Embed Size (px)
Citation preview
Synthetic Aperture Radar Synthetic Aperture Radar
Land ApplicationsLand Applications
TutorialTutorial
Part I Background and TheoryPart I Background and Theory
prepared byprepared by
SAR Land Applications SAR Land Applications -- TutorialTutorial
IntroductionIntroduction
I. Background and Theory – an overview of the principles behind SAR remote sensing, data processing techniques, examples of land applications, and current and future sources of SAR data.
II. The Bilko Exercise – a computer practical using Bilko software with ENVISAT ASAR data, allowing students to apply the theoretical knowledge to the processing and interpretation of actual SAR data.
III. Answers and Examples – model answers to questions from both parts of the tutorial.
Please note that the Bilko software is designed to run efficiently on low-cost computers and demonstrate common image processing techniques in a transparent way. It is ideally suited to training and capacity building by giving beginners hands-on experience in the application of remote sensing data to a given field of research or environmental management. Bilko's strength lies in its transparency, which makes students consider the effects of different processing steps on the reliability and validity of remote sensing products. It lacks some of the advanced 'black-box' algorithms of more specialist software, and does not provide the facility for automated processing. For advanced processing of SAR data, or the processing of large volumes of data, users are advised to consider other software packages, discussed in chapter 6 of the "Background and Theory".
The aim of this tutorial is to introduce beginners to land applications of satellite remote sensing using synthetic aperture radar (SAR). It is intended to give students a basic understanding of SAR technology, the main steps involved in the processing of SAR data, and the type of information that may be obtained from SAR images. The tutorial has three main components:

SAR Land Applications SAR Land Applications -- TutorialTutorial
Overview and hints on using the tutorialOverview and hints on using the tutorial
This section - Background and Theory - is divided into 6 chapters, which introduce beginners to
• Synthetic Aperture Radar (SAR) technology, • processing techniques,• land applications based on spaceborne SAR systems,• operational and future spaceborne SAR systems, • SAR data planning and ordering, and• specialist tools available for SAR data processing.
The chapters are divided into sections and subsections, at the end of which you will find a number of questions on the content. These are intended to test your understanding of what you have just read. Model answers to the questions may be found in Part III of the tutorial, which also contains solutions to Part II – the Bilko exercise.
Chapter 1, “What is SAR?” and the first section of chapter 2 on SAR products, entitled “SAR Processing” are both necessary for successful completion of the Bilko exercise. We therefore recommend that you look through this part of the Background and Theory before starting the computer practical using the Bilko software. The instructions in Part II – The Bilko Exercise refers to the Background and Theory where appropriate. You may therefore find it useful to keep a copy of Part I when you undertake the practical exercise in Part II.
SAR Land Applications SAR Land Applications -- TutorialTutorial
Using the module navigation toolsUsing the module navigation tools
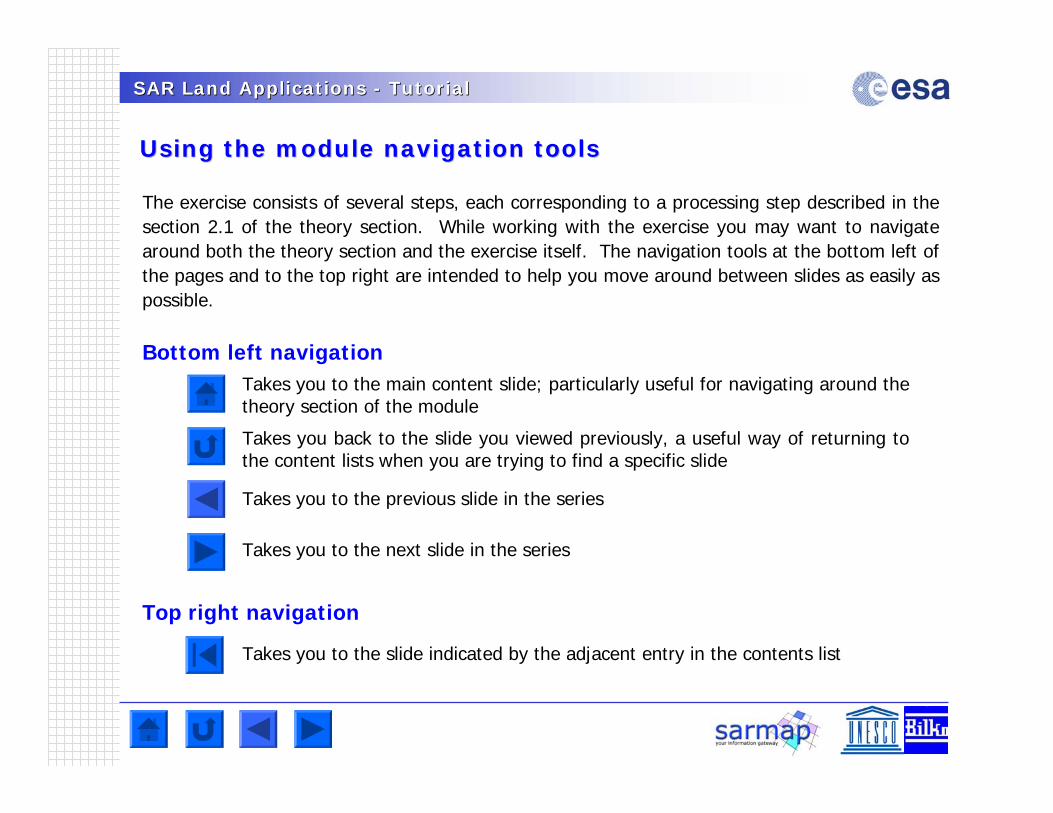
The exercise consists of several steps, each corresponding to a processing step described in the section 2.1 of the theory section. While working with the exercise you may want to navigate around both the theory section and the exercise itself. The navigation tools at the bottom left of the pages and to the top right are intended to help you move around between slides as easily as possible.
Bottom left navigationTakes you to the main content slide; particularly useful for navigating around the theory section of the module
Takes you back to the slide you viewed previously, a useful way of returning to the content lists when you are trying to find a specific slide
Takes you to the previous slide in the series
Takes you to the next slide in the series
Top right navigation
Takes you to the slide indicated by the adjacent entry in the contents list
SAR Land Applications SAR Land Applications -- TutorialTutorial
CreditsCredits
For the preparation of this Tutorial, documents of the following institutions/companies have been used:
• Alaska SAR Facility
• Atlantis Scientific Inc.
• CESBIO
• European Space Agency
• Food and Agriculture Organisation
• InfoSAR Limited
• Infoterra GmbH
• Japan Aerospace Exploration Agency
• Privateers NV
• Politecnico di Milano
• Radarsat International
• sarmap s.a.
• TeleRilevamento Europa
• University of Innsbruck, Institute for Meteorology & Geophysics
• University of Nottingham
• University of Pavia
• University of Trento, Remote Sensing Laboratory
• University of Zurich, Remote Sensing Laboratory
• US Geological Survey
SAR Land Applications SAR Land Applications -- TutorialTutorial
AcronymsAcronyms
ASAR Advanced SAR
ASI Agenzia Spaziale Italiana
DEM Digital Elevation Model
DESCW Display Earth remote sensing Swath Coverage for Windows
DInSAR Differential Interferometric SAR
DLR Deutsche Luft und Raumfahrt
DORIS Doppler Orbitography and Radiopositioning Integrated by Satellite
ENL Equivalent Number of Looks
EOLI Earthnet On-Line Interactive
ESA European Space Agency
GCP Ground Control Point
InSAR Interferometric SAR
JAXA Japan Aerospace Exploration Agency
JPL Jet Propulsion Laboratory
NASA National Aeronautics and Space Administration
PAF Processing and Archiving Facility
PDF Probability Density Function
SAR Land Applications SAR Land Applications -- TutorialTutorial
AcronymsAcronyms
PolSAR Polarimetric SAR
PolInSAR Polarimetric Interferometric SAR
PRF Pulse Repetition Frequency
RADAR Radio Detection And Ranging
RAR Real Aperture Radar
SAR Synthetic Aperture Radar
SIR Shuttle Imaging Radar
SLC Single Look Complex
SRTM Shuttle Radar Terrain Mission
UTM Universal Transfer Mercator
WGS World Geodetic System
SAR Land Applications SAR Land Applications -- TutorialTutorial
SymbolsSymbols
A Amplitudeo Beta Nought c Speed of Light Phase DifferencefD Doppler FrequencyI IntensityPd Received Power for Distributed TargetsPt Transmitted PowerP PowerL Number of Looks Wavelengtho Backscattering Coefficient or Sigma Nought Incidence Angle Pulse Duration
SAR Land Applications SAR Land Applications -- TutorialTutorial
Table of ContentsTable of Contents
1. What is Synthetic Aperture Radar (SAR)?1. What is Synthetic Aperture Radar (SAR)?
2. How SAR products are generated 2. How SAR products are generated
3. Appropriate land applications3. Appropriate land applications
4. Operational and future 4. Operational and future spacebornespaceborne SAR sensors SAR sensors
5. How do I get SAR data and products? 5. How do I get SAR data and products?
6. What tools are available for SAR data processing? 6. What tools are available for SAR data processing?
7. Glossary7. Glossary
8. References8. References
SAR Land Applications SAR Land Applications -- TutorialTutorial
1. What is Synthetic Aperture Radar (SAR)?1. What is Synthetic Aperture Radar (SAR)?
1.1 The SAR System1.1 The SAR System
1.2 SAR Specific Parameters1.2 SAR Specific Parameters
1.3 SAR Acquisition Modes and Techniques1.3 SAR Acquisition Modes and Techniques
1.4 Scattering Mechanisms1.4 Scattering Mechanisms
1.5 Speckle 1.5 Speckle
1.6 SAR Data Statistics 1.6 SAR Data Statistics
1.7 SAR Geometry1.7 SAR Geometry
SAR Land Applications SAR Land Applications -- TutorialTutorial
1.1 The SAR System1.1 The SAR System
1.1.1 Radar Imaging
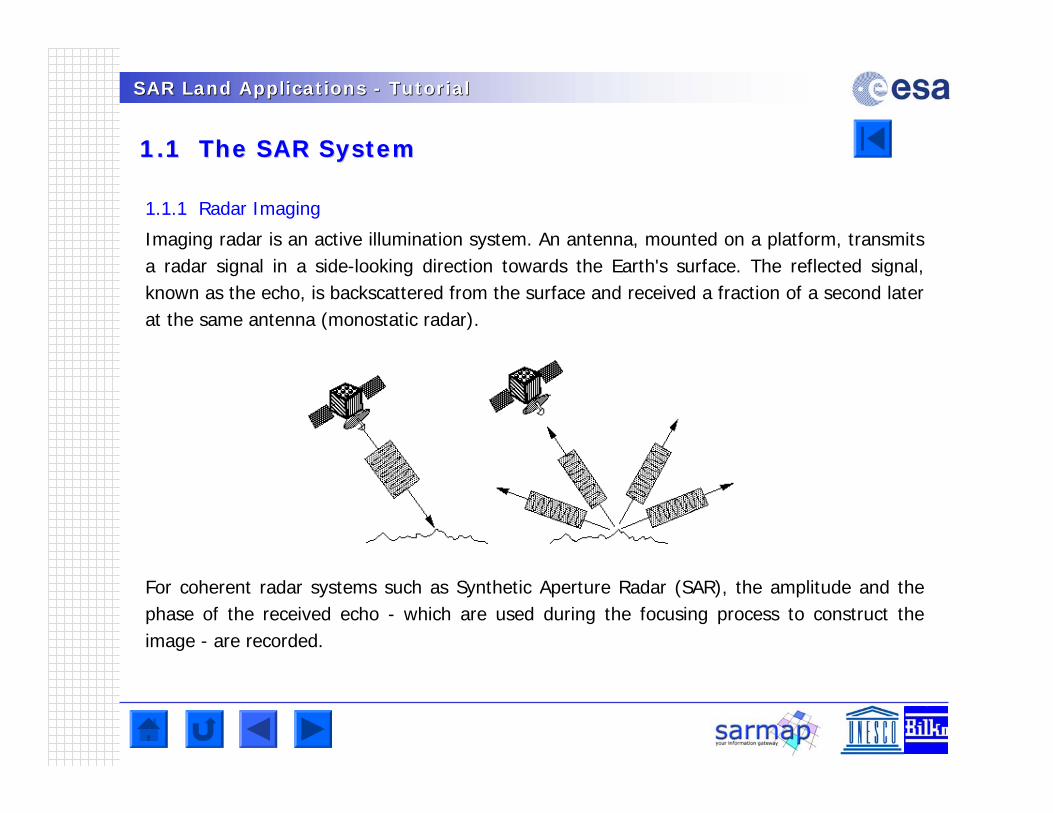
Imaging radar is an active illumination system. An antenna, mounted on a platform, transmits a radar signal in a side-looking direction towards the Earth's surface. The reflected signal, known as the echo, is backscattered from the surface and received a fraction of a second later at the same antenna (monostatic radar).
For coherent radar systems such as Synthetic Aperture Radar (SAR), the amplitude and the phase of the received echo - which are used during the focusing process to construct the image - are recorded.
SAR Land Applications SAR Land Applications -- TutorialTutorial
1.1 The SAR System1.1 The SAR System
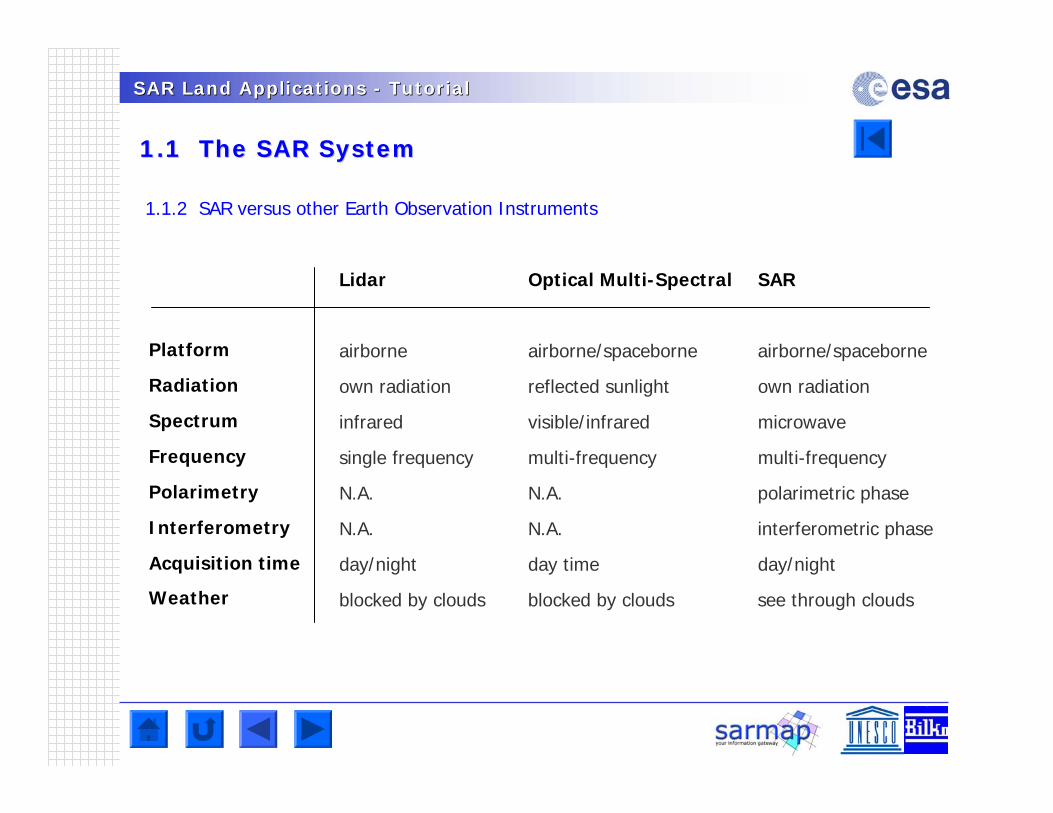
1.1.2 SAR versus other Earth Observation Instruments
Lidar Optical Multi-Spectral SAR
airborne airborne/spaceborne airborne/spaceborne
own radiation reflected sunlight own radiation
infrared visible/infrared microwave
single frequency multi-frequency multi-frequency
N.A. N.A. polarimetric phase
N.A. N.A. interferometric phase
day/night day time day/night
blocked by clouds blocked by clouds see through clouds
Platform
Radiation
Spectrum
Frequency
Polarimetry
Interferometry
Acquisition time
Weather
SAR Land Applications SAR Land Applications -- TutorialTutorial
1.1 The SAR System1.1 The SAR System
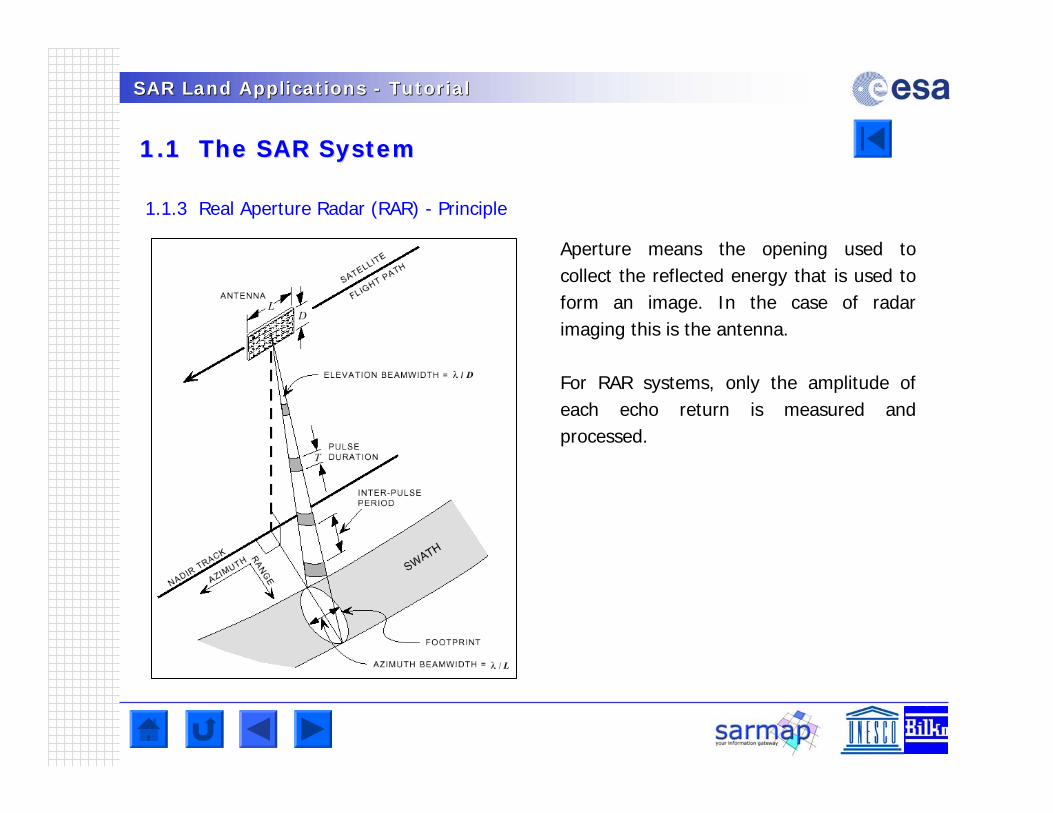
1.1.3 Real Aperture Radar (RAR) - Principle
Aperture means the opening used to collect the reflected energy that is used to form an image. In the case of radar imaging this is the antenna.
For RAR systems, only the amplitude of each echo return is measured and processed.
SAR Land Applications SAR Land Applications -- TutorialTutorial
1.1 The SAR System1.1 The SAR System
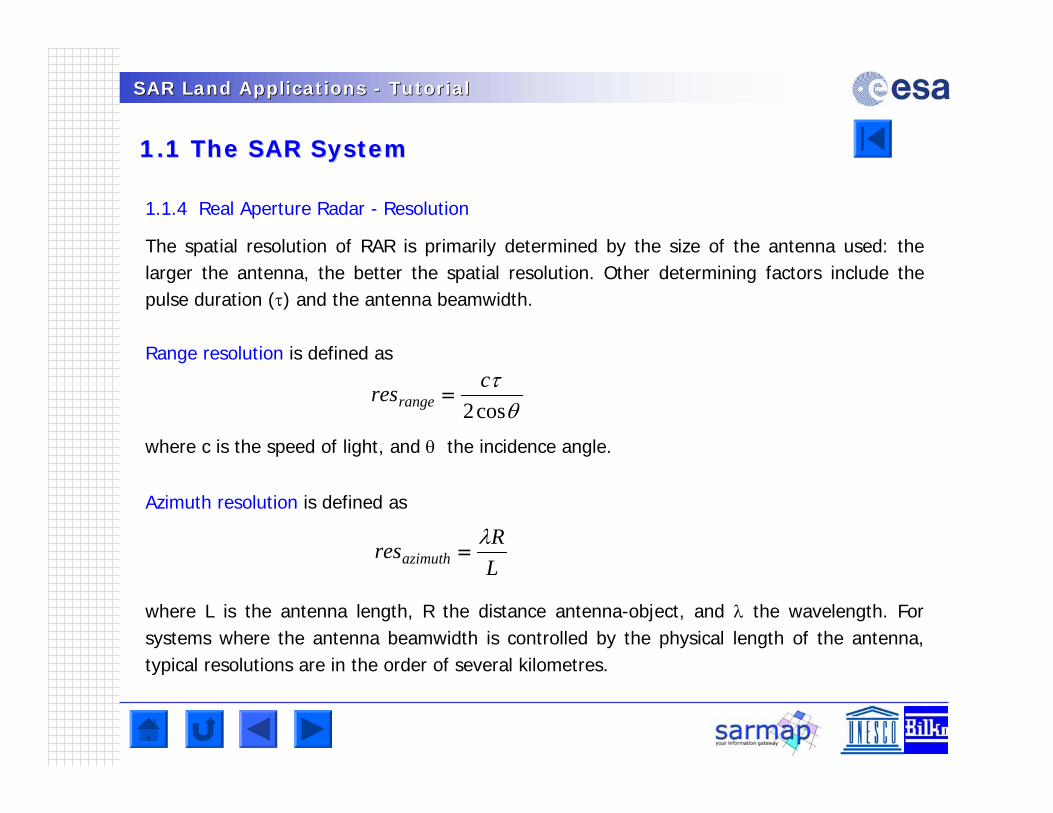
1.1.4 Real Aperture Radar - Resolution
The spatial resolution of RAR is primarily determined by the size of the antenna used: the larger the antenna, the better the spatial resolution. Other determining factors include the pulse duration () and the antenna beamwidth.
Range resolution is defined as
where c is the speed of light, and the incidence angle.
Azimuth resolution is defined as
where L is the antenna length, R the distance antenna-object, and the wavelength. For systems where the antenna beamwidth is controlled by the physical length of the antenna, typical resolutions are in the order of several kilometres.
LRresazimuth
cos2cresrange
SAR Land Applications SAR Land Applications -- TutorialTutorial
1.1 The SAR System1.1 The SAR System
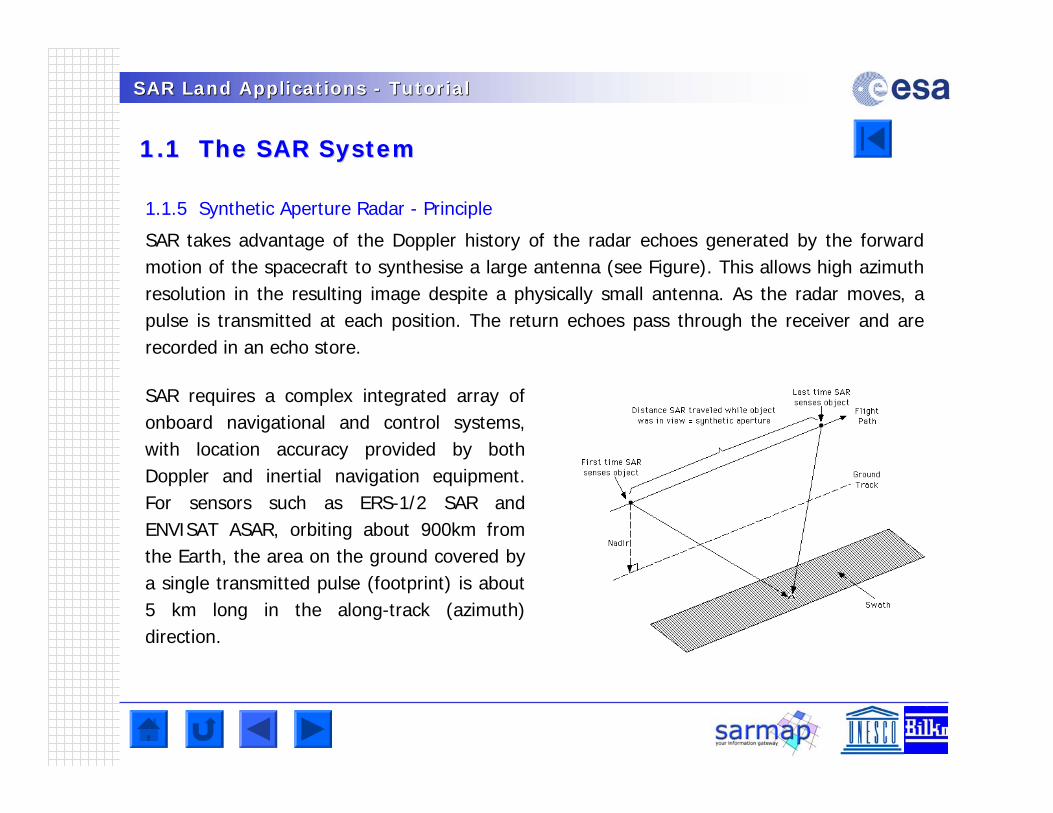
1.1.5 Synthetic Aperture Radar - Principle
SAR takes advantage of the Doppler history of the radar echoes generated by the forward motion of the spacecraft to synthesise a large antenna (see Figure). This allows high azimuth resolution in the resulting image despite a physically small antenna. As the radar moves, a pulse is transmitted at each position. The return echoes pass through the receiver and are recorded in an echo store.
SAR requires a complex integrated array of onboard navigational and control systems, with location accuracy provided by both Doppler and inertial navigation equipment. For sensors such as ERS-1/2 SAR and ENVISAT ASAR, orbiting about 900km from the Earth, the area on the ground covered by a single transmitted pulse (footprint) is about 5 km long in the along-track (azimuth) direction.
synthetic aperture
SAR Land Applications SAR Land Applications -- TutorialTutorial
1.1 The SAR System1.1 The SAR System
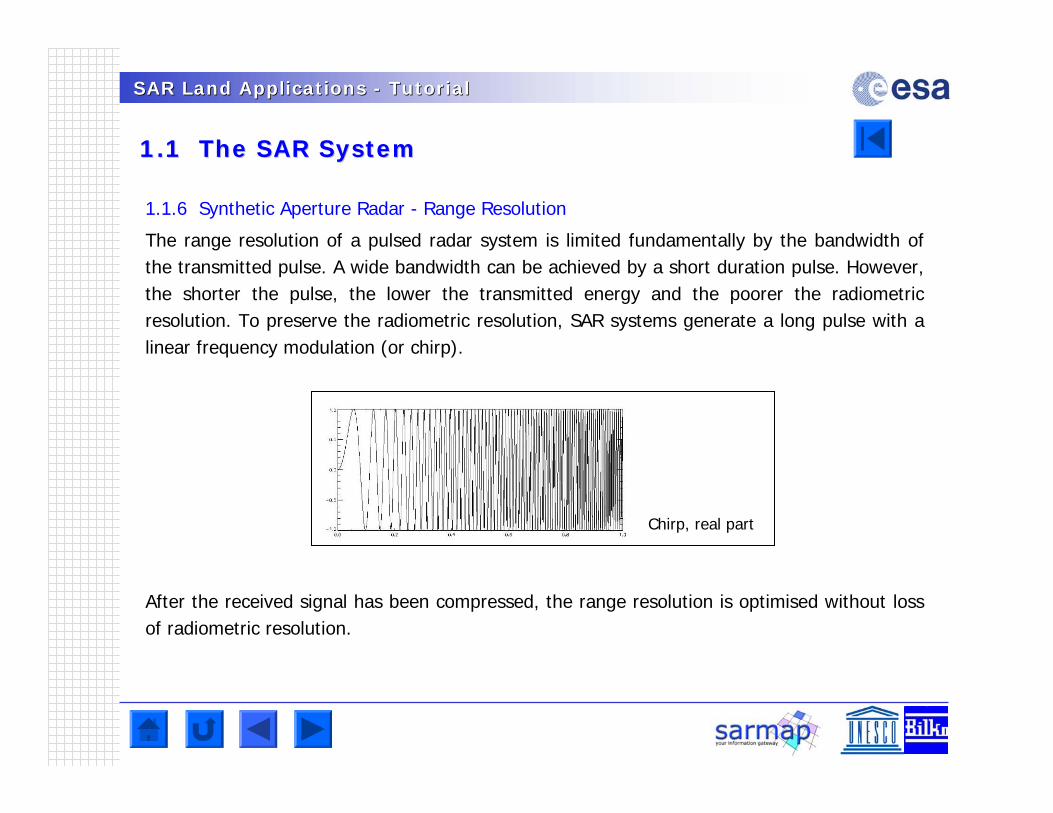
1.1.6 Synthetic Aperture Radar - Range Resolution
The range resolution of a pulsed radar system is limited fundamentally by the bandwidth of the transmitted pulse. A wide bandwidth can be achieved by a short duration pulse. However, the shorter the pulse, the lower the transmitted energy and the poorer the radiometric resolution. To preserve the radiometric resolution, SAR systems generate a long pulse with a linear frequency modulation (or chirp).
After the received signal has been compressed, the range resolution is optimised without loss of radiometric resolution.
Chirp, real part
SAR Land Applications SAR Land Applications -- TutorialTutorial
1.1 The SAR System1.1 The SAR System
1.1.7 Synthetic Aperture Radar - Azimuth Resolution
Compared to RAR, SAR synthetically increases the antenna's size to increase the azimuth resolution though the same pulse compression technique as adopted for range direction. Synthetic aperture processing is a complicated data processing of received signals and phases from moving targets with a small antenna, the effect of which is to should be theoretically convert to the effect of a large antenna, that is a synthetic aperture length, i.e. the beam width by range which a RAR of the same length, can project in the azimuth direction. The resulting azimuth resolution is given by half of real aperture radar as shown as follows:
- Real beam width = / D- Real resolution L = . R = Ls (synthetic aperture length)- Synthetic beam width s = / 2 . Ls = D / 2 . R- Synthetic resolution Ls = s . R = D / 2
where is the wavelength, D the radar aperture, and R the distance antenna-object.
This is the reason why SAR has a high azimuth resolution with a small size of antenna
regardless of the slant range, or very high altitude of a satellite.
SAR Land Applications SAR Land Applications -- TutorialTutorial
1.1 The SAR System1.1 The SAR System
Questions
Q1
What is the basic difference between real and synthetic aperture radar?
Q2
What does synthetic aperture mean?
Q3
What advantages does SAR have over Optical and Lidar systems?
SAR Land Applications SAR Land Applications -- TutorialTutorial
1.2 SAR Specific Parameters1.2 SAR Specific Parameters
1.2.1 Wavelength
Radio waves are that part of the electromagnetic spectrum that have wavelengths considerably longer than visible light, i.e. in the centimetre domain. Penetration is the key factor for the selection of the wavelength: the longer the wavelength (shorter the frequency) the stronger the penetration into vegetation and soil. Following wavelengths are in general used:
P-band = ~ 65 cm airborne AIRSAR
L-band = ~ 23 cm air- / spaceborne JERS-1 SAR, ALOS PALSAR
S-band = ~ 10 cm air- / spaceborne Almaz-1
C-band = ~ 5 cm air- / spaceborne ERS-1/2 SAR, RADARSAT-1/2, ENVISAT ASAR
X-band = ~ 3 cm air- / spaceborne TerraSAR-X , COSMO-SkyMed
K-band = ~ 1.2 cm airborne Military domain
SAR Land Applications SAR Land Applications -- TutorialTutorial
1.2 SAR Specific Parameters1.2 SAR Specific Parameters
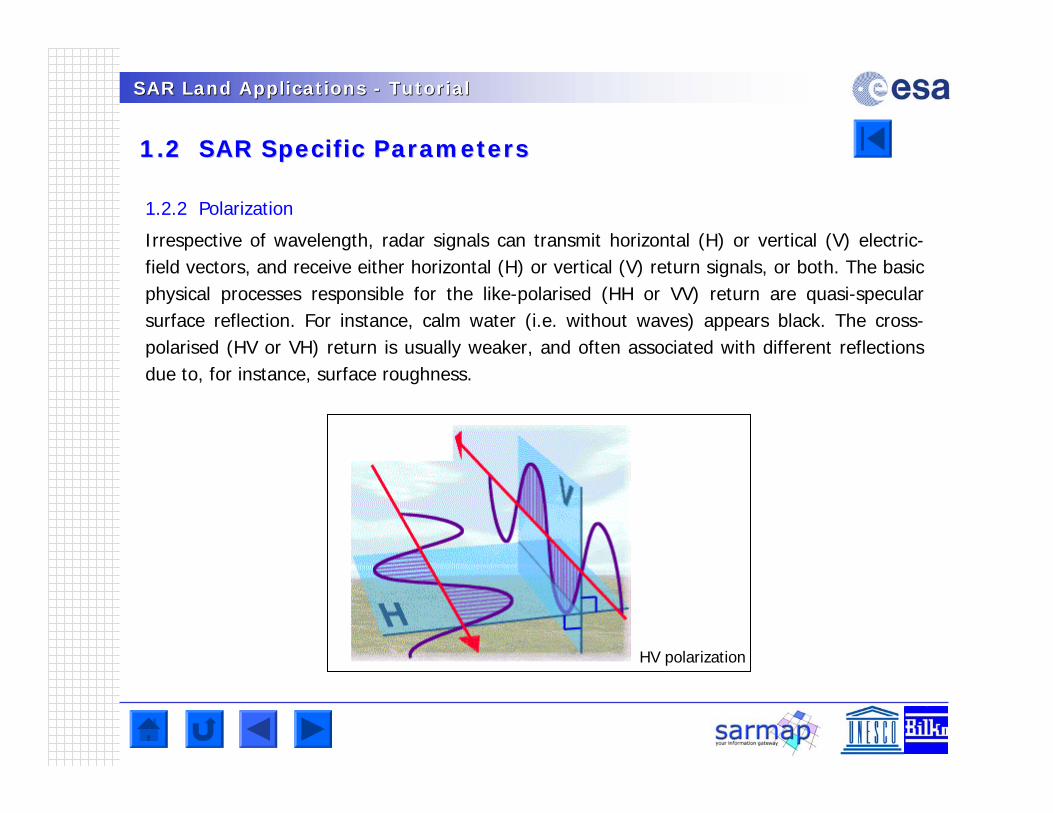
1.2.2 Polarization
Irrespective of wavelength, radar signals can transmit horizontal (H) or vertical (V) electric-field vectors, and receive either horizontal (H) or vertical (V) return signals, or both. The basic physical processes responsible for the like-polarised (HH or VV) return are quasi-specularsurface reflection. For instance, calm water (i.e. without waves) appears black. The cross-polarised (HV or VH) return is usually weaker, and often associated with different reflections due to, for instance, surface roughness.
HV polarization
SAR Land Applications SAR Land Applications -- TutorialTutorial
1.2 SAR Specific Parameters1.2 SAR Specific Parameters
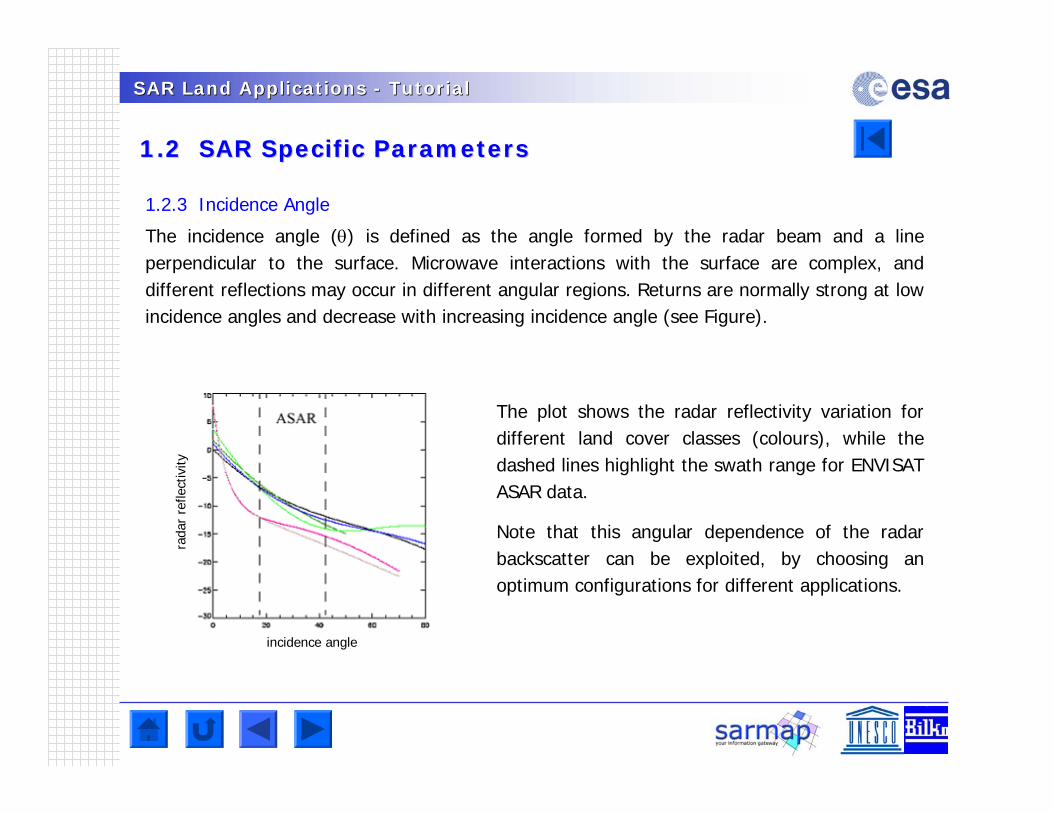
The plot shows the radar reflectivity variation for different land cover classes (colours), while the dashed lines highlight the swath range for ENVISAT ASAR data.
Note that this angular dependence of the radar backscatter can be exploited, by choosing an optimum configurations for different applications.
1.2.3 Incidence Angle
The incidence angle () is defined as the angle formed by the radar beam and a line perpendicular to the surface. Microwave interactions with the surface are complex, and different reflections may occur in different angular regions. Returns are normally strong at low incidence angles and decrease with increasing incidence angle (see Figure).
incidence angle
rada
r re
flect
ivity
SAR Land Applications SAR Land Applications -- TutorialTutorial
1.3 SAR Acquisition Modes and Techniques1.3 SAR Acquisition Modes and Techniques
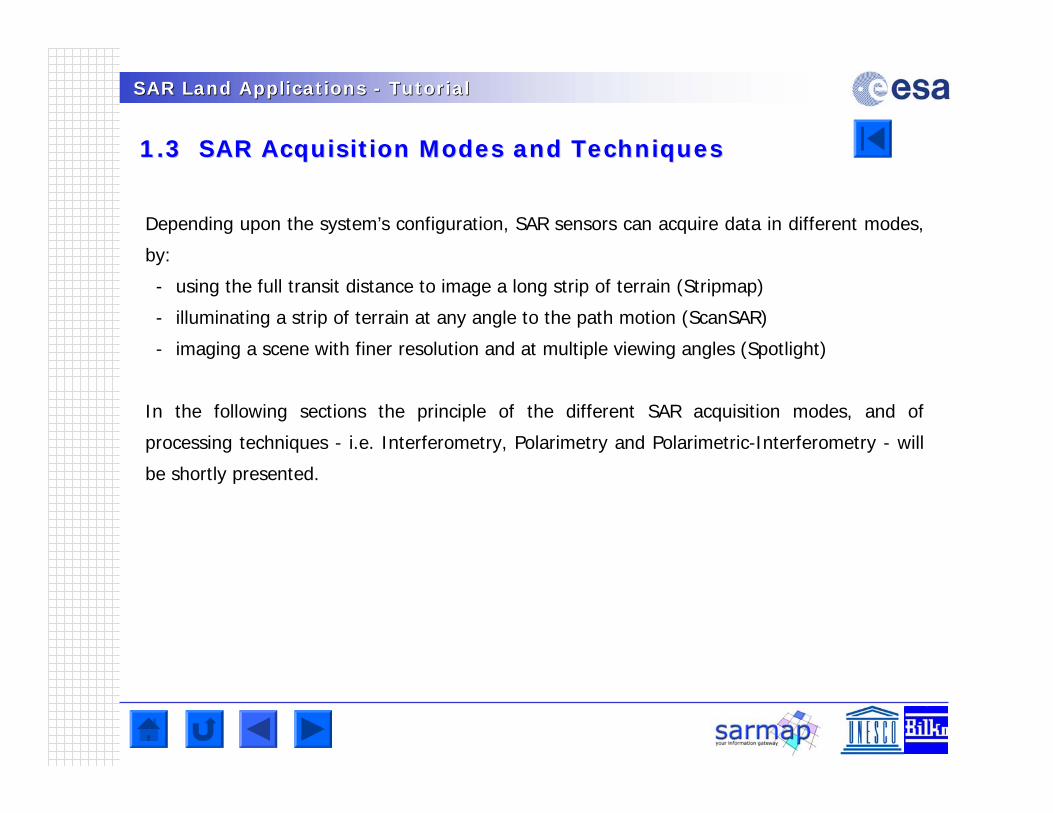
Depending upon the system’s configuration, SAR sensors can acquire data in different modes,
by:
- using the full transit distance to image a long strip of terrain (Stripmap)
- illuminating a strip of terrain at any angle to the path motion (ScanSAR)
- imaging a scene with finer resolution and at multiple viewing angles (Spotlight)
In the following sections the principle of the different SAR acquisition modes, and of
processing techniques - i.e. Interferometry, Polarimetry and Polarimetric-Interferometry - will
be shortly presented.
SAR Land Applications SAR Land Applications -- TutorialTutorial
1.3 SAR Acquisition Modes and Techniques1.3 SAR Acquisition Modes and Techniques
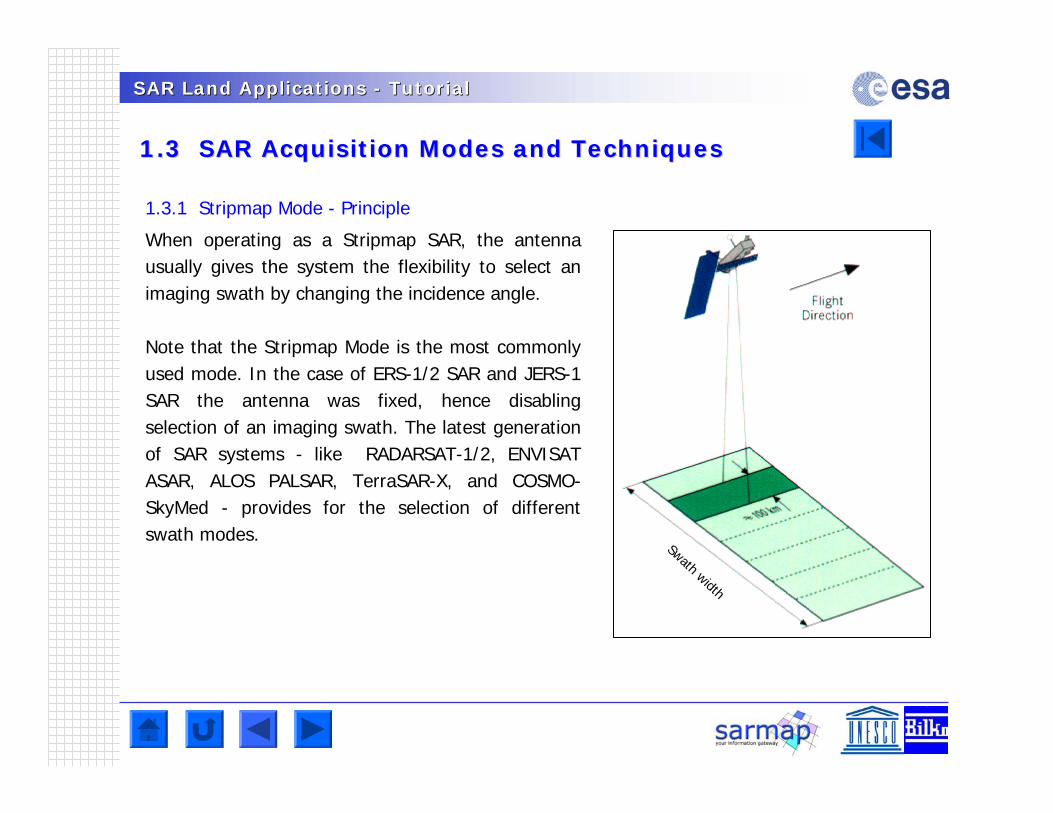
1.3.1 Stripmap Mode - Principle
When operating as a Stripmap SAR, the antenna usually gives the system the flexibility to select an imaging swath by changing the incidence angle.
Note that the Stripmap Mode is the most commonly used mode. In the case of ERS-1/2 SAR and JERS-1 SAR the antenna was fixed, hence disabling selection of an imaging swath. The latest generation of SAR systems - like RADARSAT-1/2, ENVISAT ASAR, ALOS PALSAR, TerraSAR-X, and COSMO-SkyMed - provides for the selection of different swath modes.
Swath width
SAR Land Applications SAR Land Applications -- TutorialTutorial
1.3 SAR Acquisition Modes and Techniques1.3 SAR Acquisition Modes and Techniques
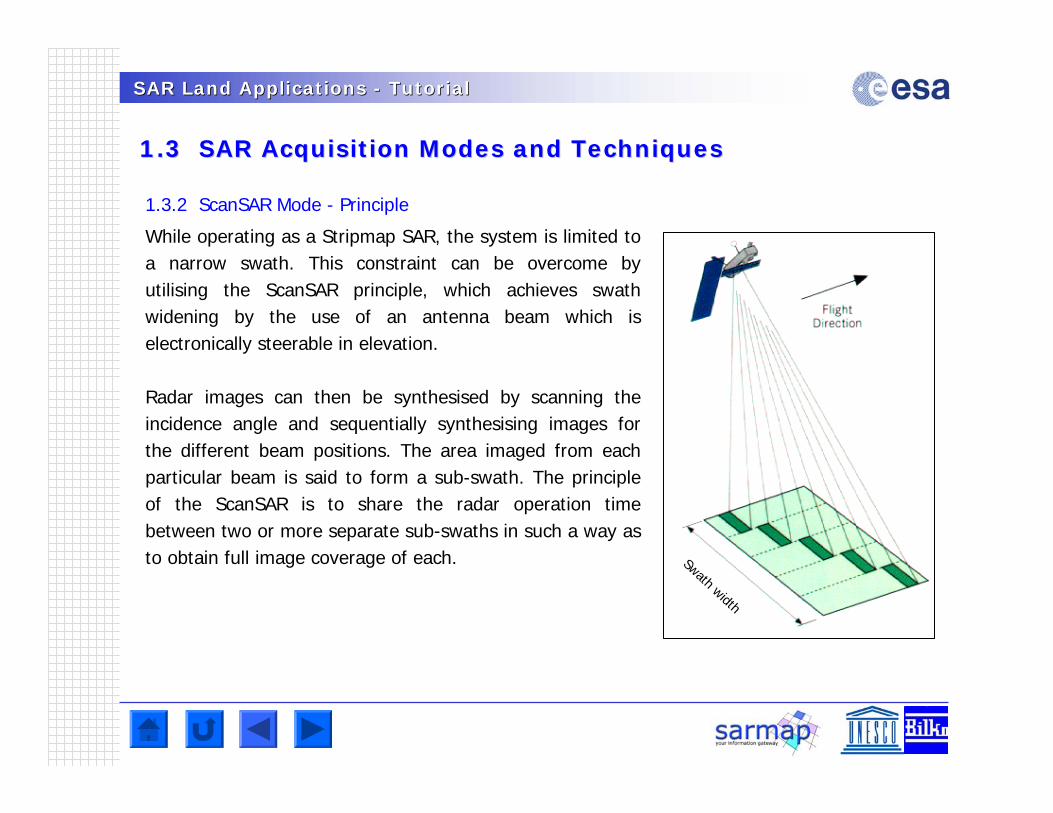
1.3.2 ScanSAR Mode - Principle
While operating as a Stripmap SAR, the system is limited to a narrow swath. This constraint can be overcome by utilising the ScanSAR principle, which achieves swath widening by the use of an antenna beam which is electronically steerable in elevation.
Radar images can then be synthesised by scanning the incidence angle and sequentially synthesising images for the different beam positions. The area imaged from each particular beam is said to form a sub-swath. The principle of the ScanSAR is to share the radar operation time between two or more separate sub-swaths in such a way as to obtain full image coverage of each. Swath width
SAR Land Applications SAR Land Applications -- TutorialTutorial
1.3 SAR Acquisition Modes and Techniques1.3 SAR Acquisition Modes and Techniques
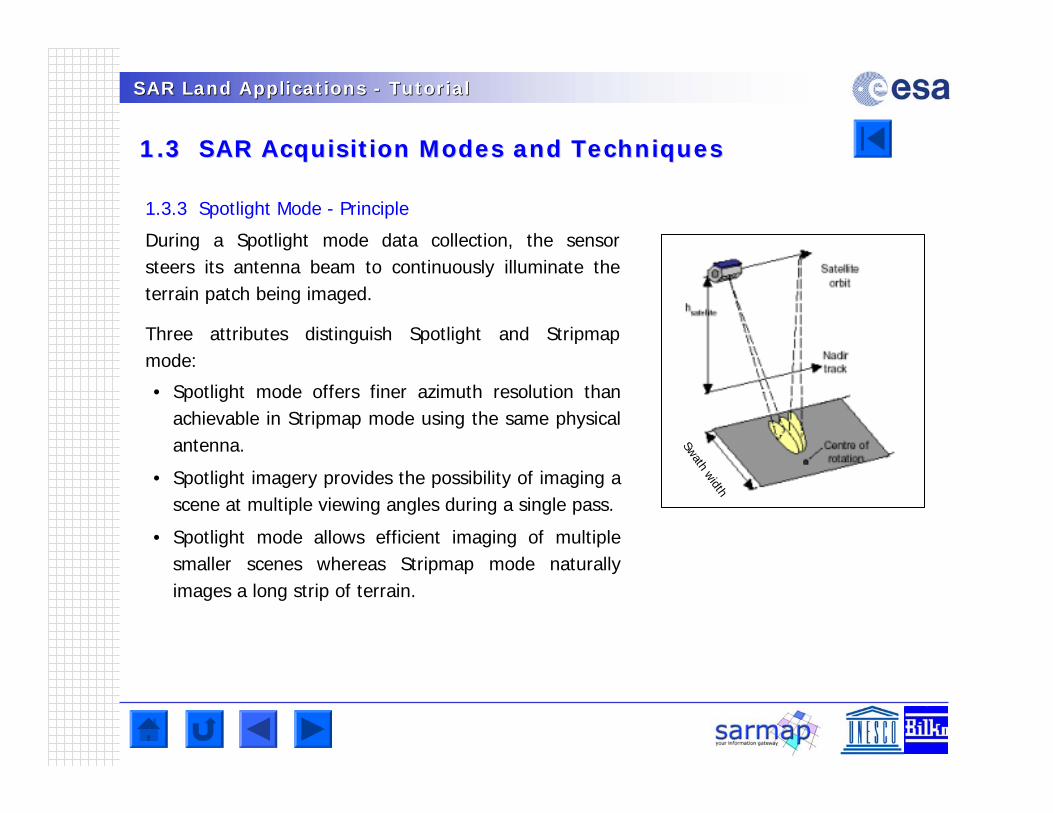
1.3.3 Spotlight Mode - Principle
During a Spotlight mode data collection, the sensor steers its antenna beam to continuously illuminate the terrain patch being imaged.
Three attributes distinguish Spotlight and Stripmapmode:
Swath width
• Spotlight mode offers finer azimuth resolution than achievable in Stripmap mode using the same physical antenna.
• Spotlight imagery provides the possibility of imaging a scene at multiple viewing angles during a single pass.
• Spotlight mode allows efficient imaging of multiple smaller scenes whereas Stripmap mode naturally images a long strip of terrain.
SAR Land Applications SAR Land Applications -- TutorialTutorial
1.3 SAR Acquisition Modes and Techniques1.3 SAR Acquisition Modes and Techniques
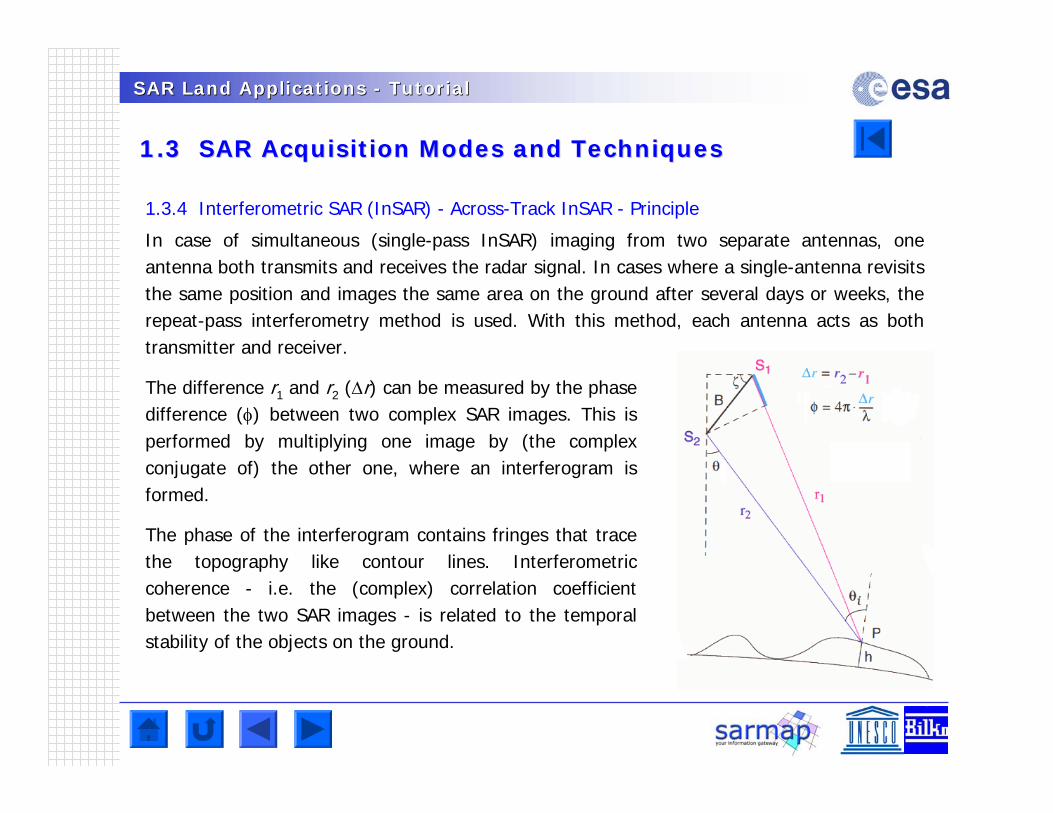
1.3.4 Interferometric SAR (InSAR) - Across-Track InSAR - Principle
In case of simultaneous (single-pass InSAR) imaging from two separate antennas, one antenna both transmits and receives the radar signal. In cases where a single-antenna revisits the same position and images the same area on the ground after several days or weeks, the repeat-pass interferometry method is used. With this method, each antenna acts as both transmitter and receiver.
The difference r1 and r2 (r) can be measured by the phase difference () between two complex SAR images. This is performed by multiplying one image by (the complex conjugate of) the other one, where an interferogram is formed.
The phase of the interferogram contains fringes that trace the topography like contour lines. Interferometric coherence - i.e. the (complex) correlation coefficient between the two SAR images - is related to the temporal stability of the objects on the ground.
SAR Land Applications SAR Land Applications -- TutorialTutorial
1.3 SAR Acquisition Modes and Techniques1.3 SAR Acquisition Modes and Techniques
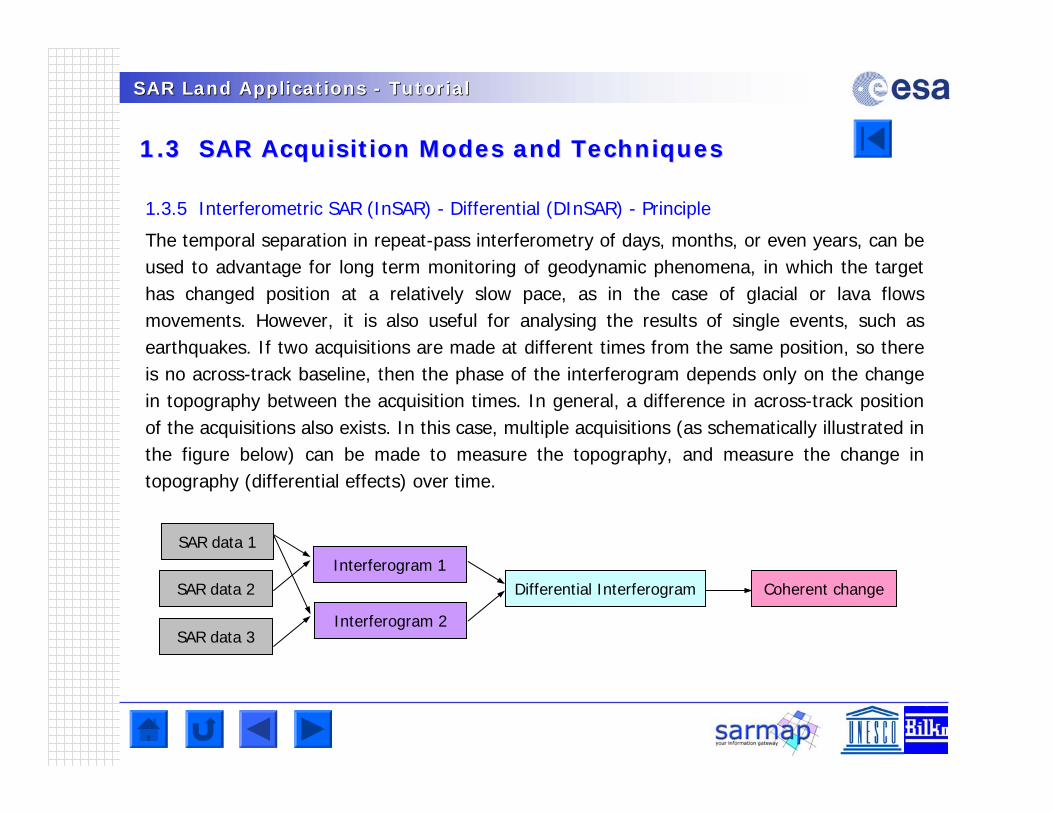
1.3.5 Interferometric SAR (InSAR) - Differential (DInSAR) - Principle
The temporal separation in repeat-pass interferometry of days, months, or even years, can be used to advantage for long term monitoring of geodynamic phenomena, in which the target has changed position at a relatively slow pace, as in the case of glacial or lava flows movements. However, it is also useful for analysing the results of single events, such as earthquakes. If two acquisitions are made at different times from the same position, so there is no across-track baseline, then the phase of the interferogram depends only on the change in topography between the acquisition times. In general, a difference in across-track position of the acquisitions also exists. In this case, multiple acquisitions (as schematically illustrated in the figure below) can be made to measure the topography, and measure the change in topography (differential effects) over time.
SAR data 1
SAR data 2
SAR data 3
Interferogram 1
Interferogram 2
Differential Interferogram Coherent change
SAR Land Applications SAR Land Applications -- TutorialTutorial
1.3 SAR Acquisition Modes and Techniques1.3 SAR Acquisition Modes and Techniques
1.3.6 Polarimetric SAR (PolSAR) Systems - Principle
Conventional SAR systems operate within a single, fixed-polarization antenna for both transmission and reception of radio frequency signals. In this way a single radar reflectivity is measured, for a specific transmit and receive polarization combination, for every resolution element of the image. A result of this implementation is that the reflected wave, a vector quantity, is measured as a scalar quantity and any additional information about the scattering process contained in the polarization properties of the scattered signal is lost. To ensure that all the information of the scattered wave is retained, the polarization of the scattered wave must be measured through a vector measurement process, enabling to use both the amplitude and phase information to distinguish between different scattering mechanisms. This differs from other approaches, not only because it is more complete in the sense that more information is used during the information extraction process, but in particular because a better understanding of the radar wave-medium interaction can be gained.
SAR Land Applications SAR Land Applications -- TutorialTutorial
1.3 SAR Acquisition Modes and Techniques1.3 SAR Acquisition Modes and Techniques
1.3.6 Polarimetric SAR (PolSAR) Systems - Status
Over the past 20 years there has been considerable progress in the application of polarimetricSAR data for land observation. The following points contributed to establish the PolSARtechnique:
• Increased availability of polarimetric data.• Development in PolSAR data processing (i.e. calibration, despeckling techniques). • Development in PolSAR decomposition techniques (analysis of fundamental scattering
properties of land surfaces/volumes).• Development in PolSAR data classification.
Nowadays, new PolSAR techniques make use of model-derived data interpretation (forestry, agriculture, ice/snow surfaces, …).
SAR Land Applications SAR Land Applications -- TutorialTutorial
1.3 SAR Acquisition Modes and Techniques1.3 SAR Acquisition Modes and Techniques
1.3.10 Polarimetric Interferometric SAR (PolInSAR) Systems - Principle
Instead of two scalar interferometric images - as in the case of single-polarization interferometry - a polarimetric SAR interferometer produces two interferometric vector images.
Basically, InSAR measurements are sensitive to the spatial distribution of the scatterers, PolSAR measurements are related to the orientation and/or dielectric properties of the scatterers. While using lower system frequencies (i.e. L- or P-band), the combination of the two techniques allows the analysis of the spatial distribution of the polarimetric scattering mechanisms within scattering volumes (vegetation, snow/ice, …).
More information is available at http://earth.esa.int/polinsar/
SAR Land Applications SAR Land Applications -- TutorialTutorial
1.3 SAR Acquisition Modes and Techniques1.3 SAR Acquisition Modes and Techniques
Questions
Q1
What is the most common used acquisition mode?
Q2
Which mode, and why, enables the collection of very high resolution images?
Q3
What is the importance of interferometric phase?
Q4
What is the advantage of SAR polarimetric sensors with respect to conventional SAR systems?
SAR Land Applications SAR Land Applications -- TutorialTutorial
1.4 Scattering Mechanisms1.4 Scattering Mechanisms
1.4.1 General
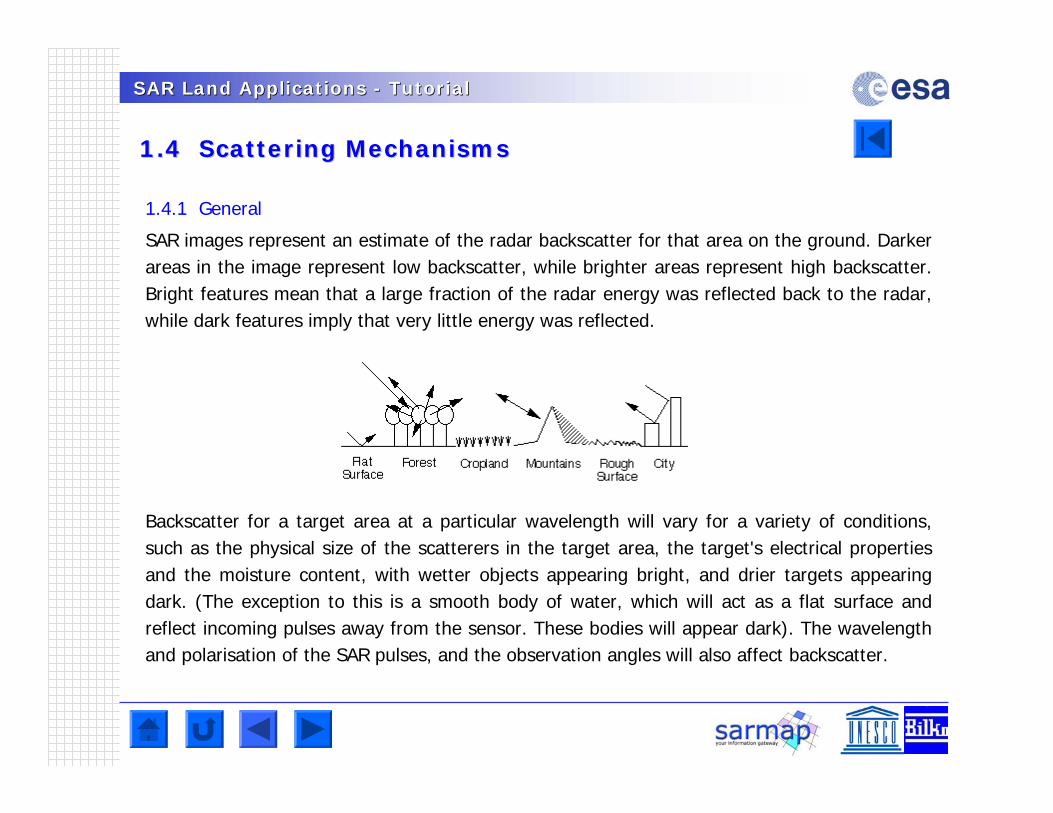
SAR images represent an estimate of the radar backscatter for that area on the ground. Darker areas in the image represent low backscatter, while brighter areas represent high backscatter. Bright features mean that a large fraction of the radar energy was reflected back to the radar, while dark features imply that very little energy was reflected.
Backscatter for a target area at a particular wavelength will vary for a variety of conditions, such as the physical size of the scatterers in the target area, the target's electrical properties and the moisture content, with wetter objects appearing bright, and drier targets appearing dark. (The exception to this is a smooth body of water, which will act as a flat surface and reflect incoming pulses away from the sensor. These bodies will appear dark). The wavelength and polarisation of the SAR pulses, and the observation angles will also affect backscatter.
SAR Land Applications SAR Land Applications -- TutorialTutorial
1.4 Scattering Mechanisms1.4 Scattering Mechanisms
1.4.2 Surface and Volume Scattering
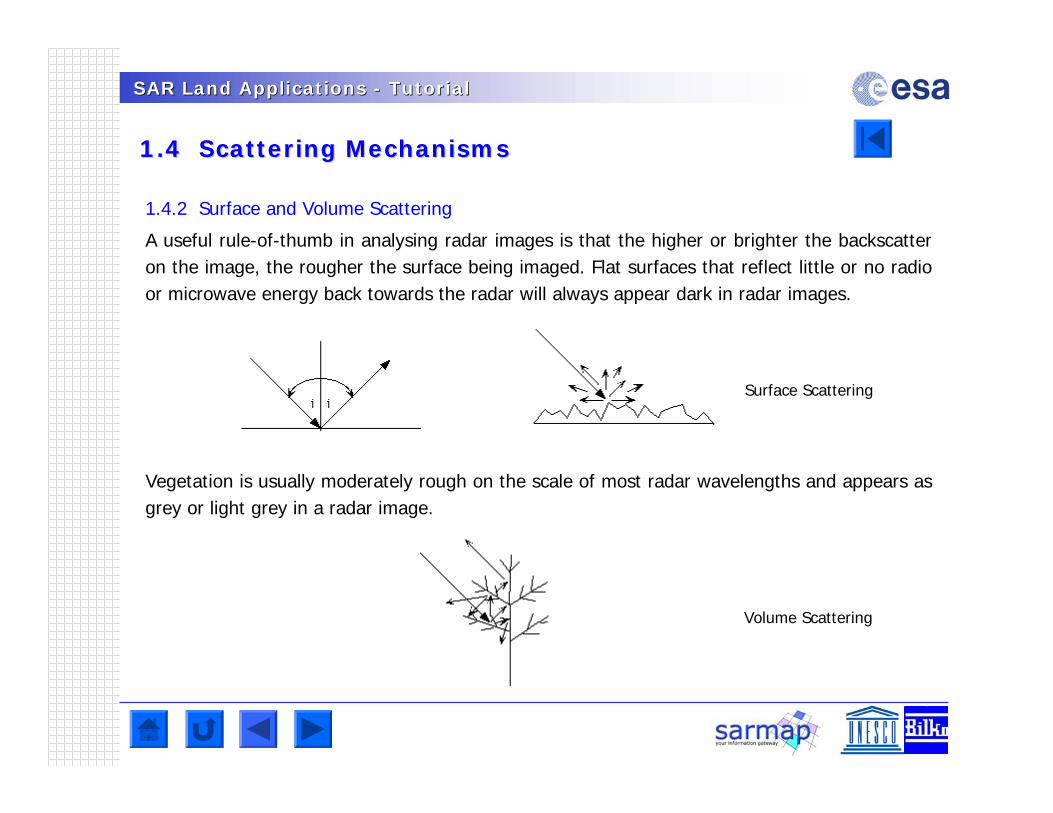
A useful rule-of-thumb in analysing radar images is that the higher or brighter the backscatter on the image, the rougher the surface being imaged. Flat surfaces that reflect little or no radio or microwave energy back towards the radar will always appear dark in radar images.
Vegetation is usually moderately rough on the scale of most radar wavelengths and appears as grey or light grey in a radar image.
Surface Scattering
Volume Scattering
SAR Land Applications SAR Land Applications -- TutorialTutorial
1.4 Scattering Mechanisms1.4 Scattering Mechanisms
Double Bounce
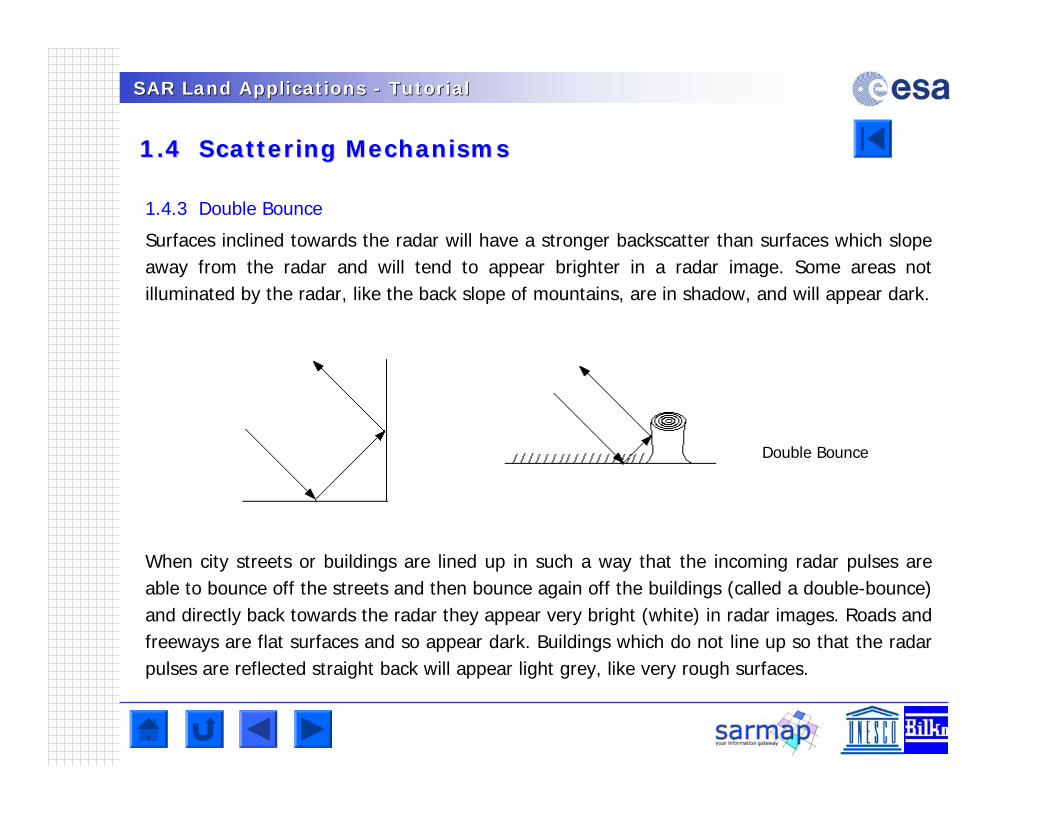
1.4.3 Double Bounce
Surfaces inclined towards the radar will have a stronger backscatter than surfaces which slope away from the radar and will tend to appear brighter in a radar image. Some areas not illuminated by the radar, like the back slope of mountains, are in shadow, and will appear dark.
When city streets or buildings are lined up in such a way that the incoming radar pulses are able to bounce off the streets and then bounce again off the buildings (called a double-bounce) and directly back towards the radar they appear very bright (white) in radar images. Roads and freeways are flat surfaces and so appear dark. Buildings which do not line up so that the radar pulses are reflected straight back will appear light grey, like very rough surfaces.
SAR Land Applications SAR Land Applications -- TutorialTutorial
1.4 Scattering Mechanisms1.4 Scattering Mechanisms
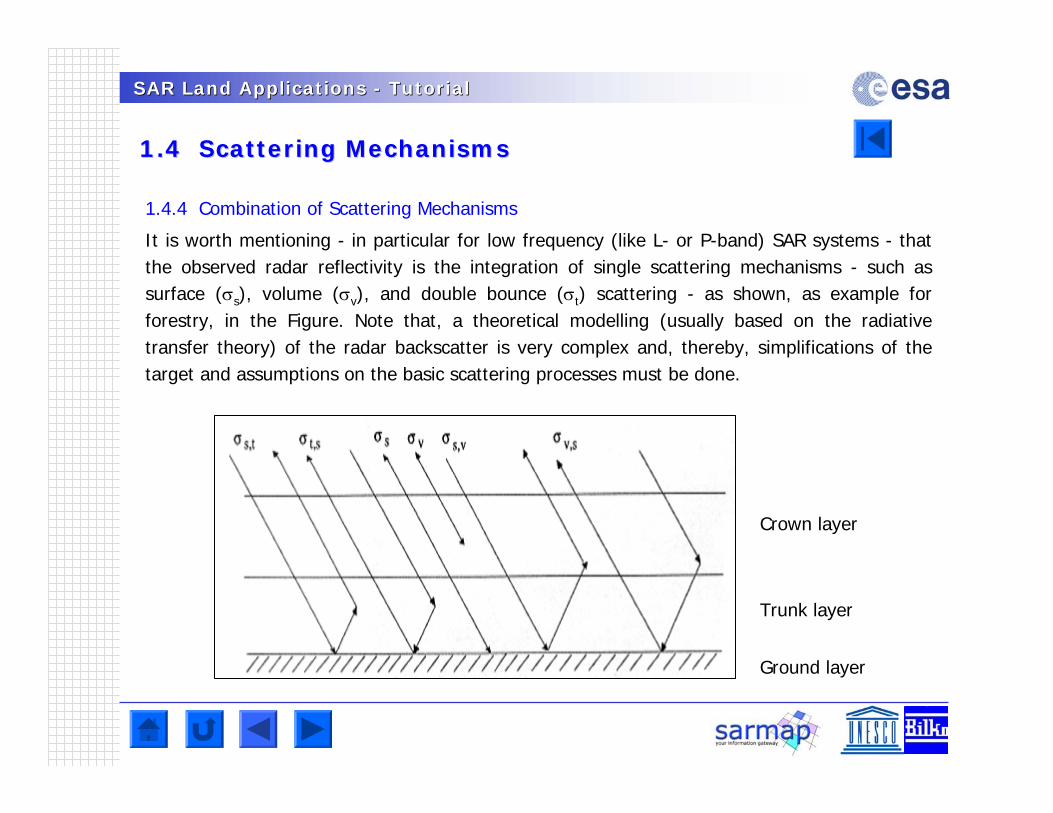
1.4.4 Combination of Scattering Mechanisms
It is worth mentioning - in particular for low frequency (like L- or P-band) SAR systems - that the observed radar reflectivity is the integration of single scattering mechanisms - such as surface (s), volume (v), and double bounce (t) scattering - as shown, as example for forestry, in the Figure. Note that, a theoretical modelling (usually based on the radiativetransfer theory) of the radar backscatter is very complex and, thereby, simplifications of the target and assumptions on the basic scattering processes must be done.
Crown layer
Trunk layer
Ground layer
SAR Land Applications SAR Land Applications -- TutorialTutorial
1.4 Scattering Mechanisms1.4 Scattering Mechanisms
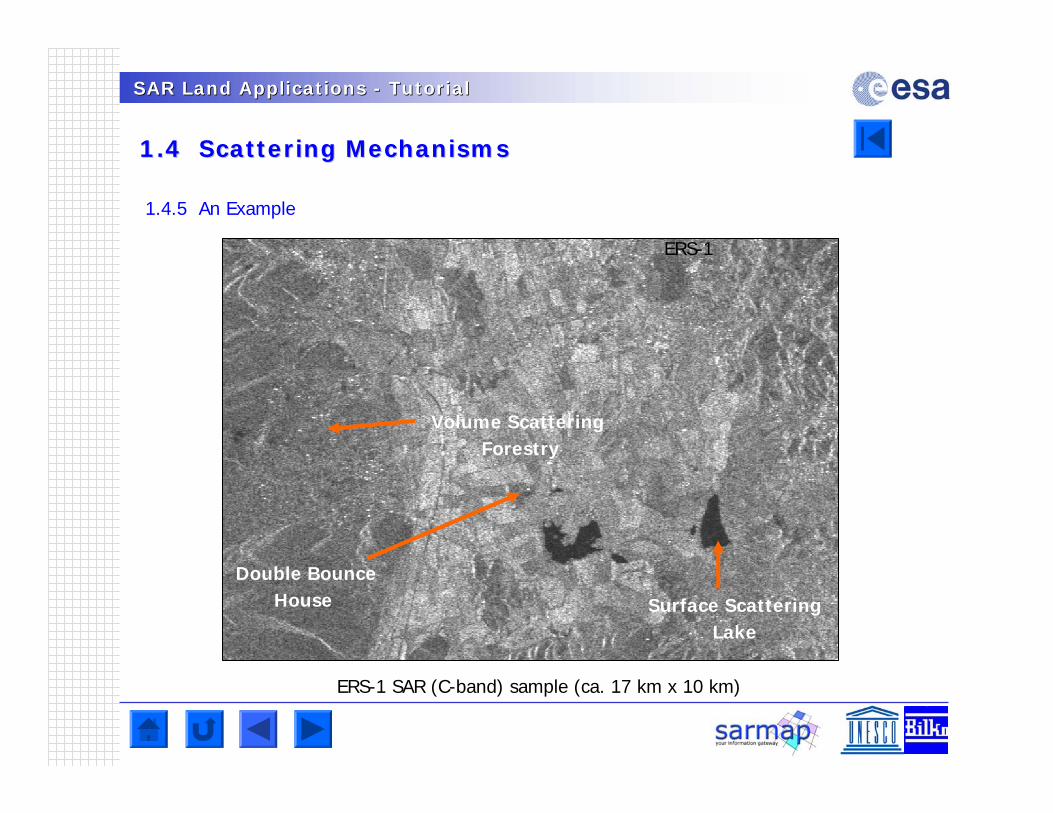
1.4.5 An Example
Surface ScatteringLake
Volume Scattering Forestry
Double BounceHouse
ERS-1
ERS-1 SAR (C-band) sample (ca. 17 km x 10 km)
SAR Land Applications SAR Land Applications -- TutorialTutorial
1.4 Scattering Mechanisms1.4 Scattering Mechanisms
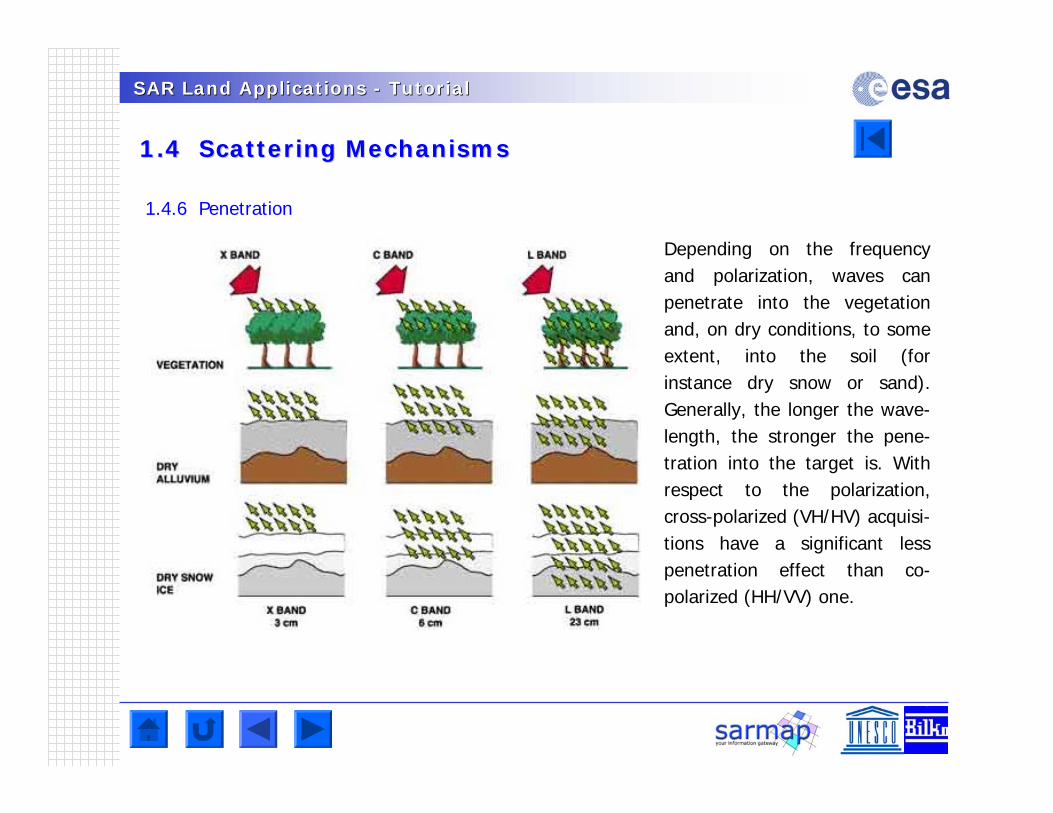
1.4.6 Penetration
Depending on the frequency and polarization, waves can penetrate into the vegetation and, on dry conditions, to some extent, into the soil (for instance dry snow or sand). Generally, the longer the wave-length, the stronger the pene-tration into the target is. With respect to the polarization, cross-polarized (VH/HV) acquisi-tions have a significant less penetration effect than co-polarized (HH/VV) one.
SAR Land Applications SAR Land Applications -- TutorialTutorial
1.4 Scattering Mechanisms1.4 Scattering Mechanisms
1.4.7 Dielectric Properties
Radar backscatter also depends on the dielectric properties of the target: for metal and water the dielectric constant is high (80), while for most other materials it is relatively low: in dry conditions, the dielectric constant ranges from 3 to 8. This means that wetness of soils or vegetated surfaces can produce a notable increase in radar signal reflectivity.
Based on this phenomenon, SAR systems are also used to retrieve the soil moisture content -primarily - of bare soils. The measurement is based on the large contrast between the dielectric properties of dry and wet soils. As the soil is moistened, its dielectric constant varies from approximately 2.5 when dry to about 25 to 30 under saturated conditions. This translates to an increase in the reflected energy. It is worth mentioning that the inference of soil moisture from the backscattering coefficient is feasible but limited to the use of polarimetric and dual frequency (C-, L-band) SAR sensors, in order to separate the effect of soil roughness and moisture.
SAR Land Applications SAR Land Applications -- TutorialTutorial
1.5 Speckle1.5 Speckle
1.5.1 General
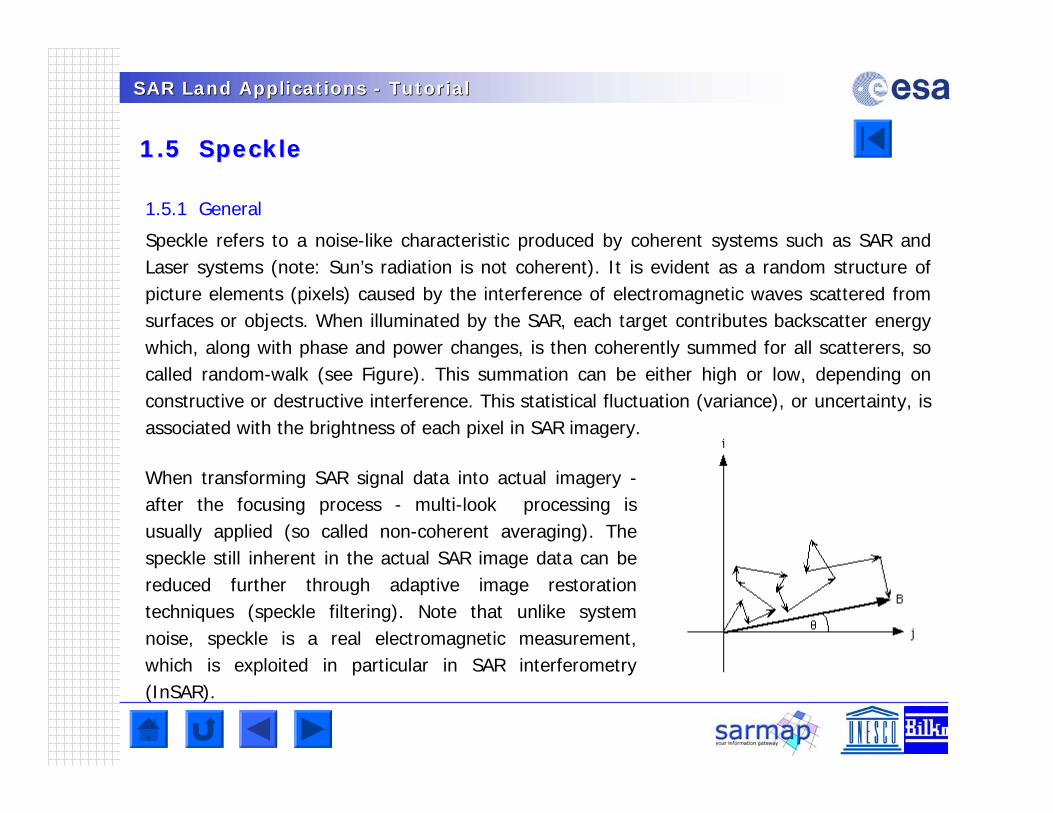
Speckle refers to a noise-like characteristic produced by coherent systems such as SAR andLaser systems (note: Sun’s radiation is not coherent). It is evident as a random structure of picture elements (pixels) caused by the interference of electromagnetic waves scattered from surfaces or objects. When illuminated by the SAR, each target contributes backscatter energy which, along with phase and power changes, is then coherently summed for all scatterers, so called random-walk (see Figure). This summation can be either high or low, depending on constructive or destructive interference. This statistical fluctuation (variance), or uncertainty, is associated with the brightness of each pixel in SAR imagery.
When transforming SAR signal data into actual imagery -after the focusing process - multi-look processing is usually applied (so called non-coherent averaging). The speckle still inherent in the actual SAR image data can be reduced further through adaptive image restoration techniques (speckle filtering). Note that unlike system noise, speckle is a real electromagnetic measurement, which is exploited in particular in SAR interferometry(InSAR).
SAR Land Applications SAR Land Applications -- TutorialTutorial
1.5 Speckle1.5 Speckle
1.5.2 Speckle Model and Speckle Filtering Principle
A well accepted appropriate model for fully developed speckle is the multiplicative fading random process F,
I = R . F
where I is the observed intensity (speckle observed reflectivity), R is the random radar reflectivity process (unspeckle reflectivity).
The first step in speckle filtering is to check if speckle is fully developed in the neighbourhood of the pixel considered. If this is the case, an estimation of the radar reflectivity is made as a function of the observed intensity, based on some local statistics and of some a priori knowledge about the scene. Good speckle removal requires the use of large processing windows. On the contrary, good preservation of the spatial resolution is needed so as not to blur thin image details like textural or structural features.
In high spatial resolution images, speckle can be partially developed in some areas (e.g. urban), when a few strong scatters are present in the resolution cell. In the extreme case of an isolated point target, intensity fluctuations are dominated by a deterministic function which should not be affected by the speckle filtering process. In these cases, small window sizes are preferable.
SAR Land Applications SAR Land Applications -- TutorialTutorial
1.5 Speckle1.5 Speckle
1.5.2 Speckle Model and Speckle Filtering Principle (cont.)
A speckle filtering is therefore a compromise between speckle removal (radiometric resolution) and thin details preservation (spatial resolution).
Adaptive filters based on appropriate scene and speckle models are the most appropriate ones for high spatial resolution SAR images, when speckle is not always fully developed. Generally, such filters are all adaptive as a function of the local coefficient of variation and can be enhanced by fixing a minimum value for better speckle smoothing and an upper limit for texture or point target preservation. The coefficient of variation (e.g. mean/standard deviation) is a good indicator of the presence of heterogeneity within a window. It is well adapted when only isotropic (homogeneous) texture is present and can be assisted by ratio operators for anisotropic oriented textural features.
Enhanced speckle filters also include the possibility that the coefficient of variation is assisted by geometrical detectors, and that the ratio detector is extended to the detection of linear features and isolated scatterers.
SAR Land Applications SAR Land Applications -- TutorialTutorial
1.5 Speckle1.5 Speckle
Questions
Q1
Why are optical images not affected by speckle?
Q2
Identify an instrument (apart from SAR) which data are affected by speckle.
SAR Land Applications SAR Land Applications -- TutorialTutorial
1.6 SAR Data Statistics1.6 SAR Data Statistics
1.6.1 Single Look Complex, Amplitude, Intensity (Power) Data
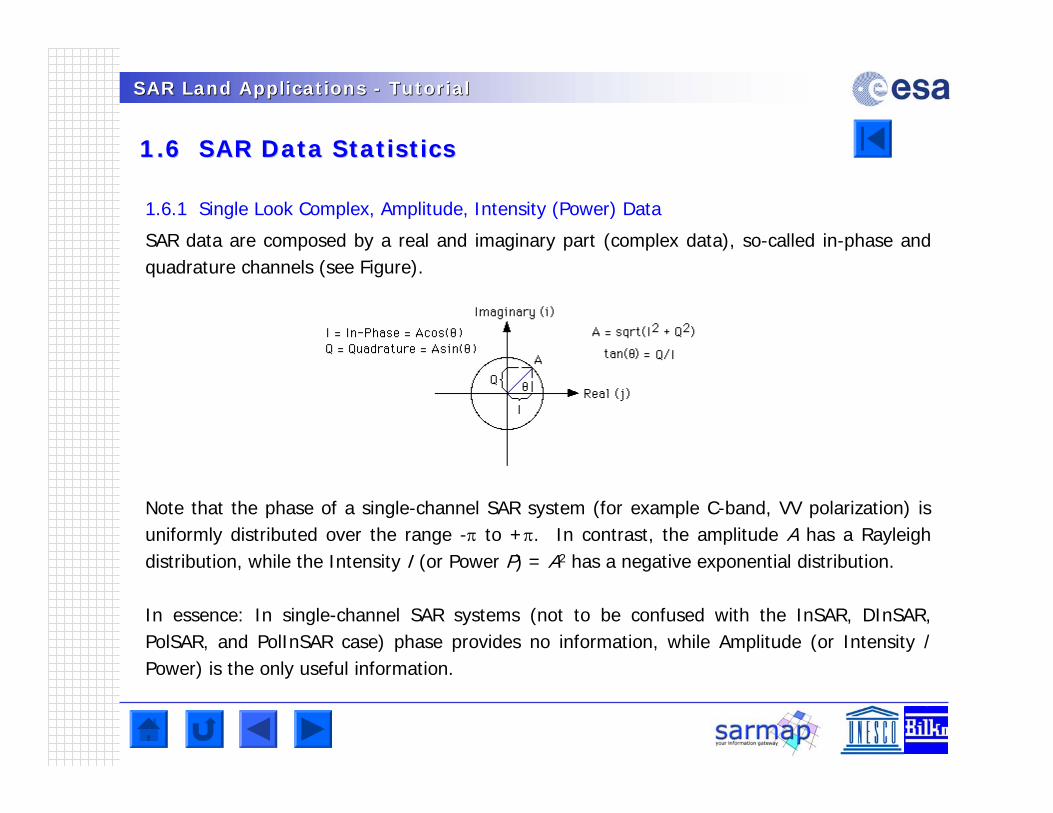
SAR data are composed by a real and imaginary part (complex data), so-called in-phase and quadrature channels (see Figure).
Note that the phase of a single-channel SAR system (for example C-band, VV polarization) is uniformly distributed over the range - to +. In contrast, the amplitude A has a Rayleigh distribution, while the Intensity I (or Power P) = A2 has a negative exponential distribution.
In essence: In single-channel SAR systems (not to be confused with the InSAR, DInSAR, PolSAR, and PolInSAR case) phase provides no information, while Amplitude (or Intensity / Power) is the only useful information.
SAR Land Applications SAR Land Applications -- TutorialTutorial
1.6 SAR Data Statistics1.6 SAR Data Statistics
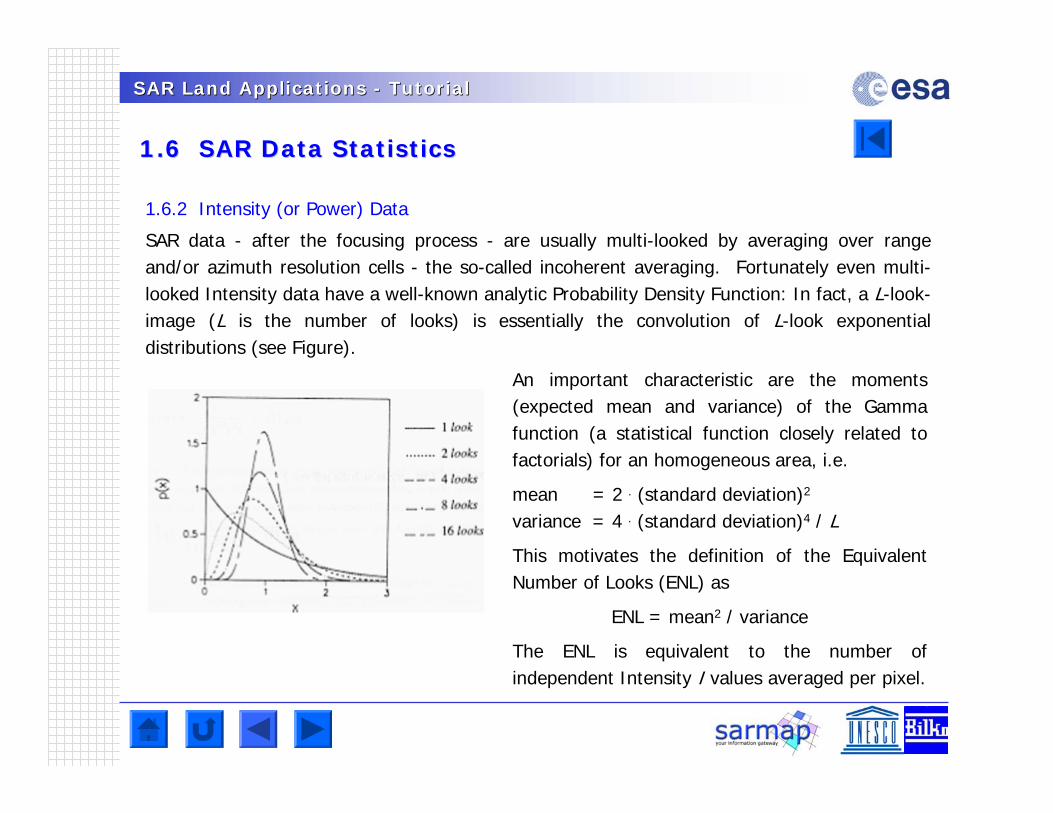
1.6.2 Intensity (or Power) Data
SAR data - after the focusing process - are usually multi-looked by averaging over range and/or azimuth resolution cells - the so-called incoherent averaging. Fortunately even multi-looked Intensity data have a well-known analytic Probability Density Function: In fact, a L-look-image (L is the number of looks) is essentially the convolution of L-look exponential distributions (see Figure).
An important characteristic are the moments (expected mean and variance) of the Gamma function (a statistical function closely related to factorials) for an homogeneous area, i.e.
mean = 2 . (standard deviation)2
variance = 4 . (standard deviation)4 / L
This motivates the definition of the Equivalent Number of Looks (ENL) as
ENL = mean2 / variance
The ENL is equivalent to the number of independent Intensity I values averaged per pixel.
SAR Land Applications SAR Land Applications -- TutorialTutorial
1.6 SAR Data Statistics1.6 SAR Data Statistics
Questions
Q1
What is the difference between Power and Intensity data?
Q2
How are Intensity data calculated from SLC data? What is the data distribution?
Q3
How are Amplitude data calculated from SLC data? What is the data distribution?
Q4
How is phase calculated from SLC data? What is the data distribution?
SAR Land Applications SAR Land Applications -- TutorialTutorial
1.7 SAR Geometry1.7 SAR Geometry
1.7.1 General
Due to the completely different geometric properties of SAR data in range and azimuth direction, it is worth considering them separately to understand the SAR imaging geometry. According to its definition, distortions in range direction are large. They are mainly caused by topographic variations. The distortions in azimuth are much smaller but more complex.
1.7.2 Geometry in Range
The position of a target is a function of the pulse transit time between the sensor and the target on the Earth’s surface. Therefore it is proportional to the distance between sensor and target. The radar image plane (see figure included in the next slide) can be thought of as any plane that contains the sensor’s flight track. The projection of individual object points onto this plane, the so-called slant range plane, is proportional to the sensor distance, and causes a non-linear compression of the imaged surface information.
SAR Land Applications SAR Land Applications -- TutorialTutorial
1.7 SAR Geometry1.7 SAR Geometry
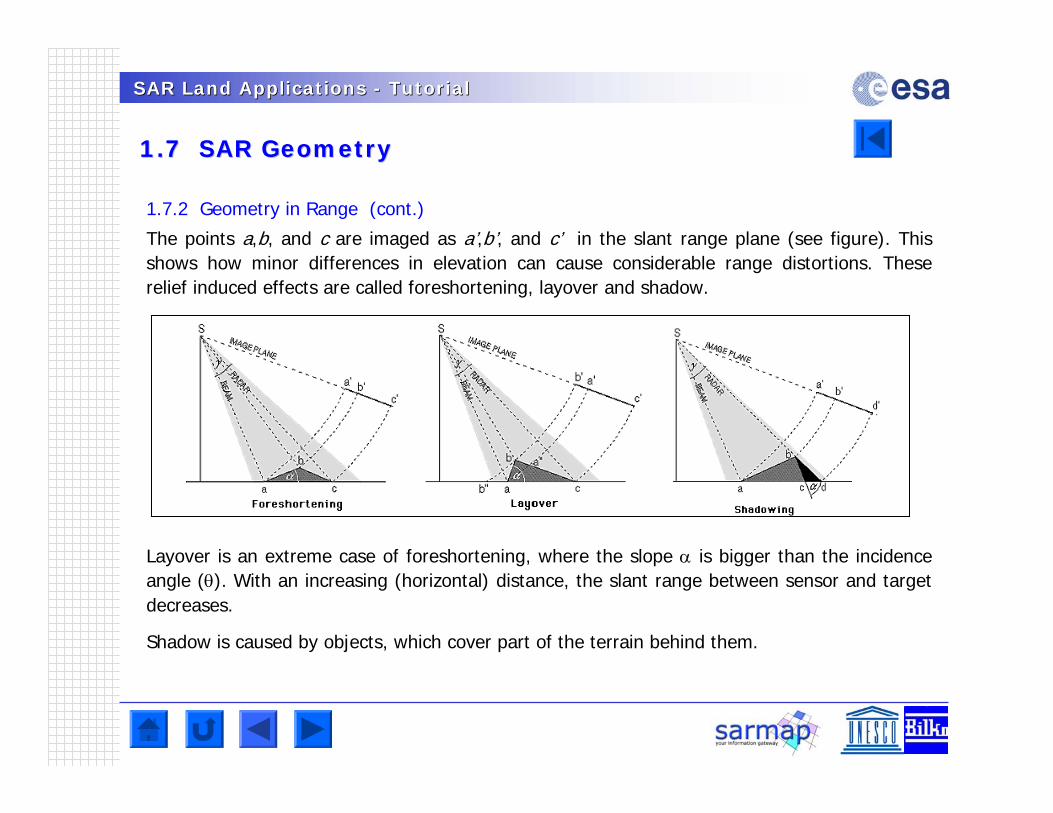
1.7.2 Geometry in Range (cont.)
The points a,b, and c are imaged as a’,b’, and c’ in the slant range plane (see figure). This shows how minor differences in elevation can cause considerable range distortions. These relief induced effects are called foreshortening, layover and shadow.
Layover is an extreme case of foreshortening, where the slope is bigger than the incidence angle (). With an increasing (horizontal) distance, the slant range between sensor and target decreases.
Shadow is caused by objects, which cover part of the terrain behind them.
SAR Land Applications SAR Land Applications -- TutorialTutorial
1.7 SAR Geometry1.7 SAR Geometry
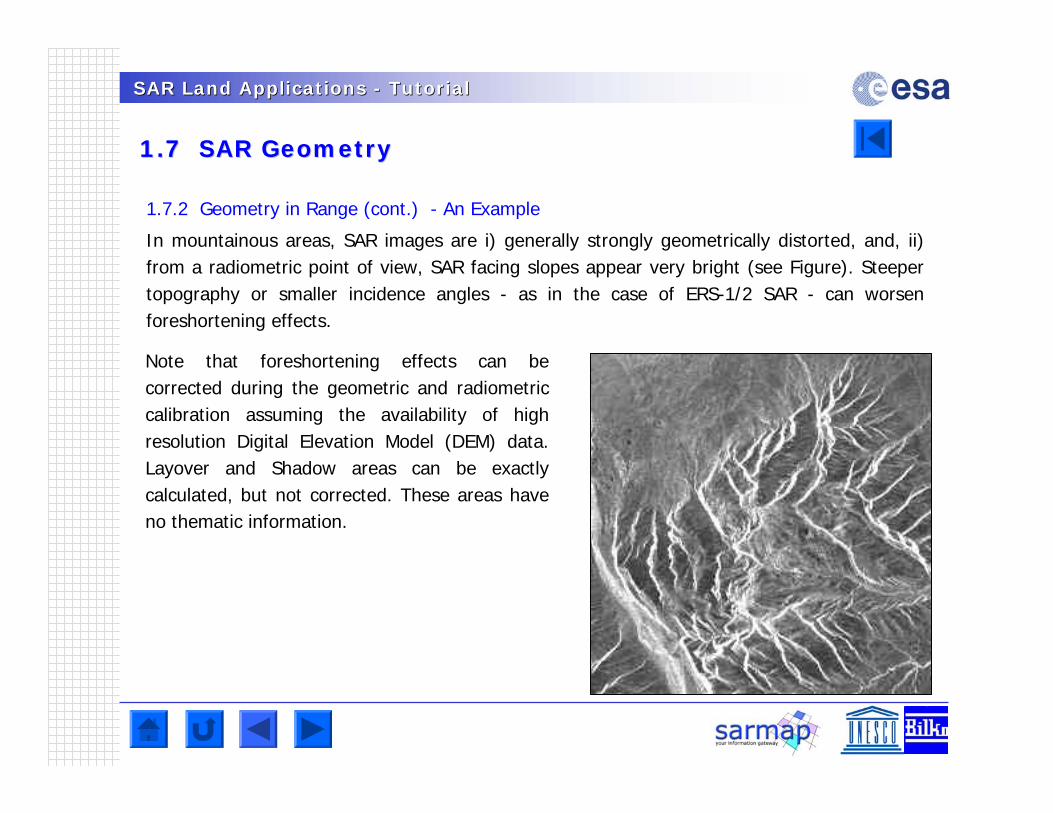
1.7.2 Geometry in Range (cont.) - An Example
In mountainous areas, SAR images are i) generally strongly geometrically distorted, and, ii) from a radiometric point of view, SAR facing slopes appear very bright (see Figure). Steeper topography or smaller incidence angles - as in the case of ERS-1/2 SAR - can worsen foreshortening effects.
Note that foreshortening effects can be corrected during the geometric and radiometric calibration assuming the availability of high resolution Digital Elevation Model (DEM) data. Layover and Shadow areas can be exactly calculated, but not corrected. These areas have no thematic information.
SAR Land Applications SAR Land Applications -- TutorialTutorial
1.7 SAR Geometry1.7 SAR Geometry
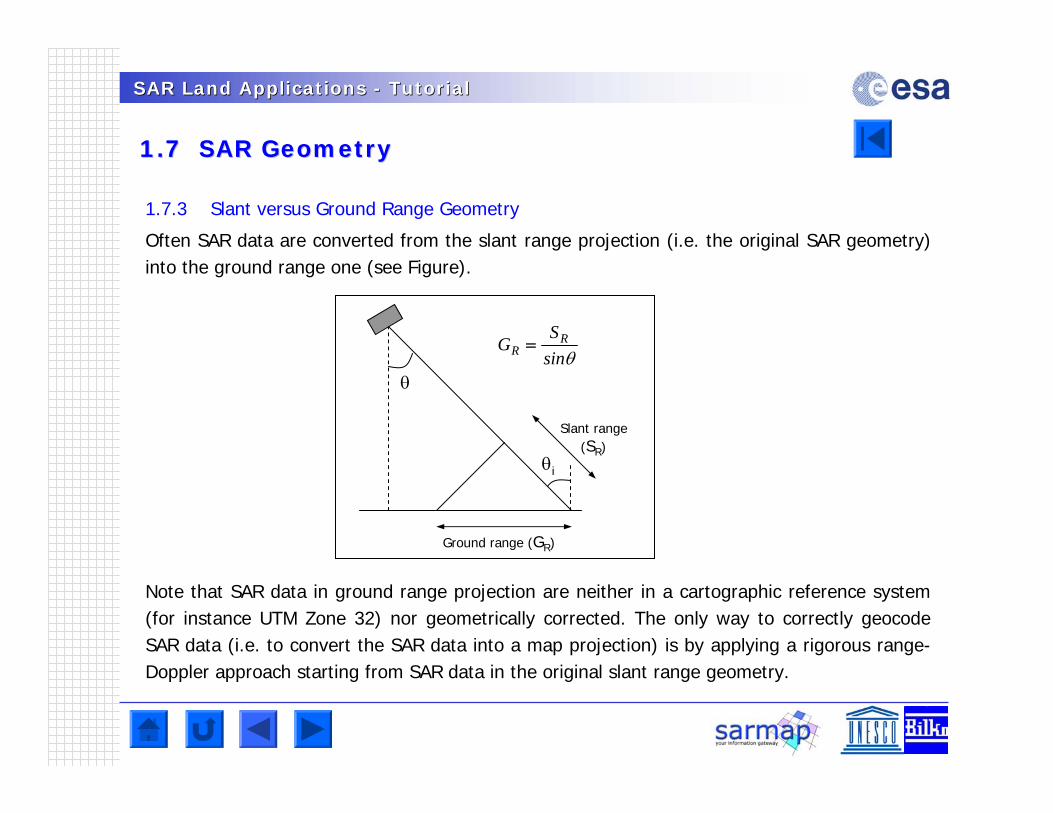
1.7.3 Slant versus Ground Range Geometry
Often SAR data are converted from the slant range projection (i.e. the original SAR geometry) into the ground range one (see Figure).
Note that SAR data in ground range projection are neither in a cartographic reference system (for instance UTM Zone 32) nor geometrically corrected. The only way to correctly geocodeSAR data (i.e. to convert the SAR data into a map projection) is by applying a rigorous range-Doppler approach starting from SAR data in the original slant range geometry.
i
Ground range (GR)
Slant range(SR)
sinS
G RR
SAR Land Applications SAR Land Applications -- TutorialTutorial
1.7 SAR Geometry1.7 SAR Geometry
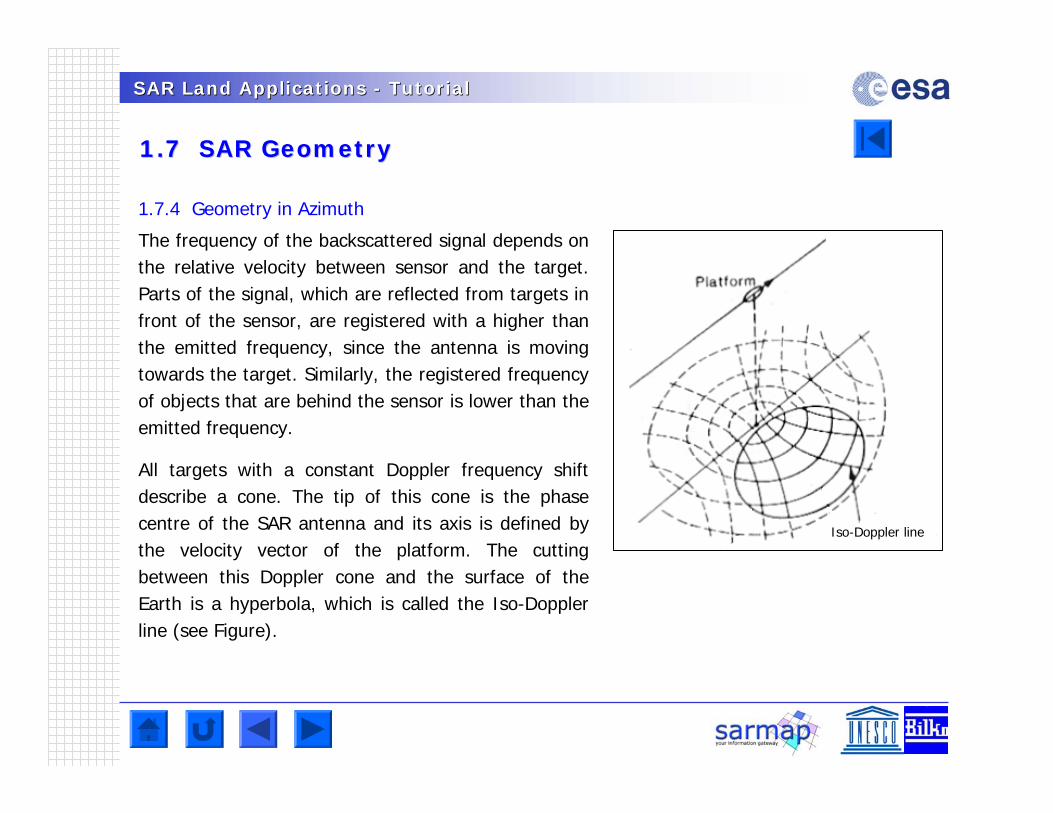
1.7.4 Geometry in Azimuth
The frequency of the backscattered signal depends on the relative velocity between sensor and the target. Parts of the signal, which are reflected from targets in front of the sensor, are registered with a higher than the emitted frequency, since the antenna is moving towards the target. Similarly, the registered frequency of objects that are behind the sensor is lower than the emitted frequency.
All targets with a constant Doppler frequency shift describe a cone. The tip of this cone is the phase centre of the SAR antenna and its axis is defined by the velocity vector of the platform. The cutting between this Doppler cone and the surface of the Earth is a hyperbola, which is called the Iso-Doppler line (see Figure).
Iso-Doppler line
SAR Land Applications SAR Land Applications -- TutorialTutorial
1.7 SAR Geometry1.7 SAR Geometry
Questions
Q1
Explain the difference between slant range and ground projection.
Q2
Why should slant range projection be used for the geocoding process?
Q3
What is the difference between slant range pixel spacing and ground resolution?
Q4
What is the difference between layover and foreshortening?
SAR Land Applications SAR Land Applications -- TutorialTutorial
2. How SAR Products are Generated 2. How SAR Products are Generated
SAR systems can acquire data in different ways, such as i) single or dual channel mode (for instance HH or HH / HV or VV / VH), ii) interferometric (single- or repeat-pass) mode, iii) polarimetric mode (HH,HV,VH,VV), and finally, iv) by combining interferometric and polarimetric acquisition modes. Obviously, different acquisition modes are subject to different processing techniques. They are:
• Processing of SAR data - Refer to Section 2.1In this case the product generation is limited to the intensity processing.
• Interferometric SAR(InSAR) Processing - Refer to Section 2.2In this case the product generation includes intensity, and interferometric phase processing.
• Polarimetric SAR (PolSAR) ProcessingIn this case the product generation includes intensity, and polarimetric phase processing.
• Polarimetric-Interferometric (PolInSAR) ProcessingIn this case the product generation includes intensity, polarimetric, and interferometricphase processing.
SAR Land Applications SAR Land Applications -- TutorialTutorial
2. How SAR Products are Generated? 2. How SAR Products are Generated?
2.1.1 Focusing 2.1.1 Focusing
2.1.2 Multi2.1.2 Multi--lookinglooking
2.1.3 Co2.1.3 Co--registrationregistration
2.1.4 Speckle Filtering2.1.4 Speckle Filtering
2.1.5 Segmentation2.1.5 Segmentation
2.1.6 Segmentation or speckle filtering?2.1.6 Segmentation or speckle filtering?
2.1.7 2.1.7 GeocodingGeocoding
2.1.8 Radiometric Calibration2.1.8 Radiometric Calibration
2.1.9 Radiometric Normalization2.1.9 Radiometric Normalization
2.1.10 2.1.10 MosaicingMosaicing
2.1.11 Classification2.1.11 Classification
2.1 SAR Processing2.1 SAR Processing
SAR Land Applications SAR Land Applications -- TutorialTutorial
2.1.1 Focusing 2.1.1 Focusing
2.1.1.1 Purpose
SAR processing is a two-dimensional problem. In the raw data, the signal energy from a point target is spread in range and azimuth, and the purpose of SAR focussing is to collect this dispersed energy into a single pixel in the output image.
Focusing for SAR image formation involves sampled and quantized SAR echoes data and represents a numerical evaluation of the synthetic aperture beam formation process. A large number of arithmetic computations are involved. The numerical nature of the digital correlation calls for the formulation of an accurate mathematical procedure, often referred to as a SAR correlation or focusing algorithm, in order to manipulate the sample echo signals to accomplish the SAR correlation process.
SAR Land Applications SAR Land Applications -- TutorialTutorial
2.1.1 Focusing 2.1.1 Focusing
2.1.1.2 Method
SAR processing is performed in range and azimuth directions. In range, the signal is spread out by the duration of the linear Frequency Modulation (FM) transmitted pulse. In azimuth, the signal is spread out by the length of the period it is illuminated by the antenna beam, or the synthetic aperture. As a point target passes through the azimuth antenna beam, the range to the target changes. On the scale of the wavelength, this range variation causes a phase variation in the received signal as a function of azimuth. This phase variation over the synthetic aperture corresponds to the Doppler bandwidth of the azimuth signal, and allows the signal to be compressed in the azimuth direction.
The range variation to a point target can result in a variation in the range delay (distance sensor-target) to the target that is larger than the range sample spacing, resulting in what is called range migration. This range migration of the signal energy over several range bins must be corrected before azimuth compression can occur. The range-Doppler algorithm performs this correction very efficiently in the range-time, azimuth-frequency domain.
SAR Land Applications SAR Land Applications -- TutorialTutorial
2.1.1 Focusing 2.1.1 Focusing
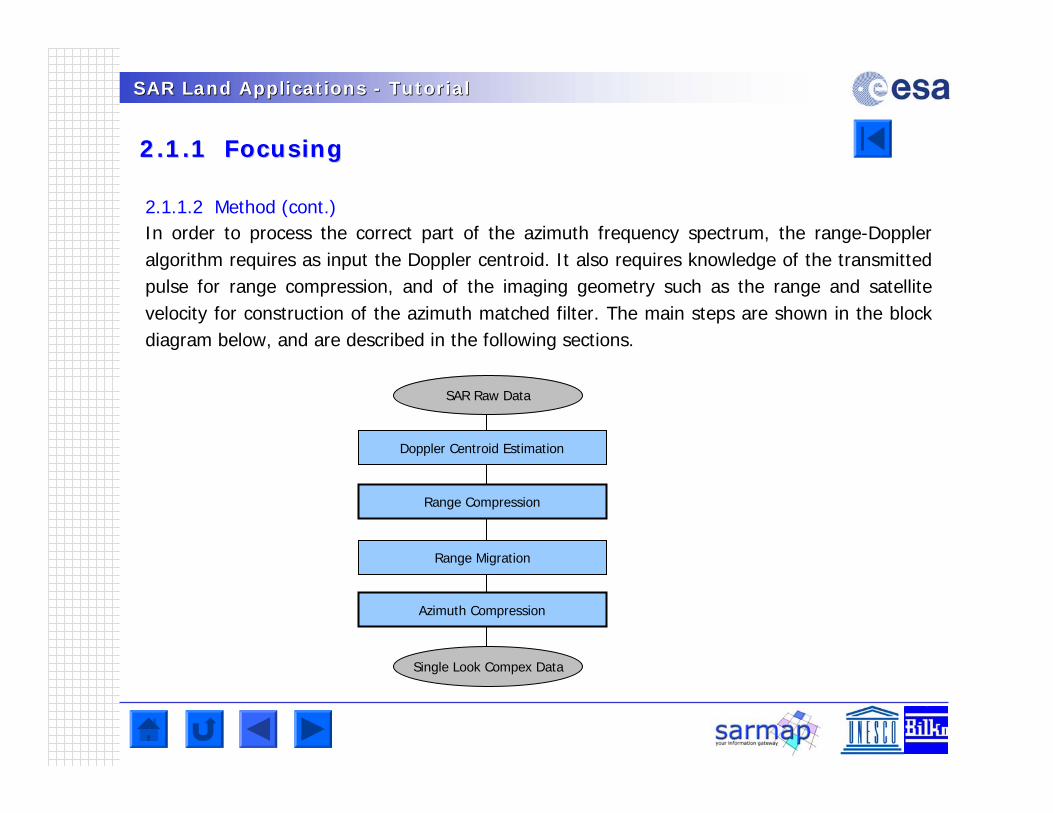
2.1.1.2 Method (cont.)In order to process the correct part of the azimuth frequency spectrum, the range-Doppler algorithm requires as input the Doppler centroid. It also requires knowledge of the transmitted pulse for range compression, and of the imaging geometry such as the range and satellite velocity for construction of the azimuth matched filter. The main steps are shown in the block diagram below, and are described in the following sections.
SAR Raw Data
Range Compression
Range Migration
Single Look Compex Data
Azimuth Compression
Doppler Centroid Estimation
SAR Land Applications SAR Land Applications -- TutorialTutorial
2.1.1 Focusing 2.1.1 Focusing
2.1.1.3 Doppler Centroid Estimation
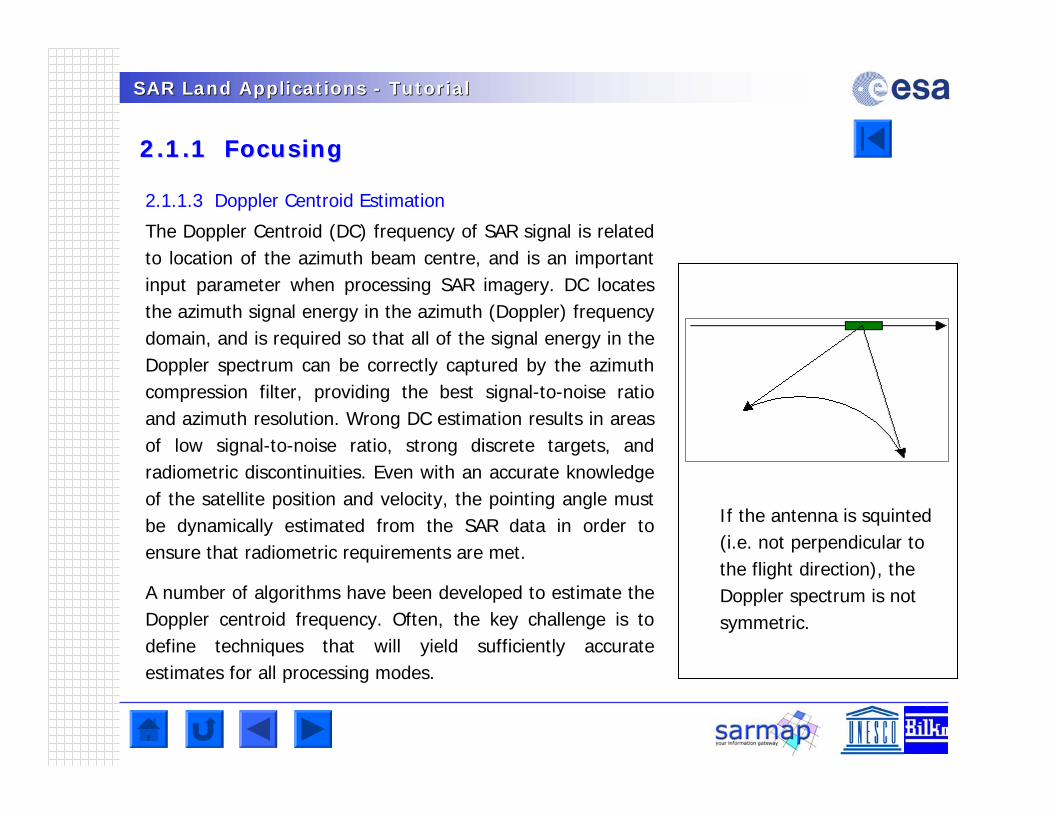
The Doppler Centroid (DC) frequency of SAR signal is related to location of the azimuth beam centre, and is an important input parameter when processing SAR imagery. DC locates the azimuth signal energy in the azimuth (Doppler) frequency domain, and is required so that all of the signal energy in the Doppler spectrum can be correctly captured by the azimuth compression filter, providing the best signal-to-noise ratio and azimuth resolution. Wrong DC estimation results in areas of low signal-to-noise ratio, strong discrete targets, and radiometric discontinuities. Even with an accurate knowledge of the satellite position and velocity, the pointing angle must be dynamically estimated from the SAR data in order to ensure that radiometric requirements are met.
A number of algorithms have been developed to estimate the Doppler centroid frequency. Often, the key challenge is to define techniques that will yield sufficiently accurate estimates for all processing modes.
If the antenna is squinted (i.e. not perpendicular to the flight direction), the Doppler spectrum is not symmetric.
SAR Land Applications SAR Land Applications -- TutorialTutorial
2.1.1 Focusing 2.1.1 Focusing
2.1.1.4 Range Compression
In collecting the SAR data, a long-duration linear Frequency Modulation (FM) pulse is transmitted. This allows the pulse energy to be transmitted with a lower peak power. The linear FM pulse has the property that, when filtered with a matched filter (e.g. the reference function), the result is a narrow pulse in which all the pulse energy has been collected to the peak value. Thus, when a matched filter is applied to the received echo, it is as if a narrow pulse were transmitted, with its corresponding range resolution and signal-to-noise ratio.
This matched filtering of the received echo is called range compression. Range compression is performed on each range line of SAR data, and can be done efficiently by the use of the Fast Fourier Transform (FFT). The frequency domain range matched filter needs to be generated only once, and it is applied to each range line. The range matched filter may be computed or generated from a replica of the transmitted pulse. In addition, the range matched filter frequency response typically includes an amplitude weighting to control sidelobes in the range impulse response.
SAR Land Applications SAR Land Applications -- TutorialTutorial
2.1.1 Focusing 2.1.1 Focusing
Range FFT
X
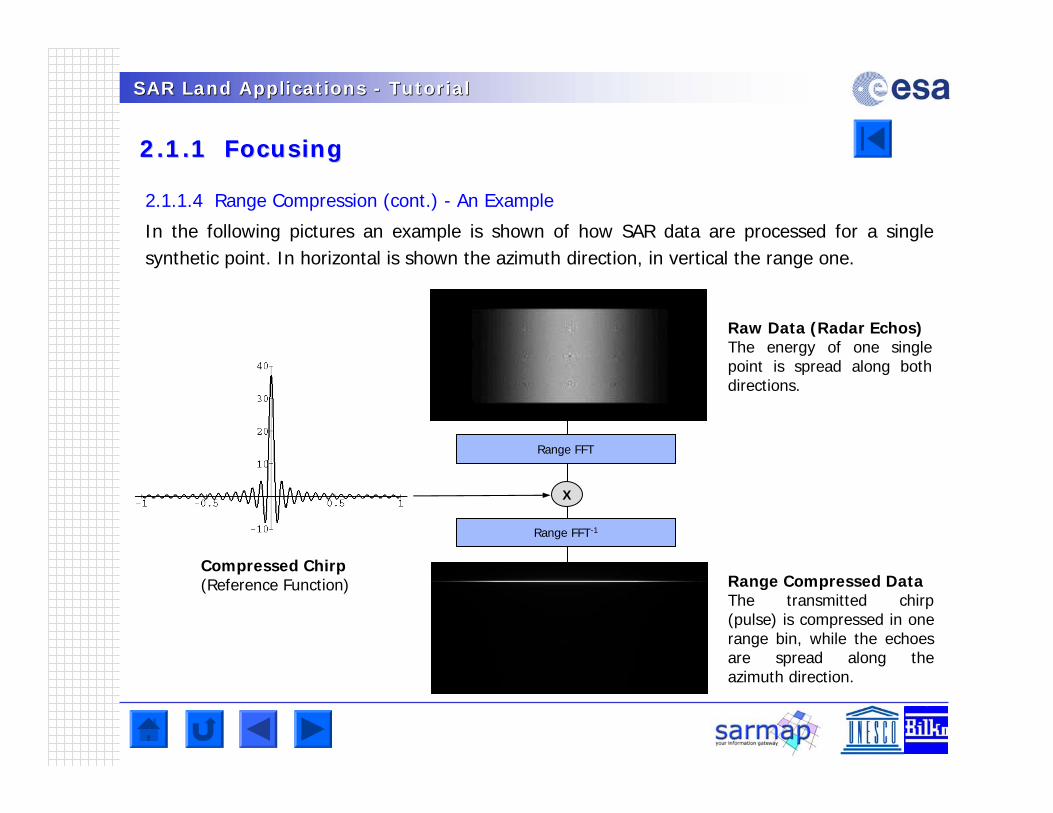
Raw Data (Radar Echos)The energy of one single point is spread along both directions.
Range Compressed DataThe transmitted chirp (pulse) is compressed in one range bin, while the echoes are spread along the azimuth direction.
2.1.1.4 Range Compression (cont.) - An Example
In the following pictures an example is shown of how SAR data are processed for a single synthetic point. In horizontal is shown the azimuth direction, in vertical the range one.
Compressed Chirp(Reference Function)
Range FFT-1
SAR Land Applications SAR Land Applications -- TutorialTutorial
2.1.1 Focusing 2.1.1 Focusing
2.1.1.6 Azimuth Compression
Azimuth compression is a matched filtering of the azimuth signal, performed efficiently using FFT's. The frequency response of the azimuth compression filter is precomputed using the orbital geometry. The azimuth filter also depends on range. Thus the data is divided into range invariance regions, and the same basic matched filter is used over a range interval called the Frequency Modulation (FM) rate invariance region. The size of this invariance region must not be large enough to cause severe broadening in the compressed image. Also included is an amplitude weighting to control sidelobes in the azimuth impulse response. Note that the position of the amplitude weighting in the azimuth frequency array depends on the Doppler Centroid, which also depends on range.
The extracted frequency array for each look is multiplied by the matched filter frequency response and the inverse FFT is performed to form the complex look image. The matched filter frequency response is adjusted by a small linear phase ramp for each look. In addition, azimuth interpolation may also performed after look compression to achieve a desire azimuth pixel spacing, and it is done on each look separately.
SAR Land Applications SAR Land Applications -- TutorialTutorial
2.1.1 Focusing 2.1.1 Focusing
Range Compressed Data Azimuth FFT
Range Cell Migration Correction
Azimuth FFT-1
XReference function
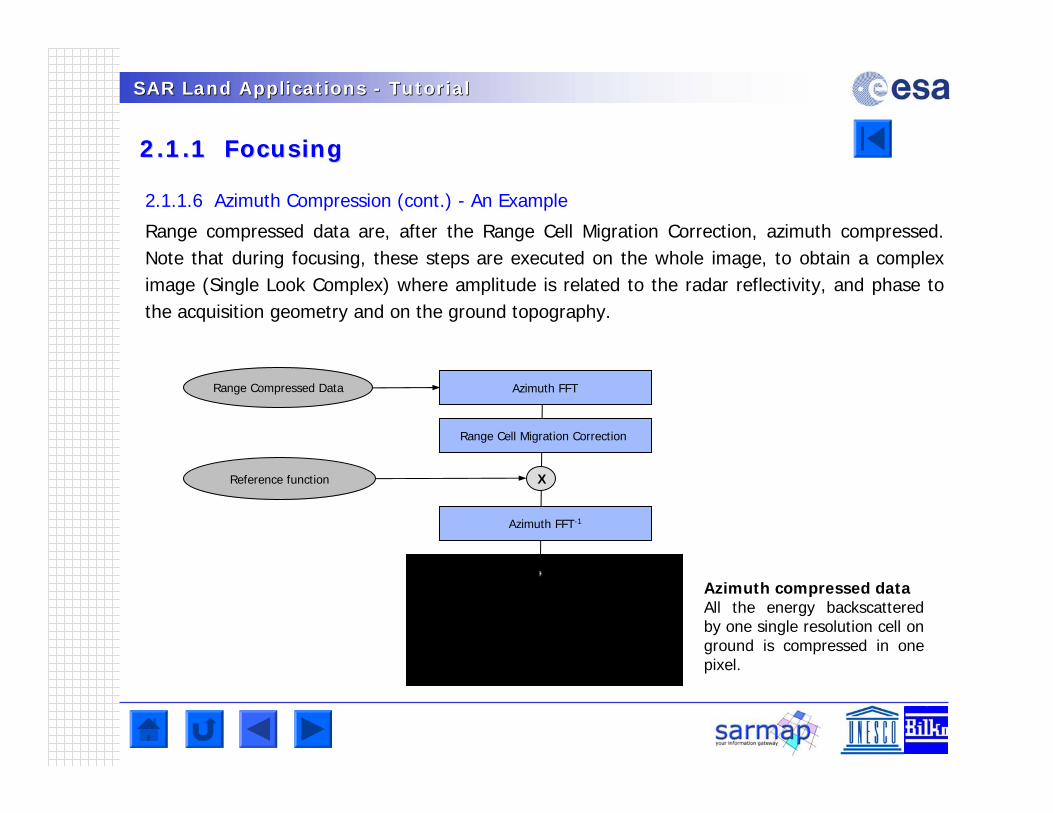
Azimuth compressed dataAll the energy backscattered by one single resolution cell on ground is compressed in one pixel.
2.1.1.6 Azimuth Compression (cont.) - An Example
Range compressed data are, after the Range Cell Migration Correction, azimuth compressed. Note that during focusing, these steps are executed on the whole image, to obtain a complex image (Single Look Complex) where amplitude is related to the radar reflectivity, and phase to the acquisition geometry and on the ground topography.
SAR Land Applications SAR Land Applications -- TutorialTutorial
2.1.1 Focusing2.1.1 Focusing
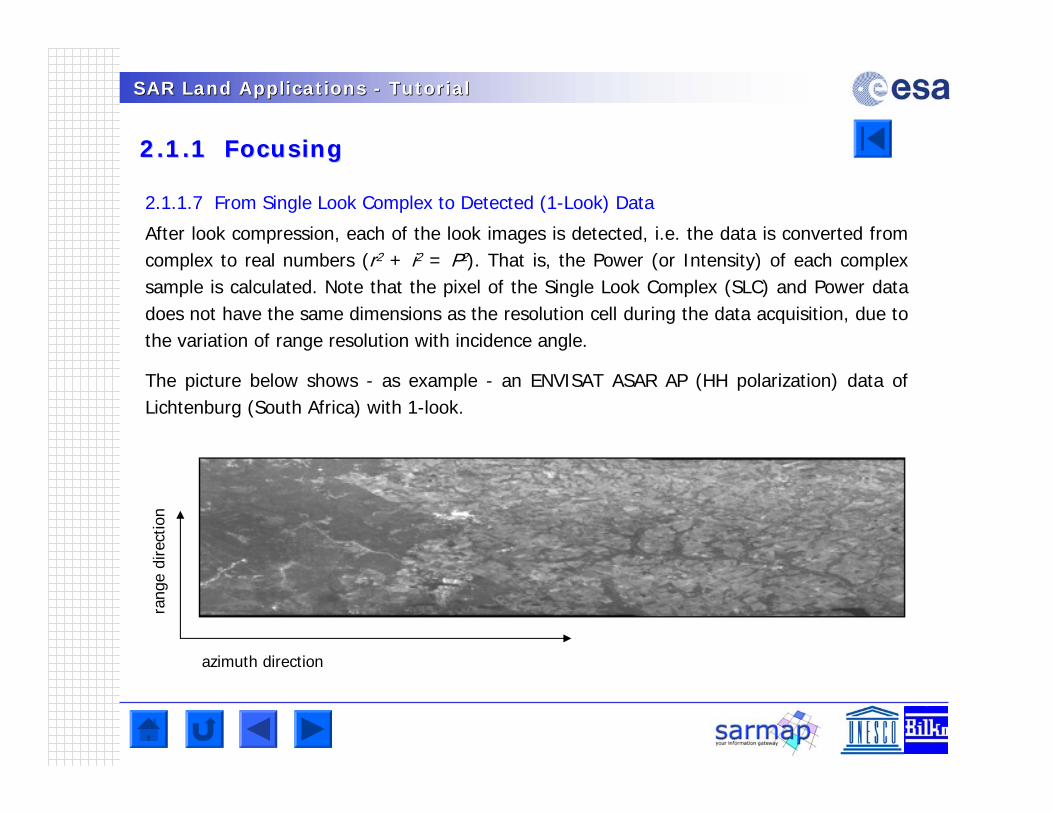
2.1.1.7 From Single Look Complex to Detected (1-Look) Data
After look compression, each of the look images is detected, i.e. the data is converted from complex to real numbers (r2 + i2 = P2). That is, the Power (or Intensity) of each complex sample is calculated. Note that the pixel of the Single Look Complex (SLC) and Power data does not have the same dimensions as the resolution cell during the data acquisition, due to the variation of range resolution with incidence angle.
The picture below shows - as example - an ENVISAT ASAR AP (HH polarization) data of Lichtenburg (South Africa) with 1-look.
azimuth direction
rang
e di
rect
ion
SAR Land Applications SAR Land Applications -- TutorialTutorial
2.1.1 Focusing2.1.1 Focusing
Questions
Q1
Assuming that the orbit is not stable (as in the airborne case), what should be considered
during the focusing step? Assuming that a standard (as presented) focusing would be used,
how would looks like a SAR image?
SAR Land Applications SAR Land Applications -- TutorialTutorial
2.1.2 Multi2.1.2 Multi--lookinglooking
2.1.2.1 Purpose
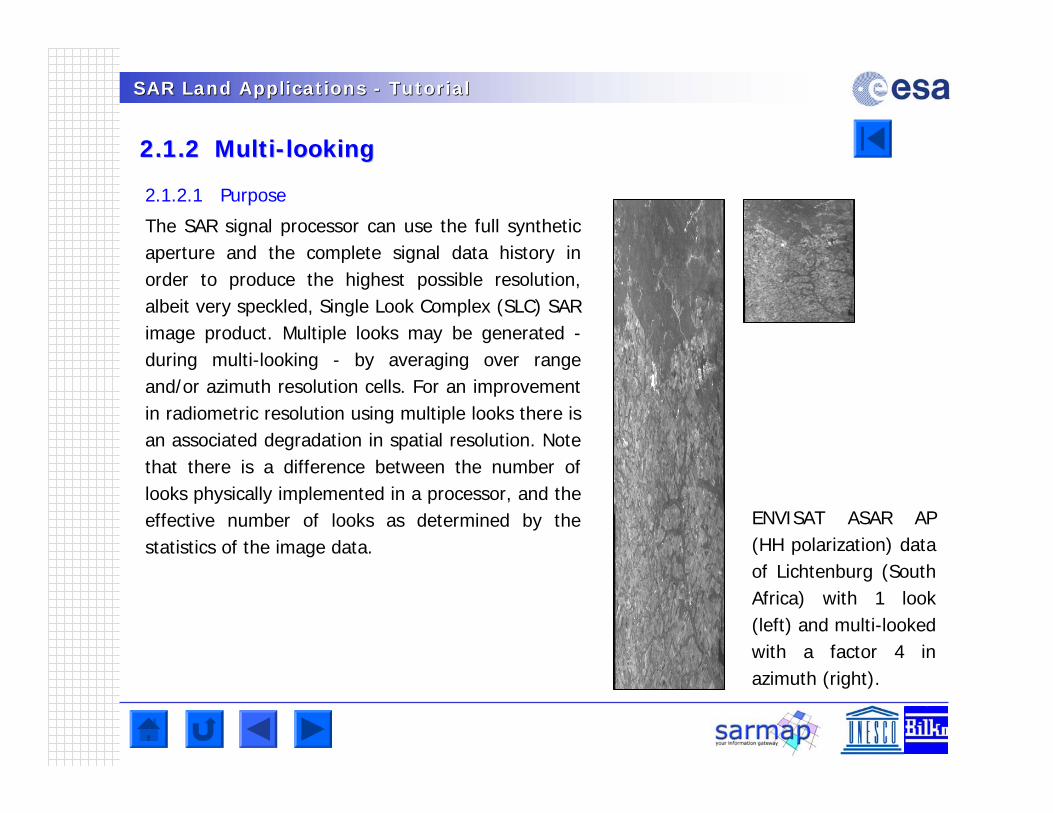
The SAR signal processor can use the full synthetic aperture and the complete signal data history in order to produce the highest possible resolution, albeit very speckled, Single Look Complex (SLC) SAR image product. Multiple looks may be generated -during multi-looking - by averaging over range and/or azimuth resolution cells. For an improvement in radiometric resolution using multiple looks there is an associated degradation in spatial resolution. Note that there is a difference between the number of looks physically implemented in a processor, and the effective number of looks as determined by the statistics of the image data.
ENVISAT ASAR AP (HH polarization) data of Lichtenburg (South Africa) with 1 look (left) and multi-looked with a factor 4 in azimuth (right).
SAR Land Applications SAR Land Applications -- TutorialTutorial
2.1.2 Multi2.1.2 Multi--lookinglooking
2.1.2.2 How to select an appropriate number of looks - An Example
The number of looks is a function of- pixel spacing in azimuth - pixel spacing in slant range- incidence at scene centre
The goal is to obtain in the multi-looked image approximately squared pixels considering the ground range resolution (and not the pixel spacing in slant range) and the pixel spacing in azimuth. In particular, in order to avoid over- or under-sampling effects in the geocoded image, it is recommended to generate a multi-looked image corresponding to approximately the same spatial resolution foreseen for the geocoded image product.
Note that ground resolution in range is defined as
ground range resolution = pixel spacing rangesin(incidence angle)
SAR Land Applications SAR Land Applications -- TutorialTutorial
2.1.2 Multi2.1.2 Multi--lookinglooking
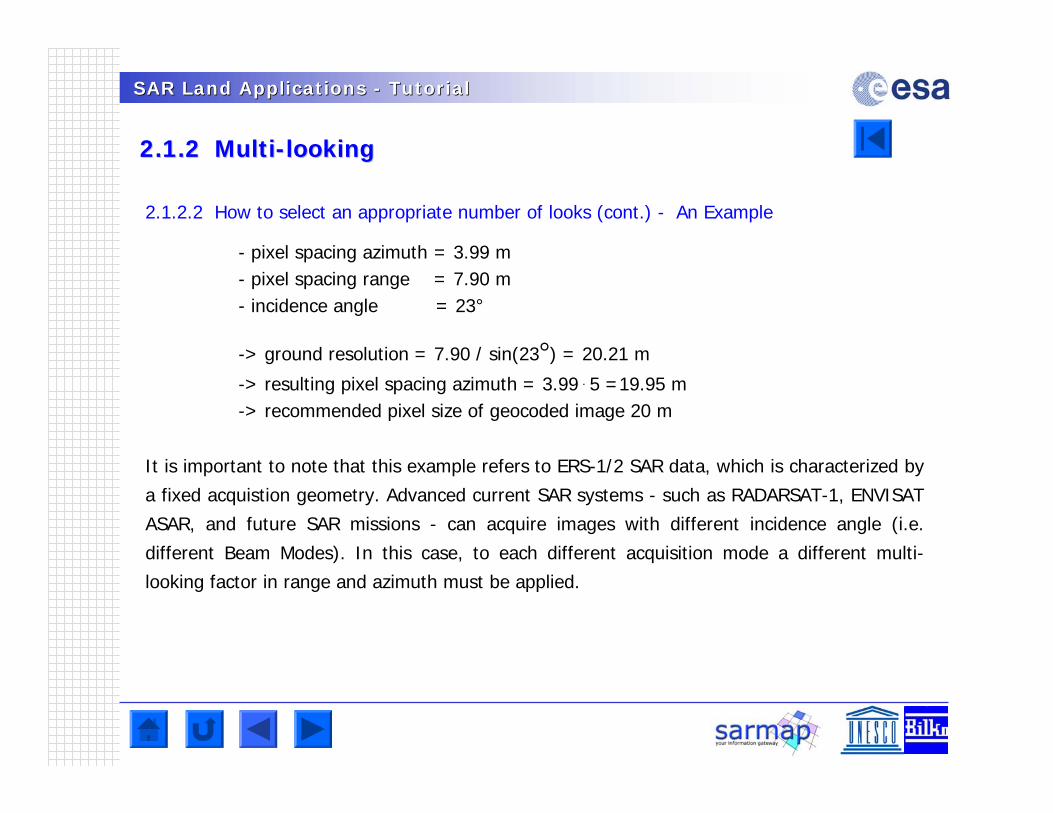
2.1.2.2 How to select an appropriate number of looks (cont.) - An Example
- pixel spacing azimuth = 3.99 m- pixel spacing range = 7.90 m- incidence angle = 23°
-> ground resolution = 7.90 / sin(23°) = 20.21 m
-> resulting pixel spacing azimuth = 3.99 . 5 =19.95 m-> recommended pixel size of geocoded image 20 m
It is important to note that this example refers to ERS-1/2 SAR data, which is characterized by
a fixed acquistion geometry. Advanced current SAR systems - such as RADARSAT-1, ENVISAT
ASAR, and future SAR missions - can acquire images with different incidence angle (i.e.
different Beam Modes). In this case, to each different acquisition mode a different multi-
looking factor in range and azimuth must be applied.
SAR Land Applications SAR Land Applications -- TutorialTutorial
2.1.2 Multi2.1.2 Multi--lookinglooking
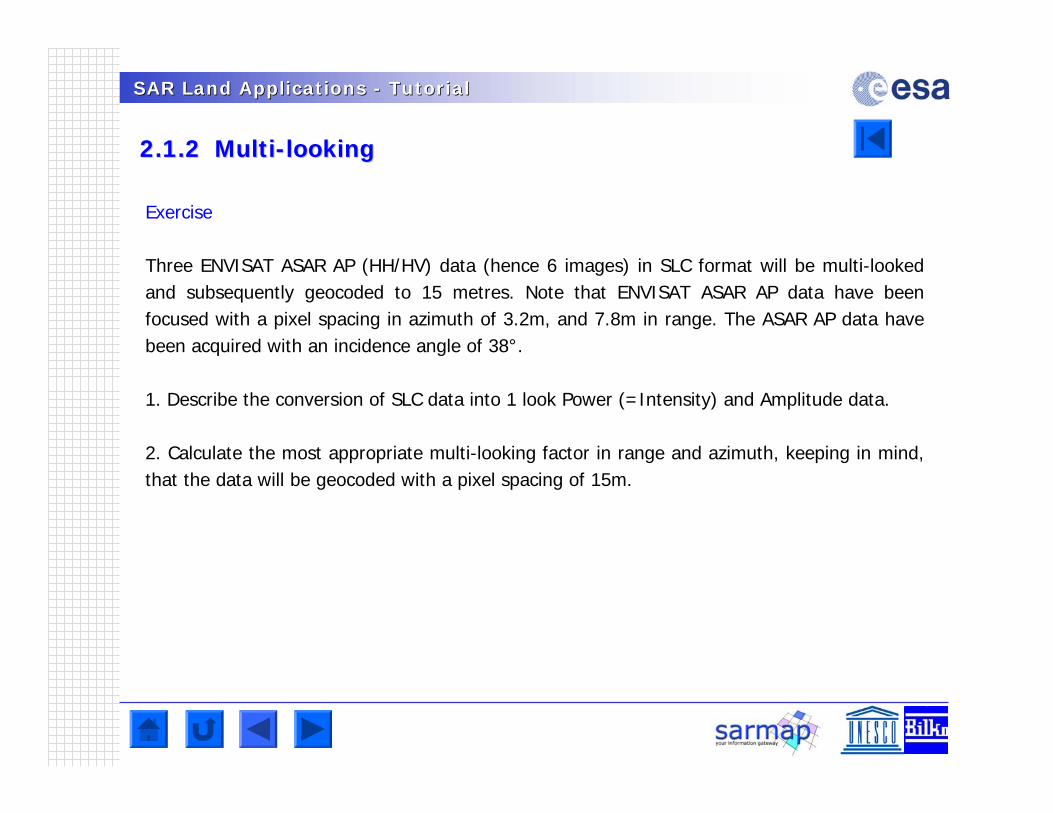
Exercise
Three ENVISAT ASAR AP (HH/HV) data (hence 6 images) in SLC format will be multi-looked and subsequently geocoded to 15 metres. Note that ENVISAT ASAR AP data have been focused with a pixel spacing in azimuth of 3.2m, and 7.8m in range. The ASAR AP data have been acquired with an incidence angle of 38°.
1. Describe the conversion of SLC data into 1 look Power (=Intensity) and Amplitude data.
2. Calculate the most appropriate multi-looking factor in range and azimuth, keeping in mind, that the data will be geocoded with a pixel spacing of 15m.
SAR Land Applications SAR Land Applications -- TutorialTutorial
2.1.3 Co2.1.3 Co--registration registration
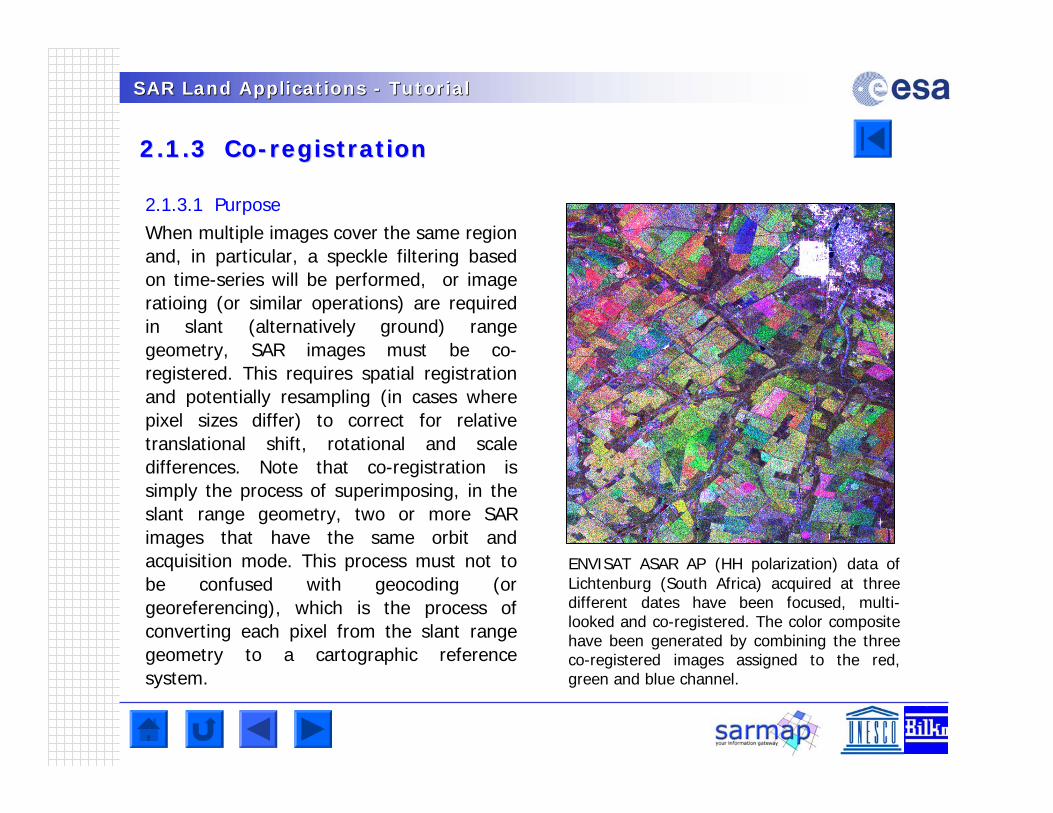
2.1.3.1 PurposeWhen multiple images cover the same region and, in particular, a speckle filtering based on time-series will be performed, or image ratioing (or similar operations) are required in slant (alternatively ground) range geometry, SAR images must be co-registered. This requires spatial registration and potentially resampling (in cases where pixel sizes differ) to correct for relative translational shift, rotational and scale differences. Note that co-registration is simply the process of superimposing, in the slant range geometry, two or more SAR images that have the same orbit and acquisition mode. This process must not to be confused with geocoding (or georeferencing), which is the process of converting each pixel from the slant range geometry to a cartographic reference system.
ENVISAT ASAR AP (HH polarization) data of Lichtenburg (South Africa) acquired at three different dates have been focused, multi-looked and co-registered. The color composite have been generated by combining the three co-registered images assigned to the red, green and blue channel.
SAR Land Applications SAR Land Applications -- TutorialTutorial
2.1.3 Co2.1.3 Co--registration registration
• A gross shift estimation is computed based on the orbital data parameters.
• A set of sub-windows is selected automatically based on the reference image and on the image(s) to be co-registered.
• The cross-correlation function is computed between the pixels of corresponding sub-windows in the two images.
• The maximum of the cross-correlation function indicates the proper shift for the selectedlocation.
• The shift to be applied in azimuth direction and range direction is calculated by a polynomial depending on the pixel position respectively in azimuth and range.
2.1.3.2 MethodThis step is usually performed in an automatic way, according to the following procedure:
SAR Land Applications SAR Land Applications -- TutorialTutorial
2.1.3 Co2.1.3 Co--registration registration
Questions
Q1
Can SAR images acquired with different acquisition geometries or by different sensors be co-
registered? Explain your answer.
Q2
What is the difference between co-registered and geocoded images?
SAR Land Applications SAR Land Applications -- TutorialTutorial
2.1.4 Speckle Filtering 2.1.4 Speckle Filtering
2.1.4.1 Purpose
Images obtained from coherent sensors such as SAR (or Laser) system are characterized by speckle. This is a spatially random multiplicative noise due to coherent superposition of multiple backscatter sources within a SAR resolution element. In other words, speckle is a statistical fluctuation associated with the radar reflectivity (brightness) of each pixel in the image of a scene. A first step to reduce speckle - at the expense of spatial resolution - is usually performed during the multi-looking, where range and/or azimuth resolution cells are averaged. The more looks that are used to process an image, the less speckle there is.
In the following sections different algorithms are shortly presented.
SAR Land Applications SAR Land Applications -- TutorialTutorial
2.1.4 Speckle Filtering 2.1.4 Speckle Filtering
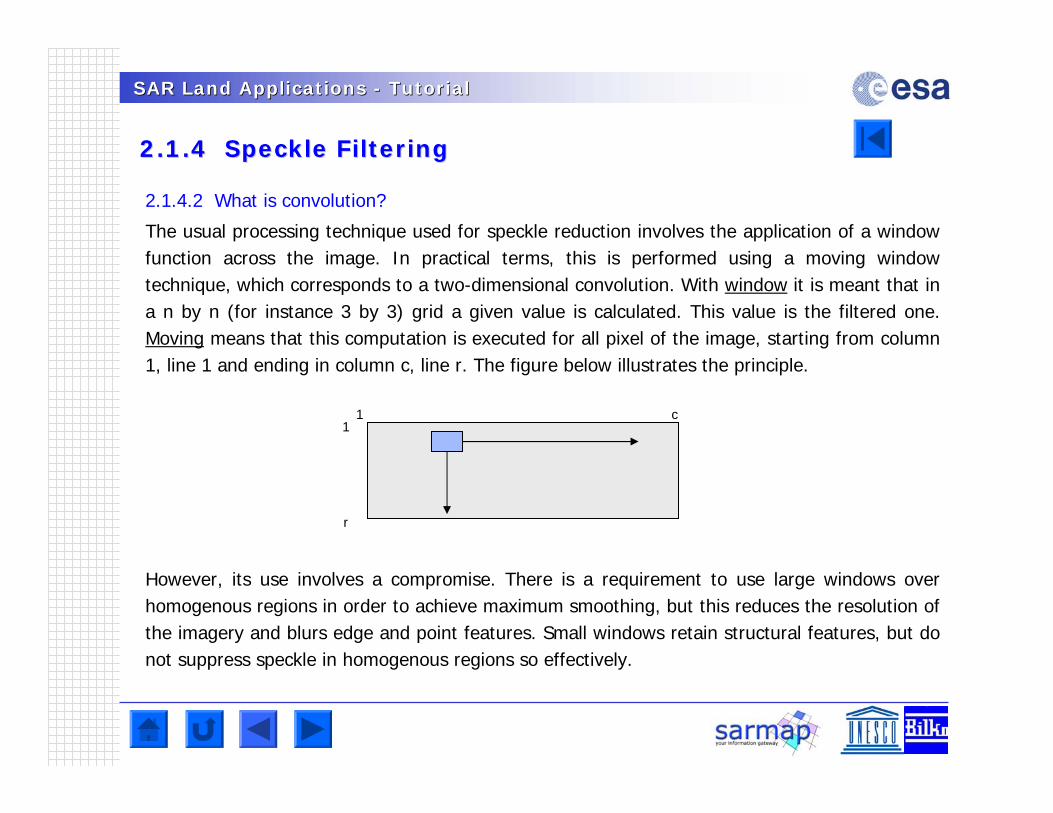
2.1.4.2 What is convolution?
The usual processing technique used for speckle reduction involves the application of a window function across the image. In practical terms, this is performed using a moving window technique, which corresponds to a two-dimensional convolution. With window it is meant that in a n by n (for instance 3 by 3) grid a given value is calculated. This value is the filtered one. Moving means that this computation is executed for all pixel of the image, starting from column 1, line 1 and ending in column c, line r. The figure below illustrates the principle.
However, its use involves a compromise. There is a requirement to use large windows over homogenous regions in order to achieve maximum smoothing, but this reduces the resolution of the imagery and blurs edge and point features. Small windows retain structural features, but do not suppress speckle in homogenous regions so effectively.
1 c1
r
SAR Land Applications SAR Land Applications -- TutorialTutorial
2.1.4 Speckle Filtering 2.1.4 Speckle Filtering
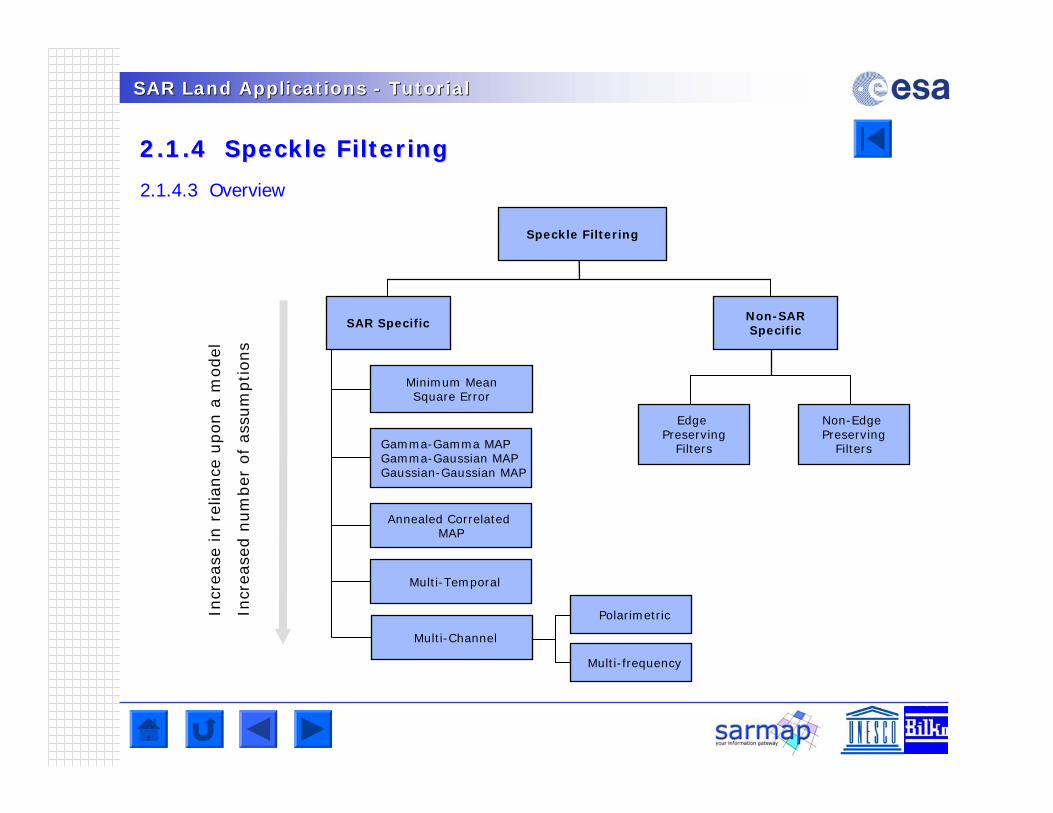
2.1.4.3 Overview
Minimum MeanSquare Error
Speckle Filtering
Non-SARSpecific
Edge Preserving
Filters
Non-Edge Preserving
Filters
SAR Specific
Gamma-Gamma MAPGamma-Gaussian MAPGaussian-Gaussian MAP
Annealed Correlated MAP
Incr
ease
in r
elia
nce
upon a
model
Incr
ease
d n
um
ber
of
ass
um
ptions
Multi-Temporal
Multi-frequency
Polarimetric
Multi-Channel
SAR Land Applications SAR Land Applications -- TutorialTutorial
2.1.4 Speckle Filtering 2.1.4 Speckle Filtering
2.1.4.4 Non-SAR Specific Filters
The simplest methods, which are non-speckle specific may or may not preserve structural features e.g. average and general low pass filters are not Edge Preserving, and are not commonly used. Edge Preserving filters such as median, the Matsuyama (Edge Preserving Smoothing) and sigma filters reduce speckle while retaining structure information.
2.1.4.5 Minimum Mean Square Error FiltersThe most well known adaptive filters are based on a multiplicative model and they consider local statistic. The Frost filter is an adaptive filter, and convolves the pixel values within a fixed size window with an adaptive exponential impulse response. The Lee and Kuan filtersperform a linear combination of the observed intensity and of the local average intensity value within the fixed window. They are all adaptive as a function of the local coefficient of variation (which is a good indicator of the presence of some heterogeneity within the window) and can be enhanced by fixing a minimum value for better speckle smoothing and an upper limit texture or point target preservation.
SAR Land Applications SAR Land Applications -- TutorialTutorial
2.1.4 Speckle Filtering 2.1.4 Speckle Filtering
2.1.4.6 Gamma-Gamma and Gaussian-Gaussian Maximum A Posteriori (MAP)
In the presence of scene texture, to preserve the useful spatial resolution, e.g. to restore the spatial fluctuations of the radar reflectivity (texture), an A Priori first order statistical model is needed. With respect to SAR clutter, it is well accepted that the Gamma-distributed scene model is the most appropriate. The Gamma-distributed scene model, modulated by, either an independent complex-Gaussian speckle model (for SAR SLC images), or by a Gamma speckle model (for multi-look detected SAR images), gives rise to a K-distributed clutter. Nevertheless, the Gaussian-distributed scene model remains still popular, mainly for mathematical tractability of the inverse problem in case of multi-channel SAR images (multivariate A Priori scene distributions). In this context, the following filter families has been developed:
- Single channel detected SAR data- Gamma-Gamma MAP filter- Gamma-Distribution-Entropy MAP filter- Gamma-A Posteriori Mean filter
- Multi-channel detected SAR data- Gamma-Gaussian MAP filter for uncorrelated speckle- Gaussian-Gaussian MAP filter for correlated speckle- Gaussian-Distribution-Entropy MAP filter for correlated speckle
SAR Land Applications SAR Land Applications -- TutorialTutorial
2.1.4 Speckle Filtering 2.1.4 Speckle Filtering
2.1.4.7 Correlated Neighbourhood and Simulated Annealing
In essence in these algorithms some structural sensitivity is introduced by subdividing the neighbourhood into a set of templates which encapsulate directional information, allowing to produce a set of different solutions, corresponding to each of the configurations. The structure can then be preserved by selecting the most probable configuration.
SAR Land Applications SAR Land Applications -- TutorialTutorial
2.1.4 Speckle Filtering 2.1.4 Speckle Filtering
2.1.4.8 Multi-Temporal Filters
Within the Multi-Temporal filtering - besides the consideration of a speckle specific filter (see previous slides) - an optimum weighting filter is introduced to balance differences in reflectivity between images at different times. It has to be pointed out that multi-temporal filtering is based on the assumption that the same resolution element on the ground is illuminated by the radar beam in the same way, and corresponds to the same coordinates in the image plane (sampled signal) in all images of the time series.The reflectivity can of course change from one time to the next due to a change in the dielectric and geometrical properties of the elementary scatters, but should not change due to a different position of the resolution element with respect to the radar. Therefore proper spatial co-registration of the SAR images in the time series is of paramount importance.
SAR Land Applications SAR Land Applications -- TutorialTutorial
2.1.4 Speckle Filtering 2.1.4 Speckle Filtering
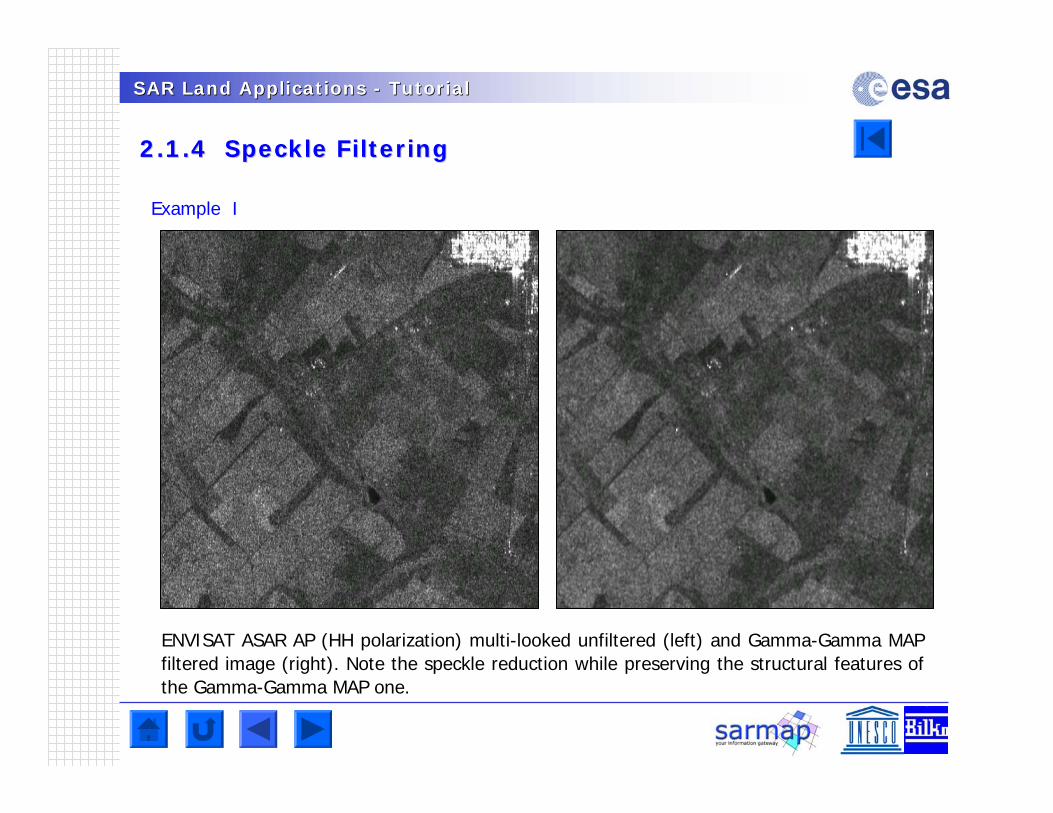
ENVISAT ASAR AP (HH polarization) multi-looked unfiltered (left) and Gamma-Gamma MAP filtered image (right). Note the speckle reduction while preserving the structural features of the Gamma-Gamma MAP one.
Example I
SAR Land Applications SAR Land Applications -- TutorialTutorial
2.1.4 Speckle Filtering 2.1.4 Speckle Filtering
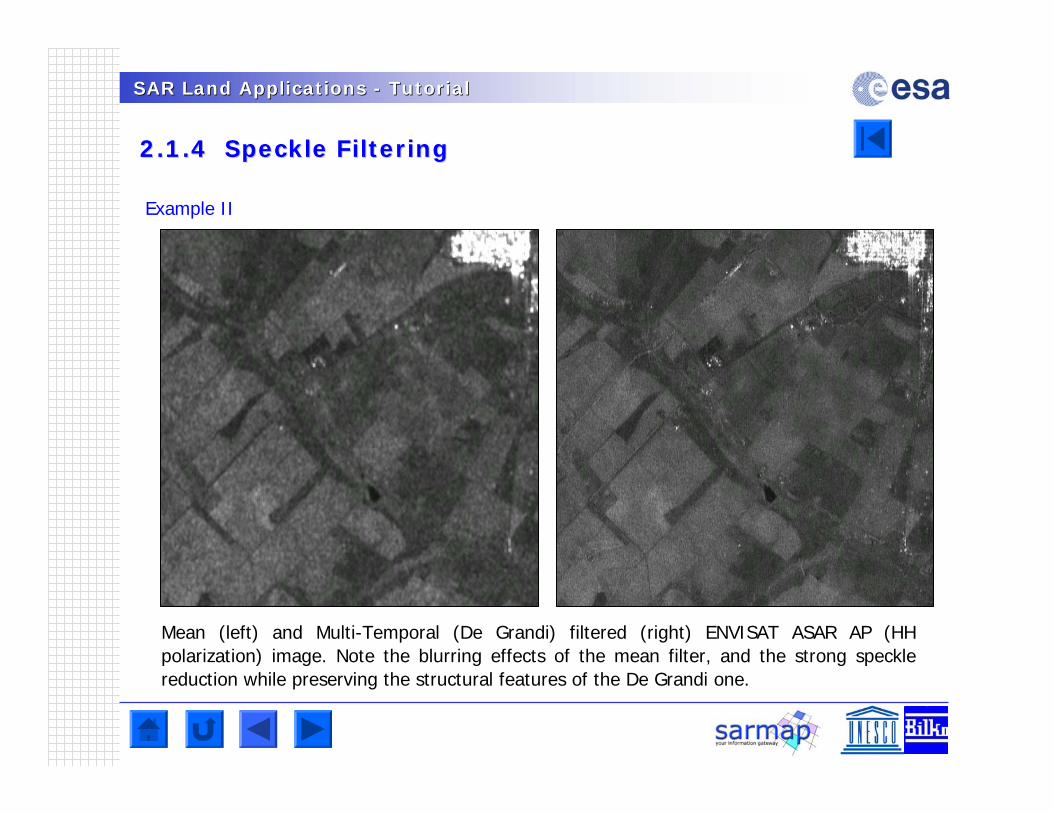
Mean (left) and Multi-Temporal (De Grandi) filtered (right) ENVISAT ASAR AP (HH polarization) image. Note the blurring effects of the mean filter, and the strong speckle reduction while preserving the structural features of the De Grandi one.
Example II
SAR Land Applications SAR Land Applications -- TutorialTutorial
2.1.4 Speckle Filtering 2.1.4 Speckle Filtering
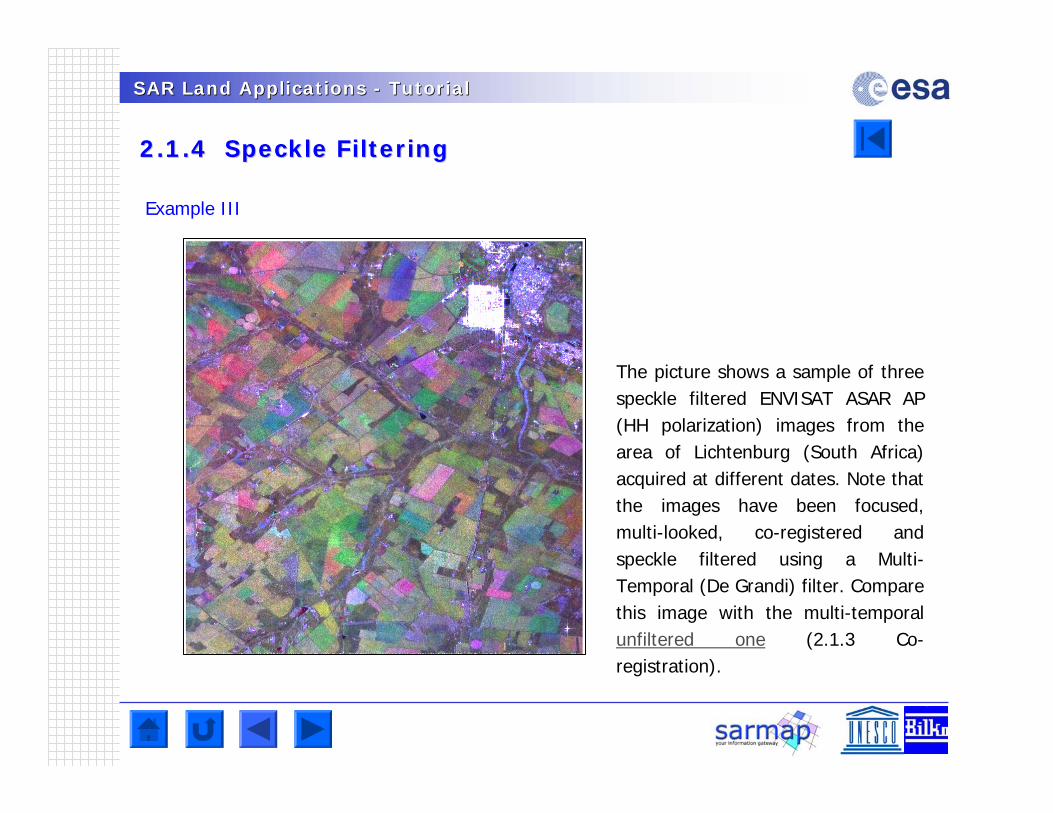
The picture shows a sample of three speckle filtered ENVISAT ASAR AP (HH polarization) images from the area of Lichtenburg (South Africa) acquired at different dates. Note that the images have been focused, multi-looked, co-registered and speckle filtered using a Multi-Temporal (De Grandi) filter. Compare this image with the multi-temporal unfiltered one (2.1.3 Co-registration).
Example III
SAR Land Applications SAR Land Applications -- TutorialTutorial
2.1.4 Speckle Filtering 2.1.4 Speckle Filtering
Question
Q1
What are the basic differences between mean or median filter and a conventional (for instance
Lee or Frost) speckle filter?
SAR Land Applications SAR Land Applications -- TutorialTutorial
2.1.5 Segmentation 2.1.5 Segmentation
2.1.5.1 Purpose
Segmentation assumes that images are made up of regions, separated by edges, in which the radar reflectivity is constant. The number and position of these segments and their mean values are unknown and must be determined from the data. Instead of attempting to reconstruct an estimate of the radar reflectivity for each pixel, segmentation seeks to overcome speckle by identifying regions of constant radar reflectivity.
In the following sections two methods are shortly presented.
SAR Land Applications SAR Land Applications -- TutorialTutorial
2.1.5 Segmentation 2.1.5 Segmentation
2.1.5.2 Annealed Segmentation
Simulated annealing algorithms proceed by randomly changing from one state in the configuration space to another. Optimisation is performed by deciding, via a probabilistic acceptance criterion, whether to accept the new configuration or keep the current one. The acceptance criterion is dependent on the value of a parameter T, know as the temperature, which itself is updated after a fixed number of configuration changes have been considered. The criterion is such that a configuration change entailing an increase in cost is more likely to be accepted at a higher temperature than a lower one. By slowly decreasing the value of T, it will avoid to be trapped in local minima and it will be reached the optimum global solution.
There are a variety of parameters that have to be determined, such as the starting temperature, number of inner loop iterations, cooling schedule, and number of outer loop iterations. In addition, there are questions over the initial regions. In principle, simulated annealing will migrate regions to those areas of the image that have a larger density of objects. However, this may involve an excessive number of iterations. Thus, it is advisable to ensure that the original tesselation assigns segments suitably, with greater density in regions of high contrast.
SAR Land Applications SAR Land Applications -- TutorialTutorial
2.1.5 Segmentation 2.1.5 Segmentation
2.1.5.3 Multi-Temporal Segmentation
In general, this processing involves the use of simulated annealing to derive the global optimum solution for the segmentation of SAR images comprising regions of uniform radar reflectivity. Two different hypotheses about the sequence of SAR images lead to different maximum likelihood tests for both segmentation and merge stages:
• Assume that there is an unknown temporal radar reflectivity fluctuation of individual regionsin the sequence of images
• Assume that there is no temporal radar reflectivity fluctuation
Exploiting the first hypothesis allows a likelihood function for a single region in a multi-temporal sequence of SAR data to be derived, assuming an absence of prior knowledge about the change pattern. This provides the objective function for an optimum multi-dimensional segmentation that decomposes the sequence of SAR images into a common set of segments of uniform radar reflectivity.
Exploiting the second hypothesis in a similar way leads to an optimum one-dimensional segmentation scheme in which the statistical variations - due to speckle and the radar reflectivity fluctuations - are combined, and the corresponding split-merge test derived.
SAR Land Applications SAR Land Applications -- TutorialTutorial
2.1.5 Segmentation 2.1.5 Segmentation
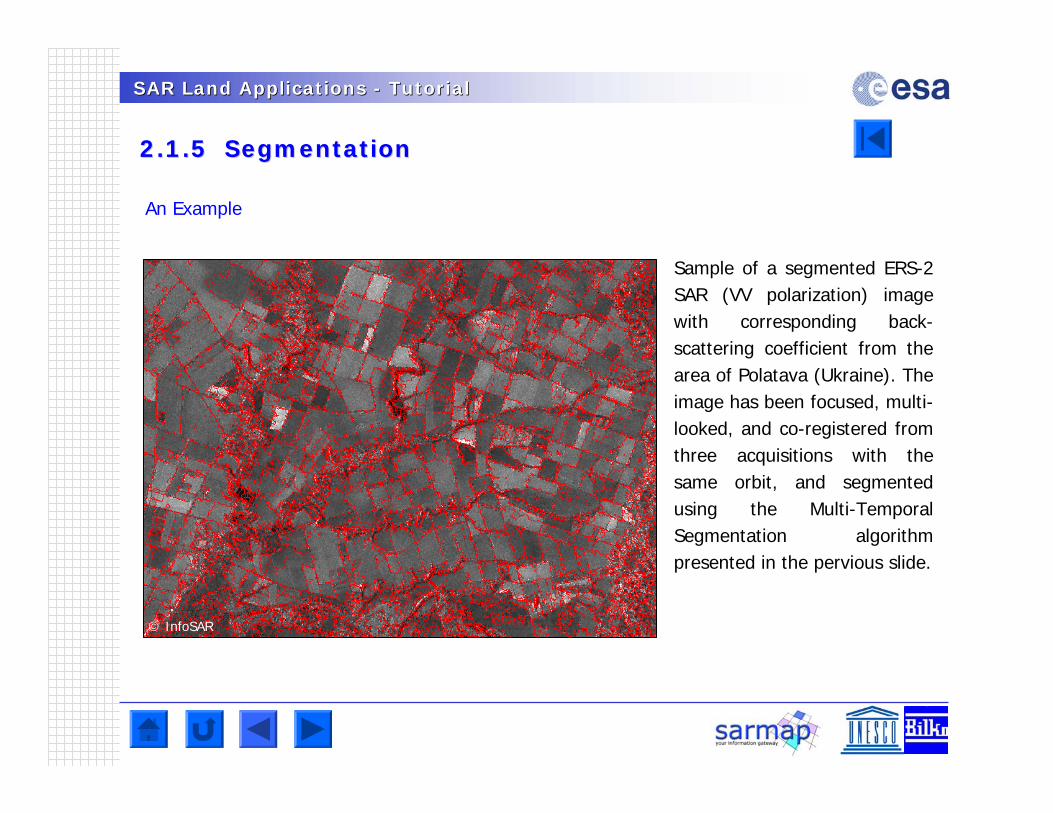
An Example
Sample of a segmented ERS-2 SAR (VV polarization) image with corresponding back-scattering coefficient from the area of Polatava (Ukraine). The image has been focused, multi-looked, and co-registered from three acquisitions with the same orbit, and segmented using the Multi-Temporal Segmentation algorithm presented in the pervious slide.
© InfoSAR
SAR Land Applications SAR Land Applications -- TutorialTutorial
2.1.6 Segmentation or speckle filtering?2.1.6 Segmentation or speckle filtering?
Filter
Minimum MeanSquare Error
- Gamma MAP- Annealing- Multi-Temporal
Merge Using Moments
- AnnealedSegmentation
- Multi-Temporal
structure
reconstruction
speed quality speed quality
Speckle Filtering or Segmentation?
Speed orQuality?
Segmentation
Speed orQuality?
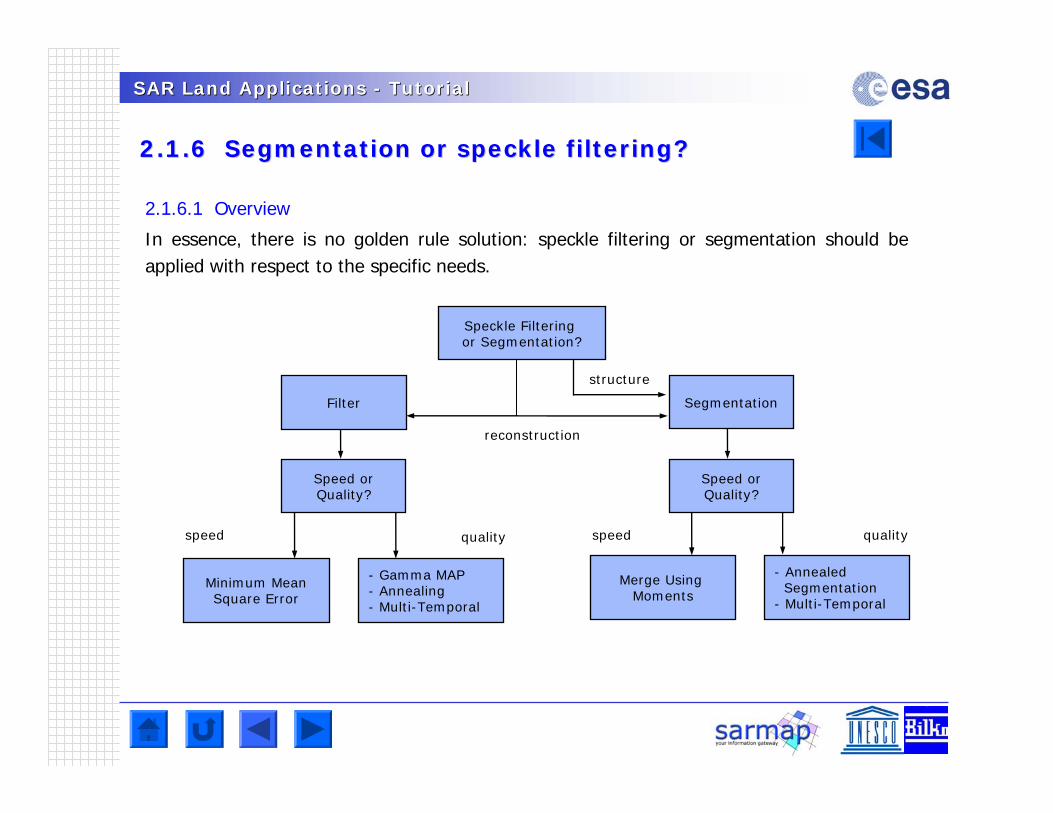
2.1.6.1 Overview
In essence, there is no golden rule solution: speckle filtering or segmentation should be applied with respect to the specific needs.
SAR Land Applications SAR Land Applications -- TutorialTutorial
2.1.7 2.1.7 GeocodingGeocoding
2.1.7.1 Purpose
Geocoding, Georeferencing, Geometric Calibration, and Ortho-rectification are synonyms. All of these definitions mean the conversion of SAR images - either slant range (preferably) or ground range geometry - into a map coordinate system (e.g. cartographic reference system). A distinction is usually made between
• Ellipsoidal Geocoding, when this process is performed without the use of Digital Elevation Model (DEM) data
• Terrain Geocoding, when this process is performed with the use of DEM data
Note that the only appropriate way to geocode SAR data is by applying a range-Doppler approach (refer to SAR geometry section for the justification). In fact, SAR systems cause non-linear compressions (in particular in the presence of topography), and thus they can not be corrected using polynomials as in the case of optical images, where (in the case of flat Earth) an affine transformation is sufficient to convert it into a cartographic reference system.
SAR Land Applications SAR Land Applications -- TutorialTutorial
2.1.7 2.1.7 GeocodingGeocoding
2.1.7.2 Range-Doppler Approach
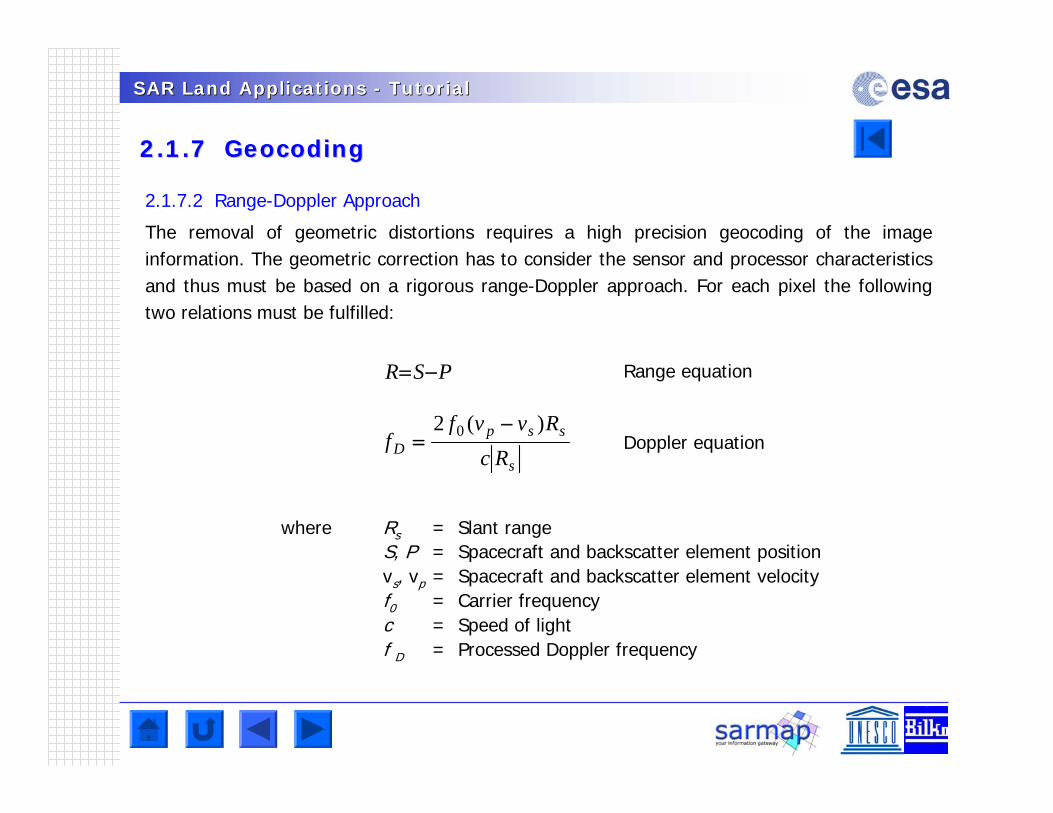
The removal of geometric distortions requires a high precision geocoding of the image information. The geometric correction has to consider the sensor and processor characteristics and thus must be based on a rigorous range-Doppler approach. For each pixel the following two relations must be fulfilled:
where Rs = Slant rangeS, P = Spacecraft and backscatter element positionvs, vp = Spacecraft and backscatter element velocityf0 = Carrier frequencyc = Speed of lightf D = Processed Doppler frequency
Range equation
Doppler equation
PSR
s
sspD Rc
Rvvff
)(2 0
SAR Land Applications SAR Land Applications -- TutorialTutorial
2.1.7 2.1.7 GeocodingGeocoding
2.1.7.2 Range-Doppler Approach (cont.)
Using these equations, the relationship between the sensor, each single backscatter element and their related velocities is calculated and therefore not only the illuminating geometry but also the processors characteristics are considered. This complete reconstruction of the imaging and processing geometry also takes into account the topographic effects (foreshortening, layover) as well as the influence of Earth rotation and terrain height on the Doppler frequency shift and azimuth geometry.
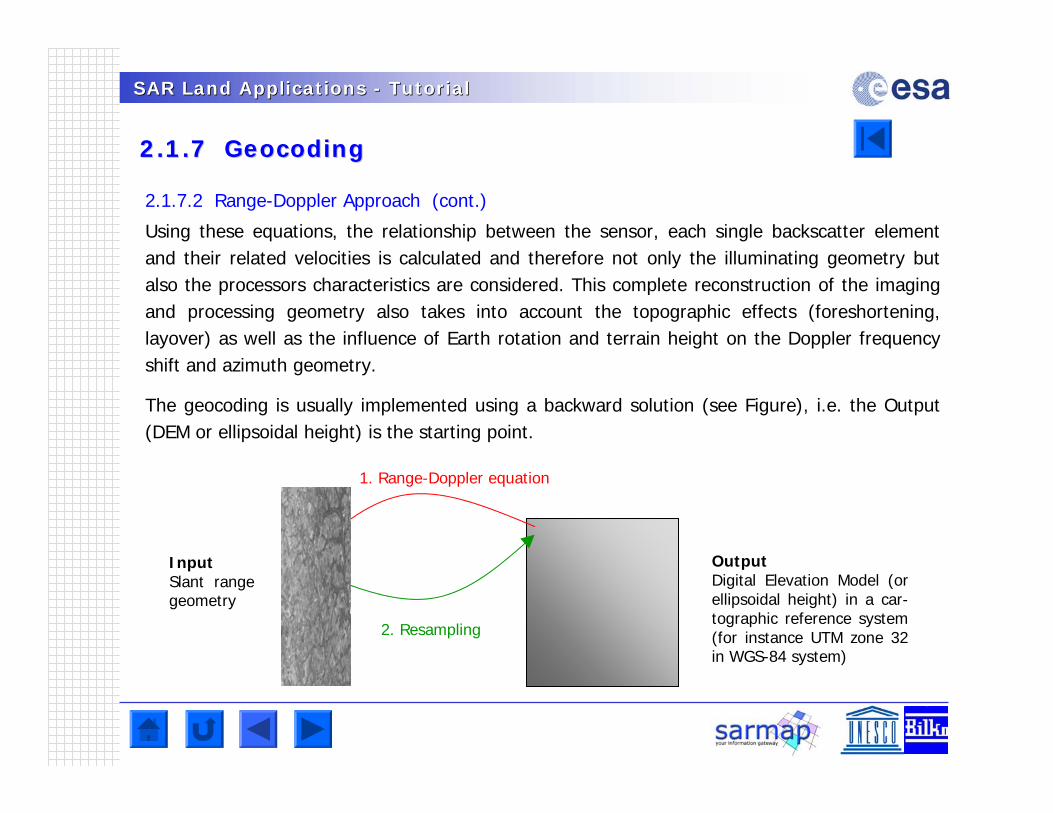
The geocoding is usually implemented using a backward solution (see Figure), i.e. the Output (DEM or ellipsoidal height) is the starting point.
OutputDigital Elevation Model (or ellipsoidal height) in a car-tographic reference system (for instance UTM zone 32 in WGS-84 system)
InputSlant range geometry
1. Range-Doppler equation
2. Resampling
SAR Land Applications SAR Land Applications -- TutorialTutorial
2.1.7 2.1.7 GeocodingGeocoding
2.1.7.3 Nominal versus Precise Geocoding
In the geocoding procedure following nomenclature is used:
• Nominal Geocoding, if- No Ground Control Point (GCP)- Orbital parameters (positions and velocities)- Processed parameters (Doppler, range delay, pixel spacing, etc.)- Digital Elevation Model or Ellipsoidal height
are used during the geocoding process.
• Precise Geocoding, if- Ground Control Points (1 GCP is sufficient)- Orbital parameters (positions and velocities)- Processed parameters (Doppler, range delay, pixel spacing, etc.)- Digital Elevation Model
are used during the geocoding process.
Note that geocoded images achieve a pixel accuracy even without the use of GCPs, if proper processing is performed and orbital parameters (so-called precise orbits) are available.
SAR Land Applications SAR Land Applications -- TutorialTutorial
2.1.7 2.1.7 GeocodingGeocoding
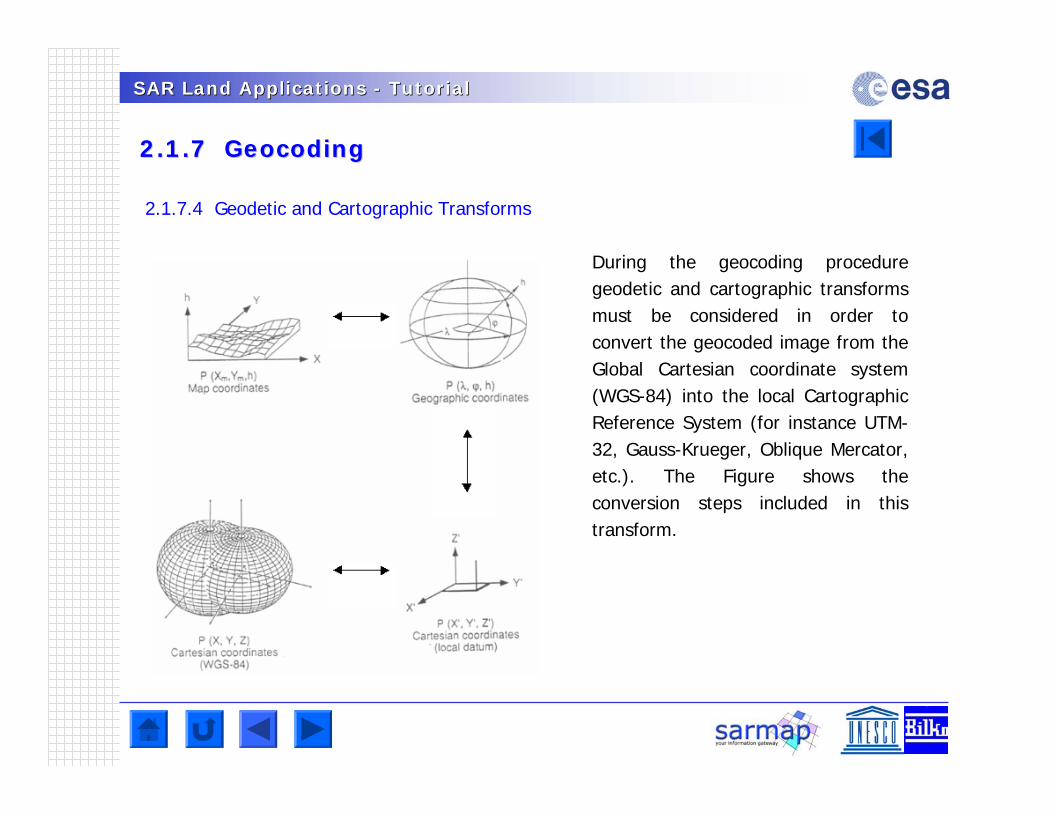
2.1.7.4 Geodetic and Cartographic Transforms
During the geocoding procedure geodetic and cartographic transforms must be considered in order to convert the geocoded image from the Global Cartesian coordinate system (WGS-84) into the local Cartographic Reference System (for instance UTM-32, Gauss-Krueger, Oblique Mercator, etc.). The Figure shows the conversion steps included in this transform.
SAR Land Applications SAR Land Applications -- TutorialTutorial
2.1.7 2.1.7 GeocodingGeocoding
2.1.7.5 Some Basic Geodetic and Cartographic Nomenclature
Projection represents the 3-dimensional Earth’s surface in a 2-dimensional plane.
Ellipsoid is the mathematical description of the Earth’s shape.
Ellipsoidal Height is the vertical distance above the reference ellipsoid and is measured along the ellipsoidal normal from the point to the ellipsoid.
Geoid is the Earth’s level surface. The geoid would have the shape of an oblate ellipsoid centred on the Earth’s centre of mass, if the Earth was of uniform density and the Earth’s topography did not exist.
Orthometric Height is the vertical distance above the geoid and is measured along the plumb line from the point to the geoid.
Topography is the Earth’s physical surface.
Datum Shift Parameters convert the ellipsoid’s origin into the Earth’s centre.
SAR Land Applications SAR Land Applications -- TutorialTutorial
2.1.7 2.1.7 GeocodingGeocoding
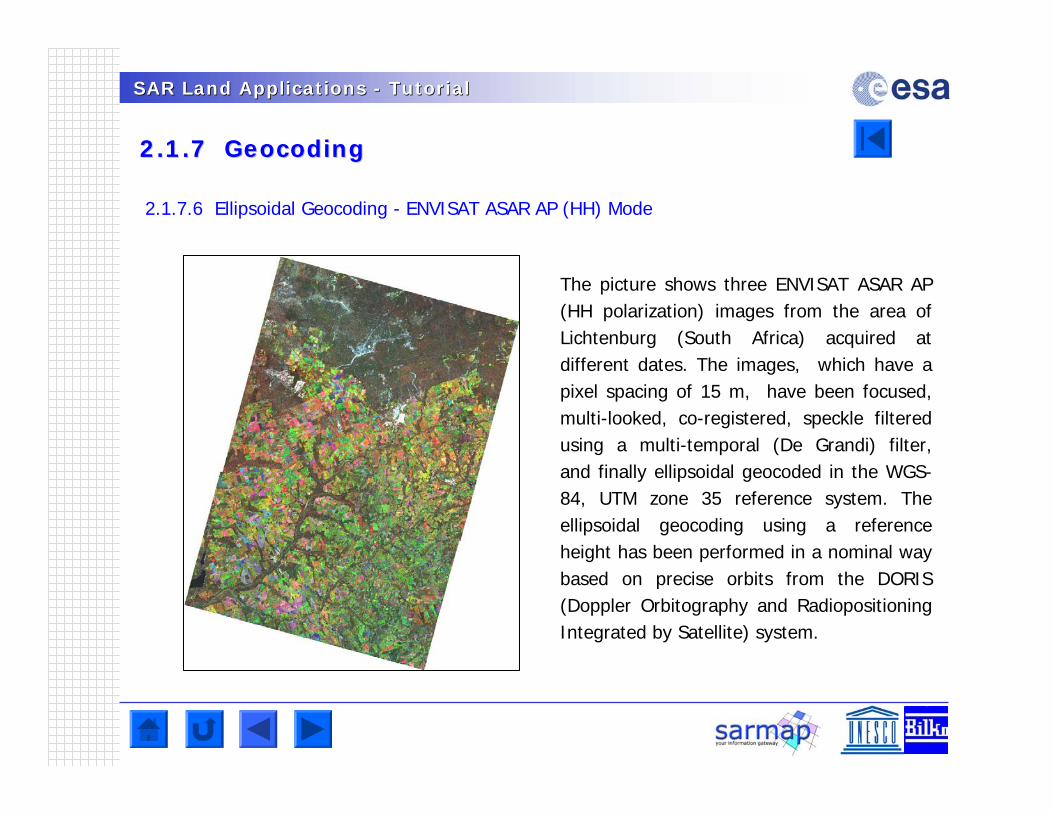
2.1.7.6 Ellipsoidal Geocoding - ENVISAT ASAR AP (HH) Mode
The picture shows three ENVISAT ASAR AP (HH polarization) images from the area of Lichtenburg (South Africa) acquired at different dates. The images, which have a pixel spacing of 15 m, have been focused, multi-looked, co-registered, speckle filtered using a multi-temporal (De Grandi) filter, and finally ellipsoidal geocoded in the WGS-84, UTM zone 35 reference system. The ellipsoidal geocoding using a reference height has been performed in a nominal way based on precise orbits from the DORIS (Doppler Orbitography and RadiopositioningIntegrated by Satellite) system.
SAR Land Applications SAR Land Applications -- TutorialTutorial
2.1.7 2.1.7 GeocodingGeocoding
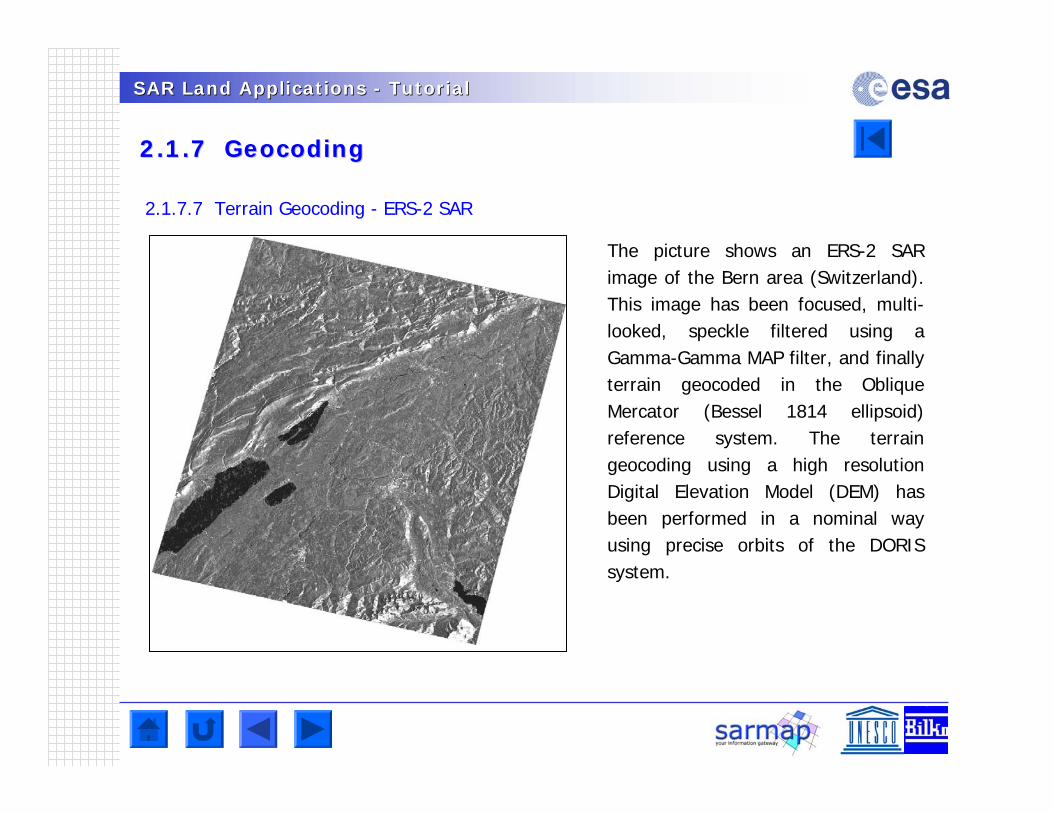
2.1.7.7 Terrain Geocoding - ERS-2 SAR
The picture shows an ERS-2 SAR image of the Bern area (Switzerland). This image has been focused, multi-looked, speckle filtered using a Gamma-Gamma MAP filter, and finally terrain geocoded in the Oblique Mercator (Bessel 1814 ellipsoid) reference system. The terrain geocoding using a high resolution Digital Elevation Model (DEM) has been performed in a nominal way using precise orbits of the DORIS system.
SAR Land Applications SAR Land Applications -- TutorialTutorial
2.1.7 2.1.7 GeocodingGeocoding
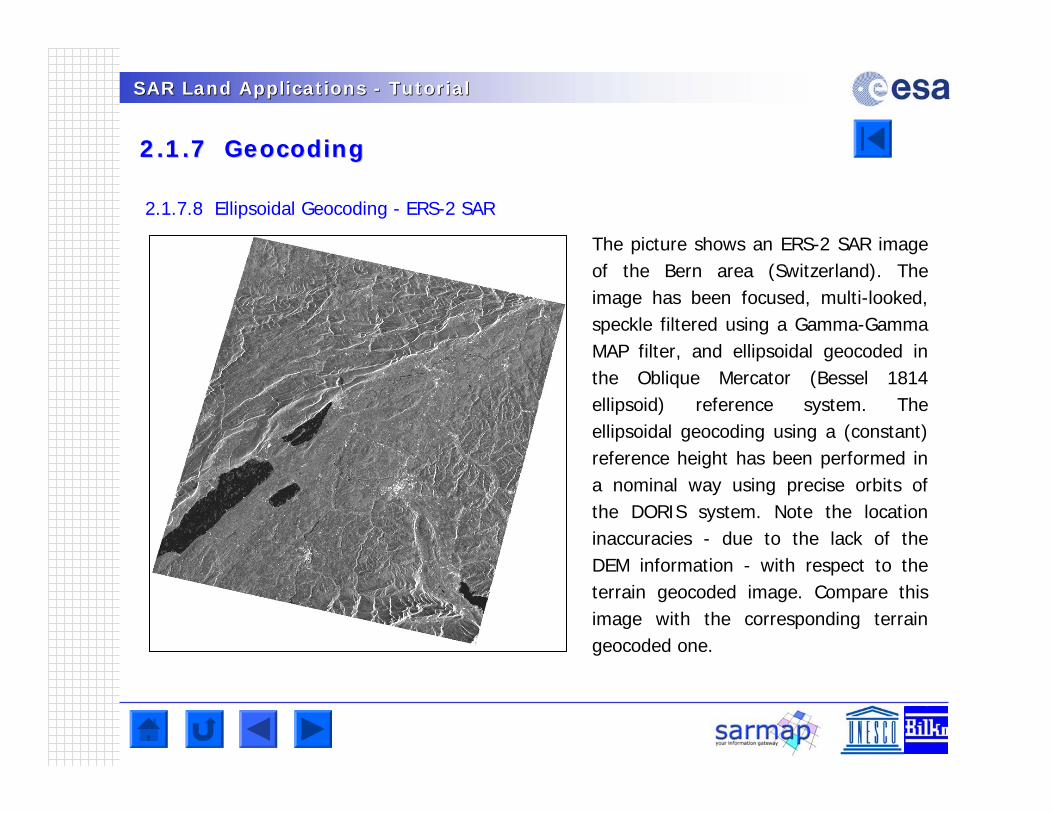
2.1.7.8 Ellipsoidal Geocoding - ERS-2 SAR
The picture shows an ERS-2 SAR image of the Bern area (Switzerland). The image has been focused, multi-looked, speckle filtered using a Gamma-Gamma MAP filter, and ellipsoidal geocoded in the Oblique Mercator (Bessel 1814 ellipsoid) reference system. The ellipsoidal geocoding using a (constant) reference height has been performed in a nominal way using precise orbits of the DORIS system. Note the location inaccuracies - due to the lack of the DEM information - with respect to the terrain geocoded image. Compare this image with the corresponding terrain geocoded one.
SAR Land Applications SAR Land Applications -- TutorialTutorial
2.1.7 2.1.7 GeocodingGeocoding
Exercise
Three ENVISAT ASAR AP images have been multi-looked (4 looks in azimuth and 1 look in range), co-registered, and subsequently speckle filtered. In the next step the slant range data must be transformed into a cartographic reference system.
1. Assuming that you don’t have a SAR geocoding algorithm, how would you proceed?
2. Assuming that you have a SAR geocoding algorithm, describe which data and parameters you need in order to perform this task.
SAR Land Applications SAR Land Applications -- TutorialTutorial
2.1.8 Radiometric Calibration 2.1.8 Radiometric Calibration
2.1.8.1 Purpose
Radars measure the ratio between the power of the pulse transmitted and that of the echo received. This ratio is called the backscatter. Calibration of the backscatter values is necessary for intercomparison of radar images acquired with different sensors, or even of images obtained by the same sensor if acquired in different modes or processed with different processors.
In order to avoid misunderstanding, note the following nomenclature:
• Beta Nought (ß°) is the radar brightness (or reflectivity) coefficient. The reflectivity per unit area in slant range is dimensionless. This normalization has the virtue that it does not require knowledge of the local incidence angle (e.g. scattering area A).
• Sigma Nought (o), the backscattering coefficient, is the conventional measure of the strength of radar signals reflected by a distributed scatterer, usually expressed in dB. It is a normalized dimensionless number, which compares the strength observed to that expected from an area of one square metre. Sigma nought is defined with respect to the nominally horizontal plane, and in general has a significant variation with incidence angle, wavelength, and polarization, as well as with properties of the scattering surface itself.
• Gamma () is the backscattering coefficient normalized by the cosine of the incidence angle.
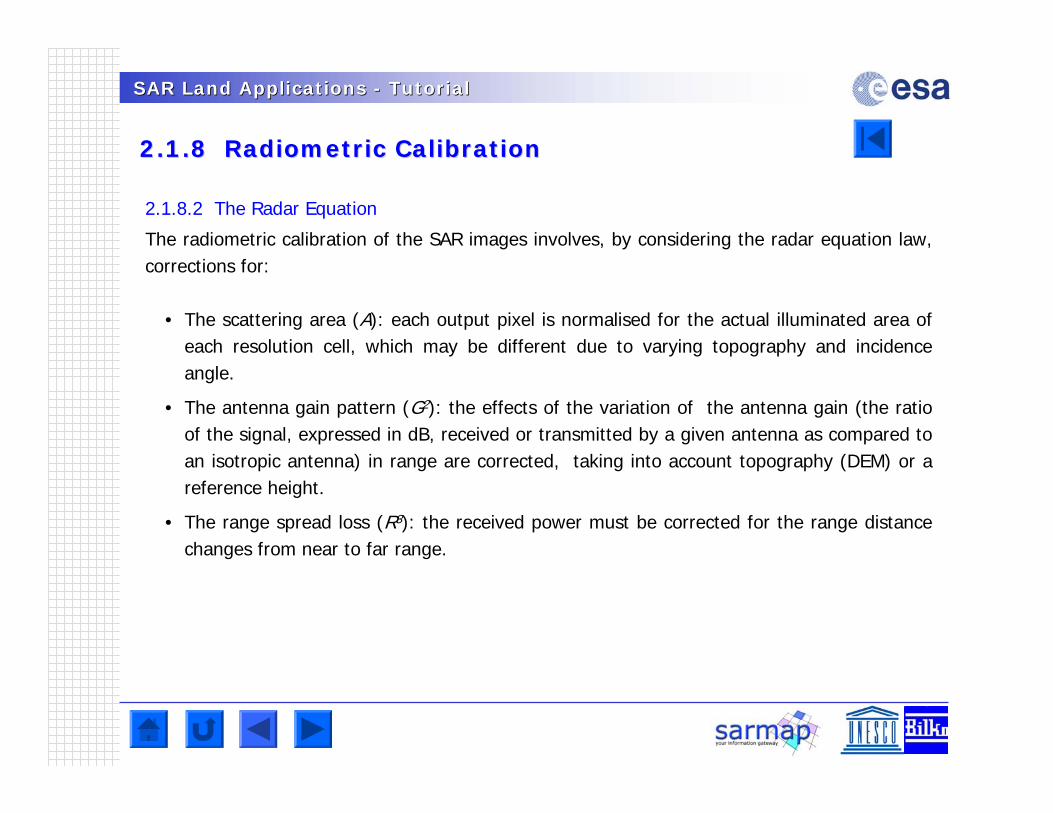
SAR Land Applications SAR Land Applications -- TutorialTutorial
2.1.8 Radiometric Calibration 2.1.8 Radiometric Calibration
2.1.8.2 The Radar Equation
The radiometric calibration of the SAR images involves, by considering the radar equation law, corrections for:
• The scattering area (A): each output pixel is normalised for the actual illuminated area of each resolution cell, which may be different due to varying topography and incidence angle.
• The antenna gain pattern (G2): the effects of the variation of the antenna gain (the ratio of the signal, expressed in dB, received or transmitted by a given antenna as compared to an isotropic antenna) in range are corrected, taking into account topography (DEM) or a reference height.
• The range spread loss (R3): the received power must be corrected for the range distance changes from near to far range.
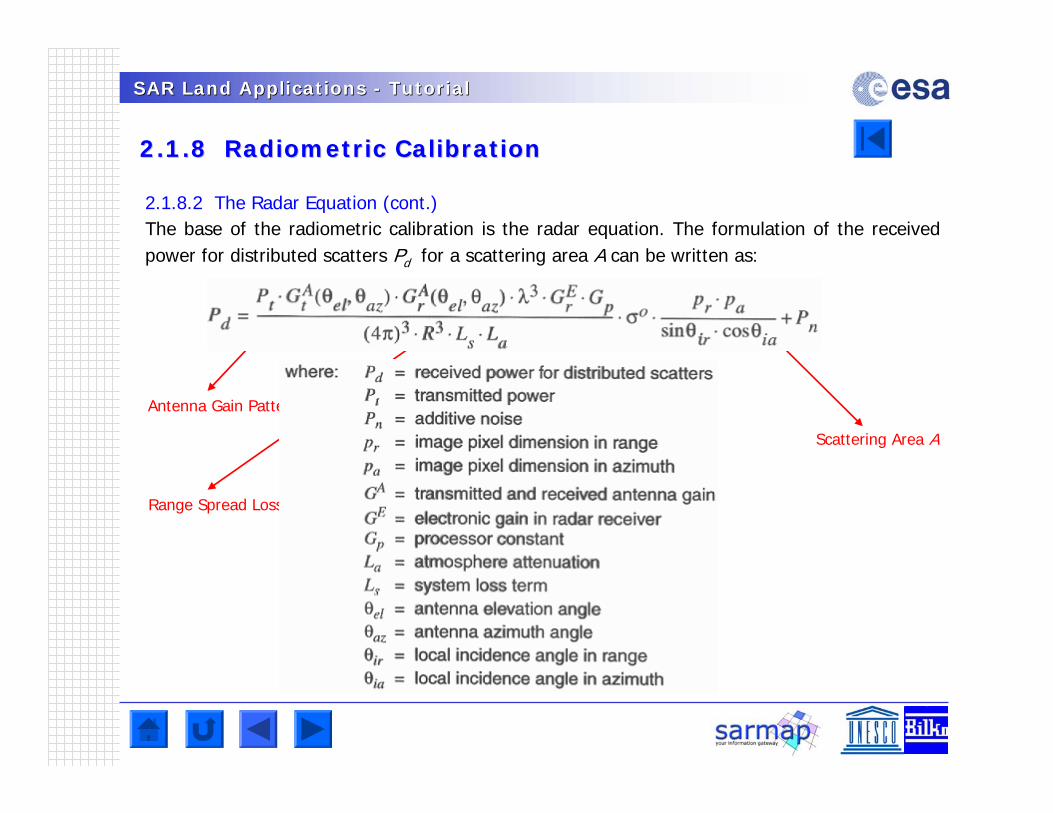
SAR Land Applications SAR Land Applications -- TutorialTutorial
2.1.8 Radiometric Calibration 2.1.8 Radiometric Calibration
2.1.8.2 The Radar Equation (cont.)The base of the radiometric calibration is the radar equation. The formulation of the received power for distributed scatters Pd for a scattering area A can be written as:
Scattering Area A
Antenna Gain Pattern
Range Spread Loss
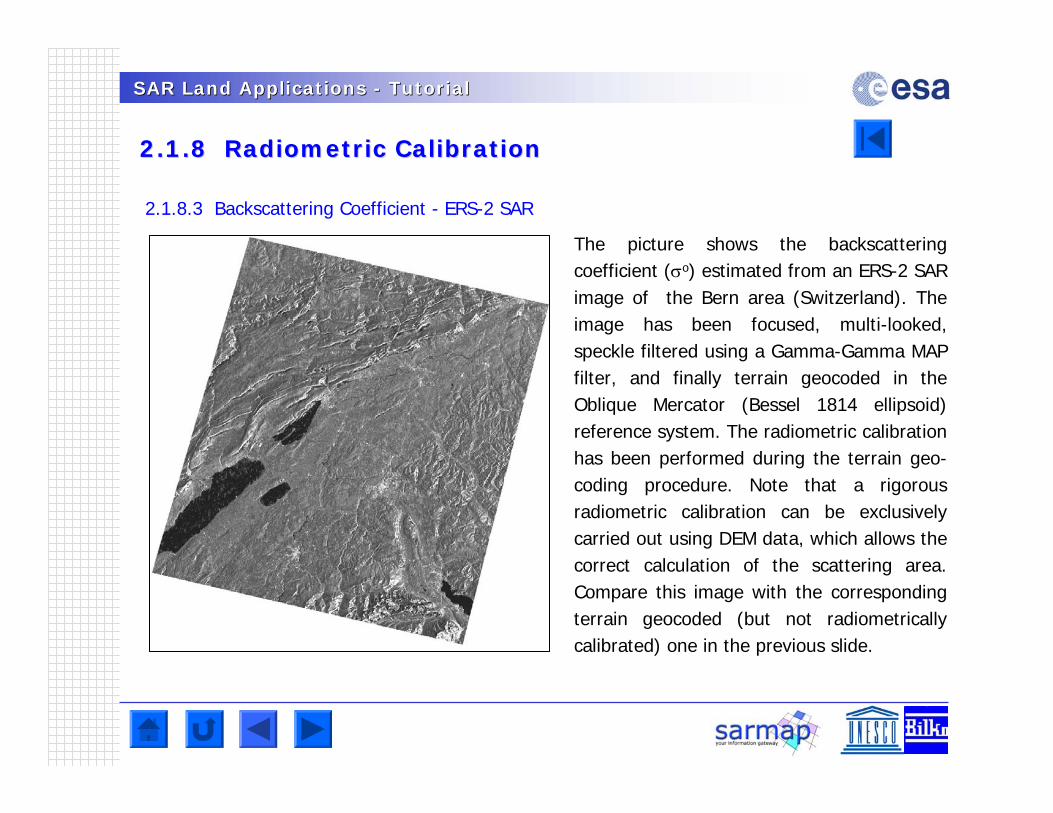
SAR Land Applications SAR Land Applications -- TutorialTutorial
2.1.8 Radiometric Calibration 2.1.8 Radiometric Calibration
2.1.8.3 Backscattering Coefficient - ERS-2 SAR
The picture shows the backscattering coefficient (o) estimated from an ERS-2 SAR image of the Bern area (Switzerland). The image has been focused, multi-looked, speckle filtered using a Gamma-Gamma MAP filter, and finally terrain geocoded in the Oblique Mercator (Bessel 1814 ellipsoid) reference system. The radiometric calibration has been performed during the terrain geo-coding procedure. Note that a rigorous radiometric calibration can be exclusively carried out using DEM data, which allows the correct calculation of the scattering area. Compare this image with the corresponding terrain geocoded (but not radiometricallycalibrated) one in the previous slide.
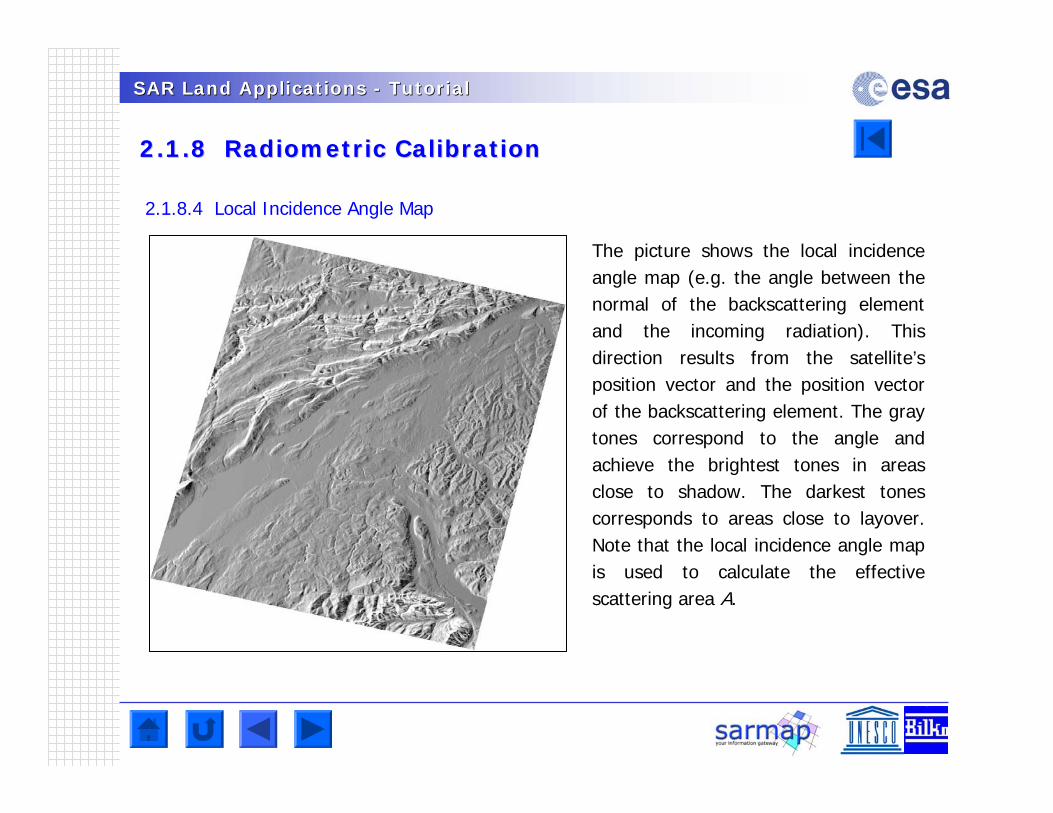
SAR Land Applications SAR Land Applications -- TutorialTutorial
2.1.8 Radiometric Calibration 2.1.8 Radiometric Calibration
2.1.8.4 Local Incidence Angle Map
The picture shows the local incidence angle map (e.g. the angle between the normal of the backscattering element and the incoming radiation). This direction results from the satellite’s position vector and the position vector of the backscattering element. The gray tones correspond to the angle and achieve the brightest tones in areas close to shadow. The darkest tones corresponds to areas close to layover. Note that the local incidence angle map is used to calculate the effective scattering area A.
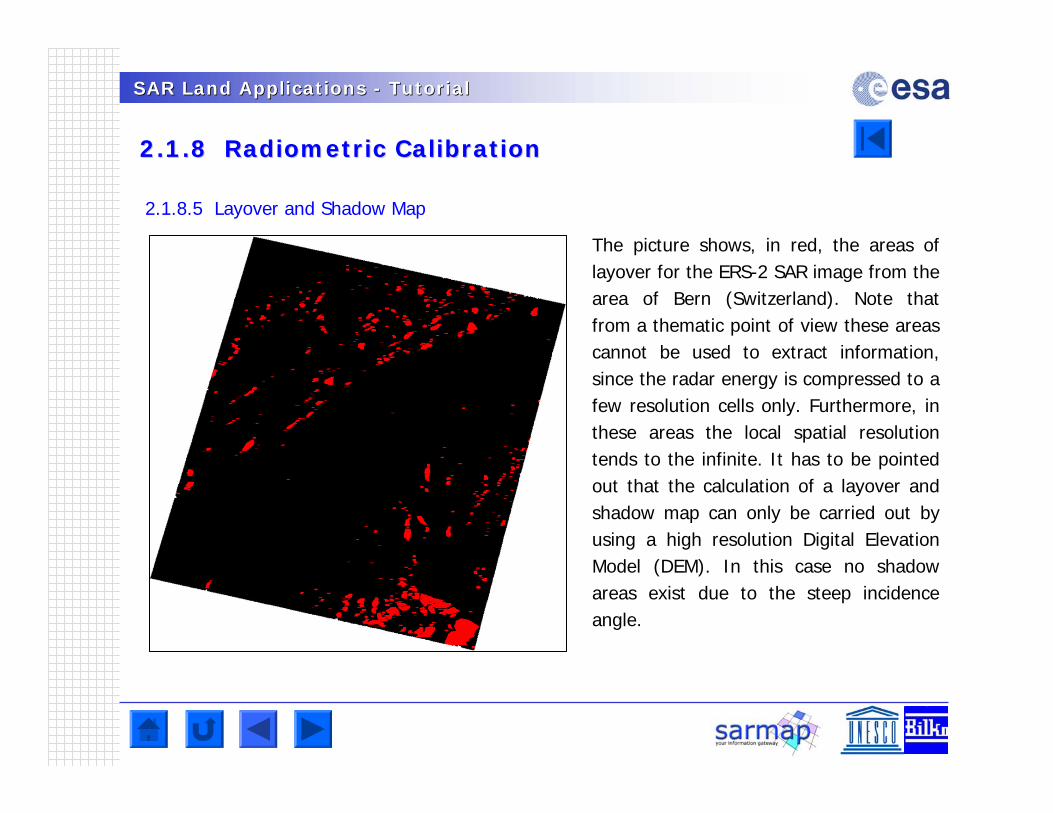
SAR Land Applications SAR Land Applications -- TutorialTutorial
2.1.8 Radiometric Calibration 2.1.8 Radiometric Calibration
2.1.8.5 Layover and Shadow Map
The picture shows, in red, the areas of layover for the ERS-2 SAR image from the area of Bern (Switzerland). Note that from a thematic point of view these areas cannot be used to extract information, since the radar energy is compressed to a few resolution cells only. Furthermore, in these areas the local spatial resolution tends to the infinite. It has to be pointed out that the calculation of a layover and shadow map can only be carried out by using a high resolution Digital Elevation Model (DEM). In this case no shadow areas exist due to the steep incidence angle.
SAR Land Applications SAR Land Applications -- TutorialTutorial
2.1.8 Radiometric Calibration 2.1.8 Radiometric Calibration
Questions
Q1 What do you need, in terms of data, in order to perform a correct radiometric calibration?
Q2Assuming that an ellipsoidal geocoded, but not radiometrically calibrated image is available. What can you do in order to calibrate the SAR data?
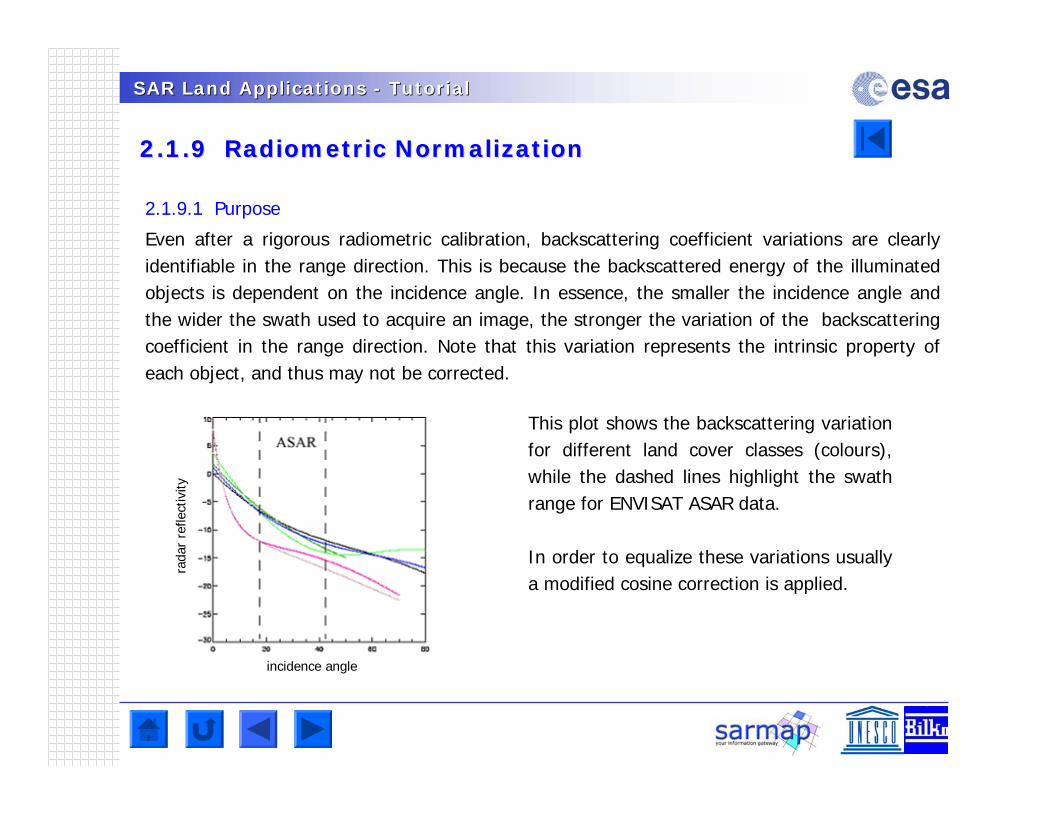
SAR Land Applications SAR Land Applications -- TutorialTutorial
2.1.9 Radiometric Normalization 2.1.9 Radiometric Normalization
2.1.9.1 Purpose
Even after a rigorous radiometric calibration, backscattering coefficient variations are clearly identifiable in the range direction. This is because the backscattered energy of the illuminated objects is dependent on the incidence angle. In essence, the smaller the incidence angle and the wider the swath used to acquire an image, the stronger the variation of the backscattering coefficient in the range direction. Note that this variation represents the intrinsic property of each object, and thus may not be corrected.
This plot shows the backscattering variation for different land cover classes (colours), while the dashed lines highlight the swath range for ENVISAT ASAR data.
In order to equalize these variations usually a modified cosine correction is applied.
incidence angle
rada
r re
flect
ivity
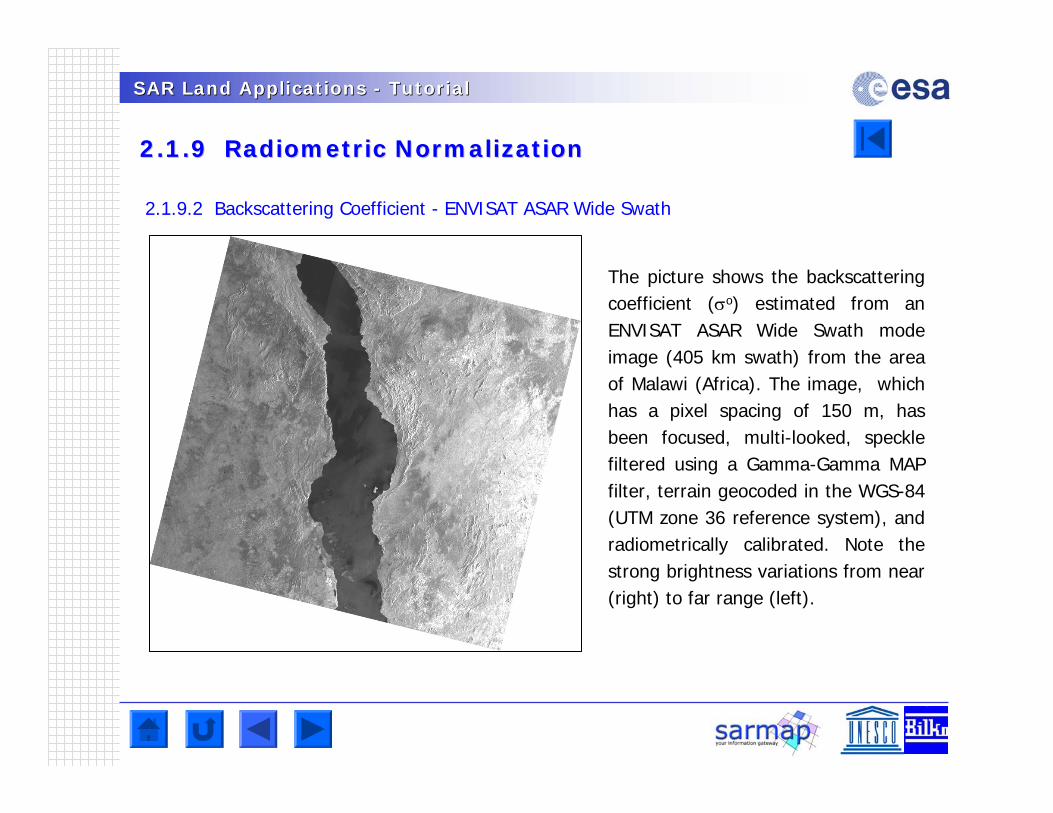
SAR Land Applications SAR Land Applications -- TutorialTutorial
2.1.9 Radiometric Normalization 2.1.9 Radiometric Normalization
2.1.9.2 Backscattering Coefficient - ENVISAT ASAR Wide Swath
The picture shows the backscattering coefficient (o) estimated from an ENVISAT ASAR Wide Swath mode image (405 km swath) from the area of Malawi (Africa). The image, which has a pixel spacing of 150 m, has been focused, multi-looked, speckle filtered using a Gamma-Gamma MAP filter, terrain geocoded in the WGS-84 (UTM zone 36 reference system), and radiometrically calibrated. Note the strong brightness variations from near (right) to far range (left).
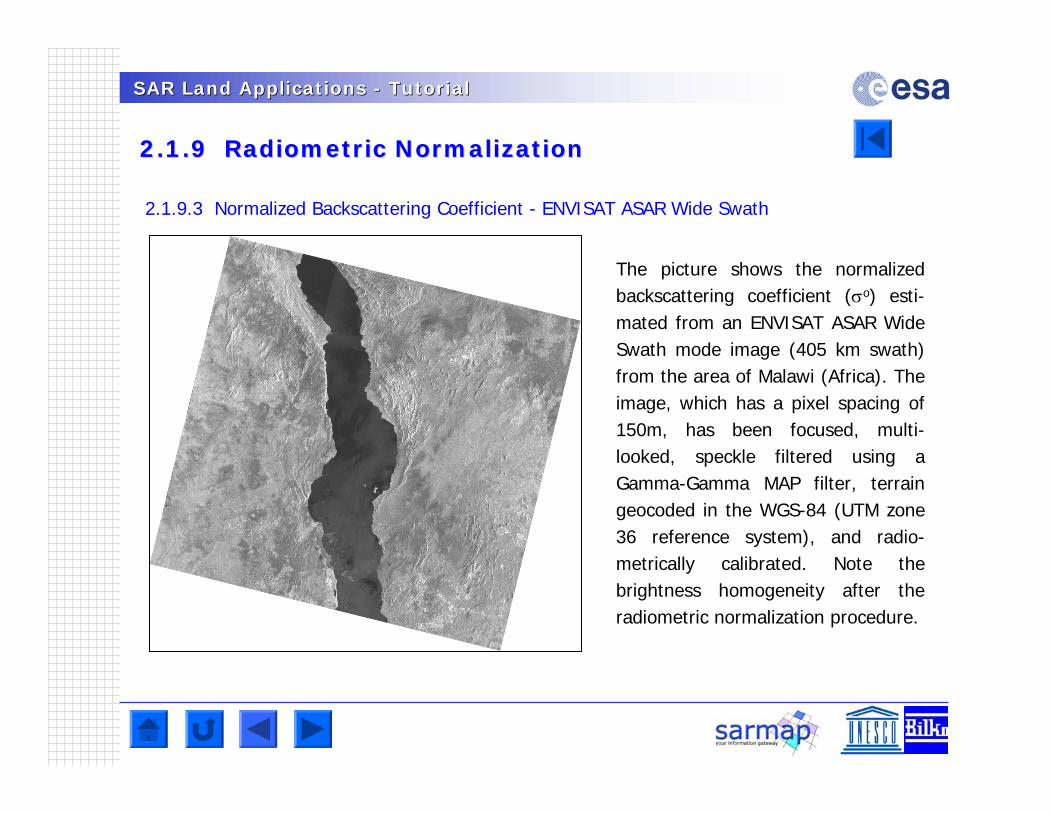
SAR Land Applications SAR Land Applications -- TutorialTutorial
2.1.9 Radiometric Normalization 2.1.9 Radiometric Normalization
2.1.9.3 Normalized Backscattering Coefficient - ENVISAT ASAR Wide Swath
The picture shows the normalized backscattering coefficient (o) esti-mated from an ENVISAT ASAR Wide Swath mode image (405 km swath) from the area of Malawi (Africa). The image, which has a pixel spacing of 150m, has been focused, multi-looked, speckle filtered using a Gamma-Gamma MAP filter, terrain geocoded in the WGS-84 (UTM zone 36 reference system), and radio-metrically calibrated. Note the brightness homogeneity after the radiometric normalization procedure.
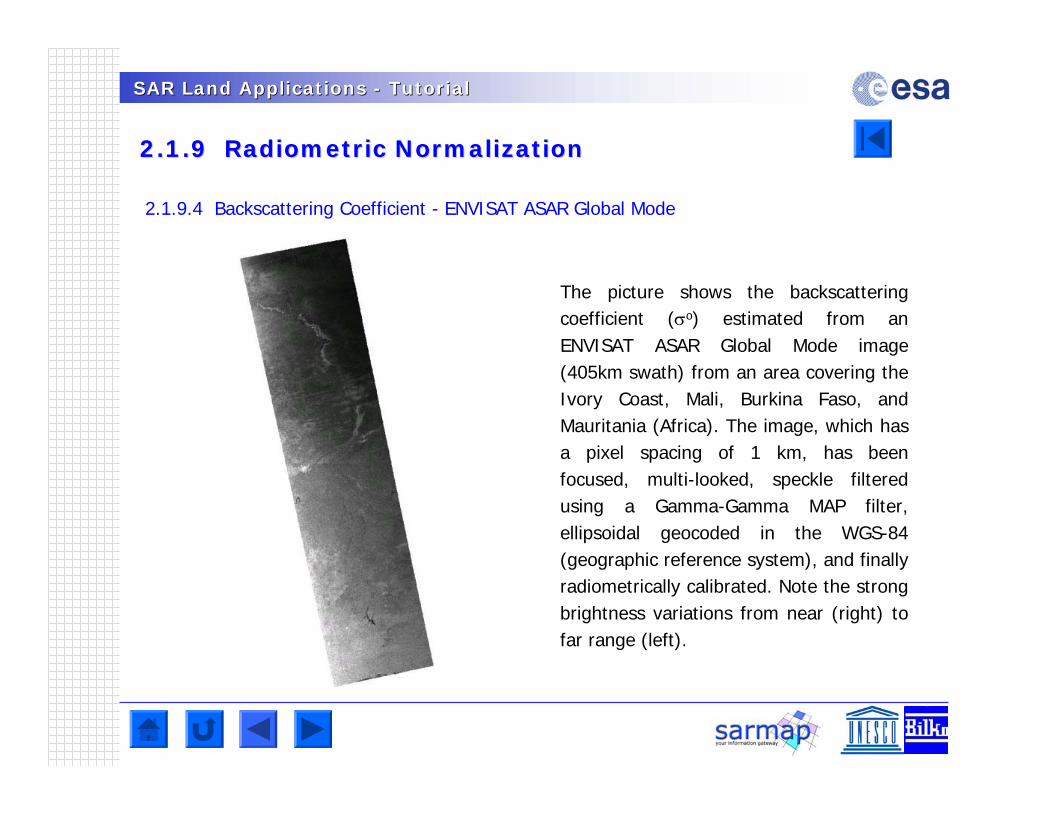
SAR Land Applications SAR Land Applications -- TutorialTutorial
2.1.9 Radiometric Normalization 2.1.9 Radiometric Normalization
2.1.9.4 Backscattering Coefficient - ENVISAT ASAR Global Mode
The picture shows the backscattering coefficient (o) estimated from an ENVISAT ASAR Global Mode image (405km swath) from an area covering the Ivory Coast, Mali, Burkina Faso, and Mauritania (Africa). The image, which has a pixel spacing of 1 km, has been focused, multi-looked, speckle filtered using a Gamma-Gamma MAP filter, ellipsoidal geocoded in the WGS-84 (geographic reference system), and finally radiometrically calibrated. Note the strong brightness variations from near (right) to far range (left).
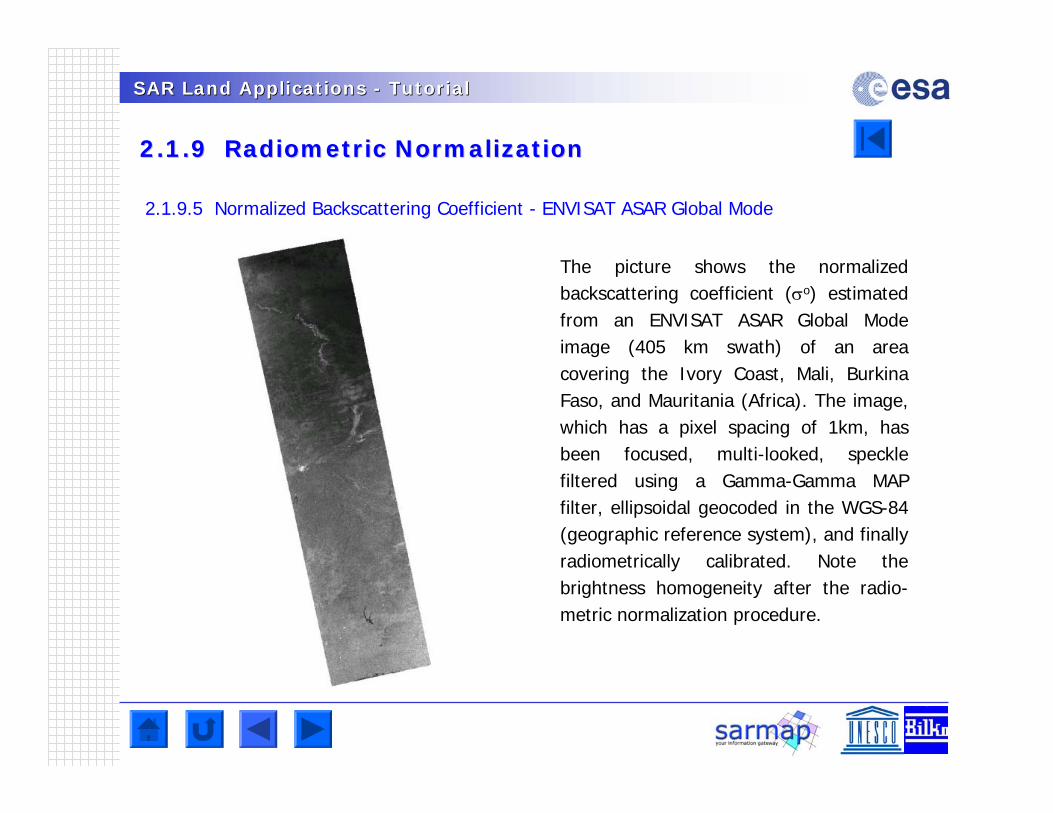
SAR Land Applications SAR Land Applications -- TutorialTutorial
2.1.9 Radiometric Normalization 2.1.9 Radiometric Normalization
2.1.9.5 Normalized Backscattering Coefficient - ENVISAT ASAR Global Mode
The picture shows the normalized backscattering coefficient (o) estimated from an ENVISAT ASAR Global Mode image (405 km swath) of an area covering the Ivory Coast, Mali, Burkina Faso, and Mauritania (Africa). The image, which has a pixel spacing of 1km, has been focused, multi-looked, speckle filtered using a Gamma-Gamma MAP filter, ellipsoidal geocoded in the WGS-84 (geographic reference system), and finally radiometrically calibrated. Note the brightness homogeneity after the radio-metric normalization procedure.
SAR Land Applications SAR Land Applications -- TutorialTutorial
2.1.10 2.1.10 MosaicingMosaicing
2.1.10.1 Purpose
Terrain geocoded, radiometrically calibrated, and radiometrically normalized backscattering coefficient (o) data acquired over different satellite paths/tracks are usually mosaiced, making it possible to cover large areas (country to continental level) - usually with data of high spatial resolution.
It is worth mentioning that the monostatic nature of the system and the penetration capabilities through the clouds means that it is not necessary to correct for sun inclination or atmospheric variations. This is the great advantage of SAR over optical sensors, primarily because large areas with the same illumination geometry can be imaged exactly in the same way regardless of weather conditions or seasonal variations in sun angle. This greatly facilitates the detection of land cover changes.
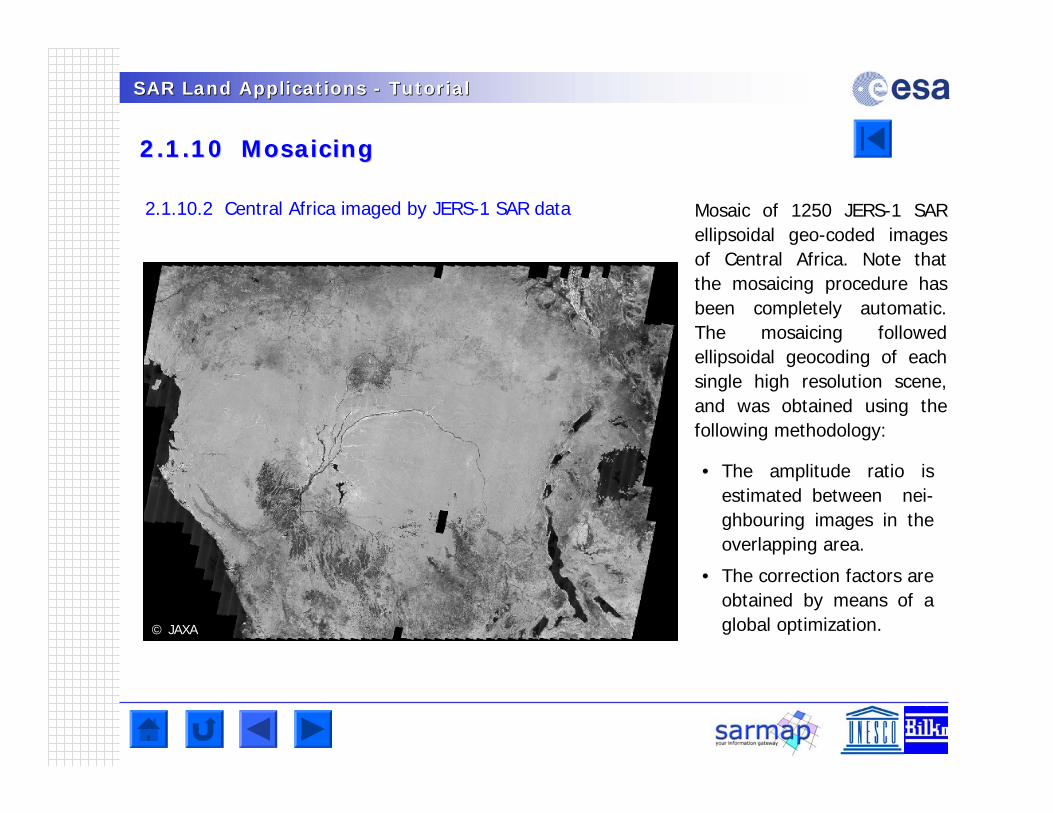
SAR Land Applications SAR Land Applications -- TutorialTutorial
2.1.10 2.1.10 MosaicingMosaicing
© JAXA
Mosaic of 1250 JERS-1 SAR ellipsoidal geo-coded images of Central Africa. Note that the mosaicing procedure has been completely automatic. The mosaicing followed ellipsoidal geocoding of each single high resolution scene, and was obtained using the following methodology:
2.1.10.2 Central Africa imaged by JERS-1 SAR data
• The amplitude ratio is estimated between nei-ghbouring images in the overlapping area.
• The correction factors are obtained by means of a global optimization.
SAR Land Applications SAR Land Applications -- TutorialTutorial
2.1.11 Classification 2.1.11 Classification
2.1.11.1 Purpose
The selection of a classification technique depends very much on the level of detail required in the resulting map. Whilst relatively simple classification algorithms and a choice of data sources may be used for maps containing a limited number of basic classes, more sophisticated algorithms must be used when more numerous and / or specific classes are selected, and not every data source may be suitable. This fact arises from the concept of classification itself: a class is often clear and understandable to a human user, but may be very difficult to define with objective parameters.
SAR Land Applications SAR Land Applications -- TutorialTutorial
2.1.11 Classification 2.1.11 Classification
2.1.11.2 Supervised or unsupervised?
Looking at the existing classification algorithms, a first distinction may be made based on the involvement of an operator within the classification process, i.e.
• Supervised Algorithms require a human user that defines the classes expected as result of the classification and reference areas – training sets – that can be considered as representative of each class. In a similar way, an operator may define a set of rules that, if fulfilled, will result in a pixel assigned to one of the possible classes.
• Unsupervised Algorithms autonomously analyse the input data and automatically identify groups of pixels with similar statistical properties.
It is widely recognized that the accuracy obtainable with supervised algorithms usually exceeds that of unsupervised algorithms. Although they are more demanding because they involve a trained operator, the greater accuracy of supervised algorithms generally makes them a better choice.
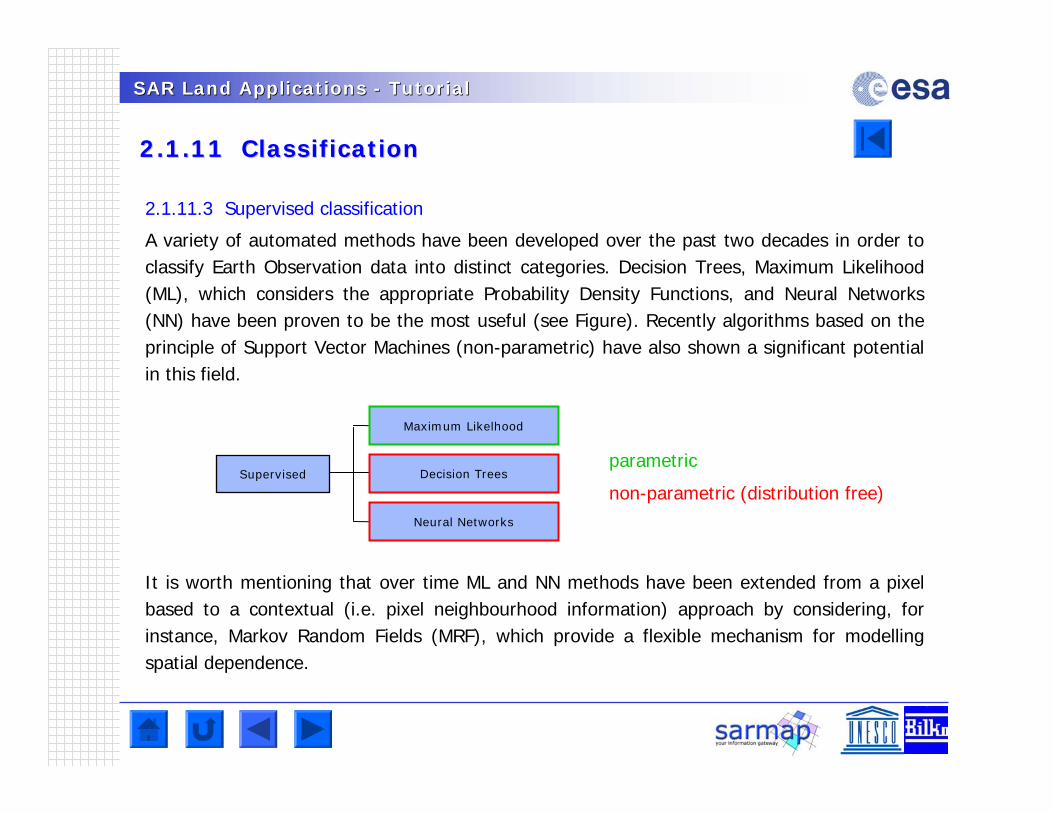
SAR Land Applications SAR Land Applications -- TutorialTutorial
2.1.11 Classification 2.1.11 Classification
2.1.11.3 Supervised classification
A variety of automated methods have been developed over the past two decades in order to classify Earth Observation data into distinct categories. Decision Trees, Maximum Likelihood (ML), which considers the appropriate Probability Density Functions, and Neural Networks (NN) have been proven to be the most useful (see Figure). Recently algorithms based on the principle of Support Vector Machines (non-parametric) have also shown a significant potential in this field.
It is worth mentioning that over time ML and NN methods have been extended from a pixel based to a contextual (i.e. pixel neighbourhood information) approach by considering, for instance, Markov Random Fields (MRF), which provide a flexible mechanism for modelling spatial dependence.
Decision Trees
Maximum Likelhood
Neural Networks
Supervisedparametric
non-parametric (distribution free)
SAR Land Applications SAR Land Applications -- TutorialTutorial
2.1.11 Classification 2.1.11 Classification
2.1.11.4 Maximum Likelihood
Maximum Likelihood (ML) estimation is a mathematical expression known as the Likelihood Function of the sample data. Loosely speaking, the likelihood of a set of data is the probability of obtaining that particular set of data, given the chosen probability distribution model. This expression contains the unknown model parameters. The values of these parameters that maximize the sample likelihood are known as the Maximum Likelihood Estimates (MLE).
The advantages of this method are:
• ML provides a consistent approach to parameter estimation problems. This means that MLE can be developed for a large variety of estimation situations.
• ML methods have desirable mathematical and optimality properties. Specifically, i) they become minimum variance unbiased estimators as the sample size increases; and ii) they have approximate normal distributions and approximate sample variances that can be used to generate confidence bounds and hypothesis tests for the parameters.
SAR Land Applications SAR Land Applications -- TutorialTutorial
2.1.11 Classification 2.1.11 Classification
2.1.11.4 Maximum Likelihood (cont.)
The disadvantages of this method are:
• The likelihood equations need to be specifically worked out for a given distribution and estimation problem. The mathematics is often non-trivial, particularly if confidence intervals for the parameters are desired.
• The numerical estimation is usually non-trivial.
• ML estimates can be heavily biased for small samples. The optimality properties may not apply for small samples.
• ML can be sensitive to the choice of starting values.

SAR Land Applications SAR Land Applications -- TutorialTutorial
2.1.11 Classification 2.1.11 Classification
2.1.11.5 Decision Tree
Decision tree classification techniques have been successfully used for a wide range of classification problems. These techniques have substantial advantages for Earth Observation classification problems because of their flexibility, intuitiveness, simplicity, and computational efficiency. As a consequence, decision tree classification algorithms are gaining increased acceptance for land cover problems. For classification problems that utilise data sets that are both well understood and well behaved, classification tree may be defined solely on analyst expertise.
Commonly, the classification structure defined by a decision tree is estimated from training data using statistical procedures. Recently, a variety of works has demonstrated that decision tree estimates from training data using a statistical procedure provide an accurate and efficient methodology for land cover classification problems in Earth Observation . Further, they require no assumption regarding the distribution of input data and also provide an intuitive classification structure.
SAR Land Applications SAR Land Applications -- TutorialTutorial
2.1.11 Classification 2.1.11 Classification
2.1.11.6 Neural Networks
NN are supervised, non-parametric classification techniques, which can model the complex statistical distribution - as in the SAR case - of the considered data in a proper way. The main characteristics of NN are
• A non-linear non-parametric approach capable of automatically fitting the complexity of the different classes
• Fast in the classification phase
Different models of NNs have been proposed. Among them, the most commonly used are the Multi-Layer Perceptron (MLP) and the Radial Basis Function (RBF) neural networks. Despite the MLPs neural networks trained with the error back-propagation (EBP) learning algorithm are the most widely used, they exhibit important drawbacks and limitations, such as:
• The slow convergence of the EBP learning algorithm• The potential convergence to a local minimum• The inability to detect that an input pattern has fallen in a region of the input space without
training data
SAR Land Applications SAR Land Applications -- TutorialTutorial
2.1.11 Classification 2.1.11 Classification
2.1.11.6 Neural Networks (cont.)
RBF Neural Networks overcome some of the above problems by relying on a rapid training phase and by presenting systematic low responses to patterns that fall in regions of the input space with no training samples. This property is very important because it is strongly related to the capability of rejecting critical input samples. Moreover, the simple and rapid training phase, makes the RBF neural networks an efficient and suitable tool also from the user point of view.
As previously mentioned, assuming that the geometrical resolution of the sensors is sufficiently high, the MRF technique can be additionally applied, giving a class label for each pixel that also considers the correlation among neighboring pixels. In this way, it is possible to obtain an improvement in the performances in terms of robustness, accuracy and reliability.
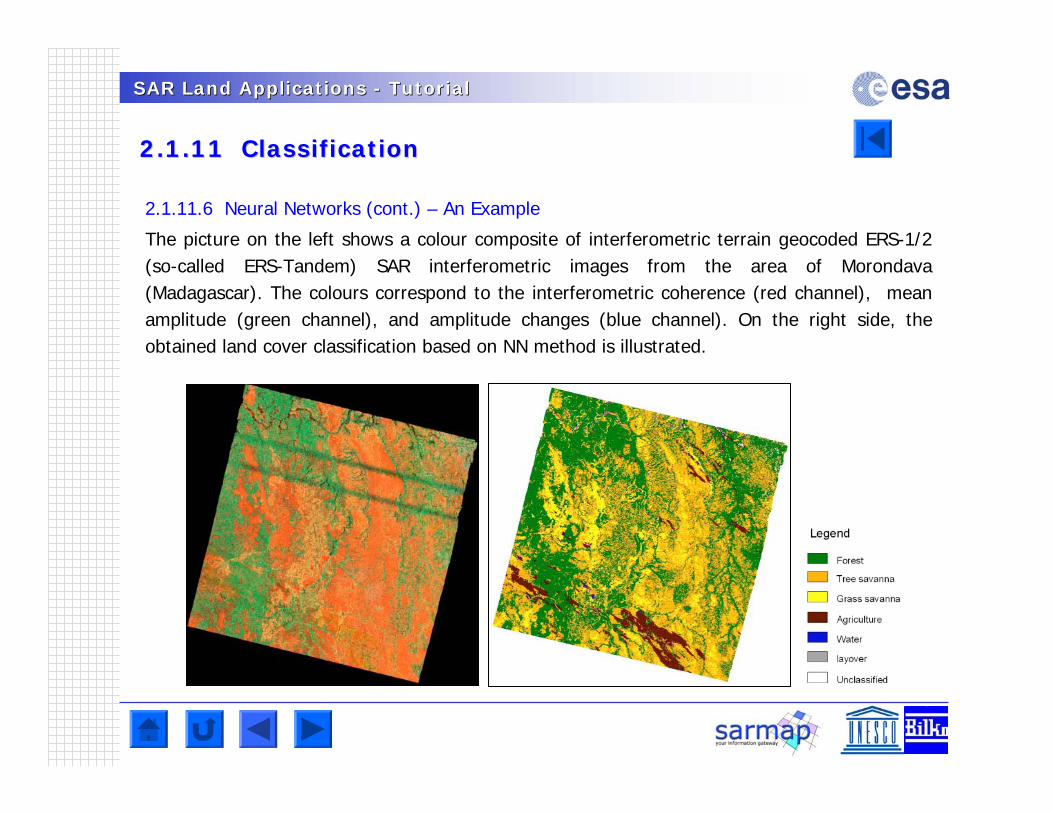
SAR Land Applications SAR Land Applications -- TutorialTutorial
2.1.11 Classification 2.1.11 Classification
2.1.11.6 Neural Networks (cont.) – An Example
The picture on the left shows a colour composite of interferometric terrain geocoded ERS-1/2 (so-called ERS-Tandem) SAR interferometric images from the area of Morondava(Madagascar). The colours correspond to the interferometric coherence (red channel), mean amplitude (green channel), and amplitude changes (blue channel). On the right side, the obtained land cover classification based on NN method is illustrated.
SAR Land Applications SAR Land Applications -- TutorialTutorial
2.1.11 Classification 2.1.11 Classification
2.1.11.7 Multi-Temporal Analysis - Unsupervised versus Supervised
The use of multi-temporal SAR data for the generation of land cover maps - and changes in particular - has increasingly become of interest for two reasons: i) With multi-temporal SAR data the radiometric quality can be improved using an appropriate multi-temporal speckle filter (or segmentation) without degrading the spatial resolution; and ii) classes and changes can be identified by analysing the temporal behaviour of the backscattering coefficient and/or interferometric coherence.
In essence, change detection techniques can be distinguished into
• Changes that can be detected by comparing multi-temporal backscattering coefficientand/or interferometric coherence.
• Changes that can be detected by using supervised classifiers.
Conditio sine qua non for the exploitation of multi-temporal analysis is that SAR data are rigorously geometrically and radiometrically calibrated and normalized, in order to enable a correct comparison.
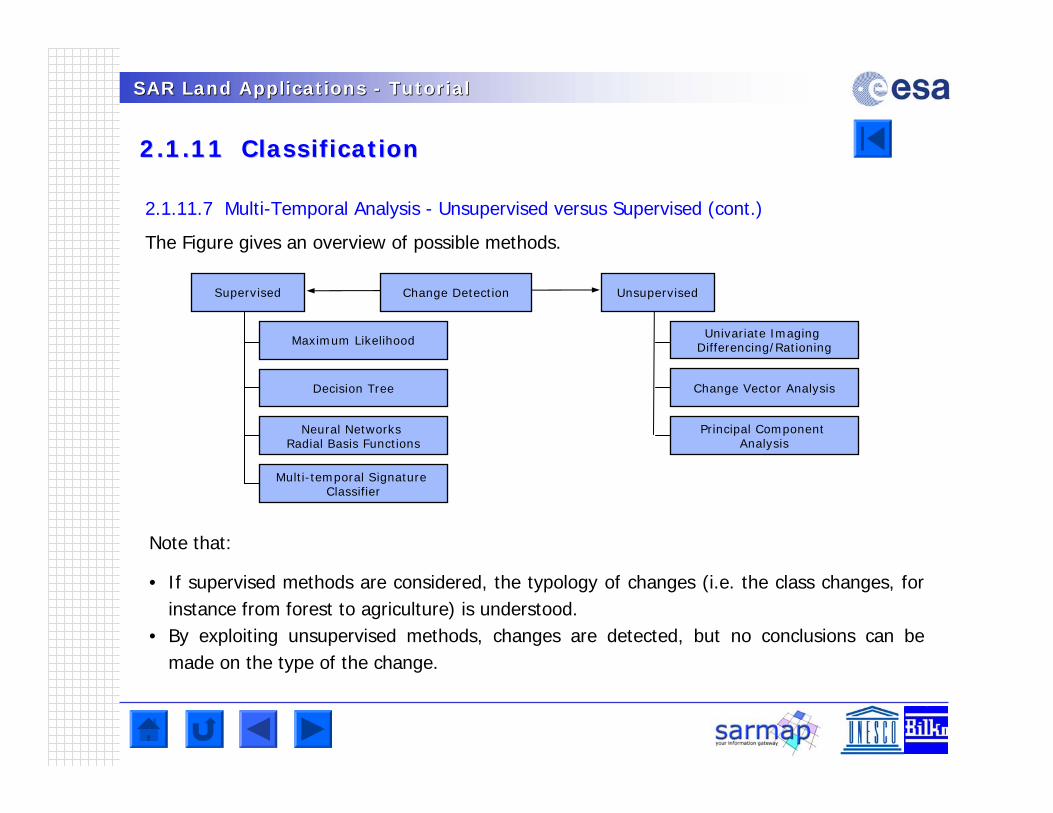
SAR Land Applications SAR Land Applications -- TutorialTutorial
2.1.11 Classification 2.1.11 Classification
2.1.11.7 Multi-Temporal Analysis - Unsupervised versus Supervised (cont.)
The Figure gives an overview of possible methods.
UnsupervisedSupervised Change Detection
Univariate Imaging Differencing/Rationing
Change Vector Analysis
Principal Component Analysis
Maximum Likelihood
Decision Tree
Neural Networks Radial Basis Functions
Multi-temporal Signature Classifier
• If supervised methods are considered, the typology of changes (i.e. the class changes, for instance from forest to agriculture) is understood.
• By exploiting unsupervised methods, changes are detected, but no conclusions can be made on the type of the change.
Note that:
SAR Land Applications SAR Land Applications -- TutorialTutorial
2.1.11 Classification 2.1.11 Classification
2.1.11.8 Multi-Temporal Analysis - Unsupervised
Univariate Image Differencing/Ratioing
Univariate Image Differencing/Ratioing performs change detection by subtracting/dividing, pixel by pixel, images acquired at two different times in order to produce a further image. Assuming that the view changes between the two times, changes can be detected in the tails of the probability density function of the pixel values in the difference/ratio image.
Change Vector Analysis
Change Vector Analysis (CVA) is based on the difference of two acquisitions between the feature vectors. In this technique, each multi-temporal set of indicator values is taken as a point in multi-temporal space. Then, for each couple of pixels, the so called change vector is computed as the difference between the feature vectors at the two times. Statistical analysis of the magnitudes of the spectral change vectors allows the detection of changes, while their directions make it possible to distinguish among different kinds of transitions.
SAR Land Applications SAR Land Applications -- TutorialTutorial
2.1.11 Classification 2.1.11 Classification
2.1.11.8 Multi-temporal Analysis – Unsupervised (cont.)
Principal Component Analysis
The Principal Component Analysis (PCA) is a multivariate statistical technique in which data axes are rotated into principal axes that maximize data variance. The original data are then transformed to the new principal axes (or components). In this manner, correlated data sets can be represented by a smaller number of axes, while maintaining most of the variation of the original data. PCA usually serves two functions: i) the evaluation of the nature of variance in the time series for anomalies and artifacts, andii) evaluation of the performance of change vector and neural network techniques.

SAR Land Applications SAR Land Applications -- TutorialTutorial
2.1.11 Classification 2.1.11 Classification
2.1.11.9 Multi-temporal Analysis - Supervised
Maximum Likelihood, Decision Tree and Neural Networks RBF
Often, in particular in the SAR case, when backscattering coefficient and interferometriccoherence data are jointly used, multi-temporal features have an irregular and complex joint probabilistic distribution, primarily because they are obtained by applying non-linear operators to multi-temporal data. For this reason, parametric classification approaches (like Gaussian or Gamma distributed ML algorithms) are problematic, as it is arduous to formulate a reasonable model of class distribution in the considered feature space.
To overcome this difficulty, distribution-free techniques that assume no specific probabilistic models for class distribution, should be considered. Among possible non-parametric approaches Decision Tree and NN RBF are commonly used. Generally, NN RFB provides accuracy higher than those based on Decision Tree technique.
SAR Land Applications SAR Land Applications -- TutorialTutorial
2.1.11 Classification 2.1.11 Classification
2.1.11.9 Multi-temporal Analysis – Supervised (cont.)
Multi-Temporal Signature Classifier
The basic idea of the Multi-temporal Signature Classifier is the analysis of reflectivity changes in the acquired SAR data over time. Measurements of temporal changes in reflectivity relates to transitions in roughness (for instance changes in the surface roughness due to emergence of crop plants) or dielectric changes (for instance drying of the plant, or frost event). This approach, which assumes a priori knowledge of the temporal signature, is therefore not just based on a (parametric or non-parametric) statistical description of the SAR data in the feature space, but, essentially, i) on the interpretation (within the classifier) of the scattering mechanisms and ii) on the assignment of these changes to specific classes.
It is worth mentioning that this classifier can be used in a pixel-based, area-based, and in a contextual way. Typical applications of the method are in the domain of agriculture, but it can be extended to other applications related to land dynamics mapping (flooding, forestry, etc.).
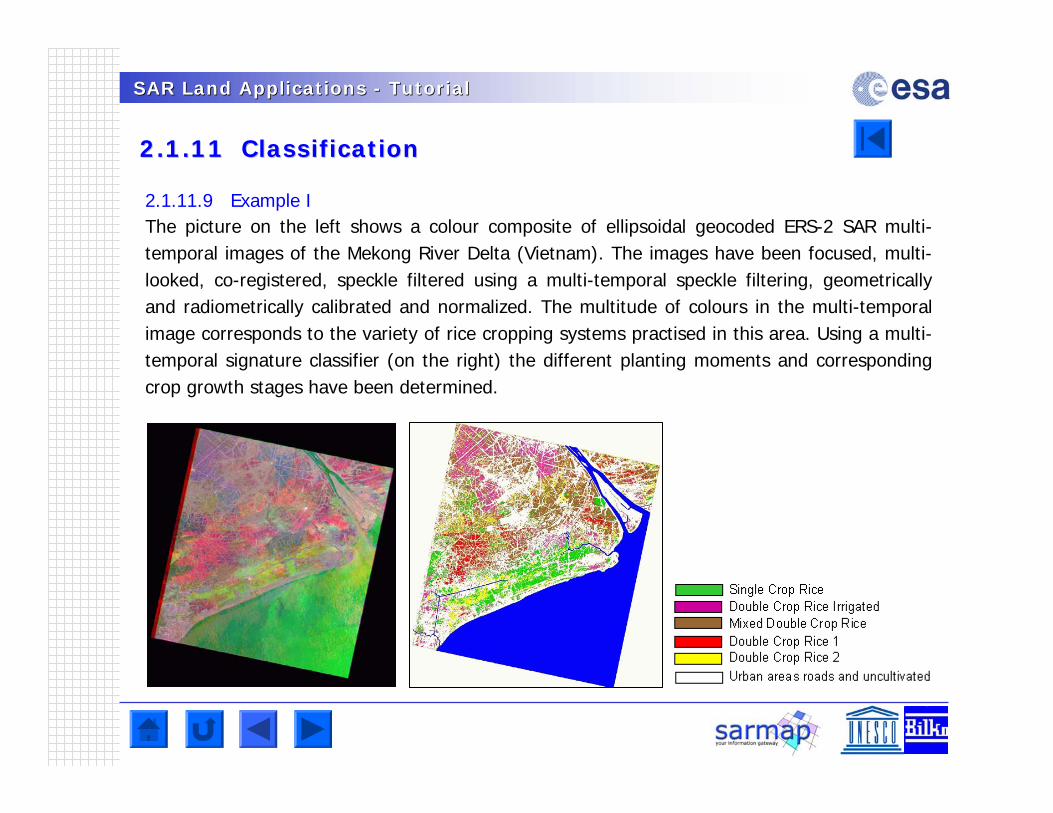
SAR Land Applications SAR Land Applications -- TutorialTutorial
2.1.11 Classification 2.1.11 Classification
2.1.11.9 Example IThe picture on the left shows a colour composite of ellipsoidal geocoded ERS-2 SAR multi-temporal images of the Mekong River Delta (Vietnam). The images have been focused, multi-looked, co-registered, speckle filtered using a multi-temporal speckle filtering, geometrically and radiometrically calibrated and normalized. The multitude of colours in the multi-temporal image corresponds to the variety of rice cropping systems practised in this area. Using a multi-temporal signature classifier (on the right) the different planting moments and corresponding crop growth stages have been determined.
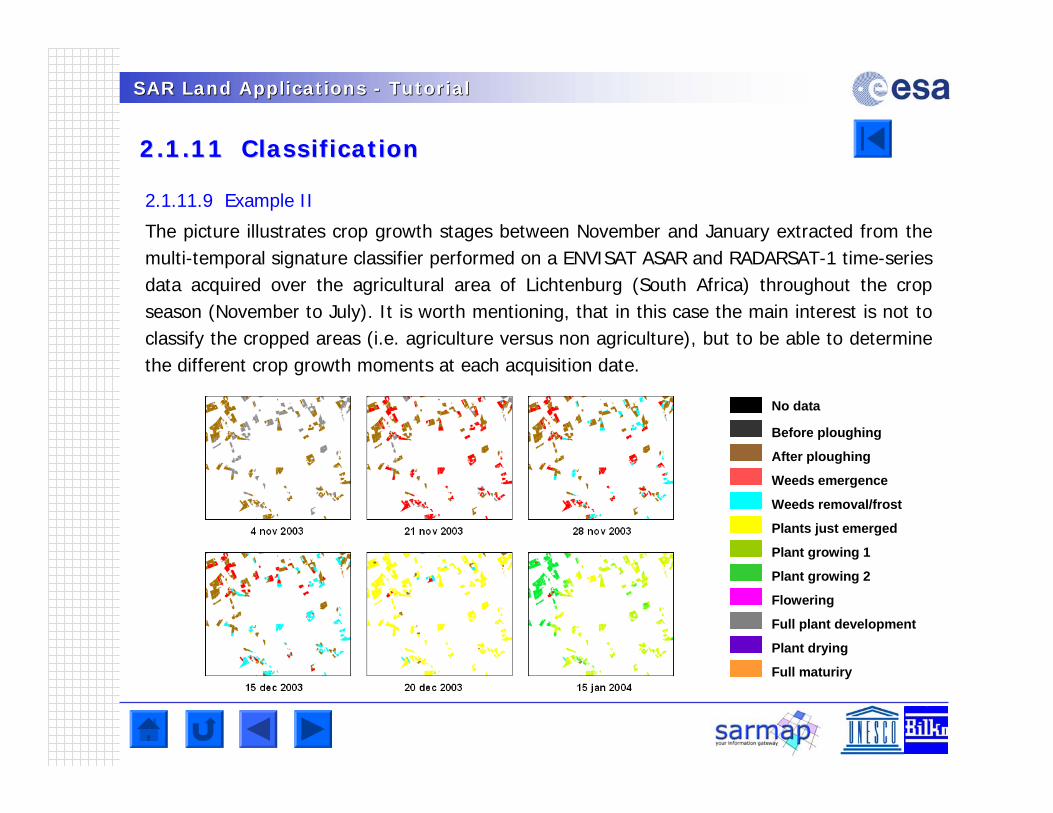
SAR Land Applications SAR Land Applications -- TutorialTutorial
2.1.11 Classification 2.1.11 Classification
2.1.11.9 Example II
The picture illustrates crop growth stages between November and January extracted from the multi-temporal signature classifier performed on a ENVISAT ASAR and RADARSAT-1 time-series data acquired over the agricultural area of Lichtenburg (South Africa) throughout the crop season (November to July). It is worth mentioning, that in this case the main interest is not to classify the cropped areas (i.e. agriculture versus non agriculture), but to be able to determine the different crop growth moments at each acquisition date.
No data
Before ploughing
After ploughing
Weeds emergence
Weeds removal/frost
Plants just emerged
Plant growing 1
Plant growing 2
Flowering
Full plant development
Plant drying
Full maturiry
SAR Land Applications SAR Land Applications -- TutorialTutorial
2.1.11 Classification 2.1.11 Classification
Exercise
Three ENVISAT ASAR AP (HH/HV) data (hence 6 images) have been multi-looked, co-registered, speckle filtered, and finally geocoded. The ASAR AP data have been acquired on 13 November 2003, 18 December 2003, and 22 January 2004 over an area in the Philippines mainly covered by rice. The goal is to map the rice fields at the different acquisition dates. How would you, in a simple way, classify the rice cropped areas?
SAR Land Applications SAR Land Applications -- TutorialTutorial
2. How SAR Products are Generated? 2. How SAR Products are Generated?
2.2.1 2.2.1 InterferogramInterferogram GenerationGeneration
2.2.2 2.2.2 InterferogramInterferogram FlatteningFlattening
2.2.3 2.2.3 InterferometricInterferometric Correlation (Coherence)Correlation (Coherence)
2.2.4 Phase Unwrapping2.2.4 Phase Unwrapping
2.2.5 Orbital Correction2.2.5 Orbital Correction
2.2.6 Phase to Map Conversion2.2.6 Phase to Map Conversion
2.2.7 Phase to Displacement Conversion2.2.7 Phase to Displacement Conversion
2.2 2.2 InterferometricInterferometric SAR (SAR (InSARInSAR) Processing) Processing
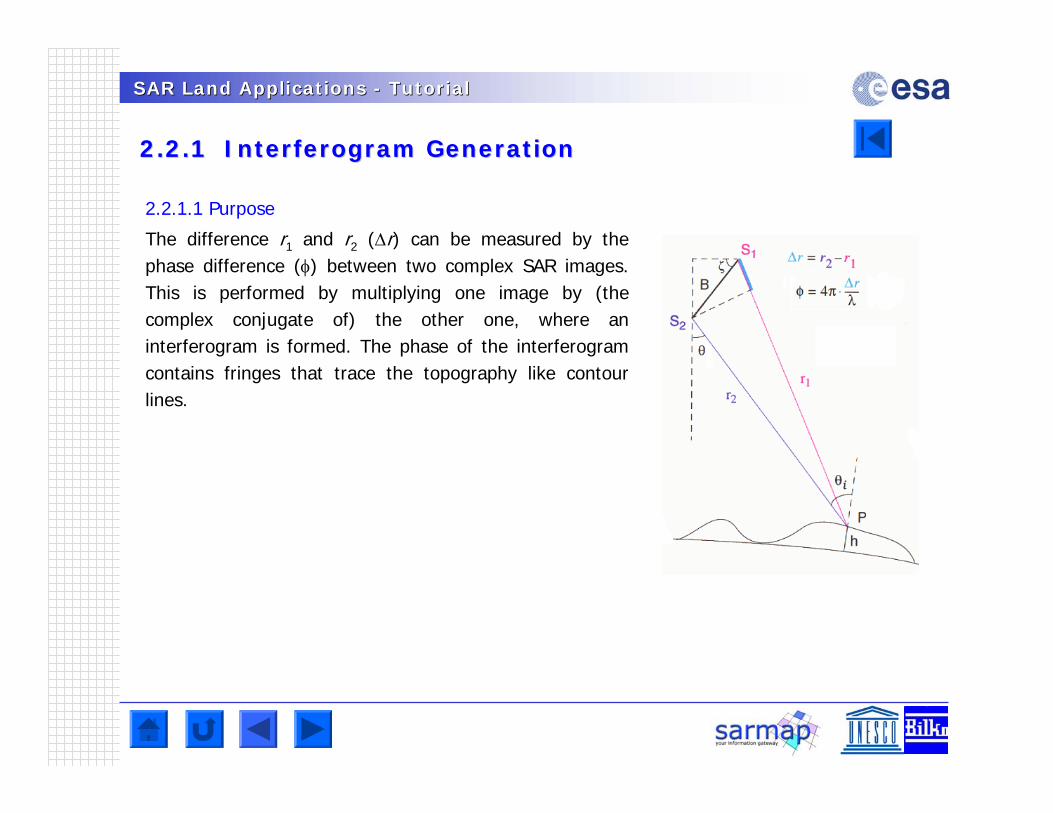
SAR Land Applications SAR Land Applications -- TutorialTutorial
2.2.1 2.2.1 InterferogramInterferogram Generation Generation
2.2.1.1 Purpose
The difference r1 and r2 (r) can be measured by the phase difference () between two complex SAR images. This is performed by multiplying one image by (the complex conjugate of) the other one, where an interferogram is formed. The phase of the interferogramcontains fringes that trace the topography like contour lines.
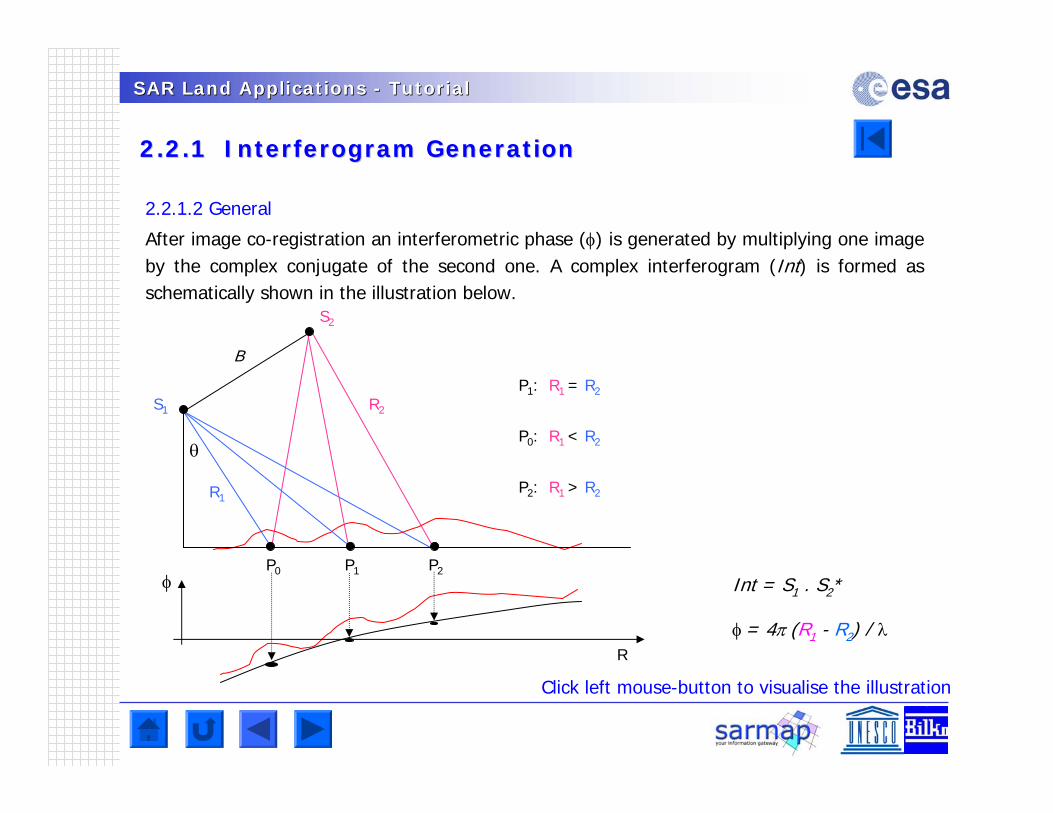
SAR Land Applications SAR Land Applications -- TutorialTutorial
2.2.1 2.2.1 InterferogramInterferogram Generation Generation
2.2.1.2 General
After image co-registration an interferometric phase () is generated by multiplying one image by the complex conjugate of the second one. A complex interferogram (Int) is formed as schematically shown in the illustration below.
P1: R1 = R2
P0: R1 < R2
P2: R1 > R2
Int = S1 . S2*
= 4(R1 - R2) /
Click left mouse-button to visualise the illustration
R
S1
R1
R2
P1 P2P0
S2
B
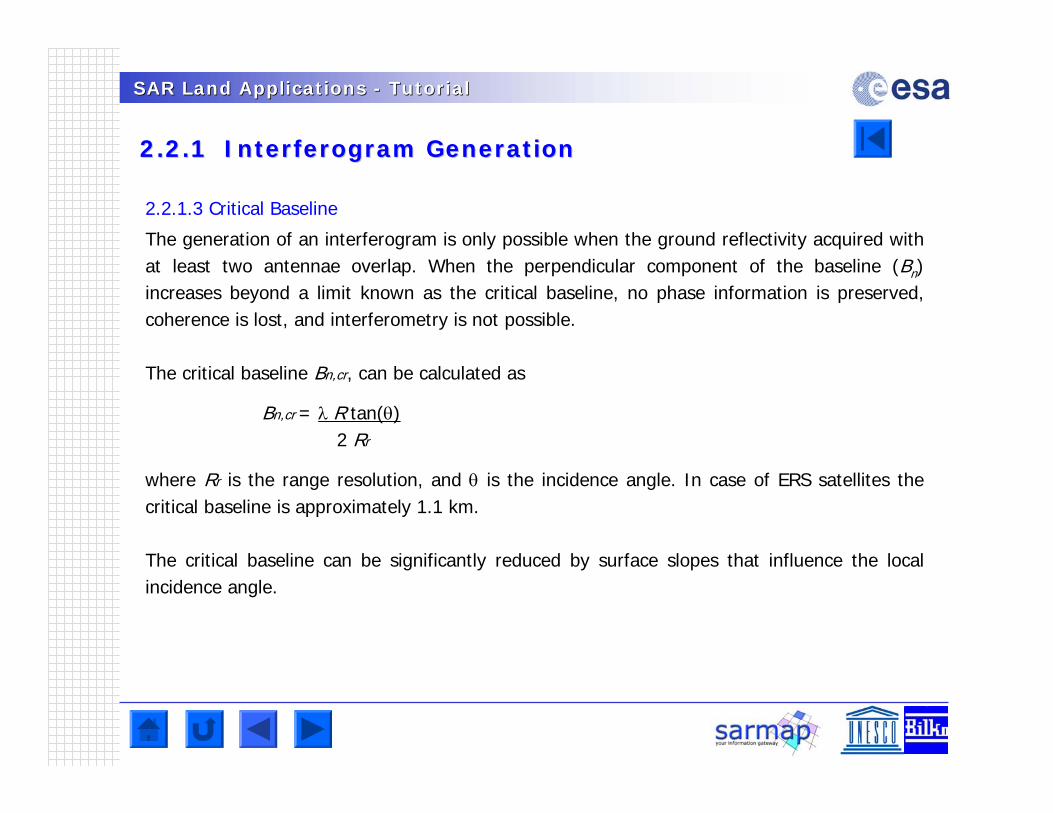
SAR Land Applications SAR Land Applications -- TutorialTutorial
2.2.1 2.2.1 InterferogramInterferogram Generation Generation
2.2.1.3 Critical Baseline
The generation of an interferogram is only possible when the ground reflectivity acquired with at least two antennae overlap. When the perpendicular component of the baseline (Bn) increases beyond a limit known as the critical baseline, no phase information is preserved, coherence is lost, and interferometry is not possible.
The critical baseline Bn,cr, can be calculated as
Bn,cr = R tan()2 Rr
where Rr is the range resolution, and is the incidence angle. In case of ERS satellites the critical baseline is approximately 1.1 km.
The critical baseline can be significantly reduced by surface slopes that influence the local incidence angle.
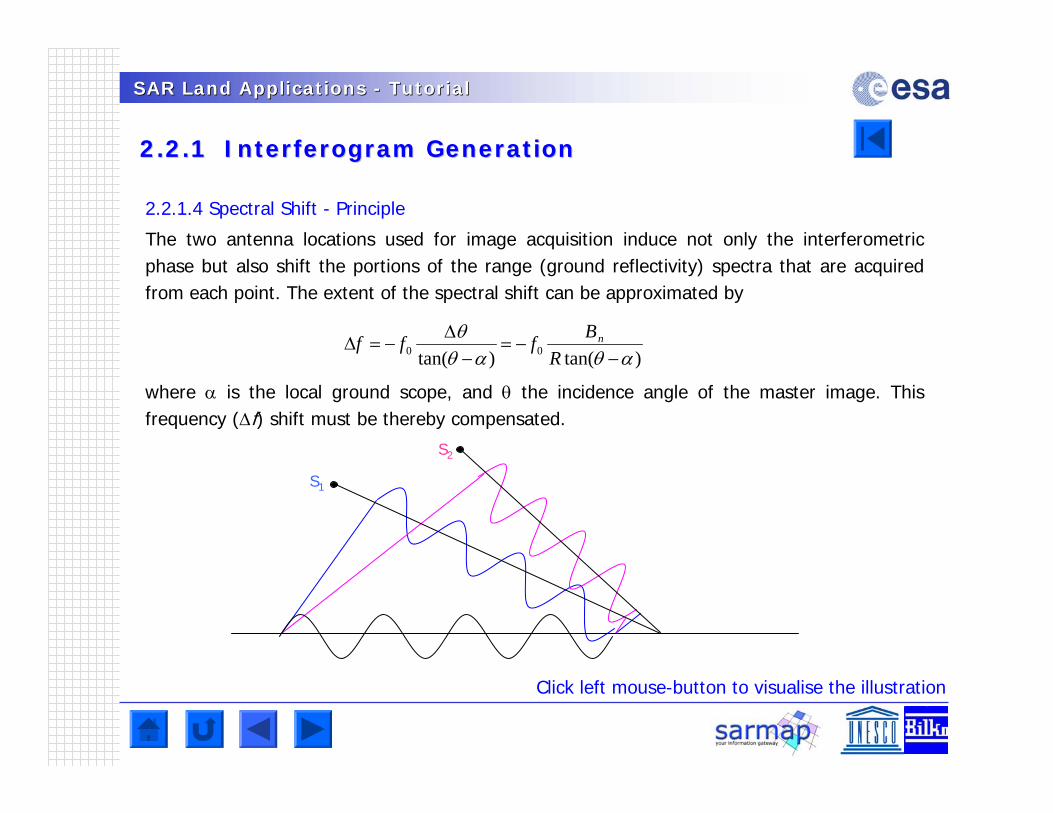
SAR Land Applications SAR Land Applications -- TutorialTutorial
2.2.1 2.2.1 InterferogramInterferogram Generation Generation
2.2.1.4 Spectral Shift - Principle
The two antenna locations used for image acquisition induce not only the interferometricphase but also shift the portions of the range (ground reflectivity) spectra that are acquired from each point. The extent of the spectral shift can be approximated by
where is the local ground scope, and the incidence angle of the master image. This frequency (f) shift must be thereby compensated.
)tan()tan( 00
R
Bfff n
S1
S2
Click left mouse-button to visualise the illustration
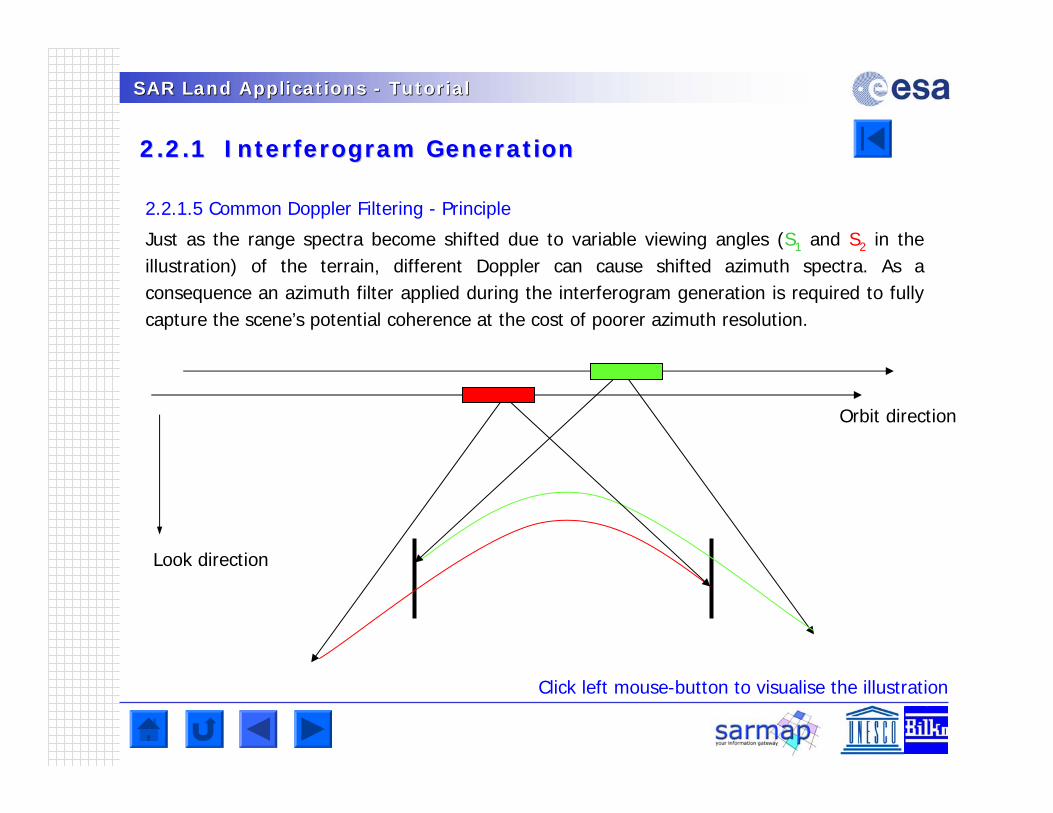
SAR Land Applications SAR Land Applications -- TutorialTutorial
2.2.1 2.2.1 InterferogramInterferogram Generation Generation
2.2.1.5 Common Doppler Filtering - Principle
Just as the range spectra become shifted due to variable viewing angles (S1 and S2 in the illustration) of the terrain, different Doppler can cause shifted azimuth spectra. As a consequence an azimuth filter applied during the interferogram generation is required to fully capture the scene’s potential coherence at the cost of poorer azimuth resolution.
Click left mouse-button to visualise the illustration
Orbit direction
Look direction
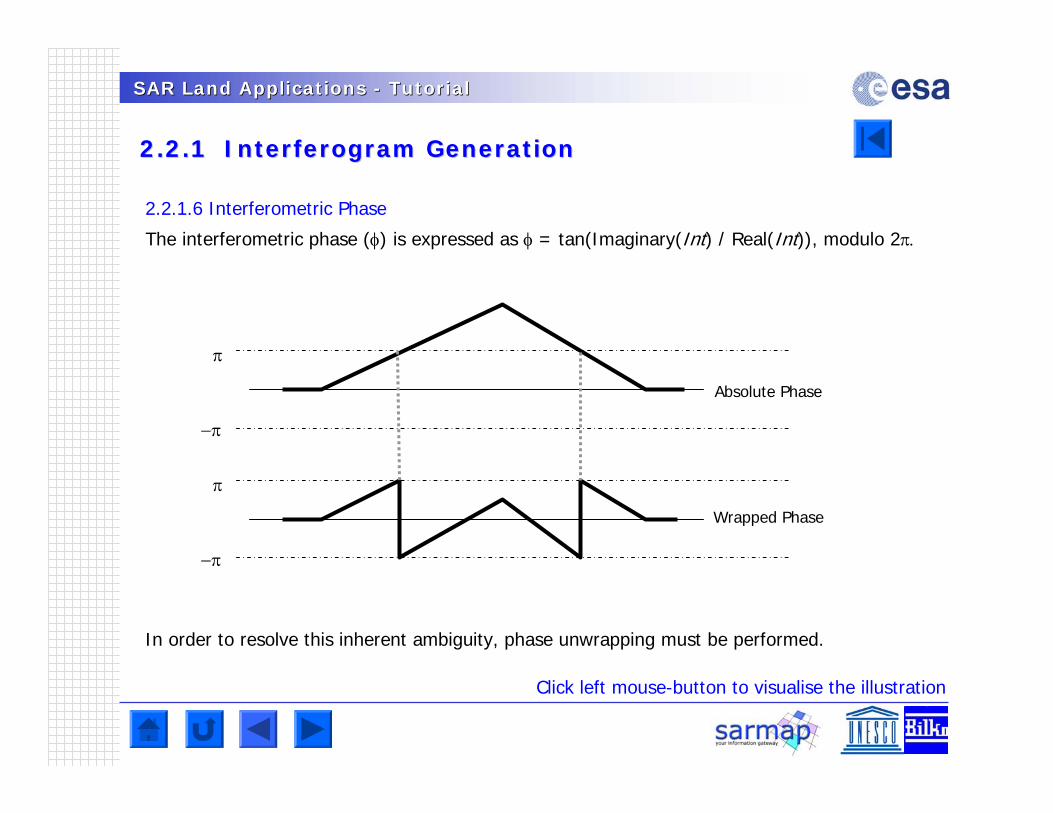
SAR Land Applications SAR Land Applications -- TutorialTutorial
2.2.1 2.2.1 InterferogramInterferogram Generation Generation
2.2.1.6 Interferometric Phase
The interferometric phase () is expressed as = tan(Imaginary(Int) / Real(Int)), modulo 2
Absolute Phase
Wrapped Phase
In order to resolve this inherent ambiguity, phase unwrapping must be performed.
Click left mouse-button to visualise the illustration
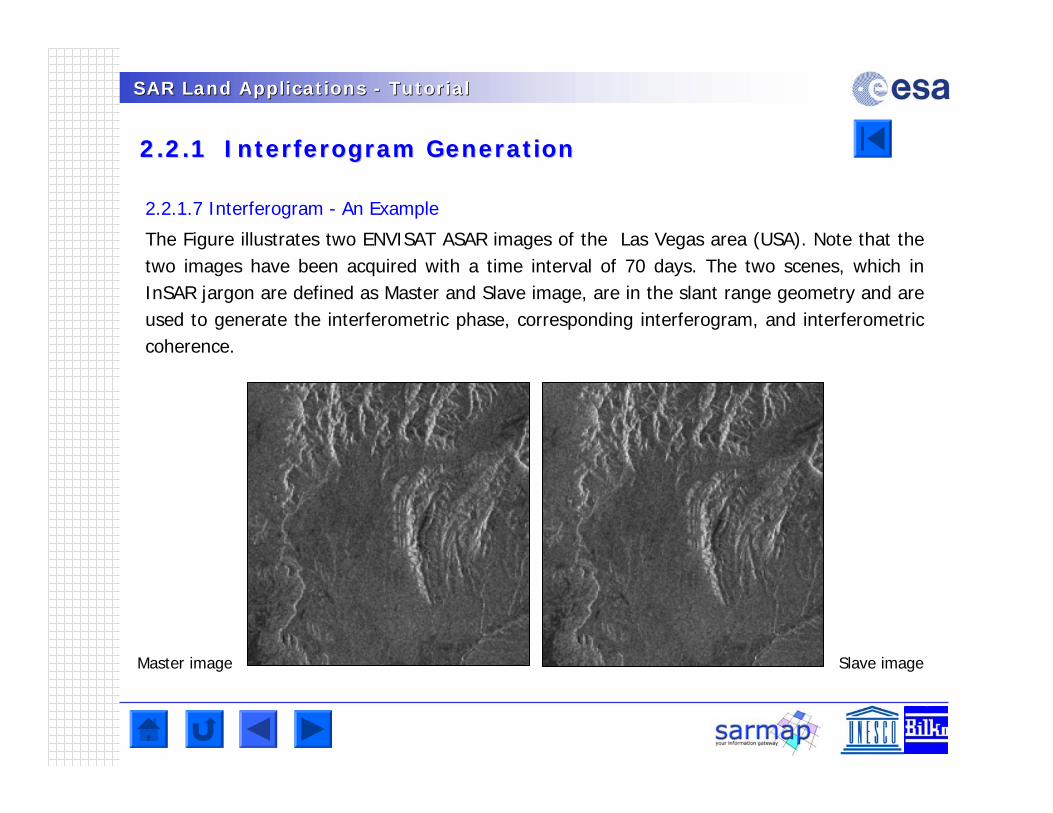
SAR Land Applications SAR Land Applications -- TutorialTutorial
2.2.1 2.2.1 InterferogramInterferogram Generation Generation
2.2.1.7 Interferogram - An Example
The Figure illustrates two ENVISAT ASAR images of the Las Vegas area (USA). Note that the two images have been acquired with a time interval of 70 days. The two scenes, which in InSAR jargon are defined as Master and Slave image, are in the slant range geometry and are used to generate the interferometric phase, corresponding interferogram, and interferometriccoherence.
Master image Slave image
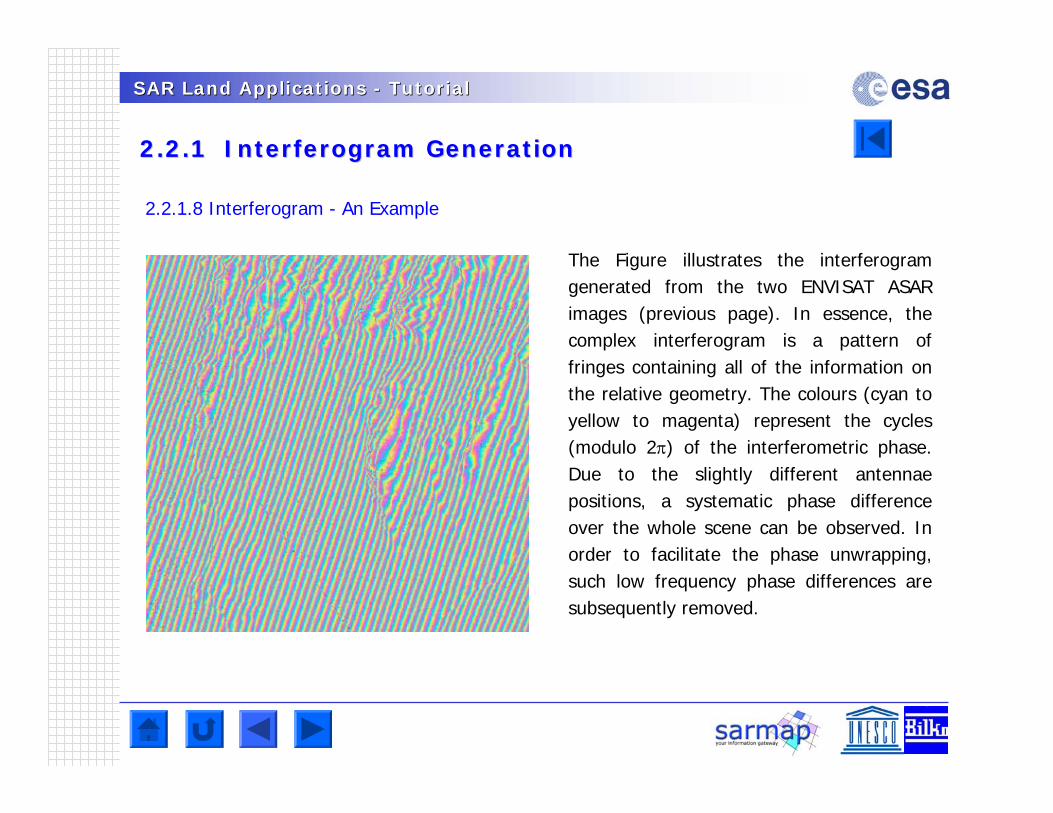
SAR Land Applications SAR Land Applications -- TutorialTutorial
2.2.1 2.2.1 InterferogramInterferogram Generation Generation
2.2.1.8 Interferogram - An Example
The Figure illustrates the interferogramgenerated from the two ENVISAT ASAR images (previous page). In essence, the complex interferogram is a pattern of fringes containing all of the information on the relative geometry. The colours (cyan to yellow to magenta) represent the cycles (modulo 2) of the interferometric phase. Due to the slightly different antennae positions, a systematic phase difference over the whole scene can be observed. In order to facilitate the phase unwrapping, such low frequency phase differences are subsequently removed.
SAR Land Applications SAR Land Applications -- TutorialTutorial
2.2.1 2.2.1 InterferogramInterferogram Generation Generation
Questions
Q1Is it possible to generate an interferogram between two ASAR images acquired with different incidence angles?
SAR Land Applications SAR Land Applications -- TutorialTutorial
2.2.2 2.2.2 InterferogramInterferogram Flattening Flattening
2.2.2.1 Purpose
In preparation for the phase unwrapping step to come, the expected phase, which is calculated using a system model, is removed, producing a flattened interferogram, that is easier to unwrap.
Neglecting terrain influences and Earth curvature, the frequency to be removed can be estimated by the interferogram itself. However, the most accurate models for removal of the fringes are those that estimate the expected Earth phase by assuming the shape of the Earth is an ellipsoid or, more accurately, by using a Digital Elevation Model.
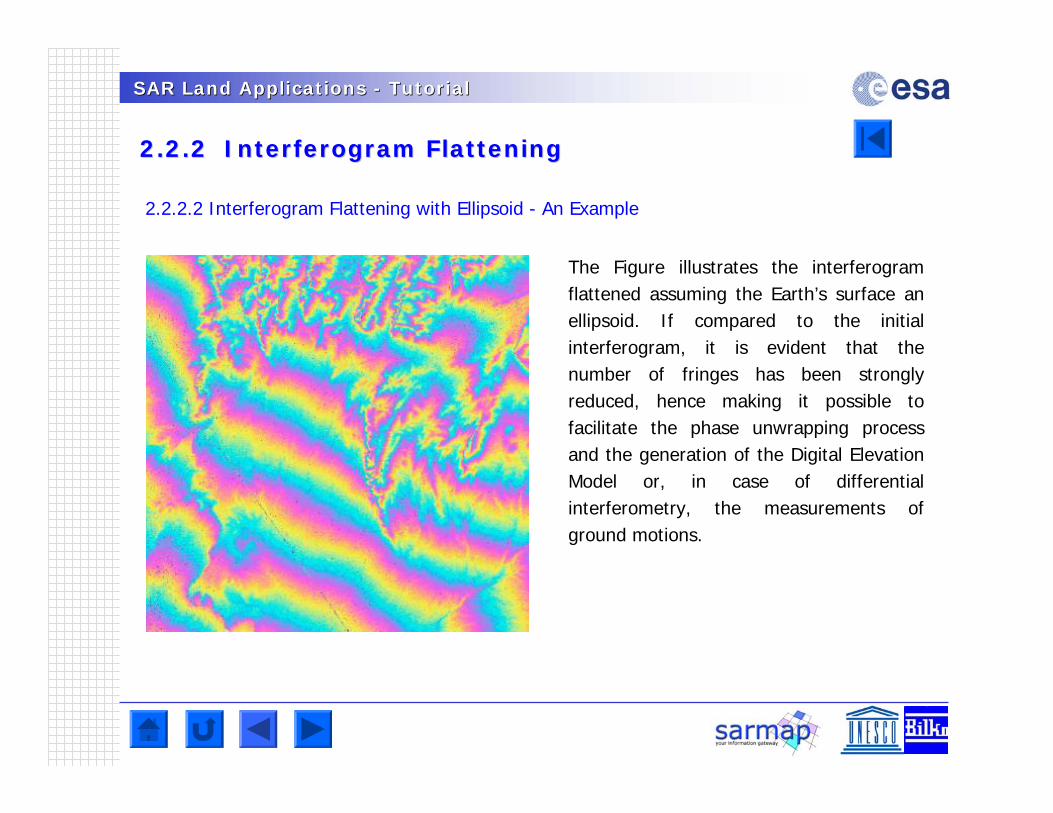
SAR Land Applications SAR Land Applications -- TutorialTutorial
2.2.2 2.2.2 InterferogramInterferogram Flattening Flattening
2.2.2.2 Interferogram Flattening with Ellipsoid - An Example
The Figure illustrates the interferogramflattened assuming the Earth’s surface an ellipsoid. If compared to the initial interferogram, it is evident that the number of fringes has been strongly reduced, hence making it possible to facilitate the phase unwrapping process and the generation of the Digital Elevation Model or, in case of differential interferometry, the measurements of ground motions.
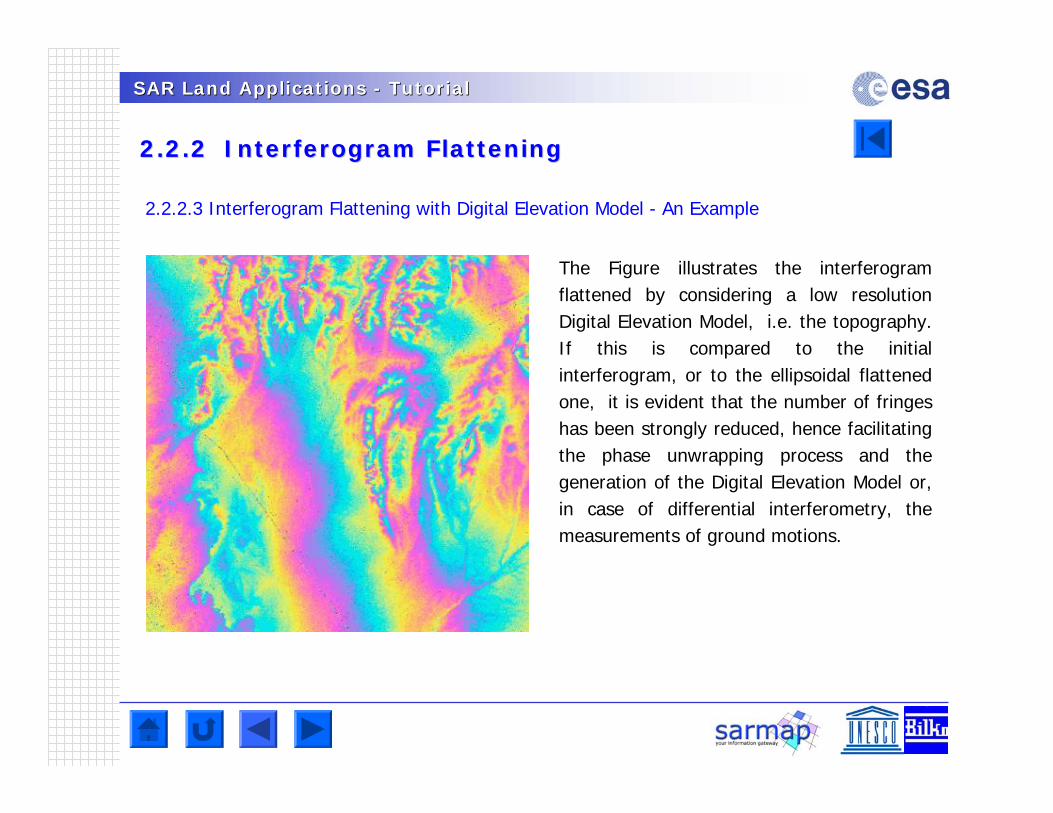
SAR Land Applications SAR Land Applications -- TutorialTutorial
2.2.2 2.2.2 InterferogramInterferogram Flattening Flattening
2.2.2.3 Interferogram Flattening with Digital Elevation Model - An Example
The Figure illustrates the interferogramflattened by considering a low resolution Digital Elevation Model, i.e. the topography. If this is compared to the initial interferogram, or to the ellipsoidal flattened one, it is evident that the number of fringes has been strongly reduced, hence facilitating the phase unwrapping process and the generation of the Digital Elevation Model or, in case of differential interferometry, the measurements of ground motions.
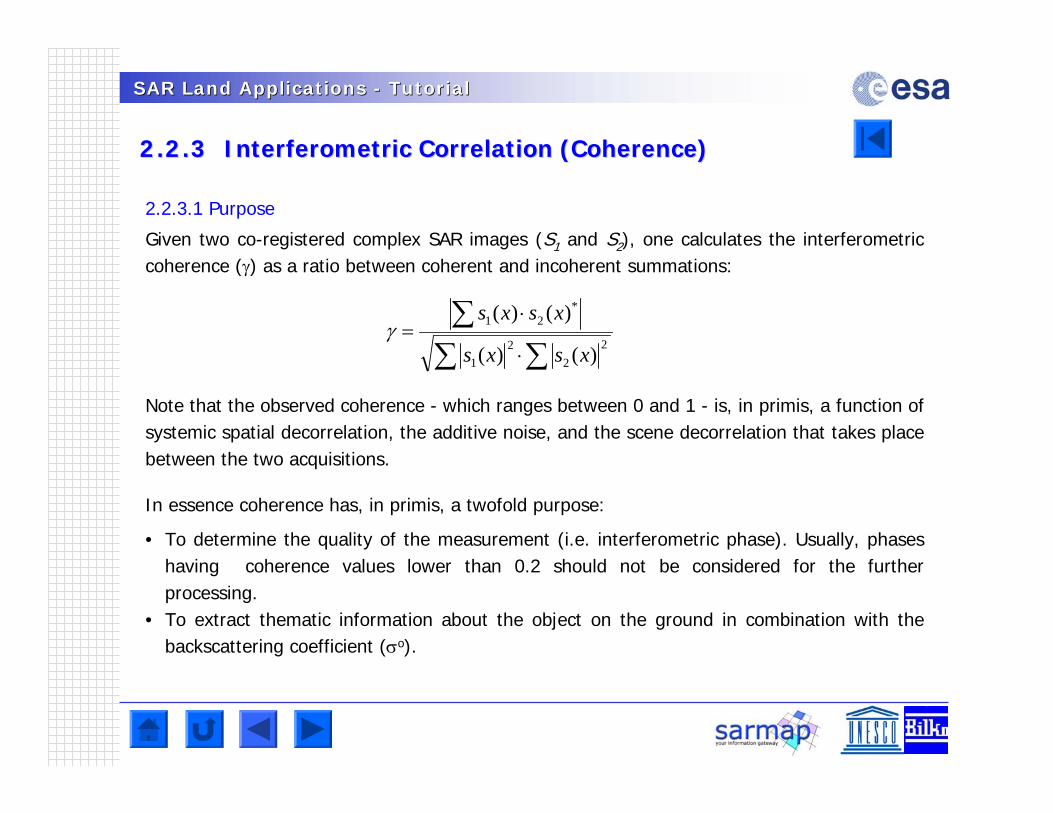
SAR Land Applications SAR Land Applications -- TutorialTutorial
2.2.3 2.2.3 InterferometricInterferometric Correlation (Coherence)Correlation (Coherence)
2.2.3.1 Purpose
Given two co-registered complex SAR images (S1 and S2), one calculates the interferometriccoherence () as a ratio between coherent and incoherent summations:
Note that the observed coherence - which ranges between 0 and 1 - is, in primis, a function of systemic spatial decorrelation, the additive noise, and the scene decorrelation that takes place between the two acquisitions.
In essence coherence has, in primis, a twofold purpose:
22
21
*21
)()(
)()(
xsxs
xsxs
• To determine the quality of the measurement (i.e. interferometric phase). Usually, phases having coherence values lower than 0.2 should not be considered for the further processing.
• To extract thematic information about the object on the ground in combination with the backscattering coefficient (o).
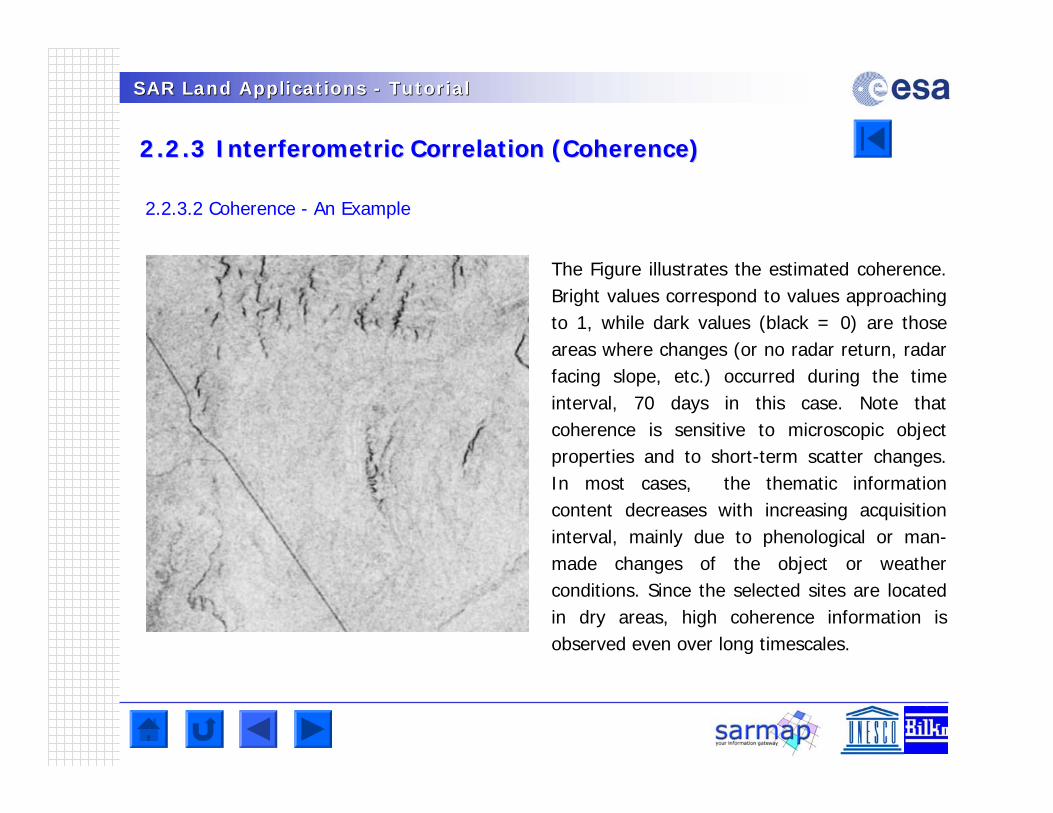
SAR Land Applications SAR Land Applications -- TutorialTutorial
2.2.3 2.2.3 InterferometricInterferometric Correlation (Coherence)Correlation (Coherence)
2.2.3.2 Coherence - An Example
The Figure illustrates the estimated coherence. Bright values correspond to values approaching to 1, while dark values (black = 0) are those areas where changes (or no radar return, radar facing slope, etc.) occurred during the time interval, 70 days in this case. Note that coherence is sensitive to microscopic object properties and to short-term scatter changes. In most cases, the thematic information content decreases with increasing acquisition interval, mainly due to phenological or man-made changes of the object or weather conditions. Since the selected sites are located in dry areas, high coherence information is observed even over long timescales.
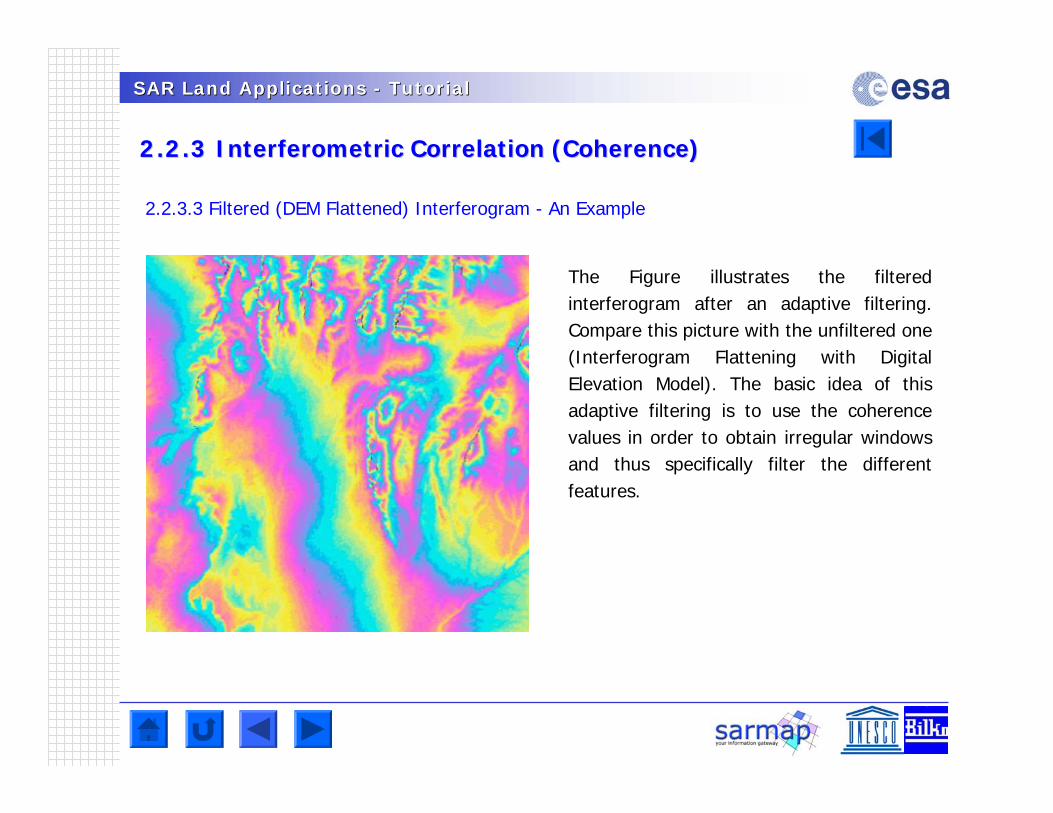
SAR Land Applications SAR Land Applications -- TutorialTutorial
2.2.3 2.2.3 InterferometricInterferometric Correlation (Coherence)Correlation (Coherence)
2.2.3.3 Filtered (DEM Flattened) Interferogram - An Example
The Figure illustrates the filtered interferogram after an adaptive filtering. Compare this picture with the unfiltered one (Interferogram Flattening with Digital Elevation Model). The basic idea of this adaptive filtering is to use the coherence values in order to obtain irregular windows and thus specifically filter the different features.
SAR Land Applications SAR Land Applications -- TutorialTutorial
2.2.3 2.2.3 InterferometricInterferometric Correlation (Coherence)Correlation (Coherence)
Questions
Q1What parameters strongly affect the Coherence values in the repeat-pass case?
Q2In which land applications could the use of Coherence be of importance?
SAR Land Applications SAR Land Applications -- TutorialTutorial
2.2.4 Phase Unwrapping 2.2.4 Phase Unwrapping
2.2.4.1 Purpose
The phase of the interferogram can only be modulo 2. Phase Unwrapping is the process that resolves this 2 ambiguity. Several algorithms (such as the branch-cuts, region growing, minimum cost flow, minimum least squares, multi-baseline, etc.) have been developed. In essence, none of these are perfect, and depending on the applied technique some phase editing should be carried out in order to correct the wrong unwrapped phases. The most reliable techniques are those in which different algorithms are combined.
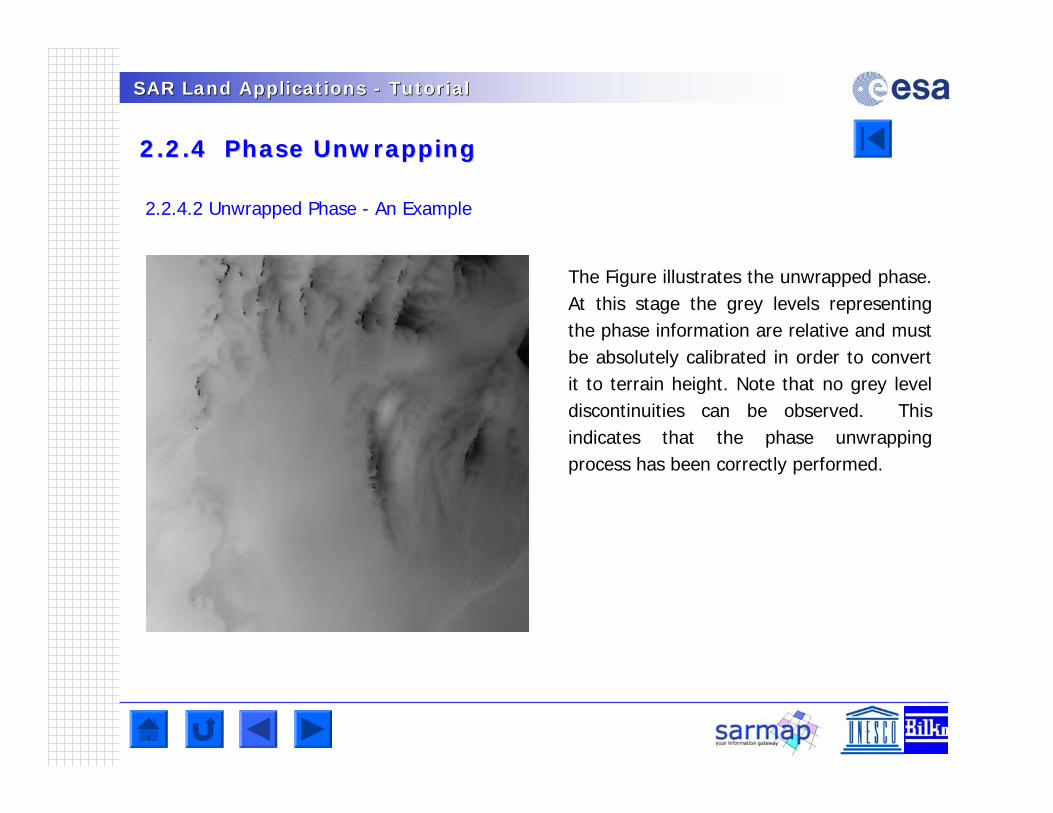
SAR Land Applications SAR Land Applications -- TutorialTutorial
2.2.4 Phase Unwrapping 2.2.4 Phase Unwrapping
2.2.4.2 Unwrapped Phase - An Example
The Figure illustrates the unwrapped phase. At this stage the grey levels representing the phase information are relative and must be absolutely calibrated in order to convert it to terrain height. Note that no grey level discontinuities can be observed. This indicates that the phase unwrapping process has been correctly performed.
SAR Land Applications SAR Land Applications -- TutorialTutorial
2.2.5 Orbital Correction 2.2.5 Orbital Correction
2.2.5.1 Purpose
The orbital correction is crucial for a correct transformation of the phase information into height values. In essence, this procedure, which requires the use of some accurate Ground Control Points, makes it possible toi) calculate the phase offset (hence allowing to calculate the absolute phase), andii) refine the orbits and thus obtain a more accurate estimate of the orbits and the corresponding baseline. Generally, this step is performed by taking into account
• Shift in azimuth direction• Shift in range direction• Convergence of the orbits in azimuth direction• Convergence of the orbits in range direction• Absolute phase
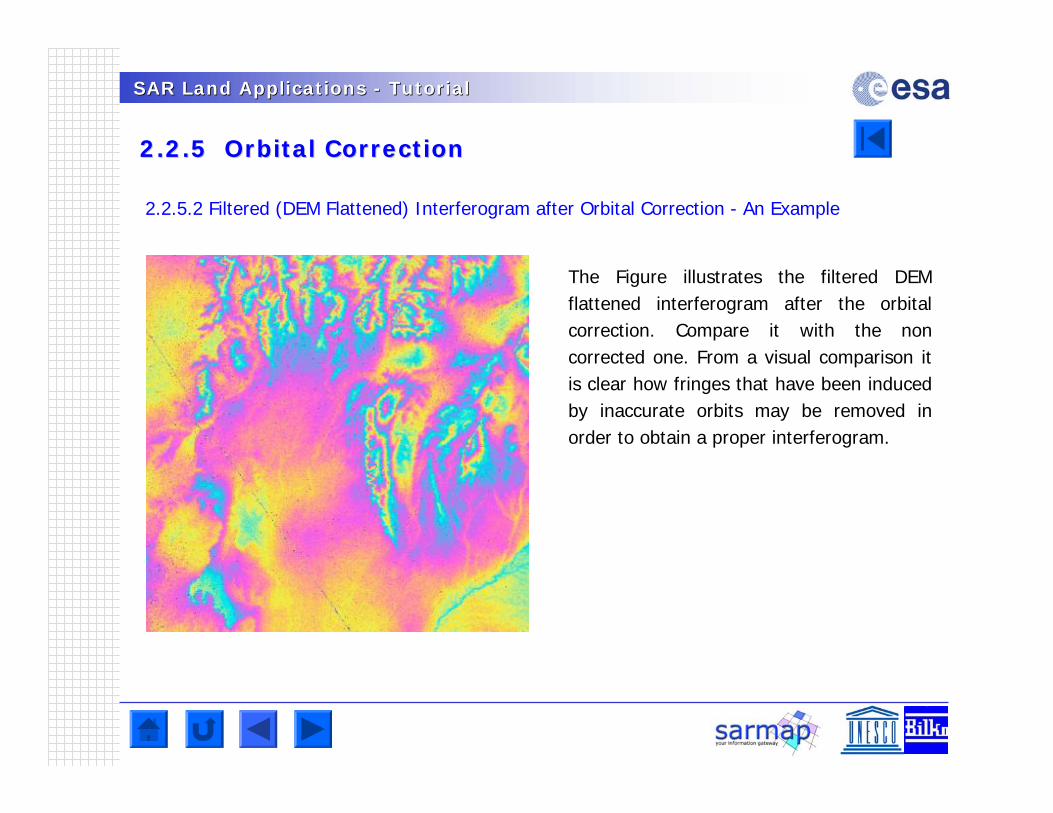
SAR Land Applications SAR Land Applications -- TutorialTutorial
2.2.5 Orbital Correction 2.2.5 Orbital Correction
2.2.5.2 Filtered (DEM Flattened) Interferogram after Orbital Correction - An Example
The Figure illustrates the filtered DEM flattened interferogram after the orbital correction. Compare it with the non corrected one. From a visual comparison it is clear how fringes that have been induced by inaccurate orbits may be removed in order to obtain a proper interferogram.
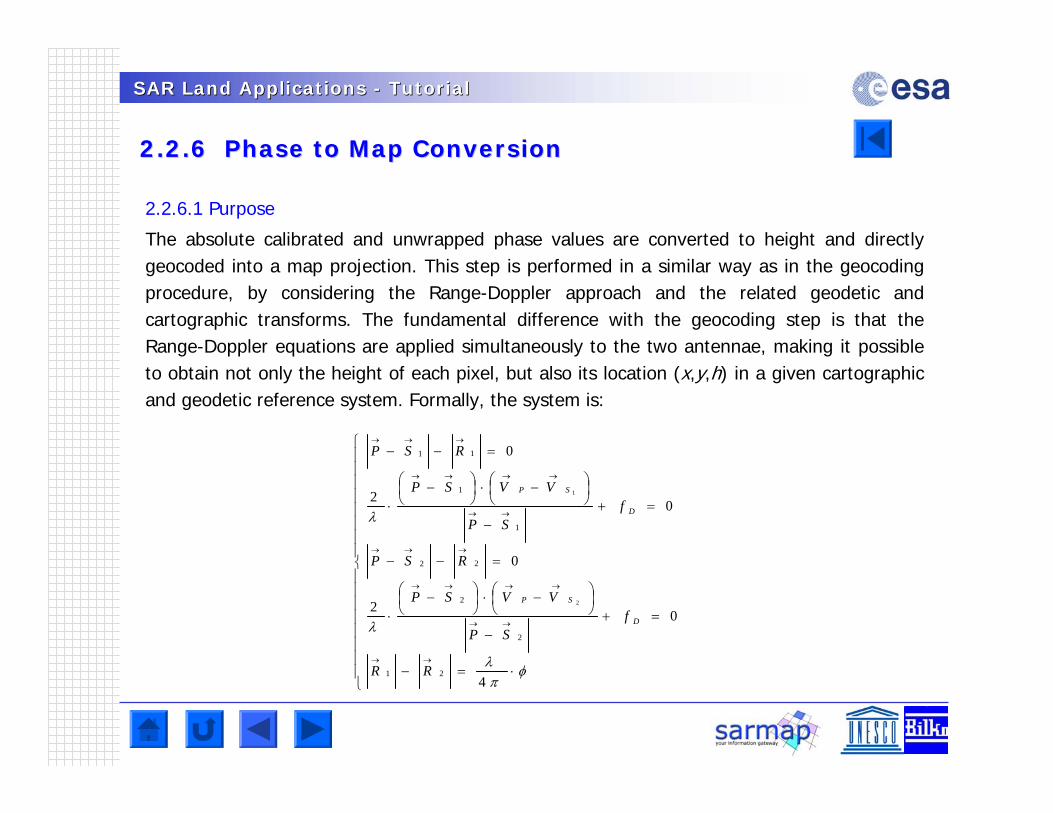
SAR Land Applications SAR Land Applications -- TutorialTutorial
2.2.6 Phase to Map Conversion2.2.6 Phase to Map Conversion
2.2.6.1 Purpose
The absolute calibrated and unwrapped phase values are converted to height and directly geocoded into a map projection. This step is performed in a similar way as in the geocodingprocedure, by considering the Range-Doppler approach and the related geodetic and cartographic transforms. The fundamental difference with the geocoding step is that the Range-Doppler equations are applied simultaneously to the two antennae, making it possible to obtain not only the height of each pixel, but also its location (x,y,h) in a given cartographic and geodetic reference system. Formally, the system is:
4
02
0
02
0
21
2
2
22
1
1
11
2
1
RR
fSP
VVSP
RSP
fSP
VVSP
RSP
D
SP
D
SP
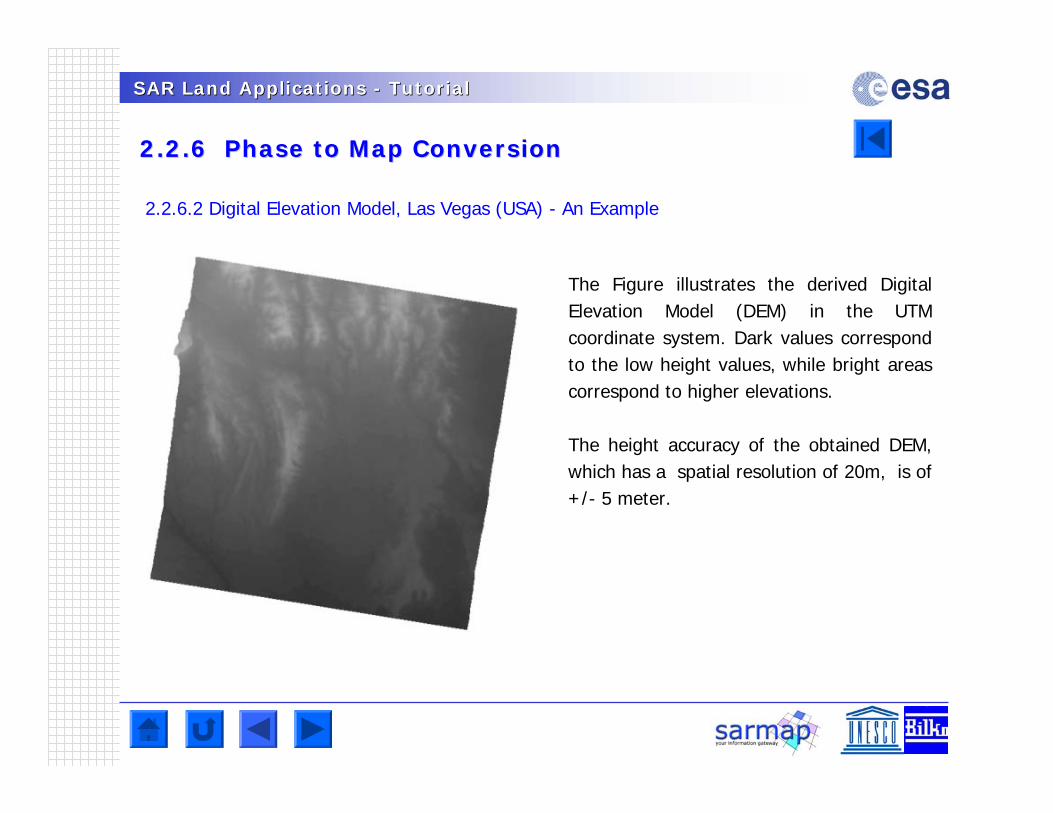
SAR Land Applications SAR Land Applications -- TutorialTutorial
2.2.6 Phase to Map Conversion2.2.6 Phase to Map Conversion
2.2.6.2 Digital Elevation Model, Las Vegas (USA) - An Example
The Figure illustrates the derived Digital Elevation Model (DEM) in the UTM coordinate system. Dark values correspond to the low height values, while bright areas correspond to higher elevations.
The height accuracy of the obtained DEM, which has a spatial resolution of 20m, is of +/- 5 meter.
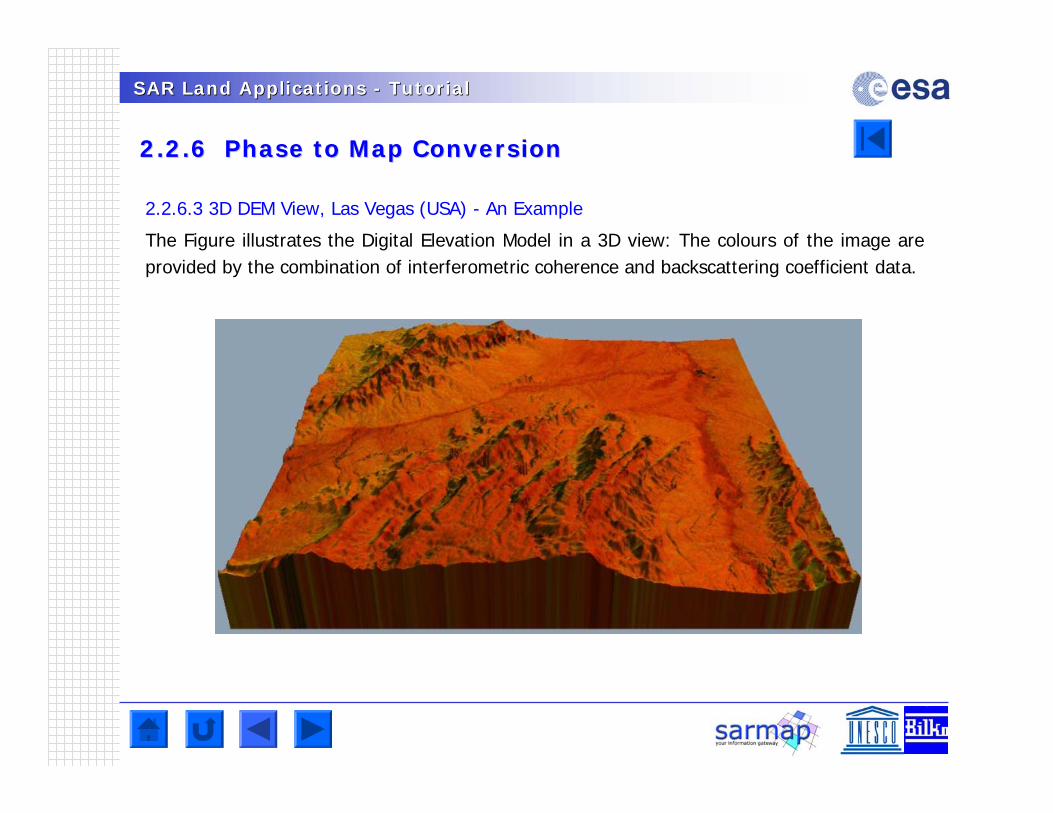
SAR Land Applications SAR Land Applications -- TutorialTutorial
2.2.6 Phase to Map Conversion2.2.6 Phase to Map Conversion
2.2.6.3 3D DEM View, Las Vegas (USA) - An Example
The Figure illustrates the Digital Elevation Model in a 3D view: The colours of the image are provided by the combination of interferometric coherence and backscattering coefficient data.
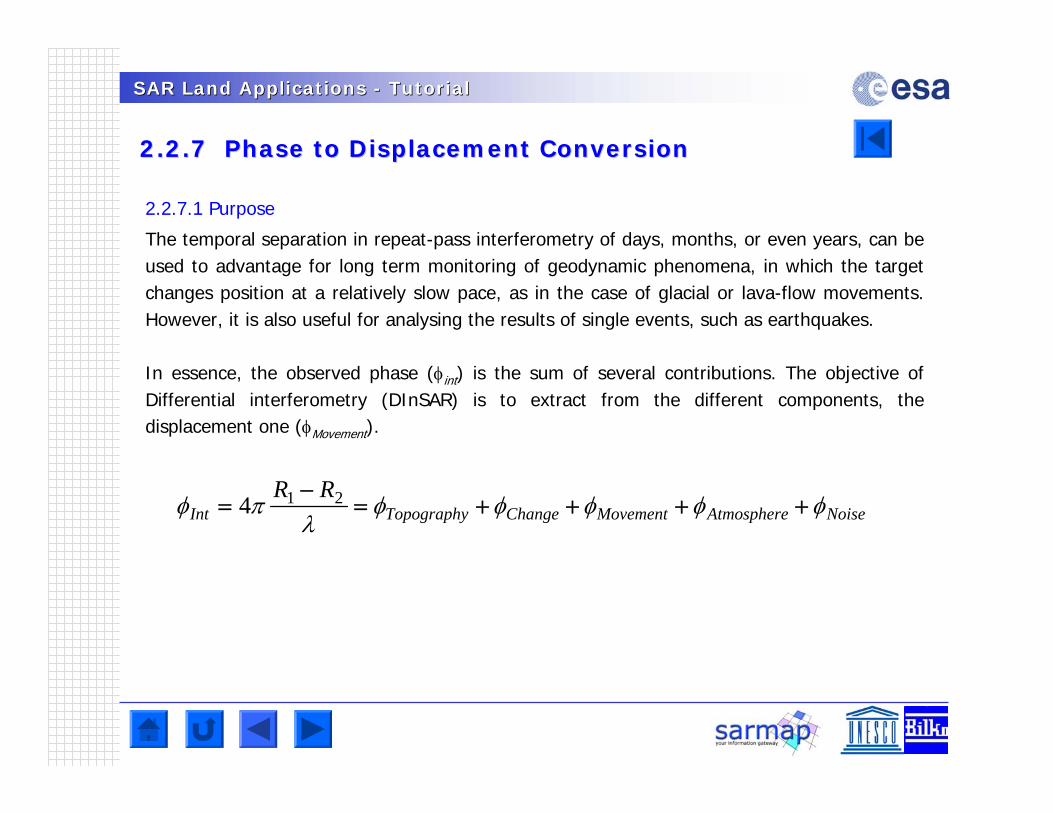
SAR Land Applications SAR Land Applications -- TutorialTutorial
2.2.7 Phase to Displacement Conversion2.2.7 Phase to Displacement Conversion
2.2.7.1 Purpose
The temporal separation in repeat-pass interferometry of days, months, or even years, can be used to advantage for long term monitoring of geodynamic phenomena, in which the target changes position at a relatively slow pace, as in the case of glacial or lava-flow movements. However, it is also useful for analysing the results of single events, such as earthquakes.
In essence, the observed phase (int) is the sum of several contributions. The objective of Differential interferometry (DInSAR) is to extract from the different components, the displacement one (Movement).
NoiseAtmosphereMovementChangeTopographyIntRR
214
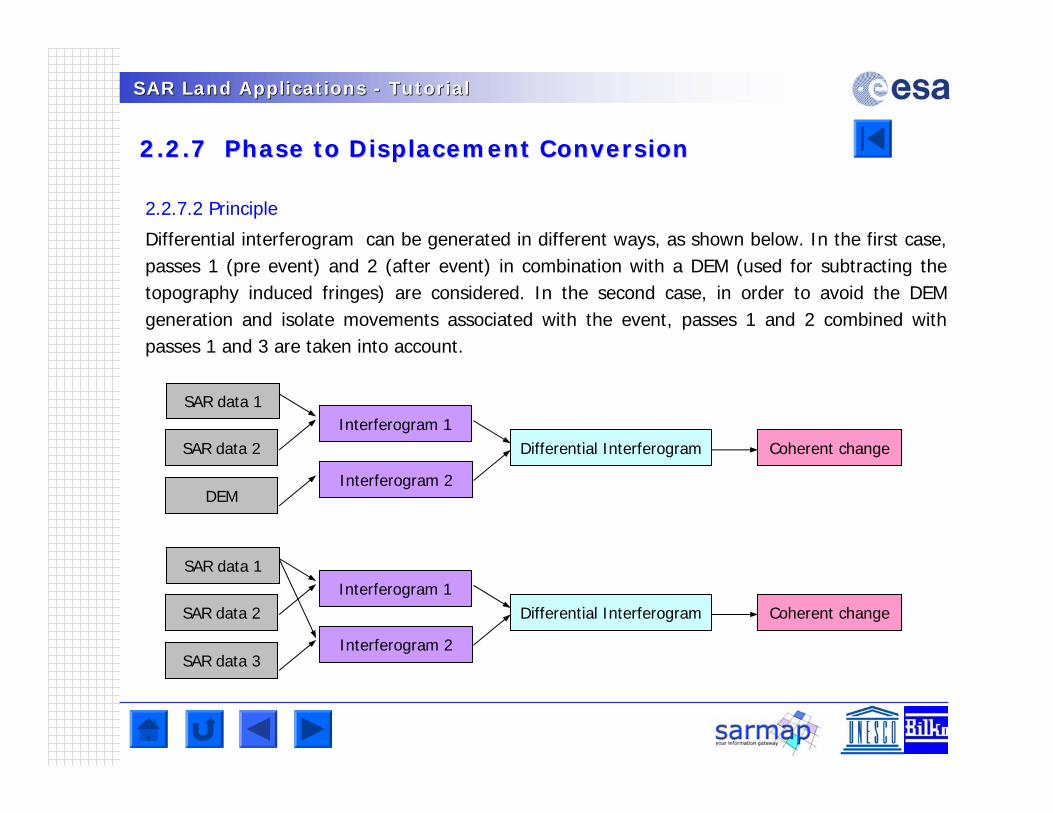
SAR Land Applications SAR Land Applications -- TutorialTutorial
2.2.7 Phase to Displacement Conversion2.2.7 Phase to Displacement Conversion
2.2.7.2 Principle
Differential interferogram can be generated in different ways, as shown below. In the first case, passes 1 (pre event) and 2 (after event) in combination with a DEM (used for subtracting the topography induced fringes) are considered. In the second case, in order to avoid the DEM generation and isolate movements associated with the event, passes 1 and 2 combined with passes 1 and 3 are taken into account.
SAR data 1
SAR data 2
SAR data 3
Interferogram 1
Interferogram 2
Differential Interferogram Coherent change
SAR data 1
SAR data 2
DEM
Interferogram 1
Interferogram 2
Differential Interferogram Coherent change
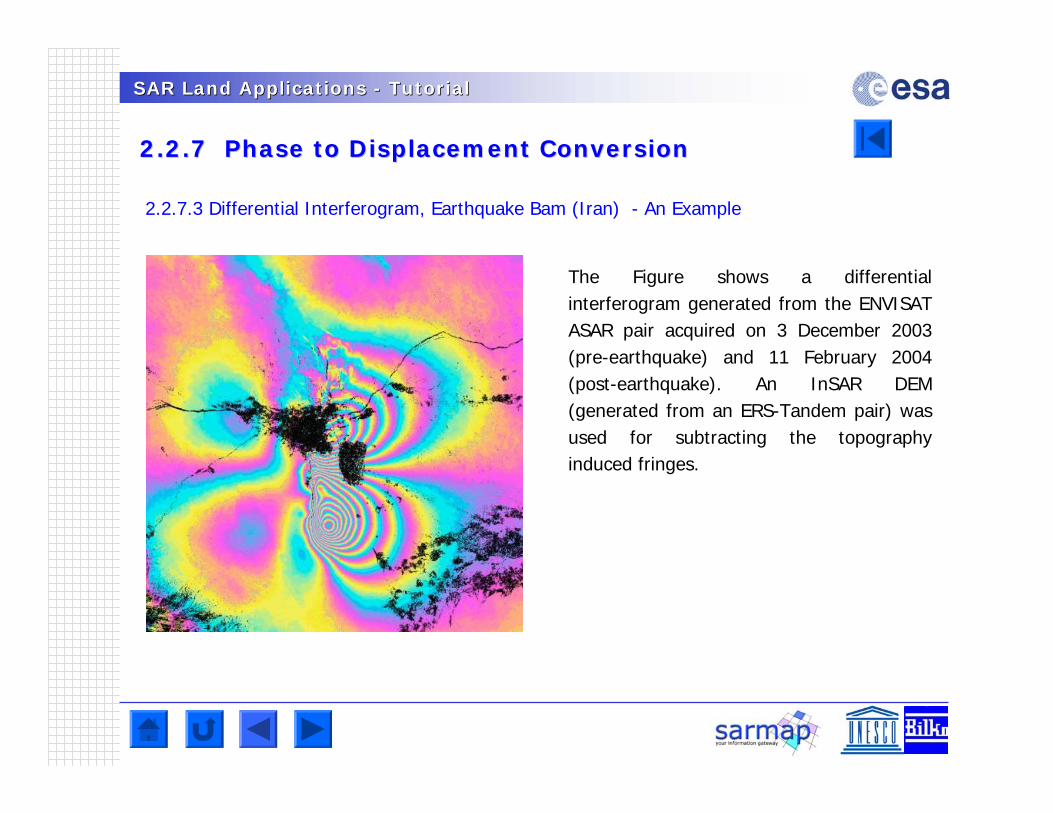
SAR Land Applications SAR Land Applications -- TutorialTutorial
2.2.7 Phase to Displacement Conversion2.2.7 Phase to Displacement Conversion
2.2.7.3 Differential Interferogram, Earthquake Bam (Iran) - An Example
The Figure shows a differential interferogram generated from the ENVISAT ASAR pair acquired on 3 December 2003 (pre-earthquake) and 11 February 2004 (post-earthquake). An InSAR DEM (generated from an ERS-Tandem pair) was used for subtracting the topography induced fringes.
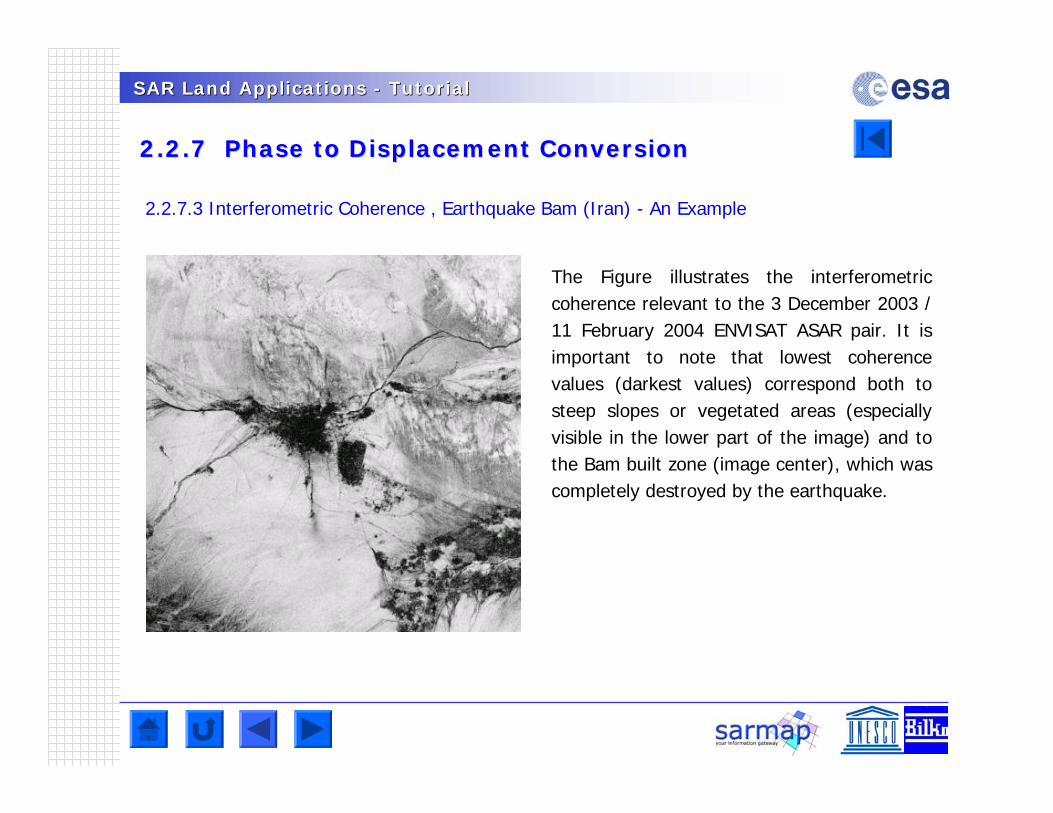
SAR Land Applications SAR Land Applications -- TutorialTutorial
2.2.7 Phase to Displacement Conversion2.2.7 Phase to Displacement Conversion
2.2.7.3 Interferometric Coherence , Earthquake Bam (Iran) - An Example
The Figure illustrates the interferometriccoherence relevant to the 3 December 2003 / 11 February 2004 ENVISAT ASAR pair. It is important to note that lowest coherence values (darkest values) correspond both to steep slopes or vegetated areas (especially visible in the lower part of the image) and to the Bam built zone (image center), which was completely destroyed by the earthquake.
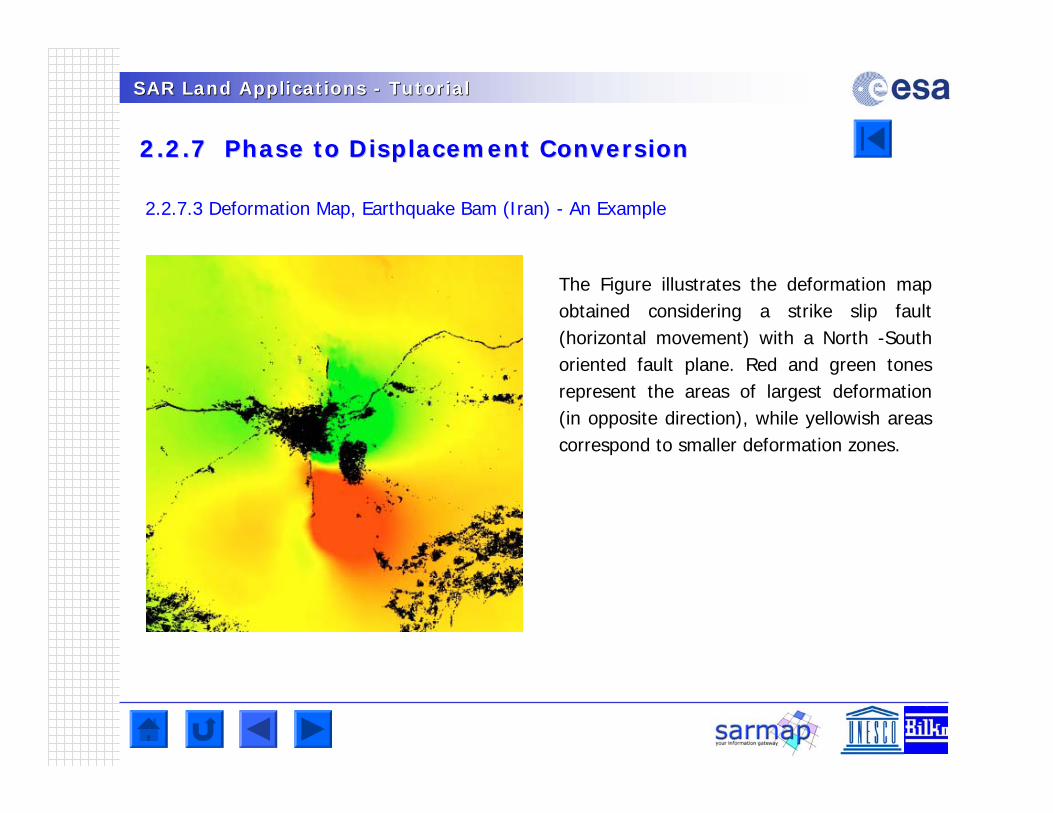
SAR Land Applications SAR Land Applications -- TutorialTutorial
2.2.7 Phase to Displacement Conversion2.2.7 Phase to Displacement Conversion
2.2.7.3 Deformation Map, Earthquake Bam (Iran) - An Example
The Figure illustrates the deformation map obtained considering a strike slip fault (horizontal movement) with a North -South oriented fault plane. Red and green tones represent the areas of largest deformation (in opposite direction), while yellowish areas correspond to smaller deformation zones.
SAR Land Applications SAR Land Applications -- TutorialTutorial
2.2.7 Phase to Displacement Conversion2.2.7 Phase to Displacement Conversion
Questions
Q1What are pros and cons of DInSAR using C- and L-band data?
SAR Land Applications SAR Land Applications -- TutorialTutorial
3. What are Appropriate Land Applications?3. What are Appropriate Land Applications?
Some ExamplesSome Examples
3.1 Agriculture monitoring3.1 Agriculture monitoring
3.2 Aquaculture mapping3.2 Aquaculture mapping
3.3 Digital Elevation Model3.3 Digital Elevation Model
3.4 Flood mapping3.4 Flood mapping
3.5 Forest mapping3.5 Forest mapping
3.6 Geomorphology3.6 Geomorphology
3.7 Monitoring of Land Subsidence3.7 Monitoring of Land Subsidence
3.8 Subsidence3.8 Subsidence Monitoring of Building SinkingMonitoring of Building Sinking
3.9 Rice mapping3.9 Rice mapping
3.10 Snow mapping3.10 Snow mapping
3.11 Urban mapping3.11 Urban mapping
3.12 Wetlands mapping3.12 Wetlands mapping
SAR Land Applications SAR Land Applications -- TutorialTutorial
3.1 Agriculture Monitoring3.1 Agriculture Monitoring
3.1.1 Purpose
Reliable and objective information on cropped area is important to farmers, local and national agencies responsible for crop subsidies and food security, as well as for traders and re-insurers. In the past years it has been shown that SAR based products can provide information on field processing conditions like ploughing, field preparation etc. and on crop growth status such as planting, emerging, flowering, plant maturity, harvest time, and frost conditions. These products - complemented with optical based products (such as chlorophyll, leaf area index, salinity, vegetation indexes, etc.) - offer a suite of information which will allow better management of both the cropped areas but also of the environment.
3.1.2 Method
The basic idea behind the generation of useful information for agriculture using SAR techniques is the analysis of changes in the acquired data over time. Measurements of temporal changes in reflectivity relate in primisi) to transitions in surface roughness, which are indicative of soil tillage, and, while crop-specific, useful in further specification of crop classes, and laterii) to the phenological crop’s status.
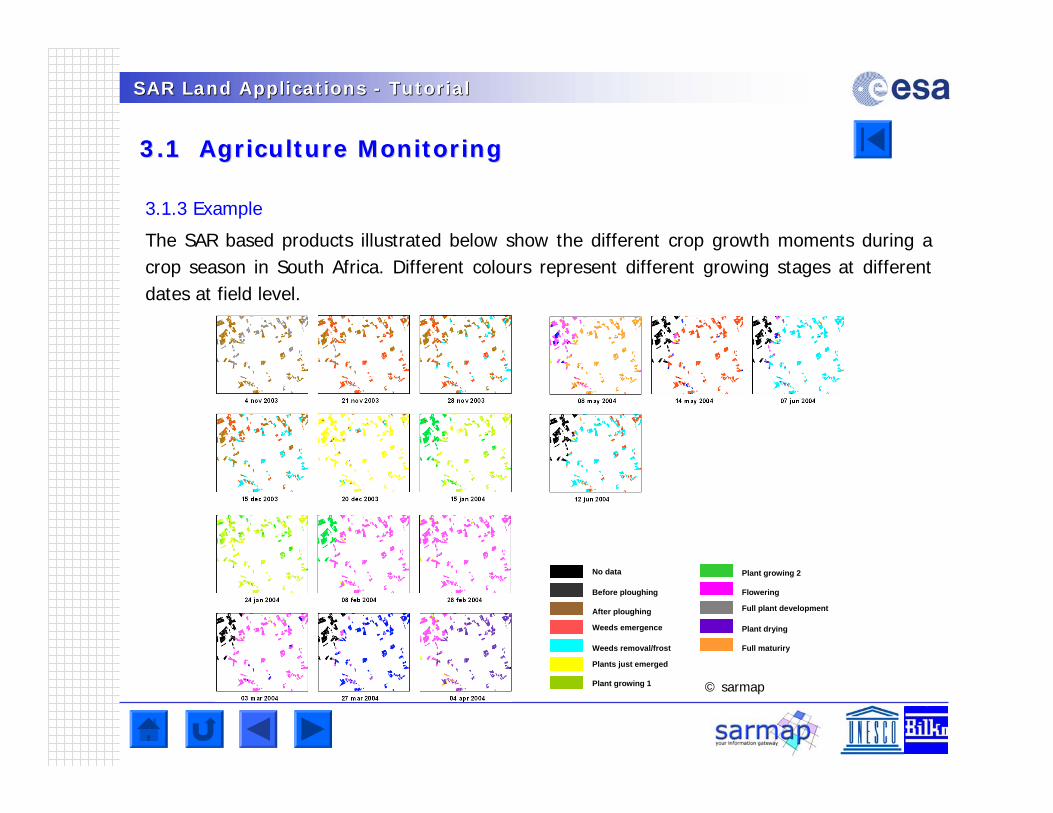
SAR Land Applications SAR Land Applications -- TutorialTutorial
3.1 Agriculture Monitoring3.1 Agriculture Monitoring
3.1.3 Example
The SAR based products illustrated below show the different crop growth moments during a crop season in South Africa. Different colours represent different growing stages at different dates at field level.
No data
Before ploughing
After ploughing
Weeds emergence
Weeds removal/frost
Plants just emerged
Plant growing 1
Flowering
Plant drying
Plant growing 2
Full plant development
Full maturiry
© sarmap
SAR Land Applications SAR Land Applications -- TutorialTutorial
3.2 Aquaculture Mapping3.2 Aquaculture Mapping
3.2.1 Purpose
Inventory and monitoring of shrimp farms are essential tools for decision-making on aquaculture development, including regulatory laws, environmental protection and revenue collection. In the context of government aquaculture development policy, much attention is focused on the identification and monitoring of the expansion of shrimp farms. Therefore, the availability of an accurate, fast and mainly objective methodology that also allows the observation of remote areas assumes a great value.
3.2.2 Method
The identification of shrimp farms on SAR images is based on several elements: i) the radar backscatter received from the water surface of the ponds and from their surrounding dykes, ii) the shape of the individual ponds, andiii) the pattern of groups of ponds and the relative direction of the dykes vis-à-vis the incoming radar beam. The location of shrimp farms is also typical, thus the analysis of their position and of the former land use of the area is necessary to verify the identification.
SAR Land Applications SAR Land Applications -- TutorialTutorial
3.2 Aquaculture Mapping3.2 Aquaculture Mapping
3.2.2 Method
Based on this principle, FAO, has developed a methodology, which considers the following processing steps:
- Pre-processing : Speckle filtering and geocoding
- Water classification : Histogram thresholding
- Boundary detection : Edge detection
- Proximity analysis : The occurrence of highly reflective surfaces around water surfaces is an indication of the presence of shrimp farms. The proximity analysis examines the boundaries of water bodies obtained from the classification, up to a user-specified distance, to locate both highly reflective surfaces in the classified image and edges in the Sobel filtered images. The proximity analysis produces two "summary images" that synthesise the shrimp ponds-related information contained in an ERS SAR image. The summary images allow the operator to locate the areas where there is a greater evidence of the occurrence of shrimp farms, and help in tracing the farms’ boundaries.
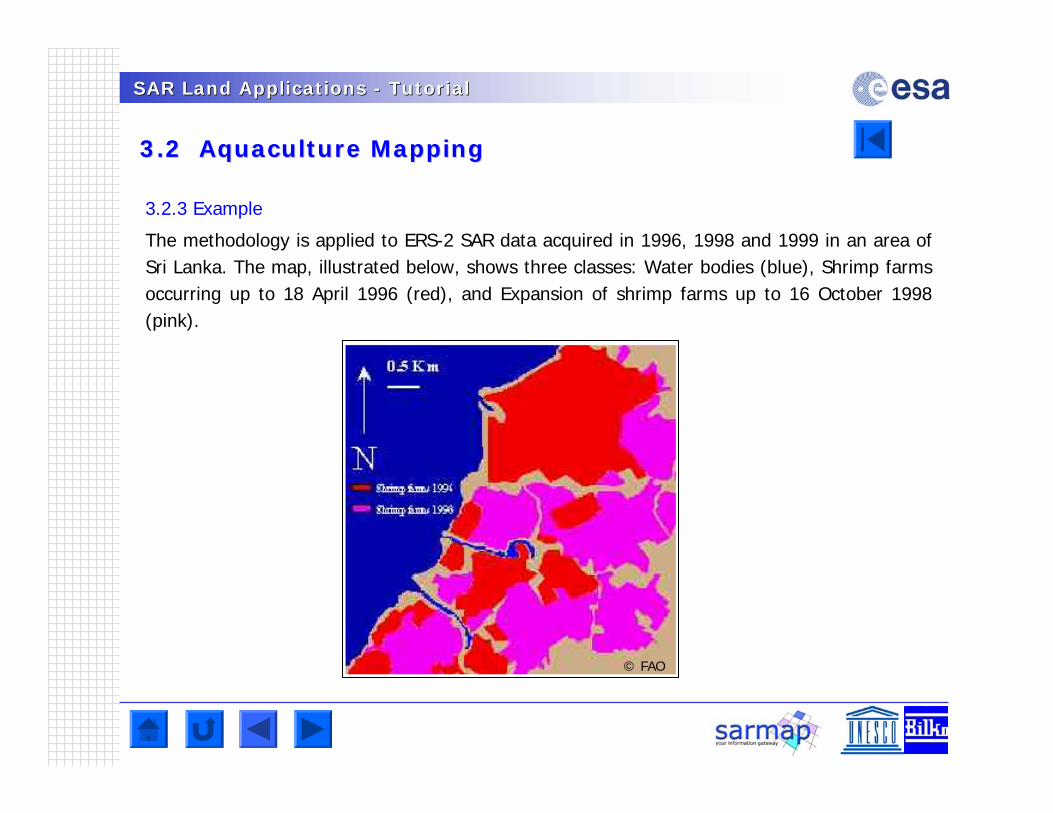
SAR Land Applications SAR Land Applications -- TutorialTutorial
3.2 Aquaculture Mapping3.2 Aquaculture Mapping
3.2.3 Example
The methodology is applied to ERS-2 SAR data acquired in 1996, 1998 and 1999 in an area of Sri Lanka. The map, illustrated below, shows three classes: Water bodies (blue), Shrimp farms occurring up to 18 April 1996 (red), and Expansion of shrimp farms up to 16 October 1998 (pink).
© FAO
SAR Land Applications SAR Land Applications -- TutorialTutorial
3.3 Digital Elevation Model Generation3.3 Digital Elevation Model Generation
3.3.1 Purpose
The Digital Elevation Model product represents a reconstruction of the height of the surface of a selected region. Such surfaces may also be of urban and forested areas, where the tops of buildings or trees are represented, respectively. The product is generated over a regular grid of equidistant points, where the corresponding height is a measure of the average height within the cell. Taking advantage of interferometric techniques it is possible to generate high quality DEM in a semi-automated fashion.
3.3.2 Method
The basic idea for the generation of DEM products is the conversion of interferometric phase information, derived from two SAR acquisitions at different dates from slightly different orbital positions, into heights. In order to obtain accurate products, the SAR data must go through a dedicated processing chain, which carries out data focussing, interferometric processing, geo-referencing and finally mosaicing. For a complete description of the methodology refer to the InSAR Section.
SAR Land Applications SAR Land Applications -- TutorialTutorial
3.3 Digital Elevation Model Generation3.3 Digital Elevation Model Generation
3.3.3 Product’s Accuracy
The achievable resolution with ERS-Tandem data is up to 25 m on the horizontal plane (x-y), while the achievable height accuracy can be summarized as follows:
5-8 metres in flat-moderate rolling areas where high temporal correlation is available (dry areas, sparse vegetation or winter conditions)
10-15 metres in steep topography areas where high temporal correlation is available
Worst accuracy in areas where low temporal correlation is available (large forested or water areas), where the DEM may be reconstructed by interpolation.
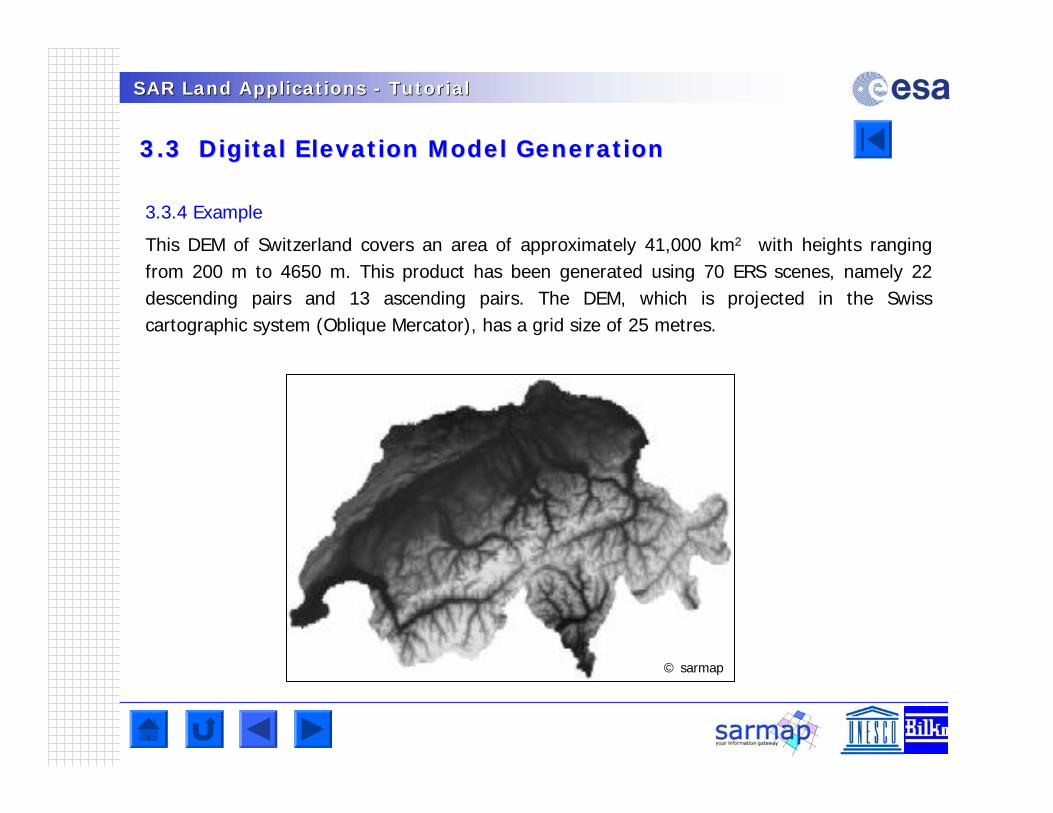
SAR Land Applications SAR Land Applications -- TutorialTutorial
3.3 Digital Elevation Model Generation3.3 Digital Elevation Model Generation
3.3.4 Example
This DEM of Switzerland covers an area of approximately 41,000 km2 with heights ranging from 200 m to 4650 m. This product has been generated using 70 ERS scenes, namely 22 descending pairs and 13 ascending pairs. The DEM, which is projected in the Swiss cartographic system (Oblique Mercator), has a grid size of 25 metres.
© sarmap
SAR Land Applications SAR Land Applications -- TutorialTutorial
3.4 Flood Mapping3.4 Flood Mapping
3.4.1 Purpose
Flooding is a major hydrological hazard which occurs relatively frequently. During the last decade floods have affected approximately 1.5 billion people - more than 75% of the total number of people reported as affected by natural disasters world-wide. Around the world there are on average about 150 serious floods per year, with significant rises in water level ranging from severely overflowing streams, lakes or reservoirs to major ocean-driven disasters in exposed coastal regions. Like droughts, floods are catastrophic events that to some extent follow a natural cycle that is often predictable. Timely information about flood phenomena that may provide strong indicators of a forthcoming disaster can often help to track and identify the areas that will be affected most severely.
3.4.2 Method
The SAR can easily detect water-covered areas, characterised by a much lower intensity than any other feature in the surroundings. The main limitations are induced by the presence of nearby vegetation cover or the presence of wind, but change detection techniques using SAR acquisitions from different dates (in the normal conditions and during the flood), prove to be a robust way to overcome these difficulties.
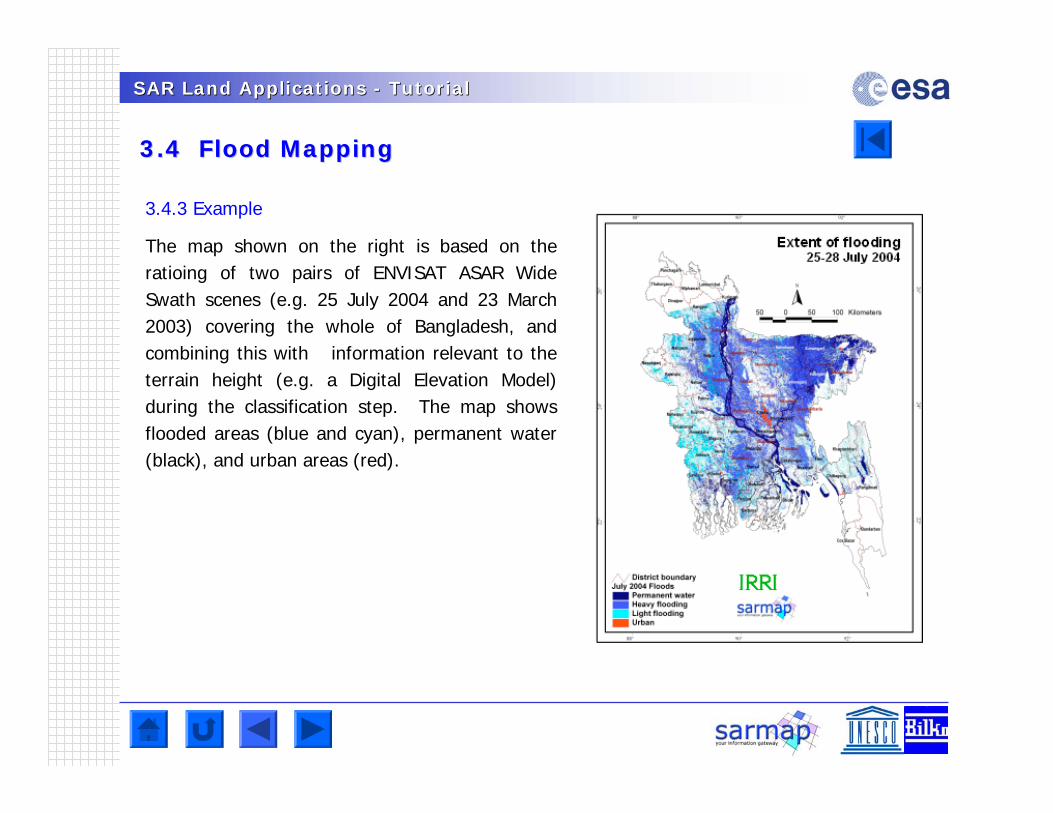
SAR Land Applications SAR Land Applications -- TutorialTutorial
3.4 Flood Mapping3.4 Flood Mapping
3.4.3 Example
The map shown on the right is based on the ratioing of two pairs of ENVISAT ASAR Wide Swath scenes (e.g. 25 July 2004 and 23 March 2003) covering the whole of Bangladesh, and combining this with information relevant to the terrain height (e.g. a Digital Elevation Model) during the classification step. The map shows flooded areas (blue and cyan), permanent water (black), and urban areas (red).
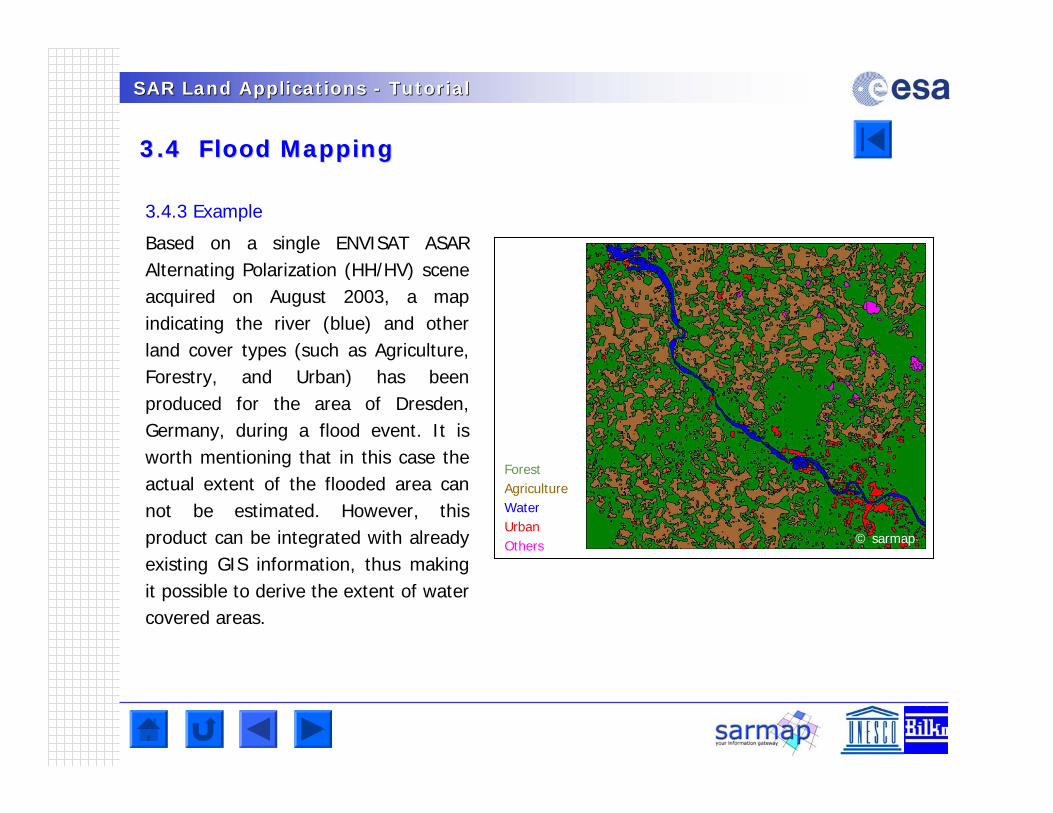
SAR Land Applications SAR Land Applications -- TutorialTutorial
3.4 Flood Mapping3.4 Flood Mapping
3.4.3 Example
Based on a single ENVISAT ASAR Alternating Polarization (HH/HV) scene acquired on August 2003, a map indicating the river (blue) and other land cover types (such as Agriculture, Forestry, and Urban) has been produced for the area of Dresden, Germany, during a flood event. It is worth mentioning that in this case the actual extent of the flooded area can not be estimated. However, this product can be integrated with already existing GIS information, thus making it possible to derive the extent of water covered areas.
ForestAgricultureWaterUrbanOthers © sarmap
SAR Land Applications SAR Land Applications -- TutorialTutorial
3.5 Forest Mapping3.5 Forest Mapping
3.5.1 Purpose
Earth Observation has demonstrated that it can offer useful information for forestryapplications, especially in cases of major forest change such as that caused by severe stormsor fires. Using low spatial resolution optical imagery from sensors such as NOAA AVHRR, ERS ATSR-1/2, ENVISAT AATSR and SPOT-VEGETATION, active fire maps are generated for large regions and even the whole globe. Given their low spatial resolution (approximately 1 km), these sensors are not suitable for deriving burn scars. The most popular sensors to date for responding to such needs are the Enhanced Thematic Mapper (ETM+), the Thematic Mapper(TM) – both on board the Landsat satellites – and SPOT-4/5 High Resolution instruments. With spatial resolutions ranging from 30 to 5 metres, such imagery can provide accurate estimates of the burnt area, as it is relatively easy to discriminate burned from non-burned areas, at least in certain vegetation types. However, these instruments have a major drawback in that it can be difficult to get imagery in areas with long periods of significant cloud cover. This applies in particular to tropical and boreal regions. In these situations, the possibility of exploiting highspatial resolution (10 to 25 metres) SAR data provides great advantages over optical sensors, because data acquired from active microwave systems are not affected by water vapour, smoke or clouds.
SAR Land Applications SAR Land Applications -- TutorialTutorial
3.5 Forest Mapping3.5 Forest Mapping
3.5.2 Method
The basic methodology for using SAR data to detect forest burn scars relies on change detection, comparing data acquired after a fire with reference data obtained beforehand. With this objective, applications relying on SAR data traditionally based on amplitude images may be fruitfully extended by exploiting interferometric techniques. A benefit of repeat-pass SAR interferometry is the feasibility of exploiting coherence information as well as the usual backscattering coefficient information and backscattering coefficient variation between the two acquisition times.
Change detection based on amplitude images may be implemented by using ratioing. This multi-temporal change approach, which tracks changes in SAR backscatter over time using multiple images, makes it possible to distinguish different land-cover types and changes in these, based on their unique temporal signatures. One drawback of this method is that multiple acquisitions are required, and that they must be available at key points in the phenologicalcycle of the different land-cover types. More importantly, for mapping changes after a disaster event, images must be available soon afterwards (maximum 1-2 months), in order to maximise the information retrieved from the imagery. Coherence information can add supporting evidence to this approach, and may also give additional information suitable to produce a reference forest-non forest map and to help the subsequent classification.
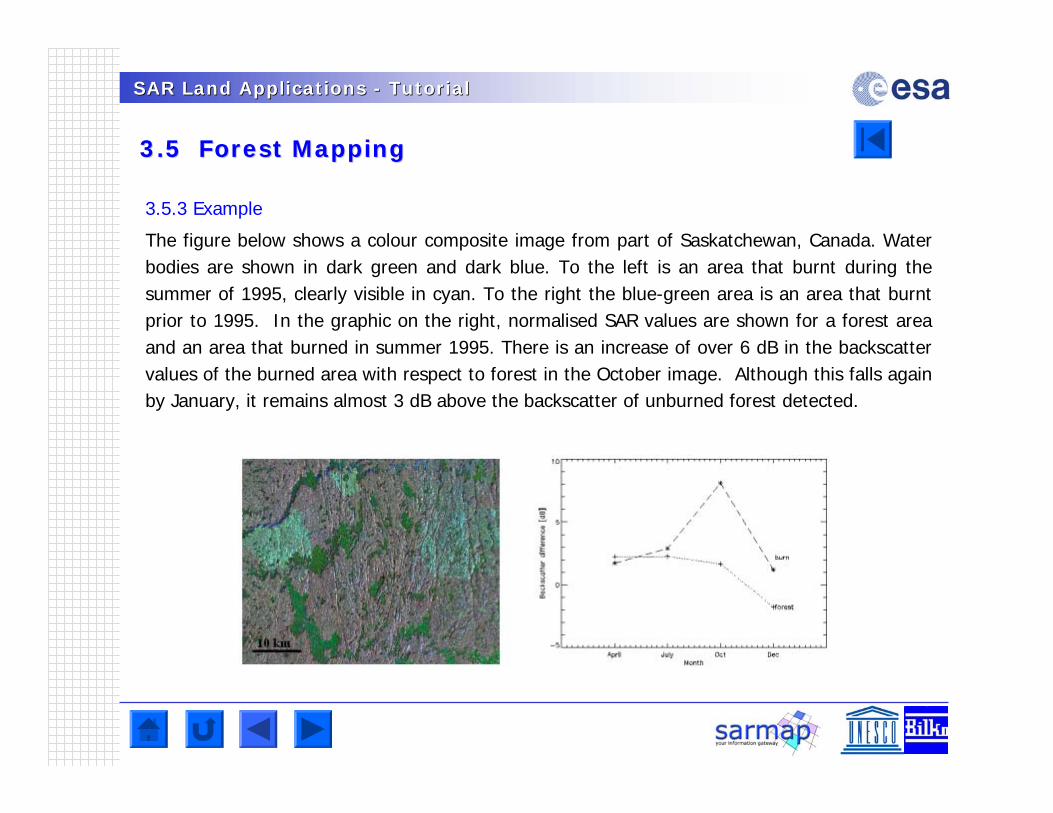
SAR Land Applications SAR Land Applications -- TutorialTutorial
3.5 Forest Mapping3.5 Forest Mapping
3.5.3 Example
The figure below shows a colour composite image from part of Saskatchewan, Canada. Water bodies are shown in dark green and dark blue. To the left is an area that burnt during the summer of 1995, clearly visible in cyan. To the right the blue-green area is an area that burnt prior to 1995. In the graphic on the right, normalised SAR values are shown for a forest area and an area that burned in summer 1995. There is an increase of over 6 dB in the backscatter values of the burned area with respect to forest in the October image. Although this falls again by January, it remains almost 3 dB above the backscatter of unburned forest detected.
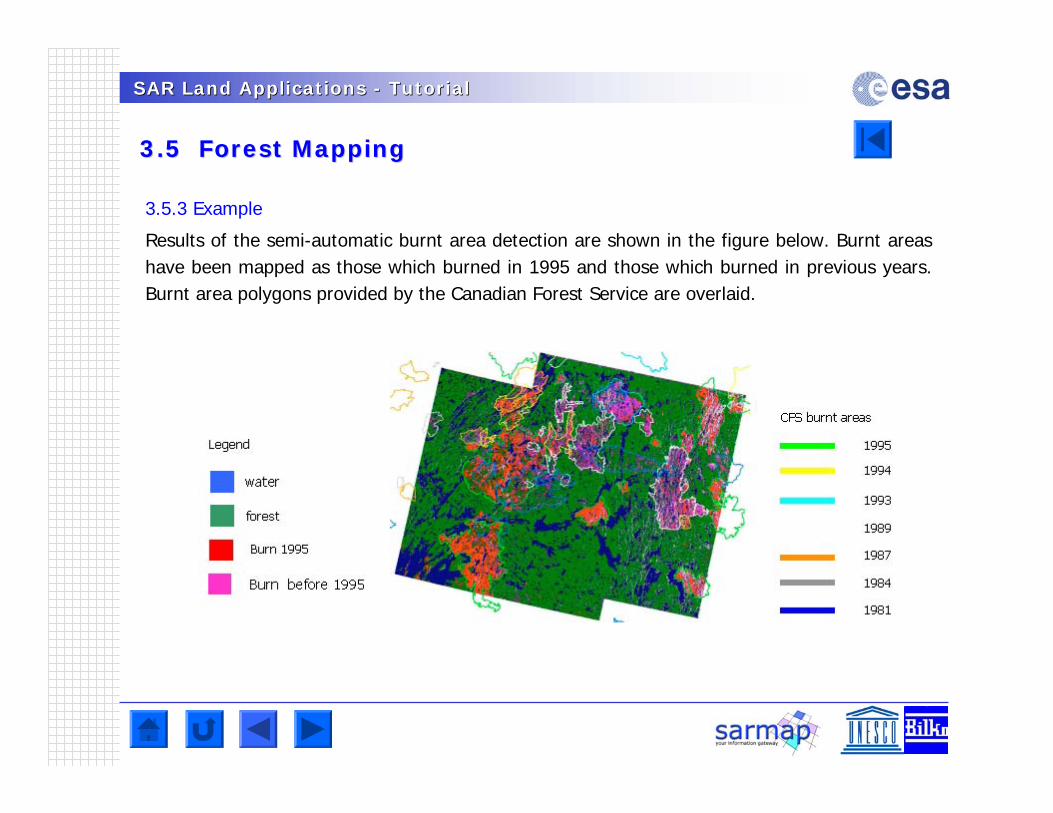
SAR Land Applications SAR Land Applications -- TutorialTutorial
3.5 Forest Mapping3.5 Forest Mapping
3.5.3 Example
Results of the semi-automatic burnt area detection are shown in the figure below. Burnt areas have been mapped as those which burned in 1995 and those which burned in previous years. Burnt area polygons provided by the Canadian Forest Service are overlaid.
© sarmap
SAR Land Applications SAR Land Applications -- TutorialTutorial
3.6 Geomorphology3.6 Geomorphology
3.6.1 Purpose
Earth Observation data are particularly appropriate for mapping morphological features such as morpholineaments, which are important factors determining geomorphological structures and geologically active areas. Due to the monostatic acquisition mode of radar systems, SAR images in particular are well suited for morpholineament mapping.
3.6.2 Method
The combination of orthorectified optical (multi-spectral) and terrain geocoded SAR images is a simple and suitable methodology to identify morpholineaments, uplift/subsidence evidence, drainage patterns, active fault systems, ductile structures, etc. A common way to generate such a product is based on the transformation of a multispectral image (e.g. Landsat TM), which is in the Red Green Blue (RGB) system, into an Intensity, Hue, and Saturation (IHS) system. Subsequently the SAR image, whose information is primarily represented by its texture, replaces the Intensity channel before re-transforming into the RGB colour system.
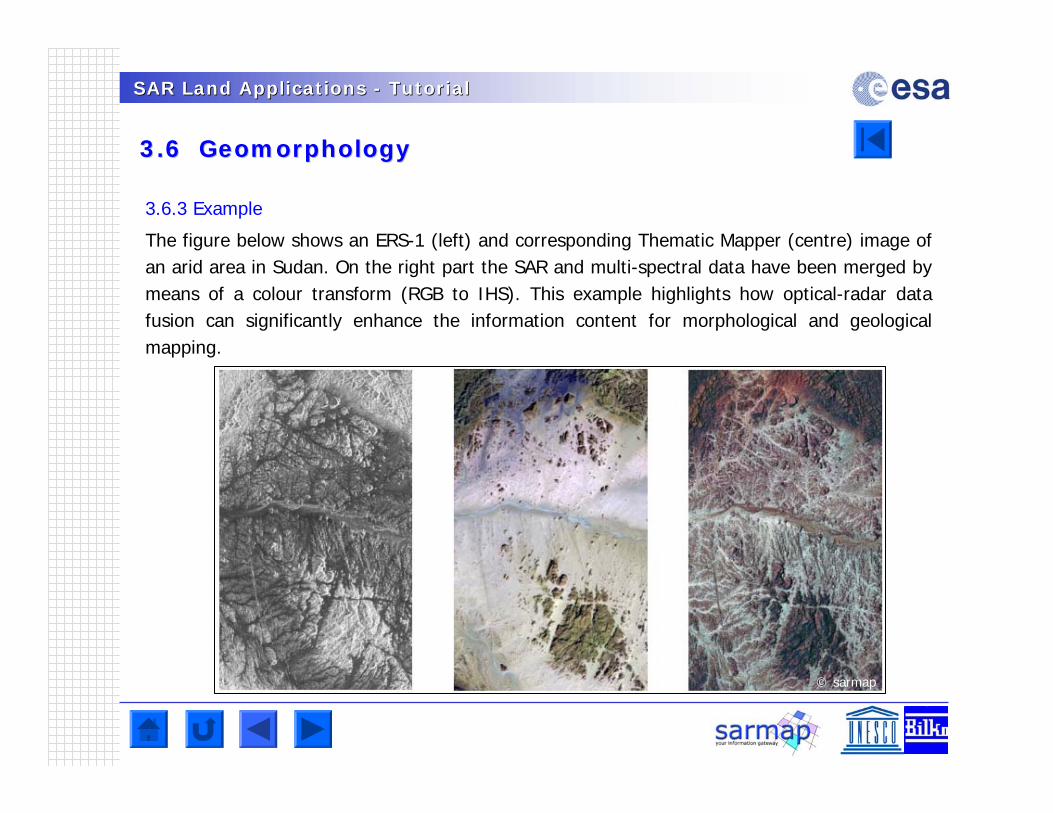
SAR Land Applications SAR Land Applications -- TutorialTutorial
3.6 Geomorphology3.6 Geomorphology
3.6.3 Example
The figure below shows an ERS-1 (left) and corresponding Thematic Mapper (centre) image of an arid area in Sudan. On the right part the SAR and multi-spectral data have been merged by means of a colour transform (RGB to IHS). This example highlights how optical-radar data fusion can significantly enhance the information content for morphological and geological mapping.
© sarmap
SAR Land Applications SAR Land Applications -- TutorialTutorial
3.7 Monitoring of Land Subsidence3.7 Monitoring of Land Subsidence
3.7.1 Purpose
Ground subsidence is a phenomenon caused by natural or man-induced compaction of unconsolidated sediments. Its effect is a sinking of the ground surface. In many cases this is a consequence of the extraction of ground water, geothermal fluids, coal, gold and other general mining activity. Due to the rapidly increasing use of underground natural resources such as water, oil and gas, most of the major subsidence areas around the world have developed at accelerated rates in the past years. Two traditional methods for detecting this are based on direct measurements, such as levelling and GPS techniques. However, there are two important problems in the use of these approaches:
i) the cost of the instrumentation, and ii) the difficulty to extrapolate point measures over wide areas.
3.7.2 Method
The basic idea for the generation of land subsidence products is the conversion of differential interferometric phase information, derived from three or more SAR acquisitions at different dates from slightly different orbital positions, into displacements (so-called conventional DInSAR technique) as presented in the DInSAR Section.
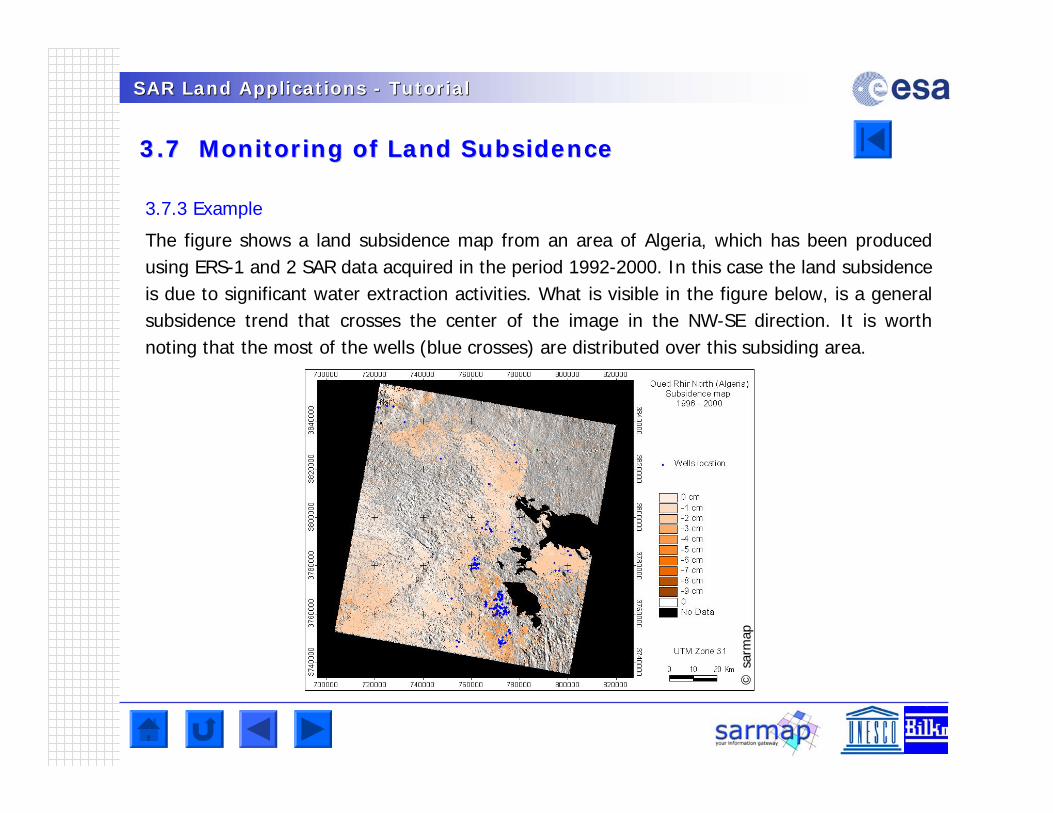
SAR Land Applications SAR Land Applications -- TutorialTutorial
3.7 Monitoring of Land Subsidence3.7 Monitoring of Land Subsidence
3.7.3 Example
The figure shows a land subsidence map from an area of Algeria, which has been produced using ERS-1 and 2 SAR data acquired in the period 1992-2000. In this case the land subsidence is due to significant water extraction activities. What is visible in the figure below, is a general subsidence trend that crosses the center of the image in the NW-SE direction. It is worth noting that the most of the wells (blue crosses) are distributed over this subsiding area.
©sa
rmap
SAR Land Applications SAR Land Applications -- TutorialTutorial
3.8 Monitoring of Building Sinking3.8 Monitoring of Building Sinking
3.8.1 Purpose
As for land subsidence.
3.8.2 Method
The Permanent Scatterer (PS) method (PSInSARTM), developed by Politecnico di Milano(POLIMI) and TRE (a POLIMI spin-off), is a new approach introduced to improve the ability to determine mm-scale displacements of individual features on the ground. It uses all data collected by a SAR system over the target area. As long as a significant number and density of independent radar-bright and radar-phase stable points (i.e. permanent scatterers) exist within a radar scene and enough radar acquisitions have been collected, displacement time series and range-change rates can be calculated.
Using the PS method, surface motions can be resolved at a level of ~0.5 mm/yr. This resolves very small-scale features, including motions of individual targets/structures (e.g. a bridge or a dam), not previously recognised in conventional DInSAR. PS usually correspond to buildings, metallic objects, outcrops, exposed rocks, etc. exhibiting a ‘radar signature’ that is constant with time. Once these ‘radar benchmarks’ have been identified from a time series of data, very accurate displacement histories can be obtained for the period 1992 to the present. The effect is akin to suddenly having a dense GPS network retrospectively available for the last ten years in any moderately urbanised area (at least areas where ERS SAR data have been collected).
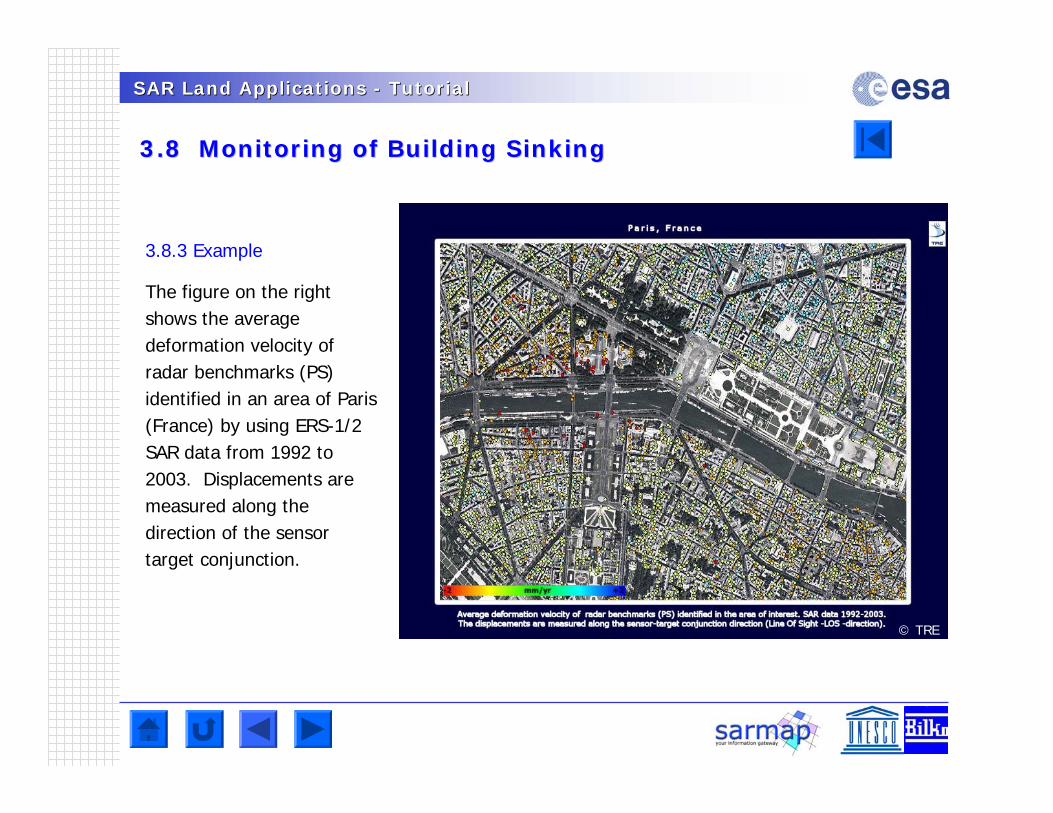
SAR Land Applications SAR Land Applications -- TutorialTutorial
3.8 Monitoring of Building Sinking3.8 Monitoring of Building Sinking
3.8.3 Example
The figure on the right shows the average deformation velocity of radar benchmarks (PS) identified in an area of Paris (France) by using ERS-1/2 SAR data from 1992 to 2003. Displacements are measured along the direction of the sensor target conjunction.
© TRE
SAR Land Applications SAR Land Applications -- TutorialTutorial
3.9 Rice Mapping3.9 Rice Mapping
3.9.1 Purpose
Rice is the most important food crop in developing countries, which still produce 1.6 times as much rice as wheat, the second most important staple. Recent projections made by the International Food Policy Research Institute show that the demand for rice will increase by about 1.8% per year over the 1990-2020 period. This means that over the period of the next 30 years, rice consumption will increase by nearly 70%, and Asian rice production must increase to about 840 million tons by the year 2025, from the present level of about 490 million tons, if rice prices are to be maintained at current levels.
3.9.2 Method
The basic idea behind the generation of rice acreage statistics using SAR techniques is the analysis of changes in the acquired data over time. Measurement of temporal changes of SAR response leads to the identification of the areas subject to transplanting / emergence moment, since an increase in the SAR backscatter corresponds to a growth in the rice plants.
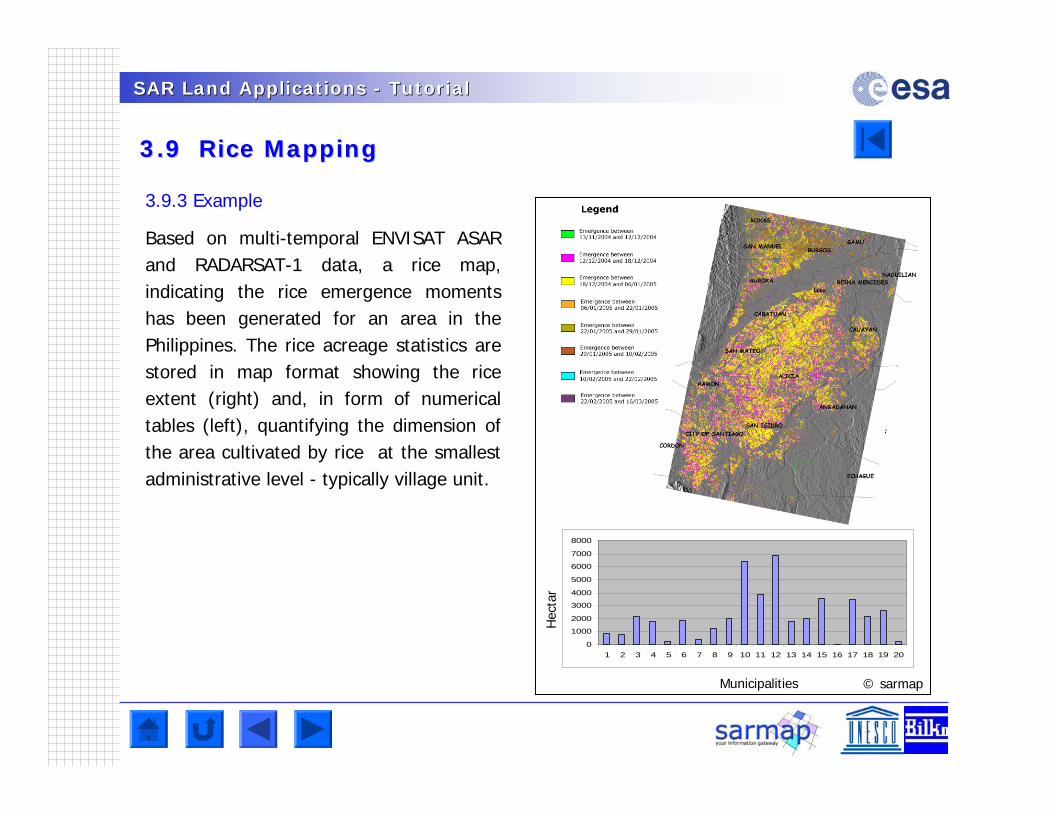
SAR Land Applications SAR Land Applications -- TutorialTutorial
3.9 Rice Mapping3.9 Rice Mapping
3.9.3 Example
Based on multi-temporal ENVISAT ASAR and RADARSAT-1 data, a rice map, indicating the rice emergence moments has been generated for an area in the Philippines. The rice acreage statistics are stored in map format showing the rice extent (right) and, in form of numerical tables (left), quantifying the dimension of the area cultivated by rice at the smallest administrative level - typically village unit.
© sarmap
0
1000
2000
3000
4000
5000
6000
7000
8000
1 2 3 4 5 6 7 8 9 10 11 12 13 14 15 16 17 18 19 20
Hec
tar
Municipalities
SAR Land Applications SAR Land Applications -- TutorialTutorial
3.10 Snow Mapping3.10 Snow Mapping
3.10.1 Purpose
The extent of snow covered area is a key parameter for predicting snowmelt runoff. Because SAR sensors provide repeat pass observations irrespective of cloud cover, they are of interest for operational snowmelt runoff modelling and forecasting.
3.10.2 Method
The methodology for mapping melting snow, developed by the University of Innsbruck, is based on repeat pass images in the C-band SAR and applies change detection to eliminate the topographic effects of backscattering. At C-band dry snow is transparent and backscattering from the rough surfaces below the packed snow dominates. This is the reason why the return signals from dry snow and snow-free areas are very similar. When the snow becomes wet, backscattering decreases significantly. Wet snow can therefore be distinguished from dry snow or snow- free conditions using analysis of temporal backscatter changes.
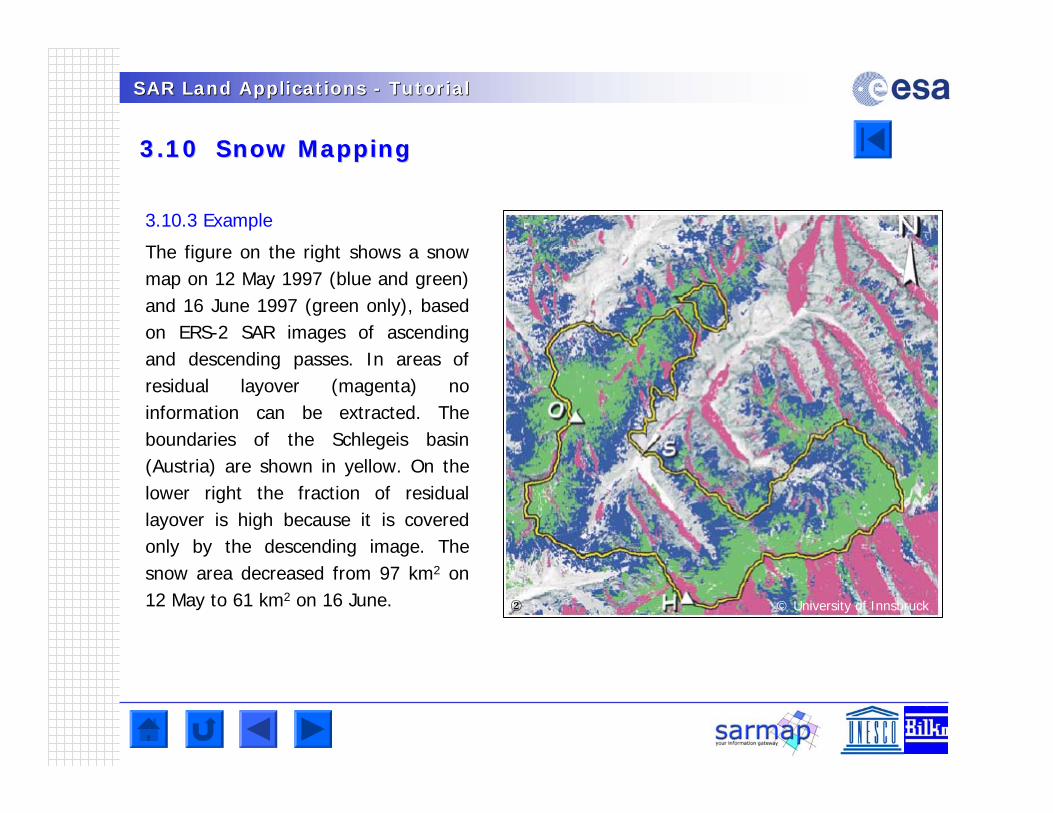
SAR Land Applications SAR Land Applications -- TutorialTutorial
3.10 Snow Mapping3.10 Snow Mapping
3.10.3 Example
The figure on the right shows a snow map on 12 May 1997 (blue and green) and 16 June 1997 (green only), based on ERS-2 SAR images of ascending and descending passes. In areas of residual layover (magenta) no information can be extracted. The boundaries of the Schlegeis basin (Austria) are shown in yellow. On the lower right the fraction of residual layover is high because it is covered only by the descending image. The snow area decreased from 97 km2 on 12 May to 61 km2 on 16 June. © University of Innsbruck
SAR Land Applications SAR Land Applications -- TutorialTutorial
3.11 Urban Mapping3.11 Urban Mapping
3.11.1 Purpose
Geo-information is by definition spatially related and therefore reliant on mapping. Some sort of base map is the foundation upon which every Geographic Information System (GIS) or geo-spatial service is built. Hence, cartography can be seen as a horizontal element of the geo-information service industry, supplying an input to every processing and application-based chain and for a broad range of thematic applications. Cartographic production chains that exploit both SAR and optical data exist and operate in both the civilian and security sectors.
3.11.2 Method
Urban areas are difficult to analyse, primarily due to the many different land cover types (e.g. streets, buildings, parks, etc.), each of which have their own shape, geometry and dimension characteristics. The methodology developed by the University of Pavia, which makes it possible to identify different classes depending upon building density, uses a texture analysis approach (i.e. a technique that take into account of the spatial relationship between neighbouring pixels). The extracted features are finally classified using supervised non-parametric classifiers, such as the Fuzzy Artmap.
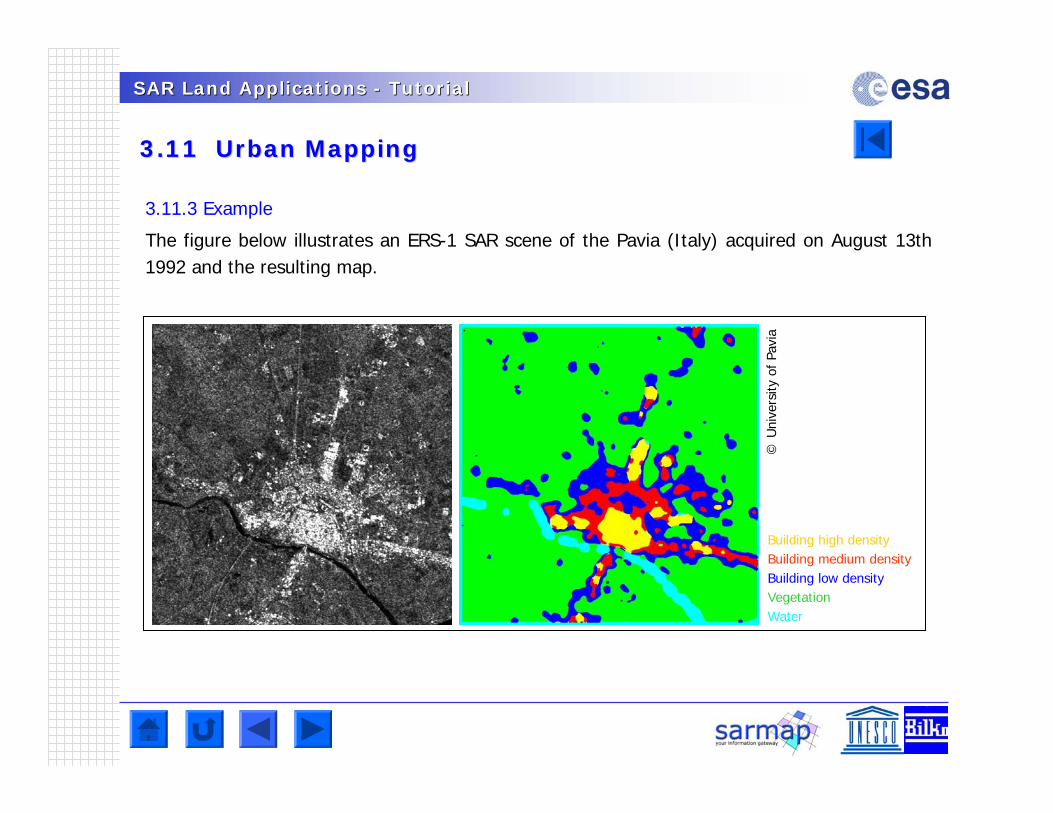
SAR Land Applications SAR Land Applications -- TutorialTutorial
3.11 Urban Mapping3.11 Urban Mapping
3.11.3 Example
The figure below illustrates an ERS-1 SAR scene of the Pavia (Italy) acquired on August 13th 1992 and the resulting map.
©U
nive
rsity
of Pa
via
Building high densityBuilding medium densityBuilding low densityVegetationWater
SAR Land Applications SAR Land Applications -- TutorialTutorial
3.12 Wetlands Mapping3.12 Wetlands Mapping
3.12.1 Purpose
Wetlands are areas where water is the primary factor controlling the environment and the associated plant and animal life. They occur where the water table is at or near the surface of the land, or where the land is covered by shallow water. Half of the world’s wetlands are estimated to have been lost during the 20th century, as land was converted to agricultural and urban areas, or filled to combat diseases such as malaria. The Ramsar Convention provides the framework for international co-operation for the conservation of wetlands. It obliges its parties to designate wetlands of international importance for inclusion in a list of so-called Ramsarsites and to wisely manage the wetlands in their territories.
3.12.2 Method
The primary utilisation of SAR data is in the identification and mapping of open water and flooded vegetation. This information is often used to complement land use/cover analysis (based on optical images), but may also be utilized as a stand alone product. This so-called Water Cycle Regime Product indicates the extent of water at dry and wet periods of the year, and is generated by classifying multi-temporal SAR data.
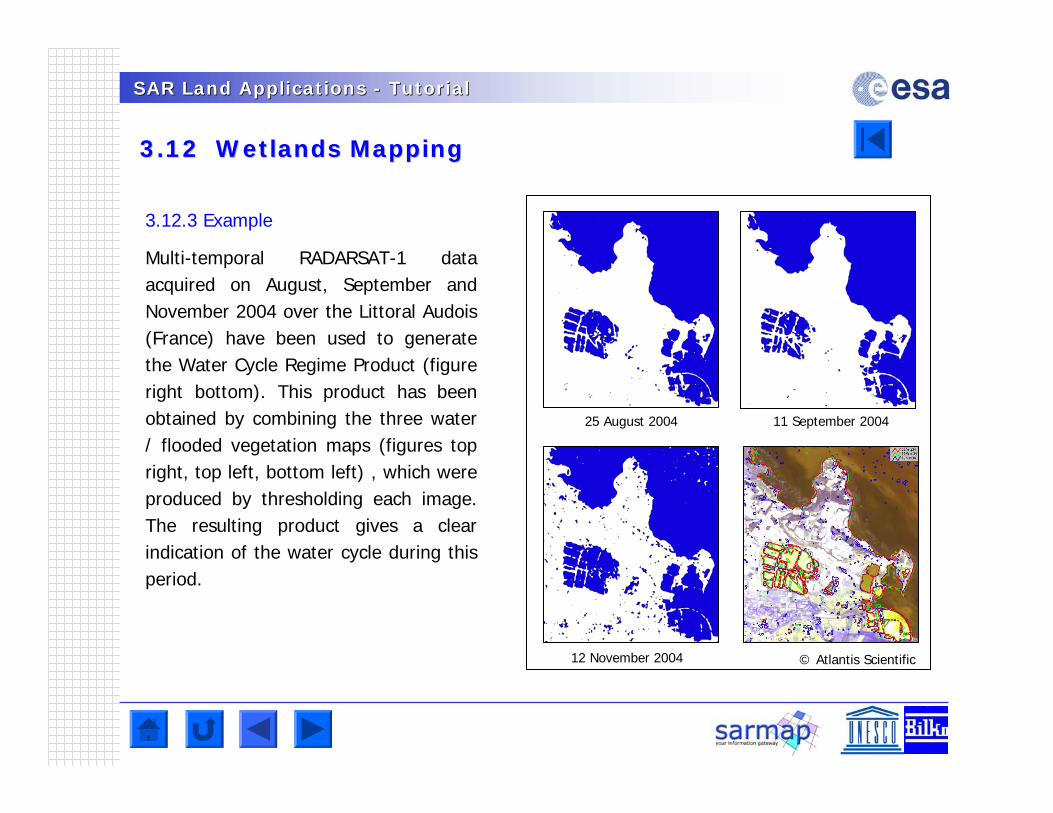
SAR Land Applications SAR Land Applications -- TutorialTutorial
3.12 Wetlands Mapping3.12 Wetlands Mapping
3.12.3 Example
Multi-temporal RADARSAT-1 data acquired on August, September and November 2004 over the Littoral Audois (France) have been used to generate the Water Cycle Regime Product (figure right bottom). This product has been obtained by combining the three water / flooded vegetation maps (figures top right, top left, bottom left) , which were produced by thresholding each image. The resulting product gives a clear indication of the water cycle during this period.
© Atlantis Scientific
25 August 2004 11 September 2004
12 November 2004
SAR Land Applications SAR Land Applications -- TutorialTutorial
4. What are Recent, Operational and 4. What are Recent, Operational and FutureFuture SpaceborneSpaceborne SAR SAR Sensors?Sensors?
4.1 ERS4.1 ERS--1 and 2 SAR1 and 2 SAR
4.2 JERS4.2 JERS--1 SAR1 SAR
4.3 RADARSAT4.3 RADARSAT--11
4.4 SRTM4.4 SRTM
4.5 ENVISAT ASAR4.5 ENVISAT ASAR
4.6 ALOS PALSAR4.6 ALOS PALSAR
4.7 4.7 TerraSARTerraSAR--XX
4.8 RADARSAT4.8 RADARSAT--22
4.9 RISAT 4.9 RISAT
4.10 COSMO4.10 COSMO--SkyMedSkyMed
4.11 SENTINEL4.11 SENTINEL--1 1
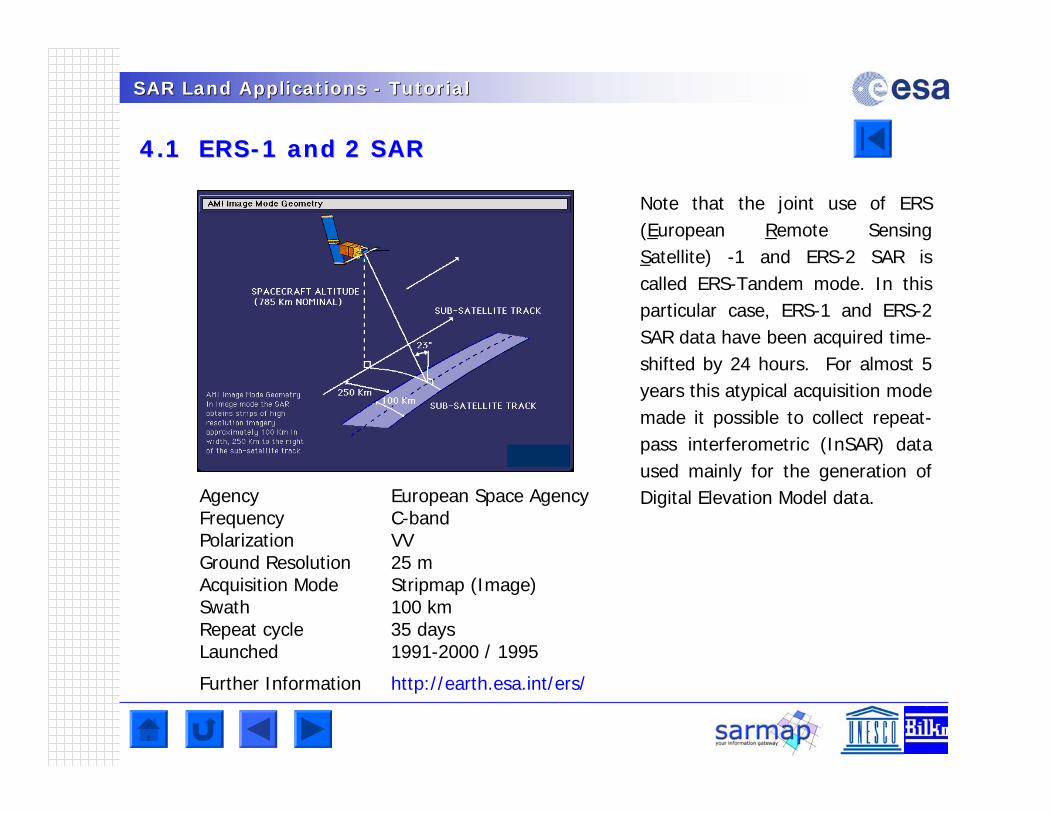
SAR Land Applications SAR Land Applications -- TutorialTutorial
4.1 ERS4.1 ERS--1 and 2 SAR1 and 2 SAR
Agency European Space AgencyFrequency C-bandPolarization VVGround Resolution 25 mAcquisition Mode Stripmap (Image)Swath 100 kmRepeat cycle 35 daysLaunched 1991-2000 / 1995
Further Information http://earth.esa.int/ers/
Note that the joint use of ERS (European Remote Sensing Satellite) -1 and ERS-2 SAR is called ERS-Tandem mode. In this particular case, ERS-1 and ERS-2 SAR data have been acquired time-shifted by 24 hours. For almost 5 years this atypical acquisition mode made it possible to collect repeat-pass interferometric (InSAR) data used mainly for the generation of Digital Elevation Model data.
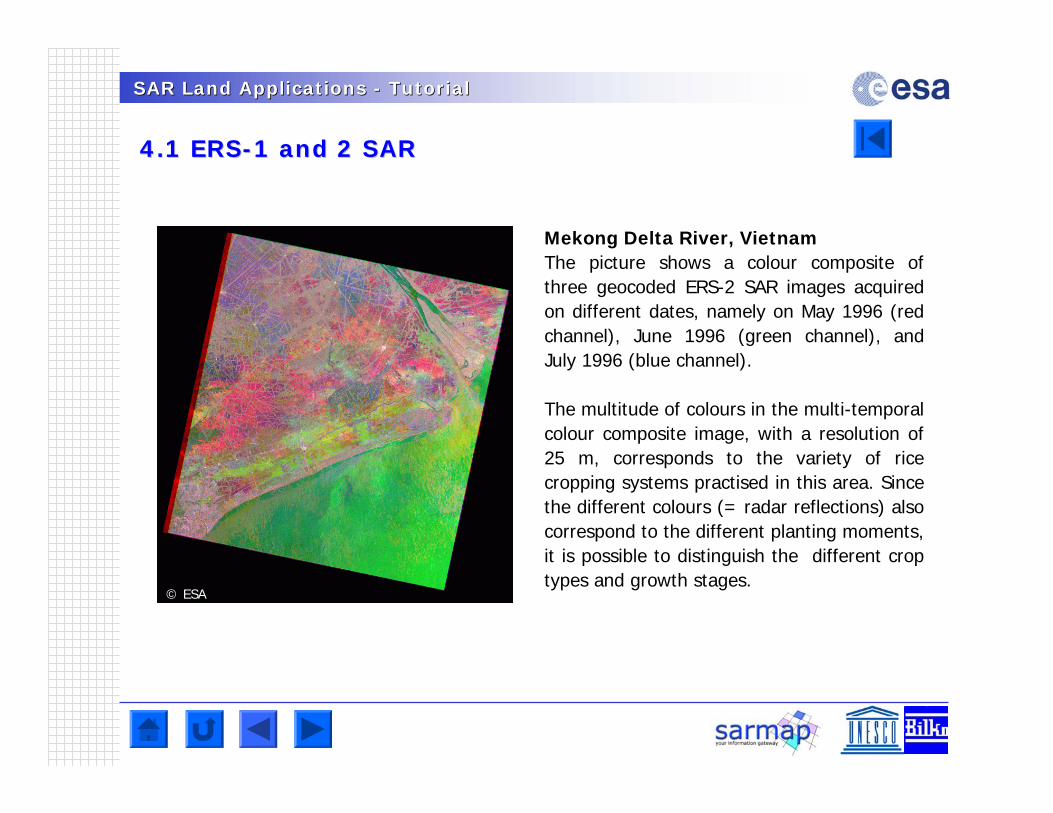
SAR Land Applications SAR Land Applications -- TutorialTutorial
4.1 ERS4.1 ERS--1 and 2 SAR1 and 2 SAR
Mekong Delta River, VietnamThe picture shows a colour composite of three geocoded ERS-2 SAR images acquired on different dates, namely on May 1996 (red channel), June 1996 (green channel), and July 1996 (blue channel).
The multitude of colours in the multi-temporal colour composite image, with a resolution of 25 m, corresponds to the variety of rice cropping systems practised in this area. Since the different colours (= radar reflections) also correspond to the different planting moments, it is possible to distinguish the different crop types and growth stages.
© ESA
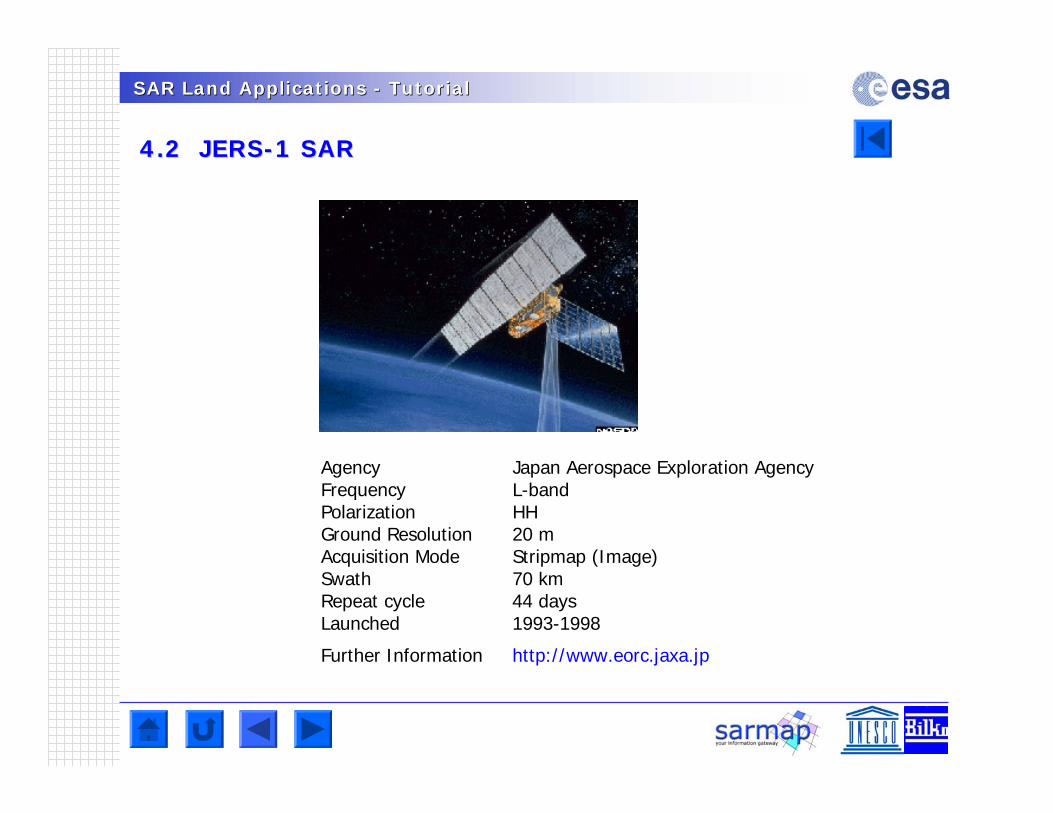
SAR Land Applications SAR Land Applications -- TutorialTutorial
4.2 JERS4.2 JERS--1 SAR1 SAR
Agency Japan Aerospace Exploration AgencyFrequency L-bandPolarization HHGround Resolution 20 mAcquisition Mode Stripmap (Image)Swath 70 kmRepeat cycle 44 daysLaunched 1993-1998
Further Information http://www.eorc.jaxa.jp
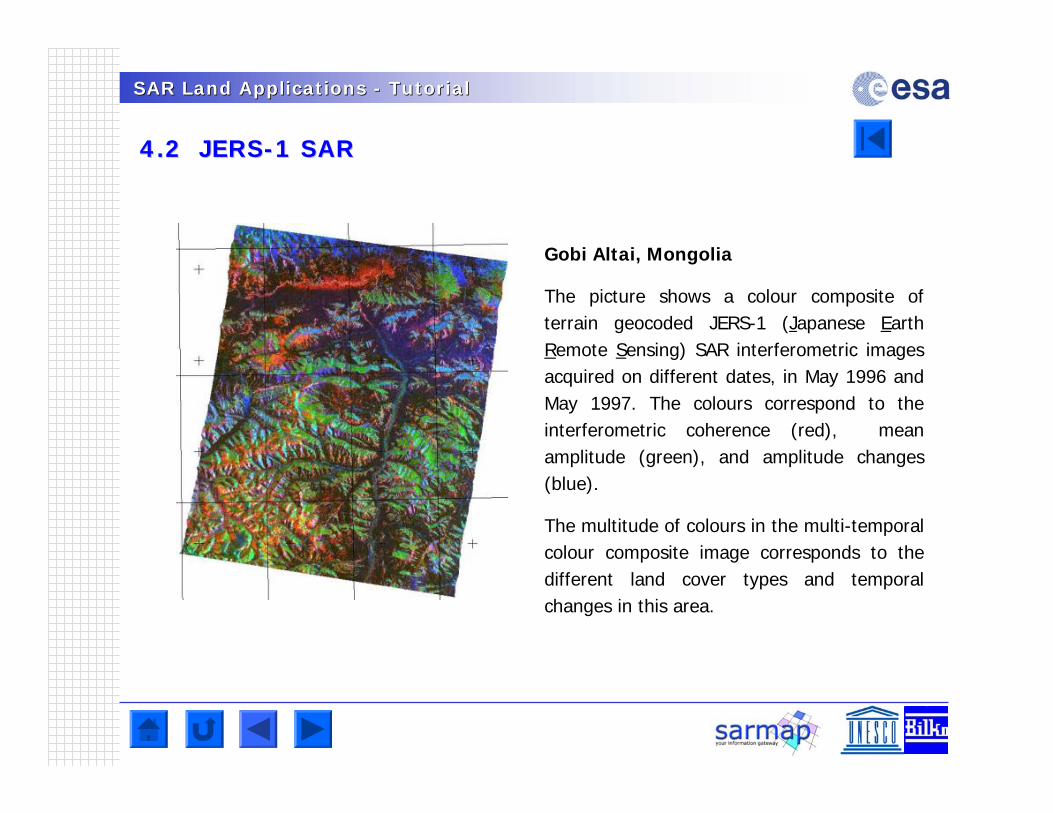
SAR Land Applications SAR Land Applications -- TutorialTutorial
4.2 JERS4.2 JERS--1 SAR1 SAR
Gobi Altai, Mongolia
The picture shows a colour composite of terrain geocoded JERS-1 (Japanese Earth Remote Sensing) SAR interferometric images acquired on different dates, in May 1996 and May 1997. The colours correspond to the interferometric coherence (red), mean amplitude (green), and amplitude changes (blue).
The multitude of colours in the multi-temporal colour composite image corresponds to the different land cover types and temporal changes in this area.
© JAXA
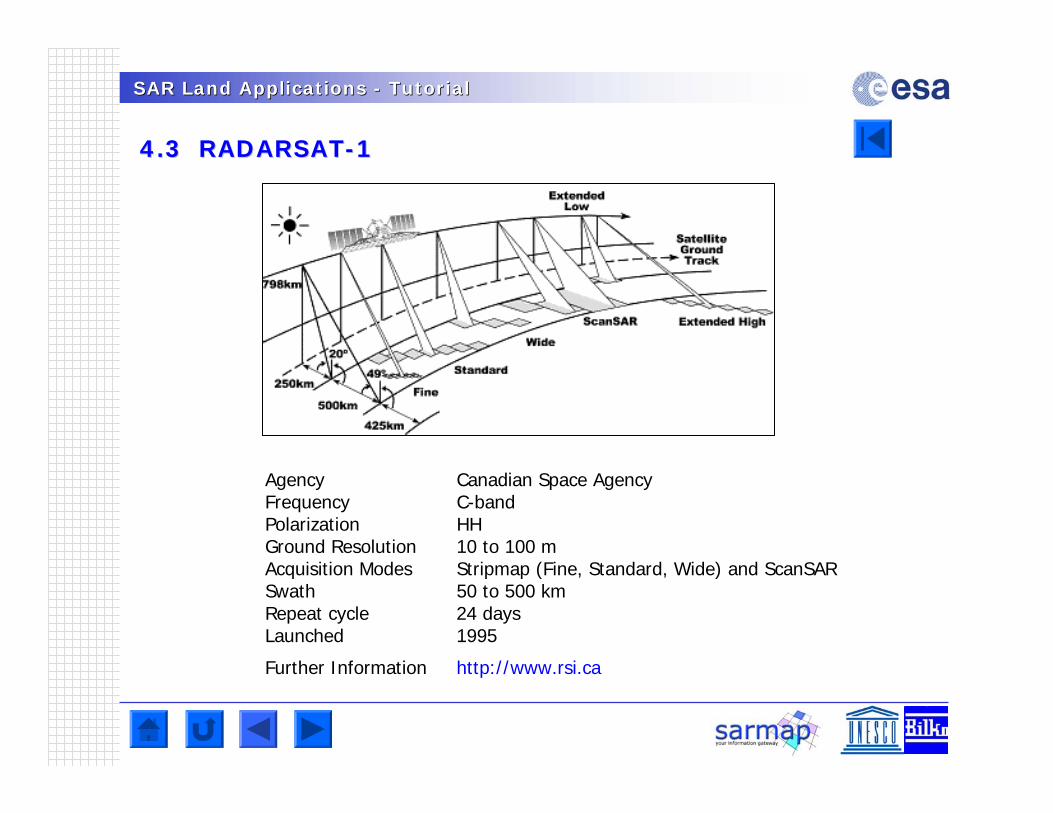
SAR Land Applications SAR Land Applications -- TutorialTutorial
4.3 RADARSAT4.3 RADARSAT--11
Agency Canadian Space AgencyFrequency C-bandPolarization HHGround Resolution 10 to 100 mAcquisition Modes Stripmap (Fine, Standard, Wide) and ScanSARSwath 50 to 500 kmRepeat cycle 24 daysLaunched 1995
Further Information http://www.rsi.ca
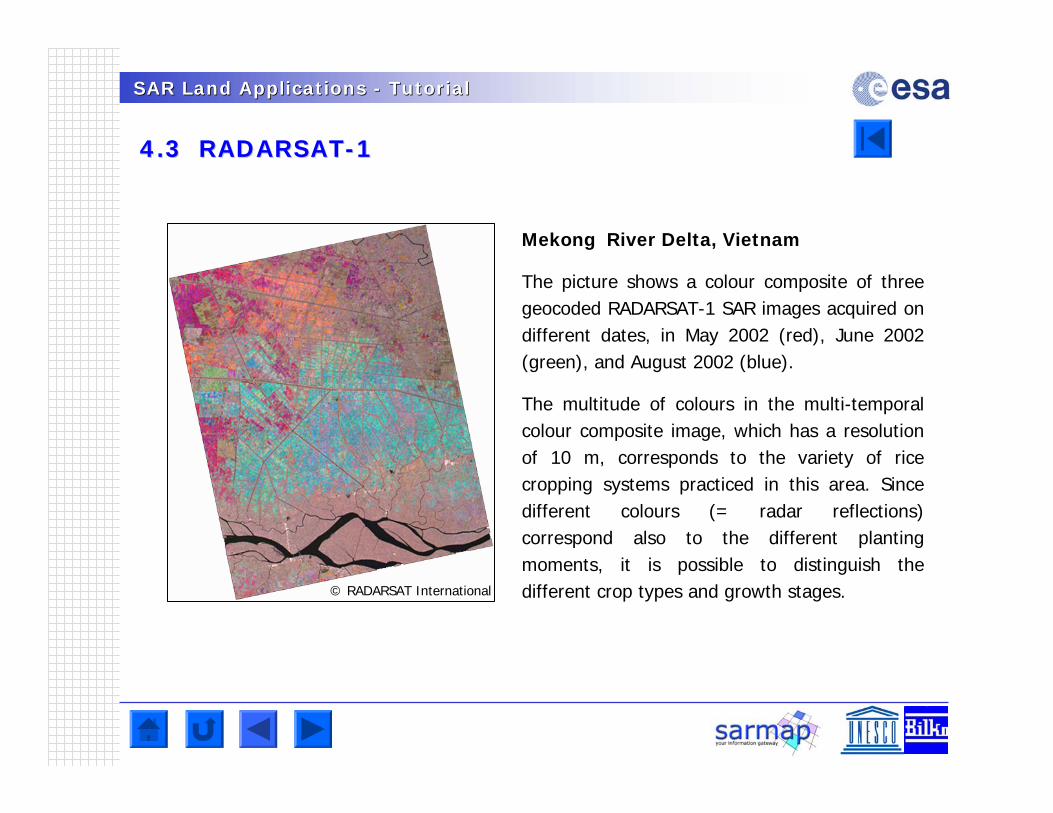
SAR Land Applications SAR Land Applications -- TutorialTutorial
4.3 RADARSAT4.3 RADARSAT--11
Mekong River Delta, Vietnam
The picture shows a colour composite of three geocoded RADARSAT-1 SAR images acquired on different dates, in May 2002 (red), June 2002 (green), and August 2002 (blue).
The multitude of colours in the multi-temporal colour composite image, which has a resolution of 10 m, corresponds to the variety of rice cropping systems practiced in this area. Since different colours (= radar reflections) correspond also to the different planting moments, it is possible to distinguish the different crop types and growth stages.© RADARSAT International
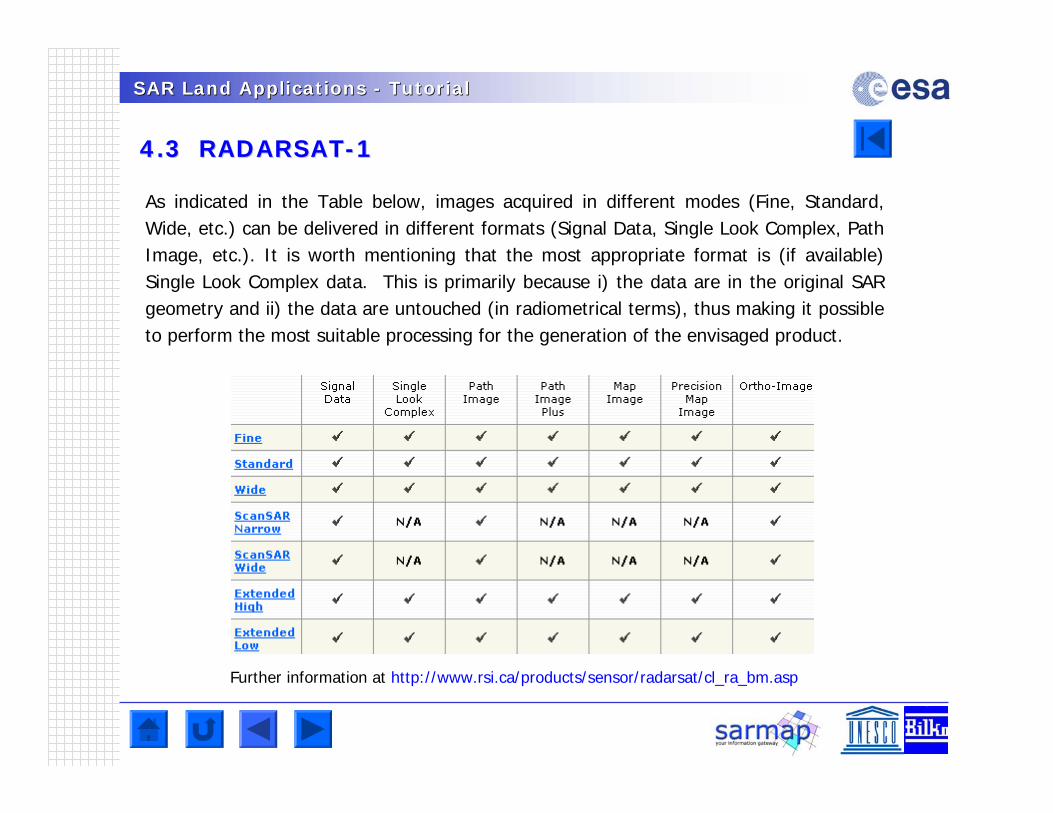
SAR Land Applications SAR Land Applications -- TutorialTutorial
4.3 RADARSAT4.3 RADARSAT--11
As indicated in the Table below, images acquired in different modes (Fine, Standard, Wide, etc.) can be delivered in different formats (Signal Data, Single Look Complex, Path Image, etc.). It is worth mentioning that the most appropriate format is (if available) Single Look Complex data. This is primarily because i) the data are in the original SAR geometry and ii) the data are untouched (in radiometrical terms), thus making it possible to perform the most suitable processing for the generation of the envisaged product.
Further information at http://www.rsi.ca/products/sensor/radarsat/cl_ra_bm.asp
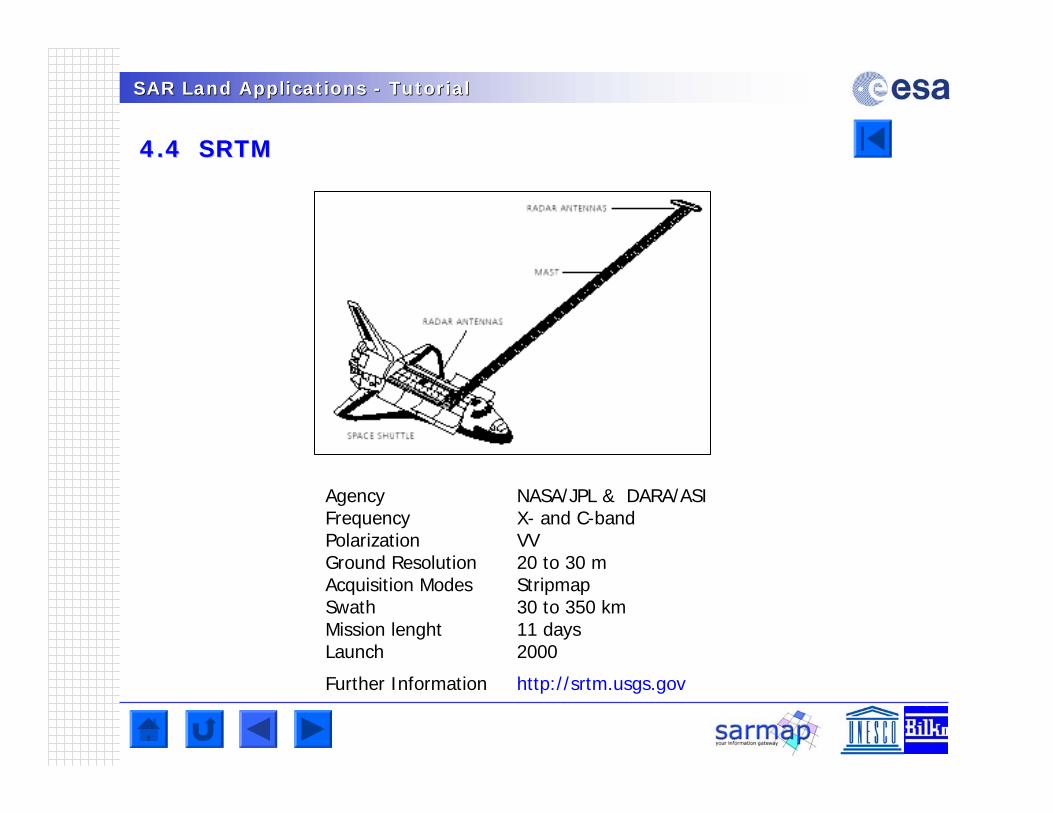
SAR Land Applications SAR Land Applications -- TutorialTutorial
4.4 SRTM4.4 SRTM
Agency NASA/JPL & DARA/ASIFrequency X- and C-bandPolarization VVGround Resolution 20 to 30 mAcquisition Modes StripmapSwath 30 to 350 kmMission lenght 11 daysLaunch 2000
Further Information http://srtm.usgs.gov
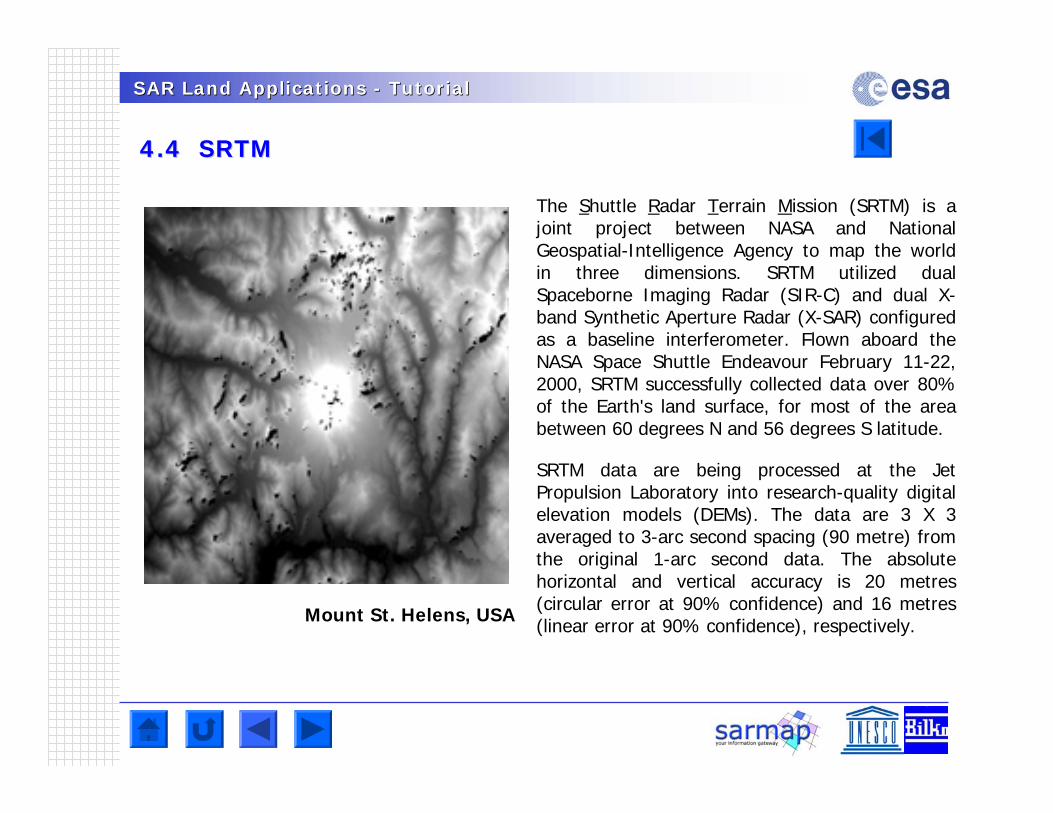
SAR Land Applications SAR Land Applications -- TutorialTutorial
4.4 SRTM4.4 SRTM
The Shuttle Radar Terrain Mission (SRTM) is a joint project between NASA and National Geospatial-Intelligence Agency to map the world in three dimensions. SRTM utilized dual Spaceborne Imaging Radar (SIR-C) and dual X-band Synthetic Aperture Radar (X-SAR) configured as a baseline interferometer. Flown aboard the NASA Space Shuttle Endeavour February 11-22, 2000, SRTM successfully collected data over 80% of the Earth's land surface, for most of the area between 60 degrees N and 56 degrees S latitude.
SRTM data are being processed at the Jet Propulsion Laboratory into research-quality digital elevation models (DEMs). The data are 3 X 3 averaged to 3-arc second spacing (90 metre) from the original 1-arc second data. The absolute horizontal and vertical accuracy is 20 metres (circular error at 90% confidence) and 16 metres (linear error at 90% confidence), respectively.Mount St. Helens, USA
© USGS
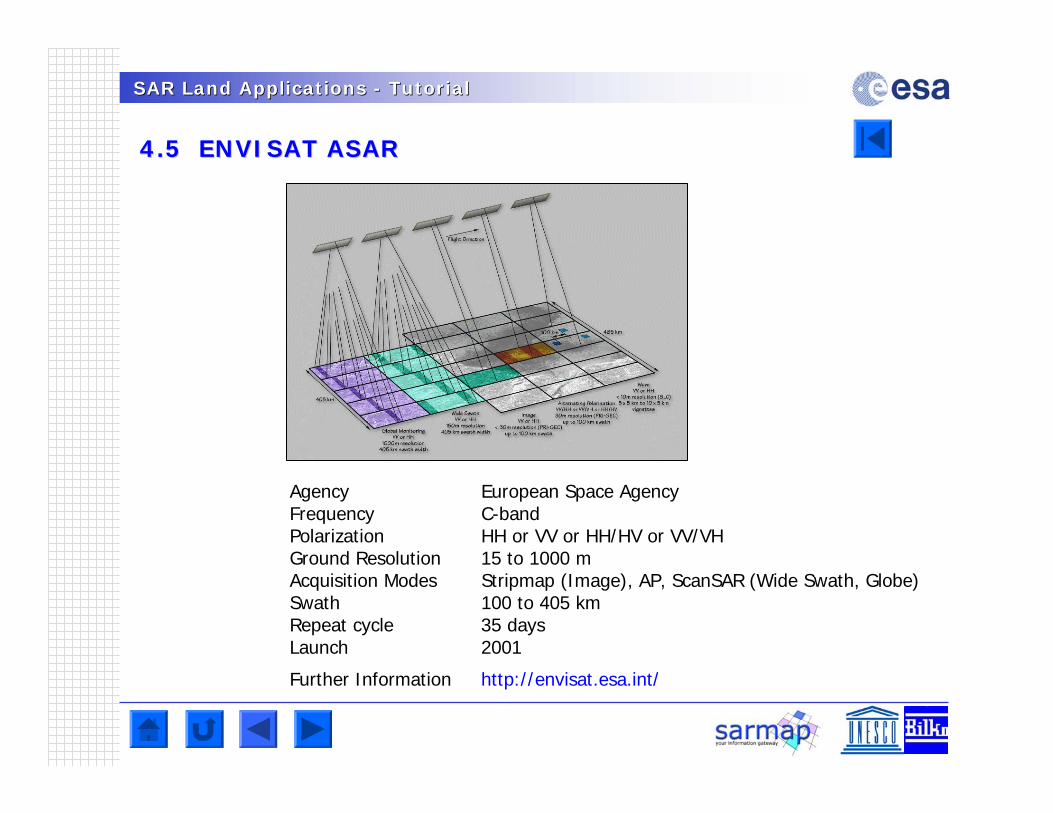
SAR Land Applications SAR Land Applications -- TutorialTutorial
4.5 ENVISAT ASAR4.5 ENVISAT ASAR
Agency European Space AgencyFrequency C-bandPolarization HH or VV or HH/HV or VV/VHGround Resolution 15 to 1000 mAcquisition Modes Stripmap (Image), AP, ScanSAR (Wide Swath, Globe) Swath 100 to 405 kmRepeat cycle 35 days Launch 2001
Further Information http://envisat.esa.int/
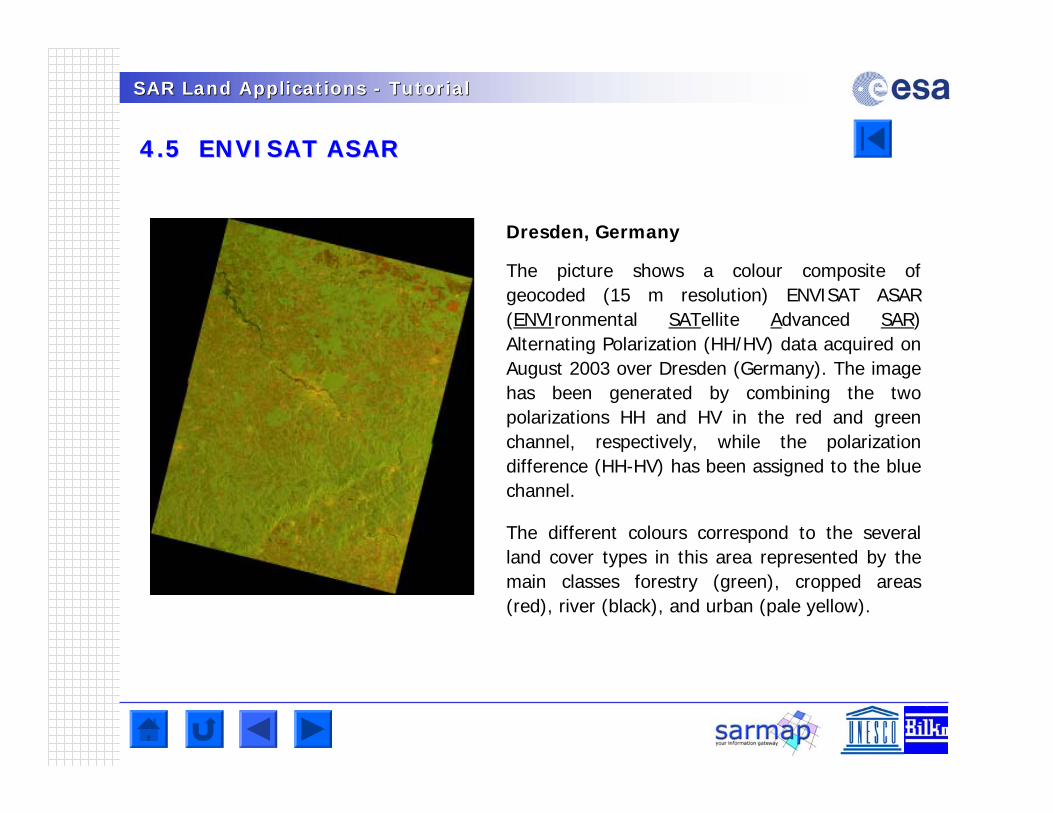
SAR Land Applications SAR Land Applications -- TutorialTutorial
4.5 ENVISAT ASAR4.5 ENVISAT ASAR
Dresden, Germany
The picture shows a colour composite of geocoded (15 m resolution) ENVISAT ASAR (ENVIronmental SATellite Advanced SAR) Alternating Polarization (HH/HV) data acquired on August 2003 over Dresden (Germany). The image has been generated by combining the two polarizations HH and HV in the red and green channel, respectively, while the polarization difference (HH-HV) has been assigned to the blue channel.
The different colours correspond to the several land cover types in this area represented by the main classes forestry (green), cropped areas (red), river (black), and urban (pale yellow).
© ESA
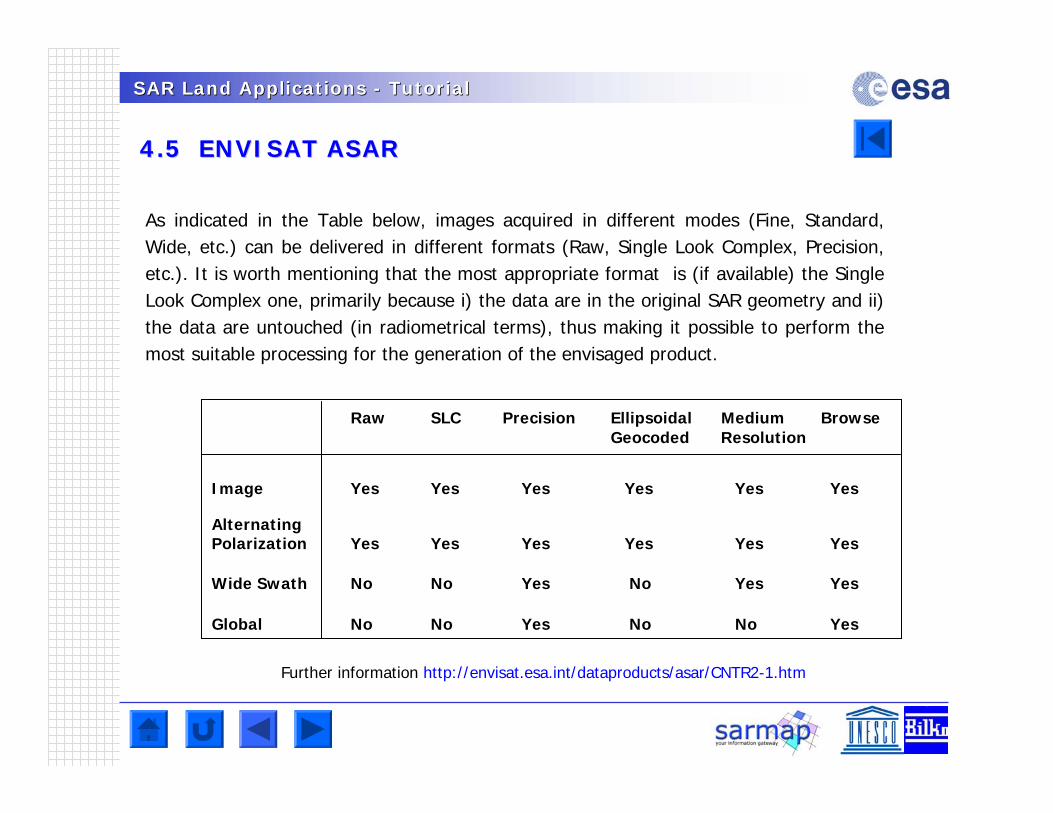
SAR Land Applications SAR Land Applications -- TutorialTutorial
4.5 ENVISAT ASAR4.5 ENVISAT ASAR
As indicated in the Table below, images acquired in different modes (Fine, Standard, Wide, etc.) can be delivered in different formats (Raw, Single Look Complex, Precision, etc.). It is worth mentioning that the most appropriate format is (if available) the Single Look Complex one, primarily because i) the data are in the original SAR geometry and ii) the data are untouched (in radiometrical terms), thus making it possible to perform the most suitable processing for the generation of the envisaged product.
Raw SLC Precision Ellipsoidal Medium BrowseGeocoded Resolution
Image Yes Yes Yes Yes Yes Yes
Alternating Polarization Yes Yes Yes Yes Yes Yes
Wide Swath No No Yes No Yes Yes
Global No No Yes No No Yes
Further information http://envisat.esa.int/dataproducts/asar/CNTR2-1.htm
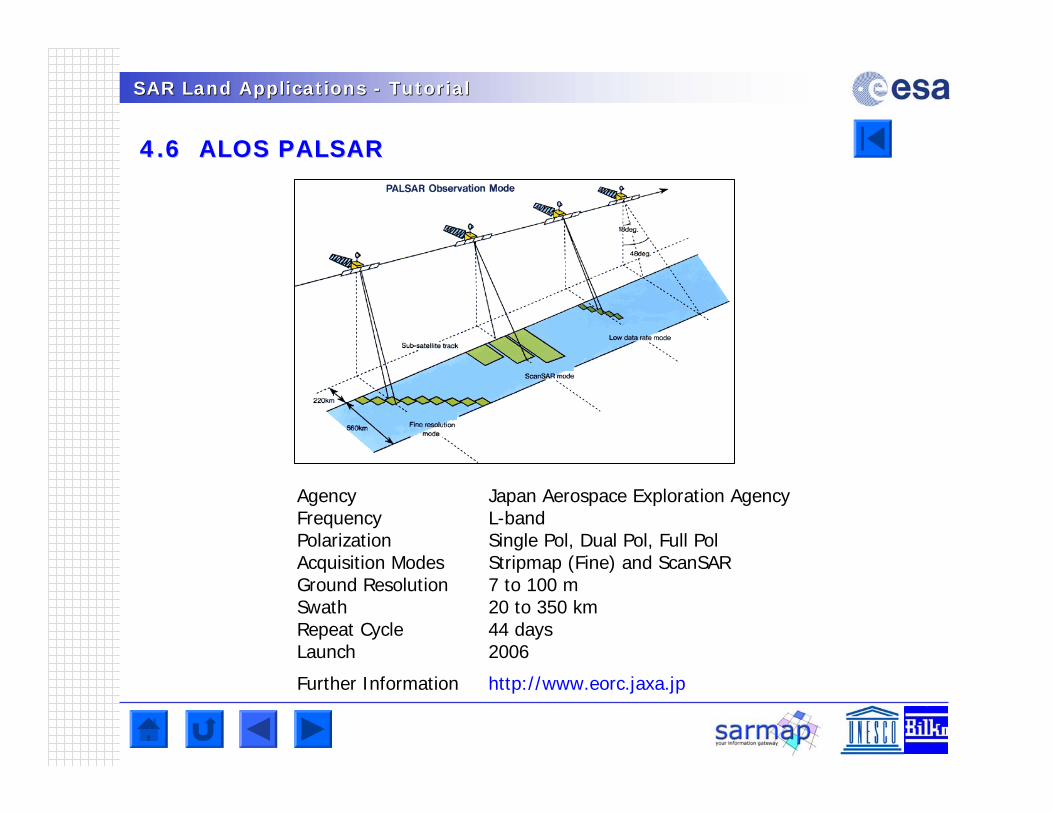
SAR Land Applications SAR Land Applications -- TutorialTutorial
4.6 ALOS PALSAR4.6 ALOS PALSAR
Agency Japan Aerospace Exploration AgencyFrequency L-bandPolarization Single Pol, Dual Pol, Full PolAcquisition Modes Stripmap (Fine) and ScanSARGround Resolution 7 to 100 mSwath 20 to 350 kmRepeat Cycle 44 daysLaunch 2006
Further Information http://www.eorc.jaxa.jp
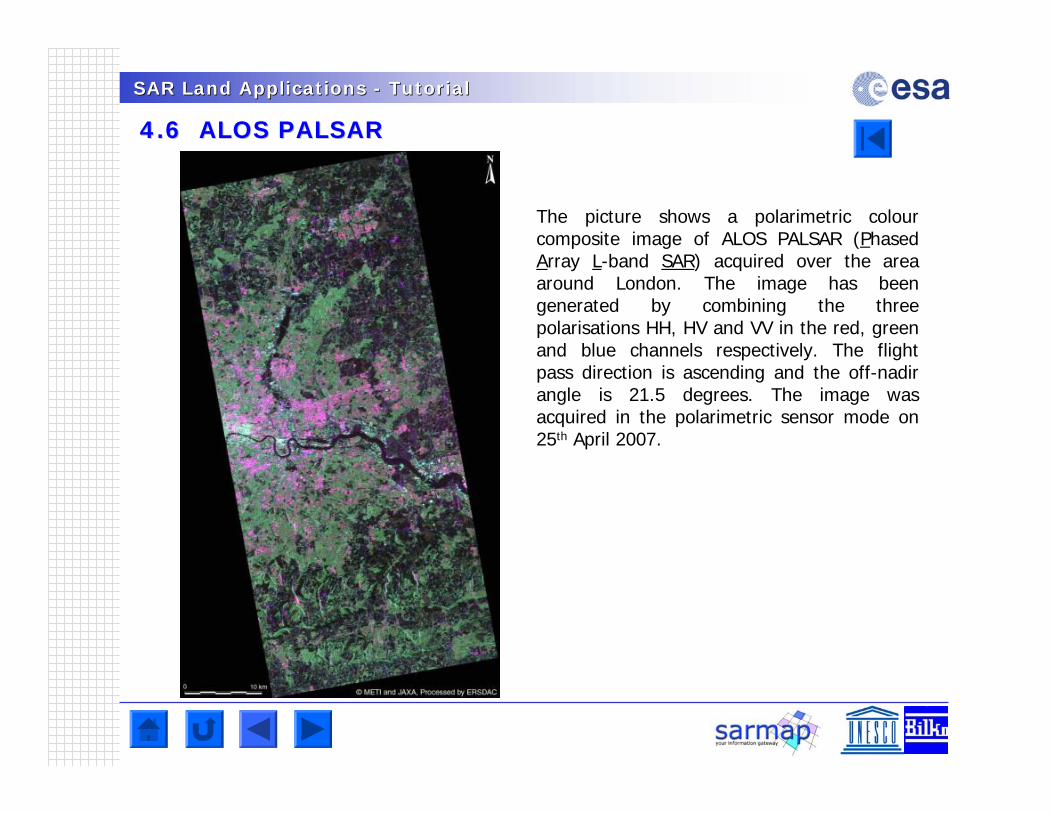
SAR Land Applications SAR Land Applications -- TutorialTutorial
4.6 ALOS PALSAR4.6 ALOS PALSAR
The picture shows a polarimetric colour composite image of ALOS PALSAR (Phased Array L-band SAR) acquired over the area around London. The image has been generated by combining the three polarisations HH, HV and VV in the red, green and blue channels respectively. The flight pass direction is ascending and the off-nadir angle is 21.5 degrees. The image was acquired in the polarimetric sensor mode on 25th April 2007.
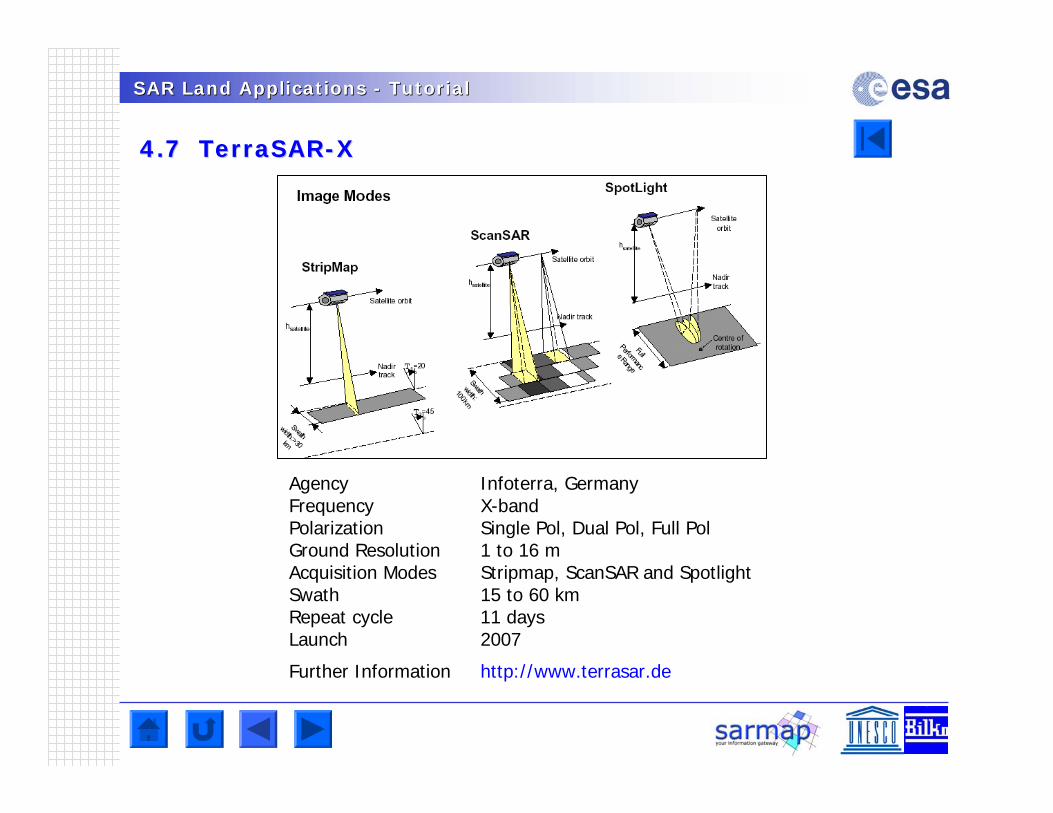
SAR Land Applications SAR Land Applications -- TutorialTutorial
4.7 4.7 TerraSARTerraSAR--XX
Agency Infoterra, GermanyFrequency X-bandPolarization Single Pol, Dual Pol, Full PolGround Resolution 1 to 16 mAcquisition Modes Stripmap, ScanSAR and SpotlightSwath 15 to 60 kmRepeat cycle 11 daysLaunch 2007
Further Information http://www.terrasar.de
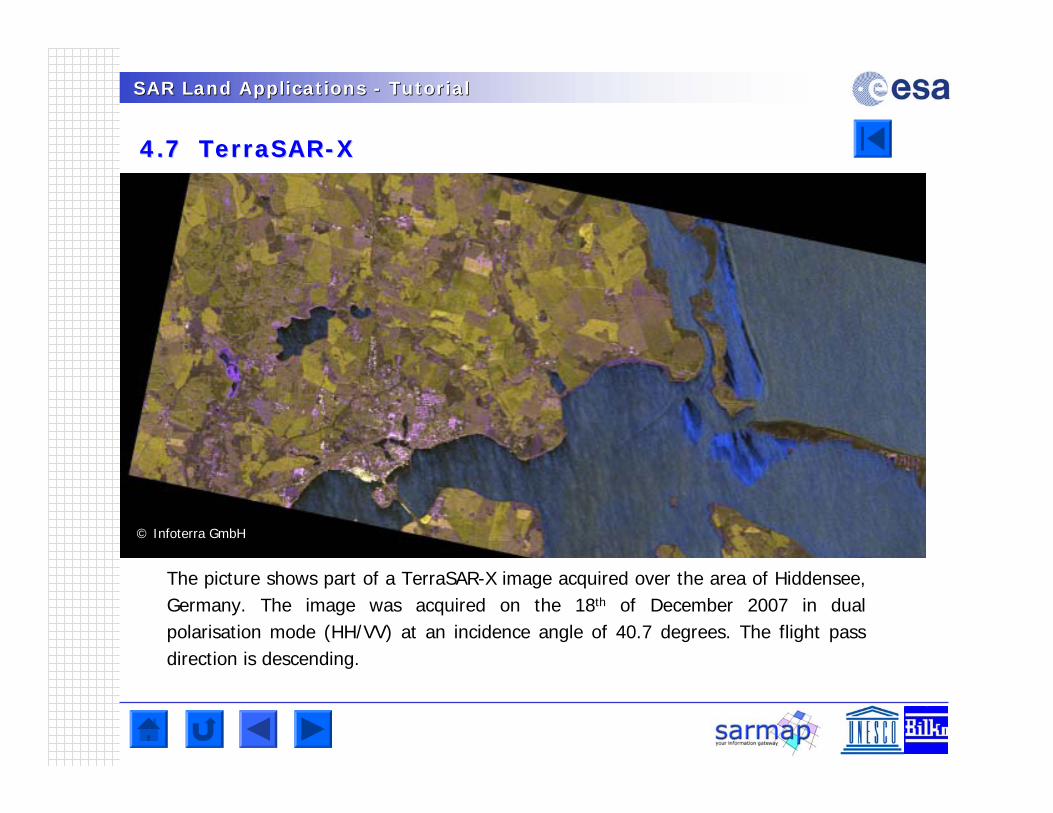
SAR Land Applications SAR Land Applications -- TutorialTutorial
4.7 4.7 TerraSARTerraSAR--XX
The picture shows part of a TerraSAR-X image acquired over the area of Hiddensee, Germany. The image was acquired on the 18th of December 2007 in dual polarisation mode (HH/VV) at an incidence angle of 40.7 degrees. The flight pass direction is descending.
© Infoterra GmbH
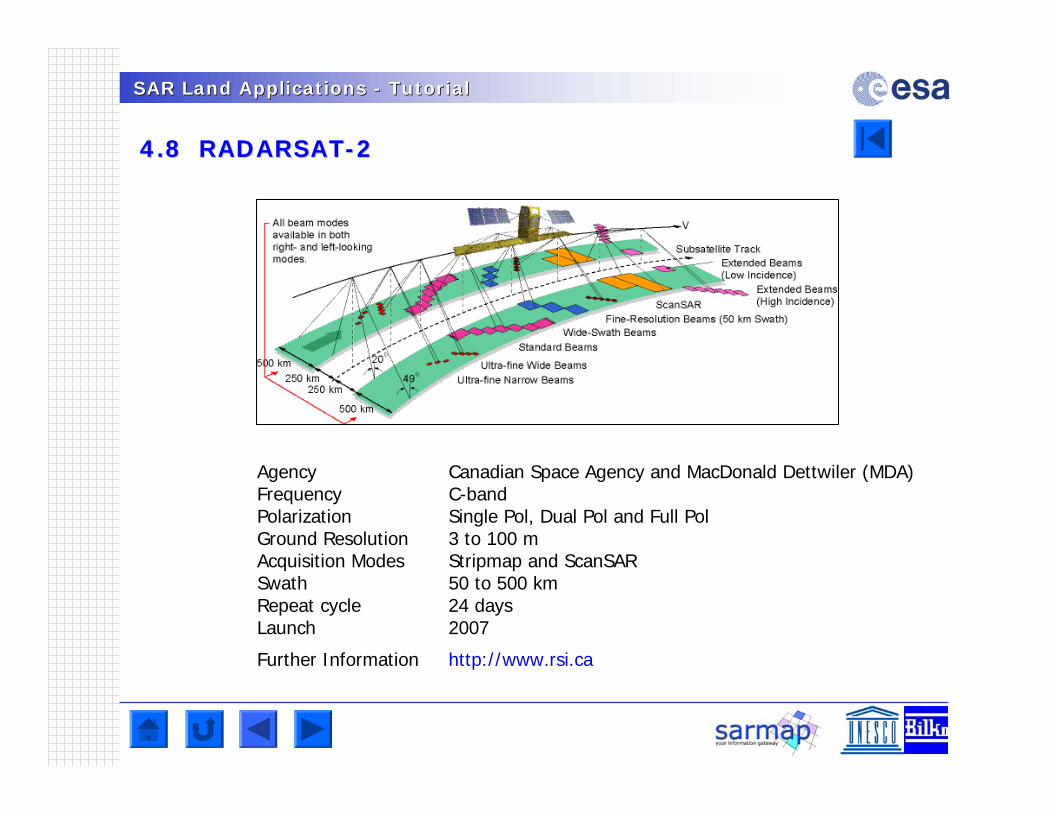
SAR Land Applications SAR Land Applications -- TutorialTutorial
4.8 RADARSAT4.8 RADARSAT--22
Agency Canadian Space Agency and MacDonald Dettwiler (MDA)Frequency C-bandPolarization Single Pol, Dual Pol and Full PolGround Resolution 3 to 100 mAcquisition Modes Stripmap and ScanSARSwath 50 to 500 kmRepeat cycle 24 daysLaunch 2007
Further Information http://www.rsi.ca
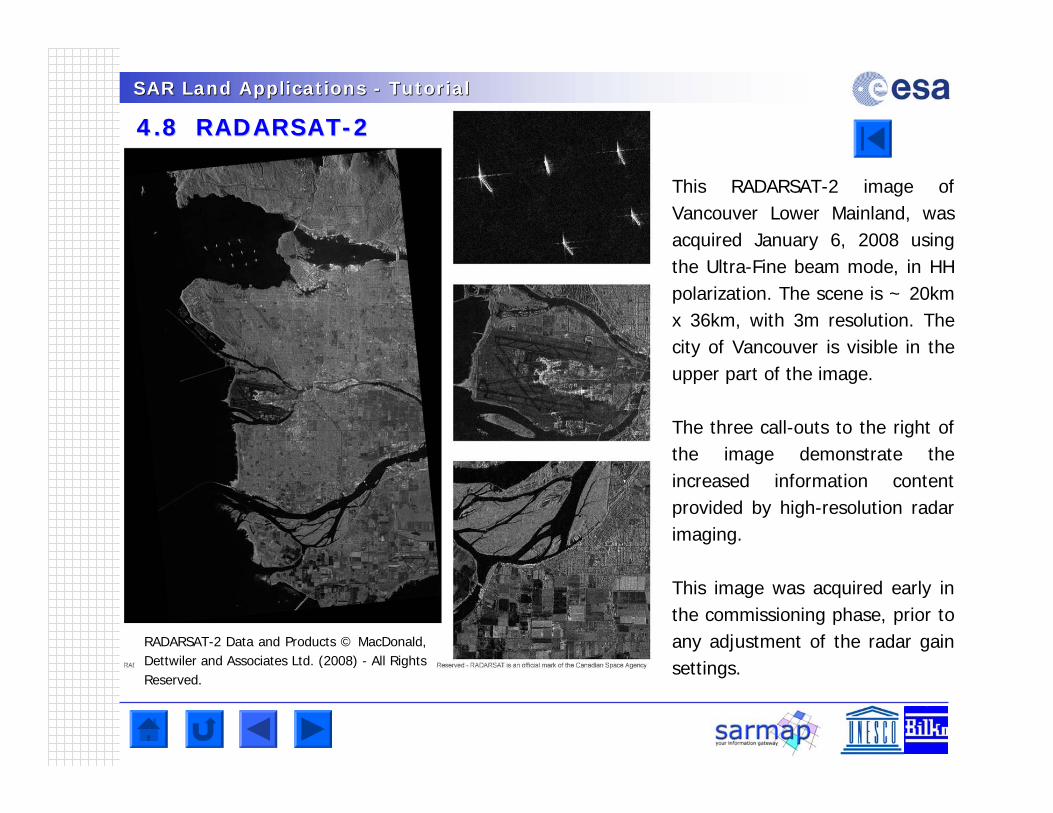
SAR Land Applications SAR Land Applications -- TutorialTutorial
4.8 RADARSAT4.8 RADARSAT--22
This RADARSAT-2 image of Vancouver Lower Mainland, was acquired January 6, 2008 using the Ultra-Fine beam mode, in HH polarization. The scene is ~ 20km x 36km, with 3m resolution. The city of Vancouver is visible in the upper part of the image.
The three call-outs to the right of the image demonstrate the increased information content provided by high-resolution radar imaging.
This image was acquired early in the commissioning phase, prior to any adjustment of the radar gain settings.
RADARSAT-2 Data and Products © MacDonald, Dettwiler and Associates Ltd. (2008) - All Rights Reserved.
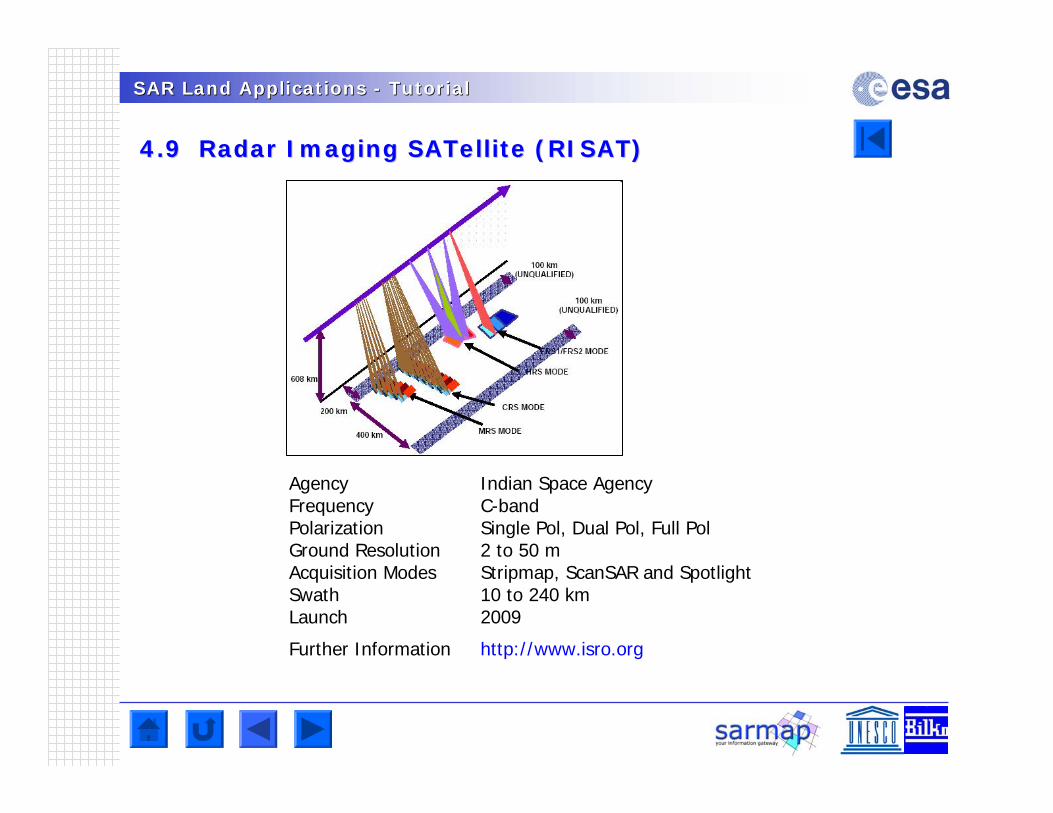
SAR Land Applications SAR Land Applications -- TutorialTutorial
4.9 Radar Imaging 4.9 Radar Imaging SATelliteSATellite (RISAT)(RISAT)
Agency Indian Space AgencyFrequency C-bandPolarization Single Pol, Dual Pol, Full PolGround Resolution 2 to 50 mAcquisition Modes Stripmap, ScanSAR and SpotlightSwath 10 to 240 kmLaunch 2009
Further Information http://www.isro.org
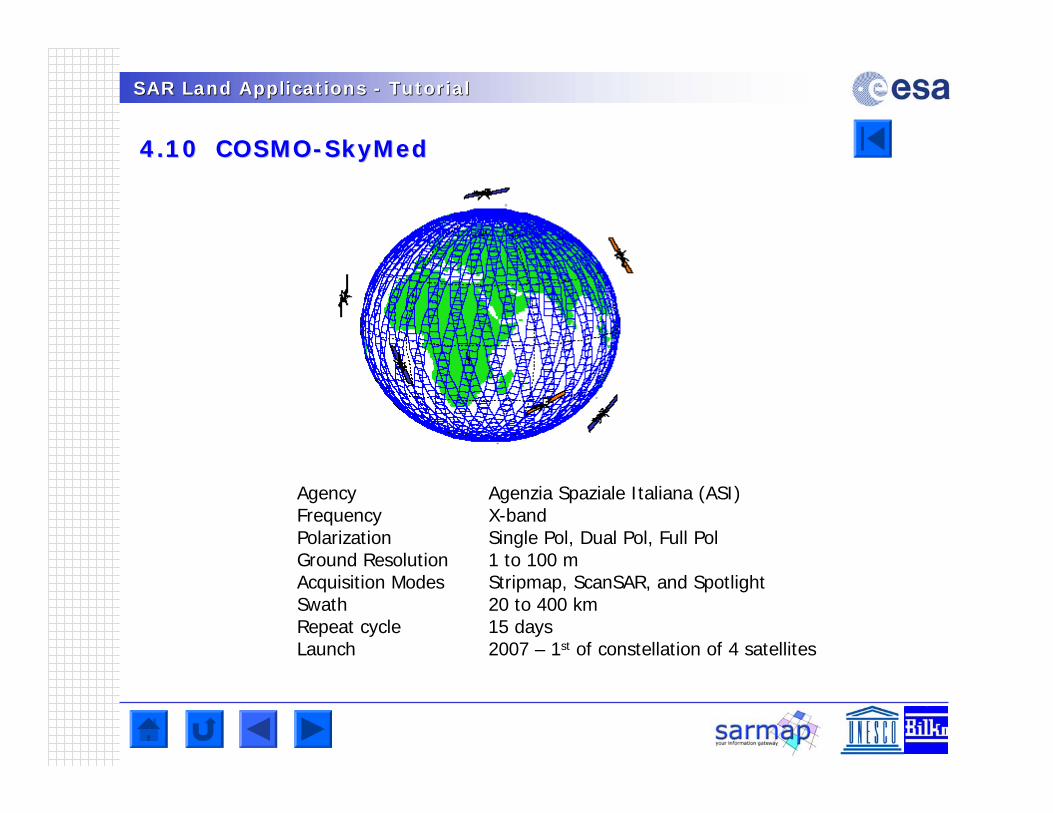
SAR Land Applications SAR Land Applications -- TutorialTutorial
4.10 COSMO4.10 COSMO--SkyMedSkyMed
Agency Agenzia Spaziale Italiana (ASI)Frequency X-bandPolarization Single Pol, Dual Pol, Full PolGround Resolution 1 to 100 mAcquisition Modes Stripmap, ScanSAR, and SpotlightSwath 20 to 400 kmRepeat cycle 15 daysLaunch 2007 – 1st of constellation of 4 satellites
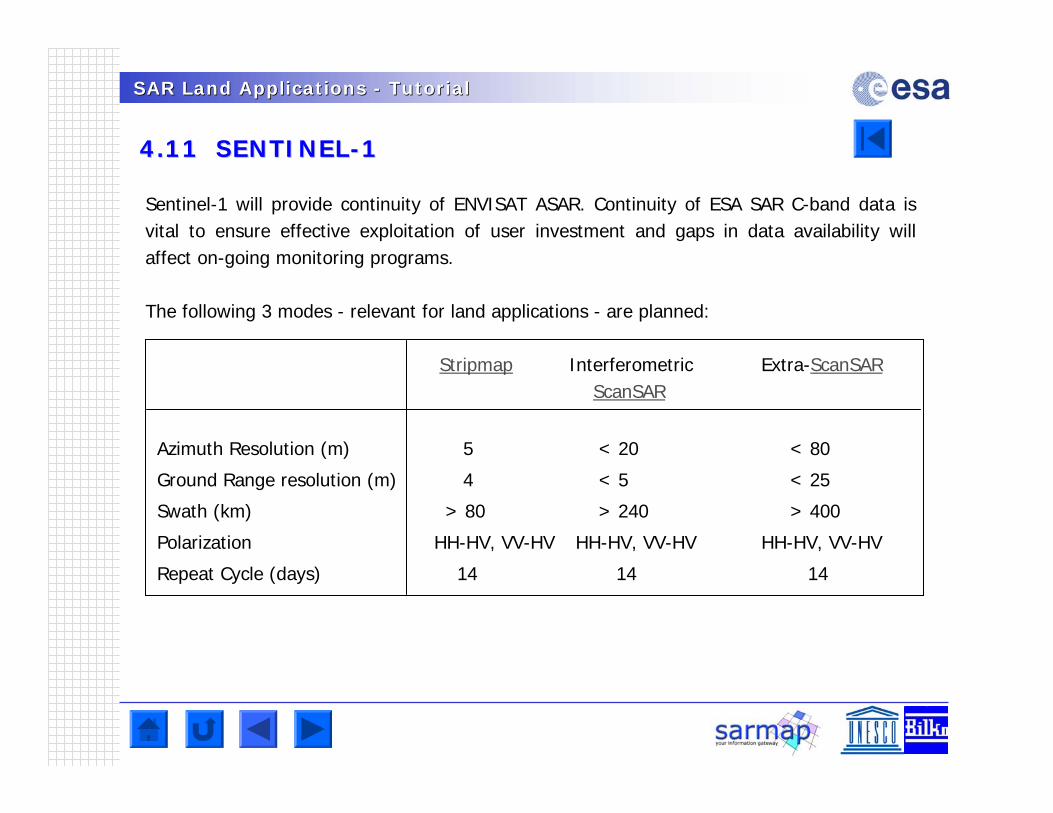
SAR Land Applications SAR Land Applications -- TutorialTutorial
4.11 SENTINEL4.11 SENTINEL--11
Sentinel-1 will provide continuity of ENVISAT ASAR. Continuity of ESA SAR C-band data is vital to ensure effective exploitation of user investment and gaps in data availability will affect on-going monitoring programs.
The following 3 modes - relevant for land applications - are planned:
Stripmap Interferometric Extra-ScanSARScanSAR
Azimuth Resolution (m) 5 < 20 < 80
Ground Range resolution (m) 4 < 5 < 25
Swath (km) > 80 > 240 > 400
Polarization HH-HV, VV-HV HH-HV, VV-HV HH-HV, VV-HV
Repeat Cycle (days) 14 14 14
SAR Land Applications SAR Land Applications -- TutorialTutorial
5. How do I get SAR Data and Products?5. How do I get SAR Data and Products?
5.1 ESA5.1 ESA EOLI CatalogueEOLI Catalogue
5.2 RADARSAT Swath Planner Application5.2 RADARSAT Swath Planner Application
5.3 ESA Category5.3 ESA Category--1 data 1 data
5.4 ESA Data Dissemination System5.4 ESA Data Dissemination System
5.5 Commercial Data Providers 5.5 Commercial Data Providers
5.6 ESA 5.6 ESA Multiple Application Support ServiceMultiple Application Support Service PortalPortal
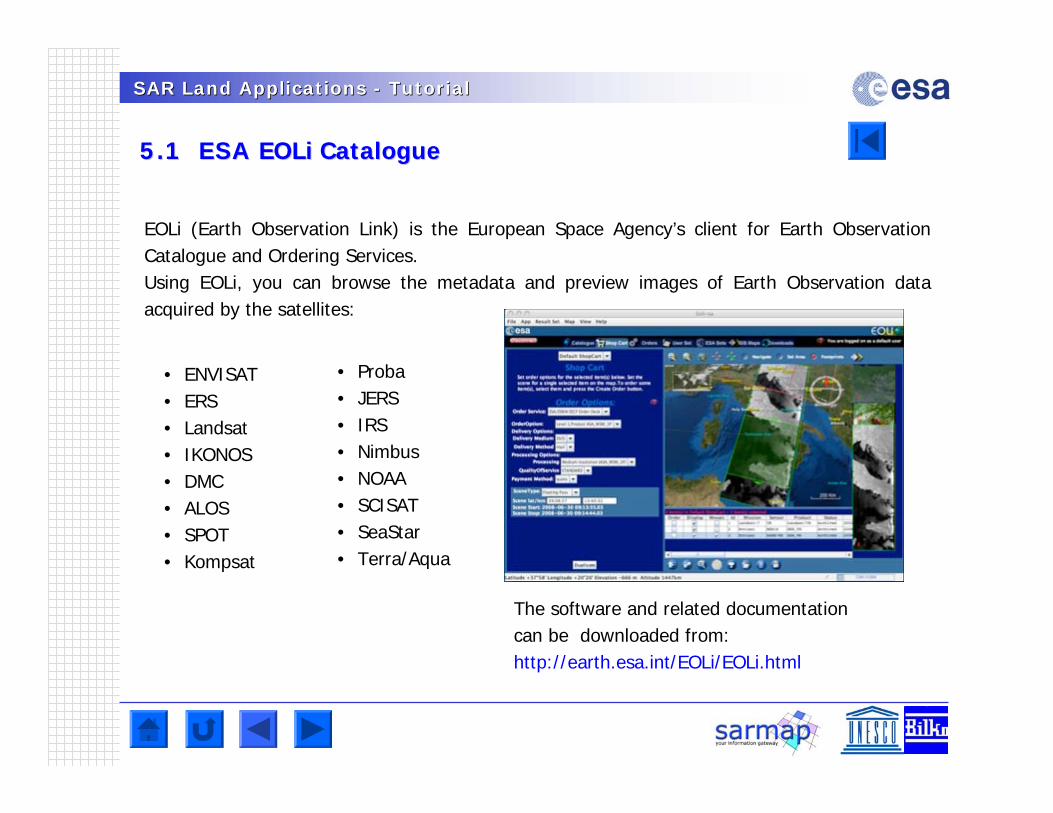
SAR Land Applications SAR Land Applications -- TutorialTutorial
5.1 ESA 5.1 ESA EOLiEOLi CatalogueCatalogue
EOLi (Earth Observation Link) is the European Space Agency’s client for Earth Observation Catalogue and Ordering Services. Using EOLi, you can browse the metadata and preview images of Earth Observation data acquired by the satellites:
• ENVISAT• ERS• Landsat• IKONOS• DMC• ALOS• SPOT• Kompsat
The software and related documentation can be downloaded from:http://earth.esa.int/EOLi/EOLi.html
• Proba• JERS• IRS• Nimbus• NOAA• SCISAT• SeaStar• Terra/Aqua
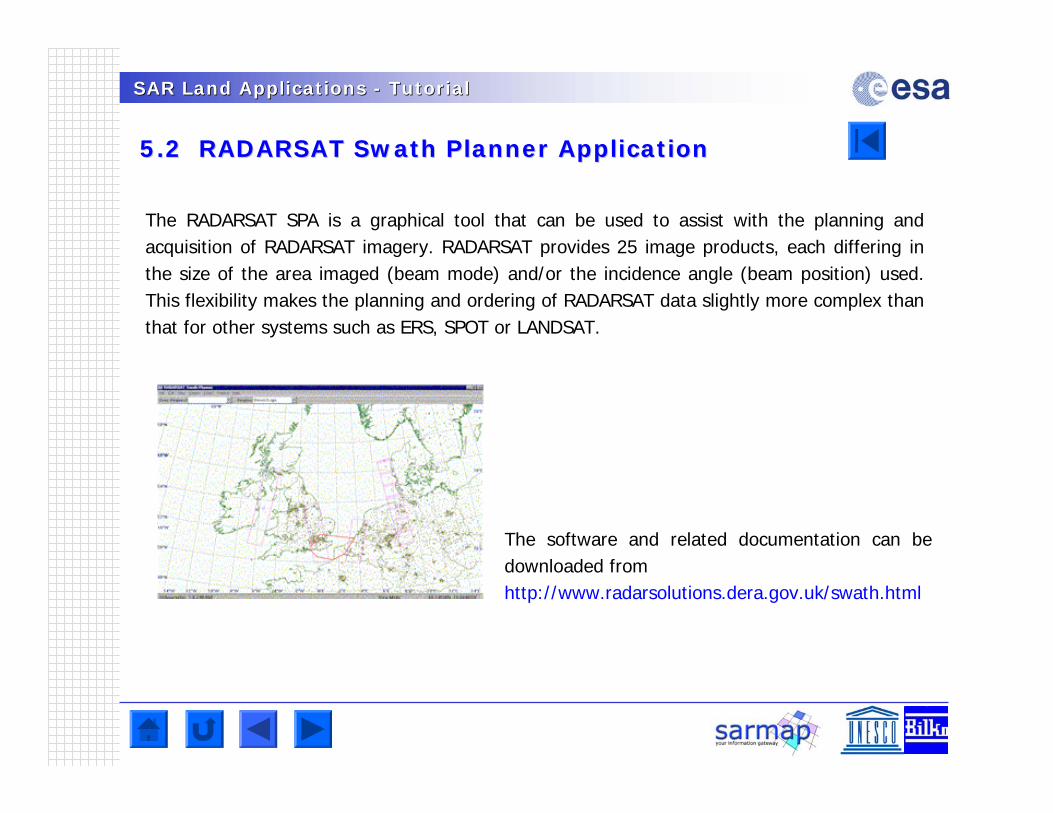
SAR Land Applications SAR Land Applications -- TutorialTutorial
5.2 RADARSAT Swath Planner Application5.2 RADARSAT Swath Planner Application
The RADARSAT SPA is a graphical tool that can be used to assist with the planning and acquisition of RADARSAT imagery. RADARSAT provides 25 image products, each differing in the size of the area imaged (beam mode) and/or the incidence angle (beam position) used. This flexibility makes the planning and ordering of RADARSAT data slightly more complex than that for other systems such as ERS, SPOT or LANDSAT.
The software and related documentation can be downloaded fromhttp://www.radarsolutions.dera.gov.uk/swath.html
SAR Land Applications SAR Land Applications -- TutorialTutorial
5.3 ESA Category5.3 ESA Category--1 Data1 Data
The ESA distribution policy related to data obtained from the ERS and ENVISAT satellites foresees the data use for research and applications development in support of the mission objectives, including
• Research on long term issues of Earth System science• Research and development in preparation for future operational use• Certification of receiving stations as part of the ESA functions• ESA internal use
For data distribution falling under Category 1 use, the data will be provided by ESA at reproduction cost or free of charge (to be waived by the Earth Observation Program Board).
After approval of the Category 1 Proposal ERS and ENVISAT data can be ordered at [email protected] .
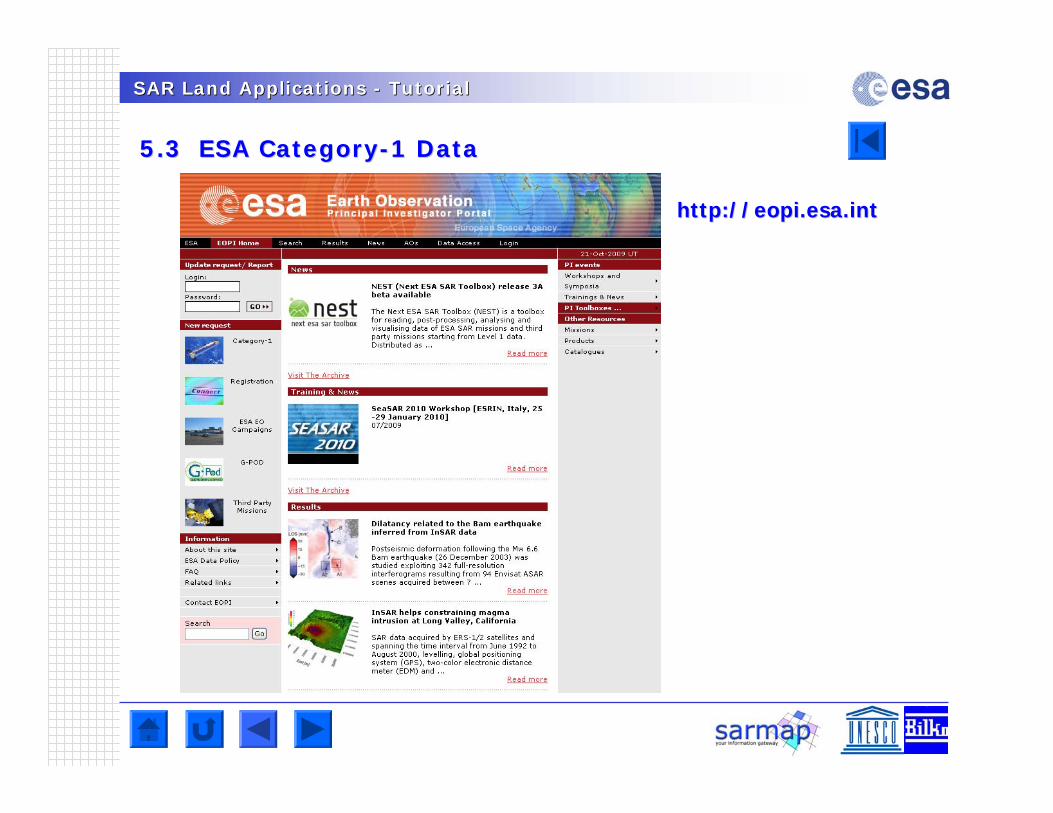
SAR Land Applications SAR Land Applications -- TutorialTutorial
5.3 ESA Category5.3 ESA Category--1 Data1 Data
http://http://eopi.esa.inteopi.esa.int
SAR Land Applications SAR Land Applications -- TutorialTutorial
5.4 ESA Data Dissemination System5.4 ESA Data Dissemination System
• The Data Dissemination System (DDS) is a very successful Earth Observation (EO) data distribution method used inside ESA ground segment. DDS is an integral element of ESA EO data dissemination strategy and together with the Internet online distribution, will be increasingly replacing distribution on media. Using IP over DVB-satellite, DDS is today a fully operational, reliable and cost-attractive service for the dissemination of ENVISAT data.
• Reception and decryption of DDS transmitted data can be achieved in two ways: a Linux custom receiver for corporate users, and a Windows version for single users.
• For additional information refer to http://dwlinkdvb.esrin.esa.it/DDS/
SAR Land Applications SAR Land Applications -- TutorialTutorial
5.5 Commercial Data Providers5.5 Commercial Data Providers
• EMMA - represented by EurimageCustomer Servicestel.: +39 06 40 69 42 22fax: +39 06 40 69 42 32e-mail: [email protected]://www.eurimage.com
• SARCOM - represented by Spot ImageSales Departmenttel.: +33 5 621 94040fax: +33 5 621 94011e-mail: [email protected]://www.spotimage.com
ERS-1/2 SAR, ALOS PALSAR, RADARSAT-1, ENVISAT ASAR, TerraSAR-X can be directly purchased by the official data providers:
SAR Land Applications SAR Land Applications -- TutorialTutorial
5.6 ESA Service Support Environment (SSE)5.6 ESA Service Support Environment (SSE)
http://services.eoportal.org/index.jsp
The “Service Support Environment” (SSE) is a neutrally managed, open and distributed platform that streamlines the definition and prototyping of services, offering an exclusive opportunity to integrate a wide range of heterogeneous EO and geospatial information services , including product catalogues. The SSE environment is an advanced test-bed that supports service prototyping and demonstration processes, allowing the design of automatically executed workflows, with a valuable decrease of the overall development effort.In this way SSE streamlines both the time to get the EO data and that to deliver the service to the end-user.
SSE works to:
• Orchestrate synchronous and asynchronous Web Services for online and offline processes • Provide an overarching infrastructure, neutrally managed by ESA • Integrate the access to EO data within service prototyping and delivery • Empower service providers through a business process management platform • Minimize service providers’ upfront investments and development risk • Allow the use of Open standards to facilitate adoption and evolution • Facilitate the integration of satellite data and geospatial information within the processing and exploitation chains
SSE offers a service directory giving access to a continuously expanding set of basic and more complex Earth observation and GIS services, at demonstration or operational level. Some services are free of charge while other need a quotation. To access the full set of available services, you should Register as SSE portal user.
SAR Land Applications SAR Land Applications -- TutorialTutorial
6. What Tools are Available for SAR Data Processing?6. What Tools are Available for SAR Data Processing?
6.1 Public domain software tools6.1 Public domain software tools
6.2 Commercial software tools6.2 Commercial software tools
SAR Land Applications SAR Land Applications -- TutorialTutorial
6.1 Public Domain Software Tools6.1 Public Domain Software Tools
• Next ESA SAR Toolbox (NEST) http://earth.esa.int/nest• DORIS http://www.geo.tudelft.nl/fmr/research/insar/• EnviView http://earth.esa.int/enviview• UNESCO-Bilko http://www.unesco.bilko.org/
SAR Land Applications SAR Land Applications -- TutorialTutorial
6.2 Commercial Software Tools6.2 Commercial Software Tools
• DIAPASON http://www.altamira-information.com• Earthview http://www.pcigeomatics.com/products/atlantis.html• GAMMA http://www.gamma-rs.ch• InfoPACK http://www.infosar.co.uk• PulSAR http://www.phoenixsystems.co.uk• SARscape http://www.sarmap.ch• Vexcel http://www.vexcel.com
SAR dedicated software
Software tools including SAR processing capabilities
• eCognition http://www.definiens-imaging.com• ENVI http://www.rsinc.com/envi/• ERDAS http://www.erdas.com• ER Mapper http://www.ermapper.com• GEOimage http://www.geoimage.fr• PCI Geomatics http://www.pcigeomatics.com
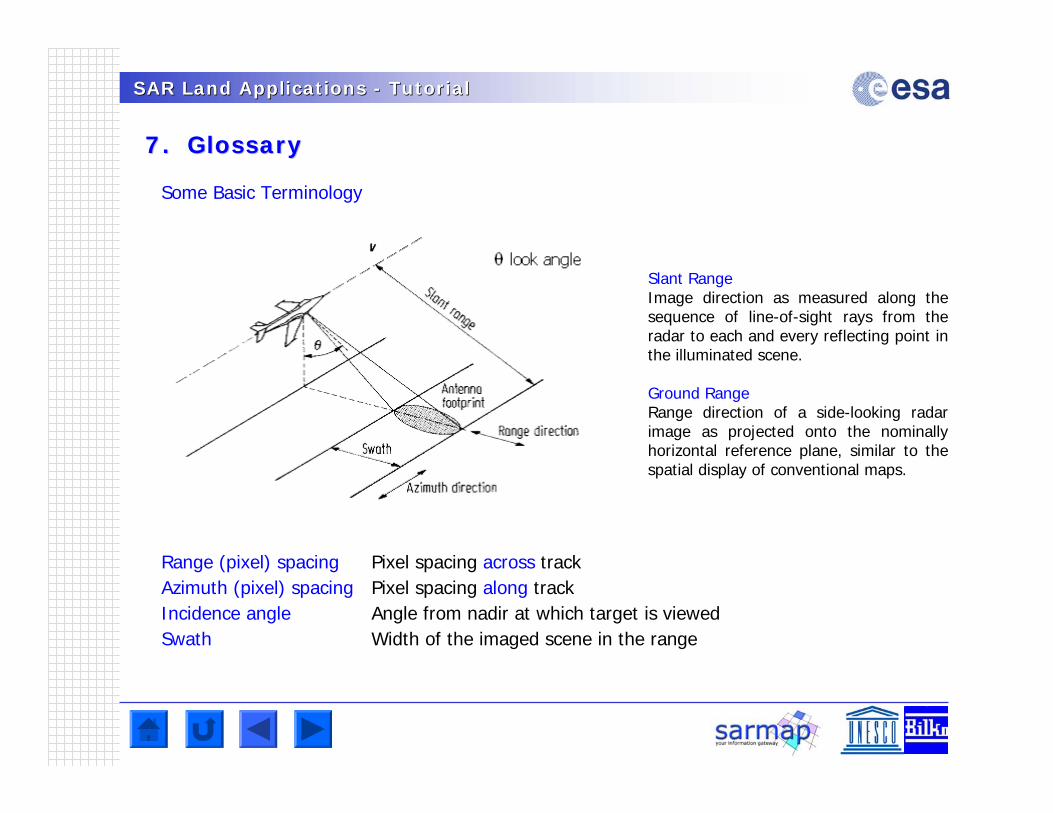
SAR Land Applications SAR Land Applications -- TutorialTutorial
7. Glossary7. Glossary
Range (pixel) spacing Pixel spacing across trackAzimuth (pixel) spacing Pixel spacing along trackIncidence angle Angle from nadir at which target is viewedSwath Width of the imaged scene in the range
Slant RangeImage direction as measured along the sequence of line-of-sight rays from the radar to each and every reflecting point in the illuminated scene.
Ground RangeRange direction of a side-looking radar image as projected onto the nominally horizontal reference plane, similar to the spatial display of conventional maps.
Some Basic Terminology
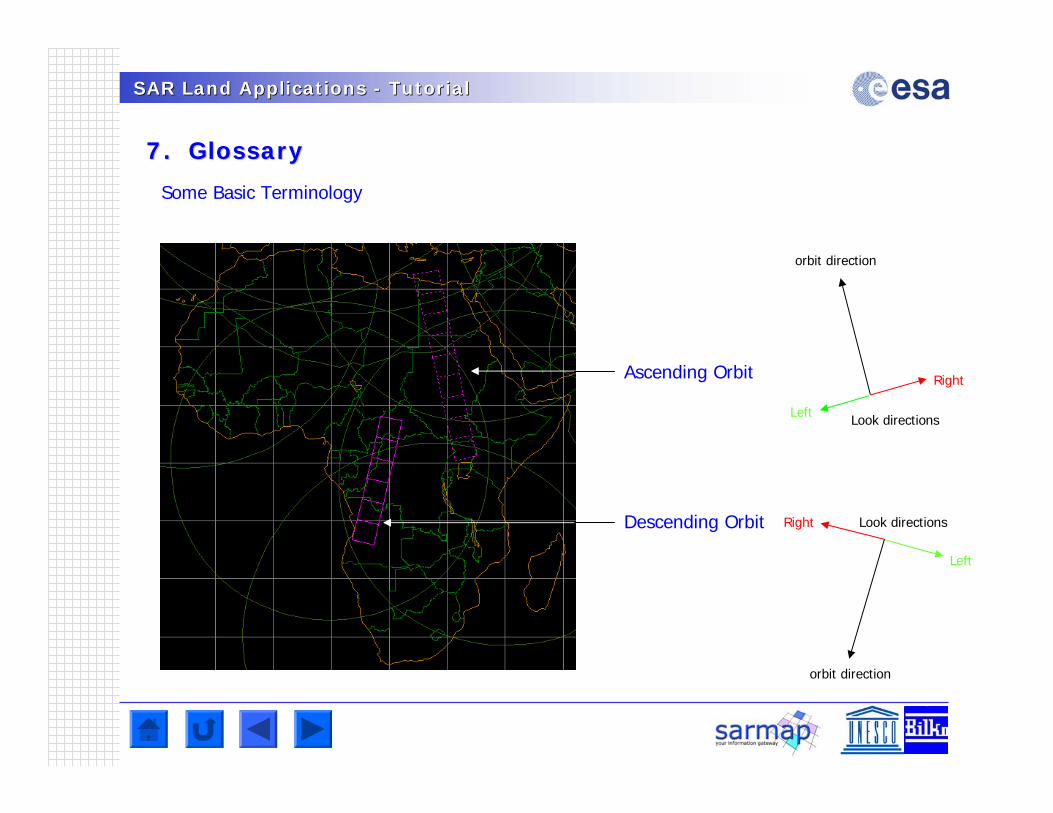
SAR Land Applications SAR Land Applications -- TutorialTutorial
7. Glossary7. Glossary
Some Basic Terminology
Ascending Orbit
Descending Orbit
orbit direction
orbit direction
Look directions
Right
Left
Left
Right Look directions
SAR Land Applications SAR Land Applications -- TutorialTutorial
7. Glossary7. Glossary
Across-track - The across-track dimension is the imaging direction of the sensor that is orthogonal to the direction in which the platform is moving.
Active Remote Sensing System - A system that provides its own source of energy and illumination (i.e. radar system). A remote sensing system that transmits its own electromagnetic emanations at an object(s) and then records the energy reflected or refracted back to the sensor.
Along-track - The along-track dimension is the imaging direction of the sensor that is parallel to the direction in which the platform is moving.
Amplitude - Measure of the strength of a signal, and in particular the strength or height of an electromagnetic wave (units of voltage). The amplitude may imply a complex signal, including both magnitude and the phase.
Antenna - Part of the radar system, which transmits and/or receives electromagnetic energy.
Antenna Array - An arrangement of several individual antennas so spaced and phased that their individual contributions add in the preferred direction and cancel in other directions. SAR systems, employ a short physical antenna, but through modified data recording and processing techniques, they synthesise the effect of a very long antenna. The result of this mode of operation is a very narrow effective antenna beamwidth, even at far ranges, without requiring a physically long antenna or a short operating wavelength. For example, in a SAR system, a 2m antenna can be made effectively 600 m long.
Attenuation - Decrease in the strength of a signal. The decrease in the strength of a signal, is usually described by a multiplicative factor in the mathematical description of signal level. A signal is attenuated by application of a gain less than unity. Common causes of attenuation of an electromagnetic wave include losses through absorption and by volume scattering in a medium as a wave passes through.
Azimuth - The relative position of an object within the field of view of an antenna in the plane intersecting the moving radar's line of flight. The term commonly is used to indicate linear distance or image scale in the along-track direction.
SAR Land Applications SAR Land Applications -- TutorialTutorial
7. Glossary7. Glossary
Azimuth Ambiguity - A form of ghosting that occurs when the sampling of returned signals is too slow.
Azimuth Bandpass Filtering - Bandpass filtering selects a certain band of frequency components in the signal. Azimuth bandpass filtering refers to filtering in the azimuth direction of the two-dimensional SAR signal. The location of signal energy in the azimuth frequency domain depends on the antenna pointing angle, so bandpass filtering is necessary to maximize the signal energy in the processed image.
Azimuth Compression - In the SAR signal domain, the raw data is spread out in the range and azimuth directions and must be coherently compressed to realise the full-resolution potential of the instrument. Azimuth compression consists of coherently correlating the received signal with the azimuth replica function. The appropriate Hamming weighting is applied also to the reference function. Subsequent correlation has the effect of modulating both signal and noise by similar amounts and hence the signal-to-noise ratio is unchanged by this process.
Azimuth Resolution - Resolution characteristic of the azimuth dimension, usually applied to the image domain. Azimuth resolution is fundamentally limited by the Doppler bandwidth of the system. Excess Doppler bandwidth is usually used to allow extra looks, at the expense of azimuth resolution.
Azimuth Time - The time along the flight path.
Backscatter - It is the portion of the outgoing radar signal that the target redirects directly back towards the radar antenna.
Backscattering is the process by which backscatter is formed. The scattering cross section in the direction toward the radar is called the backscattering cross section; the usual notation is the symbol sigma . It is a measure of the reflective strength of a radar target. The normalised measure of the radar return from a distributed target is called the backscatter coefficient, or sigma nought , and is defined as per unit area on the ground. If the signal formed by backscatter is undesired, it is called clutter. Other portions of the incident radar energy may be reflected and scattered away from the radar or absorbed.
SAR Land Applications SAR Land Applications -- TutorialTutorial
7. Glossary7. Glossary
Band - A selection of wavelengths or range of radar frequencies.
Bandwidth -A measure, according to a standard definition (see width), of the span of frequencies available in a signal or other distribution, or of the frequency limiting stages in the system. Typical bandwidths in the range channel of a SAR are on the order of 20 Megahertz, and in the azimuth channel are on the order of 1 Kilohertz. Bandwidth is a fundamental parameter of any imaging system, and determines the ultimate resolution available. For any pulse, the basic parameter that describes its structure is the time bandwidth product.
Beam - A focused pulse of energy. The antenna beam of a side-looking radar (SLAR) is directed perpendicular to the flight path and illuminates a swath parallel to the platform ground track. Due to the motion of the satellite, each target element is illuminated by the beam for a period of time, known as the integration time.
Beam Mode - The SAR operating configuration defined by the swath width and resolution.
Beta Nought (ß°) - A radar brightness coefficient. The reflectivity per unit area in slant range is dimensionless.
Brightness - Property of an image in which the strength of the radar reflectivity is expressed as being proportional to a digital number (digital image file) or to a grey scale (photographic image), which for a photographic positive shows bright as white. The attribute of visual perception in accordance with which an area appears to emit more or less light. Brightness may be a result of variations in tone, texture, or in the case of radar imagery, radar artefacts. The topography and surface roughness of the terrain will affect the image brightness. Where the local incidence angle is large, the image will be dark. Conversely, the image will be brighter where the local incidence angle is small.
C-Band - A nominal frequency range, from 8 to 4 Ghz (3.75 to 7.5 cm wavelength) within the microwave portion of theelectromagnetic spectrum. C-band has been the frequency of choice for several experimental aircraft SAR systems as well as a series of single-band satellite SAR systems, including the ERS-1/2 and Envisat SAR systems and RADARSAT-1/2 SAR. The corresponding wavelength for these systems is on the order of 5.6 cm, which has been found useful in sea ice surveillance as well as in other applications. Its penetration capability with regard to vegetation canopies or soils is limited and is restricted to the top layers.
SAR Land Applications SAR Land Applications -- TutorialTutorial
7. Glossary7. Glossary
Calibration - Process whereby one may relate the digital numbers describing an image to physical quantities such as reflectivity, geometry (position or size), or phase.
Chirp - Typical phase coding or modulation applied to the range pulse of an imaging radar designed to achieve a large time-bandwidth product. The resulting phase is quadratic in time, which has a linear derivative. Such coding is often called linear frequency modulation (FM).
Chirp Compression - The echo signal is correlated with a suitable reference function. This correlation is performed in the frequency domain after suitable Fast Fourrier Transform from the time domain. The reference function of interest should represent the chirp signal which illuminates the target.
Coherence - Coherence is the magnitude of an interferogram's pixels, divided by the product of the magnitudes of the original image's pixels. It is usually calculated on a small window of pixels at a time, from the complex interferogram and images. It ranges from 0.0, where there is no useful information in the interferogram; to 1.0, where there is no noise in the interferogram. Coherence can serve as a measure of the quality of an interferogram; tell you more about the surface type (vegetated vs. rock); or tell you when a tiny, otherwise invisible change has occured in the image, and it is only visible in the phase image of an interferogram.
Complex Number - For radar systems, a complex number implies that the representation of a signal, or data file, needs both magnitude and phase measures. In the digital SAR context, a complex number is often represented by an equivalent pair of numbers, the real in-phase component (I) and the imaginary quadrature component (Q). For coherent systems such as SAR, the role of complex numbers is an essential part of the signal, since signal phase is used in the processor to obtain high-resolution.
Co-polarisation Signature - The received signature when the transmit and receive antennas have the same polarisation properties.
Corner Reflector - A combination of two or more intersecting specular surfaces that combine to enhance the signal reflected in the direction of the radar. The strongest reflection is obtained for materials having a high conductivity (i.e. ships, bridges).
Cross Polarisation Signature -The received signature when the transmit and receive antennas have orthogonal polarisations.
SAR Land Applications SAR Land Applications -- TutorialTutorial
7. Glossary7. Glossary
Decibel (dB) - Measurement of signal strength, properly applied to a ratio of powers. Decibels often are used in radar, such as in measures of reflectivity, for which the dynamic range may span several factors of ten.
Depolarisation - The polarisation state of an electromagnetic wave can change when the wave scatters from a target. Depolarisation is a measure of the change in the degree of polarisation of a partially polarised wave upon scattering. For example, a target may scatter a wave with a greater degree of polarisation than the incident wave, in which case the depolarisation is negative. Depolarisation is also used to indicate spatial or temporal variation of the degree of polarisation for a completely polarised wave
Depression Angle - Usually refers to the line of sight from the radar to an illuminated object as measured from the horizontal plane at the radar. For image interpretation, use of the term is not recommended because it does not account for the effects of Earth curvature, and it does not conveniently include effects of local slope in the scene. It is more appropriate for engineering description of the vertical antenna pattern at the radar itself.
Detection - Processing stage at which the strength of the signal is determined for each pixel value. Detection removes phase information from the data file. The preferred detection scheme uses a magnitude squared method, which is energy conserving, and has units of voltage squared per pixel.
Doppler Frequency - The Doppler frequency depends on the component of satellite velocity in the line-of-sight direction to the target. This direction changes with each satellite position along the flight path, so the Doppler frequency varies with azimuth time. For this reason, azimuth frequency is often referred to as Doppler frequency.
Dielectric - Material which has neither "perfect" conductivity nor is perfectly "transparent" to electromagnetic radiation. The electrical properties of all intermediate materials, such as ice, natural foliage, or rocks, may be described by two quantities relative dielectric constant; and loss tangent. Reflectivity of a smooth surface and the penetration of microwaves into the material are determined by these two quantities.
Dielectric Constant - Fundamental (complex) parameter, also known as the complex permittivity, that describes the electrical properties of a lossy medium. (See permeability.) By convention, the relative dielectric constant of a given material is used, defined as the (absolute) dielectric constant divided by the dielectric constant of "free space".
SAR Land Applications SAR Land Applications -- TutorialTutorial
7. Glossary7. Glossary
Dihedral - Corner reflector formed by two surfaces orthogonally intersecting. For enhanced backscatter, the dihedral must be open to the radar, and have the axis of intersection at right angles to the direction of illumination.
Distributed Scatters -Elements of a scene consisting of many small scatterers of random location, phase, and reflectivity in each resolution cell.
Elliptical Polarisation - A polarisation state in which the two perpendicular components of the electric field have unequal magnitudes and a non-zero phase difference. In this case, the tip of the electric field vector traces an ellipse on a plane that is transverse to thewave propagation direction.
Foreshortening - Spatial distortion whereby terrain slopes facing a side-looking radar's illumination are mapped as having a compressed range scale relative to its appearance if the same terrain were level. Foreshortening is a special case of elevation displacement. The effect is more pronounced for steeper slopes, and for radars that use steeper incidence angles. Range scale expansion, the complementary effect, occurs for slopes that face away from the radar illumination.
Frequency - Number of oscillations per unit time or number of wavelengths that pass a point per unit time. Rate of oscillation of a wave. In remote sensing, this term is most often used with radar. The frequency bands used by radar (radar frequency bands) werefirst designated by letters for military secrecy. In the microwave region, frequencies are on the order of 1 GHz (Gigahertz) to 100 GHz. ("Giga" implies multiplication by a factor of a billion). For electromagnetic waves, the product of wavelength and frequency is equal to the speed of propagation, which, in free space, is the speed of light.
Frequency Modulation - A technique in which the frequency of a signal is changed about a fundamental or carrier frequency.
Geocoding (or Georeferencing or Ortho-rectification) -The process to transform an image from slant range projection to a cartographic reference system considering ellipsoidal height or a Digital Elevation Model.
Ground Range - Range direction of a side-looking radar image as projected onto the nominally horizontal reference plane, similar to the spatial display of conventional maps. For spacecraft data, an Earth geoid model is used, whereas for airborne radar data, a planar approximation is sufficient. Ground range projection requires a geometric transformation from slant range to ground range, leading to relief or elevation displacement, foreshortening, and layover unless terrain elevation information is used.
SAR Land Applications SAR Land Applications -- TutorialTutorial
7. Glossary7. GlossaryGround Range - Range direction of a side-looking radar image as projected onto the nominally horizontal reference plane, similar to the spatial display of conventional maps. For spacecraft data, an Earth geoid model is used, whereas for airborne radar data, a planar approximation is sufficient. Ground range projection requires a geometric transformation from slant range to ground range, leading to relief or elevation displacement, foreshortening, and layover unless terrain elevation information is used.
Horizontal Polarisation - Linear polarisation with the lone electric vector oriented in the horizontal direction in antenna co-ordinates.
Incidence Angle - Angle between the line of sight from the radar to an element of an imaged scene, and a vertical direction characteristic of the scene. The definition of "vertical" for this purpose is important. One must distinguish between the (nominal) "incidence angle" determined by the large scale geometry of the radar and the Earth's geoidal surface, and the local incidence angle which takes into account the mean slope with each pixel of the image. Smaller incidence angle refers to viewing line of sight being closer to the (local) vertical, hence "steeper". In general, reflectivity from distributed scatterers decreases with increasing incidence angle.
Intensity - Strength of a field or of a distribution, such as an image file, proportional to magnitude, squared (see Power).
Interferometric Synthetic Aperture Radar (InSAR) - SAR interferometry is a technique involving phase measurements from successive satellite SAR images to infer differential range and range changes for the purpose of detecting very subtle changes on, or of, the Earth surface with unprecedented scale, accuracy and reliability. SAR interferometry has been demonstrated successfully in a number of applications, including topographic mapping, measurement of terrain displacement as a result of earthquakes, and measurement of flow rates of glaciers or large ice sheets. The term InSAR, is most commonly associated with repeat-pass interferometry.
Interferometry - A technique that uses the measured differences in the phase of the return signal between two satellite passes to detect slight changes on the Earth's surface. The combination of two radar measurements of the same point on the ground, taken at the same time, but from slightly different angles, to produce stereo images. Using the cosine rule from trigonometry to calculate the distance between the radar and the Earth's surface, these measurements can produce very accurate height maps, or maps of height changes. Mapping height changes provides information on earthquake damage, volcanic activity, landslides, and glacier movement.
SAR Land Applications SAR Land Applications -- TutorialTutorial
7. Glossary7. Glossary
L-Band - A nominal frequency range, from 1 to 3 Ghz (30 to 10 cm wavelength) within the microwave portion of the electromagnetic spectrum. L-band has been the frequency of choice for several experimental aircraft SAR systems as well as a series of single-band satellite SAR systems, including the SEASAT SAR and JERS-1 SAR systems. The corresponding wavelength for these systems is on the order of 23.5 cm, which has been found useful in sea ice surveillance as well as in other applications. Its penetration capability with regard to vegetation canopies is significant.
Layover - Extreme form of elevation displacement or foreshortening in which the top of a reflecting object (such as mountain) is closer to the radar (in slant range) than are the lower parts of the object. The image of such a feature appears to have fallen over towards the radar. The effect is more pronounced for radars having smaller incidence angle.
Linear Polarisation - A polarisation state in which one of the perpendicular components of the electric field has zero magnitude. In this case, the polarisation ellipse collapses to a straight line; the tip of the electric field vector traces a straight line on a plane that is transverse to the wave propagation direction.
Looks - It refers to individual looks as groups of signal samples in a SAR processor that splits the full synthetic aperture into several sub-apertures, each representing an independent look of the identical scene. The resulting image formed by incoherent summing of these looks is characterised by reduced speckle and degraded spatial resolution. The SAR signal processor can use the full synthetic aperture and the complete signal data history in order to produce the highest possible resolution, albeit very speckled, single-look complex (SLC) SAR image product. Multiple looks may be generated by averaging over range and/or azimuth resolution cells. For animprovement in radiometric resolution using multiple looks there is an associated degradation in spatial resolution. Note that there is a difference between the number of looks physically implemented in a processor, and the effective number of looks as determined by the statistics of the image data.
Magnitude -One of three parameters required to describe a wave. Magnitude is the amplitude of the wave irrespective of the phase. For a complex signal described by in-phase (I) and quadrature (Q) components, the magnitude is given by sqrt(I2+Q2). For complex amplitude A, magnitude is, by definition, lAl.
SAR Land Applications SAR Land Applications -- TutorialTutorial
7. Glossary7. GlossaryMicrowave - A very short electromagnetic wave. The portion of the electromagnetic spectrum lying between the far infrared (IR) and the conventional radio frequency portion. While not bounded by definition, it is commonly regarded as extending from 1 mm to1 m in wavelength (300 GHz to 0.3 GHz frequency). Passive systems operating at these wavelengths sometimes are called microwave systems. Active systems are called radar, although the literal definition of radar requires a distance measuring capability not always included in active systems.
Monostatic Radar - A monostatic radar system transmits and receives its energy through the same antenna system or through collocated antennas.
Motion Compensation - Adjustment of a sensing system and/or the recorded data to remove effects of platform motion, including rotation and translation, and variations in along-track velocity. Motion compensation is essential for aircraft SARs, but usually is not needed for spacecraft SARs.
Multi-look - See Looks
Multifrequency Radar - Broadband systems that transmit pulses in a range of frequencies and wavelengths.
Multipolarisation Radar -A radar capable of simultaneously and coherently acquiring several independent complex polarisation measurements for every pixel in the image.
P-Band - A frequency range from 0.999 to 0.2998 GHz (30 to 100 cm wavelength) within the microwave (radar) portion of the electromagnetic spectrum. P-band is an experimental SAR frequency that has only been used to-date for research and development purposes. It is part of the NASA JPL AIRSAR multi-frequency (C-, L- & P-band) SAR system designed for Earth observation experiments. P-band is not hindered by atmospheric effects and is capable of seeing through heavy rain showers. P-band SAR penetration capabilities are very significant with regard to vegetation canopies, glacier or sea ice, and soil.
Phased Array Radar - A phased array radar uses an antenna that consists of an array of antenna elements along with signal
processing that allows the antenna to be steered electronically.
Phase Preserving - When the phase at the peak is correct, the processing algorithm is referred to as phase preserving, regardless of the phase variation across the impulse response.
SAR Land Applications SAR Land Applications -- TutorialTutorial
7. Glossary7. Glossary
Phase Unwrap - In SAR interferometry, the phase delay of the carrier signal at a certain point in the interferogram is a function of the terrain height at that point. However, the phase of the carrier signal can only be measured to within one cycle, or 360 degrees. Phase unwrapping refers to converting the measured phase to the absolute phase, by adding the appropriate number of cycles, or multiple of 360 degrees, to the measured phase.
Polarimetric Active Radar Calibrator (PARC) - Device used to receive and retransmit radar pulses. These devices usually consist of a polarisation sensitive receive and transmit antenna and a stable amplifier which boosts the signal level so that the device being calibrated receives a high signal of a given polarisation.
Polarimetric Radar - A radar which permits measurement of the full polarisation signature of every resolution element.
Polarisation - Orientation of the electric (E) vector in an electromagnetic wave, frequently "horizontal" (H) or "vertical" (V) in conventional imaging radar systems. Polarization is established by the antenna, which may be adjusted to be different on transmit and on receive. Reflectivity of microwaves from an object depends on the relationship between the polarization state and the geometric structure of the object. Common shorthand notation for band and polarization properties of an image file is tostate the band, with a subscript for the receive and the transmit state of polarization, in that order.
Polarisation Ellipse - For an elliptically polarised wave, the tip of the electric field vector traces an ellipse on a plane that is transverse to the wave propagation direction. This polarisation ellipse describes the polarisation properties of the electromagnetic waves, including the ratio of the perpendicular electric field components and their relative phases.
Power - Strength of a field or of a distribution, such as an image file, proportional to magnitude, squared (see Intensity).
Pulse - A short burst of electromagnetic radiation transmitted by the radar. Also described as a group of waves with a distribution confined to a short interval of time. Such a distribution is described in the time domain, or in spatial dimensions, by its width and its amplitude or magnitude, from which its energy may be found. In radar, use is made of modulated or coded pulses which must be processed to decode or compress the original pulse to achieve the impulse response observed in the image.
SAR Land Applications SAR Land Applications -- TutorialTutorial
7. Glossary7. Glossary
Pulse Repetition Frequency (PRF) - Rate of recurrence of the pulses transmitted by a radar.
Radar Antenna -The radar antenna is a structure for transmitting and receiving radiated energy; it is an important subsystem that defines, to a great extent, a radar's operational capabilities and cost. In radar remote sensing the main function of the antenna is to concentrate a radiated microwave energy into a beam of required shape, referred to as the antenna pattern, to transmit it into the desired direction (look direction), and to receive the returned energy from surfaces or objects. Radar remote sensing antennas provide scene illumination.
Radar Cross Section (RCS) - Measure of radar reflectivity. The Radar Cross Section (RCS) is expressed in terms of the physical size of an hypothetical uniformly scattering sphere that would give rise to the same level of reflection as that observed from the sample target.
Radar Equation - Mathematical expression that describes the average received signal level (or, sometimes, the image signal level), compared to the additive noise level, in terms of system parameters. Principal parameters include transmitted power, antenna gain, noise power, and radar range. The range effect is sometimes called the spreading factor, since effective power decreases significantly with a small increase in range. All else equal, the power received by a SAR per image pixel is proportional to R3.
Radio Echo - The signal reflected by a radar target, or the trace produced by this signal on the screen of the cathode-ray tube in a radar receiver.
Radiometric Resolution - The expected spread of variation in each estimate of scene reflectivity as observed in an image. Smaller radiometric resolution is "better". Radiometric resolution for a given radar may be improved by averaging, but at the cost of spatial resolution.
Radiometer - An instrument for quantitatively measuring the intensity of electromagnetic radiation in some band of wavelengths in any part of the electromagnetic spectrum. Usually used with a modifier, such as an infrared radiometer or a microwave radiometer.
SAR Land Applications SAR Land Applications -- TutorialTutorial
7. Glossary7. Glossary
Radiometric Calibration - The process to radiometrically calibrate SAR data considering the Antenna Gain Pattern, Range Spread Loss and Scattering area according to the Radar Equation.
Range Resolution - Resolution characteristic of the range dimension, usually applied to the image domain, either in the slant range plane or in the ground range plane. Range resolution is fundamentally determined by the system bandwidth in the range channel.
Range Time - The fast time within a received pulse, relative to the pulse transmission time.
Raw Data - Raw data are data as received from the SAR system.
Reflectivity - Property of illuminated objects to reradiate a portion of the incident energy. Reflectivity, in general, is larger in the specular direction for smaller surface roughness. For side looking radars, backscatter is the observable portion of the energy reflected. Backscatter, in general, is increased by greater surface roughness. In general, reflectivity is increased for higher conductivity of the scattering surface. The relative strength of radar reflectivity is tabulated by sigma, for discrete objects, and by sigma nought for natural terrain surfaces.
Repeat Pass Interferometry - Method based on two image acquisitions of the same scene from slightly displaced orbits of a satellite. Phase information of the two image data files are superimposed. The two phase values at each pixel are then subtracted, leading to an interferogram that records only the differences in phase between the two original images. Phase differences can be related to the altitude variation at each position in the swath and enable the production of a Digital Elevation Model (DEM). For optimum results, there should be no change in the backscatter to maintain coherence; vegetated sites are therefore a problem. For detection of feature movement (e.g. tracking glaciers) orbits should be as close as possible. And knowledge of the sensor location is critical. With a good baseline and coherence, this technique can be better than stereo (~10 m vertical accuracy).
Resolution - Generally (but loosely) defined as the width of the "point spread function", the "Green's function", or the " impulse response function", depending on whether one has an optics, a physics, or an electronic systems background. More properly, "resolution" refers to the ability of a system to differentiate two image features corresponding to two closely spaced small objects in the illuminated scene when the brightness of the two objects in question are comparable and fall within the dynamic range of the radar in question. (Definition adapted from Lord Rayleigh [1879]). "Higher resolution" refers to a system having a smaller impulse response width.
SAR Land Applications SAR Land Applications -- TutorialTutorial
7. Glossary7. Glossary
Resolution Cell - A three-dimensional cylindrical volume surrounding each point in the scene. The cell range depth is slant range resolution, its width is azimuth resolution, and its height, which is conformal to the illumination wavefront, is limited only by the vertical
beam width of the antenna pattern. Resolution cell often is defined with respect to the local horizontal.
SAR Focusing - In a long synthetic aperture (array), SAR focusing involves the removal and compensation of path length differences from the antenna to the target on the ground. The main advantage of a focused synthetic aperture is that it increases its array length over those radar signals that can be processed, and thus increases potential SAR resolution at any range. SAR focusing is a necessary process when the length of a synthetic array is a significant fraction of the range to ground being imaged, as the lines-of-sight (range) from a particular point on the ground to each individual element of the array differ in distance. These range differences, or path length differences, of the radar signals can affect image quality. In a focused SAR image these phase errors can be compensated for by applying a phase correction to the return signal at each synthetic aperture element. Focusing errors may be introduced by unknown or uncorrected platform motion. In an unfocused SAR image, the usable synthetic aperture length is quite limited.
S-Band - A nominal frequency range from 4 to 2 GHz (7.5 to 15 cm wavelength) within the microwave (radar) portion of the electromagnetic spectrum. S-band radars are used for medium-range meteorological applications, for example rainfall measurements, as well as airport surveillance and specialised tracking tasks.
Scanning Synthetic Aperture Radar (ScanSAR) - A having the capability to illuminate several subswaths by scanning its antenna off-nadir into different positions.
Sensitivity Time Control (STC) - Pre-programmemed change in radar amplitude due to weaker backscatter from greater ranges and varying incidence angles across the imaged swath.
Shadow - From an optical point of view as seen from the position of a radar, a region hidden behind an elevated feature in the scene would be out of sight. This region corresponds to that which does not get illuminated by the radar energy, and thus is also not visible in the resulting radar image. The region is filled with "no reflectivity", which appears as small digital numbers, or a dark region in hard copy.
SAR Land Applications SAR Land Applications -- TutorialTutorial
7. Glossary7. Glossary
Sidelobes - Non-zero levels in a distribution that are separated from the desired central response. Sidelobes arise naturally in antenna patterns, for example, although in general they are a nuisance, and must be suppressed as much as possible. Large side-lobes may lead to unwanted multiple images of a single feature.
sigma () - The conventional measure of the strength of a radar signal reflected from a geometric object (natural or manufactured) such as a corner reflector. Sigma specifies the strength of reflection in terms of the geometric cross section of a conducting sphere that would give rise to the same level of reflectivity. (Units of area, such as metres squared). (See radar cross section.)
sigma nought () - Scattering coefficient, the conventional measure of the strength of radar signals reflected by a distributed scatterer, usually expressed in dB. It is a normalized dimensionless number, comparing the strength observed to that expected from an area of one square metre. Sigma nought is defined with respect to the nominally horizontal plane, and in general has a significant variation with incidence angle, wavelength, and polarization, as well as with properties of the scattering surface itself.
Slant Range - Image direction as measured along the sequence of line-of-sight rays from the radar to each and every reflecting point in the illuminated scene. Since a SAR is looks down and to the side, the slant range to ground range transformation has aninherent geometric scale which changes across the image swath.
Speckle - Statistical fluctuation or uncertainty associated with the brightness of each pixel in the image of a scene. A single look SAR system achieves one estimate of the reflectivity of each resolution cell in the image. Speckle may be reduced, at the expense of resolution, in the SAR processor by using several looks. Speckle appears as a multiplicative random process whose variance and spatial correlation are determined primarily by the SAR system.
Synthetic Aperture - A synthetic aperture, or virtual antenna, consists of a long array of successive and coherent radar signals that are transmitted and received by a physically short (real) antenna as it moves along a predetermined flight or orbital path. The synthetic aperture is formed by pointing the real radar antenna of relatively small dimensions, which are restricted in size by the satellite platform, broadside to the direction of forward motion of that platform. The points at which successive pulses are transmitted can be thought of as the elements of a long synthetic array, which a signal processor will then use and process to generate a SAR image. This detailed array of radar signal data is the key to achieving high azimuth resolution. This long virtual antenna concept is the basis for synthetic aperture radar, or SAR.
SAR Land Applications SAR Land Applications -- TutorialTutorial
7. Glossary7. Glossary
Synthetic Aperture Radar (SAR) - A synthetic aperture radar, or SAR, is a coherent radar system that generates high-resolution remote sensing imagery. Signal processing uses magnitude and phase of the received signals over successive pulses from elements of a synthetic aperture to create an image. As the line of sight direction changes along the radar platform trajectory, a synthetic aperture is produced by signal processing that has the effect of lengthening the antenna. The achievableazimuth resolution of a SAR is approximately equal to one-half the length of the actual (real) antenna and does not depend on platform altitude (distance). High range resolution is achieved through pulse compression techniques. In order to map the groundsurface the radar beam is directed to the side of the platform trajectory; with a sufficiently wide antenna beam width in the along-track direction, an identical target or area may be illuminated a number of times without a change in the antenna look angle.
Stokes Matrix - 4x4 array of real numbers that describes the transformation of the Stokes parameters of the incident wave into the Stokes parameters of the electromagnetic wave reflected by each element of a scene illuminated by a radar. The Stokes matrixdescribes the complete polarization signature of the reflective medium.
Stokes Parameters - Set of four real numbers that together describe the state of polarization of an electromagnetic wave.
Swath - Width of the imaged scene in the range dimension, measured either in ground range or in slant range.
Texture - Second order spatial average of brightness. Scene texture is the spatial variation of the average reflectivity. For areas of nominally constant average reflectivity, image texture consists of scene texture multiplied by speckle.
Tone - First order spatial average of image brightness, often defined for a region of nominally constant average reflectivity.
Transmission - Energy sent by the radar, normally in the form of a sequence of pulses, to illuminate a scene of interest.
Trihedral - Corner reflector formed from three mutually orthogonal surfaces.
Volume Scattering - Multiple scattering events occurring inside a medium, generally neither dense nor having a large loss tangent, such as the canopy of a forest. The relative importance of volume scattering is governed by the dielectric properties of the material.
SAR Land Applications SAR Land Applications -- TutorialTutorial
7. Glossary7. Glossary
Vertical Polarisation - Linear polarisation with the lone electric vector oriented in the vertical direction in antenna co-ordinates.
Wavelength - In a periodic wave, the distance between two points of corresponding phase in consecutive cycles
X-Band - A nominal frequency range from 12.5 to 8 GHz (2.4 to 3.75 cm wavelength) within the microwave (radar) portion of the electromagnetic spectrum. X-band is a suitable frequency for several high-resolution radar applications and has often been used for both experimental and operational airborne SAR systems, designed for military as well as civilian remote sensing applications. The corresponding wavelength for these systems is on the order of 3 cm, which has been found useful for mapping and surveillance tasks.
Zero Doppler Time - It is the along-track (azimuth) time at which a target on the ground would have a Doppler shift of zero with respect to the satellite ( i.e. when the target was perpendicular to the flight path). Also called the closest approach azimuth time.
SAR Land Applications SAR Land Applications -- TutorialTutorial
8. References8. References
Carrara W., R. Goodman, and R. Majewsky, Spotlight Synthetic Aperture Radar: Signal Processing Algorithms, Artech House, 1985. - Advanced
Curlander J.C. and R.N. McDonough, Synthetic Aperture Radar: Systems and Signal Processing, Wiley-Interscience, November, 1991. - Advanced
Dixon T. (Editor), SAR Interferometry and Surface Change Detection, Report of a Workshop held in Boulder, 1995, http://southport.jpl.nasa.gov/science/dixon. - Basic
Elachi C.,T. Bicknell, R. Jordan, and C. Wu, Spaceborne Synthetic Aperture Imaging Radars: Application, Techniques, and Technology, IEEE Vol. 70, October 1982. - Basic
ESA, ASAR product handbook, http://www.envisat.esa.int/dataproducts. - Basic
Henderson F. and Lewis A. (Editors), Manual of Remote Sensing, Volume 2, Principles and Applications of Imaging Radar, ISBN: 0-471-33046-9, 1998. - Basic
Hovanessian S., Introduction to synthetic array and imaging radar, Artech House, 1980. - Basic
Massonnet D. and K. Feigl, Radar interferometry and its applications to changes in the Earth’s surface, Review of Geophisics, 36/4, 1998. (http://www.ingv.it/barba/igl/2003/Massonnet_98.pdf) - Basic to Advanced
SAR Land Applications SAR Land Applications -- TutorialTutorial
8. References8. References
Oliver C. and S. Quegan, Understanding Synthetic Aperture Radar Images, ArtechHouse, 1998. - Basic to Advanced
Olmert C., Alaska SAR Facility Scientific SAR User’s Guide, http://www.asf.alaska.edu/SciSARuserGuide.pdf -Basic
Schreier G. (Editor), SAR Geocoding: Data and Systems, Wichmann, 1993. - Basic to Advanced
Ulaby F.T., R. Moore, and A.K. Fung, Microwave Remote Sensing (Volume 1,2,3), Addison Wesley, Reading (MA), 1981, 1982, 1986. - Advanced
Ulaby F.T. and C. Elachi (Editors), Radar Polarimetry for Geoscience Applications, Artech House, Nordwood, 1989. - Advanced
For a complete reference list refer to http://southport.jpl.nasa.gov/science/SAR_REFS.html