Embed Size (px)
Citation preview

J Supercond Nov MagnDOI 10.1007/s10948-014-2769-8
ORIGINAL PAPER
Synthesis of Superparamagnetic NanoparticleNi0.50Zn0.50Fe2O4 Using Wet Chemical Method
Manoj M. Kothawale · Rajesh Pednekar ·Sher Singh Meena
Received: 28 August 2014 / Accepted: 1 September 2014© Springer Science+Business Media New York 2014
Abstract The nanoparticles of Ni0.50Zn0.50Fe2O4 wereprepared using cotton base wet chemical method. The X-ray diffraction (XRD) spectrum shows single phase cubicspinel structure, and crystallize size calculated using theDebye–Scherrer formula for 311 planes was found to be41 nm ± 5 %. The nano range sizes of particle were con-firmed using transmission electron microscope (TEM) andatomic force microscopy (AFM) images. The porosity valueof the sample is promising towards sensor applications.Infrared spectroscopic results reveal two main absorptionbands, indicating sample is having single phase spinel struc-ture with two sublattices. The high DC resistivity of thesample is attributed to nano range particle sizes. The super-paramagnetic (SPM) nature was confirmed from a variationof magnetic moment with applied magnetic field usingVSM. The Mossbauer spectrum recorded at room tempera-ture shows two major sextets corresponding to A- and B-siteFe ions. The relaxed sextet is associated with the atomsnear the surface of the nanoparticles experiencing disor-dered spins. The central doublet in Mossbauer spectra ofthe sample indicates SPM particles. The isomer shift resultsshow that all the Fe ions are in high state.
M. M. Kothawale (�)Department of Physics, DM’s College of Arts, Scienceand Commerce, Assagao, Goa 403507, Indiae-mail: [email protected]
R. PednekarDepartment of Chemistry, DM’s College of Arts,Science and Commerce, Assagao, Bardez Goa, 403507, India
S. S. MeenaSolid State Physics Division, Physics Division, Bhabha AtomicResearch Centre, Mumbai, 400085, India
Keywords Ni–Zn ferrites · XRD · TEM ·Superparamagnetism · Isomer shift · DC resistivity
1 Introduction
Spinel ferrites are technologically important for severalelectromagnetic devices because of their high Curie temper-ature, high permeability, high electrical resistivity, low eddycurrent, and low dielectric loss. Ni–Zn ferrites are commer-cially important due to their uses in devices operating athigh frequency such as radio-frequency coils, transformercores, etc. [1]. The properties of ferrite are sensitive tomethod of preparation, compositions, particle sizes, andsize distribution [2]. In the present work, nanoparticles ofNi0.50Zn0.50Fe2O4 were prepared using cotton base wetchemical method. Properties such as particle sizes, satura-tion magnetization, DC electrical resistivity, porosity, andMossbauer hyperfine parameters were studied.
2 Experimental
Calculated amount of ferric nitrate, nickel nitrate, and zincnitrate (all salts of AR grade) in stoichiometry proportionswere dissolved in the minimum amount of distilled water.This solution was soaked using the optimum amount of cot-ton. The soaked cotton pieces were placed in crucible andheated in conventional box-type furnace for 6 h at 600 ◦C.The decomposition of soaked solution resulted into finepowder of Ni–Zn ferrite. The powder obtained was used forcharacterization. The X-ray powder diffraction pattern wasrecorded on Rigaku X-ray diffractometer using CuKα radi-ation and 2θ scanning range from 20◦to 80◦. IR spectrum
J Supercond Nov Magn
of sample was recorded using a Shimatzu Fourier transforminfrared (FTIR) 8900 spectrometer in the range of 300−o4000 cm−1. The pallet was prepared with KBr to a sampleratio of 1:100 for IR measurements. Transmission electronmicroscope (TEM) image was recorded on Hitachi H7500.Atomic force microscopy (AFM) image was recorded onNT-MDT’s Integra AFM via semicontact mode. Variation ofmagnetic moment at room temperature was recorded usingVSM (Lakeshore model 7404) up to a field of 2 T, and cor-responding hysteresis curve was obtained. The room tem-perature Mossbauer spectrum of the sample was recorded inconstant acceleration mode using a 57Co. The calibration ofthe velocity scale was done using 57Fe metal foil. Mass den-sity was calculated using the Archimedes principle [3]. Thefreshly prepared powder was pressed into pellet (10 mm diaand 2 mm thick) by applying pressure of 75 kN for 5 min.The pellet was then coated with silver on both surfacesfor having good electrical contact. The DC resistivity wasmeasured by a two-probe method using the Keithley elec-trometer in the temperature range of 30 to 500 ◦C in stepsof 5 ◦C.
3 Results and Discussion
3.1 X-ray Diffraction, TEM, and AFM Analysis
The X-ray diffraction (XRD) pattern of the sample isshown in Fig. 1. The strongest refection from (311) planedenotes the spinel phase. The positions of peaks complywith reported JCPDS file no. 8-234. This confirms thatsample under study is having single phase cubic spinelstructure. The observed lattice constant value of 8.3977 (A)is comparable with reported literature [1].
Fig. 1 XRD pattern of Ni0.50Zn0.50Fe2O4
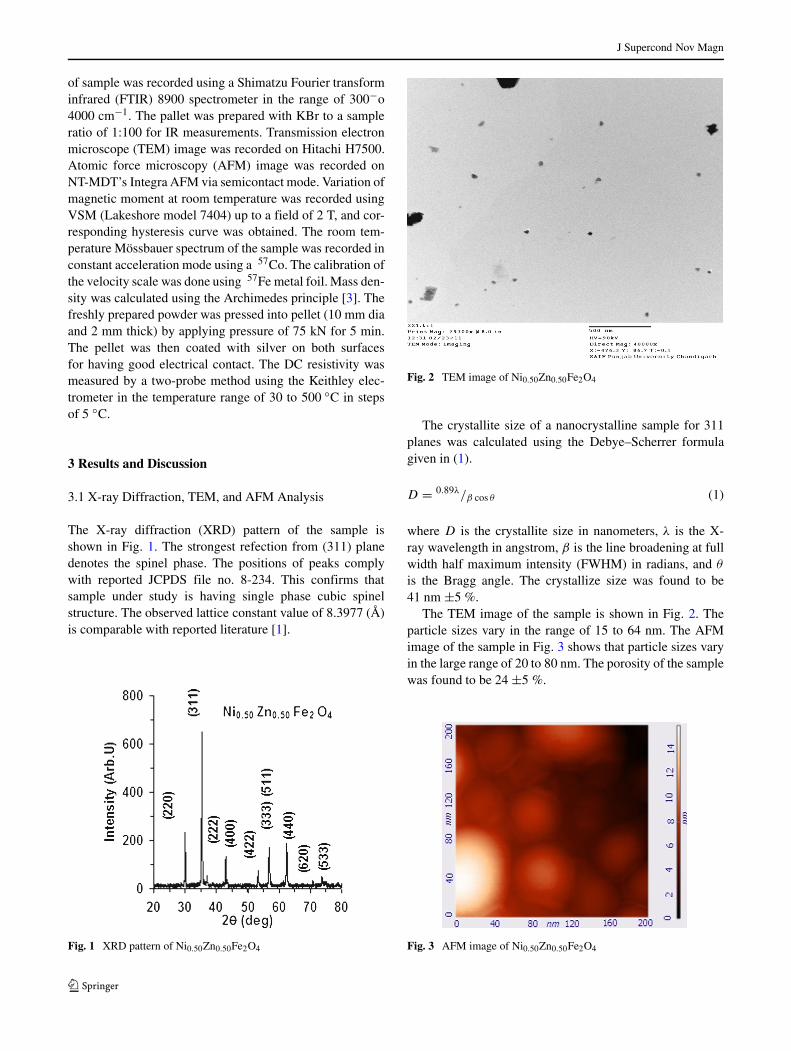
Fig. 2 TEM image of Ni0.50Zn0.50Fe2O4
The crystallite size of a nanocrystalline sample for 311planes was calculated using the Debye–Scherrer formulagiven in (1).
D = 0.89λ/β cos θ (1)
where D is the crystallite size in nanometers, λ is the X-ray wavelength in angstrom, β is the line broadening at fullwidth half maximum intensity (FWHM) in radians, and θ
is the Bragg angle. The crystallize size was found to be41 nm ±5 %.
The TEM image of the sample is shown in Fig. 2. Theparticle sizes vary in the range of 15 to 64 nm. The AFMimage of the sample in Fig. 3 shows that particle sizes varyin the large range of 20 to 80 nm. The porosity of the samplewas found to be 24 ±5 %.
Fig. 3 AFM image of Ni0.50Zn0.50Fe2O4

J Supercond Nov Magn
Fig. 4 IR spectrum of Ni0.50Zn0.50Fe2O4
3.2 IR Analysis
The IR absorption spectrum of sample show two absorp-tion bands as can be seen in Fig. 4. The higher band ν1 isbetween wave numbers 600 and 550 cm−1 whereas lowerband ν2 between 450 and 385 cm−1. This is a common fea-ture of all the ferrites indicating single phase spinel structurehaving two sub-lattices [4–7]. The highest band correspondsto intrinsic stretching vibrations of metals at the tetrahedralsite, whereas the lowest band is assigned to octahedral metalstretching.
3.3 DC Resistivity
The plot of log ρ vs. 1000/T of the sample is shown inFig. 5. It can be seen that the DC resistivity decreases withincreasing temperature showing typical semiconductor-likebehavior. The variation in resistivity curve can be dividedinto three temperature regions. Region (I) is in the rela-tively lower temperature range up to 400 K (∼ 125 ◦C). Inthis region, resistivity does not exhibit much variation withtemperature. The conduction phenomenon in this region is
Fig. 5 Log ρ vs. 1000/T of Ni0.50Zn0.50Fe2O4
Fig. 6 M–H loop of Ni0.5Zn0.5Fe2O4 at room temperature
mostly attributed to scattering of charge carriers by lat-tice vibrations, impurities in the sample, presence of latticedefects (defects are having smaller mobility), voids, andhigh resistive grain boundaries or existence of resonantphonon modes [8].
The region (II) was observed in the temperature rangearound 400 to 675 K (125 to 400 ◦C). In this region, resis-tivity decreases with increase in temperature and the con-duction phenomenon is attributed to the thermally activatedmobility of the charge carriers. The change in slope of thecurve was also found in this region. The small dip or cuspsin the curves causing change in the slope can be clearlyseen. This change is related to the magnetic transition fromferrimagnetic to paramagnetic state and corresponding tem-perature to the Curie point (TC) of the sample [9]. In region(III) for temperature range T>673 K (400 ◦C), the resis-tivity decreases rapidly with temperature (above TC). Thisdecrease in resistivity is mainly associated to the increase
Fig. 7 Mossbauer spectrum of Ni0.50Zn0.50Fe2O4

J Supercond Nov Magn
Table 1 The isomer shift (δ), quadrupole splitting (), hyperfine field values (H), outer line width (T ) and areas in percentage of tetrahedral(A) and octahedral (B) sites occupied by Fe3+ ions of Ni0.50Zn0.50Fe2O4 sample derived from Mossbauer spectra recorded at room temperature
Iron site
Parameters A B C Doublet
Hyperfine field, H (T ) 44.13 51.23 29.62 –
Isomer shift (δ) mm/s 0.311 0.490 0.352 0.335
Quadrupole splitting, (mm/s) 0.003 0.111 0.018 0.433
Outer line width, T (mm/s) 2.240 0.185 6.556 0.423
Area % 56.20 2.43 31.36 10.01
[Isomer shift values are relative to αα-Fe (0.00 mm/s) foil]
in thermally activated drift mobility of the charge carri-ers in accordance with the hopping conduction model [10].The higher-temperature region above TC is corresponding toa paramagnetic disordered region with comparatively highactivation energy. The room temperature resistivity of nanosamples is of the order of 6.5 × 10⁷ ohm/cm.
3.4 M −H Loop
The variation of magnetization (M) with the static appliedmagnetic field (H) (up to 2 T) at room temperature isshown in Fig. 6. The magnetization increases with increas-ing applied magnetic field and attains its saturation valuefor fields higher than 0.50 T. The saturation magnetiza-tion was found to be 68 emu/g. The close hysteresis loopobserved at room temperature indicates superparamagnetic(SPM) nature of nanoparticles.
3.5 Mossbauer Spectrum
The room temperature Mossbauer spectrum recorded tomonitor the local environment around Fe cations is shownin Fig. 7. The solid line in Fig. 7 represents the simulatedcurves, whereas solid circles represent experimental datapoints. Each spectrum was fitted with the three magneticsextets which are arising due to Zeeman splitting. The twomajor sextets are corresponding to Fe ions residing at theA site (inner sextet) and B site (outer sextet) of the lattices.This is an indication of ferrimagnetic behavior of the sam-ples [11]. The observed six-line magnetic patterns in thespectra are attributed to super exchange interaction betweenthe magnetic ions at A and B sub-lattices.
The third broad featureless absorption sextet character-ized by a significant reduction of the magnetic hyperfinefield is associated with relaxation effect. The Fe ions corre-sponding to broad sextet with much smaller hyperfine fieldthan that of major sextet may be associated with the atomsnear the surface of the nanoparticles experiencing disor-dered spins [12]. This relaxation effect may also be due to
the presence of strong interparticle interactions and nanosizes of particles of the samples [13]. The area of this broadsextet may be associated with the range of nanoparticles.The appearance of central doublet is indicating the presenceof SPM particles in the sample. The various Mossbauerparameters of sample are given in Table 1. The results of theisomer shift vary in the range of 0.311 to 0.490 mm/s. Thisshows that Fe ions are in the trivalent state. The quadrupoleshift () values were found to be low and is indicatingthat the local symmetry of the magnetic phase of A sitesis close to cubic, while that of B site is close to trigonal[14, 15].
4 Conclusions
The nanoparticles of Ni0.5Zn0.5Fe2O4 were successfullysynthesized by simple and easy cotton base wet chemicalmethod. The crystallite size calculated using X-ray spec-tra is comparable with particle sizes obtained from TEMand AFM images. The high DC resistivity at room tem-perature is attributed to nano sizes of particles. The sampleshow high saturation magnetization and superparamagneticnature at room temperature. The Fe ions at the A and B sitesare in trivalent state. The detailed dielectric studies can beundertaken in the future.
Acknowledgments The author is thankful to UGC, New Delhi, forgranting the Minor Research Project.
References
1. Jadhav, S.S., Shirsath, S.E., Toksha, B.G., Shukla, S.J., Jadhav,K.M.: Chin. J. Chem. Phys. 21, 381–386 (2008)
2. Mahmud, S.T., Akther Hossain, A.K.M., Abdul Hakim, A.K.M.,Seki, M., Kawai, T., Tabata, H.: J. Magn. Magn. Mater. 305, 269–274 (2006)
3. Sheikh, A.D., Mathe, V.L.: J. Mater. Sci. 43, 2018–2025 (2008)4. Akther Hossaina, A.K.M., Mahmuda, S.T., Seki, M., Kawai, T.,
Tabata, H.: J. Magn. Magn. Mate. 312, 210–219 (2007)

J Supercond Nov Magn
5. Ayer, R., Desai, R., Upadhay, R.V.: Bull. Mater. Sci. 32, 141–147(2009)
6. Ayer, R., Desai, R., Upadhay, R.V.: Indian J. Pure Appl. Phys. 47,180–185 (2009)
7. Ladgaonkar, B.P., Kolekar, C.B., Vaingankar, A.S.: Bull. Mater.Sci. 25, 351–358 (2002)
8. El-Sayed, A.M.: Mater. Chem. Phys. 82, 583–587 (2003)9. Srinivasan, T.T., Ravindranathan, P., Cross, L.E., Roy, R.,
Newman, R.E., Sankar, S.G., Patil, K.C.: J. Appl. Phys. 63, 3789–3794 (1988)
10. Bhosale, A.G., Chougule, B.K.: Mater. Lett. 60, 3912–3915(2006)
11. Dhiman, R.L., Taneja, S.P., Reddy, V.R.: Ad. Cond. Matt. Phys.,1–7 (2008)
12. Singh, L.H., Govindaraj, R., Amarendra, G., Sundar, C.S.: AIPConf. Proc. 1447, 445–446 (2012). doi:10.1063/1.4710071
13. Albuquerque, A.S., Ardisson, J.D., Waldemar, A.A.M., Alves, M.:J. Appl. Phys. 87, 4352–4357 (2000)
14. Attia, S.M.: Egypt. J. Solids 29(2), 329–339 (2006)15. Blasko, J., Garcia, J.: Phys. Rev. B 83, 104–105 (2011)