Embed Size (px)
Citation preview
Synthesis of silica particles for the use
as probe in diffusion by FRAP and NMR-
diffusometry
Master of Science Thesis
MARIE IVARSSON
Department of Chemical and Biological Engineering
Division of Applied Surface Chemistry
CHALMERS UNIVERSITY OF TECHNOLOGY
Gothenburg, Sweden, 2013
ii
Master of Science Thesis
Synthesis of silica particles for the use as probe in diffusion by FRAP and NMR-diffusometry
MARIE IVARSSON
Examiner: Prof. Krister Holmberg Supervisors: Dr. Romain Bordes and Dr. Maria Pihl
Department of Chemical and Biological Engineering Division of Applied Surface Chemistry
Chalmers University of Technology Gothenburg, Sweden 2013
iii
Synthesis of silica particles for the use as probe in diffusion by FRAP and NMR-diffusometry
MARIE IVARSSON
© MARIE IVARSSON, 2013.
Department of Chemical and Biological Engineering
Chalmers University of Technology
SE-412 96 Göteborg
Sweden
Telephone + 46 (0)31-772 1000
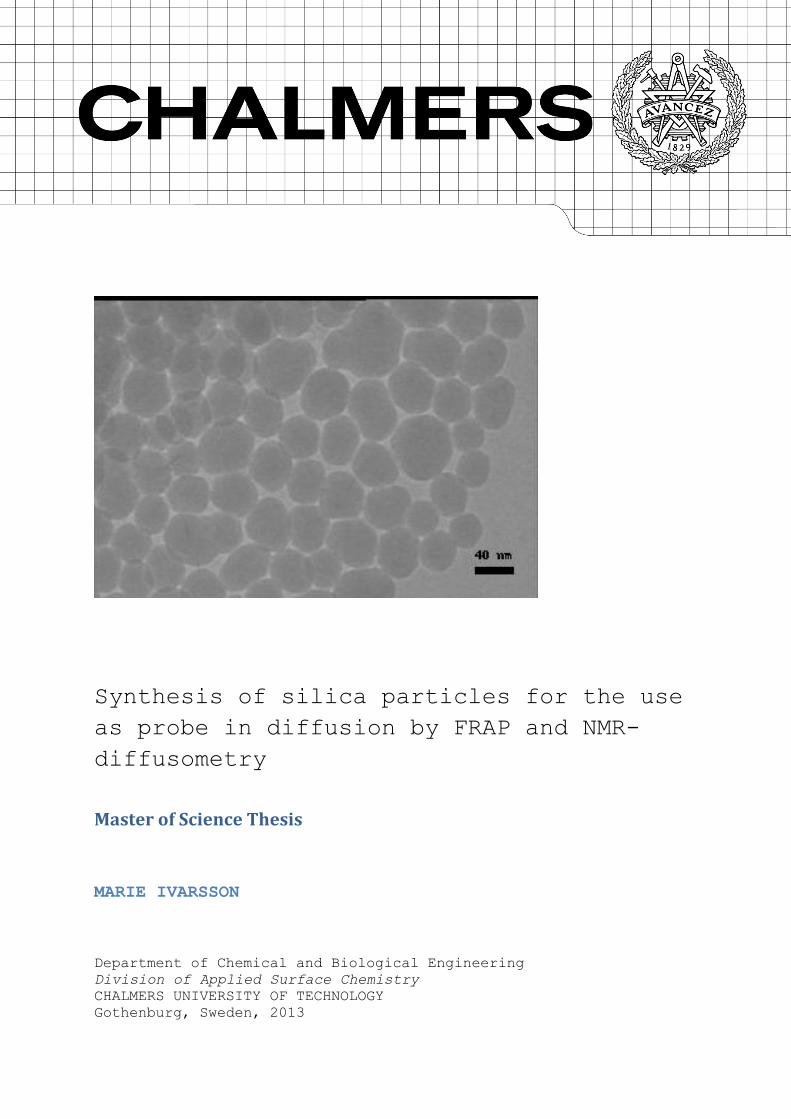
Cover: TEM image of synthesized and surface modified sample of silica nanoparticles called APTMS II 3rd
iv
Synthesis of silica particles for the use as probe in diffusion by FRAP and NMR-
diffusometry
Marie Ivarsson Division of Applied Surface Chemistry
Department of Chemical and Biological Engineering Chalmers University of Technology
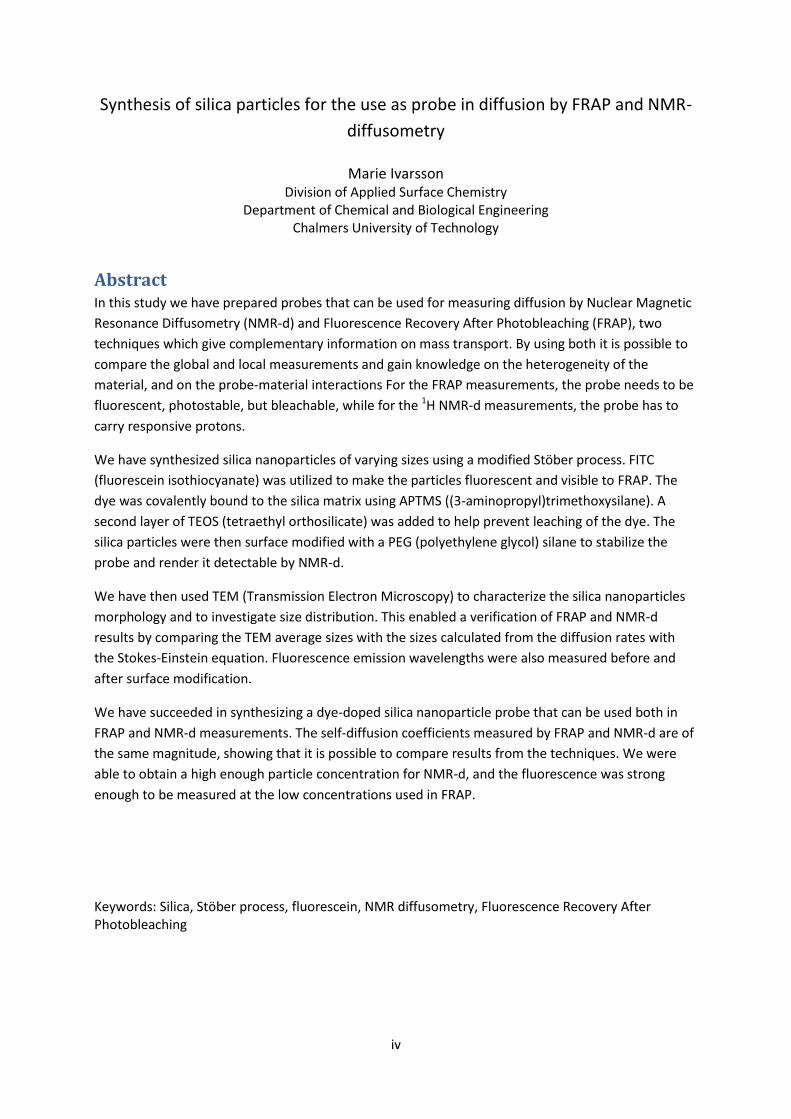
Abstract In this study we have prepared probes that can be used for measuring diffusion by Nuclear Magnetic
Resonance Diffusometry (NMR-d) and Fluorescence Recovery After Photobleaching (FRAP), two
techniques which give complementary information on mass transport. By using both it is possible to
compare the global and local measurements and gain knowledge on the heterogeneity of the
material, and on the probe-material interactions For the FRAP measurements, the probe needs to be
fluorescent, photostable, but bleachable, while for the 1H NMR-d measurements, the probe has to
carry responsive protons.
We have synthesized silica nanoparticles of varying sizes using a modified Stöber process. FITC
(fluorescein isothiocyanate) was utilized to make the particles fluorescent and visible to FRAP. The
dye was covalently bound to the silica matrix using APTMS ((3-aminopropyl)trimethoxysilane). A
second layer of TEOS (tetraethyl orthosilicate) was added to help prevent leaching of the dye. The
silica particles were then surface modified with a PEG (polyethylene glycol) silane to stabilize the
probe and render it detectable by NMR-d.
We have then used TEM (Transmission Electron Microscopy) to characterize the silica nanoparticles
morphology and to investigate size distribution. This enabled a verification of FRAP and NMR-d
results by comparing the TEM average sizes with the sizes calculated from the diffusion rates with
the Stokes-Einstein equation. Fluorescence emission wavelengths were also measured before and
after surface modification.
We have succeeded in synthesizing a dye-doped silica nanoparticle probe that can be used both in
FRAP and NMR-d measurements. The self-diffusion coefficients measured by FRAP and NMR-d are of
the same magnitude, showing that it is possible to compare results from the techniques. We were
able to obtain a high enough particle concentration for NMR-d, and the fluorescence was strong
enough to be measured at the low concentrations used in FRAP.
Keywords: Silica, Stöber process, fluorescein, NMR diffusometry, Fluorescence Recovery After Photobleaching
v
Table of Contents 1. Introduction ..................................................................................................................................... 1
1.1 Aim........................................................................................................................................... 2
2. Theoretical Background................................................................................................................... 3
2.1 Diffusion .................................................................................................................................. 3
2.2 Silica as a probe ....................................................................................................................... 3
2.2.1 Silica ................................................................................................................................. 4
2.2.2 Chemistry of silica ............................................................................................................ 4
2.2.3 Particles Synthesis: The Stöber Process .......................................................................... 5
2.3 Introduction of fluorescence in silica (FRAP) .......................................................................... 7
2.3.1 Fluorescein doped silica nanoparticles ........................................................................... 7
2.4 Introduction of PEG on the silica particles ............................................................................ 11
2.5 Purification of particles ......................................................................................................... 12
2.5.1 Centrifugation ................................................................................................................ 13
2.5.2 Dialysis ........................................................................................................................... 13
2.5.3 Ultrafiltration ................................................................................................................. 13
2.6 Characterization of particles ................................................................................................. 13
2.6.1 Structural characterization ............................................................................................ 13
2.6.2 Diffusion measurements ............................................................................................... 14
2.6.3 Fluorescence Emission Wavelength .............................................................................. 15
2.6.4 Dynamic Light Scattering (DLS) ...................................................................................... 16
3. Materials and Methods ................................................................................................................. 16
3.1 Materials ................................................................................................................................ 16
3.1.1 Chemicals ....................................................................................................................... 16
3.2 Methods ................................................................................................................................ 16
3.2.1 Synthesis ........................................................................................................................ 16
3.2.2 Purification .................................................................................................................... 18
3.2.3 Surface Modification ..................................................................................................... 19
3.2.4 Characterization of particles ......................................................................................... 19
4. Results ........................................................................................................................................... 21
4.1 Particle synthesis and characterization ................................................................................. 21
4.1.1 Protocol 1: Based on Wang et al. .................................................................................. 21
4.1.2 Protocol 2: Based on Bogush et al. ................................................................................ 22
vi
4.1.3 Protocol 3: Incorporation of fluorescein into the silica matrix based on Zhang et al. and
Estévez et al. .................................................................................................................................. 23
4.2 Purification ............................................................................................................................ 26
4.3 Fluorescence Emission Wavelength ...................................................................................... 27
4.4 Diffusion measurements ....................................................................................................... 28
4.4.1 FRAP ............................................................................................................................... 28
4.4.2 NMR-d ........................................................................................................................... 30
4.4.3 Self-diffusion coefficient ................................................................................................ 33
4.5 DLS and Zetapotential ........................................................................................................... 33
5. Discussion ...................................................................................................................................... 34
5.1. Particle synthesis ................................................................................................................... 34
5.1.1 Size and morphology control of the probe ................................................................... 34
5.1.2 Fluorescence of the probe ............................................................................................. 34
5.2. Cleaning ................................................................................................................................. 35
5.3. Characterization .................................................................................................................... 35
5.4. Diffusion measurements ....................................................................................................... 36
6. Conclusion ..................................................................................................................................... 37
7. Further Work ................................................................................................................................. 38
8. Acknowledgements ....................................................................................................................... 39
9. References ..................................................................................................................................... 40
Appendix ................................................................................................................................................... i
1
1. Introduction Many areas in today’s research deal with the investigation and optimization of mass transport. Food
and products that we use on a daily basis are affected by their mass transport properties. From bread
to meat, the texture of food depends on its water holding capacity, making it important to have
knowledge of water transport in and/or out of materials. There is also a desire to prevent the loss of
vitamins and minerals during storage of food that could result from the transport of oxygen through
the packaging material. In the pharmaceutical industry it is important to be able to make sure that a
drug’s active substance is delivered to the correct site in the right amount and at a certain rate, and
for hygiene products it is desirable to optimize fluid intake. By investigating the behavior of a liquid in
terms of its flow, or contact with solid materials, it is possible to gain an understanding for its
properties. One way is by measuring the diffusion of a probe in the material. There is always a need
for improving mass transport properties, and thus an interest in finding new tools to characterize the
properties of a material arises. In general, dealing with biological materials means dealing with
heterogeneous structures. In many of these cases, measuring diffusion is a challenge.[1]
SuMo (Competence Centre for Supramolecular Biomaterials) is a research collaboration between
Chalmers and industry. The purpose of SuMo is to gain understanding of and develop soft
biomaterials. Soft biomaterials are biological materials (as compared with biomaterials which are
commonly defined as materials with an interface in contact with the body). Soft biomaterials often
self-aggregate, making the structure of these materials heterogeneous. This can make measuring
flow and diffusion through soft biomaterials difficult.[2, 3]
It is not always possible to measure the diffusion directly, when the molecules present are not easily
detectable by the measuring methods. In those cases, a probe is added to the system, with the
markers necessary for it to be visible with the technique used. Nuclear Magnetic Resonance
Diffusometry (NMR-d) and Fluorescence Recovery After Photobleaching (FRAP) are both possible
methods for measuring diffusion. However, they have different requirements that need to be
fulfilled for the probe to be visible for each particular technique. For NMR-d, the probe needs to have
a molecule attached to its surface that will respond to a radiowave, i.e. it has to have a magnetic
momentum. To be FRAP compatible, the probe needs to be fluorescent. To have both these
requirements met in one and the same probe would be highly useful, since it would mean both types
of measurements could be done on probes synthesized from the same batch instead of one NMR-d
and one FRAP compatible. This would ensure that the particles show the same size distribution and
dispersion in solution.[4]
Even though NMR-d and FRAP allow measurements of the diffusion in heterogeneous materials,
these techniques differ on several points. NMR-d gives global measurements of the diffusion of the
probe, with high spatial resolution, while with FRAP it is a local measurement, i.e. in the region that is
bleached. NMR-d acquisition time is usually dependent on the probe concentration, which is
required to be higher than for FRAP to achieve short measurement time. FRAP is more sensitive
allowing lower concentrations, but the method is also more sensitive to background noise in the
form of unbound molecules, which will have an unproportional influence on the diffusion
measurements due to being smaller and therefore diffusing faster than the probe. NMR-d is useful in
looking at the interaction of the probe with its surroundings, and seeing how it influences the
2
mobility. By using both methods, it is possible to compare the global and local measurements and
gain knowledge on the heterogeneity of the material, and on the probe-material interactions.
A suitable probe should have several properties. It should be small enough to diffuse freely through the medium in which it is used. There should be no risk of it being trapped in a porous material, where the pores are too small for the probe to diffuse through, in which case the results would be influenced. Because of that it is also useful to be able to tailor the size for each particular
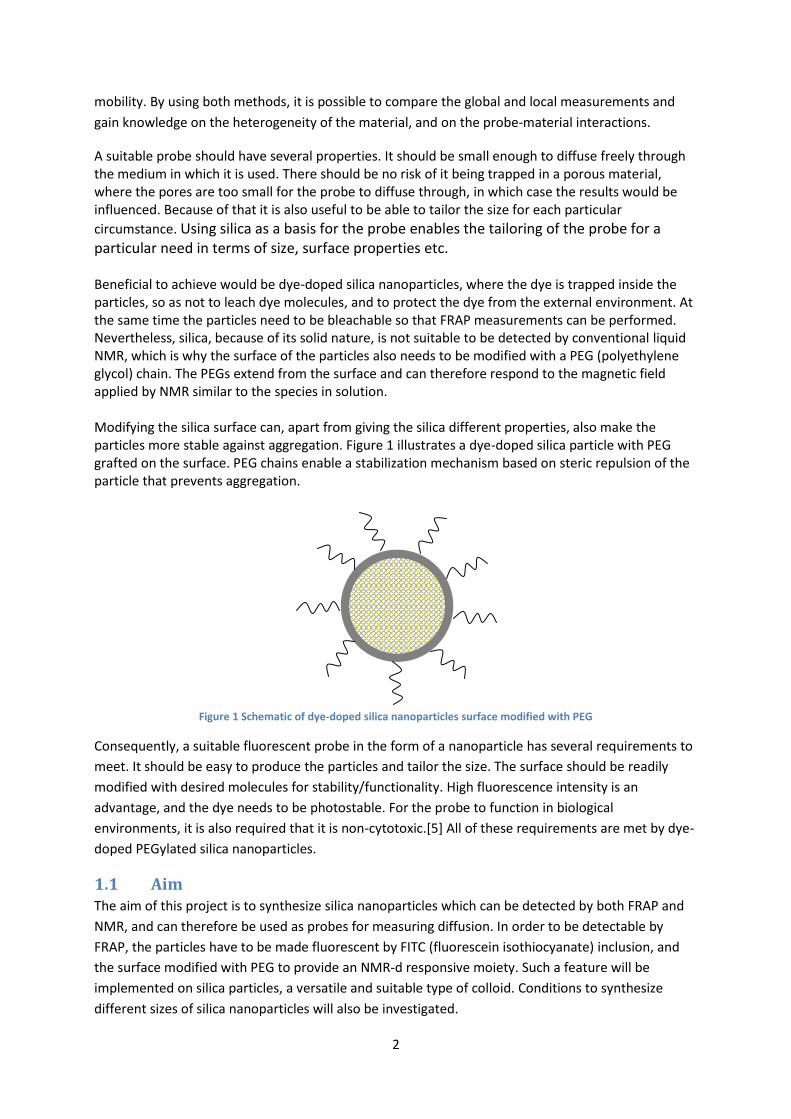
circumstance. Using silica as a basis for the probe enables the tailoring of the probe for a particular need in terms of size, surface properties etc. Beneficial to achieve would be dye-doped silica nanoparticles, where the dye is trapped inside the particles, so as not to leach dye molecules, and to protect the dye from the external environment. At the same time the particles need to be bleachable so that FRAP measurements can be performed. Nevertheless, silica, because of its solid nature, is not suitable to be detected by conventional liquid NMR, which is why the surface of the particles also needs to be modified with a PEG (polyethylene glycol) chain. The PEGs extend from the surface and can therefore respond to the magnetic field applied by NMR similar to the species in solution. Modifying the silica surface can, apart from giving the silica different properties, also make the particles more stable against aggregation. Figure 1 illustrates a dye-doped silica particle with PEG grafted on the surface. PEG chains enable a stabilization mechanism based on steric repulsion of the particle that prevents aggregation.
Figure 1 Schematic of dye-doped silica nanoparticles surface modified with PEG
Consequently, a suitable fluorescent probe in the form of a nanoparticle has several requirements to
meet. It should be easy to produce the particles and tailor the size. The surface should be readily
modified with desired molecules for stability/functionality. High fluorescence intensity is an
advantage, and the dye needs to be photostable. For the probe to function in biological
environments, it is also required that it is non-cytotoxic.[5] All of these requirements are met by dye-
doped PEGylated silica nanoparticles.
1.1 Aim The aim of this project is to synthesize silica nanoparticles which can be detected by both FRAP and
NMR, and can therefore be used as probes for measuring diffusion. In order to be detectable by
FRAP, the particles have to be made fluorescent by FITC (fluorescein isothiocyanate) inclusion, and
the surface modified with PEG to provide an NMR-d responsive moiety. Such a feature will be
implemented on silica particles, a versatile and suitable type of colloid. Conditions to synthesize
different sizes of silica nanoparticles will also be investigated.
3
2. Theoretical Background In this chapter, first a theoretical background for diffusion is given. The historical and chemical
perspectives for silica and fluorescein are presented, and how they are used as probes in different
ways. The features of surface modification of silica are also described. Methods to synthesize silica
nanoparticles are detailed and finally the methods used to characterize the particles are outlined.
2.1 Diffusion Diffusion is the random movement of a molecule or particles in a system, where the driving force is
to even out the concentration of the molecules or particles within the system, i.e. to maximize the
entropy of the system. One way to describe diffusion is by the concept of Brownian motion, where
the particles move randomly in the solution because of collision with other particles. Diffusion is the
macroscopic result of Brownian motion on the microscopic level.[6]
The Stokes-Einstein equation is derived from Stokes’ law of friction and Einstein’s law of diffusion.
For spherical particles in a dilute suspension, where the liquid medium is continuous compared with
the particles, i.e. the constituents of the liquid are much smaller than the particles suspended in it,
Stokes-Einstein’s equation then looks as follows:
where D is the diffusion coefficient, kB is Boltzmann’s constant, T is the absolute temperature and η is
the viscosity of the medium. Finally, r is the hydrodynamic radius of the particle.[6, 7] As is obvious
from the equation, the diffusion constant is inversely proportional to the radius of the particle,
meaning that bigger particles diffuse slower than smaller ones. In a porous material, the size of the
pores will determine the diffusion rate, however. If the pores are big enough for the smaller particles
to move freely, then the larger particles might still diffuse at a slower rate. But if there are instances
where the pores are too small for the larger particles to move into, they might move at a faster rate
if diffusion outside of the material is possible, while the smaller particles are trapped inside the
pores. Also, if the particles have a tendency to adsorb to the material which they move through, that
will influence the diffusion rate profoundly.[1]
FRAP and NMR-d are two ways of measuring diffusion in a solution. If using a probe, both techniques
require that the probe possesses properties making it detectable for each technique respectively.
With FRAP, which measures fluorescence, the particles must be made fluorescent using a dye. NMR-
d requires that a molecule which responds to NMR is attached to the probe. PEGs are often used as
that NMR responsive moiety. It would be both convenient and useful for the sake of comparing
results if the same probe could be used for both of these methods.
2.2 Silica as a probe Since the 1970s, silica nanoparticles have known an increase of interest, mainly because of their
harmless properties. They have also shown little to no cytotoxicity.[8-10] They are biocompatible, for
example by being hydrophilic which makes them able to move in aqueous systems in vivo. There is
also no risk of them being microbially attacked and destroyed when used in vivo. And, finally, an
important property in this study, they are capable of entrapping molecules in their cores.[4, 8] Silica
is useful as a probe in this setting because of several reasons. There are established methods of
4
synthesizing monodisperse particles of broad range of sizes.[11] Also, the surface of the silica
particles is relatively easily modified with a large range of molecules. All these features make silica a
stable and versatile probe.
2.2.1 Silica
Silica exists in nature mostly in the form of sand and quartz. Mainly it is used to make glass products
such as windows and bottles, but it is also utilized in manufacturing optical fibers, whiteware
ceramics and food additives. Within industry its use has been found in catalysis, as stabilizers and
pigments. [12] It is produced in many different forms, such as crystal, silica gel and colloidal silica.
Although it was not until the 1940’s that it was discovered how to produce uniform concentrated
silica sols that remained stable for years, by removing salts from the solution and adding a base.[13]
In industry, silica is manufactured in the form of waterglass. Waterglass is the common name for
sodium silicate and is produced by melting sand (silicon dioxide) and sodium carbonate. In this study
we are focusing on silica in its colloidal state and its use as probe in scientific research.
2.2.2 Chemistry of silica
Silica is an often used name for silicon dioxide with the chemical formula SiO2. As mentioned earlier,
it exists in different forms, but this study has focused on colloidal amorphous silica. Amorphous silica
is silica without a crystalline structure. The colloidal character comes from the discrete particles that
are dispersed in a continuous medium, while being amorphous. [13]
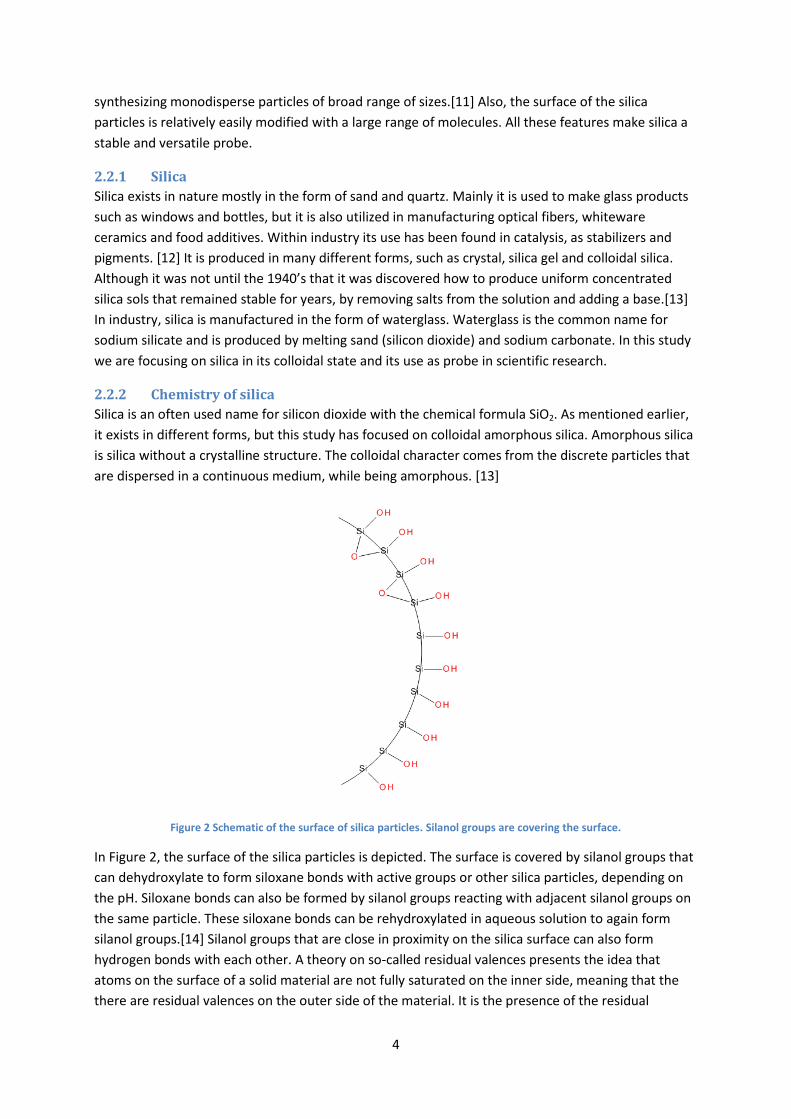
Figure 2 Schematic of the surface of silica particles. Silanol groups are covering the surface.
In Figure 2, the surface of the silica particles is depicted. The surface is covered by silanol groups that
can dehydroxylate to form siloxane bonds with active groups or other silica particles, depending on
the pH. Siloxane bonds can also be formed by silanol groups reacting with adjacent silanol groups on
the same particle. These siloxane bonds can be rehydroxylated in aqueous solution to again form
silanol groups.[14] Silanol groups that are close in proximity on the silica surface can also form
hydrogen bonds with each other. A theory on so-called residual valences presents the idea that
atoms on the surface of a solid material are not fully saturated on the inner side, meaning that the
there are residual valences on the outer side of the material. It is the presence of the residual
5
valences on the silica surface that lead to the siloxane bridges being hydrated and silanol groups
being formed.[15] The modern name for this concept is a dangling bond.
Because the surface character of silica is so important to its properties, it is desirable to know the
surface area and the amount of silanol groups on the surface. The concept of specific surface area is
defined to get an idea of the available surface area and number of silanol groups which are possible
to modify. When the silica surface is fully hydrolyzed, the surface coverage of silanol groups is
approximately 8 µmol/m2. [16-18] This is considered to be a physicochemical constant.[14] In reality,
not all of these silanol groups are available to react with a surface modifier. The silica surface is not
completely smooth, leading to some silanols being hidden in crevices or folds in the surface.[16]
Also, after a PEG has bound to the surface, it will sterically hinder silanol groups surrounding it,
preventing other PEG modifiers from accessing the surface.[19]
Specific surface area is defined as surface area per mass unit and can be used to determine how
much PEG is needed to cover the surface at a desired degree. As the diameter decreases, the ratio of
particle surface area to particle volume as well as mass, greatly increases.
There are two primary forces governing the stability of a colloidal suspension: electrostatic charge
repulsion and van der Waals attractions. Electrostatic repulsion occurs when the particles are
charged and repel each other and, at the same time, attract counter ions, which leads to a so-called
ionic double layer being formed. The van der Waals forces work to bring the particles closer together,
resulting in aggregation if they are greater than the repulsive forces.[6]
In the case of silica, the surface charge varies a lot with the pH. If the pH is above 9, it is negatively
charged, which keeps the suspension stable. Another way to stabilize the silica is to create a steric
stabilization by attaching a molecule to the surface to prevent the silanol groups from coming into
closer contact with each other and creating siloxane bonds.[13] Therefore the grafting of PEG on the
surface is not only a way of making the silica nanoparticles NMR responsive, but it can also serve to
stabilize the particles.
Another stabilizing effect, in water, comes from the formation of hydrogen bonds between the
silanol groups on the silica surface and the solvent. Smaller particles are more easily dehydrated
because the silanol groups are further apart. On a larger particle, the curvature angle of the particle
is smaller and thus the silanol groups are more crowded, coming in closer contact, and there are
more stable hydrogen bonds formed. At about pH 2, the silica surface is neutral, and up to pH 6 the
negative charge increases slowly. After that, it continues to increase up to about pH 10.7. However,
when the pH reaches 8-9, the silica also starts to dissolve to form silicate ions (HSiO3-), thus leading to
additional amounts of negative ions. More ions in the solution leads to a decrease of hydrogen
bonding due to the fact that the solvated ions block charge sites.[13, 20]
2.2.3 Particles Synthesis: The Stöber Process
There are several advantages of being able to synthesize particles that are monodisperse. For
example, it is easier to evaluate diffusion rates with methods such as FRAP and NMR-d if all particles
in a solution are the same size. Before Stöber, in 1967 [11], nobody had been successful in generating
monodisperse suspensions of silica particles in a reproducible way. The synthesis protocol described
by Stöber was very simple, easy to carry out, and used basic reactants: water, ammonia, alcohol and
6
an alkyl silicate. The alkyl silicate, for example TEOS (tetraethyl orthosilicate), undergoes hydrolysis
and condensation to produce SiO2.
Colloidal amorphous silica tends to arrange itself into spherical particles when using the synthesis
method in the so-called Stöber process.[11] The process by which the particles are synthesized can
be divided into two reactions: [21]
Hydrolysis: Si–(OR)4 + H2O Si –(OH)4 + 4R–OH (i)
Condensation: 2Si-(OH)4→ 2(Si–O –Si) + 4H2O (ii)
In the first reaction(i), in the hydration of an alkyl silicate, the silanol groups which often determine
the surface chemistry of silica particles[14] are formed, and in the second one(ii) the polymerization
occurs which in fact forms the silica matrix. This happens by dehydration of the hydroxyl groups in a
condensation polymerization which causes siloxane bridges to form.[21]
The Stöber process has since been investigated in more detail and improved upon. During this master
thesis we have focused on three variations of the Stöber process, developed by Wang et al., Bogush
et al. and van Blaaderen et al., respectively.
To further investigate the Stöber process, Wang et al. have used a reaction system where the
ammonia and water concentrations are calculated based on the TEOS concentrations ([NH3] =
0.81[TEOS], [H2O] = 6.25[TEOS].[12]
The reaction system has three major features: an excess of water to make sure the hydrolysis of
TEOS is as completed as possible, a low ratio of NH3 to TEOS (too low concentration of NH3 may
cause the solution to aggregate), and a high concentration of TEOS.
In comparison with the protocol presented above, Bogush et al.[22] present a more comprehensive
approach where a correlation between the concentrations for TEOS, water and ammonia was
established to enable the possibility of controlling particle sizes.
The correlation presented:
with
and
Where d is the average diameter in nanometers. All concentrations are given in M. However, Razink
et al[23] found issues with this correlation and presented a correction of A:
7
Even though these approaches offer the advantage of a good control over the size of the particles,
the protocols were not developed to render the silica particles fluorescent. This can be achieved
during the synthesis of the particles by adding the dye to the reaction mixture, accounting that it will
not interfere with the process. Other approaches will be discussed further below. In 1992, van
Blaaderen et al.[7] were the first to report a modified Stöber process which incorporated organic dye
in the silica spheres by covalent bonding. They showed how it was possible to dye-dope the silica
nanospheres either in the core or a surface layer. Since then, there has been a lot of research done in
this area[4, 5, 9, 10, 24-34], and the method of incorporating a dye by creating a conjugate between
the dye and APTMS((3-aminopropyl)trimethoxysilane) or APTES((3-aminopropyl)-triethoxysilane) has
been employed both in studies using a modified Stöber process[7, 9, 10, 24, 26, 27], and the reverse
microemulsion technique[31, 34, 35].
Protocol 3 in this project was based mainly on the protocols given by Zhang et al.[9] and Estévez et
al.[24]. In these studies, a second coating of TEOS was applied after the synthesis of the silica
nanoparticles. A second coating of TEOS has proven to be beneficial when it comes to increasing the
photostability and thereby protection from undesired photobleaching.[26, 33] The postcoating of an
additional layer of silica also has the goal of giving the particle a pure silica surface.[32] There have
also been claims that the spheres surfaces are smoother by the addition of an outer layer of TEOS.[9]
An excess amount of APTMS/APTES is commonly used[9, 10, 24] to make sure that all the dye is
incorporated into the silica particle. According to Ha et al, an excess amount of APTES, if used to coat
with an outer layer of dye, might influence size uniformity.[28] This might be avoided by adding a
second coating of TEOS.
Since van Blaaderen et al. presented their research a lot has happened in the field of fluorescent
probes. With the increased need for sensitive assays in the medical field for diagnosis, there has been
interest in investigating fluorescent silica nanoparticles as possible probes for genes, proteins and
cells.
2.3 Introduction of fluorescence in silica (FRAP) To be able to use FRAP on the silica nanoparticles they need to be doped with dye in some way. In
the next section, different routes of making the particles fluorescent are described, and a general
background on fluorescein is given.
2.3.1 Fluorescein doped silica nanoparticles
Fluorescence occurs when a substance absorbs light, i.e. photons, exciting the substance to a higher
level of energy. Almost immediately, the energy is then used to emit light, usually at a longer
wavelength which means it has lower energy. The quantum yield is a measurement of how efficient
the fluorescence is. It says how many of the photons are emitted, compared to how many are
absorbed. Fluorescein is a fluorophore, i.e. a fluorescent molecule.[36] One of the reasons why
fluorescein is a common fluorophore used in scientific research comes from its excellent quantum
yield.[37]
In order to introduce fluorescence to molecules, usually a dye is covalently bound to the molecule of
interest. Neverthless, the possibilities offered to introduce such character on particles are more
flexible. There are basically two main options when trying to impart a fluorescent character to silica
nanoparticles. First, the fluorescein can be bound to the surface of the particles, via a linker. The
8
linker usually reacts on one side with the dye, while it presents silyl ether prone to react with the
silica surface on the other side. Even though this is a suitable option to post functionalized well
defined particles, this approach faces a major drawback when it comes to further modification of the
surface. For instance, if the surface will also be modified with a bulky molecule, such as PEG, the dye
and the PEG will then have to compete for the available silanols on the surface of the particle,
possibly leading to inferior detection possibilities for both NMR-d and FRAP. Furthermore, since the
fluorescein is not encapsulated, there is an increased risk of loss of the dye by local hydrolysis, as
observed during previous work.[38]
The second option consists in adding the dye directly to the reaction media during the synthesis of
the particles to incorporate the dye in the matrix of the particle. In such a case, the dye can be added
with or without a linking moiety that can react with silica. The latter approach is indeed easier in that
it reduces the preparation steps, but there is an additional risk of dye leakage, since the fluorophore
is not covalently attached to the silicon dioxide matrix. By conjugating the fluorescent molecule to a
spacer containing suitable groups for the formation of covalent bond with silanols, the risks of
leakage are usually reduced.
A derived procedure utilized to synthesize silica nanoparticles, both dye-doped and otherwise, is the
microemulsion technique. This technique is based on the hydrolysis of TEOS in a reverse-micelle or
water-in-oil microemulsion system, where water droplets are dispersed in oil. It produces highly
spherical and monodisperse particles. The dye molecules encapsulated into these silica particles are
polar, and they are physically bound to the negatively charged matrix. However, that method of
producing silica particles has not been investigated in this project.[8]
Both strategies are highly depending on the type of dye chosen, and in the present case, fluorescein
was chosen since FRAP usually employs fluorescein. With the microemulsion technique, the dye with
the common name Rubpy is often used.[5, 29, 30, 33]
Fluorescein has been used in chemical research for a long time. Already, in 1871, Adolf Baeyer
reported he had managed to synthesize fluorescein [39], a feat that, among other things, eventually
earned him the Nobel Prize.[40]
Fluorescein can be modified to obtain different functionalities, for example the ability to bind to
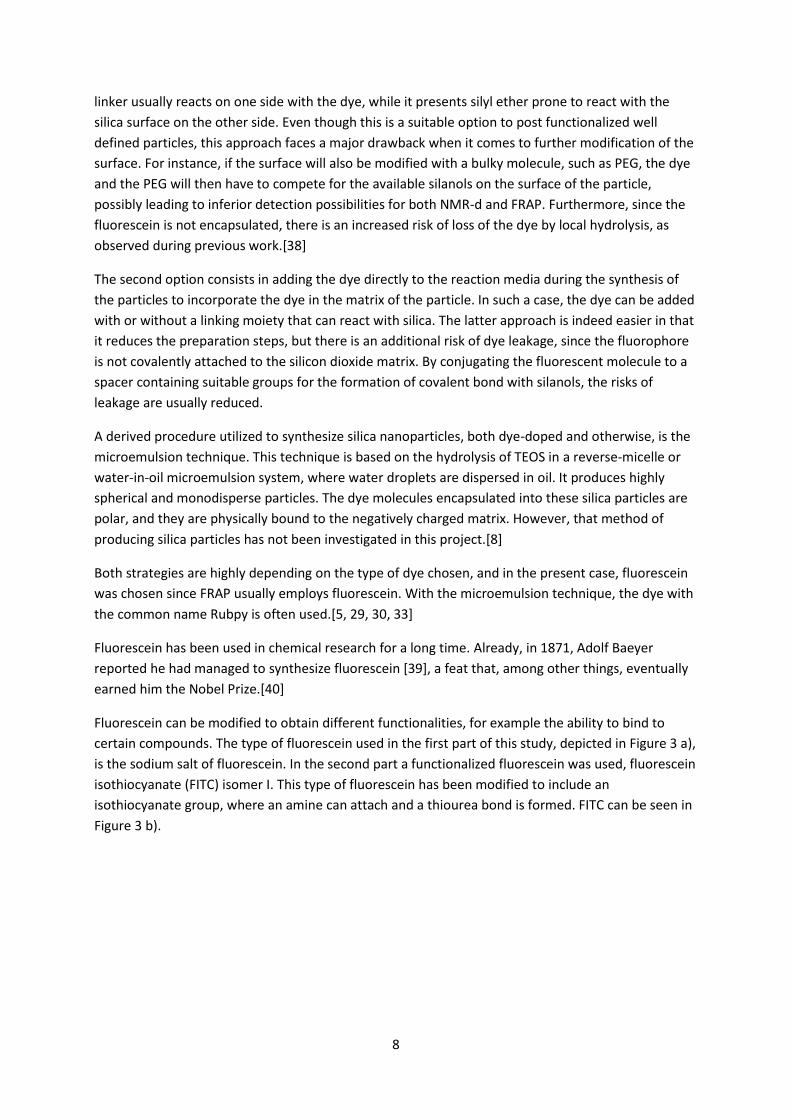
certain compounds. The type of fluorescein used in the first part of this study, depicted in Figure 3 a),
is the sodium salt of fluorescein. In the second part a functionalized fluorescein was used, fluorescein
isothiocyanate (FITC) isomer I. This type of fluorescein has been modified to include an
isothiocyanate group, where an amine can attach and a thiourea bond is formed. FITC can be seen in
Figure 3 b).
9
Figure 3 Fluorescein isomers. a) Fluorescein sodium salt b) Fluorescein isothiocyanate isomer I
Fluorescein and its derivatives are used as probes in many different settings. Fluorescein sodium salt
has been used to study skin conditions in vivo to visualize skin structures when non-invasive
techniques, such as a Confocal Laser Scanning Microscope (CLSM), are used. FITC is employed for
staining in immunofluorescence microscopy.[41] There are many advantages in using fluorescein as a
probe. It is a small molecule, which is easily soluble in water, which is convenient for measuring
diffusion. That, and its high sensitivity of detection[42] makes it suitable for non-invasive
investigation of blood flow, for which it is commonly used in ophthalmology by injecting sodium
fluorescein systemically and then observing the fluorescence in the small blood vessels in the retina.
Fluorescein is also used as a tracer in water systems to track flow dynamics for the purpose of finding
leaks or tracking how a hazardous spill disperses in water, for example.[43] For that application it is
important for fluorescein to not react with any part of the system. This is also one of the cases where
the dye needs to be able to be detected at low levels so as not to contaminate the water to a large
extent. [44]
Fluorescein also has a tendency to bind nonspecifically to macromolecules such as DNA and
proteins.[36] However, for the analysis of a biological system to be more straightforward because of
its specificity it is preferred that the fluorescein is chemically bound to a compound that in turn binds
to the macromolecule. Another advantage of having the fluorescein attached to the binding
molecule is that there is no risk of the fluorescein desorbing from the target molecule.
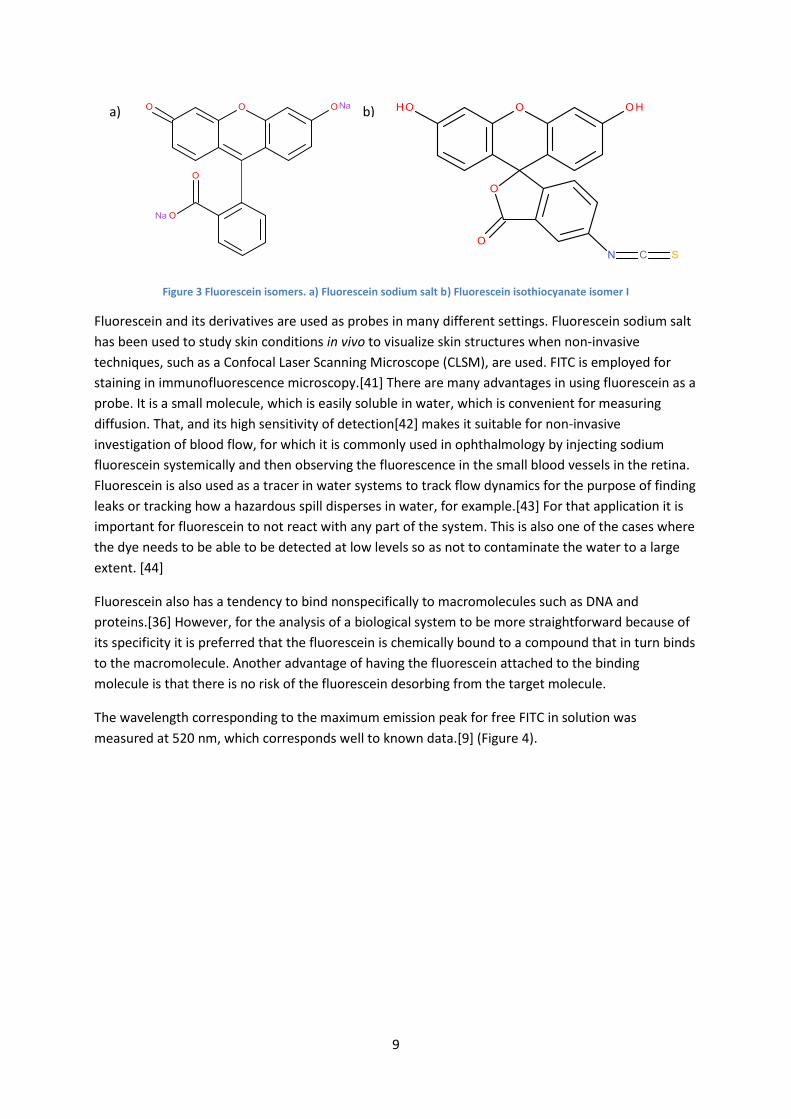
The wavelength corresponding to the maximum emission peak for free FITC in solution was
measured at 520 nm, which corresponds well to known data.[9] (Figure 4).
a) b)
10
Figure 4 Emission spectrum for free FITC in solution
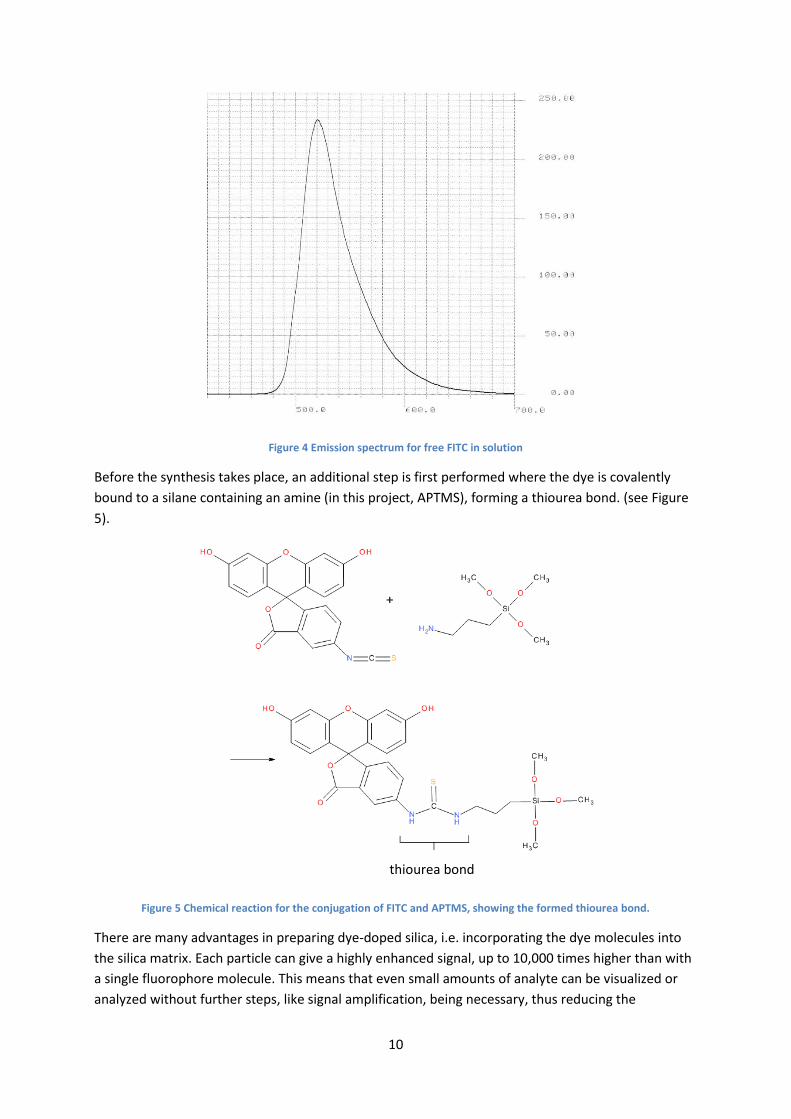
Before the synthesis takes place, an additional step is first performed where the dye is covalently
bound to a silane containing an amine (in this project, APTMS), forming a thiourea bond. (see Figure
5).
Figure 5 Chemical reaction for the conjugation of FITC and APTMS, showing the formed thiourea bond.
There are many advantages in preparing dye-doped silica, i.e. incorporating the dye molecules into
the silica matrix. Each particle can give a highly enhanced signal, up to 10,000 times higher than with
a single fluorophore molecule. This means that even small amounts of analyte can be visualized or
analyzed without further steps, like signal amplification, being necessary, thus reducing the
thiourea bond
11
measurement time. Because the dye is protected in the silica matrix, dye-doped silica nanoparticles
also have a higher resistance to losing fluorescence when exposed to light for a prolonged time. Also,
the difference in density between silica and commonly used solvents such as water and ethanol is
significant enough to make it easier to separate the silica particles using centrifugation.[8]
The possible amount of dye-loading is however determined by a phenomenon known as self-
quenching. The dye itself prevents fluorescence intensity from increasing when the dye molecules
are too close to each other. When this happens, the molecules go from their excited state without
emitting a photon.[7]
2.4 Introduction of PEG on the silica particles It was mentioned earlier that one of the ways to stabilize a silica suspension is by creating steric
hindrance that prevents the silanol groups from getting close enough to dehydrate and form siloxane
bonds.
When the fluorescein is incorporated into the silica matrix the surface exposed to the environment is
mostly silica, and consequently silanol groups. Many biological molecules can be adsorbed to the
surface of silica by physical interactions as well. However, like with fluorescein, analysis is easier if
there is a possibility of covalently binding the surface to the analyte. In this study, a PEG modifier was
bound to the surface of the silica particles for the purpose of tracking the diffusion of particles by
NMR-d. Functional groups can also be grafted on the surface in order to bind covalently to a target
biomolecule which can then be traced.[8]
Coating with an amine can, depending on the coverage, lead to the silica surface losing its negative
charge and making the surface charge neutral at neutral pH. Because of this there is a loss in colloidal
stability and the risk of aggregation increases when the particles are able to move closer to each
other. Coating wia PEG on the other hand, makes the surface hydrophilic enhance the dispersibility
of particles in water. Like with the amine compounds, the surface is also made neutral, which
reduces the likelihood of the non-specific binding of the charged macromolecules mentioned earlier.
The PEG also creates a steric hindrance for other particles and larger molecules.[8]
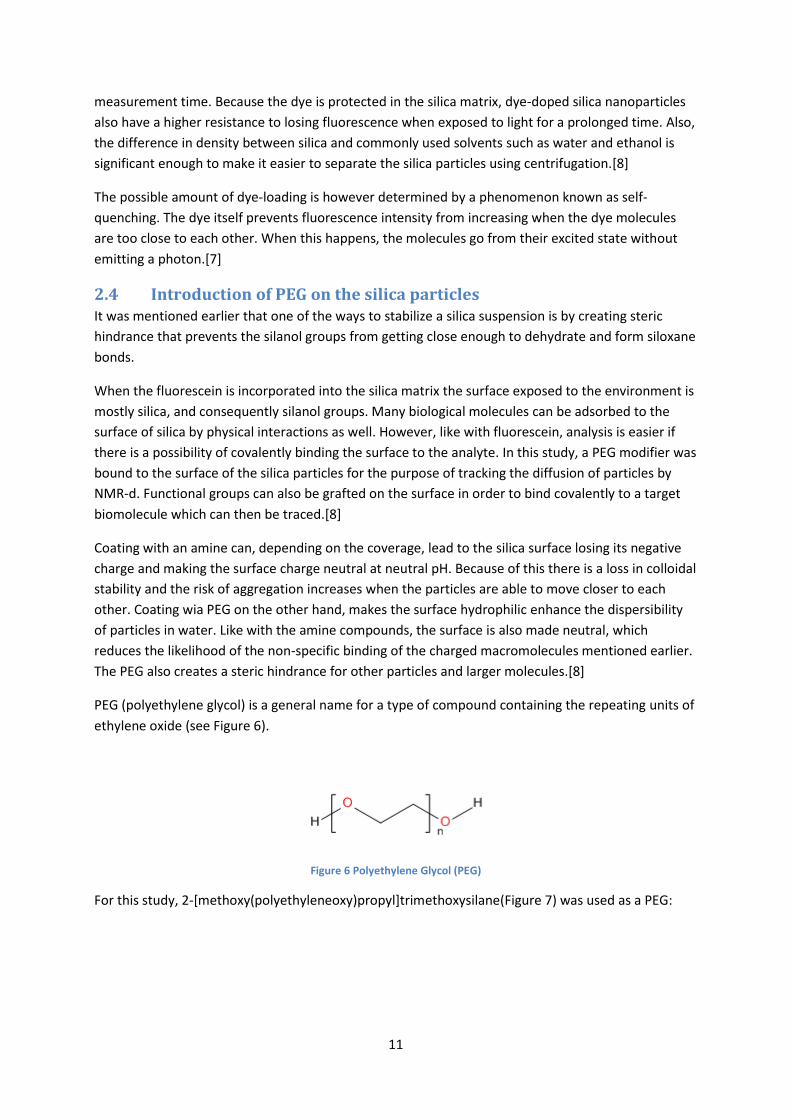
PEG (polyethylene glycol) is a general name for a type of compound containing the repeating units of
ethylene oxide (see Figure 6).
Figure 6 Polyethylene Glycol (PEG)
For this study, 2-[methoxy(polyethyleneoxy)propyl]trimethoxysilane(Figure 7) was used as a PEG:
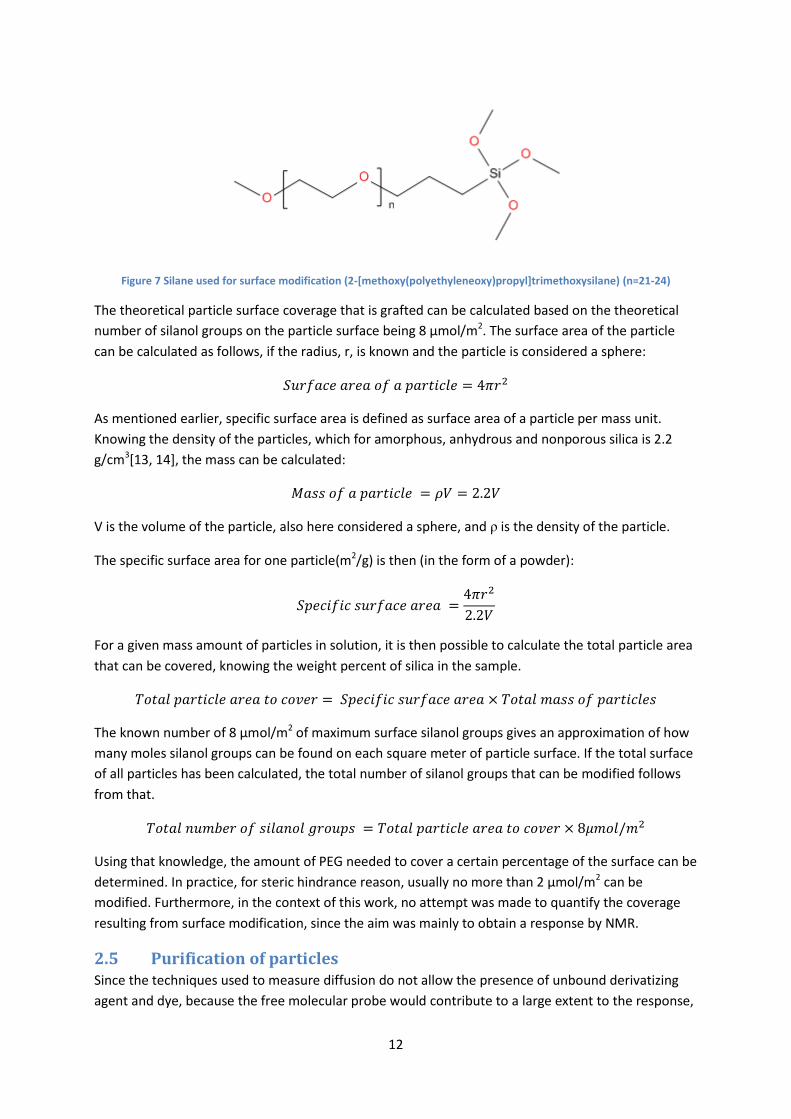
12
Figure 7 Silane used for surface modification (2-[methoxy(polyethyleneoxy)propyl]trimethoxysilane) (n=21-24)
The theoretical particle surface coverage that is grafted can be calculated based on the theoretical
number of silanol groups on the particle surface being 8 µmol/m2. The surface area of the particle
can be calculated as follows, if the radius, r, is known and the particle is considered a sphere:
As mentioned earlier, specific surface area is defined as surface area of a particle per mass unit.
Knowing the density of the particles, which for amorphous, anhydrous and nonporous silica is 2.2
g/cm3[13, 14], the mass can be calculated:
V is the volume of the particle, also here considered a sphere, and ρ is the density of the particle.
The specific surface area for one particle(m2/g) is then (in the form of a powder):
For a given mass amount of particles in solution, it is then possible to calculate the total particle area
that can be covered, knowing the weight percent of silica in the sample.
The known number of 8 µmol/m2 of maximum surface silanol groups gives an approximation of how
many moles silanol groups can be found on each square meter of particle surface. If the total surface
of all particles has been calculated, the total number of silanol groups that can be modified follows
from that.
Using that knowledge, the amount of PEG needed to cover a certain percentage of the surface can be
determined. In practice, for steric hindrance reason, usually no more than 2 µmol/m2 can be
modified. Furthermore, in the context of this work, no attempt was made to quantify the coverage
resulting from surface modification, since the aim was mainly to obtain a response by NMR.
2.5 Purification of particles Since the techniques used to measure diffusion do not allow the presence of unbound derivatizing
agent and dye, because the free molecular probe would contribute to a large extent to the response,
13
especially for FRAP, the particles require to be purified. It is also a way to eliminate the reactants
which have not been consumed during the reaction to prevent it from continuing, or new particles
from forming. The cleaning is also performed to keep the solution stable. Normally, the strong
negative surface charge of the silica particles will enable a proper electrostatic repulsion. However,
pH changes can cause aggregation, which is why the pH of the solvent needs to be controlled. It is
also beneficial to get rid of salt being present in the solution, to avoid screening of the charges on the
surface, leading to aggregation.[8]
For the purification of particles, three major techniques are generally in use, in which the particles
are physically separated either by sedimentation or by using a membrane.
2.5.1 Centrifugation
Centrifugation is a way to separate more dense particles from less dense particles and reactants. This
is depending on the density of the particles. In the case of solid particles, heavier particles will be the
same as bigger particles. The bigger particles are spun down in a pellet, while the smaller particles
and reactants remain in solution, the so-called supernatant. The supernatant is then discarded, and
the pellet resuspended in the desired solvent, in this case water. The procedure is repeated many
times as needed. In this study, the samples were centrifuged 10 times for 15 minutes each.
2.5.2 Dialysis
Dialysis functions by osmosis and diffusion. Osmosis allows the water to move into the dialysis tube
to even out the solute concentrations, and diffusion is when smaller molecules, such as leftover
reactants, diffuse out into the surrounding water through a membrane. The membrane has a cut-off
that only allows smaller molecules and ions to diffuse through, but retains the silica particles. The
dialysis water is then changed a few times a day so that new equilibriums can be reached. In this
case, each new batch of water was also set to pH 10. This is a procedure that does not demand a lot
of time, work wise. However, one batch might need to be dialyzed for weeks before being
considered clean enough for measurement purposes.
2.5.3 Ultrafiltration
Ultrafiltration works the way filtration normally does, in that the solution is placed over a filter
membrane, which lets smaller molecules pass through; how small is depending on the size of the
filter. As with dialysis, the filter retains larger molecules and the silica particles. The difference
between normal filtration and ultrafiltration is that in ultrafiltration a pressure is applied on the
solution by running nitrogen gas through, which pushes the solution through the filter. The container
with solution is refilled with solvent and the procedure is repeated until the ultrafiltrate is considered
clean.
2.6 Characterization of particles Techniques used for the characterization of the dye-doped silica nanoparticles are described.
2.6.1 Structural characterization
2.6.1.1 Transmission Electron Microscopy (TEM)
The principle of transmission electron microscopy is similar to that of light microscopy. However, the
lenses used in TEM are electromagnetic ones instead of optical, and instead of visible light an
electron beam is transmitted through the sample. The electron beam is emitted from a cathode at
the top of a column. The electrons then accelerate downward, toward the anode, through lenses. It
14
is important to keep a deep vacuum in the column, to prevent the electrons from being absorbed by
atoms present in the chamber, but also to prevent electrical discharges that may harm the
cathode.[36] The resolution of the electron microscope is very high, making the measurements for
particle size reliable. For the electrons to pass through the sample, it has to be very thin. And for
particles in solution they have to be diluted enough that they will not aggregate on the grid when the
sample is dried. This is to make sure that aggregates seen on the grid are from the sample and not
because of the grid preparation.[13] TEM was one of the main techniques to characterize the
samples
2.6.2 Diffusion measurements
2.6.2.1 Fluorescence Recovery After Photobleaching (FRAP)
Fluorescence Recovery After Photobleaching, or FRAP, is a way to measure diffusion. A fluorescing
sample is put under a laser beam, and thereby bleached. The photons from the laser excite the
fluorescent probe to a non-fluorescing state. The bleached area is then observed to see how quickly
it recovers fluorescence, which happens by fluorescing probes diffusing into the bleached area and
bleached probes diffusing out. When the probe diffuses freely in the sample, a diffusion coefficient
can be determined, and with that the size of the probe. [45]
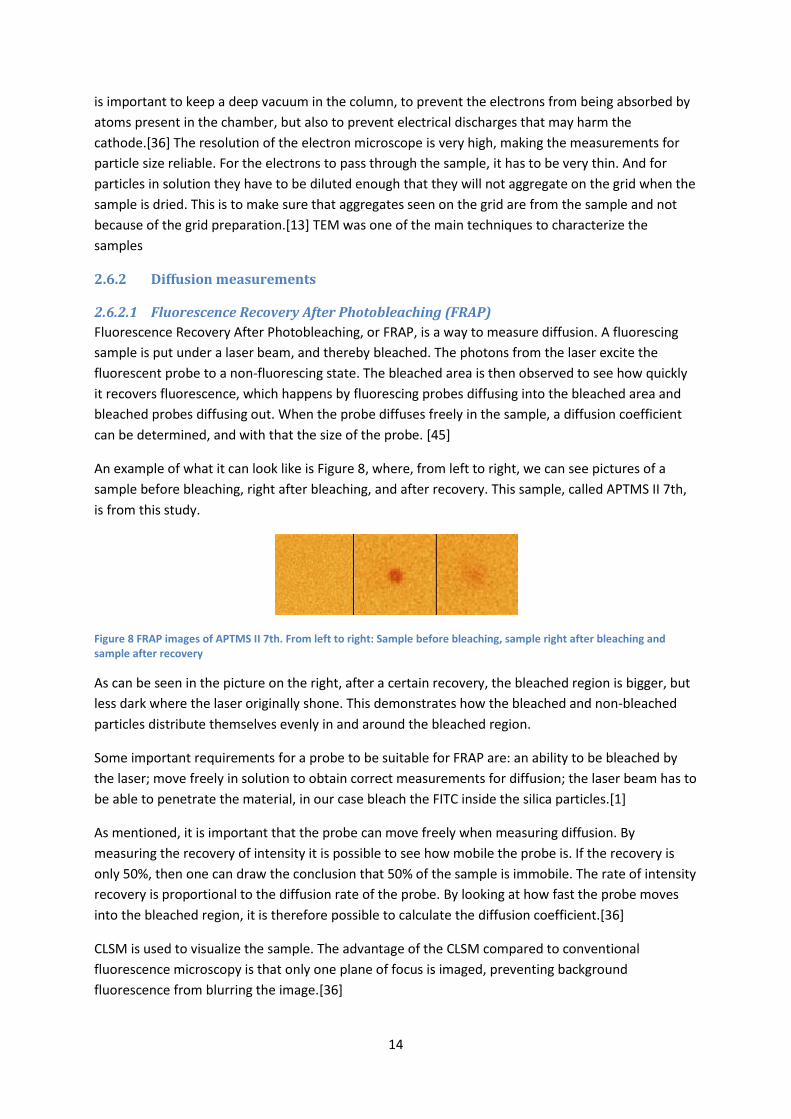
An example of what it can look like is Figure 8, where, from left to right, we can see pictures of a
sample before bleaching, right after bleaching, and after recovery. This sample, called APTMS II 7th,
is from this study.
Figure 8 FRAP images of APTMS II 7th. From left to right: Sample before bleaching, sample right after bleaching and sample after recovery
As can be seen in the picture on the right, after a certain recovery, the bleached region is bigger, but
less dark where the laser originally shone. This demonstrates how the bleached and non-bleached
particles distribute themselves evenly in and around the bleached region.
Some important requirements for a probe to be suitable for FRAP are: an ability to be bleached by
the laser; move freely in solution to obtain correct measurements for diffusion; the laser beam has to
be able to penetrate the material, in our case bleach the FITC inside the silica particles.[1]
As mentioned, it is important that the probe can move freely when measuring diffusion. By
measuring the recovery of intensity it is possible to see how mobile the probe is. If the recovery is
only 50%, then one can draw the conclusion that 50% of the sample is immobile. The rate of intensity
recovery is proportional to the diffusion rate of the probe. By looking at how fast the probe moves
into the bleached region, it is therefore possible to calculate the diffusion coefficient.[36]
CLSM is used to visualize the sample. The advantage of the CLSM compared to conventional
fluorescence microscopy is that only one plane of focus is imaged, preventing background
fluorescence from blurring the image.[36]
15
2.6.2.2 Nuclear Magnetic Resonance Diffusometry (NMR-d)
Nuclear Magnetic Resonance (NMR) is used to determine molecular structures and dynamics of
molecules. It is based on observing how the nuclei of investigated molecules are affected by a static
magnetic field, and after applying a fluctuating magnetic field. NMR diffusometry (NMR-d), also
known as pulsed field gradient (PFG) is a way to measure the self-diffusion coefficient of molecules in
solution.[46]
In addition to the static magnetic field, a short pulse is added in the form of a gradient, with the help
of which it is possible to determine to which place the molecules have moved. This is how the
method enables measurement of diffusion rate. [47]
To evaluate the results of NMR-d, the Stejskal-Tanner equation[48] was developed:
In equation (1), the intensity of the signal, I, is described by the intensity without gradient, I0, the
duration of the two gradient pulses, δ, the time between pulses, Δ, and the strength of the pulses, G.
G, δ and Δ are all parameters that are set in the experiment. T2 is the spin-spin relaxation time
constant, γ is the gyromagnetic ratio, both of which depend on the system. The only thing not given,
or measured, in the experimental setting, is then D, the diffusion coefficient, which can be calculated
by plotting log(I/I0) against k, where
. In a pure system, a linear relationship is
then obtained, and the diffusion coefficient can be determined from the slope.
With a solid, or in the case of aggregation, T2 becomes too small to enable measurements. It is
because of this that there is a need for surface modifying the silica particles. The PEG on the surface
can move more freely, inducing longer relaxation time.
An important difference between NMR-d and FRAP is the ability in NMR-d to separate two diffusing
components from each other. The slope of the curve will be steeper at the higher gradient, indicating
free PEG is present. It is then possible to calculate the proportional slope represented by the
remaining measurements, and get a value for the diffusion coefficient, excluding the known
impurities.
2.6.3 Fluorescence Emission Wavelength
Each derivative of fluorescein has its own specific excitation and emission wavelengths. The
wavelength also depends on the pH, and which ionic state fluorescein is at that particular pH, since
the characteristic absorbance is different for different ionic species.[44]
In Table 1 the excitation and emission wavelengths for the fluorescein derivatives used in our
experiments (fluorescein sodium salt and FITC isomer I), according to the manufacturer Sigma-
Aldrich[49], are given.
Excitation wavelength [nm] Emission wavelength [nm]
Fluorescein sodium salt 460 515
FITC isomer I 492 518 Table 1 Excitation and emission wavelengths for derivatives of fluorescein
16
2.6.4 Dynamic Light Scattering (DLS)
Dynamic Light Scattering is a useful method to obtain information about a system in solution,
compared to, for instance TEM where drying effects may give an untrue picture of how the particles
are arranged in relation to each other. For example the drying may have caused the particles to
aggregate, something that might not occur in solution. DLS also gives a good size distribution since it
measures particles statistically, as compared with TEM where one typically measures hundreds of
particles in what is a time consuming process.[8]
3. Materials and Methods
3.1 Materials
3.1.1 Chemicals
MilliQ water from MilliQ Academic Millipore system was used. Particle synthesis was performed
using ammonia solution 25% (Merck Millipore), tetraethyl orthosilicate (TEOS) (Sigma-Aldrich) and
analytical grade ethanol (Solveco). (3-aminopropyl)trimethoxysilane (APTMS) (Sigma-Aldrich, CAS
13822-56-5) was conjugated with Fluorescein isothiocyanate isomer I (Sigma-Aldrich, CAS 3326-32-
7). 2-[methoxy(polyethyleneoxy)propyl]trimethoxysilane (Gelest, CAS 65994-07-2) was used to
modify the surface of the silica nanoparticles.
3.2 Methods
3.2.1 Synthesis
The Stöber process was used as basis for all syntheses of silica particles. All glassware was sonicated
for 15 minutes, filled with MilliQ water, before use. All reactions were carried out in the dark as far as
was possible.
3.2.1.1 Protocol 1: Based on Wang et al
With Protocol 1 different concentrations of TEOS were investigated, and the NH3 and water
concentrations were calculated with the ratios given by Wang et al. For the synthesis, first MilliQ
water, ammonia and alcohol was added to an Erlenmeyer flask, and stirred for 15 minutes. Then
TEOS was added dropwise, and the solution was left to react for 5 hours, while stirring, at room
temperature. For the batches containing fluorescein, the powder was added alongside the water,
ammonia and alcohol. Table 2 shows the concentrations used in experiments performed using
Protocol 1.
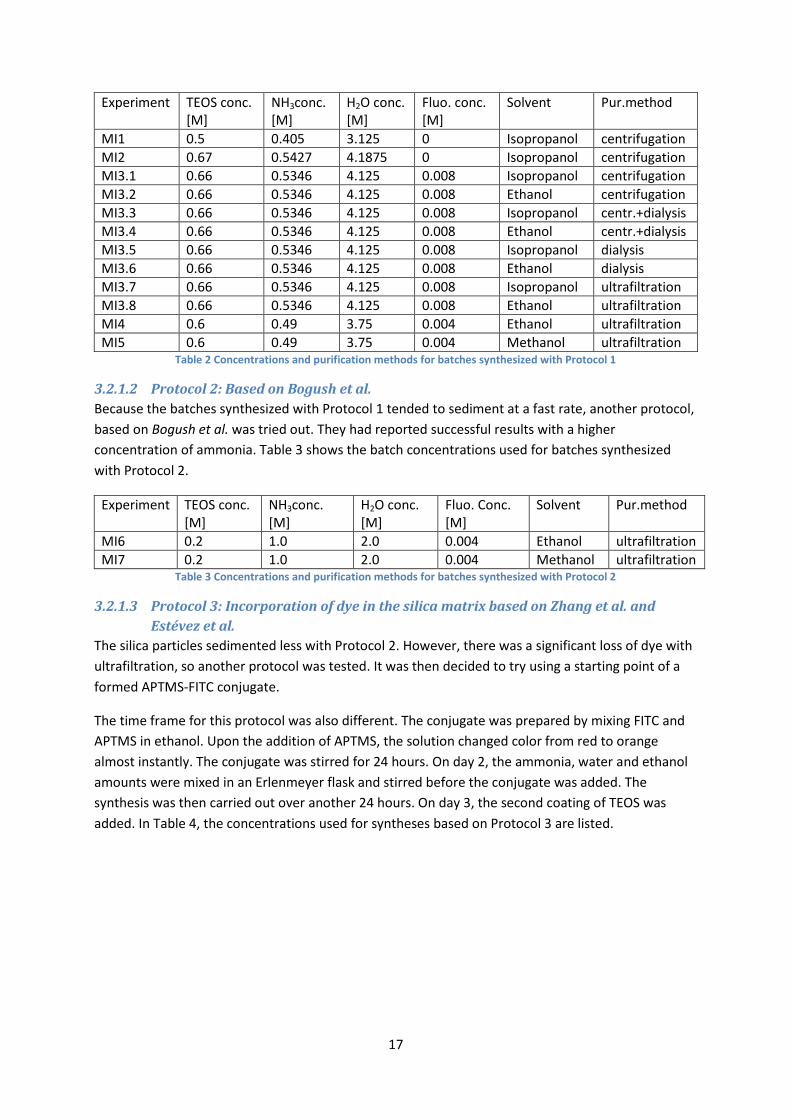
17
Experiment
TEOS conc. [M]
NH3conc. [M]
H2O conc. [M]
Fluo. conc. [M]
Solvent Pur.method
MI1 0.5 0.405 3.125 0 Isopropanol centrifugation
MI2 0.67 0.5427 4.1875 0 Isopropanol centrifugation
MI3.1 0.66 0.5346 4.125 0.008 Isopropanol centrifugation
MI3.2 0.66 0.5346 4.125 0.008 Ethanol centrifugation
MI3.3 0.66 0.5346 4.125 0.008 Isopropanol centr.+dialysis
MI3.4 0.66 0.5346 4.125 0.008 Ethanol centr.+dialysis
MI3.5 0.66 0.5346 4.125 0.008 Isopropanol dialysis
MI3.6 0.66 0.5346 4.125 0.008 Ethanol dialysis
MI3.7 0.66 0.5346 4.125 0.008 Isopropanol ultrafiltration
MI3.8 0.66 0.5346 4.125 0.008 Ethanol ultrafiltration
MI4 0.6 0.49 3.75 0.004 Ethanol ultrafiltration
MI5 0.6 0.49 3.75 0.004 Methanol ultrafiltration Table 2 Concentrations and purification methods for batches synthesized with Protocol 1
3.2.1.2 Protocol 2: Based on Bogush et al.
Because the batches synthesized with Protocol 1 tended to sediment at a fast rate, another protocol,
based on Bogush et al. was tried out. They had reported successful results with a higher
concentration of ammonia. Table 3 shows the batch concentrations used for batches synthesized
with Protocol 2.
Experiment TEOS conc. [M]
NH3conc. [M]
H2O conc. [M]
Fluo. Conc. [M]
Solvent Pur.method
MI6 0.2 1.0 2.0 0.004 Ethanol ultrafiltration
MI7 0.2 1.0 2.0 0.004 Methanol ultrafiltration Table 3 Concentrations and purification methods for batches synthesized with Protocol 2
3.2.1.3 Protocol 3: Incorporation of dye in the silica matrix based on Zhang et al. and
Estévez et al.
The silica particles sedimented less with Protocol 2. However, there was a significant loss of dye with
ultrafiltration, so another protocol was tested. It was then decided to try using a starting point of a
formed APTMS-FITC conjugate.
The time frame for this protocol was also different. The conjugate was prepared by mixing FITC and
APTMS in ethanol. Upon the addition of APTMS, the solution changed color from red to orange
almost instantly. The conjugate was stirred for 24 hours. On day 2, the ammonia, water and ethanol
amounts were mixed in an Erlenmeyer flask and stirred before the conjugate was added. The
synthesis was then carried out over another 24 hours. On day 3, the second coating of TEOS was
added. In Table 4, the concentrations used for syntheses based on Protocol 3 are listed.
18
Experiment TEOS conc. [M]
TEOS conc. 2nd coating [M]
NH3 conc. [M]
H2O conc. [M]
FITC conc. [M]
APTMS conc. [M]
APTMS 1st 0.159 0.028 0.53 1.5 0.000141 0.275
APTMS I 2nd 0.167 0.0294 0.557 1.58 0.000190 0.000992
APTMS II 2nd 0.167 0.0294 0.556 1.58 0.000180 0.00397
APTMS I 3rd 0.167 0.0294 0.557 1.58 0.000364 0.000722
APTMS II 3rd 0.167 0.0294 0.557 1.58 0.000348 0.00144
APTMS II 4th 0.0834 0.0294 0.557 1.58 0.000362 0.00144
APTMS II 5th 0.334 0.0294 0.557 1.58 0.000375 0.00144
APTMS I 6th a 0.0833 0.0149 0.559 1.58 0.000151 0.000579
APTMS I 6th b 0.0417 0.0074 0.560 1.59 0.000151 0.000580
APTMS I 6th c 0.0205 0.00370 0.560 1.59 0.000151 0.000581
APTMS I 6th d 0.0833 0.0149 0.279 0.792 0.000151 0.000579
APTMS I 6th e 0.0418 0.00741 0.280 0.794 0.000151 0.000581
APTMS II 7th* 0.166 0.0292 0.553 1.57 0.000370 0.00143
APTMS II 8th 0.0213 0.00371 0.561 1.59 0.000376 0.00145
APTMS II 9th 0.022 0.00383 0.579 1.64 0.000372 0.00150 Table 4 Concentrations for batches synthesized with Protocol 3
The batches synthesized with Protocol 3 are all named APTMS; the Roman numeral denotes a lower
(I) or higher (II) amount of APTMS. Batches APTMS I 6th a-e were trial runs done with smaller
reaction volumes and various concentrations of TEOS and ammonia, to determine which
concentrations would be appropriate to use for a full scale experiment, this because of the time
frame for experiments. All of those batches were examined with TEM before cleaning/purification.
Only APTMS I 6th c was then ultrafiltrated.
*For APTMS II 7th, a third coating of TEOS, the same amount as the second coating, was added the
day after the second coating.
3.2.2 Purification
For this project, three types of cleaning/purification of the dye-doped silica nanoparticles were
investigated. Here follows a description of the methods, and Table 2 and 3 address the sample
purification. Ultrafiltration is the technique that was eventually retained.
3.2.2.1 Centrifugation
The samples were centrifuged using an ALC 4233 ECT centrifuge. The batches without fluorescein (MI
1 and 2) were centrifuged 10 times for 15 minutes each at 2500 rpm at room temperature. The same
procedure was used in MI 3.1 and 3.2, while one round of centrifugation was followed by dialysis in
MI 3.3 and 3.4. For Protocol 3, one round of centrifugation was also performed to remove debris or
aggregates formed during the ultrafiltration step.
3.2.2.2 Dialysis
For dialysis, tubing cellulose membrane (Sigma-Aldrich) was used. The membrane retains proteins of
molecular weight 12,000 or greater. Dialysis was experimented with in the batch series of MI 3.1-
3.8.The dialysis water was kept at pH10 to ensure that the silica particles kept stable.
19
3.2.2.3 Ultrafiltration
MI 3.7 and 3.8 were ultrafiltrated. The positive results from those batches lead to all subsequent
batches being ultrafiltrated. The ultrafiltration was carried out with either an Amicon Stirred Cell
Model 8050, 50 mL (Merck Millipore) using Ultra cel® 30 kDa Ultrafiltration Discs (Amicon Merck
Millipore) or a solvent resistant cell (Merck Millipore).
3.2.3 Surface Modification
The specific surface area was calculated according to previously mentioned equations, using the radii
determined by TEM. The quantity of modifier added aimed at surface coverage of 8 µmol/m2 in all
surface modified batches of dye-doped silica nanoparticles, this to increase the chance of a better
response in NMR. Approximately 1 ml of PEG solution was prepared by weighing the calculated
amount of PEG and then adding MilliQ water adjusted to pH10. The solution was pulled up into a
syringe and the syringe was then placed in a NE-1000 Programmable Single Syringe Pump (New Era
Pump Systems Inc.) with tubing leading from the syringe into the roundflask. Because of the smaller
volume of solution, compared to trial runs, problems using a pH meter to keep the pH constant at
pH10 arose. Therefore the pH was not adjusted during the surface modification. The pH was
measured in a couple of batches at the end of surface modification, but did not go below 9.5, so it
was concluded possible to forego the pH adjustment. The solution containing the silica particles was
then added to the roundflask. The aim was to keep the weight percent of silica at 1%, but due to low
dry weight concentrations for the later batches, it was not possible for APTMS II 9th for which the
silica content in the surface modification step was 0.37%. The silica solution was heated to 80°C,
after which the PEG was added stepwise over 4 hours. The reaction was then allowed to continue for
another 2 hours, at which point the particles were purified.
The density of silica used for calculations was 2.6 g/cm3.
3.2.4 Characterization of particles
3.2.4.1 TEM
A JEM-1200 EX II (JEOL) electron microscope was used to visualize the particles, and images were
taken with a CCD 673-0200 camera (gatan, Inc.). Different ways to prepare copper grids for TEM
were tried. Problems with sedimentation in the earlier protocols lead to crowded grids. The grid was
applied on top of a drop of solution for about a minute, and then left to dry. Finally, with the last
protocol, when a relatively stable colloidal solution was obtained, a successful technique was settled
upon. The copper grid is submerged for about a minute in a drop of the solution with an approximate
dry weight percentage of 0.1%. The grid is then withdrawn, and filter paper with torn edges is used
to dry up most of the remaining liquid on the grid. The grid is then left to dry until all the water has
evaporated. The software ImageJ was then used to obtain a size distribution. Between 83 and 985
particles were indicated manually, and calculated by the program, based on the known ratio given by
the scalebar on each image.
3.2.4.2 FRAP
The confocal laser scanning microscope (CLSM) system used consists of a Leica SP2 AOBS
(Heidelberg, Germany) with a 20x, 0.5 NA water objective, with the following settings: 256 x 256
pixels, zoom factor 4 (with a zoom-in during bleaching), and 800 Hz, yielding a pixel size of 0.73 µm
and an image acquisition rate of two images per second. The FRAP images were stored as 12-bit tif-
images. The 488-nm line of an argon laser was utilized to excite the fluorescent probes. The beam
expander was set to 1, which lowered the effective NA to approximately 0.35 and yielded a slightly
20
better bleaching and a more cylindrical bleaching profile. The bleached areas are called region of
interest (ROI) in due course of the paper, and were 30 µm large discs (nominal radius rn=15 µm) at
50 µm into the sample. The measurement routine consisted of 20 prebleach images, 1 bleach image -
gaining an initial bleaching depth ≈ 35% of the prebleach intensity in the ROI - and 50 postbleach
frames, recording the recovery. The FRAP data got normalized by the prebleach fluorescence
intensity.
7 μl of the probe solutions were placed into secure-seal spacer grids between two cover glass slides
and the FRAP measurements were carried out on such locked samples. The probes were diluted with
H2O. FRAP measurements were carried out on a dilution series of the probe, until the fluorescent
signal was too weak to yield accurate measurements. The lowest concentration yielding a good FRAP
signal was 700 ppm for APTMS I 3rd mod, 900 ppm for APTMS II 7th and 450 ppm for APTMS II 7th
mod. All depicted FRAP measurements were done at these lowest concentration respectively.
Experiments were performed in room temperature. The secure-seal spacers used were 120 μm thick
and 9 mm in diameter. (Invitrogen, U.S.A.)
3.2.4.3 NMR-d
Diffusion experiments were run on a 14.1 T Bruker spectrometer equipped with a Diff30 probe at
22°C. 1H diffusion measurements were carried out in the z-direction by using a standard stimulated
echo sequence. The gradient strength, g, was varied in, at least, 16 steps. The gradient duration δ
was set to 1 ms and the time between the leading edges of the two gradient pulses that allow for
diffusive motion ∆ was set to 100 ms. For each sample, 256 scans were collected. The processing
(phasing, baseline correction, integration and diffusion constant) was done with Topspin (Bruker,
Germany).
3.2.4.4 Fluorescence Emission Wavelength
Excitation spectra were recorded using Shimadzu Spectrofluorophotometer RF-5000 DR-15
(Shimadzu Scientific Instruments). Emission wavelength for free FITC in solution was measured for
the excitation wavelength of 494 nm. Measurements were then performed for APTMS II 3rd and
APTMS II 3rd mod. All measurements were done in distilled H2O at an assumed pH of about 7.
3.2.4.5 Dynamic Light Scattering (DLS) and Zetapotential
DLS is an often used method to characterize silica particles without dye. It was used on particles
supplied by Eka Chemicals to us as a comparison for further measurements, since they are well-
defined. However, tries were made to measure particle size of our own particles with DLS and
surface charge with zetapotential, but none were successful in getting consistent data.
21
4. Results
4.1 Particle synthesis and characterization For this project, three different protocols were investigated, all of them based on a modified Stöber
process. The first was derived from Wang et al., where ratios of reagents were given in relation to
which TEOS concentration was used. The second protocol used was based on Bogush et al., and used
a higher ammonia concentration. With both of these protocols, fluorescein sodium salt was added
together with the other reagents. Finally, a third protocol was worked out, where an APTMS-FITC
conjugate was first synthesized, and then added to the particle synthesis solution to incorporate the
dye covalently in the silica matrix.
We have defined success of a protocol used, by whether the silica particles sediment or not, i.e.
whether they are small enough and do not aggregate. This can be determined by visual observation
of the synthesized particles. We have also looked at TEM images to determine the size of the
particles, and to see that the particles do not look aggregated. When those criteria were met, surface
modification was performed, and diffusion measurements with FRAP and NMR-d were done.
4.1.1 Protocol 1: Based on Wang et al.
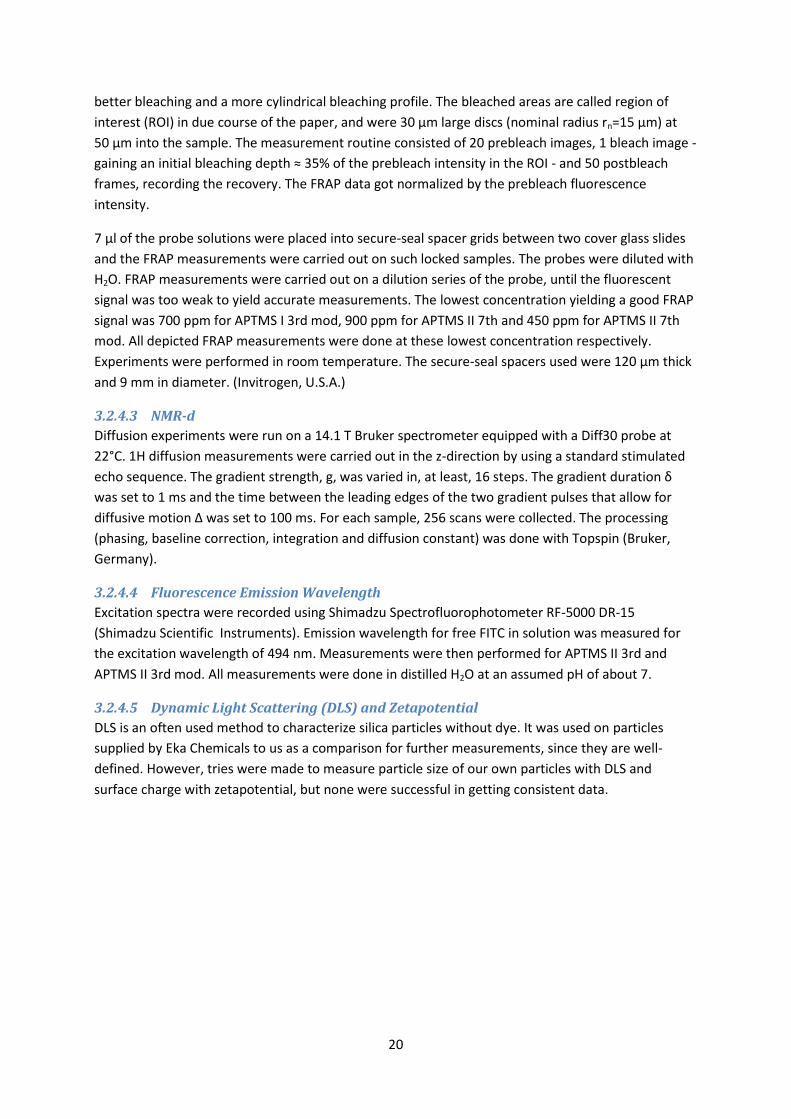
We started by synthesizing particles without the inclusion of fluorescein. They appeared spherical
with relatively few aggregations. However, we looked at two identical batches with a TEOS
concentration of 0.5M, given the reaction times of 3 and 5 hours respectively, and since the particles
seemed to look a little smoother with a reaction time of 5 hours, that was chosen for the rest of the
reactions using Protocol 1 and 2. As can be seen in Figure 9, though, two populations of particles
result after 5 hours, making the suspension polydisperse.
Figure 9 Particles synthesized using Protocol 1. 0.5M TEOS in isopropanol, cleaned with centrifugation.
For the dye-doped silica nanoparticles synthesized using Protocol 1, we have mostly visual
observations as results, since TEM images showed strong aggregations, DLS proved to be inconsistent
in measurements, and FRAP showed non-recovering feature, most likely because of the fast
sedimentation. Since sedimentation occurred relatively quickly in all batches, we therefore focused
on the color and the behavior of the pellet after centrifugation and the supernatant after
sedimentation.
22
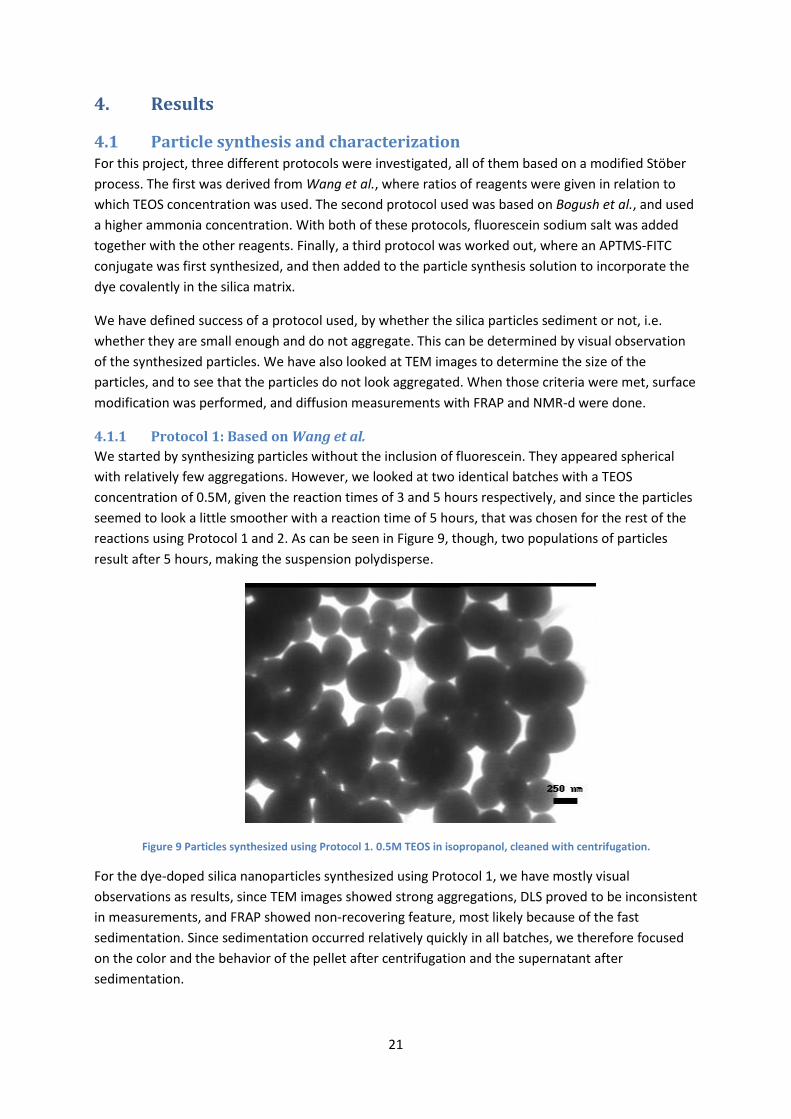
Different techniques for cleaning/purification were tried. All these batches, regardless of the workup
method used, showed great signs of aggregation. Smaller particles could also be seen gathered
around the larger particles(Figure 10).
With 0.6M of TEOS in ethanol and 0.004 M of fluorescein, still using Protocol 1, we managed to get
more dispersed particles. There was still the issue of the smaller particle-like aggregates around the
larger particles, as can be seen in Figure 10. Also, since the aim was particles smaller than 100 nm,
the particles were still too big at around 250-300 nm.
Figure 10 Particles synthesized using Protocol 1. 0.6M TEOS in ethanol, with 0.004 M fluorescein.
We also tried using methanol as solvent. Studies have shown that lower alcohols in the Stöber
process give smaller particles.[11, 12] Nevertheless, the presence of fluorescein in the methanol
containing reaction mixture led to mostly aggregates, and large particles not suitable for their
intended use as probe.
4.1.2 Protocol 2: Based on Bogush et al.
With the second protocol used, the concentration of ammonia, in relation to the concentration of
water and TEOS, was considerably higher in comparison with the first protocol. The batches
produced using Protocol 2, although still sedimenting, displayed a different type of pellet, appearing
more viscous and more easily resuspended. However, it also displayed a greater loss of dye, where
the batch using methanol as a solvent actually lost most of the dye during ultrafiltration.
In their article, Bogush et al. reported that the size they got for the particles synthesized using these
particular concentrations yielded a particle size of about 80 nm. The particles we could view by TEM
were smaller than that. Two populations of particles were present, though; large particles that
sedimented rapidly, and smaller ones that remained in the supernatant after centrifugation at
relatively low lateral acceleration. The particles which were dispersed enough to get a more exact
approximation of a size were only from the supernatant after the particles had been centrifuged to
sediment larger particles and aggregates.
Other methods were tested to improve the results, and to get corresponding measurements with
DLS, which had so far showed an inconsistency in particle size in comparison to measurements at
different angles, but also when compared to TEM results. The silica suspension was sonicated, and
the TEM grid was coated with PEI(polyethylenimine) to see if these changes could improve results,
23
unsuccessfully. The particles still showed aggregation. Even though we had managed to get particles
of the desired size, there were still aggregated structures, and the smaller particles tended to leach
dye to a greater extent.
4.1.3 Protocol 3: Incorporation of fluorescein into the silica matrix based on Zhang et
al. and Estévez et al.
Protocol 3 employed an incorporation of the fluorescein into the silica matrix by the use of a covalent
conjugation with APTMS. A lower concentration of TEOS was used, and the reaction time was
increased, compared with the first two protocols.
Protocol 3 showed a marked difference from Protocol 1 and 2 in various aspects. One of the most
remarkable results with this approach was the gain in stability of the sol, mainly due to the fact that
the particles were small enough. Furthermore, no aggregation was detected. Some gel was formed
on the filter during ultrafiltration, though, and there was loss of silica content. There tended to be
some loss of dye during surface modification, which could be determined by visual observation. Also,
because of their stable character, further surface modification was carried out on silica nanoparticles.
4.1.3.1 Particle synthesis
Based on the protocol by Zhang et al. and Estévez et al., a series of syntheses were realized where
different parameters were varied. From the previous protocols used, it was obvious that the main
parameter influencing the size was the TEOS concentration used. As can be seen from Table 4 (batch
names APTMS I 6th a-e), gradually lower amounts of TEOS were investigated, but also lower amounts
of ammonia. The size of the resulting particles was determined by TEM. The results are reported in
Table 5.
As can be seen from APTMS I 6th a-e , a smaller concentration of TEOS gave correspondingly smaller
particles. The results obtained from synthesis of APTMS I 6th c were replicated on larger scale to
allow further surface modification. From the larger scale synthesis, the size of the particles was
around 32 nm yielding a specific surface of 72 m2/g. This value was used for the surface modification
as it will be discussed below.
According to literature, a lower amount of ammonia gives smaller particles, but a low ratio of
ammonia/TEOS might also decrease the risk of aggregation.[12] For the batches with a lower amount
of ammonia, however, no spherical particles were obtained. Instead it yielded a network (which
might consist of spherical particles a few nanometers in diameter) as illustrated by Figure 11, which
shows APTMS I 6th e, the batch with the lowest amount of both TEOS and NH3.
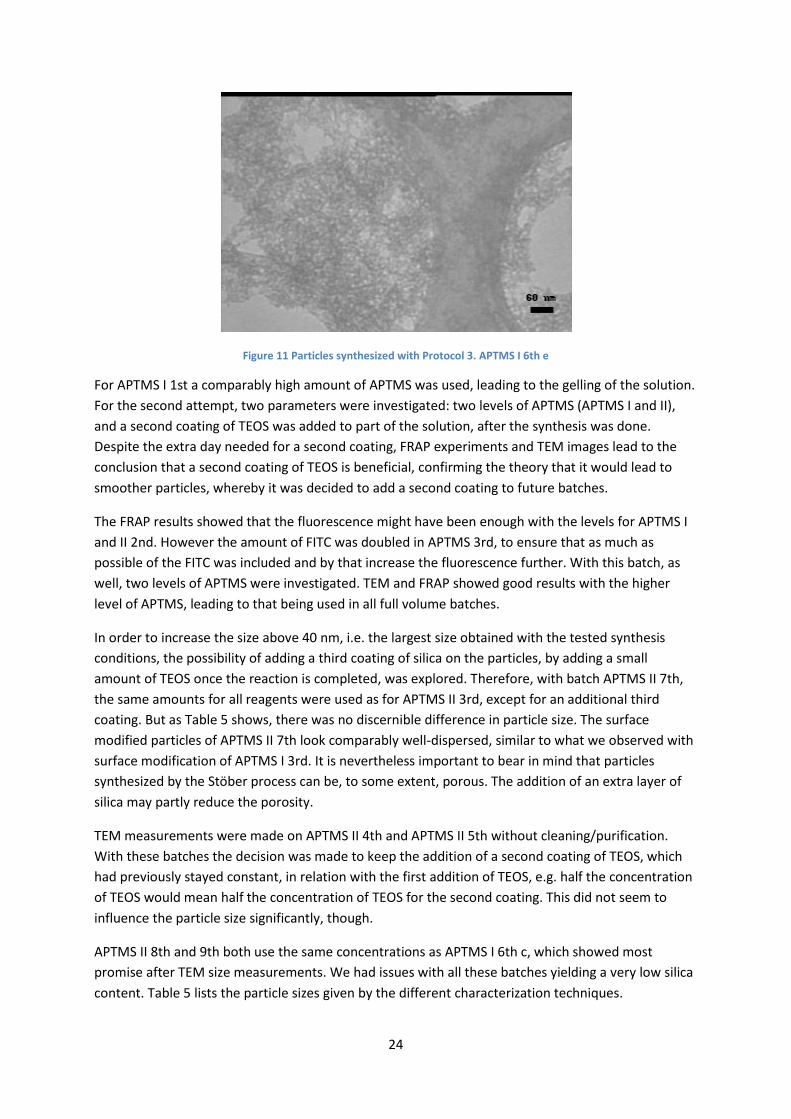
24
Figure 11 Particles synthesized with Protocol 3. APTMS I 6th e
For APTMS I 1st a comparably high amount of APTMS was used, leading to the gelling of the solution.
For the second attempt, two parameters were investigated: two levels of APTMS (APTMS I and II),
and a second coating of TEOS was added to part of the solution, after the synthesis was done.
Despite the extra day needed for a second coating, FRAP experiments and TEM images lead to the
conclusion that a second coating of TEOS is beneficial, confirming the theory that it would lead to
smoother particles, whereby it was decided to add a second coating to future batches.
The FRAP results showed that the fluorescence might have been enough with the levels for APTMS I
and II 2nd. However the amount of FITC was doubled in APTMS 3rd, to ensure that as much as
possible of the FITC was included and by that increase the fluorescence further. With this batch, as
well, two levels of APTMS were investigated. TEM and FRAP showed good results with the higher
level of APTMS, leading to that being used in all full volume batches.
In order to increase the size above 40 nm, i.e. the largest size obtained with the tested synthesis
conditions, the possibility of adding a third coating of silica on the particles, by adding a small
amount of TEOS once the reaction is completed, was explored. Therefore, with batch APTMS II 7th,
the same amounts for all reagents were used as for APTMS II 3rd, except for an additional third
coating. But as Table 5 shows, there was no discernible difference in particle size. The surface
modified particles of APTMS II 7th look comparably well-dispersed, similar to what we observed with
surface modification of APTMS I 3rd. It is nevertheless important to bear in mind that particles
synthesized by the Stöber process can be, to some extent, porous. The addition of an extra layer of
silica may partly reduce the porosity.
TEM measurements were made on APTMS II 4th and APTMS II 5th without cleaning/purification.
With these batches the decision was made to keep the addition of a second coating of TEOS, which
had previously stayed constant, in relation with the first addition of TEOS, e.g. half the concentration
of TEOS would mean half the concentration of TEOS for the second coating. This did not seem to
influence the particle size significantly, though.
APTMS II 8th and 9th both use the same concentrations as APTMS I 6th c, which showed most
promise after TEM size measurements. We had issues with all these batches yielding a very low silica
content. Table 5 lists the particle sizes given by the different characterization techniques.
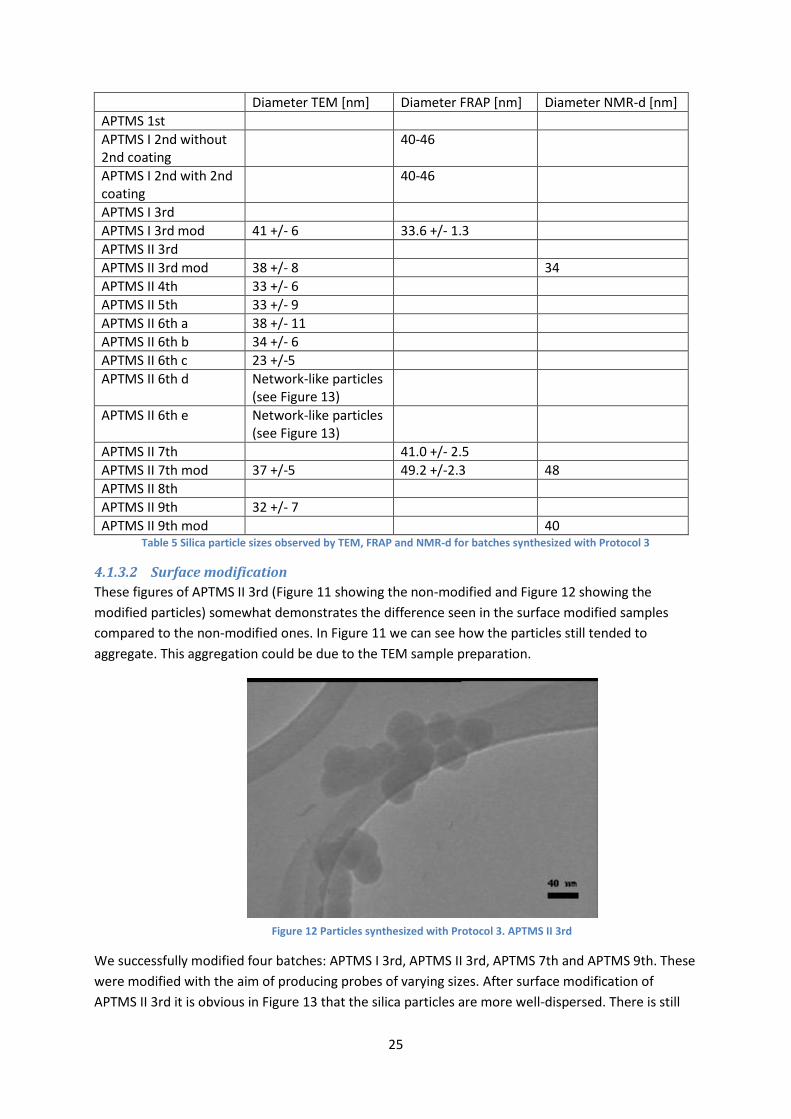
25
Diameter TEM [nm] Diameter FRAP [nm] Diameter NMR-d [nm]
APTMS 1st
APTMS I 2nd without 2nd coating
40-46
APTMS I 2nd with 2nd coating
40-46
APTMS I 3rd
APTMS I 3rd mod 41 +/- 6 33.6 +/- 1.3
APTMS II 3rd
APTMS II 3rd mod 38 +/- 8 34
APTMS II 4th 33 +/- 6
APTMS II 5th 33 +/- 9
APTMS II 6th a 38 +/- 11
APTMS II 6th b 34 +/- 6
APTMS II 6th c 23 +/-5
APTMS II 6th d Network-like particles (see Figure 13)
APTMS II 6th e Network-like particles (see Figure 13)
APTMS II 7th 41.0 +/- 2.5
APTMS II 7th mod 37 +/-5 49.2 +/-2.3 48
APTMS II 8th
APTMS II 9th 32 +/- 7
APTMS II 9th mod 40 Table 5 Silica particle sizes observed by TEM, FRAP and NMR-d for batches synthesized with Protocol 3
4.1.3.2 Surface modification
These figures of APTMS II 3rd (Figure 11 showing the non-modified and Figure 12 showing the
modified particles) somewhat demonstrates the difference seen in the surface modified samples
compared to the non-modified ones. In Figure 11 we can see how the particles still tended to
aggregate. This aggregation could be due to the TEM sample preparation.
We successfully modified four batches: APTMS I 3rd, APTMS II 3rd, APTMS 7th and APTMS 9th. These
were modified with the aim of producing probes of varying sizes. After surface modification of
APTMS II 3rd it is obvious in Figure 13 that the silica particles are more well-dispersed. There is still
Figure 12 Particles synthesized with Protocol 3. APTMS II 3rd
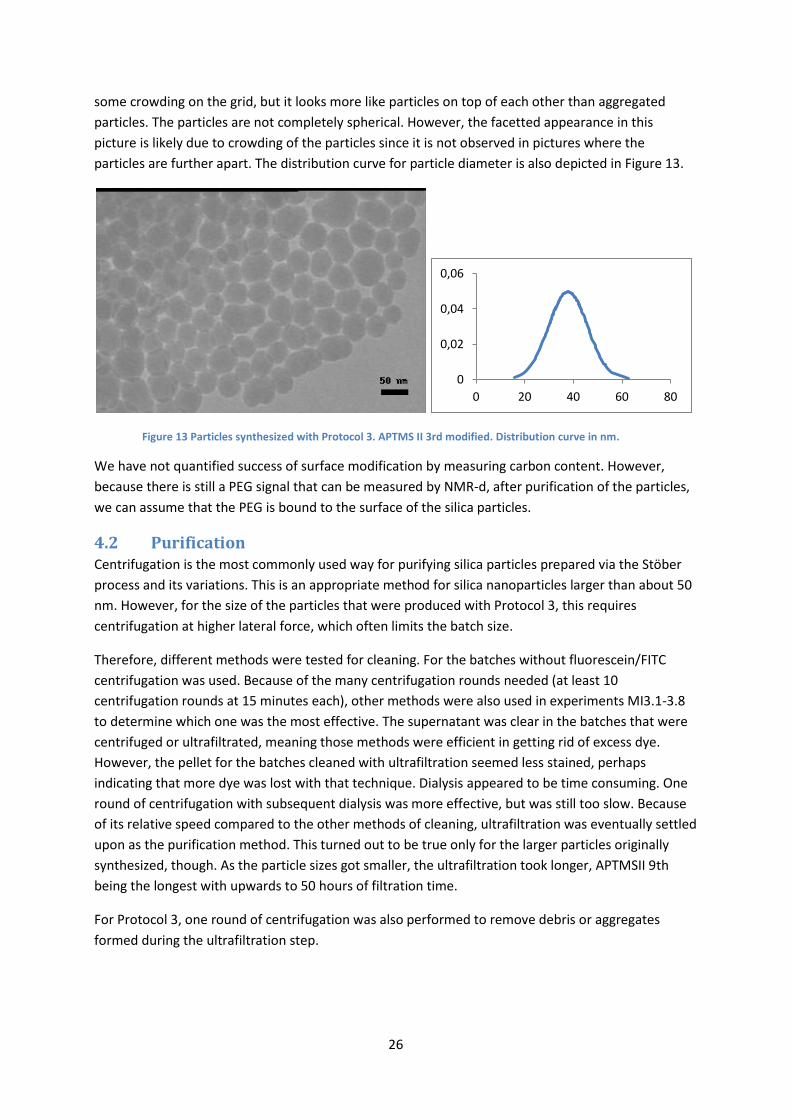
26
some crowding on the grid, but it looks more like particles on top of each other than aggregated
particles. The particles are not completely spherical. However, the facetted appearance in this
picture is likely due to crowding of the particles since it is not observed in pictures where the
particles are further apart. The distribution curve for particle diameter is also depicted in Figure 13.
Figure 13 Particles synthesized with Protocol 3. APTMS II 3rd modified. Distribution curve in nm.
We have not quantified success of surface modification by measuring carbon content. However,
because there is still a PEG signal that can be measured by NMR-d, after purification of the particles,
we can assume that the PEG is bound to the surface of the silica particles.
4.2 Purification Centrifugation is the most commonly used way for purifying silica particles prepared via the Stöber
process and its variations. This is an appropriate method for silica nanoparticles larger than about 50
nm. However, for the size of the particles that were produced with Protocol 3, this requires
centrifugation at higher lateral force, which often limits the batch size.
Therefore, different methods were tested for cleaning. For the batches without fluorescein/FITC
centrifugation was used. Because of the many centrifugation rounds needed (at least 10
centrifugation rounds at 15 minutes each), other methods were also used in experiments MI3.1-3.8
to determine which one was the most effective. The supernatant was clear in the batches that were
centrifuged or ultrafiltrated, meaning those methods were efficient in getting rid of excess dye.
However, the pellet for the batches cleaned with ultrafiltration seemed less stained, perhaps
indicating that more dye was lost with that technique. Dialysis appeared to be time consuming. One
round of centrifugation with subsequent dialysis was more effective, but was still too slow. Because
of its relative speed compared to the other methods of cleaning, ultrafiltration was eventually settled
upon as the purification method. This turned out to be true only for the larger particles originally
synthesized, though. As the particle sizes got smaller, the ultrafiltration took longer, APTMSII 9th
being the longest with upwards to 50 hours of filtration time.
For Protocol 3, one round of centrifugation was also performed to remove debris or aggregates
formed during the ultrafiltration step.
0
0,02
0,04
0,06
0 20 40 60 80
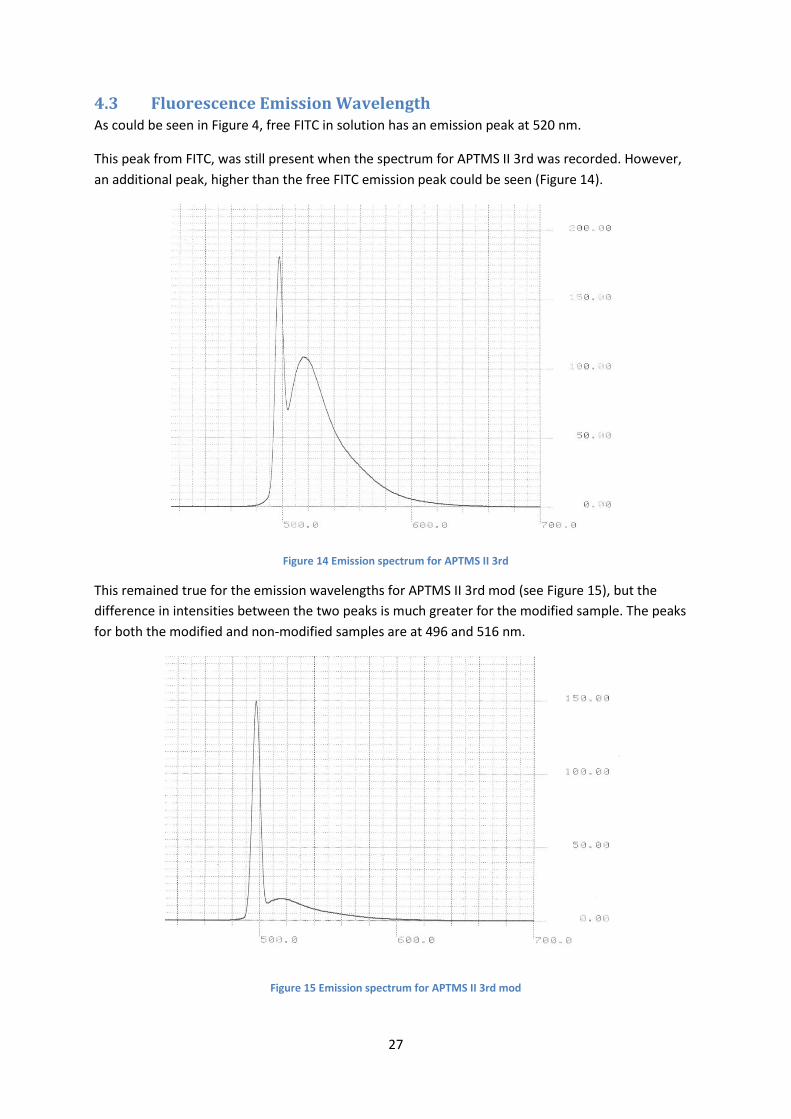
27
4.3 Fluorescence Emission Wavelength As could be seen in Figure 4, free FITC in solution has an emission peak at 520 nm.
This peak from FITC, was still present when the spectrum for APTMS II 3rd was recorded. However,
an additional peak, higher than the free FITC emission peak could be seen (Figure 14).
Figure 14 Emission spectrum for APTMS II 3rd
This remained true for the emission wavelengths for APTMS II 3rd mod (see Figure 15), but the
difference in intensities between the two peaks is much greater for the modified sample. The peaks
for both the modified and non-modified samples are at 496 and 516 nm.
Figure 15 Emission spectrum for APTMS II 3rd mod
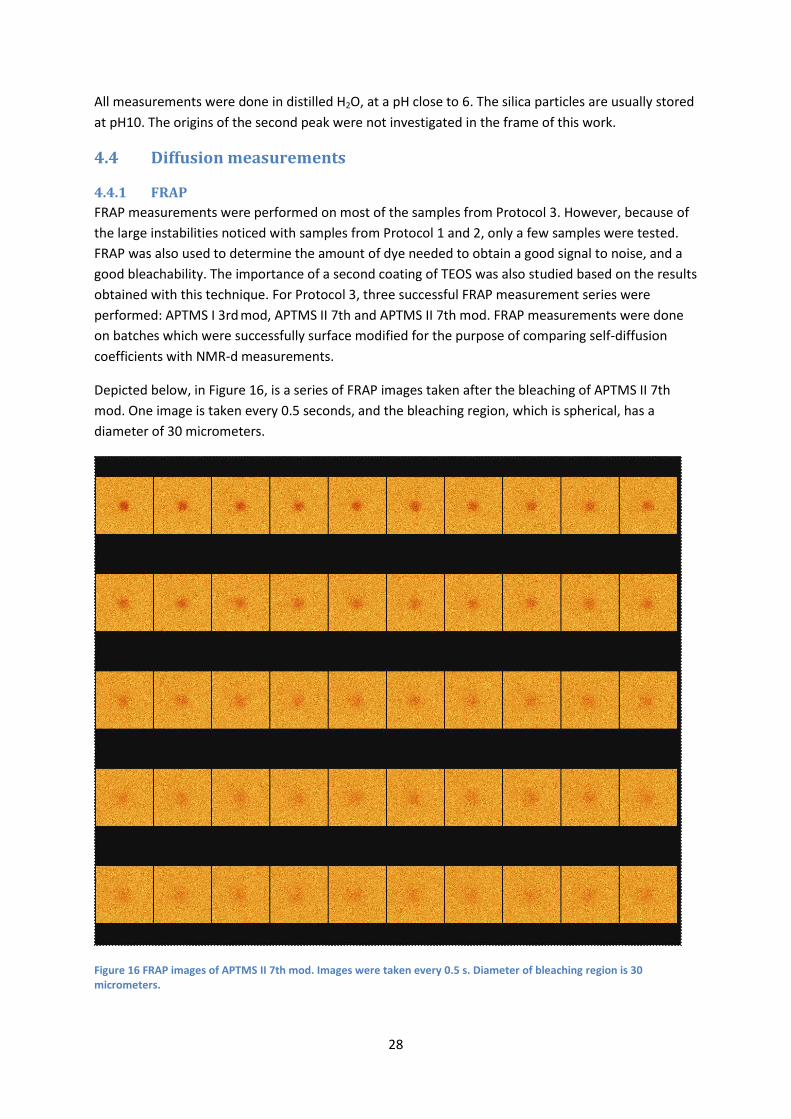
28
All measurements were done in distilled H2O, at a pH close to 6. The silica particles are usually stored
at pH10. The origins of the second peak were not investigated in the frame of this work.
4.4 Diffusion measurements
4.4.1 FRAP
FRAP measurements were performed on most of the samples from Protocol 3. However, because of
the large instabilities noticed with samples from Protocol 1 and 2, only a few samples were tested.
FRAP was also used to determine the amount of dye needed to obtain a good signal to noise, and a
good bleachability. The importance of a second coating of TEOS was also studied based on the results
obtained with this technique. For Protocol 3, three successful FRAP measurement series were
performed: APTMS I 3rd mod, APTMS II 7th and APTMS II 7th mod. FRAP measurements were done
on batches which were successfully surface modified for the purpose of comparing self-diffusion
coefficients with NMR-d measurements.
Depicted below, in Figure 16, is a series of FRAP images taken after the bleaching of APTMS II 7th
mod. One image is taken every 0.5 seconds, and the bleaching region, which is spherical, has a
diameter of 30 micrometers.
Figure 16 FRAP images of APTMS II 7th mod. Images were taken every 0.5 s. Diameter of bleaching region is 30 micrometers.
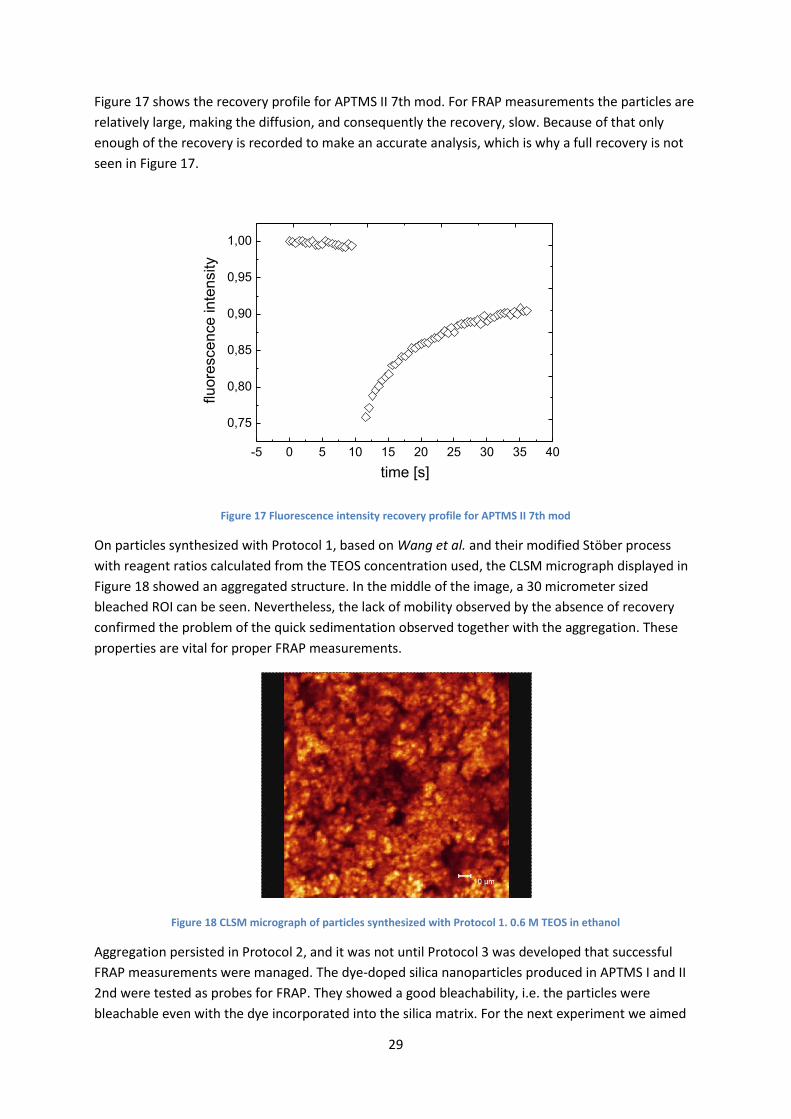
29
Figure 17 shows the recovery profile for APTMS II 7th mod. For FRAP measurements the particles are
relatively large, making the diffusion, and consequently the recovery, slow. Because of that only
enough of the recovery is recorded to make an accurate analysis, which is why a full recovery is not
seen in Figure 17.
-5 0 5 10 15 20 25 30 35 40
0,75
0,80
0,85
0,90
0,95
1,00
fluore
scence inte
nsity
time [s]
Figure 17 Fluorescence intensity recovery profile for APTMS II 7th mod
On particles synthesized with Protocol 1, based on Wang et al. and their modified Stöber process
with reagent ratios calculated from the TEOS concentration used, the CLSM micrograph displayed in
Figure 18 showed an aggregated structure. In the middle of the image, a 30 micrometer sized
bleached ROI can be seen. Nevertheless, the lack of mobility observed by the absence of recovery
confirmed the problem of the quick sedimentation observed together with the aggregation. These
properties are vital for proper FRAP measurements.
Figure 18 CLSM micrograph of particles synthesized with Protocol 1. 0.6 M TEOS in ethanol
Aggregation persisted in Protocol 2, and it was not until Protocol 3 was developed that successful
FRAP measurements were managed. The dye-doped silica nanoparticles produced in APTMS I and II
2nd were tested as probes for FRAP. They showed a good bleachability, i.e. the particles were
bleachable even with the dye incorporated into the silica matrix. For the next experiment we aimed
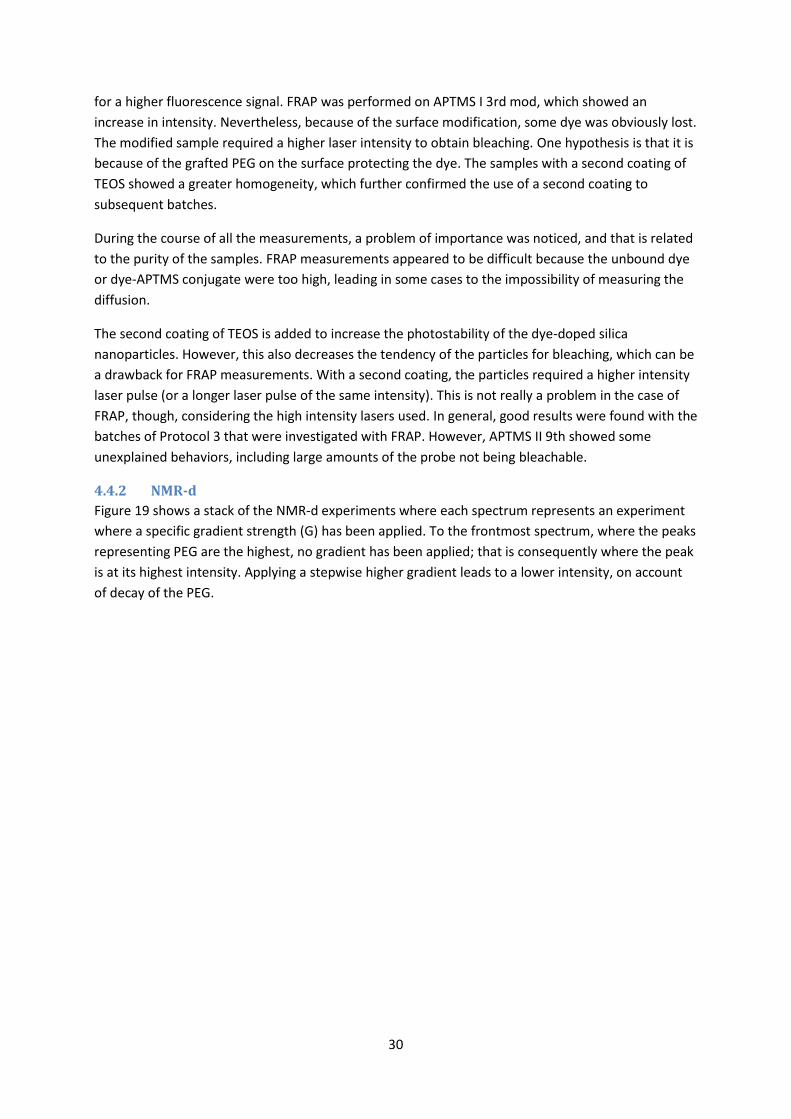
30
for a higher fluorescence signal. FRAP was performed on APTMS I 3rd mod, which showed an
increase in intensity. Nevertheless, because of the surface modification, some dye was obviously lost.
The modified sample required a higher laser intensity to obtain bleaching. One hypothesis is that it is
because of the grafted PEG on the surface protecting the dye. The samples with a second coating of
TEOS showed a greater homogeneity, which further confirmed the use of a second coating to
subsequent batches.
During the course of all the measurements, a problem of importance was noticed, and that is related
to the purity of the samples. FRAP measurements appeared to be difficult because the unbound dye
or dye-APTMS conjugate were too high, leading in some cases to the impossibility of measuring the
diffusion.
The second coating of TEOS is added to increase the photostability of the dye-doped silica
nanoparticles. However, this also decreases the tendency of the particles for bleaching, which can be
a drawback for FRAP measurements. With a second coating, the particles required a higher intensity
laser pulse (or a longer laser pulse of the same intensity). This is not really a problem in the case of
FRAP, though, considering the high intensity lasers used. In general, good results were found with the
batches of Protocol 3 that were investigated with FRAP. However, APTMS II 9th showed some
unexplained behaviors, including large amounts of the probe not being bleachable.
4.4.2 NMR-d
Figure 19 shows a stack of the NMR-d experiments where each spectrum represents an experiment
where a specific gradient strength (G) has been applied. To the frontmost spectrum, where the peaks
representing PEG are the highest, no gradient has been applied; that is consequently where the peak
is at its highest intensity. Applying a stepwise higher gradient leads to a lower intensity, on account
of decay of the PEG.
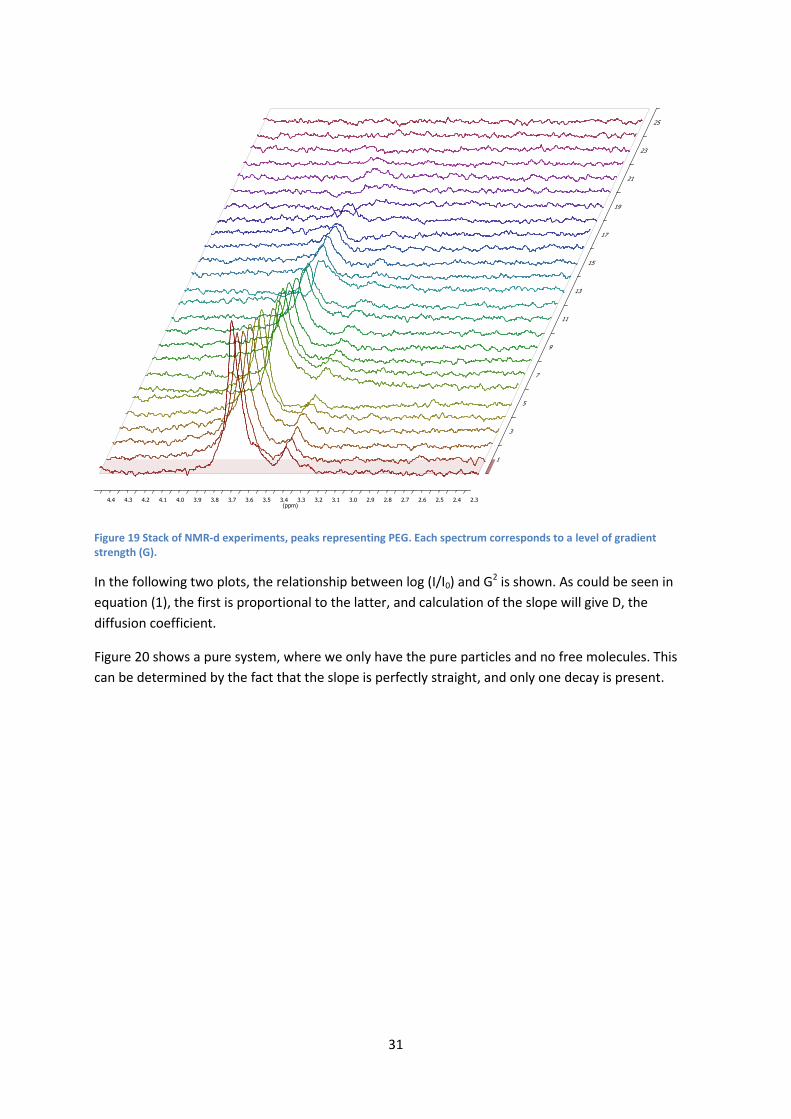
31
Figure 19 Stack of NMR-d experiments, peaks representing PEG. Each spectrum corresponds to a level of gradient strength (G).
In the following two plots, the relationship between log (I/I0) and G2 is shown. As could be seen in
equation (1), the first is proportional to the latter, and calculation of the slope will give D, the
diffusion coefficient.
Figure 20 shows a pure system, where we only have the pure particles and no free molecules. This
can be determined by the fact that the slope is perfectly straight, and only one decay is present.
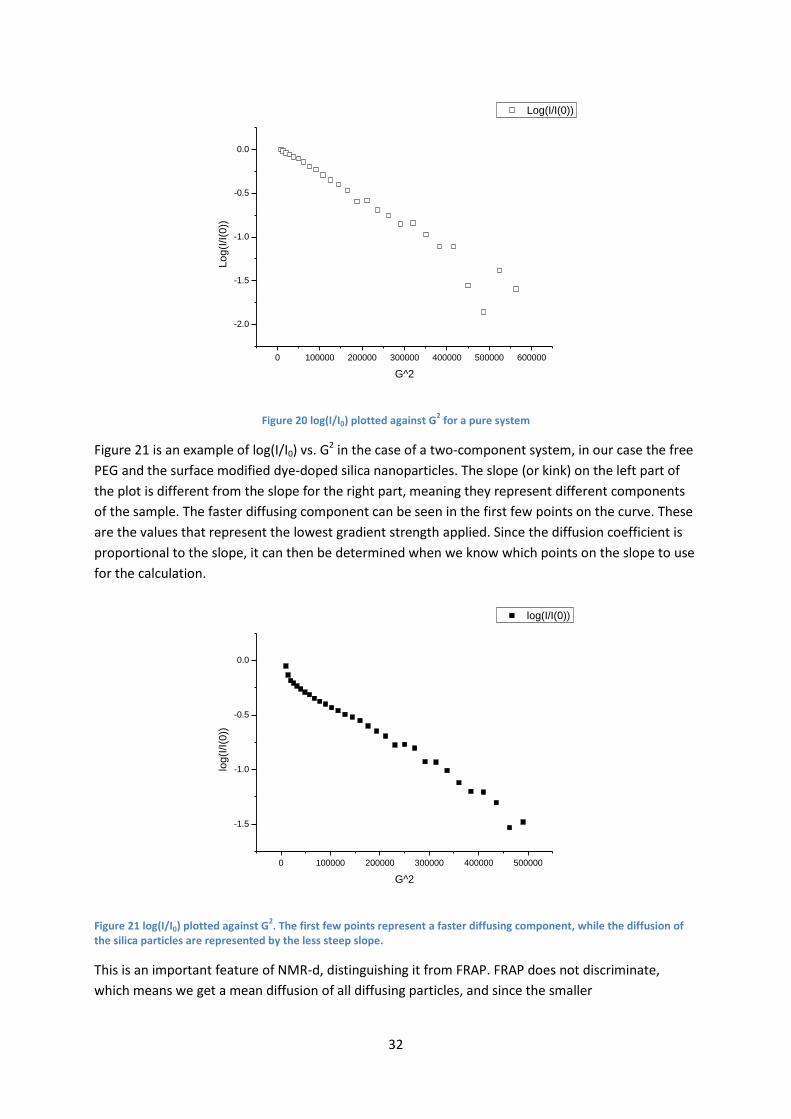
32
0 100000 200000 300000 400000 500000 600000
-2.0
-1.5
-1.0
-0.5
0.0
Log(I/I(0))
Lo
g(I
/I(0
))
G^2
Figure 20 log(I/I0) plotted against G2 for a pure system
Figure 21 is an example of log(I/I0) vs. G2 in the case of a two-component system, in our case the free
PEG and the surface modified dye-doped silica nanoparticles. The slope (or kink) on the left part of
the plot is different from the slope for the right part, meaning they represent different components
of the sample. The faster diffusing component can be seen in the first few points on the curve. These
are the values that represent the lowest gradient strength applied. Since the diffusion coefficient is
proportional to the slope, it can then be determined when we know which points on the slope to use
for the calculation.
0 100000 200000 300000 400000 500000
-1.5
-1.0
-0.5
0.0
log(I/I(0))
log
(I/I(0
))
G^2
Figure 21 log(I/I0) plotted against G2. The first few points represent a faster diffusing component, while the diffusion of
the silica particles are represented by the less steep slope.
This is an important feature of NMR-d, distinguishing it from FRAP. FRAP does not discriminate,
which means we get a mean diffusion of all diffusing particles, and since the smaller
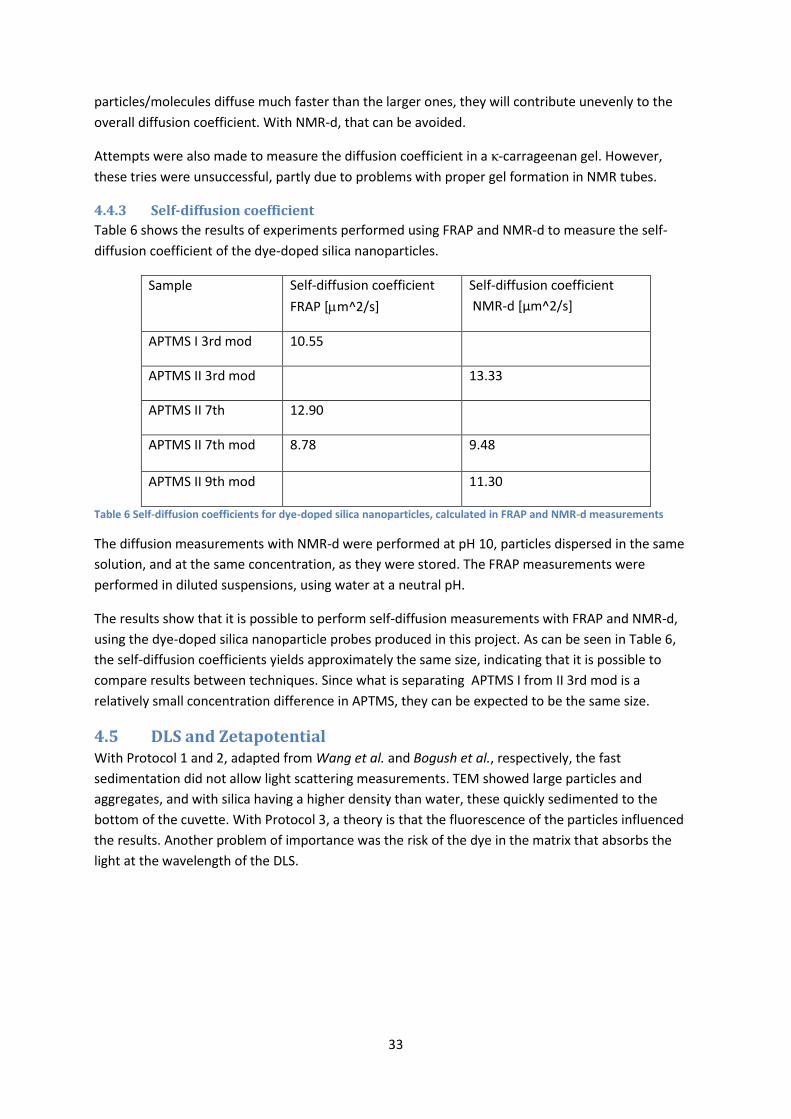
33
particles/molecules diffuse much faster than the larger ones, they will contribute unevenly to the
overall diffusion coefficient. With NMR-d, that can be avoided.
Attempts were also made to measure the diffusion coefficient in a κ-carrageenan gel. However,
these tries were unsuccessful, partly due to problems with proper gel formation in NMR tubes.
4.4.3 Self-diffusion coefficient
Table 6 shows the results of experiments performed using FRAP and NMR-d to measure the self-
diffusion coefficient of the dye-doped silica nanoparticles.
Sample Self-diffusion coefficient
FRAP [m^2/s]
Self-diffusion coefficient
NMR-d [µm^2/s]
APTMS I 3rd mod 10.55
APTMS II 3rd mod 13.33
APTMS II 7th 12.90
APTMS II 7th mod 8.78 9.48
APTMS II 9th mod 11.30
Table 6 Self-diffusion coefficients for dye-doped silica nanoparticles, calculated in FRAP and NMR-d measurements
The diffusion measurements with NMR-d were performed at pH 10, particles dispersed in the same
solution, and at the same concentration, as they were stored. The FRAP measurements were
performed in diluted suspensions, using water at a neutral pH.
The results show that it is possible to perform self-diffusion measurements with FRAP and NMR-d,
using the dye-doped silica nanoparticle probes produced in this project. As can be seen in Table 6,
the self-diffusion coefficients yields approximately the same size, indicating that it is possible to
compare results between techniques. Since what is separating APTMS I from II 3rd mod is a
relatively small concentration difference in APTMS, they can be expected to be the same size.
4.5 DLS and Zetapotential With Protocol 1 and 2, adapted from Wang et al. and Bogush et al., respectively, the fast
sedimentation did not allow light scattering measurements. TEM showed large particles and
aggregates, and with silica having a higher density than water, these quickly sedimented to the
bottom of the cuvette. With Protocol 3, a theory is that the fluorescence of the particles influenced
the results. Another problem of importance was the risk of the dye in the matrix that absorbs the
light at the wavelength of the DLS.
34
5. Discussion In this chapter the results reported, issues and possible solutions are discussed.
5.1. Particle synthesis
5.1.1 Size and morphology control of the probe
In Protocol 1 and 2 different solvents were tested. Isopropanol, ethanol and methanol were all used
in an attempt to get decreasingly smaller sizes. However, in Protocol 3 only ethanol was used, so
there is a possibility of obtaining smaller sized silica particles by using methanol as a solvent. Lower
alcohols also tend to have a more narrow size distribution. A similar relationship is found when using
a lower alkyl silicate(tetramethyl ester, TMOS).[11]
Ammonia is the catalyst in the Stöber process, and what causes the particles to be spherical.[11]
Without ammonia, the silica can flocculate in irregularly shaped particles, which may be what we
observed in APTMS I 6th d and e. According to Wang et al.[12], a low ratio of NH3/TEOS is necessary
to avoid coagulation. In our batches for Protocol 3, this ratio was much higher than in Protocol 1 and
2, but much less coagulation was found. We used a low concentration of TEOS, though, and the dry
weight content was subsequently low, which can lead to an increase in the distance between
particles. Because the particles are farther apart, the risk of particle aggregation is reduced, and the
chances of monodisperse particles increase.
5.1.2 Fluorescence of the probe
Many approaches were considered before deciding on the one utilized for Protocol 3, and naturally
they differed in the amounts of reagents used. When it comes to the synthesis of the particles, there
is also a time aspect to consider. The reaction times employed for the various stages of the synthesis,
differ in most articles. We decided on letting each step take 24 hours, but some articles use less time,
even as little as an hour for the FITC-APTMS conjugate synthesis.[24]. It is quite possible that this is a
fast reaction, given the fact that there is an immediate change in color of the medium. In the particle
synthesis, the reaction times we used for the particles that were not dye-doped were between 3 and
5 hours. But with the dye-doped particles, the batch was left alone for up to 24 hours. Due to time
restraints, the time was not always 24 hours, but always more than 12 hours.
Because of the self-quenching that occurs with the dye if the concentration used is too high, the
concentrations should be kept low. According to Santra et al.[32] the maximum concentration of dye
which can be used before self-quenching occurs, is 0.7 mM. In our case, we used 0.37mM, so
possibly we could raise the dye concentration further if higher fluorescence intensity is desired.
However, our particles are relatively small and the self-quenching increases with a smaller particle
volume due to the dye molecules getting closer to each other. [31]
The second coating of TEOS that is added contributes increasing photostability. This might be a
problem since it is actually desirable that the particles are bleachable with FRAP. However, the
intensity of lasers used in FRAP is high compared to the ones used in normal low intensity scanning
procedures for analysis, so in the case of using regular analysis equipment the stability improves.
Consequently the particles can still be used as FRAP probes. The second coating also made the
particles suspension appear more homogenous, i.e. less aggregated, which seems to imply that an
additional silica layer makes the particles more stable, since the surface has a higher degree of silica
character. The question remains as to why APTMS II 9th seemed to show a decrease in bleachability.
35
5.2. Cleaning As mentioned, ultrafiltration, which was chosen as a cleaning method, ended up being too slow to be
feasible in the end. Iler[13] talks about a couple of reasons why ultrafiltration might be slow. He
describes how, during ultrafiltration, the viscosity increases and a so-called microgel can be formed
near the surface of the filter. These things may cause the filtration time to increase. One explanation
to why the filtration took such a long time might be that the turbulence inside the filtration device
was too small due to a lower stirring rate. Another reason could be the fact that a very small amount
of aggregates is enough to slow the ultrafiltration considerably.[13]
Since there is less dye lost with the use of an FITC-APTMS conjugate, than in Protocol 1, which was
the protocol used when different purification methods were experimented with, even dialysis might
be an option. The time required to purify the solution is probably less than for Protocol 1. On the
other hand, we had problems with purifying the samples enough for FRAP, particularly APTMS II 9th,
which was ultrafiltrated for more than a week. So, getting the samples pure enough with dialysis
might be hard. van Blaaderen et al.[7] reported that only a small amount of dye was washed away in
the cleaning step. Possibly we needed a thicker second coating, like they used, to further protect the
dye inside the silica core. As stated earlier, for Protocol 3, one round of centrifugation was performed
after cleaning of the particles, to remove debris or aggregates formed during the ultrafiltration step.
The color seemed to be deeper in the pellet than in the supernatant, making it a possibility that the
pellet contained dye-APTMS conjugate not included in the silica matrices.
5.3. Characterization There is a clear trend that the modified samples look better dispersed in TEM pictures, indicating that
the surface modification has stabilized the particles. Although we applied a second coating of TEOS in
part to obtain smoother particles, the particles still did not show a completely spherical character,
but rather a more faceted surface. In general, smaller particles synthesized by the Stöber process
give less smooth and less spherical particles, and they are also less monodisperse.[8] In our case,
most batches looked rather monodisperse. Furthermore, in the final preparation method used for
the TEM grids, the particles also looked well-dispersed on the grid, in particular the surface modified
ones. It is anyway difficult to come to a conclusion regarding the truth of the improved stability
because of the introduction of the PEG moieties, simply based on the TEM observations. The latter
are highly depending on the sample preparation. The same statement is applicable for the
morphology of the particles. Nevertheless, macroscopic visual observation support the TEM
observation and this improved stability is probably a combined effect of the particles synthesized
with Protocol 3 themselves being more well-dispersed than the ones prepared with Protocol 1 and 2,
and also that we managed to avoid drying effects due to slow evaporation by removing most of the
excess water immediately.
Given the fact that the difference in particle size between batches is relatively small, it is difficult to
discern trends caused by reagent concentrations. In the trial batches of APTMS I 6th a to c, the TEOS
concentrations were halved for each step, and there is a trend of smaller particle sizes as the
concentration decreases. However, for APTMS II 4th, where the concentration of TEOS is doubled
compared to APTMS I and II 3rd, the particle size is actually smaller than for the latter batches.
As mentioned, we could not get any conclusive results from the DLS measurements. This is possibly
due to the fact that the particles are fluorescent and interfering with the laser in some way.
36
No explanation for the dual peaks in the emission spectra has been found. The two peaks are
positioned where the excitation and emission peaks for free FITC can be found, respectively. The
longer wavelength emission peak is only marginally changed by the dye being incorporated in the
silica particles, and there is no change with surface modification.
5.4. Diffusion measurements FRAP measurements were successful for all measured batches synthesized using Protocol 3, with the
exception of APTMS II 9th, which, for some reason, to a large extent did not seem bleachable. An
issue with FRAP is the necessity of purity of the sample, allowing no excess dye. This was sometimes
difficult to achieve, since there is a small constant leakage of dye from the silica nanoparticles. After
some adjustments of parameters in the NMR-d settings, batches with a lower dry-weight content
could also be used, which had originally been a problem.
As is evident from the results, we have succeeded in synthesizing a dye-doped silica nanoparticle
probe that can be used both in FRAP and NMR-d measurements. The self-diffusion coefficients
calculated with FRAP and NMR-d are of the same magnitude, showing that it is possible to compare
results from the techniques. The difference can be explained, to some extent, by the difference in pH
used for the measurement. The dye-doped silica nanoparticles synthesized were small enough not to
sediment. They showed a good enough fluorescence intensity to be used in FRAP experiments, but
were still bleachable. And the surface modification was successful, shown by the fact that we could
use the nanoparticles in NMR-d experiments. The successful measurements were all performed in
free solution.
37
6. Conclusion In this project our aim was to synthesize silica nanoparticles which can be used as probes for
measuring diffusion using FRAP and NMR-d. Two protocols were investigated before we developed a
third modified Stöber protocol, based on previous research, where FITC was covalently bound to
APTMS and in that way incorporated into the silica matrix.
Using the final protocol, we managed to obtain relatively monodisperse particles for all batches that
we observed by TEM. We also managed to synthesize probes with which diffusion measurements are
possible to perform locally, with FRAP, and globally, using NMR-d. The aim of the study was to
produce a probe that could be used in comparative experiments using both FRAP and NMR-d, and
that aim has thus been accomplished.
When it comes to which protocol to use for synthesis of dye-doped silica nanoparticles, there really is
no question as to which to choose from the protocols tested. Protocol 3, using a complex between
the dye and a conjugate molecule gives better results in every respect, including colloidal stability,
TEM visualization, and FRAP results. (NMR-d experiments were not performed on any of the Protocol
1 and 2 particles, since no modifications were done on them, so no comparison is possible.)
As for the size of the particles, there were some batches that were not regarded as successful in this
project, i.e. they did not go below 100 nm in size. However, they were still successful in that we
obtained spherical, dispersed silica particles, meaning that they could be useful for purposes where
bigger particles are desirable, if they are also successfully dye-doped.
The scope for possible uses of dye-doped silica nanoparticles is big. A couple of examples are that
fluorescing silica particles can be modified to bind to antigens of harmful bacteria to evaluate food
safety, and that dye-doped silica particles could be used as contrast in magnetic resonance imaging,
combining it with optical imaging.[4] Silica nanoparticles have also shown promise in being able to
function in a drug delivery system, where the surface is designed to target a particular place in the
body and deposit the active substance. Particles which have magnetic cores have been synthesized. If
these are modified to bind to cancer cells, and a dc magnetic field is then applied, the cancer cells
could potentially be selectively destroyed. [8]
38
7. Further Work There are several aspects of this project which would be beneficial to consider for further
investigation in future research. When it comes to the synthesis of the particles, we have only used a
modified Stöber process as basis for our protocol, but there are other ways of synthesizing silica
particles, perhaps more suited for our aim. Given how the microemulsion technique is reported to
give spherical and highly monodisperse particles, it might be of interest to look into adapting
Protocol 3 from this study to a microemulsion technique instead. Roy et al[31] reported using a
conjugate between a dye referred to as NIR664 and MPTES for synthesis of dye-doped particles with
the microemulsion technique. Because the size distribution is narrower with lower alcohols[11] it
might also be worth it to try Protocol 3 using methanol as a solvent.
An area for definitive improvement at this time is the cleaning/purification step. The premise of
ultrafiltration is a great one, in theory. However, with the smaller particles and pore sizes in filters,
the filtration takes too much time. We meant to try ultracentrifugation instead, given that the
centrifuge used in initial experiments, where larger particles were obtained, is not powerful enough
to spin down the smaller particles synthesized with the last protocol, but there wasn’t time. If it
would be possible to use the ultracentrifuge to clean/purify the particles, a lot of time could be
saved.
It would be useful to get accurate DLS measurements. DLS is a great way to obtain statistics for a
sample. We attempted to make NMR-d measurements in a gel system. However, the issue with
cooling the gel down slowly enough, in the NMR tube, proved too difficult. If that could be solved,
interesting comparisons could be made with FRAP, for which SIK have developed protocols.
We know that we have managed to get fluorescent particles, but it would also be interesting to
quantify the fluorescence in different ways. A UV spectra could be recorded, and ε, the absorption
coeffiecient might be calculated. It would be of interest to measure the quantum yield. We have a
working concept for synthesizing dye-doped silica nanoparticles – now we need accuracy in the
system, and being able to control parameters such as size. What also remains to be investigated is
the possibility of using the particles as probes in heterogeneous materials, such as gels.
39
8. Acknowledgements I would like to thank my supervisor Romain Bordes for his commitment to and enthusiasm for this
project. I would also like to thank him for the NMR-d measurements.
Thank you to my supervisor Maria Pihl for her interest in silica particles and support with lab work
and report writing.
Also big thanks to Erich Schüster at SIK for doing the FRAP measurements, and his willingness to
answer all of my questions.
I also want to thank my examiner Professor Krister Holmberg for helping out with some of the
compulsory items of my thesis.
I want to thank all the people at the department for Applied Surface Chemistry for making me feel
welcome, and especially the other Master’s students for always being able to brighten my day when
it was needed. Special thanks to Ali Movahedi, without whose help the first Protocol 3 batch would
not have gotten started when it did, and Saba Atefyekta, who graciously offered to be my opponent.
Thanks to VINN Excellence Center SuMo Biomaterials (Supermolecular Biomaterials –Structure
dynamics and properties) for supporting this project.
Finally, I want to thank my family and friends. My dad for being a great support with the day-to-day
things. My friends, Magda, Jimmy and Tina for keeping me sane when I was stressed out. But most of
all, Magnus, for always being there and being my pillar of strength.
40
9. References 1. Loren, N., M. Nyden, and A.M. Hermansson, Determination of local diffusion properties in
heterogeneous biomaterials. Adv Colloid Interface Sci, 2009. 150(1): p. 5-15. 2. SuMo Concept, SuMo Biomaterials - Webpage of Chalmers University of Technology. [cited
2013 April 22]; Available from: http://www.chalmers.se/chem/sumo-en/sumo-biomaterials. 3. Innovations through world-class research - Developing the next generation sustainable soft
biomaterials by using predictive science, SuMo - Competence Centre for Supramolecular Biomaterials: Chalmers University of Technology.
4. Lipani, E., et al., High-relaxivity and luminescent silica nanoparticles as multimodal agents for molecular imaging. Langmuir, 2013. 29(10): p. 3419-27.
5. Lian, W., et al., Ultrasensitive detection of biomolecules with fluorescent dye-doped nanoparticles. Anal Biochem, 2004. 334(1): p. 135-44.
6. Shaw, D.J., Introduction to Colloid and Surface Chemistry. Fourth ed1992: Butterworth-Heinemann.
7. van Blaaderen, A. and A. Vrij, Synthesis and characterization of colloidal dispersions of fluorescent, monodisperse silica spheres. Langmuir, 1992. 8(12): p. 2921-2931.
8. Wang, L., et al., Watching silica nanoparticles glow in the biological world. Analytical Chemistry, 2006. 78(3): p. 646-654.
9. Zhang, N., et al., Synthesis, characterizations of dye-doped silica nanoparticles and their application in labeling cells. Colloids Surf B Biointerfaces, 2012. 89: p. 133-8.
10. Choi, J., et al., Core-shell silica nanoparticles as fluorescent labels for nanomedicine. J Biomed Opt, 2007. 12(6): p. 2823149.
11. Stöber, W., A. Fink, and E. Bohn, Controlled growth of monodisperse silica spheres in the micron size range. J Colloid Interface Sci, 1968. 26(1): p. 62-69.
12. Wang, X.D., et al., Preparation of spherical silica particles by Stober process with high concentration of tetra-ethyl-orthosilicate. J Colloid Interface Sci, 2010. 341(1): p. 23-9.
13. Iler, R.K., Chemistry of Silica - Solubility, Polymerization, Colloid and Surface Properties and Biochemistry. Chapter 4: John Wiley & Sons.
14. Zhuravlev, L.T., The surface chemistry of amorphous silica. Zhuravlev model. Colloids and Surfaces A: Physicochemical and Engineering Aspects, 2000. 173(1–3): p. 1-38.
15. Iler, R.K., The chemistry of silica : solubility, polymerization, colloid and surface properties, and biochemistry p. 622-623, 1979, New York: Wiley.
16. Bourgeat-Lami, E. and J. Lang, Encapsulation of Inorganic Particles by Dispersion Polymerization in Polar Media: 1. Silica Nanoparticles Encapsulated by Polystyrene. J Colloid Interface Sci, 1998. 197(2): p. 293-308.
17. Kim, J.W., L.U. Kim, and C.K. Kim, Size Control of Silica Nanoparticles and Their Surface Treatment for Fabrication of Dental Nanocomposites. Biomacromolecules, 2006. 8(1): p. 215-222.
18. Fripiat, J.J., Surface Properties of Alumino-Silicates. Clays and Clay Minerals, 1963. 12(1): p. 327-358.
19. Douglas T. Gjerde, S.C.A. and G.C.A. Paul D. Taylor, Non-polar media for polynucleotide separations, 2003: US.
20. Iler, R.K., Chemistry of Silica - Solubility, Polymerization, Colloid and Surface Properties and Biochemistry. Chapter 6: John Wiley & Sons.
21. Rao, K.S., et al., A novel method for synthesis of silica nanoparticles. Journal of Colloid and Interface Science, 2005. 289(1): p. 125-131.
22. Bogush, G., M. Tracy, and C. Zukoski, Preparation of monodisperse silica particles: control of size and mass fraction. Journal of Non-Crystalline Solids, 1988. 104(1): p. 95-106.
23. Razink, J.J. and N.E. Schlotter, Correction to “Preparation of monodisperse silica particles: Control of size and mass fraction” by G.H. Bogush, M.A. Tracy and C.F. Zukoski IV, Journal of
41
Non-Crystalline Solids 104 (1988) 95–106. Journal of Non-Crystalline Solids, 2007. 353(30–31): p. 2932-2933.
24. Estévez, M.-C., et al., Highly fluorescent dye-doped silica nanoparticles increase flow cytometry sensitivity for cancer cell monitoring. Nano Research, 2009. 2(6): p. 448-461.
25. May, F., et al., Synthesis and characterization of photoswitchable fluorescent SiO2 nanoparticles. Chemistry, 2012. 18(3): p. 814-21.
26. Ow, H., et al., Bright and stable core-shell fluorescent silica nanoparticles. Nano Lett, 2005. 5(1): p. 113-7.
27. Alesker, M., et al., Hybrid silicananoparticles traceable by fluorescence and FT-IR spectroscopy: preparation, characterization and preliminary biological studies. Journal of Materials Chemistry, 2011. 21(29): p. 10883-10893.
28. Ha, S.W., et al., New method to prepare very stable and biocompatible fluorescent silica nanoparticles. Chem Commun, 2009. 28(20): p. 2881-3.
29. Bagwe, R.P., L.R. Hilliard, and W. Tan, Surface Modification of Silica Nanoparticles to Reduce Aggregation and Nonspecific Binding. Langmuir, 2006. 22(9): p. 4357-4362.
30. Qhobosheane, M., et al., Biochemically functionalized silica nanoparticles. Analyst, 2001. 126(8): p. 1274-8.
31. Roy, S., et al., Fluorescence lifetime analysis and fluorescence correlation spectroscopy elucidate the internal architecture of fluorescent silica nanoparticles. Langmuir, 2010. 26(17): p. 13741-6.
32. Santra, S., et al., Development of novel dye-doped silica nanoparticles for biomarker application. J Biomed Opt, 2001. 6(2): p. 160-6.
33. Tansub, W.e.a., Synthesis of Antibodies-Conjugated Fluorescent Dye-Doped Silica Nanoparticles for a Rapid Single Step Detection of Campylobacter jejuni in Live Poultry. Journal of Nanomaterials, 2012. 2012: p. 7.
34. Yang, W., et al., Novel fluorescent silica nanoparticle probe for ultrasensitive immunoassays. Analytica Chimica Acta, 2004. 503(2): p. 163-169.
35. He, X., et al., A novel fluorescent label based on organic dye-doped silica nanoparticles for HepG liver cancer cell recognition. J Nanosci Nanotechnol, 2004. 4(6): p. 585-9.
36. Lodish H, B.A., Zipursky SL, et al., Molecular Cell Biology. 4th ed2000: New York: W. H. Freeman.
37. Gonçalves, M.S.T., Fluorescent labeling of biomolecules with organic probes. Chemical reviews, 2009. 109(1): p. 190.
38. Pihl, M., Chalmers University of Technology. 39. Baeyer, A., Ueber eine neue Klasse von Farbstoffen. Ber. Dtsch. Chem. Ges., 1871. 4(2): p.
555-558. 40. "Adolf von Baeyer - Biography". Nobelprize.org. 22 Mar 2013. Available from:
http://www.nobelprize.org/nobel_prizes/chemistry/laureates/1905/baeyer-bio.html. 41. O'Goshi, K.-i. and J. Serup, Safety of sodium fluorescein for in vivo study of skin. Skin Research
and Technology, 2006. 12(3): p. 155-161. 42. Zheng, H., et al., Advances in modifying fluorescein and rhodamine fluorophores as
fluorescent chemosensors. Chemical Communications, 2013. 49(5): p. 429-447. 43. Bennett, T.J. Fundamentals of Fluorescein Angiography. [cited 2013 May 6]; Available from:
http://www.opsweb.org/?page=FA. 44. Smith, S. and W. Pretorius, The conservative behaviour of fluorescein. WATER SA-PRETORIA-,
2002. 28(4): p. 403-406. 45. Deschout, H., et al., Straightforward FRAP for quantitative diffusion measurements with a
laser scanning microscope. Opt Express, 2010. 18(22): p. 22886-905. 46. Östlund, Å., A Nuclear Magnetic Resonance Study of Polysaccharides in Solution, in Applied
Surface Chemistry, Department of Chemical and Biological Engineering2007, Chalmers University of Technology: Gothenburg, Sweden.
42
47. Walther, B., et al., Influence of kappa-carrageenan gel structures on the diffusion of probe molecules determined by transmission electron microscopy and NMR diffusometry. Langmuir, 2006. 22(19): p. 8221-8.
48. Stejskal, E.O. and J.E. Tanner, Spin Diffusion Measurements: Spin Echoes in the Presence of a Time-Dependent Field Gradient. The Journal of Chemical Physics, 1965. 42(1): p. 288-292.
49. Sigma-Aldrich Website. Available from: http://www.sigmaaldrich.com.
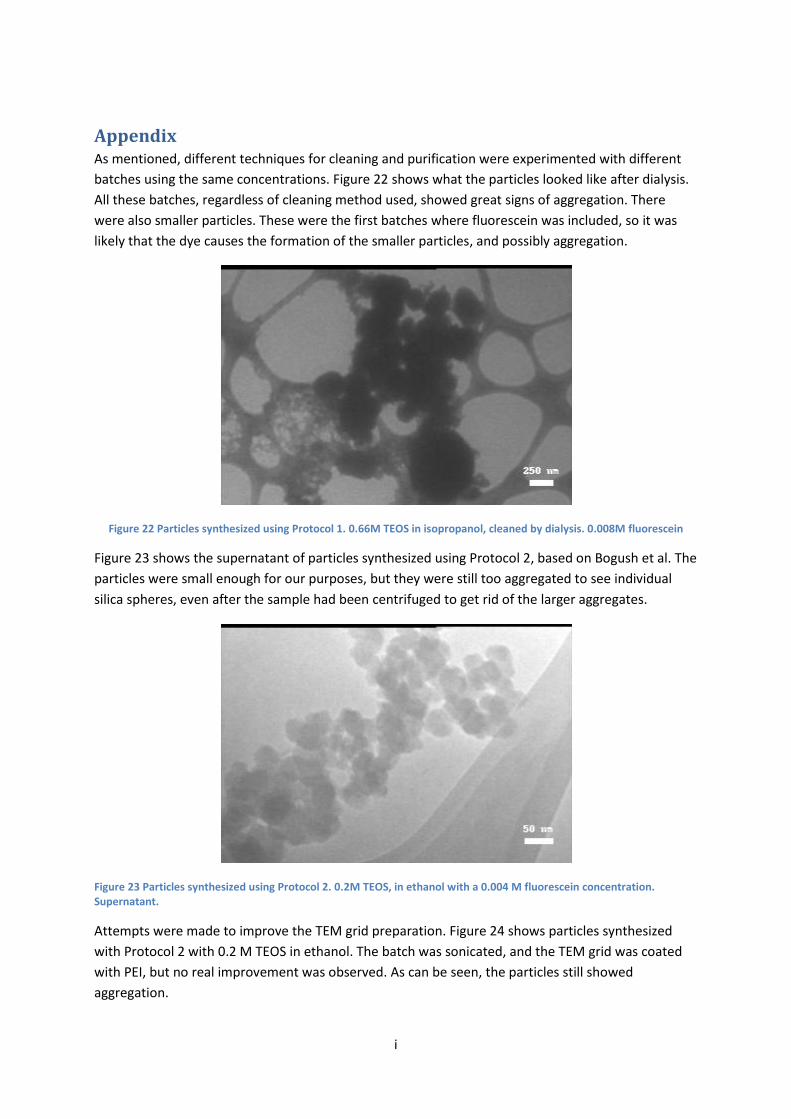
i
Appendix As mentioned, different techniques for cleaning and purification were experimented with different
batches using the same concentrations. Figure 22 shows what the particles looked like after dialysis.
All these batches, regardless of cleaning method used, showed great signs of aggregation. There
were also smaller particles. These were the first batches where fluorescein was included, so it was
likely that the dye causes the formation of the smaller particles, and possibly aggregation.
Figure 22 Particles synthesized using Protocol 1. 0.66M TEOS in isopropanol, cleaned by dialysis. 0.008M fluorescein
Figure 23 shows the supernatant of particles synthesized using Protocol 2, based on Bogush et al. The
particles were small enough for our purposes, but they were still too aggregated to see individual
silica spheres, even after the sample had been centrifuged to get rid of the larger aggregates.
Figure 23 Particles synthesized using Protocol 2. 0.2M TEOS, in ethanol with a 0.004 M fluorescein concentration. Supernatant.
Attempts were made to improve the TEM grid preparation. Figure 24 shows particles synthesized
with Protocol 2 with 0.2 M TEOS in ethanol. The batch was sonicated, and the TEM grid was coated
with PEI, but no real improvement was observed. As can be seen, the particles still showed
aggregation.
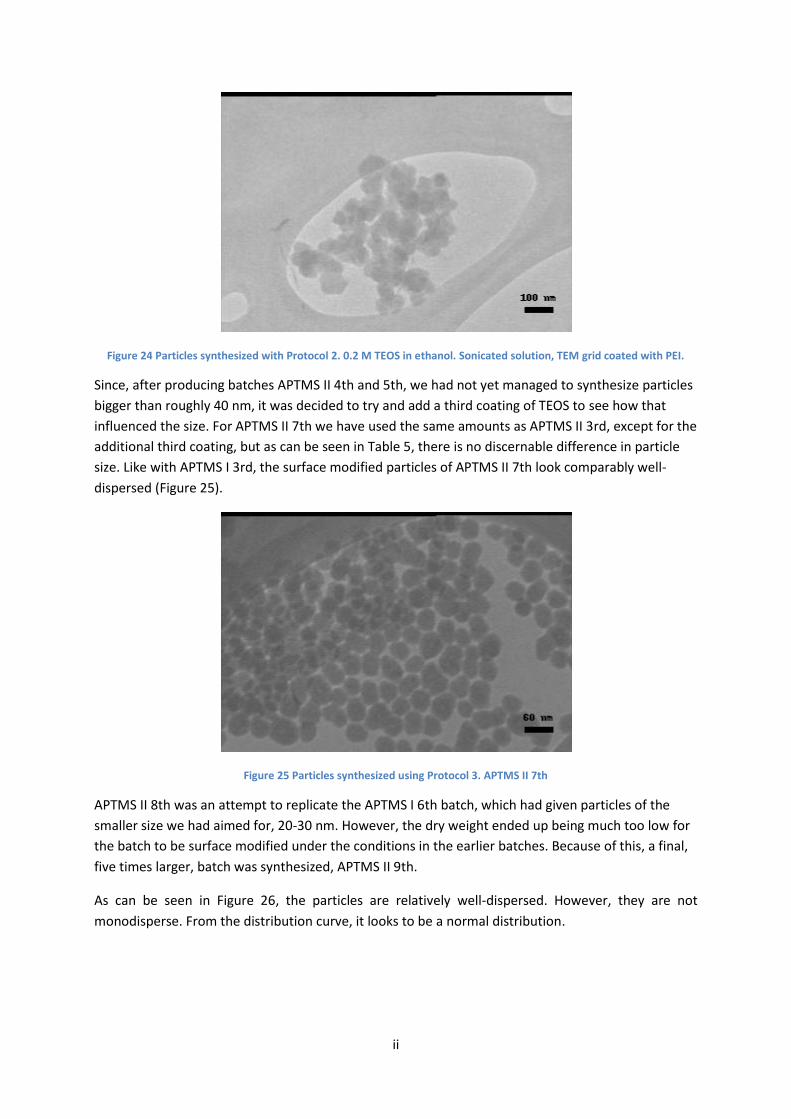
ii
Figure 24 Particles synthesized with Protocol 2. 0.2 M TEOS in ethanol. Sonicated solution, TEM grid coated with PEI.
Since, after producing batches APTMS II 4th and 5th, we had not yet managed to synthesize particles
bigger than roughly 40 nm, it was decided to try and add a third coating of TEOS to see how that
influenced the size. For APTMS II 7th we have used the same amounts as APTMS II 3rd, except for the
additional third coating, but as can be seen in Table 5, there is no discernable difference in particle
size. Like with APTMS I 3rd, the surface modified particles of APTMS II 7th look comparably well-
dispersed (Figure 25).
Figure 25 Particles synthesized using Protocol 3. APTMS II 7th
APTMS II 8th was an attempt to replicate the APTMS I 6th batch, which had given particles of the
smaller size we had aimed for, 20-30 nm. However, the dry weight ended up being much too low for
the batch to be surface modified under the conditions in the earlier batches. Because of this, a final,
five times larger, batch was synthesized, APTMS II 9th.
As can be seen in Figure 26, the particles are relatively well-dispersed. However, they are not
monodisperse. From the distribution curve, it looks to be a normal distribution.
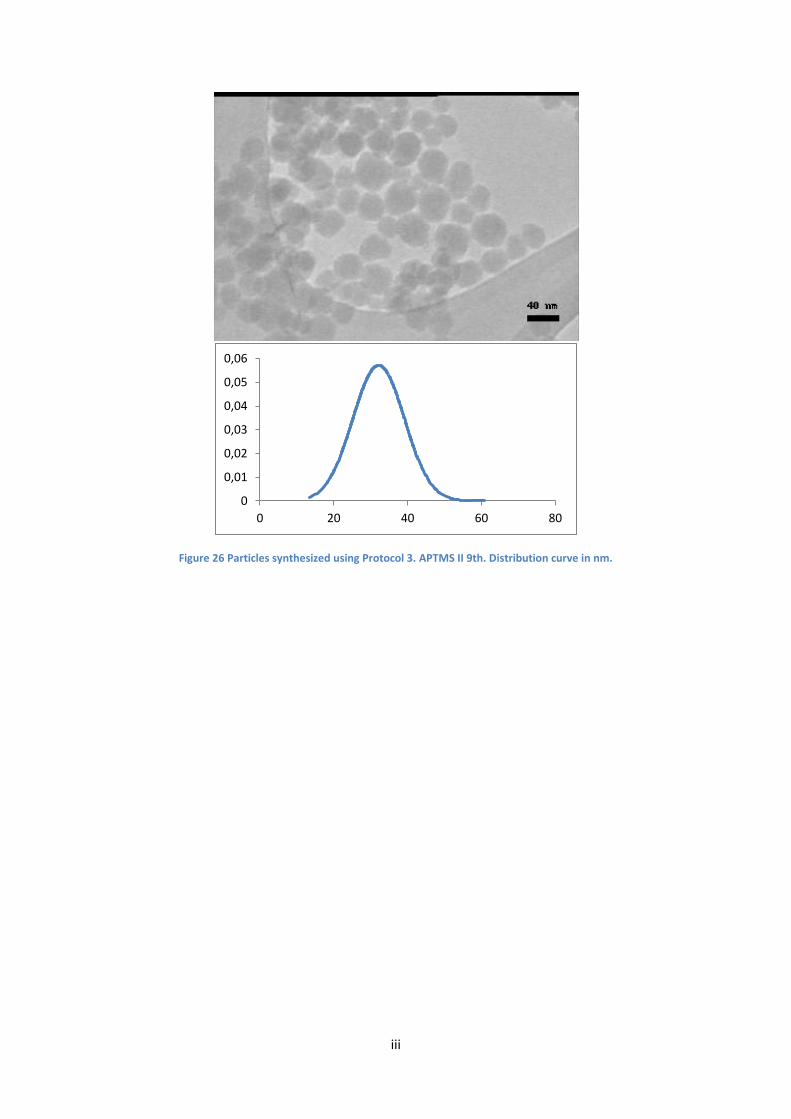
iii
Figure 26 Particles synthesized using Protocol 3. APTMS II 9th. Distribution curve in nm.
0
0,01
0,02
0,03
0,04
0,05
0,06
0 20 40 60 80


![Oil absorption in mesoporous silica particles - UNS 10 06.pdf · 265 Processing and Application of Ceramics 4 [4] (2010) 265–269 Oil absorption in mesoporous silica particles Radislav](https://img.pdfslide.us/doc/110x75/5adf06147f8b9a6e5c8b9b88/oil-absorption-in-mesoporous-silica-particles-10-06pdf265-processing-and-application.jpg)
![Organization of silica spherical particles into different ... · The uniform sub-micron silica particles were synthesized following the modified Stöber method [6]. A mixture of ethanol](https://img.pdfslide.us/doc/110x75/5f9bdac425738165624c28e6/organization-of-silica-spherical-particles-into-different-the-uniform-sub-micron.jpg)