Embed Size (px)
Citation preview
Synthesis, Crystal Structure and Solid State NMR
Investigations of Heteronuclear Zn/Co Coordination
Networks - A Comparative Study
Anusree Viswanath Kuttatheyil,† Daniel Lässig,‡ Jörg Lincke,‡ Merten Kobalz,‡
Maria Baias,¶ Katja König,§ Jörg Hofmann,§ Harald Krautscheid,‡ Chris J.
Pickard,‖ Jürgen Haase,† and Marko Bertmer∗,†
Universität Leipzig, Fakultät für Physik und Geowissenschaften, Linnéstr. 5, D-04103, Germany,
Universität Leipzig, Fakultät für Chemie und Mineralogie, Johannisallee 29, D-04103, Germany,
Universitè de Lyon, Centre de RMN à très hauts champs, CNRS/ENS Lyon/UCBL, 5 Rue de la
Doua, 69100 Villeurbanne, France, Institut für Nichtklassische Chemie, e.V., Permoserstr.15,
D-04318, Germany, and Department of Physics & Astronomy, University College London, Gower
Street, London, United Kingdom
E-mail: [email protected]
Abstract
Synthesis and solid-state NMR characterization of two isomorphous series of zinc and
cobalt coordination networks with 1,2,4-triazolyl benzoate ligands are reported. Both series
∗To whom correspondence should be addressed†Universität Leipzig, Fakultät für Physik und Geowissenschaften, Linnéstr. 5, D-04103, Germany‡Universität Leipzig, Fakultät für Chemie und Mineralogie, Johannisallee 29, D-04103, Germany¶Universitè de Lyon, Centre de RMN à très hauts champs, CNRS/ENS Lyon/UCBL, 5 Rue de la Doua, 69100
Villeurbanne, France§ Institut für Nichtklassische Chemie, e.V., Permoserstr.15, D-04318, Germany‖Department of Physics & Astronomy, University College London, Gower Street, London, United Kingdom
1
consist of 3D diamondoid networks with fourfold interpenetration. Solid-state NMR identifies
the metal coordination of the ligands and assignment of all 1H and 13C shifts was enabled by
the combination of 13C editing and FSLG-HETCOR spectra, 2D 1H-1H back-to-back (BABA)
spectra with results from NMR-CASTEP calculations. The incorporation of Co2+ replacing
Zn2+ ions in the MOF over the full range of concentrations has significant influences on the
NMR spectra. A uniform distribution of metal ions is documented based on the analysis of 1H
T1 relaxation time measurements.
Introduction
Coordination Networks or often called Metal-organic frameworks (MOFs) have attracted tremen-
dous attention in recent years as a new class of porous compounds.1,2 The dramatic increase in
the number of publications in this area shows its growing interest as can be seen for instance
in two reviews.3,4 The wide structural diversity offered by this class has high potential for vari-
ous applications including gas storage,5,6 catalysis,7 sensoring,8 gas separation9 and others, such
as heat-transformation applications.10–13 They are designed from inorganic building blocks, e.g.,
metal ions or clusters interconnected by polyfunctional organic ligands.
Carboxylates are the most extensively studied polyfunctional organic ligands. Apart from this,
ligands having a combination of both neutral donor groups such as pyridine or 1,2,4-triazoles and
anionic functional groups like carboxylates are of interest14,15 where the coordination properties
of both functional groups can be combined. 1,2,4-triazole derived ligands show promising coor-
dination chemistry especially when substituted with certain donor groups. The synthesis of such
ligands has been reported16 and successfully applied for the preparation of novel MOFs.17,18 Es-
pecially MOFs with N-donor ligands show interesting properties for heterogeneous catalysis.19 On
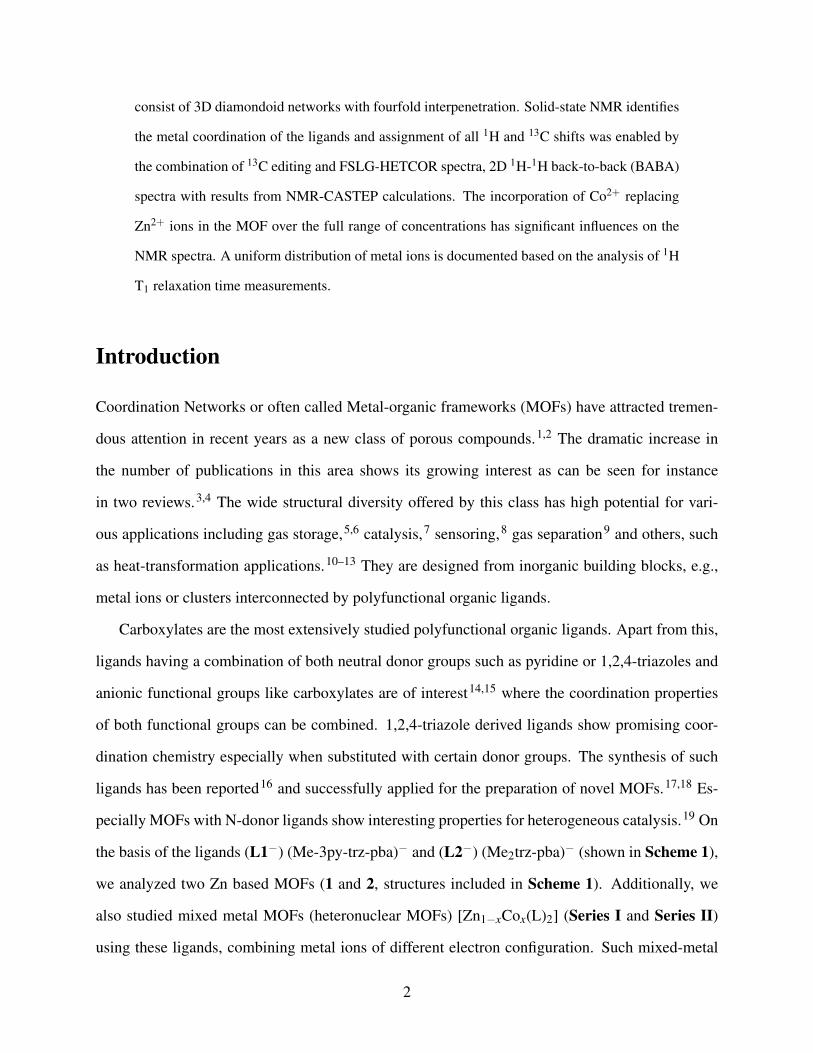
the basis of the ligands (L1−) (Me-3py-trz-pba)− and (L2−) (Me2trz-pba)− (shown in Scheme 1),
we analyzed two Zn based MOFs (1 and 2, structures included in Scheme 1). Additionally, we
also studied mixed metal MOFs (heteronuclear MOFs) [Zn1−xCox(L)2] (Series I and Series II)
using these ligands, combining metal ions of different electron configuration. Such mixed-metal
2
systems exhibit interesting catalytic properties.19 The heteronuclear MOFs were prepared by par-
tially substituting the diamagnetic Zn2+ ions with varying amounts of paramagnetic Co2+ ions in
the full range from x = 0.02 to x = 1.
4
32
7
65
N
CO2
1
9
N N
108 11
12N
13
1415
1234
5
67
8
9
1011
12
1314
15
1 (a)
(b)
4
32
7
65
N
CO2
1
9
N N
108 8a
12
34
5 6
7
8
9
108a
2 (a)
(b)
Scheme 1: Ligand structures of, 1(a) L1− (Me-3py-trz-pba)− and 2(a) L2− (Me2trz-pba)− withcarbon numbering used in this text. The corresponding structural motifs of the coordinationpolymers are given in 1(b) and 2(b) respectively.
Various experimental methods can be used for the structural characterization of porous co-
ordination compounds. A better understanding of the various interactions present in the metal -
ligand framework is inevitable to explore its potential applicability. Solid-state NMR is a versatile
tool for studying the different interactions present in porous co-ordination frameworks, which is
increasingly used for the characterization of structure and dynamics in these materials.20–24 NMR
spectra of solid samples provide information on the detailed local electronic structure of each nu-
cleus reflected as chemical shift without the need of long-range order. Therefore, non-crystalline
materials can be characterized with solid-state NMR which is increasingly used for the characteri-
zation of structure and dynamics in these materials.25–27 Furthermore, using this method it is easy
3
to determine the presence of small mobile molecules, while X-ray analysis is more complicated or
impossible.28
In this paper, we report on the synthesis and detailed structural elucidation of two Zn MOFs
together with their corresponding protonated ligands by means of X-ray structure analysis, 1H and
13C solid-state NMR and quantum chemical calculations. Detailed assignments of NMR reso-
nances were done, including the changes in individual chemical shifts with respect to the proto-
nated ligands. Full resonance assignments were achieved with Frequency Switched Lee-Goldburg
(FSLG) heteronuclear 1H-13C correlation experiments (HETCOR)29 and 1H-1H homonuclear cor-
relation experiments using the back-to-back (BABA)30 sequence. Our experimental results were
complemented by DFT calculations of NMR parameters, using the GIPAW method31 implemented
in the CASTEP code,32 which has already been proven to be a reliable tool in characterizing the
NMR properties of crystalline solids.33–40
Heteronuclear MOFs with varying percentage of paramagnetic Co2+ were also investigated
with 1H and 13C NMR to study the influence of paramagnetic metal ions on the parent framework.
To get information about the distribution of Co2+ in the MOF network, an analysis of 1H T1
relaxation times was performed.
Experimental
Synthesis
The synthesis of the respective N-donor ligands was previously reported by Lässig et al.16 While
the synthesis and characterization of the coordination polymers 3∞[M(Me-3py-trz-pba)2] (M =
Zn: 1, Zn/Co: Series I) were reported earlier,17 herein we present the structurally related sys-
tem 3∞[Zn(Me2trz-pba)2] (2) with the dimethylated ligand (Me2trz-pba)−. Multigram amounts
of MOFs of the two isomorphous series were obtained by heating the starting materials, i. e.,
Zn(OAc)2·2H2O and the respective protonated ligands H(Me-3py-trz-pba) and H(Me2trz-pba) un-
der reflux in DMF for 48 hours. Afterwards the reaction mixtures were cooled to room temperature,
4
the solid products washed with DMF and ethanol yielding fine microcrystalline powders after dry-
ing in air. The IR, thermogravimetric and PXRD data of 1 und 2 are given in the SI or or can be
found in the respective publication.17
For the preparation of mixed Zn/Co MOFs of type 3∞[Zn1−xCox(Me-3py-trz-pba)2] (Series I),
Zn(OAc)2·2H2O was partially replaced by 5, 10, 20, 25, 30, 40, 50 and 75% of CoCl2·6H2O,
respectively. Similarly, for the preparation of mixed Zn/Co MOFs of type 3∞[Zn1−xCox(Me2trz-
pba)2]·DMF· 1.5·H2O (Series II), Zn(OAc)2·2H2O was partially replaced by 2, 5, 10, 25, 50
and 75% of CoCl2·6H2O, respectively. For both series, also samples with only cobalt as metal
connector were prepared as well.
To determine the actual amounts of zinc and cobalt incorporated into the MOFs, atomic ab-
sorption spectroscopy (AAS) was carried out. For this, the samples were first incinerated and
afterwards diluted in nitric acid. Experiments were performed using a Varian SpectrAA 300 op-
erating at wavelengths of 242.5 nm and 307.6 nm for cobalt and zinc, respectively. Due to the
higher cobalt fraction xCo experimentally determined by AAS compared to the cobalt amount used
in synthesis (cf. Table 1), we conclude that the incorporation of cobalt is favored over zinc.
Notably, the reported synthesis procedure17 for microcrystalline material of 1, proved to be
successful only for the incorporation of small percentages of cobalt as shown in EPR studies.17
Nevertheless, by changing the reported method by the use of DMF instead of ethanol, higher
amounts of Co2+ could be incorporated in yields ranging from 40% to 98%, depending on compo-
sition.
X-Ray Crystallography
The X-ray diffraction (XRD) data were collected on an IPDS-I (STOE) diffractometer using Mo-
Kα radiation (λ = 71.073 pm).41 The structure was solved by direct methods and refined us-
ing SHELX-97.42 The coordinates of the framework non-hydrogen atoms were refined using
anisotropic displacement parameters whereas the disordered water molecules were treated isotropi-
cally. The coordinates of hydrogen atoms of the framework were calculated for idealized positions.
5
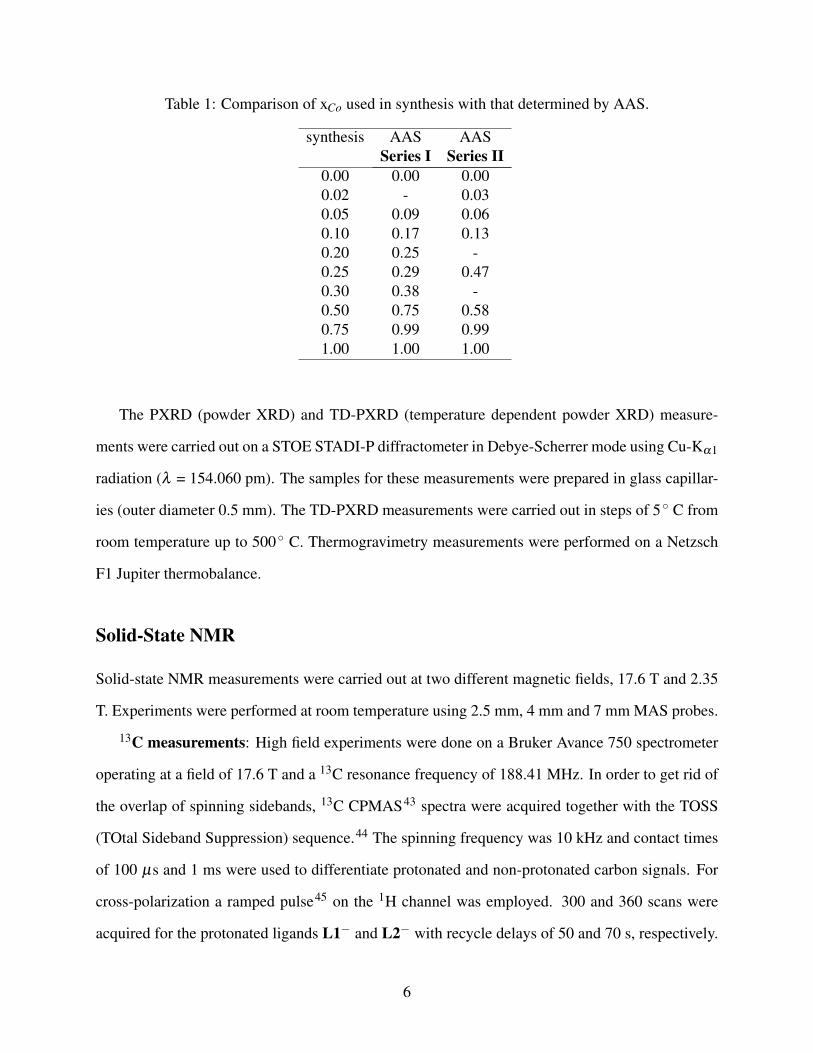
Table 1: Comparison of xCo used in synthesis with that determined by AAS.
synthesis AAS AASSeries I Series II
0.00 0.00 0.000.02 - 0.030.05 0.09 0.060.10 0.17 0.130.20 0.25 -0.25 0.29 0.470.30 0.38 -0.50 0.75 0.580.75 0.99 0.991.00 1.00 1.00
The PXRD (powder XRD) and TD-PXRD (temperature dependent powder XRD) measure-
ments were carried out on a STOE STADI-P diffractometer in Debye-Scherrer mode using Cu-Kα1
radiation (λ = 154.060 pm). The samples for these measurements were prepared in glass capillar-
ies (outer diameter 0.5 mm). The TD-PXRD measurements were carried out in steps of 5◦ C from
room temperature up to 500◦ C. Thermogravimetry measurements were performed on a Netzsch
F1 Jupiter thermobalance.
Solid-State NMR
Solid-state NMR measurements were carried out at two different magnetic fields, 17.6 T and 2.35
T. Experiments were performed at room temperature using 2.5 mm, 4 mm and 7 mm MAS probes.
13C measurements: High field experiments were done on a Bruker Avance 750 spectrometer
operating at a field of 17.6 T and a 13C resonance frequency of 188.41 MHz. In order to get rid of
the overlap of spinning sidebands, 13C CPMAS43 spectra were acquired together with the TOSS
(TOtal Sideband Suppression) sequence.44 The spinning frequency was 10 kHz and contact times
of 100 µs and 1 ms were used to differentiate protonated and non-protonated carbon signals. For
cross-polarization a ramped pulse45 on the 1H channel was employed. 300 and 360 scans were
acquired for the protonated ligands L1− and L2− with recycle delays of 50 and 70 s, respectively.
6
For the MOF samples 1 and 2, 4000 and 1600 scans were collected with recycle delays of 5
s and 10 s, respectively. The decoupling and Hartmann Hahn matching fields were 80 and 65
kHz, respectively. The presence of paramagnetic Co2+ lowers the resolution of carbon spectra
severely. Hence, only spectra for samples containing cobalt in low concentrations (up to 25%) were
recorded. The corresponding spectra were recorded with recycle delays of 4 s or less, collecting
4000 scans.
Spectral editing experiments using non-quaternary suppression (NQS),46 with two dephasing
delays of 37 µs each within an echo sequence spanning two rotor periods helped in assignment.
All measurements were done with high power 1H decoupling using two pulse phase modulation
(TPPM).47
The 2D FSLG-HETCOR29 experiments of the protonated ligand L1− and MOFs 1 and 2 were
done at 10 and 8 kHz MAS and a contact time of 500 µs with 13 µs as the length of one FSLG
block. For L1− and 1, 80 and 128 t1 increments were collected with 256 scans and 5s as recycle
delay. For 2, a recycle delay of 4 s and 400 transients with 128 t1 increments was used. The
States-TPPI48 mode for pure absorption spectra was employed.
Chemical shifts are referenced to TMS using adamantane as a secondary reference with the
downfield signal at 38.56 ppm.
1H measurements: High-field measurements at 17.6 T were done at a frequency of 749.32
MHz. Single pulse excitation experiments were performed at various spinning frequencies of 10,
11, 12, 12.5 and 25 kHz, in particular for high resolution and to distinguish signals from spinning
sidebands. π
2 pulse lengths were about 3.6 µs at 12.5 kHz and 1.4 µs at 25 kHz MAS. For the
paramagnetic samples, since the uniform excitation of the full spectrum is hard to achieve with a
single pulse, a frequency-stepped acquisition was performed. Therefore, for both static and MAS
experiments (10 kHz spinning frequency), Hahn-echo49 spectra with a 90◦ pulse length of 3.2 µs
were measured at two different excitation frequencies of 104 kHz and -104 kHz from the center of
the main resonance and the full spectrum obtained by summing up the individual sub-spectra.
2D 1H-1H BABA30 double quantum experiments were performed using a 2.5 mm probe at a
7
spinning frequency of 30 and 26 kHz for 1 and 2, respectively. 128 points were collected in the
indirect dimension with 16 and 64 scans and recycle delays of 1 s and 3 s for 1 and 2, respectively.
During excitation and reconversion the back-to-back (BABA) scheme was used which recouples
the 1H-1H dipolar coupling. π
2 pulses were 1.6 µs and recoupling over one rotor period was used.
The z-filter delay was 20 µs. For pure-absorption spectra, the TPPI scheme was used.50
Static 1H T1 relaxation measurements were performed at a magnetic field of 2.35 T and a
frequency of 100.13 MHz using a Tecmag Apollo spectrometer. The inversion recovery sequence51
with π
2 pulse lengths of 2.0 µ and 2.75 µs for 1 and 2, respectively, was used. The sequence was
combined with DEPTH52 detection to remove probe background signal. The samples were packed
in a 7 mm MAS rotor used under non-spinning conditions. The lower magnetic field was chosen
for the relaxation measurements since in this case uniform excitation was possible.
All 1H spectra were referenced to TMS using a sample of PDMS as secondary reference (0.07
ppm from TMS).
First-Principles NMR Calculations
Geometry optimizations and chemical shift calculations were carried out within the Density Func-
tional Theory (DFT) framework using the CASTEP (Cambridge Serial Total Energy Package)
software.32 CASTEP uses planewave basis sets to describe the wavefunctions (it thus has an im-
plicit translational symmetry) and is very well adapted to the description of solid crystalline sys-
tems. The GIPAW (Gauge-Including Projector Augmented Waves) method,31 used with ultrasoft
pseudo-potentials,53,54 provides an efficient method for calculating chemical shifts in crystalline
solids.55 The geometry optimization of the X-ray determined structure and the calculation of NMR
parameters were carried out using generalized gradient approximation (GGA) with PBE exchange
correlation functional56 and Vanderbilt-type pseudo-potentials.54 Only the proton positions were
relaxed during the geometry optimization, keeping both the unit cell and all the other atoms fixed
to their X-ray determined positions. For the geometry optimization, a plane-wave cutoff energy
of 800 eV and a Monkhorst-Pack grid of k-points57 spacing of 0.05 Å−1 in reciprocal space were
8
used. The NMR calculations were done on the proton-optimized structure using a higher cutoff en-
ergy of 1000 eV and a k-point sampling of 0.05 Å−1. A higher cutoff energy was used for the NMR
calculations due to the slower convergence of NMR parameters compared to the electronic struc-
ture convergence. In order to compare directly with experimentally measured isotropic chemical
shifts, the calculated chemical shieldings were then converted into calculated chemical shifts, δcalc
using the relation, δcalc = σre f −σcalc. The value of σre f was determined with a linear regression
between calculated and experimental shifts, imposing a slope of unity, where shifts and shielding
were simply sorted by ascending and descending order, respectively. This procedure leads to a 13C
reference value of 169.65 ppm, which was then used to determine the computed chemical shifts.
Results and Discussion
X-ray Diffraction Studies
Whereas the isomorphous Zn (1) and Zn/Co MOFs of Series I crystallize in the non-centro sym-
metric monoclinic space group P c (no. 7) with two formula units per unit cell, the coordination
polymer 2 crystallizes in the non-centrosymmetric orthorhombic space group P ca21 (no. 29) with
four formula units per unit cell. The atomic coordinates of 1 can be found in ref. [17], those of
2 are reported in Supplementary Table S 3. The formula units correspond to the asymmetric units
in the crystal structures and consist of one metal ion, Zn2+ or Co2+, and two ligand anions (Me-
3py-trz-pba)− or (Me2trz-pba)−, respectively. In addition, the asymmetric unit of 2 contains 1.5
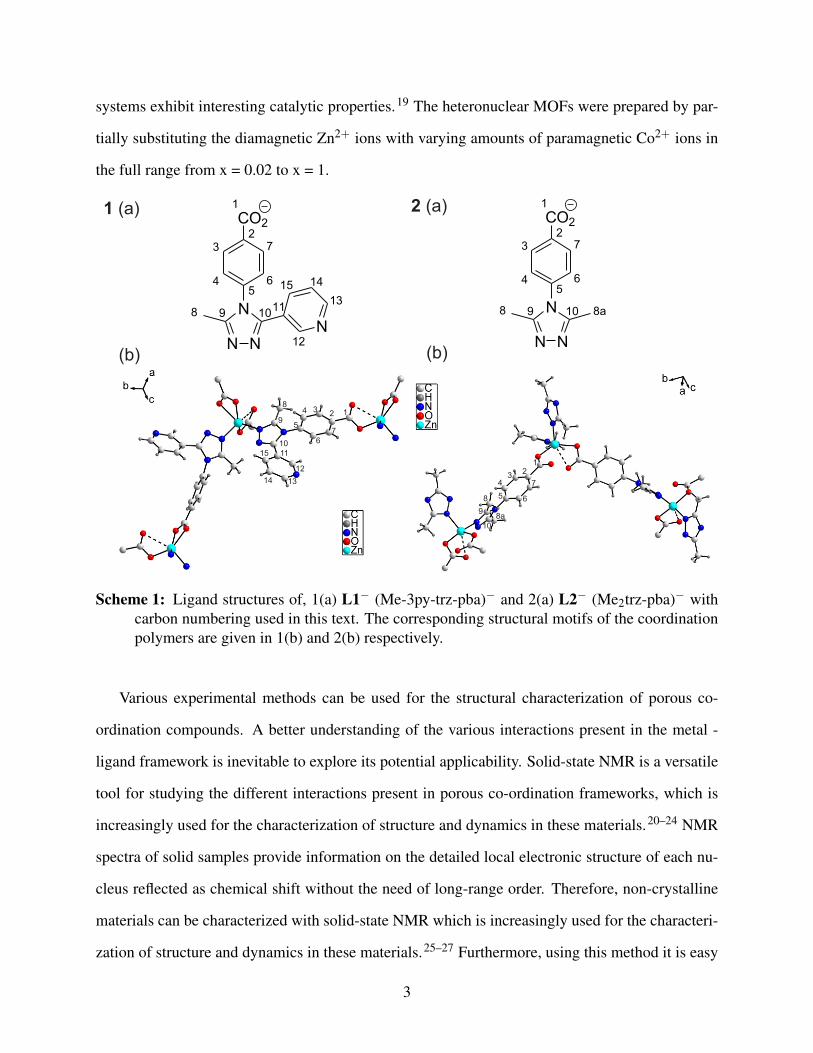
non-coordinated water molecules and one DMF molecule. The Zn2+ ions in 1 and 2 possess co-
ordination spheres in the transition from trigonal bipyramidal to square pyramidal (see Figure 1).
Selected bond lengths and angles of 1 and 2 are given in Supplementary Table S 2. The topol-
ogy of both series is the one of the commonly observed diamondoid network (dia, point symbol
{66}), which was determined using the program TOPOS 4.0.58 The porosity of these compounds
is reduced by fourfold interpenetration (type la).59
The phase purity of the as-synthesized materials was proven by powder X-ray diffraction. The
9
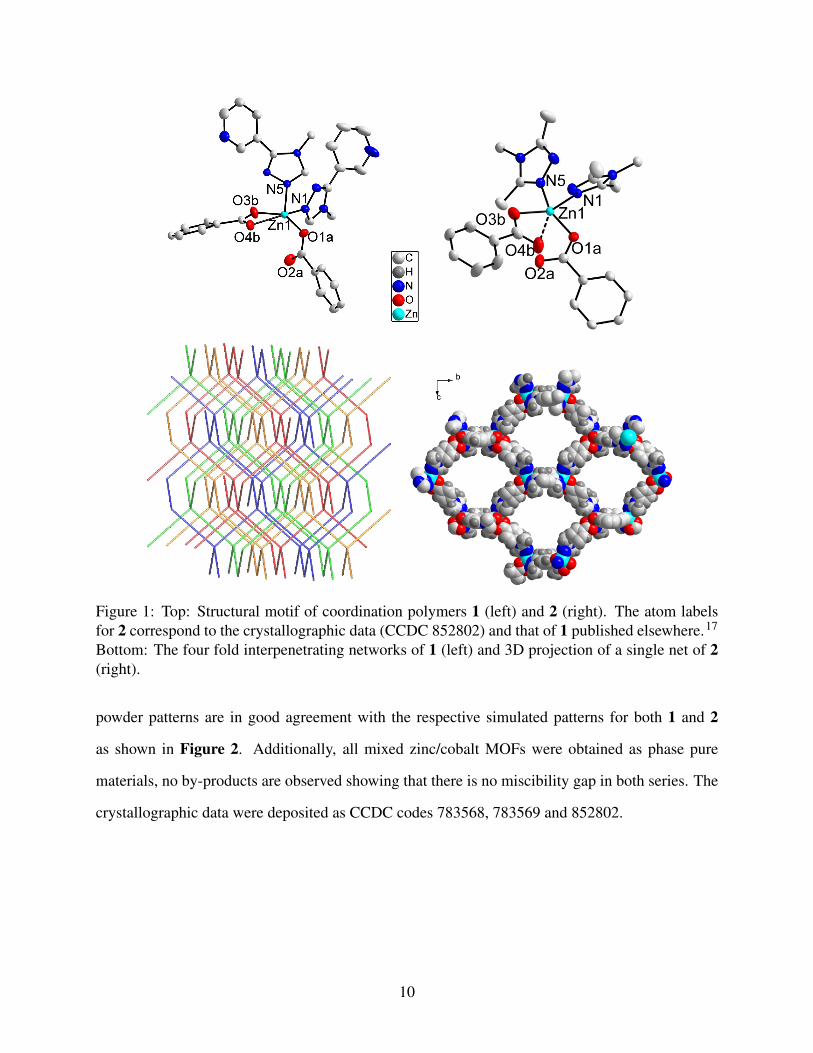
Figure 1: Top: Structural motif of coordination polymers 1 (left) and 2 (right). The atom labelsfor 2 correspond to the crystallographic data (CCDC 852802) and that of 1 published elsewhere.17
Bottom: The four fold interpenetrating networks of 1 (left) and 3D projection of a single net of 2(right).
powder patterns are in good agreement with the respective simulated patterns for both 1 and 2
as shown in Figure 2. Additionally, all mixed zinc/cobalt MOFs were obtained as phase pure
materials, no by-products are observed showing that there is no miscibility gap in both series. The
crystallographic data were deposited as CCDC codes 783568, 783569 and 852802.
10
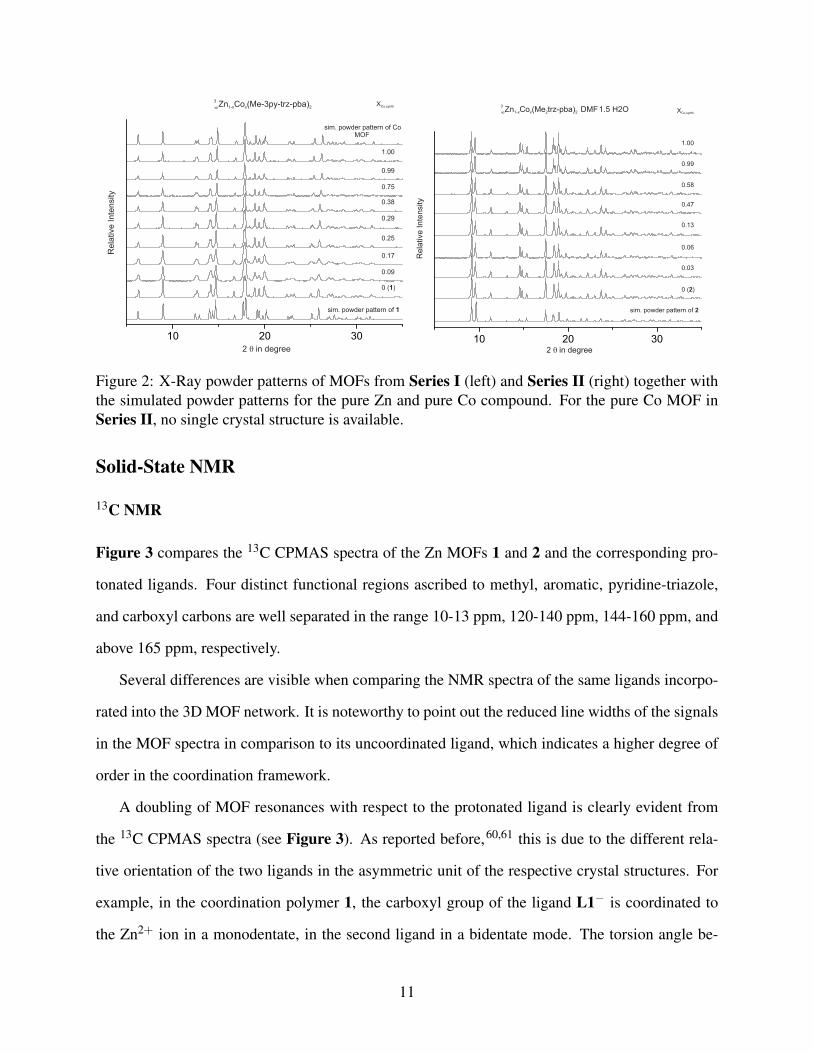
Figure Revised
Re
lative
In
ten
sity
2 q in degree
sim. powder pattern of 1
0 (1)
sim. powder pattern of Co MOF
XCo,synth
0.09
0.17
0.25
0.29
0.38
0.75
0.99
1.00
Zn Co (Me-3py-trz-pba)1-x x 2
3
8
Figure Revised
Rela
tive
Inte
nsi
ty
2 q in degree
XCo,synth
0 (2)
sim. powder pattern of 2
0.03
0.06
0.13
0.47
0.58
0.99
1.00
.Zn Co (Me trz-pba) DMF1.5 H2O1-x x 2 2
.3
8
Figure 2: X-Ray powder patterns of MOFs from Series I (left) and Series II (right) together withthe simulated powder patterns for the pure Zn and pure Co compound. For the pure Co MOF inSeries II, no single crystal structure is available.
Solid-State NMR
13C NMR
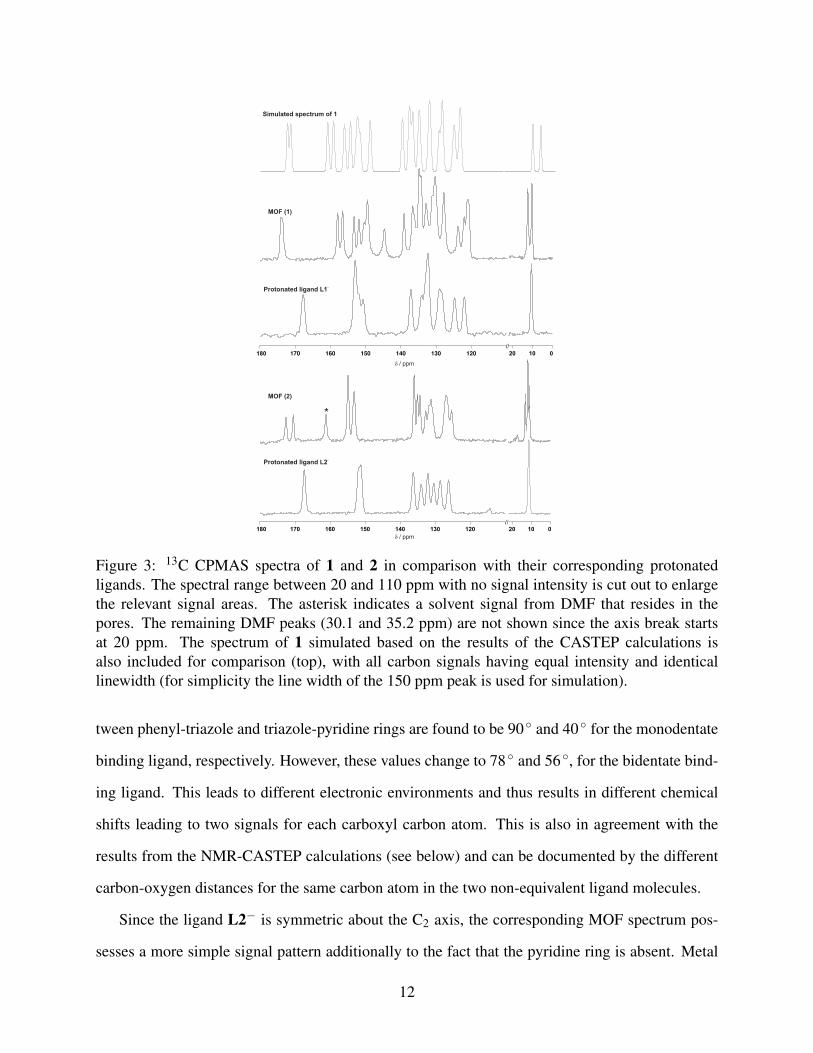
Figure 3 compares the 13C CPMAS spectra of the Zn MOFs 1 and 2 and the corresponding pro-
tonated ligands. Four distinct functional regions ascribed to methyl, aromatic, pyridine-triazole,
and carboxyl carbons are well separated in the range 10-13 ppm, 120-140 ppm, 144-160 ppm, and
above 165 ppm, respectively.
Several differences are visible when comparing the NMR spectra of the same ligands incorpo-
rated into the 3D MOF network. It is noteworthy to point out the reduced line widths of the signals
in the MOF spectra in comparison to its uncoordinated ligand, which indicates a higher degree of
order in the coordination framework.
A doubling of MOF resonances with respect to the protonated ligand is clearly evident from
the 13C CPMAS spectra (see Figure 3). As reported before,60,61 this is due to the different rela-
tive orientation of the two ligands in the asymmetric unit of the respective crystal structures. For
example, in the coordination polymer 1, the carboxyl group of the ligand L1− is coordinated to
the Zn2+ ion in a monodentate, in the second ligand in a bidentate mode. The torsion angle be-
11
Simulated one- replaced by the new on Sep 19th2012
120130140150160170//
MOF (2)
MOF (1)
20 10
d / ppm
20 10
-Protonated ligand L1
//
*
180 0
d / ppm
180 0
Simulated spectrum of 1
-Protonated ligand L2
Figure 3: 13C CPMAS spectra of 1 and 2 in comparison with their corresponding protonatedligands. The spectral range between 20 and 110 ppm with no signal intensity is cut out to enlargethe relevant signal areas. The asterisk indicates a solvent signal from DMF that resides in thepores. The remaining DMF peaks (30.1 and 35.2 ppm) are not shown since the axis break startsat 20 ppm. The spectrum of 1 simulated based on the results of the CASTEP calculations isalso included for comparison (top), with all carbon signals having equal intensity and identicallinewidth (for simplicity the line width of the 150 ppm peak is used for simulation).
tween phenyl-triazole and triazole-pyridine rings are found to be 90◦ and 40◦ for the monodentate
binding ligand, respectively. However, these values change to 78◦ and 56◦, for the bidentate bind-
ing ligand. This leads to different electronic environments and thus results in different chemical
shifts leading to two signals for each carboxyl carbon atom. This is also in agreement with the
results from the NMR-CASTEP calculations (see below) and can be documented by the different
carbon-oxygen distances for the same carbon atom in the two non-equivalent ligand molecules.
Since the ligand L2− is symmetric about the C2 axis, the corresponding MOF spectrum pos-
sesses a more simple signal pattern additionally to the fact that the pyridine ring is absent. Metal
12
binding via one nitrogen of the triazole ring and carboxyl oxygens (both mono- and bidentate)
induces asymmetry leading to a doubling of resonances as for 1. However, smaller chemical shift
differences between same carbon atoms in two non-equivalent ligand molecules are obtained due
to the higher symmetry, and therefore fewer signals than for 1 are resolved.
Some signals are significantly shifted in the spectrum of the MOF samples with respect to
the protonated ligand, mainly due to metal coordination. This effect of metal coordination to the
ligand molecule can be analyzed by calculating the coordination induced shifts,60,62 obtained by
subtracting from the carbon chemical shifts of the MOF those of the corresponding uncoordinated
ligand. These numbers are summarized for the most significant carbon atoms in Table 2.
Table 2: 13C NMR coordination induced shifts, ∆δ for 1 and 2.
Carbon ∆δ 1=δ MOF -δ lig ∆δ 2=δ MOF -δ ligC-1 +5.7, +6.3 +3.2, +5.3C-2 +2.0, -0.3 +0.0, +0.2C-9 +4.9, +3.5 +3.3C-10 +0.2, +1.6 +2.2
The carboxyl carbon (C-1) is found to be most sensitive to metal coordination60,62,63 in both
MOFs. While incorporated into 1, this signal gets shifted downfield by 5.7 ppm and 6.3 ppm
which clearly corroborates the metal binding via the carboxyl group, however, for 2 the effects
are somewhat smaller. The shift difference for C-1 also induces a shift effect on the neighboring
carbon C-2 as well.
A large ∆δ value has also been observed for carbon C-9 of the triazole ring, implying the effect
of metal coordination through its nearby nitrogen atom. However, this value being smaller than
that of C-1 predominantly refers to a relatively larger metal-carbon distance64 (e. g. 263/250 pm
for C-1 vs. 309/313 pm for C-9 for 1). In contrast to C-9, C-10 shows a smaller ∆δ value indicating
a comparatively larger distance to the metal center (411 pm for 1) and documenting binding via the
nitrogen next to C-9. For 2 the shift effects are less pronounced, though also showing the largest
induced shifts for carbons C-1 and C-9.
Other carbons not involved in metal binding typically show small shift differences between
13
protonated ligand and MOF which could be explained by the different π-π stacking interactions in
the uncoordinated ligand and the interpenetrated frameworks.
The full resonance assignments given in the supplementary information were achieved by a
combination of several techniques. Spectral editing (NQS and different contact times, details given
in supplementary information, Figures S 4 to S 7) allowed to distinguish protonated and quaternary
carbons (as well as mobile, rotating groups such as methyl groups). Comparison to literature values
for similar compounds as well as the solution NMR data of structurally similar triazolyl ligands16
helped in refinement.
For 1, NMR-CASTEP calculation results are included in Figure 3 and in (Table S 4), showing
a very good agreement with the experimental spectrum. In accordance with the discussion of the
crystal structure, two siganls are present for every carbon atom of the ligand and results a total
of 30 lines. The deviation between experimental and calculated values might hint at a somewhat
dynamic structure at room temperature.
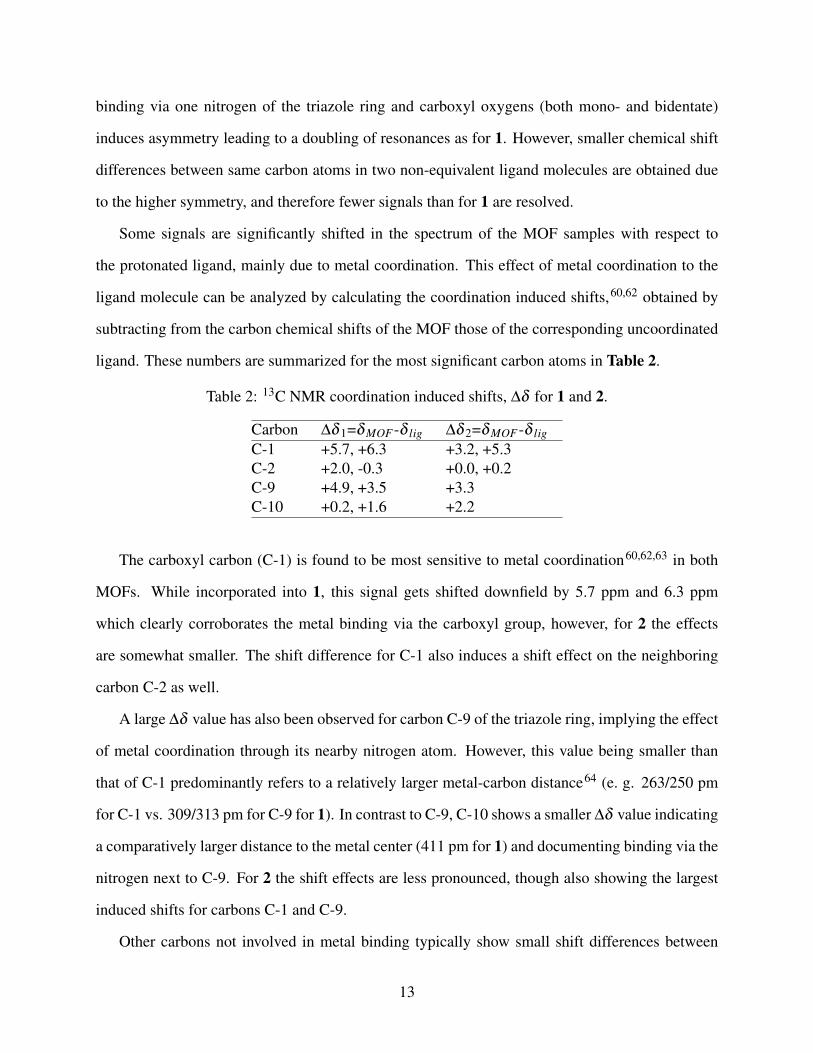
The assignment based on the calculated values are further revealed by FSLG-HETCOR experi-
ments, as shown in Figure 4 for 1 and 2 (for the protonated ligand L1− shown in the supplementary
information, Figure S 8). The spreading of signals in two dimensions as well as the higher res-
olution in the indirect dimension from the homonuclear Lee-Goldburg decoupling enhance the
information content.
Especially for 1, resolution of different 1H chemical shifts and the cross-peaks from the methyl
protons to carbons C-9, C-5, and C-6 strengthen our assignments. For 2, the presence of four
signals (two of them overlapping) for the four methyl groups is clearly visible and the respective
protons of these methyl groups show a different coupling to the C-9 and C-10 carbon atoms. This
means that the orientation in the crystal structure makes all methyl groups non-equivalent. A
solvent signal at 162.2 ppm is identified by having unique coupling to a proton with no other cross
peaks. For ligand L1−, the resonance at 153.1 ppm could be clearly assigned to C-9 due to the
cross-peak with the methyl protons (see supplementary information Figure S 8).
14
125130135140
10
8
6
4
2
175 170 165 160 155 150 145
10
8
6
4
2
13C
1H
*
*
*
*
13C
1H
125130135140145155165175 170 160 150
solvent
#
#
Figure 4: 2D 1H-13C FSLG HETCOR spectra of 1 (top) and 2 (bottom). Individual 1H projectionsfor the different 13C regions are shown. The asterisks indicate spinning sidebands. Coherencesmarked with a # indicate the resolution of carbon signals in the 2D plot that are not resolved in the13C CPMAS spectrum, as can be seen by the non-spherical shape of the coherences.
1H NMR
The metal coordination by the oxygen atoms of the carboxylic group is clearly documented from
the 1H MAS spectra (shown in the supplementary information, Figure S 9) by the disappearance of
the carboxylic acid proton at chemical shifts of 15.0 ppm and 16.5 ppm for 1 and 2, respectively.
For 2, two regions of signals around 7.5 ppm for aromatic and 2.0 ppm for methyl protons are
visible. For 1, however, the methyl signal is more narrow than in the corresponding protonated
ligand and shifted 1 ppm downfield. Furthermore, aromatic signals span a range from 5 ppm up to
9 ppm. This larger range compared to that of 2 is due to the additional pyridine ring in the ligand.
In order to get more information from the 1H spectra, we combine the information from the
15
MAS spectrum with the results from the NMR-CASTEP calculations (for 1, experimental and
calculated values are given in the supplementary information, Table S 5) and the 1H projection
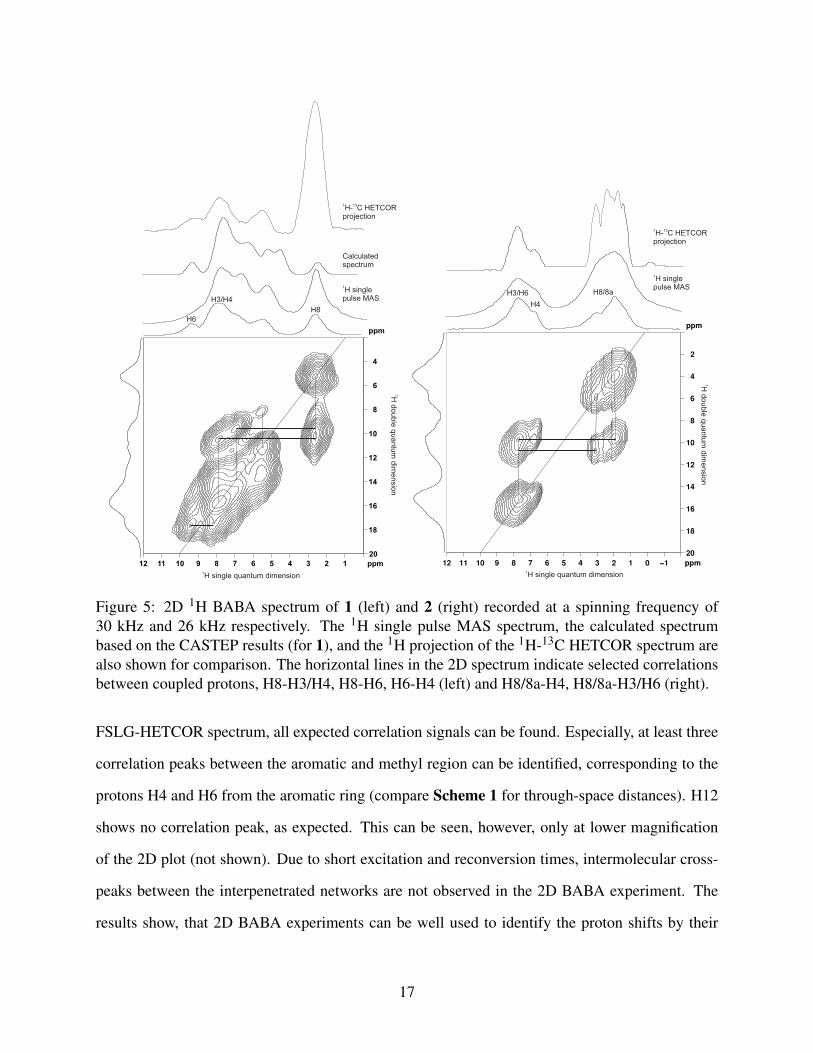
from the FSLG-HETCOR spectrum with higher resolution (see above). Furthermore, the 2D 1H-
1H double quantum BABA spectrum gives further insight from 1H-1H correlations as shown in
Figure 5 for 1 and 2 together with the MAS spectrum, the calculated spectrum, and the FSLG-
HETCOR projection. In the HETCOR projection, the resolution is higher due to the homonuclear
decoupling. In the 2D BABA spectrum, diagonal peaks indicate the proximity of two protons with
same chemical shifts. Off-diagonal peaks then identify proximity of two protons with different
chemical shifts, the corresponding shift in the double-quantum dimension being the sum of the
chemical shifts of the two involved protons.
As seen in Figure 5, there is a very good agreement between experimental and calculated
chemical shifts. Differences are seen predominantly only for the signals at 4.2 and 4.4 ppm in the
calculated spectrum. Intensity differences between the different 1H spectra arise from the different
excitation efficiencies in the BABA and HETCOR spectra.
The assignments were made by combining the CASTEP results with the observed cross-peaks
in the FSLG-HETCOR spectrum. The protons of the aromatic ring have rather typical chemical
shifts with the exception of one of the H6 protons at 9.3 ppm which agrees well with the calculated
value. The protons of the pyridine ring, H13 and H14, are found at rather low chemical shifts,
4.9 and 5.2 ppm, respectively. These values presumably result from the shielding of these protons
which are positioned above (below) the face of aromatic rings.65
The 2D BABA spectra show close through-space proximity of protons. Most clearly, this can
be seen for 2. Due to the small shift range of both aromatic and methyl signals, no resolution
of coupling within the aromatic or the methyl region is possible. However, off-diagonal peaks
between aromatic and methyl signals are visible. These arise between the methyl protons and
the protons at the C-4 and C-6 carbons. For compound 1, several correlation peaks are resolved
because of the larger shift range within the aromatic range between 9.3 ppm for H6 and 4.9 ppm for
H13 (see above). Based on the assignment of proton signals from the CASTEP calculations and the
16
1H single pulse MAS
1H d
ouble
quantu
m d
ime
nsio
n
1H single quantum dimension
ppm
12 11 10 9 8 7 6 5 4 3 2 1 ppm
4
6
8
10
12
14
16
18
20
1H- HETCOR
projection
13C
Calculated spectrum
H8
H3/H4
H6
1H d
ou
ble
qua
ntu
m d
imensio
n
1H single quantum dimension
1H single pulse MAS
1H- HETCOR projection
13C
H8/8a
H4
H3/H6
Figure 5: 2D 1H BABA spectrum of 1 (left) and 2 (right) recorded at a spinning frequency of30 kHz and 26 kHz respectively. The 1H single pulse MAS spectrum, the calculated spectrumbased on the CASTEP results (for 1), and the 1H projection of the 1H-13C HETCOR spectrum arealso shown for comparison. The horizontal lines in the 2D spectrum indicate selected correlationsbetween coupled protons, H8-H3/H4, H8-H6, H6-H4 (left) and H8/8a-H4, H8/8a-H3/H6 (right).
FSLG-HETCOR spectrum, all expected correlation signals can be found. Especially, at least three
correlation peaks between the aromatic and methyl region can be identified, corresponding to the
protons H4 and H6 from the aromatic ring (compare Scheme 1 for through-space distances). H12
shows no correlation peak, as expected. This can be seen, however, only at lower magnification
of the 2D plot (not shown). Due to short excitation and reconversion times, intermolecular cross-
peaks between the interpenetrated networks are not observed in the 2D BABA experiment. The
results show, that 2D BABA experiments can be well used to identify the proton shifts by their
17
coupling scheme.
Heteronuclear MOFs
The presence of traces of paramagnetic impurities in the sample has various effects on NMR spec-
tra such as unusual chemical shifts, dramatic line broadening and shortening of relaxation times.
The hyperfine interaction66 is responsible for the unusual chemical or paramagnetic shifts, the size
of which is often hard to predict and can lead to shifts of up to 1000 ppm for 13C.
Since magic angle spinning removes only the isotropic part of the magnetic susceptibility, con-
tributions from the anisotropic bulk magnetic susceptibility and short T2 also lead to the broadening
of resonances. The demagnetizing fields created, e. g., at grain boundaries, influence neighbouring
spins and hence these orientation-dependent local fields cause a dispersion of chemical shifts and
result in broadening of NMR resonances. This phenomenon has been investigated in the pioneering
works by Lippmaa and VanderHart.67,68 Additionally, the presence of large magnetic susceptibil-
ities in the sample even produces a large manifold of spinning sidebands in MAS spectra,69,70
which can be analyzed in a similar way as chemical shift anisotropy.
The combined effects of hyperfine interaction and anisotropic magnetic susceptibility limit
good spectral resolution in our samples, both for 1H and 13C spectra (see discussion below). Nev-
ertheless, NMR relaxation measurements can be used to analyze the dynamics and distribution
of paramagnetic centers in the matrix of diamagnetic ions.71,72 It is noteworthy to point out the
improvements in the detection and resolution of 1H and 13C signals in paramagnetic systems using
fast magic-angle spinning by Ishii and et. al.73–75
Effect of Paramagnetic Co2+ on the 13C and 1H NMR Spectra
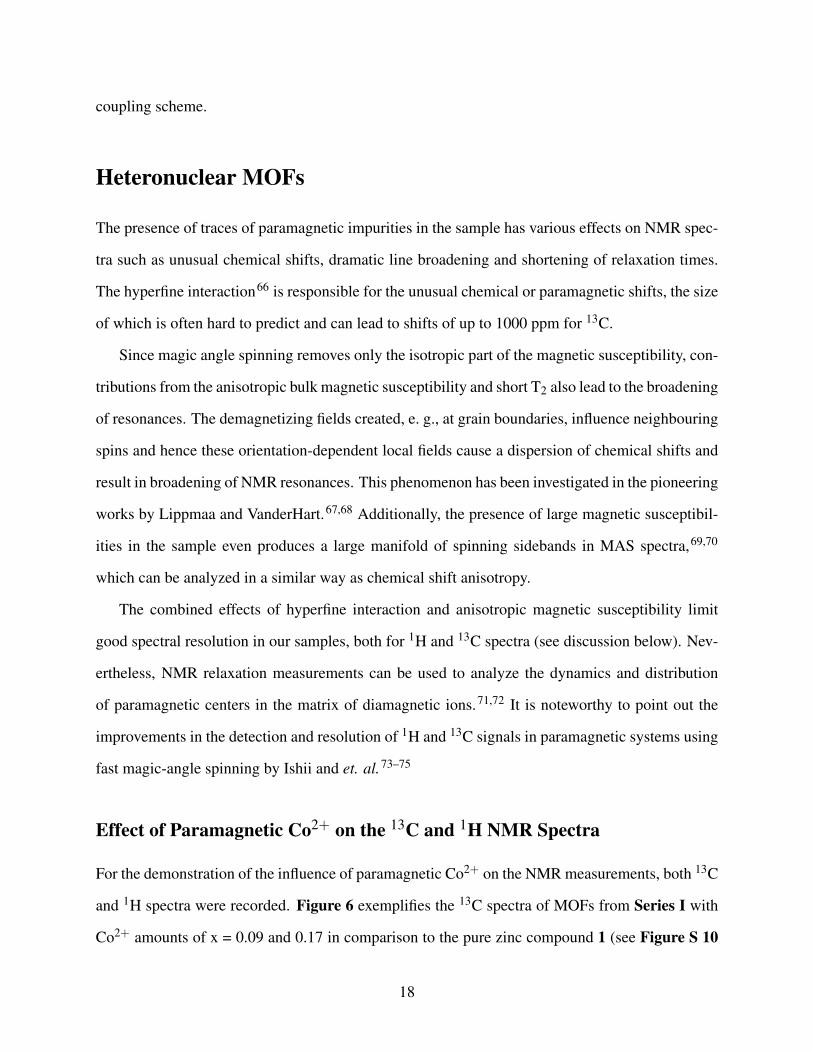
For the demonstration of the influence of paramagnetic Co2+ on the NMR measurements, both 13C
and 1H spectra were recorded. Figure 6 exemplifies the 13C spectra of MOFs from Series I with
Co2+ amounts of x = 0.09 and 0.17 in comparison to the pure zinc compound 1 (see Figure S 10
18
120130140150160170
//
20 10
d / ppm
x = 0.00Co
x = 0.09Co
x = 0.17Co
Figure 6: 13C CPMAS spectra for selected samples of Series I, showing the influence of paramag-netic cobalt.
for Series II).
In contrast to the diamagnetic MOF 1, the corresponding paramagnetic analogues have a rather
low resolution due to broadening by the paramagnetic cobalt ions, with the isotropic shifts being
unchanged. Different efficient decoupling sequences76,77 were applied to improve resolution, but
they showed no improvement. Also higher spinning frequencies (>25 kHz) with or without decou-
pling did show no improvement as for instance observed for copper containing samples.73 In our
cobalt-containing samples the couplings are probably much stronger due to the higher number of
unpaired electrons. Contrary to reports on NMR of paramagnetic systems,78 here by no means any
additional carbon shifts were detected, but only severe line broadening is observed. Our current
explanation is that we cannot detect those 13C spins in direct vicinity of Co2+ which might have
either shifted to some totally unpredictable range or more probably are severely broadened to be
indistinguishable from the baseline.79 The line broadening of the remaining 13C spins next to Zn2+
then indicates reduction in T2 or T∗2 due to the presence of nearby cobalt ions, thus indicating the
formation of a heteronuclear Co/Zn MOF.
Figure 7 illustrates the line broadening effects for various regions of carbon signals with in-
19
0 5 10 15 20 25
0
1000
2000
3000
4000
5000
6000
Linebro
adening(H
z)
xCo0.00 0.05 0.10 0.15 0.20 0.25 0.30
0
1000
2000
3000
4000
5000
6000
xCo
LineBro
adening(H
z)
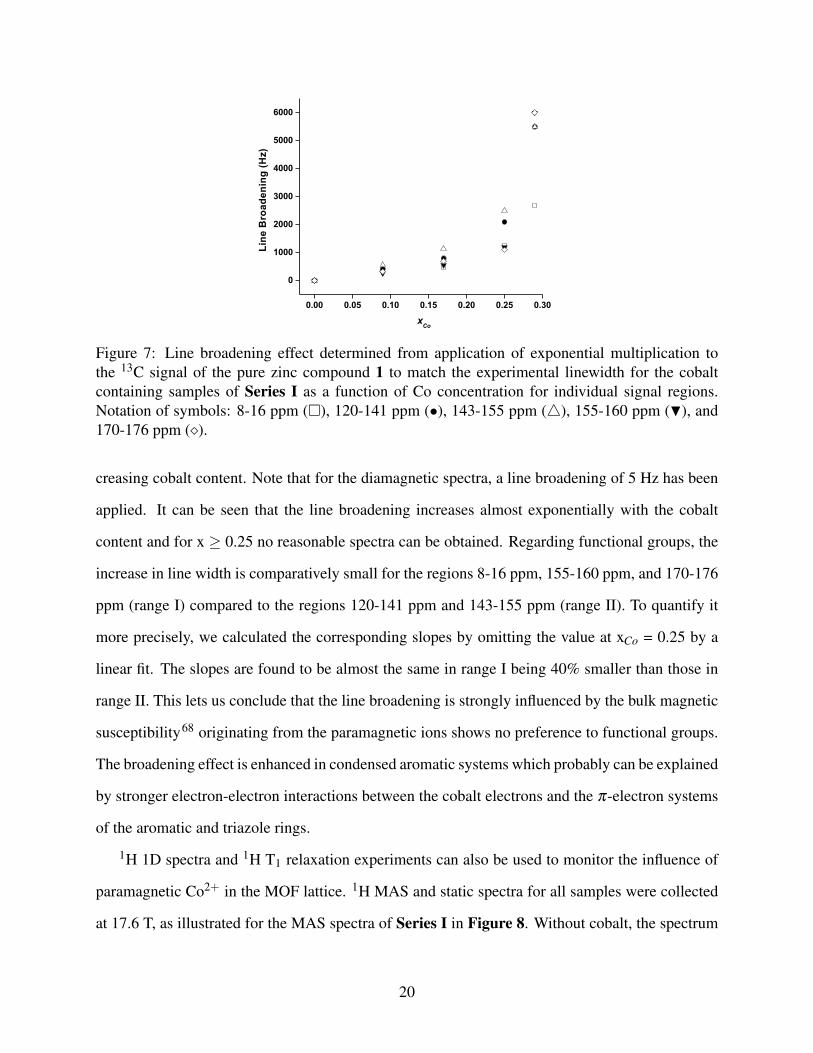
Figure 7: Line broadening effect determined from application of exponential multiplication tothe 13C signal of the pure zinc compound 1 to match the experimental linewidth for the cobaltcontaining samples of Series I as a function of Co concentration for individual signal regions.Notation of symbols: 8-16 ppm (�), 120-141 ppm (•), 143-155 ppm (4), 155-160 ppm (H), and170-176 ppm (�).
creasing cobalt content. Note that for the diamagnetic spectra, a line broadening of 5 Hz has been
applied. It can be seen that the line broadening increases almost exponentially with the cobalt
content and for x ≥ 0.25 no reasonable spectra can be obtained. Regarding functional groups, the
increase in line width is comparatively small for the regions 8-16 ppm, 155-160 ppm, and 170-176
ppm (range I) compared to the regions 120-141 ppm and 143-155 ppm (range II). To quantify it
more precisely, we calculated the corresponding slopes by omitting the value at xCo = 0.25 by a
linear fit. The slopes are found to be almost the same in range I being 40% smaller than those in
range II. This lets us conclude that the line broadening is strongly influenced by the bulk magnetic
susceptibility68 originating from the paramagnetic ions shows no preference to functional groups.
The broadening effect is enhanced in condensed aromatic systems which probably can be explained
by stronger electron-electron interactions between the cobalt electrons and the π-electron systems
of the aromatic and triazole rings.
1H 1D spectra and 1H T1 relaxation experiments can also be used to monitor the influence of
paramagnetic Co2+ in the MOF lattice. 1H MAS and static spectra for all samples were collected
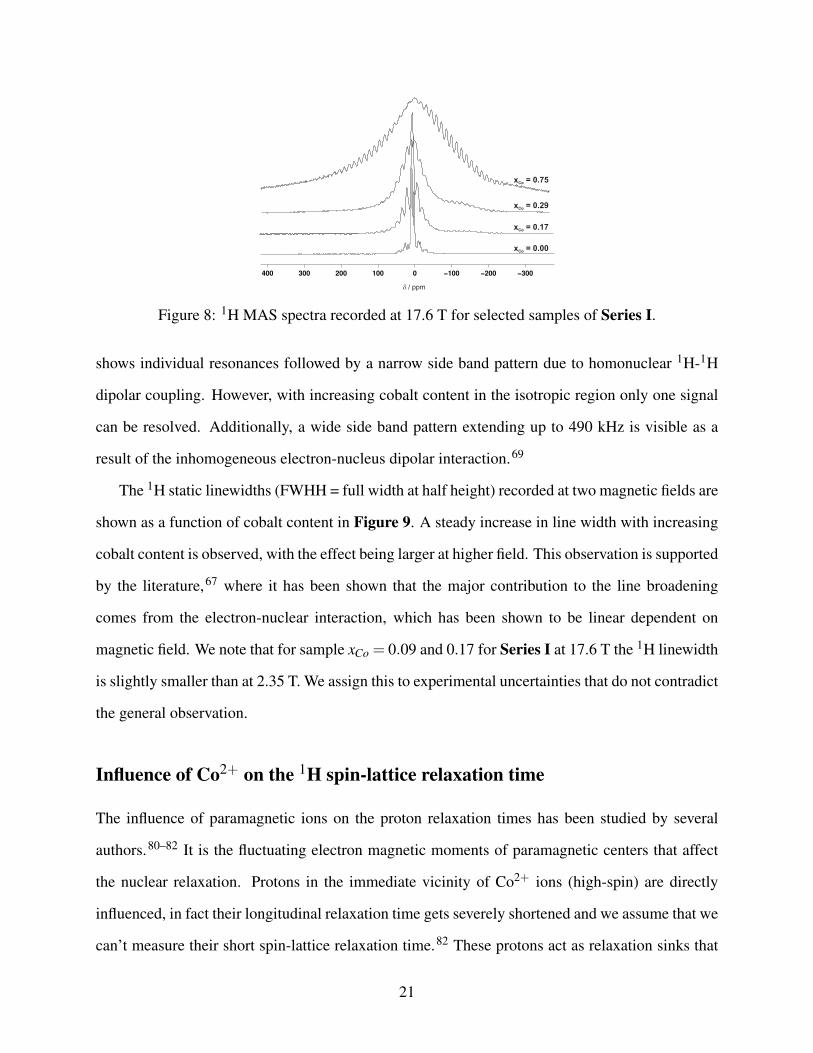
at 17.6 T, as illustrated for the MAS spectra of Series I in Figure 8. Without cobalt, the spectrum
20
d / ppm
x = 0.00Co
x = 0.17Co
x = 0.29Co
x = 0.75Co
Figure 8: 1H MAS spectra recorded at 17.6 T for selected samples of Series I.
shows individual resonances followed by a narrow side band pattern due to homonuclear 1H-1H
dipolar coupling. However, with increasing cobalt content in the isotropic region only one signal
can be resolved. Additionally, a wide side band pattern extending up to 490 kHz is visible as a
result of the inhomogeneous electron-nucleus dipolar interaction.69
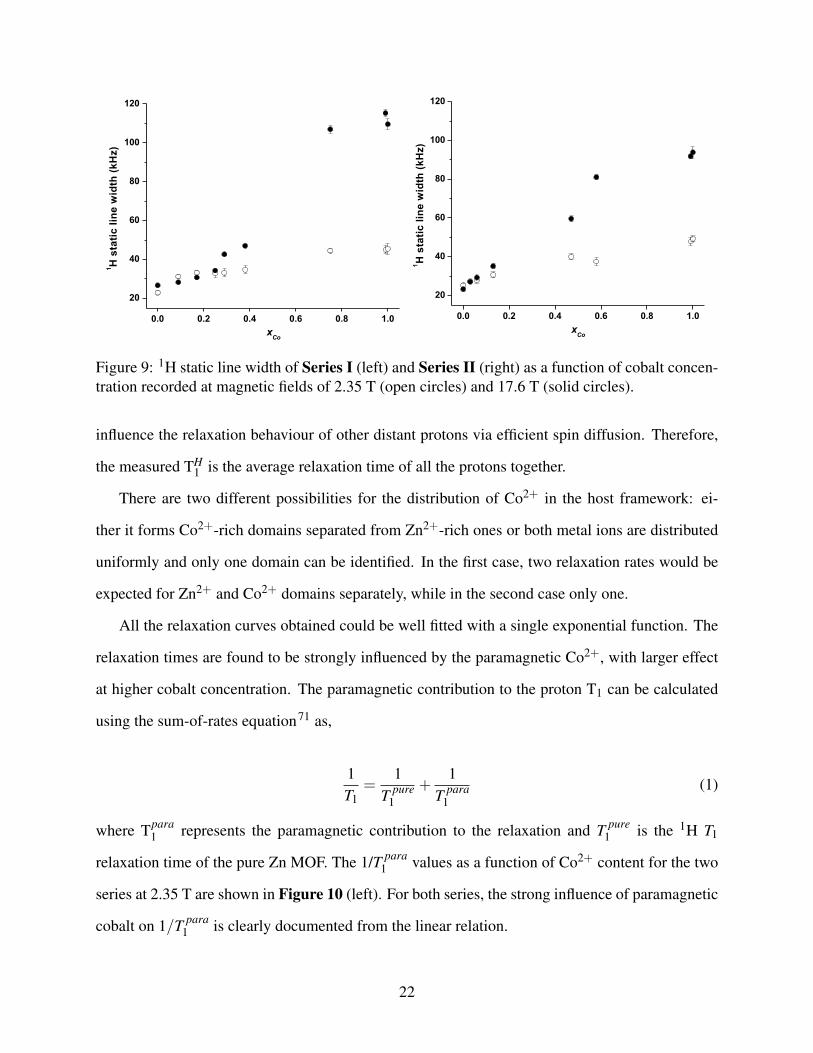
The 1H static linewidths (FWHH = full width at half height) recorded at two magnetic fields are
shown as a function of cobalt content in Figure 9. A steady increase in line width with increasing
cobalt content is observed, with the effect being larger at higher field. This observation is supported
by the literature,67 where it has been shown that the major contribution to the line broadening
comes from the electron-nuclear interaction, which has been shown to be linear dependent on
magnetic field. We note that for sample xCo = 0.09 and 0.17 for Series I at 17.6 T the 1H linewidth
is slightly smaller than at 2.35 T. We assign this to experimental uncertainties that do not contradict
the general observation.
Influence of Co2+ on the 1H spin-lattice relaxation time
The influence of paramagnetic ions on the proton relaxation times has been studied by several
authors.80–82 It is the fluctuating electron magnetic moments of paramagnetic centers that affect
the nuclear relaxation. Protons in the immediate vicinity of Co2+ ions (high-spin) are directly
influenced, in fact their longitudinal relaxation time gets severely shortened and we assume that we
can’t measure their short spin-lattice relaxation time.82 These protons act as relaxation sinks that
21
0.0 0.2 0.4 0.6 0.8 1.0
20
40
60
80
100
120
xCo
1H
staticlinewidth
(kHz)
0.0 0.2 0.4 0.6 0.8 1.0
20
40
60
80
100
120
xCo
1H
staticlinewidth
(kHz)
Figure 9: 1H static line width of Series I (left) and Series II (right) as a function of cobalt concen-tration recorded at magnetic fields of 2.35 T (open circles) and 17.6 T (solid circles).
influence the relaxation behaviour of other distant protons via efficient spin diffusion. Therefore,
the measured TH1 is the average relaxation time of all the protons together.
There are two different possibilities for the distribution of Co2+ in the host framework: ei-
ther it forms Co2+-rich domains separated from Zn2+-rich ones or both metal ions are distributed
uniformly and only one domain can be identified. In the first case, two relaxation rates would be
expected for Zn2+ and Co2+ domains separately, while in the second case only one.
All the relaxation curves obtained could be well fitted with a single exponential function. The
relaxation times are found to be strongly influenced by the paramagnetic Co2+, with larger effect
at higher cobalt concentration. The paramagnetic contribution to the proton T1 can be calculated
using the sum-of-rates equation71 as,
1T1
=1
T pure1
+1
T para1
(1)
where Tpara1 represents the paramagnetic contribution to the relaxation and T pure
1 is the 1H T1
relaxation time of the pure Zn MOF. The 1/T para1 values as a function of Co2+ content for the two
series at 2.35 T are shown in Figure 10 (left). For both series, the strong influence of paramagnetic
cobalt on 1/T para1 is clearly documented from the linear relation.
22
0.0 0.2 0.4 0.6 0.8 1.0
0
50
100
150
200
250
300
xCo
(T1para
H)-1
x ( s e r i e s I I ) C o
x ( s e r i e s I )C o
0.4 0.1 0.05 00.3 0.15>=0.5
0.05 00.10.15>=0.5
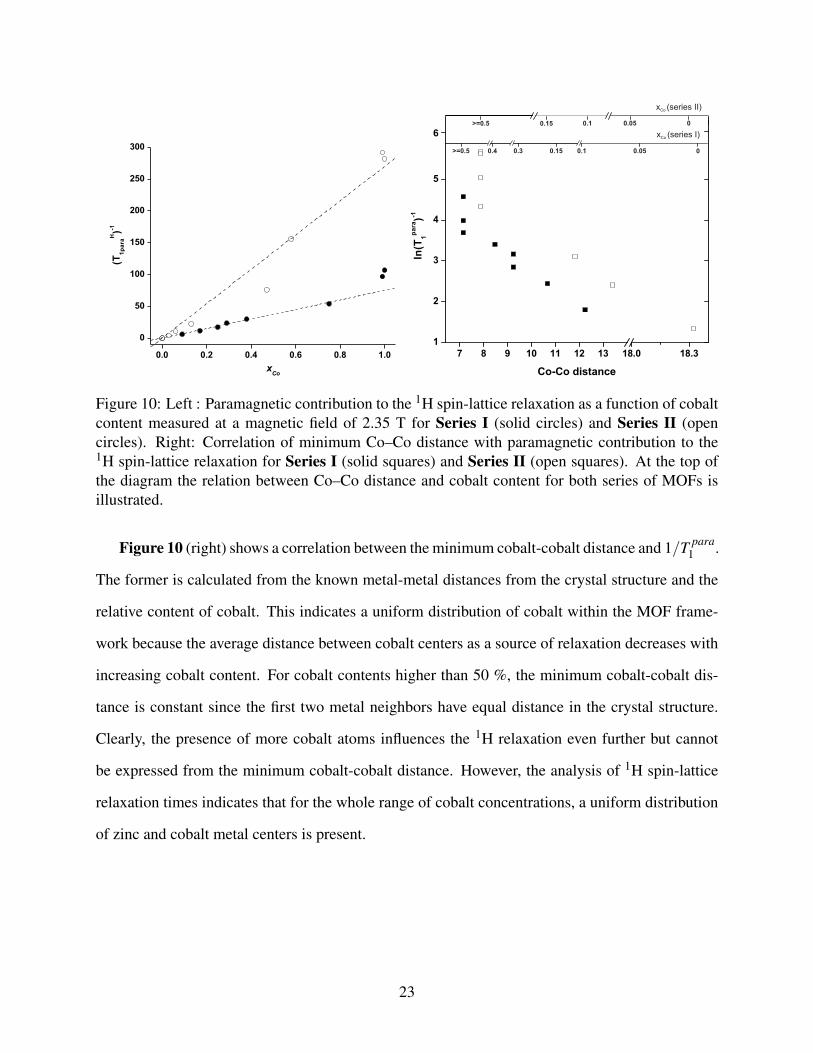
Figure 10: Left : Paramagnetic contribution to the 1H spin-lattice relaxation as a function of cobaltcontent measured at a magnetic field of 2.35 T for Series I (solid circles) and Series II (opencircles). Right: Correlation of minimum Co–Co distance with paramagnetic contribution to the1H spin-lattice relaxation for Series I (solid squares) and Series II (open squares). At the top ofthe diagram the relation between Co–Co distance and cobalt content for both series of MOFs isillustrated.
Figure 10 (right) shows a correlation between the minimum cobalt-cobalt distance and 1/T para1 .
The former is calculated from the known metal-metal distances from the crystal structure and the
relative content of cobalt. This indicates a uniform distribution of cobalt within the MOF frame-
work because the average distance between cobalt centers as a source of relaxation decreases with
increasing cobalt content. For cobalt contents higher than 50 %, the minimum cobalt-cobalt dis-
tance is constant since the first two metal neighbors have equal distance in the crystal structure.
Clearly, the presence of more cobalt atoms influences the 1H relaxation even further but cannot
be expressed from the minimum cobalt-cobalt distance. However, the analysis of 1H spin-lattice
relaxation times indicates that for the whole range of cobalt concentrations, a uniform distribution
of zinc and cobalt metal centers is present.
23
Conclusions
The crystal structures of two series of isomorphous MOFs have been determined. 1H and 13C
chemical shifts of both series of Zn MOFs are reported and compared to their corresponding pro-
tonated ligands. The effect of metal coordination is monitored by changes in the chemical shifts
of those carbon atoms participating in the metal coordination which is as large as 6.3 ppm. 13C
assignments were achieved by combining the different methods spectral editing, heteronuclear cor-
relation spectra as well as CASTEP calculations for 1. The two ligand molecules in the asymmetric
unit give rise to one signal set each that is clearly documented in the 13C spectra.
The assignments of 1H chemical shifts was done based on the 1H projections from the FSLG-
HETCOR experiments and CASTEP calculations for 1. These were verified by the 2D double
quantum BABA spectra that identify close couplings between different protons. Rather high (9.3
ppm) and low (5.0 ppm) shifts for aromatic protons are observed that agree with the calculations
and can be explained, e. g., by ring current effects of the interpenetrating networks.
In two series of heteronuclear MOFs, the incorporation of paramagnetic Co2+ into the MOF
structure being able to replace the Zn2+ ion in the full range of concentrations is documented
by an increased line width in the 1H and 13C NMR spectra. Furthermore, a correlation of the
paramagnetic contribution to the 1H spin-lattice relaxation time with the minimum Co–Co distance
was obtained which corroborates a uniform distribution of Co2+ and Zn2+ in the MOF structure.
With this contribution, we have documented that combination of different solid-state NMR
techniques show excellent agreement with predictions of chemical shifts based on X-ray structures
and DFT calculations). Though this probably has to be verified on other MOF materials, we expect
that in the future solid-state NMR can be used as a standard technique for the characterization
of MOFs, especially for those with low crystallinity or even those lacking crystallinity. These
materials might still show excellent properties for different applications. We will orient our efforts
in this direction.
24
Acknowledgement
We thank the DFG (German Research Foundation) and the Experimental Physics Institute of
Leipzig University for support with the Avance 750 MHz NMR spectrometer. A. V. K. thanks
the graduate school BuildMoNa for a doctoral stipend. DL acknowledges the fellowship of the
Fonds der Chemischen Industrie and JL acknowledges the ESF fellowship.
Supporting Information Available
CCDC 852802 contains the supplementary crystallographic data for this paper. These data can be
obtained free of charge from The Cambridge Crystallographic Data Centre via www.ccdc.cam.ac.uk/
data_request/cif.
IR, thermogravimetric, temperature dependent PXRD data and atomic coordinates of 2 are
given in the supplementary information. It also contains , various CP spectra using spectral editing
techniques, tables for 13C and 1H assignments, additional 1H 1D, 13C CPMAS, 2D HETCOR and
BABA spectra. This material is available free of charge via the Internet at http://pubs.acs.
org/.
References
(1) James, S. L. Chem. Soc. Rev. 2003, 32, 276–288.
(2) Kitagawa, S.; Kitaura, R.; Noro, S.-i. Angew. Chem. Int. Ed. 2004, 43, 2334–2375.
(3) Janiak, C.; Vieth, J. K. New J. Chem. 2010, 34, 2366–2388.
(4) Janiak, C. Dalton Trans. 2003, 2781–2804.
(5) Li, H.; Eddaoudi, M.; O’Keeffe, M.; Yaghi, O. M. Nature 1999, 402, 276–279.
(6) Rosi, N. L.; Eckert, J.; Eddaoudi, M.; Vodak, D. T.; Kim, J.; O’Keeffe, M.; Yaghi, O. M.
Science 2003, 300, 1127–1129.
25
(7) Lee, J.; Farha, O. K.; Roberts, J.; Scheidt, K. A.; Nguyen, S. T.; Hupp, J. T. Chem. Soc. Rev.
2009, 38, 1450–1459.
(8) Achmann, S.; Hagen, G.; Kita, J.; Malkowsky, I.; Kiener, C.; Moos, R. Sensors 2009, 9,
1574–1589.
(9) Lee, J. Y. Y.; Olson, D. H.; Pan, L.; Emge, T. J.; Li, J. Adv. Funct. Mater. 2007, 17, 1255–
1262.
(10) Jeremias, F.; Khutia, A.; Henninger, S. K.; Janiak, C. J. Mater. Chem. 2012, 22, 10148–
10151.
(11) Henninger, S. K.; Jeremias, F.; Kummer, H.; Janiak, C. Eur. J. Inorg. Chem. 2012, 2012,
2625–2634.
(12) Ehrenmann, J.; Henninger, S. K.; Janiak, C. Eur. J. Inorg. Chem. 2011, 2011, 471–474.
(13) Henninger, S. K.; Habib, H. A.; Janiak, C. J. Am. Chem. Soc. 2009, 131, 2776–2777.
(14) Jaap G, H. Coord. Chem. Rev. 2000, 200-202, 131–185.
(15) Zou, R.-Q.; Cai, L.-Z.; Guo, G.-C. J. Molec. Struct. 2005, 737, 125–129.
(16) Lässig, D.; Lincke, J.; Krautscheid, H. Tetrahedr. Lett. 2010, 51, 653–656.
(17) Lässig, D.; Lincke, J.; Griebel, J.; Kirmse, R.; Krautscheid, H. Inorg. Chem. 2010, 50, 213–
219.
(18) Lincke, J.; Lässig, D.; Moellmer, J.; Reichenbach, C.; Puls, A.; Moeller, A.; Gläser, R.;
Kalies, G.; Staudt, R.; Krautscheid, H. Microp. Mesopor. Mater. 2011, 142, 62–69.
(19) Tonigold, M.; Lu, Y.; Bredenkötter, B.; Rieger, B.; Bahnmüller, S.; Hitzbleck, J.; Lang-
stein, G.; Volkmer, D. Angew. Chem. Int. Ed. 2009, 48, 7546–7550.
(20) Paluch, P.; Potrzebowski, M. J. Solid State Nucl. Magn. Reson. 2009, 36, 103–109.
26
(21) Jiang, Y.; Huang, J.; Kasumaj, B.; Jeschke, G.; Hunger, M.; Mallat, T.; Baiker, A. J. Am.
Chem. Soc. 2009, 131, 2058–2059.
(22) Habib, H. A.; Hoffmann, A.; Hoppe, H. A.; Janiak, C. Dalton Trans. 2009, 1742–1751.
(23) Gul-E-Noor, F.; Jee, B.; Pöppl, A.; Hartmann, M.; Himsl, D.; Bertmer, M. Phys. Chem.
Chem. Phys. 2011, 13, 7783–7788.
(24) Habib, H. A.; Hoffmann, A.; Höppe, H. A.; Steinfeld, G.; Janiak, C. Inorg. Chem. 2009, 48,
2166–2180.
(25) Shustova, N. B.; Ong, T.-C.; Cozzolino, A. F.; Michaelis, V. K.; Griffin, R. G.; Dinca, M. J.
Am. Chem. Soc. 2012, 134, 15061–15070.
(26) Vukotic, V. N.; Harris, K. J.; Zhu, K.; Schurko, R. W.; Loeb, S. J. Nat Chem 2012, 4, 456–460.
(27) Kong, X.; Scott, E.; Ding, W.; Mason, J. A.; Long, J. R.; Reimer, J. A. J. Am. Chem. Soc.
2012, 134, 14341–14344.
(28) Lincke, J.; Lässig, D.; Stein, K.; Moellmer, J.; Viswanath Kuttatheyil, A.; Reichenbach, C.;
Moeller, A.; Staudt, R.; Kalies, G.; Bertmer, M.; Krautscheid, H. Dalton Trans. 2012, 41,
817–824.
(29) van Rossum, B. J.; Förster, H.; de Groot, H. J. M. J. Magn. Reson. 1997, 124, 516–519.
(30) Feike, M.; Demco, D. E.; Graf, R.; Gottwald, J.; Hafner, S.; Spiess, H. W. J. Magn. Reson. A
1996, 122, 214–221.
(31) Pickard, C. J.; Mauri, F. Phys. Rev. B 2001, 63, 245101.
(32) Clark, S. J.; Segall, M. D.; Pickard, C. J.; Hasnip, P. J.; Probert, M. I. J.; Refson, K.;
Payne, M. C. Z. Krist. 2005, 220, 567–570.
(33) Harris, R. K.; Hodgkinson, P.; Pickard, C. J.; Yates, J. R.; Zorin, V. Magn. Reson. Chem.
2007, 45, S174–S186.
27
(34) Ashbrook, S. E.; Le Polles, L.; Pickard, C. J.; Berry, A. J.; Wimperis, S.; Farnan, I. Phys.
Chem. Chem. Phys. 2007, 9, 1587–1598.
(35) Yates, J. R.; Pickard, C. J.; Payne, M. C.; Dupree, R.; Profeta, M.; Mauri, F. J. Phys. Chem.
A 2004, 108, 6032–6037.
(36) Joyce, S. A.; Yates, J. R.; Pickard, C. J.; Brown, S. P. J. Am. Chem. Soc. 2008, 130, 12663–
12670.
(37) Yates, J. R.; Dobbins, S. E.; Pickard, C. J.; Mauri, F.; Ghi, P. Y.; Harris, R. K. Phys. Chem.
Chem. Phys. 2005, 7, 1402–1407.
(38) Webber, A. L.; Emsley, L.; Claramunt, R. M.; Brown, S. P. J. Phys. Chem. A 2010, 114,
10435–10442.
(39) Webber, A. L.; Elena, B.; Griffin, J. M.; Yates, J. R.; Pham, T. N.; Mauri, F.; Pickard, C. J.;
Gil, A. M.; Stein, R.; Lesage, A.; Emsley, L.; Brown, S. P. Phys. Chem. Chem. Phys. 2010,
12, 6970–6983.
(40) Harris, R. K. Analyst 2006, 131, 351–373.
(41) Stoe & Cie (2002), X-AREA and X-RED. Stoe & Cie, Darmstadt, Germany.
(42) Sheldrick, G. Acta Cryst. A 2008, 64, 112–122.
(43) Stejskal, E. O.; Schaefer, J.; Waugh, J. S. J. Magn. Reson. 1977, 28, 105–112.
(44) Dixon, W. T. J. Chem. Phys. 1982, 77, 1800–1809.
(45) Metz, G.; Wu, X. L.; Smith, S. O. J. Magn. Reson. A 1994, 110, 219–227.
(46) Opella, S. J.; Frey, M. H. J. Am. Chem. Soc. 1979, 101, 5854–5856.
(47) Bennett, A. E.; Rienstra, C. M.; Auger, M.; Lakshmi, K. V.; Griffin, R. G. J. Chem. Phys.
1995, 103, 6951–6958.
28
(48) Marion, D.; Ikura, M.; Tschudin, R.; Bax, A. J. Magn. Reson. 1989, 85, 393–399.
(49) Hahn, E. L. Phys. Rev. 1950, 80, 580–594.
(50) Marion, D.; Wüthrich, K. Biochem. Biophys. Res. Commun. 1983, 113, 967–974.
(51) Vold, R. L.; Waugh, J. S.; Klein, M. P.; Phelps, D. E. J. Chem. Phys. 1968, 48, 3831–3832.
(52) Robin Bendall, M.; Gordon, R. E. J. Magn. Reson. 1983, 53, 365–385.
(53) Laasonen, K.; Car, R.; Lee, C.; Vanderbilt, D. Phys. Rev. B 1991, 43, 6796–6799.
(54) Vanderbilt, D. Phys. Rev. B 1990, 41, 7892–7895.
(55) Yates, J. R.; Pickard, C. J.; Mauri, F. Phys. Rev. B 2007, 76, 024401.
(56) Perdew, J. P.; Burke, K.; Ernzerhof, M. Phys. Rev. Lett. 1996, 77, 3865–3868.
(57) Monkhorst, H. J.; Pack, J. D. Phys. Rev. B 1976, 13, 5188–5192.
(58) Blatov, V. A.; Shevchenko, A. P.; Serezhkin, V. N. J. Appl. Cryst. 2000, 33, 1193.
(59) Blatov, V. A.; Carlucci, L.; Ciani, G.; Proserpio, D. M. CrystEngComm 2004, 6, 378–395.
(60) Orellana, G.; Alvarez Ibarra, C.; Santoro, J. Inorg. Chem. 1988, 27, 1025–1030.
(61) Webber, A. L.; Masiero, S.; Pieraccini, S.; Burley, J. C.; Tatton, A. S.; Iuga, D.; Pham, T. N.;
Spada, G. P.; Brown, S. P. J. Am. Chem. Soc. 2011, 133, 19777–19795.
(62) Szlyk, E.; Lakomska, I.; Kobe, J.; Surdykowski, A.; Glowiak, T.; Sitkowski, J. Polyhedron
2002, 21, 2001–2007.
(63) Cornago, P.; Claramunt, R. M.; Cano, M.; Heras, J. V.; Gallego, L. M. ARKIVOC 2005, 9,
21–29.
(64) Harris, R. K., Wasylishen, R. E., Duer, M. J., Eds. NMR Crystallography; John Wiley & Sons
Ltd, 2009.
29
(65) Brouwer, D. H.; Alavi, S.; Ripmeester, J. A. Phys. Chem. Chem. Phys. 2008, 10, 3857–3860.
(66) Ubbink, M.; Worrall, J. A. R.; Canters, G. W.; Groenen, E. J. J.; Huber, M. Ann. Rev. Biophys.
Biomolec. Struct. 2002, 31, 393–422.
(67) Alla, M.; Lippmaa, E. Chem. Phys. Lett. 1982, 87, 30–33.
(68) Vanderhart, D. L.; Earl, W. L.; Garroway, A. N. J. Magn. Reson. 1981, 44, 361–401.
(69) Nayeem, A.; Yesinowski, J. P. J. Chem. Phys. 1988, 89, 4600–4608.
(70) Oldfield, E.; Kinsey, R. A.; Smith, K. A.; Nichols, J. A.; Kirkpatrick, R. J. J. Magn. Reson.
1983, 51, 325–329.
(71) VanderHart, D. L.; Asano, A.; Gilman, J. W. Chem. Mater. 2001, 13, 3796–3809.
(72) Bertmer, M.; Wang, M. F.; Krüger, M.; Blümich, B.; Litvinov, V. M.; van Es, M. Chem.
Mater. 2007, 19, 1089–1097.
(73) Ishii, Y.; Wickramasinghe, N. P.; Chimon, S. J. Am. Chem. Soc. 2003, 125, 3438–3439.
(74) Wickramasinghe, N. P.; Shaibat, M. A.; Jones, C. R.; Casabianca, L. B.; de Dios, A. C.;
Harwood, J. S.; Ishii, Y. J. Chem. Phys. 2008, 128, 052210–15.
(75) Wickramasinghe, N. P.; Shaibat, M. A.; Ishii, Y. J. Phys. Chem. B 2007, 111, 9693–9696.
(76) Fung, B. M.; Khitrin, A. K.; Ermolaev, K. J. Magn. Reson. 2000, 142, 97–101.
(77) Detken, A.; Hardy, E. H.; Ernst, M.; Meier, B. H. Chem. Phys. Lett. 2002, 356, 298–304.
(78) Ganapathy, S.; Chacko, V. P.; Bryant, R. G.; Etter, M. C. J. Am. Chem. Soc. 1986, 108,
3159–3165.
(79) Chacko, V. P.; Ganapathy, S.; Bryant, R. G. J. Am. Chem. Soc. 1983, 105, 5491–5492.
(80) Bernheim, R. A.; Brown, T. H.; Gutowsky, H. S.; Woessner, D. E. J. Chem. Phys. 1959, 30,
950–956.
30
(81) Blumberg, W. E. Phys. Rev. 1960, 119, 79–84.
(82) Bourbigot, S.; VanderHart, D. L.; Gilman, J. W.; Awad, W. H.; Davis, R. D.; Morgan, A. B.;
Wilkie, C. A. J. Polym. Sci. B: Polym. Phys. 2003, 41, 3188–3213.
31