Embed Size (px)
Citation preview
Available online at www.sciencedirect.com
Polymer 49 (2008) 422e431www.elsevier.com/locate/polymer
Synthesis and thermal properties of telechelicpoly(lactic acid) ionomers
Andrew J. Ro a, Samuel J. Huang a,b, R.A. Weiss a,c,*
a Polymer Program, University of Connecticut, 97 N. Eagleville Road, Storrs, CT 06269-3136, USAb Department of Chemistry, University of Connecticut, 97 N. Eagleville Road, Storrs, CT 06269-3136, USA
c Department of Chemical Engineering, University of Connecticut, 97 N. Eagleville Road, Storrs, CT 06269-3136, USA
Received 19 August 2007; received in revised form 7 November 2007; accepted 17 November 2007
Available online 21 November 2007
Abstract
Telechelic poly(lactic acid) (PLA) ionomers were synthesized using a chemical recycling process. A transesterification reaction between acommercial PLA and 2-hydroxyethyl methacrylate or ethylene glycol was used to produce a hydroxy-terminated PLA. The hydroxy-terminatedPLA was then reacted with itaconic anhydride to produce terminal carboxylic acid groups, which were neutralized with appropriate metalacetates to produce Na-, Li-, K-, Zn-, Ca- and Y-u- and a,u-telechelic PLA ionomers. 1H NMR spectroscopy was used to confirm the presenceof the itaconic acid end-groups and FTIR spectroscopy was used to quantify the extent of neutralization. The addition of the ionic groupsincreased the glass transition (Tg), and Tg increased as the strength of the ion-pair increased. The ionic groups suppressed crystallinity, especiallywhen multivalent cations were used.� 2007 Elsevier Ltd. All rights reserved.
Keywords: Poly(lactic acid); Ionomers; Synthesis
1. Introduction
Petroleum-based polymers are not easily recyclable and donot biodegrade, which presents significant problems in wastemanagement [1]. In 2003, the United States generated 26.7million tons of plastic waste, of which only 5.2% was recycled[2]. In addition, the increasing price of petroleum has led tocorresponding increases in monomer costs [3]. One alternativeto petroleum-based polymers is renewable, plant-based poly-mers, such as poly(lactic acid) (PLA). PLA has thermal andmechanical properties similar to current commodity polymersbut there is considerable interest in improving its glass transi-tion temperature (Tg), melt processibility, toughness, and com-patibility with other polymers [4e6].
Attempts to improve the properties of PLA have includedorientation of the polymer [7], blending it with other biode-
* Corresponding author. Department of Chemical Engineering, University of
Connecticut, 97 N. Eagleville Road, Storrs, CT 06269-3136, USA. Tel.: þ1
860 486 4698; fax: þ1 860 486 6048.
E-mail address: [email protected] (R.A. Weiss).
0032-3861/$ - see front matter � 2007 Elsevier Ltd. All rights reserved.
doi:10.1016/j.polymer.2007.11.038
gradable polymers [8], and copolymerization [9]. Integrationof ionic groups on the polymer chain is another approach forimproving the properties of polymers [10]. Ionomers typicallycontain a small amount (e.g., �15 mol%) of bonded saltgroups. The majority of investigations of these materials con-sider random ionomers, where the ionic groups are randomlydistributed on the polymer chain [11]. However, telechelic ion-omers are generally used as model systems for understandingionic aggregation behavior and morphology [12]. Telechelicionomers are ideal for these investigations since the molecularweight between the ionic groups is controlled and the ionicgroups are located exclusively at the ends of the polymerchain.
The improvements in thermal and mechanical properties ofionomers are attributed to nanophase separation of the ionicspecies, which forms due to strong ionedipole interactionsbetween the bonded salt groups. The interactions betweenthe ionic groups act as reversible crosslinks, providing physi-cal characteristics of a crosslinked polymer, but processibilityis possible in solution or in the melt at elevated temperatures
423A.J. Ro et al. / Polymer 49 (2008) 422e431
[10]. The ionic groups restrict the segmental mobility of thepolymer chain, which increases the Tg of the polymers [13,14].In his early theoretical work, Eisenberg proposed that the ex-tent of the increase should be dependent on the concentrationand strength of the ion-pair interactions, specifically cq/a,where q is the cation charge, a is the ionic radius of thecounter-ion and c is the ion concentration [15].
Sherman and Storey [16] previously synthesized telechelicPLA carboxylate ionomers and demonstrated that the presenceof the metal carboxylates increased Tg and hindered crystalli-zation. In the current study, u- and a,u-carboxylic acid-func-tional PLAs were synthesized by a chemical recycling process[17] using polymers and monomers derived from renewableresources. An alcoholysis reaction between itaconic anhydrideand hydroxy groups produces carboxylic acid moieties. Thechemical recycling process is a transesterification reactionbetween high molecular weight PLA and a hydroxy-termi-nated monomer and a subsequent end-capping reaction withitaconic anhydride. Itaconic anhydride is produced from thepyrolysis of citric acid or the fermentation of carbohydrates(both of which are renewable resources), followed by dehydra-tion [18]. A reaction similar to the chemical recycling reactionis to use amines instead of hydroxy groups [19,20]. The func-tionalized PLA was neutralized with metal acetates of variousvalencies (Naþ, Liþ, Kþ, Caþ2, Znþ2, Yþ3). This paperdescribes the effect of the metal ion concentration, metal ionvalency, and the location of the ionic moieties on the thermaland mechanical properties of the telechelic PLA ionomers.
2. Experimental
2.1. Materials
PLA with a Mn¼ 65,000 g/mol and Mw¼ 121,000 g/mol(as determined by gel permeation chromatography using poly-styrene standards) was obtained from Cargill Corp. (now,Natureworks, LLC) and was dried in a vacuum oven at 70 �Cunder reduced pressure for 12 h. Chloroform (Aldrich Chem-ical Co., 99.5%) was distilled over calcium hydride prior touse. 2-Hydroxyethyl methacrylate (HEMA, Sigma ChemicalCo., 97%) was distilled under reduced pressure. All otherreagents were used without further purification. Tin(II) 2-ethylhexanoate (SnOct, w95%), calcium acetate, and itaconicanhydride (95%) were purchased from Sigma Chemical Co.Ethylene glycol (EG, anhydrous, 99.8%) and yttrium(III) ace-tate hydrate were purchased from Aldrich Chemical Co. Meth-anol, tetrahydrofuran (99.9%), sodium acetate, and potassium
O
OOH + H
O
CH3
CH3
O
HOn
a
O
O O
OO H
n+
OOO
b
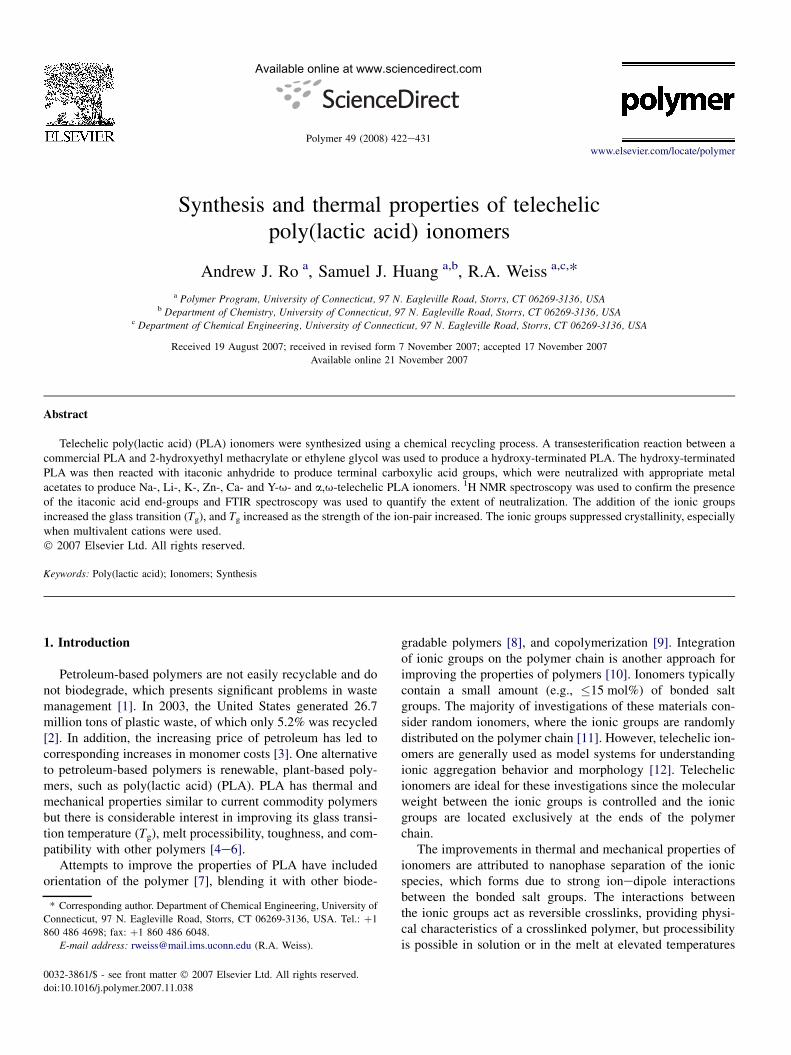
Scheme 1. (a) Synthesis of a-methacrylate-u-hydroxy-PLA
acetate were purchased from Fisher Scientific Inc. Zinc acetatedihydrate and lithium acetate were purchased from AcrosOrganics Co.
2.2. Synthesis of u-(carboxylic acid) PLA
All glasswares and the stir-blades were dried in an oven at160 �C and allowed to cool over CaSO4 in a desiccator prior touse. PLA was melted under a N2 purge at 190 �C in a 250 mLflask equipped with a mechanical stirrer. SnOct (2% w/wPLA) and HEMA were injected into the reaction flask viasyringe. HEMA was added in two different molar ratios(26 mol and 130 mol of lactic acid units in the PLA permole of HEMA) to produce two different molecular weightpolymers. The reaction mixture was heated and stirred at190 �C for 2 h to reduce the molecular weight of the PLAand functionalize one end of it with HEMA, see Scheme1(a) The reaction flask was then quenched in cold water andthe HEMA-functionalized polymer was dissolved in chloro-form. The reaction flask was purged with N2 and a two-foldmolar excess of itaconic anhydride (ITA) and SnOct (1% w/wPLA) was then added to the flask. A water-cooled conden-ser was attached to the flask and the end-capping reaction(Scheme 1(b)) was refluxed at 120 �C for 6 h. The polymerswere precipitated with excess methanol, filtered, and dried at70 �C in a vacuum oven for 24 h. Two different molecularweight telechelic PLAs were prepared, Mn w 3.4 kg/mol andMn w 13.0 kg/mol. These polymers are denoted as HPLAx,where x is the number-average molecular weight determinedby 1H NMR (see Section 2.5 below).
2.3. Synthesis of a,u-(carboxylic acid) PLA
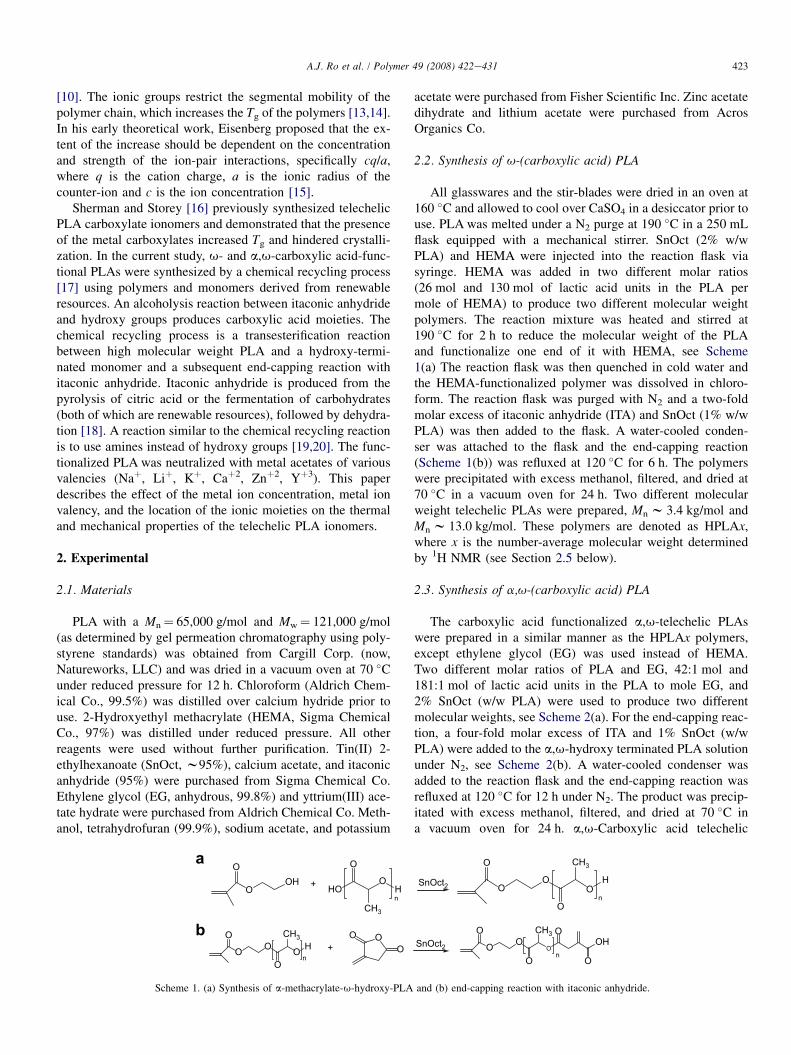
The carboxylic acid functionalized a,u-telechelic PLAswere prepared in a similar manner as the HPLAx polymers,except ethylene glycol (EG) was used instead of HEMA.Two different molar ratios of PLA and EG, 42:1 mol and181:1 mol of lactic acid units in the PLA to mole EG, and2% SnOct (w/w PLA) were used to produce two differentmolecular weights, see Scheme 2(a). For the end-capping reac-tion, a four-fold molar excess of ITA and 1% SnOct (w/wPLA) were added to the a,u-hydroxy terminated PLA solutionunder N2, see Scheme 2(b). A water-cooled condenser wasadded to the reaction flask and the end-capping reaction wasrefluxed at 120 �C for 12 h under N2. The product was precip-itated with excess methanol, filtered, and dried at 70 �C ina vacuum oven for 24 h. a,u-Carboxylic acid telechelic
CH3
CH3
SnOct2
SnOct2
O
OO
O
OH
n
O
O O
OO
O
O
OHn
and (b) end-capping reaction with itaconic anhydride.
SnOct2
SnOct2
HO HOOH +
CH3
CH3
CH3
CH3
CH3
CH3
CH3
OH
O
OO
O
O
O
O HH
n
a
OOO
O
OO HH O
O
O
OOO
O
OO
O
O
OH
O
O
OH+
b
Scheme 2. (a) Synthesis of a,u-(hydroxy) PLA and (b) end-capping reaction with itaconic anhydride.
424 A.J. Ro et al. / Polymer 49 (2008) 422e431
polymers with Mn w 3.4 kg/mol and w13.0 kg/mol (EPLAx,where x¼Mn from 1H NMR) were prepared.
2.4. Preparation of ionomers
Stock solutions of the metal acetates (0.25 M) were pre-pared using distilled, deionized water. The HPLAx or EPLAxwas dissolved in tetrahydrofuran (THF) in a round-bottomflask, and the following equivalents of metal acetate per equiv-alent of carboxylic acid were added to the reaction flask:1 equiv for monovalent metal acetates, 2 equiv for divalentmetal acetates, and 3 equiv for trivalent metal acetates. Afterallowing the neutralization reaction to proceed for 0.5 h, thesolvent was vacuum distilled and the precipitated polymerwas dried at 70 �C under reduced pressure for 24 h. The poly-mer was then washed with excess distilled, deionized water toremove any acetic acid and unreacted metal acetate, filtered,and dried at 70 �C under reduced pressure for 24 h. The sam-ple nomenclatures for the telechelic ionomers are HPLAxeMand EPLAxeM, where M is the metal counter-ion (Naþ, Liþ,Kþ, Caþ2, Znþ2, Yþ3).
2.5. Polymer characterization
FTIR spectra were measured with a Nicolet Magna IR 560spectrometer using pellets prepared from KBr powder (FisherScientific Inc., 99.9%). Each sample was analyzed with 128scans with 2 cm�1 resolution. 1H NMR spectra were acquiredon a Bruker DRX-500 MHz using 5 mm o.d. sample tubes.Samples were analyzed in CDCl3 (Cambridge Isotope Labora-tories, Inc.) containing 1% TMS as an internal reference. Thenumber-average molecular weights (Mn) were determined by1H NMR from the ratio of the methine protons in the lacticacid repeat unit and the terminal vinyl protons.
The molecular weight averages Mn and Mw were also mea-sured using a Waters 717 Plus autosampler gel permeationchromatography system equipped with a Waters 410 differen-tial refractometer, a Waters 2487 dual wavelength absorbanceUVevis detector set at 254 nm, a Polymer Laboratories PL-ELS 1000 evaporative light scattering (ELS) detector, and aJordi Gel DVB 105 A, a PL Gel 10.4 nm, a Jordi Gel DVB10 nm, and a Waters Ultrastyragel 50 nm column setup. Tetra-hydrofuran (Fisher, 99.9% HPLC grade) was used as an eluentat a flow rate of 2 mL/min. Number-average (Mn) and weight-average molecular weights (Mw) were determined fromcalibration plots constructed with polystyrene standards.
Thermal properties were analyzed with a TA InstrumentsQ100 differential scanning calorimeter and samples weresealed in aluminum pans and experiments were run under anargon atmosphere. The sample thermal history was removedby heating the sample to 170 �C for 5 min and then quenchingto �30 �C before all thermal analyses. The sample was heatedfrom �30 �C to 170 �C, at a rate of 20 �C/min. Non-isother-mal crystallization kinetic studies were conducted by heatingthe sample to 170 �C for 5 min and then cooling to �30 �C,at a rate of 5 �C/min. Temperatures and enthalpies were cali-brated using an indium standard.
Thermomechanical analysis was conducted on a TA Instru-ments Q400 Thermomechanical Analyzer. A penetration probewith a force of 70 mN was applied to film sample that was1.5e1.7 mm thick. The samples were heated from 10 �C to140 �C at the rate of 10 �C/min. The ionomer samples weremolded in a Teflon mold at 180 �C under reduced pressurein a vacuum oven.
3. Results and discussion
3.1. Structural characterization
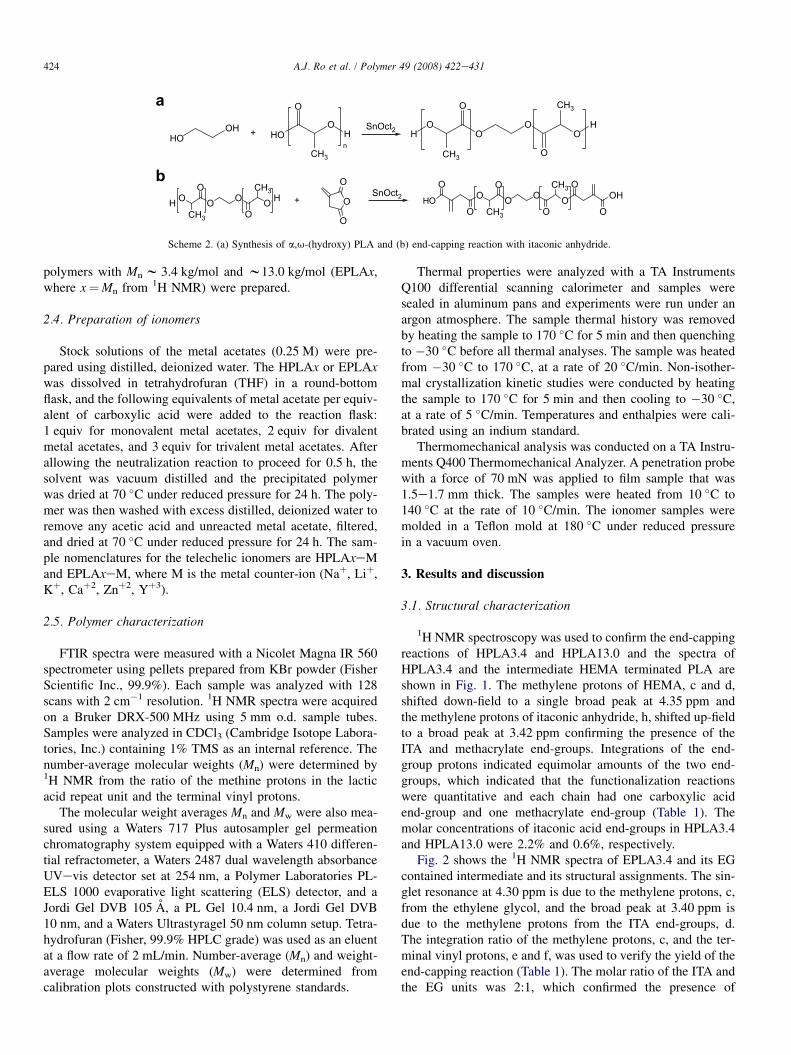
1H NMR spectroscopy was used to confirm the end-cappingreactions of HPLA3.4 and HPLA13.0 and the spectra ofHPLA3.4 and the intermediate HEMA terminated PLA areshown in Fig. 1. The methylene protons of HEMA, c and d,shifted down-field to a single broad peak at 4.35 ppm andthe methylene protons of itaconic anhydride, h, shifted up-fieldto a broad peak at 3.42 ppm confirming the presence of theITA and methacrylate end-groups. Integrations of the end-group protons indicated equimolar amounts of the two end-groups, which indicated that the functionalization reactionswere quantitative and each chain had one carboxylic acidend-group and one methacrylate end-group (Table 1). Themolar concentrations of itaconic acid end-groups in HPLA3.4and HPLA13.0 were 2.2% and 0.6%, respectively.
Fig. 2 shows the 1H NMR spectra of EPLA3.4 and its EGcontained intermediate and its structural assignments. The sin-glet resonance at 4.30 ppm is due to the methylene protons, c,from the ethylene glycol, and the broad peak at 3.40 ppm isdue to the methylene protons from the ITA end-groups, d.The integration ratio of the methylene protons, c, and the ter-minal vinyl protons, e and f, was used to verify the yield of theend-capping reaction (Table 1). The molar ratio of the ITA andthe EG units was 2:1, which confirmed the presence of
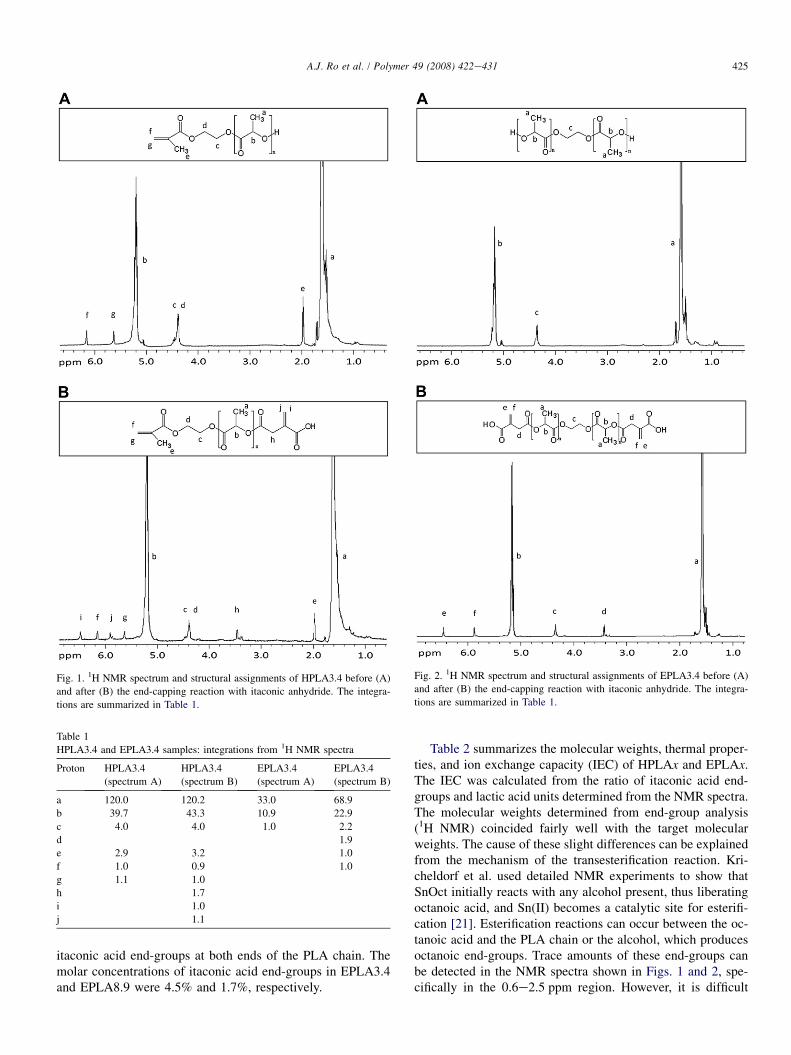
Table 1
HPLA3.4 and EPLA3.4 samples: integrations from 1H NMR spectra
Proton HPLA3.4
(spectrum A)
HPLA3.4
(spectrum B)
EPLA3.4
(spectrum A)
EPLA3.4
(spectrum B)
a 120.0 120.2 33.0 68.9
b 39.7 43.3 10.9 22.9
c 4.0 4.0 1.0 2.2
d 1.9
e 2.9 3.2 1.0
f 1.0 0.9 1.0
g 1.1 1.0
h 1.7
i 1.0
j 1.1
Fig. 1. 1H NMR spectrum and structural assignments of HPLA3.4 before (A)
and after (B) the end-capping reaction with itaconic anhydride. The integra-
tions are summarized in Table 1.
Fig. 2. 1H NMR spectrum and structural assignments of EPLA3.4 before (A)
and after (B) the end-capping reaction with itaconic anhydride. The integra-
tions are summarized in Table 1.
425A.J. Ro et al. / Polymer 49 (2008) 422e431
itaconic acid end-groups at both ends of the PLA chain. Themolar concentrations of itaconic acid end-groups in EPLA3.4and EPLA8.9 were 4.5% and 1.7%, respectively.
Table 2 summarizes the molecular weights, thermal proper-ties, and ion exchange capacity (IEC) of HPLAx and EPLAx.The IEC was calculated from the ratio of itaconic acid end-groups and lactic acid units determined from the NMR spectra.The molecular weights determined from end-group analysis(1H NMR) coincided fairly well with the target molecularweights. The cause of these slight differences can be explainedfrom the mechanism of the transesterification reaction. Kri-cheldorf et al. used detailed NMR experiments to show thatSnOct initially reacts with any alcohol present, thus liberatingoctanoic acid, and Sn(II) becomes a catalytic site for esterifi-cation [21]. Esterification reactions can occur between the oc-tanoic acid and the PLA chain or the alcohol, which producesoctanoic end-groups. Trace amounts of these end-groups canbe detected in the NMR spectra shown in Figs. 1 and 2, spe-cifically in the 0.6e2.5 ppm region. However, it is difficult
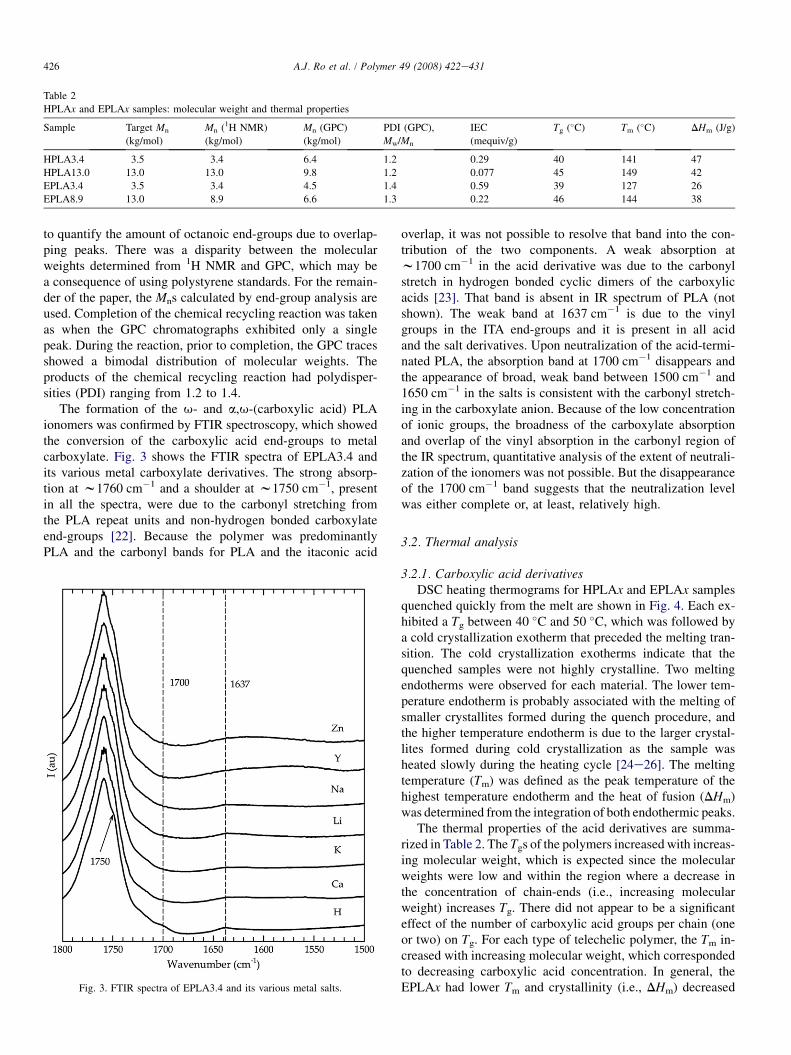
Table 2
HPLAx and EPLAx samples: molecular weight and thermal properties
Sample Target Mn
(kg/mol)
Mn (1H NMR)
(kg/mol)
Mn (GPC)
(kg/mol)
PDI (GPC),
Mw/Mn
IEC
(mequiv/g)
Tg (�C) Tm (�C) DHm (J/g)
HPLA3.4 3.5 3.4 6.4 1.2 0.29 40 141 47
HPLA13.0 13.0 13.0 9.8 1.2 0.077 45 149 42
EPLA3.4 3.5 3.4 4.5 1.4 0.59 39 127 26
EPLA8.9 13.0 8.9 6.6 1.3 0.22 46 144 38
426 A.J. Ro et al. / Polymer 49 (2008) 422e431
to quantify the amount of octanoic end-groups due to overlap-ping peaks. There was a disparity between the molecularweights determined from 1H NMR and GPC, which may bea consequence of using polystyrene standards. For the remain-der of the paper, the Mns calculated by end-group analysis areused. Completion of the chemical recycling reaction was takenas when the GPC chromatographs exhibited only a singlepeak. During the reaction, prior to completion, the GPC tracesshowed a bimodal distribution of molecular weights. Theproducts of the chemical recycling reaction had polydisper-sities (PDI) ranging from 1.2 to 1.4.
The formation of the u- and a,u-(carboxylic acid) PLAionomers was confirmed by FTIR spectroscopy, which showedthe conversion of the carboxylic acid end-groups to metalcarboxylate. Fig. 3 shows the FTIR spectra of EPLA3.4 andits various metal carboxylate derivatives. The strong absorp-tion at w1760 cm�1 and a shoulder at w1750 cm�1, presentin all the spectra, were due to the carbonyl stretching fromthe PLA repeat units and non-hydrogen bonded carboxylateend-groups [22]. Because the polymer was predominantlyPLA and the carbonyl bands for PLA and the itaconic acid
Fig. 3. FTIR spectra of EPLA3.4 and its various metal salts.
overlap, it was not possible to resolve that band into the con-tribution of the two components. A weak absorption atw1700 cm�1 in the acid derivative was due to the carbonylstretch in hydrogen bonded cyclic dimers of the carboxylicacids [23]. That band is absent in IR spectrum of PLA (notshown). The weak band at 1637 cm�1 is due to the vinylgroups in the ITA end-groups and it is present in all acidand the salt derivatives. Upon neutralization of the acid-termi-nated PLA, the absorption band at 1700 cm�1 disappears andthe appearance of broad, weak band between 1500 cm�1 and1650 cm�1 in the salts is consistent with the carbonyl stretch-ing in the carboxylate anion. Because of the low concentrationof ionic groups, the broadness of the carboxylate absorptionand overlap of the vinyl absorption in the carbonyl region ofthe IR spectrum, quantitative analysis of the extent of neutrali-zation of the ionomers was not possible. But the disappearanceof the 1700 cm�1 band suggests that the neutralization levelwas either complete or, at least, relatively high.
3.2. Thermal analysis
3.2.1. Carboxylic acid derivativesDSC heating thermograms for HPLAx and EPLAx samples
quenched quickly from the melt are shown in Fig. 4. Each ex-hibited a Tg between 40 �C and 50 �C, which was followed bya cold crystallization exotherm that preceded the melting tran-sition. The cold crystallization exotherms indicate that thequenched samples were not highly crystalline. Two meltingendotherms were observed for each material. The lower tem-perature endotherm is probably associated with the melting ofsmaller crystallites formed during the quench procedure, andthe higher temperature endotherm is due to the larger crystal-lites formed during cold crystallization as the sample washeated slowly during the heating cycle [24e26]. The meltingtemperature (Tm) was defined as the peak temperature of thehighest temperature endotherm and the heat of fusion (DHm)was determined from the integration of both endothermic peaks.
The thermal properties of the acid derivatives are summa-rized in Table 2. The Tgs of the polymers increased with increas-ing molecular weight, which is expected since the molecularweights were low and within the region where a decrease inthe concentration of chain-ends (i.e., increasing molecularweight) increases Tg. There did not appear to be a significanteffect of the number of carboxylic acid groups per chain (oneor two) on Tg. For each type of telechelic polymer, the Tm in-creased with increasing molecular weight, which correspondedto decreasing carboxylic acid concentration. In general, theEPLAx had lower Tm and crystallinity (i.e., DHm) decreased
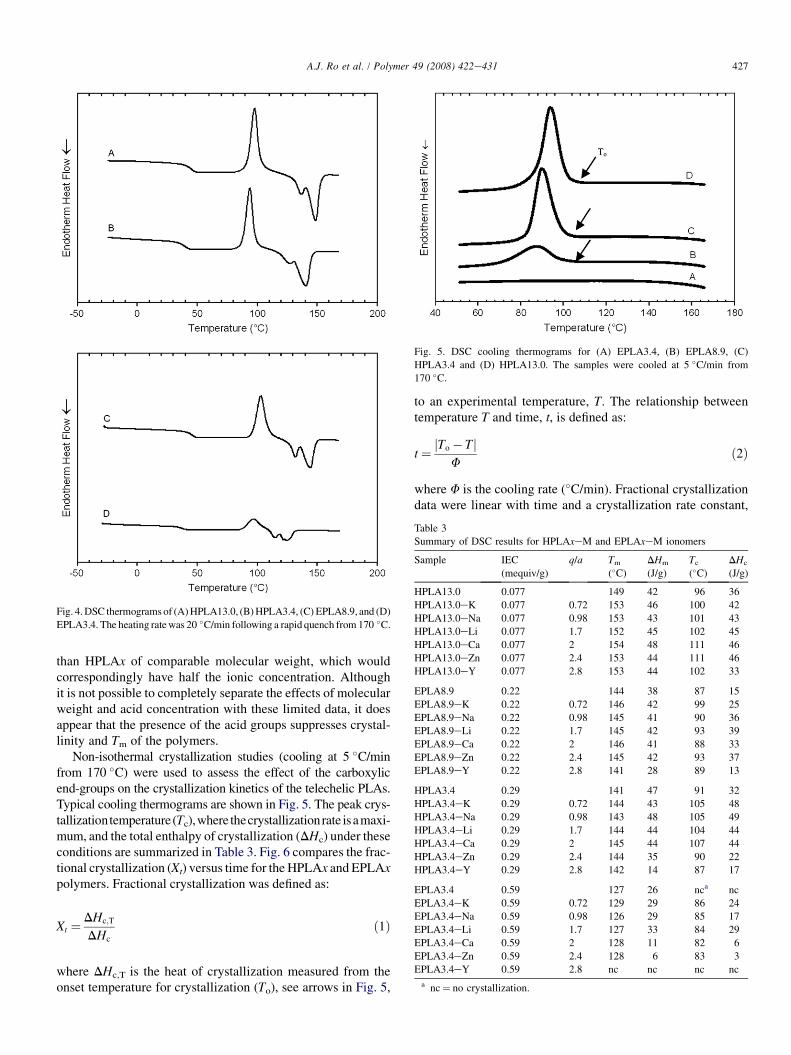
Fig. 5. DSC cooling thermograms for (A) EPLA3.4, (B) EPLA8.9, (C)
HPLA3.4 and (D) HPLA13.0. The samples were cooled at 5 �C/min from
170 �C.
Table 3
Summary of DSC results for HPLAxeM and EPLAxeM ionomers
Sample IEC
(mequiv/g)
q/a Tm
(�C)
DHm
(J/g)
Tc
(�C)
DHc
(J/g)
HPLA13.0 0.077 149 42 96 36
HPLA13.0eK 0.077 0.72 153 46 100 42
HPLA13.0eNa 0.077 0.98 153 43 101 43
HPLA13.0eLi 0.077 1.7 152 45 102 45
HPLA13.0eCa 0.077 2 154 48 111 46
HPLA13.0eZn 0.077 2.4 153 44 111 46
HPLA13.0eY 0.077 2.8 153 44 102 33
EPLA8.9 0.22 144 38 87 15
EPLA8.9eK 0.22 0.72 146 42 99 25
EPLA8.9eNa 0.22 0.98 145 41 90 36
EPLA8.9eLi 0.22 1.7 145 42 93 39
EPLA8.9eCa 0.22 2 146 41 88 33
EPLA8.9eZn 0.22 2.4 145 42 93 37
EPLA8.9eY 0.22 2.8 141 28 89 13
HPLA3.4 0.29 141 47 91 32
HPLA3.4eK 0.29 0.72 144 43 105 48
HPLA3.4eNa 0.29 0.98 143 48 105 49
HPLA3.4eLi 0.29 1.7 144 44 104 44
HPLA3.4eCa 0.29 2 145 44 107 44
HPLA3.4eZn 0.29 2.4 144 35 90 22
HPLA3.4eY 0.29 2.8 142 14 87 17
EPLA3.4 0.59 127 26 nca nc
EPLA3.4eK 0.59 0.72 129 29 86 24
EPLA3.4eNa 0.59 0.98 126 29 85 17
EPLA3.4eLi 0.59 1.7 127 33 84 29
EPLA3.4eCa 0.59 2 128 11 82 6
EPLA3.4eZn 0.59 2.4 128 6 83 3
EPLA3.4eY 0.59 2.8 nc nc nc nc
a nc¼ no crystallization.
Fig. 4. DSC thermograms of (A) HPLA13.0, (B) HPLA3.4, (C) EPLA8.9, and (D)
EPLA3.4. The heating rate was 20 �C/min following a rapid quench from 170 �C.
427A.J. Ro et al. / Polymer 49 (2008) 422e431
than HPLAx of comparable molecular weight, which wouldcorrespondingly have half the ionic concentration. Althoughit is not possible to completely separate the effects of molecularweight and acid concentration with these limited data, it doesappear that the presence of the acid groups suppresses crystal-linity and Tm of the polymers.
Non-isothermal crystallization studies (cooling at 5 �C/minfrom 170 �C) were used to assess the effect of the carboxylicend-groups on the crystallization kinetics of the telechelic PLAs.Typical cooling thermograms are shown in Fig. 5. The peak crys-tallizationtemperature(Tc),where thecrystallizationrate isamaxi-mum, and the total enthalpy of crystallization (DHc) under theseconditions are summarized in Table 3. Fig. 6 compares the frac-tional crystallization (Xt) versus time for the HPLAx and EPLAxpolymers. Fractional crystallization was defined as:
Xt ¼DHc;T
DHc
ð1Þ
where DHc,T is the heat of crystallization measured from theonset temperature for crystallization (To), see arrows in Fig. 5,
to an experimental temperature, T. The relationship betweentemperature T and time, t, is defined as:
t ¼ jTo� TjF
ð2Þ
where F is the cooling rate (�C/min). Fractional crystallizationdata were linear with time and a crystallization rate constant,
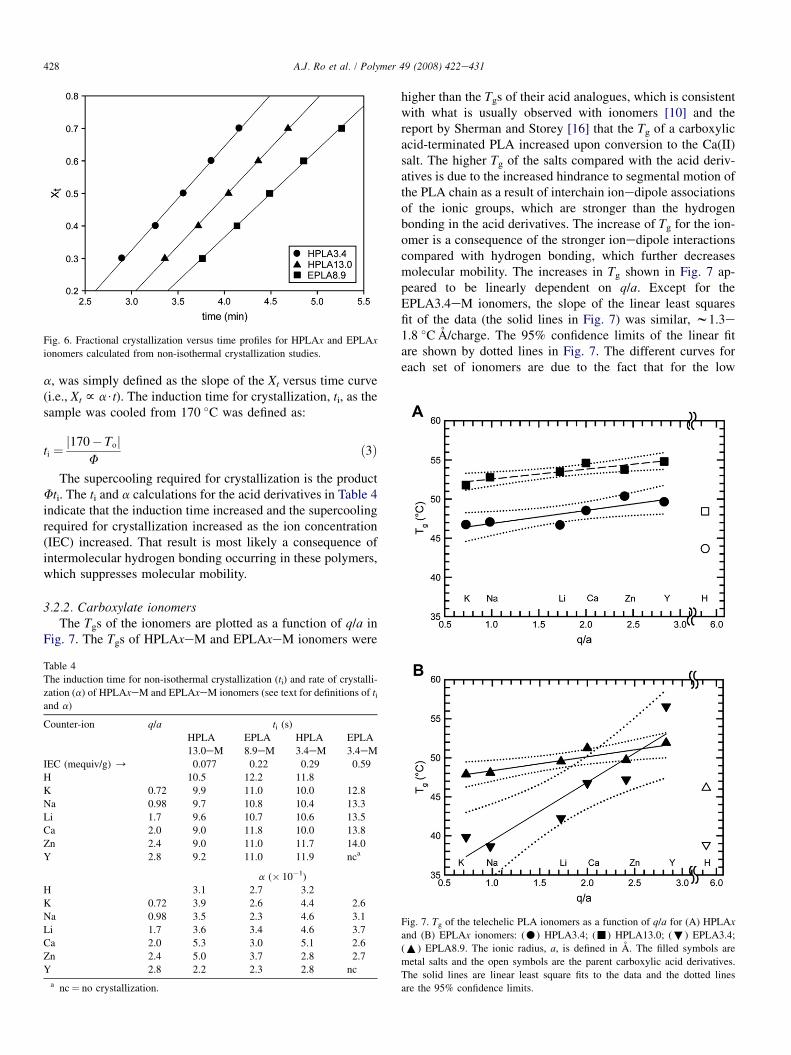
Fig. 6. Fractional crystallization versus time profiles for HPLAx and EPLAx
ionomers calculated from non-isothermal crystallization studies.
428 A.J. Ro et al. / Polymer 49 (2008) 422e431
a, was simply defined as the slope of the Xt versus time curve(i.e., Xt f a$t). The induction time for crystallization, ti, as thesample was cooled from 170 �C was defined as:
ti ¼j170� Toj
Fð3Þ
The supercooling required for crystallization is the productFti. The ti and a calculations for the acid derivatives in Table 4indicate that the induction time increased and the supercoolingrequired for crystallization increased as the ion concentration(IEC) increased. That result is most likely a consequence ofintermolecular hydrogen bonding occurring in these polymers,which suppresses molecular mobility.
3.2.2. Carboxylate ionomersThe Tgs of the ionomers are plotted as a function of q/a in
Fig. 7. The Tgs of HPLAxeM and EPLAxeM ionomers were
Table 4
The induction time for non-isothermal crystallization (ti) and rate of crystalli-
zation (a) of HPLAxeM and EPLAxeM ionomers (see text for definitions of tiand a)
Counter-ion q/a ti (s)
HPLA
13.0eM
EPLA
8.9eM
HPLA
3.4eM
EPLA
3.4eM
IEC (mequiv/g) / 0.077 0.22 0.29 0.59
H 10.5 12.2 11.8
K 0.72 9.9 11.0 10.0 12.8
Na 0.98 9.7 10.8 10.4 13.3
Li 1.7 9.6 10.7 10.6 13.5
Ca 2.0 9.0 11.8 10.0 13.8
Zn 2.4 9.0 11.0 11.7 14.0
Y 2.8 9.2 11.0 11.9 nca
a (� 10�1)
H 3.1 2.7 3.2
K 0.72 3.9 2.6 4.4 2.6
Na 0.98 3.5 2.3 4.6 3.1
Li 1.7 3.6 3.4 4.6 3.7
Ca 2.0 5.3 3.0 5.1 2.6
Zn 2.4 5.0 3.7 2.8 2.7
Y 2.8 2.2 2.3 2.8 nc
a nc¼ no crystallization.
higher than the Tgs of their acid analogues, which is consistentwith what is usually observed with ionomers [10] and thereport by Sherman and Storey [16] that the Tg of a carboxylicacid-terminated PLA increased upon conversion to the Ca(II)salt. The higher Tg of the salts compared with the acid deriv-atives is due to the increased hindrance to segmental motion ofthe PLA chain as a result of interchain ionedipole associationsof the ionic groups, which are stronger than the hydrogenbonding in the acid derivatives. The increase of Tg for the ion-omer is a consequence of the stronger ionedipole interactionscompared with hydrogen bonding, which further decreasesmolecular mobility. The increases in Tg shown in Fig. 7 ap-peared to be linearly dependent on q/a. Except for theEPLA3.4eM ionomers, the slope of the linear least squaresfit of the data (the solid lines in Fig. 7) was similar, w1.3e1.8 �C A/charge. The 95% confidence limits of the linear fitare shown by dotted lines in Fig. 7. The different curves foreach set of ionomers are due to the fact that for the low
Fig. 7. Tg of the telechelic PLA ionomers as a function of q/a for (A) HPLAx
and (B) EPLAx ionomers: (C) HPLA3.4; (-) HPLA13.0; (;) EPLA3.4;
(:) EPLA8.9. The ionic radius, a, is defined in A. The filled symbols are
metal salts and the open symbols are the parent carboxylic acid derivatives.
The solid lines are linear least square fits to the data and the dotted lines
are the 95% confidence limits.
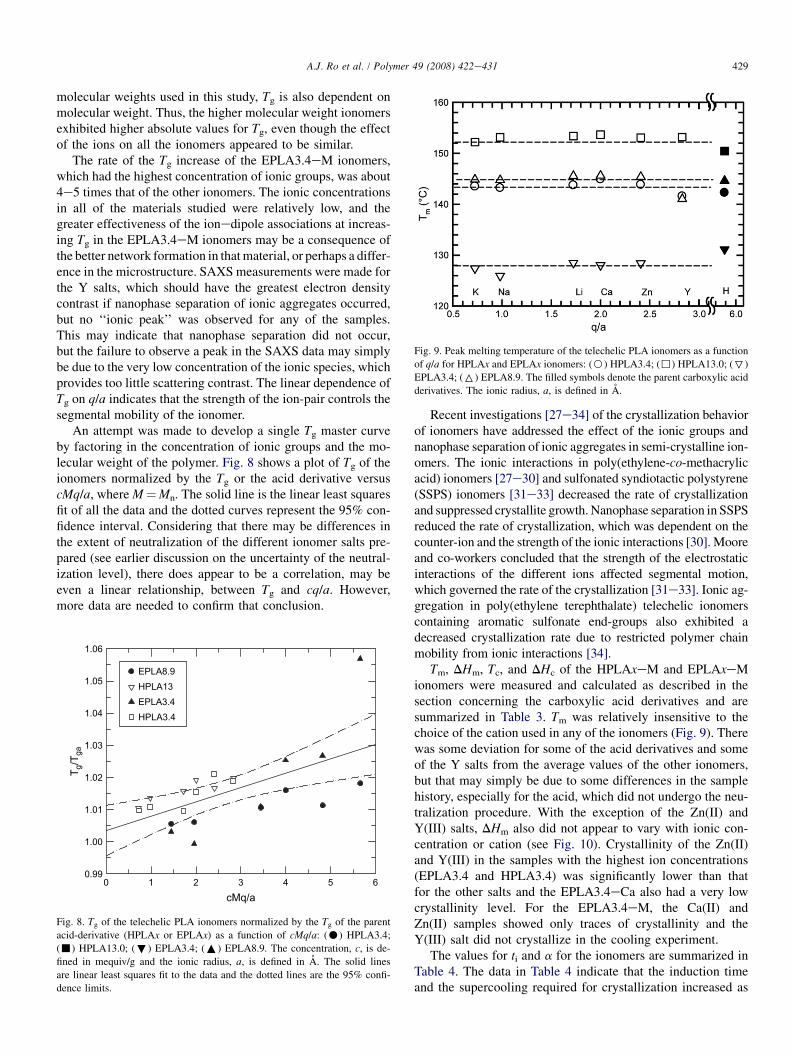
Fig. 9. Peak melting temperature of the telechelic PLA ionomers as a function
of q/a for HPLAx and EPLAx ionomers: (B) HPLA3.4; (,) HPLA13.0; (7)
EPLA3.4; (6) EPLA8.9. The filled symbols denote the parent carboxylic acid
derivatives. The ionic radius, a, is defined in A.
429A.J. Ro et al. / Polymer 49 (2008) 422e431
molecular weights used in this study, Tg is also dependent onmolecular weight. Thus, the higher molecular weight ionomersexhibited higher absolute values for Tg, even though the effectof the ions on all the ionomers appeared to be similar.
The rate of the Tg increase of the EPLA3.4eM ionomers,which had the highest concentration of ionic groups, was about4e5 times that of the other ionomers. The ionic concentrationsin all of the materials studied were relatively low, and thegreater effectiveness of the ionedipole associations at increas-ing Tg in the EPLA3.4eM ionomers may be a consequence ofthe better network formation in that material, or perhaps a differ-ence in the microstructure. SAXS measurements were made forthe Y salts, which should have the greatest electron densitycontrast if nanophase separation of ionic aggregates occurred,but no ‘‘ionic peak’’ was observed for any of the samples.This may indicate that nanophase separation did not occur,but the failure to observe a peak in the SAXS data may simplybe due to the very low concentration of the ionic species, whichprovides too little scattering contrast. The linear dependence ofTg on q/a indicates that the strength of the ion-pair controls thesegmental mobility of the ionomer.
An attempt was made to develop a single Tg master curveby factoring in the concentration of ionic groups and the mo-lecular weight of the polymer. Fig. 8 shows a plot of Tg of theionomers normalized by the Tg or the acid derivative versuscMq/a, where M¼Mn. The solid line is the linear least squaresfit of all the data and the dotted curves represent the 95% con-fidence interval. Considering that there may be differences inthe extent of neutralization of the different ionomer salts pre-pared (see earlier discussion on the uncertainty of the neutral-ization level), there does appear to be a correlation, may beeven a linear relationship, between Tg and cq/a. However,more data are needed to confirm that conclusion.
cMq/a0 1 2 3 4 5 6
T g/T
ga
0.99
1.00
1.01
1.02
1.03
1.04
1.05
1.06
EPLA8.9HPLA13EPLA3.4HPLA3.4
Fig. 8. Tg of the telechelic PLA ionomers normalized by the Tg of the parent
acid-derivative (HPLAx or EPLAx) as a function of cMq/a: (C) HPLA3.4;
(-) HPLA13.0; (;) EPLA3.4; (:) EPLA8.9. The concentration, c, is de-
fined in mequiv/g and the ionic radius, a, is defined in A. The solid lines
are linear least squares fit to the data and the dotted lines are the 95% confi-
dence limits.
Recent investigations [27e34] of the crystallization behaviorof ionomers have addressed the effect of the ionic groups andnanophase separation of ionic aggregates in semi-crystalline ion-omers. The ionic interactions in poly(ethylene-co-methacrylicacid) ionomers [27e30] and sulfonated syndiotactic polystyrene(SSPS) ionomers [31e33] decreased the rate of crystallizationand suppressed crystallite growth. Nanophase separation in SSPSreduced the rate of crystallization, which was dependent on thecounter-ion and the strength of the ionic interactions [30]. Mooreand co-workers concluded that the strength of the electrostaticinteractions of the different ions affected segmental motion,which governed the rate of the crystallization [31e33]. Ionic ag-gregation in poly(ethylene terephthalate) telechelic ionomerscontaining aromatic sulfonate end-groups also exhibited adecreased crystallization rate due to restricted polymer chainmobility from ionic interactions [34].
Tm, DHm, Tc, and DHc of the HPLAxeM and EPLAxeMionomers were measured and calculated as described in thesection concerning the carboxylic acid derivatives and aresummarized in Table 3. Tm was relatively insensitive to thechoice of the cation used in any of the ionomers (Fig. 9). Therewas some deviation for some of the acid derivatives and someof the Y salts from the average values of the other ionomers,but that may simply be due to some differences in the samplehistory, especially for the acid, which did not undergo the neu-tralization procedure. With the exception of the Zn(II) andY(III) salts, DHm also did not appear to vary with ionic con-centration or cation (see Fig. 10). Crystallinity of the Zn(II)and Y(III) in the samples with the highest ion concentrations(EPLA3.4 and HPLA3.4) was significantly lower than thatfor the other salts and the EPLA3.4eCa also had a very lowcrystallinity level. For the EPLA3.4eM, the Ca(II) andZn(II) samples showed only traces of crystallinity and theY(III) salt did not crystallize in the cooling experiment.
The values for ti and a for the ionomers are summarized inTable 4. The data in Table 4 indicate that the induction timeand the supercooling required for crystallization increased as
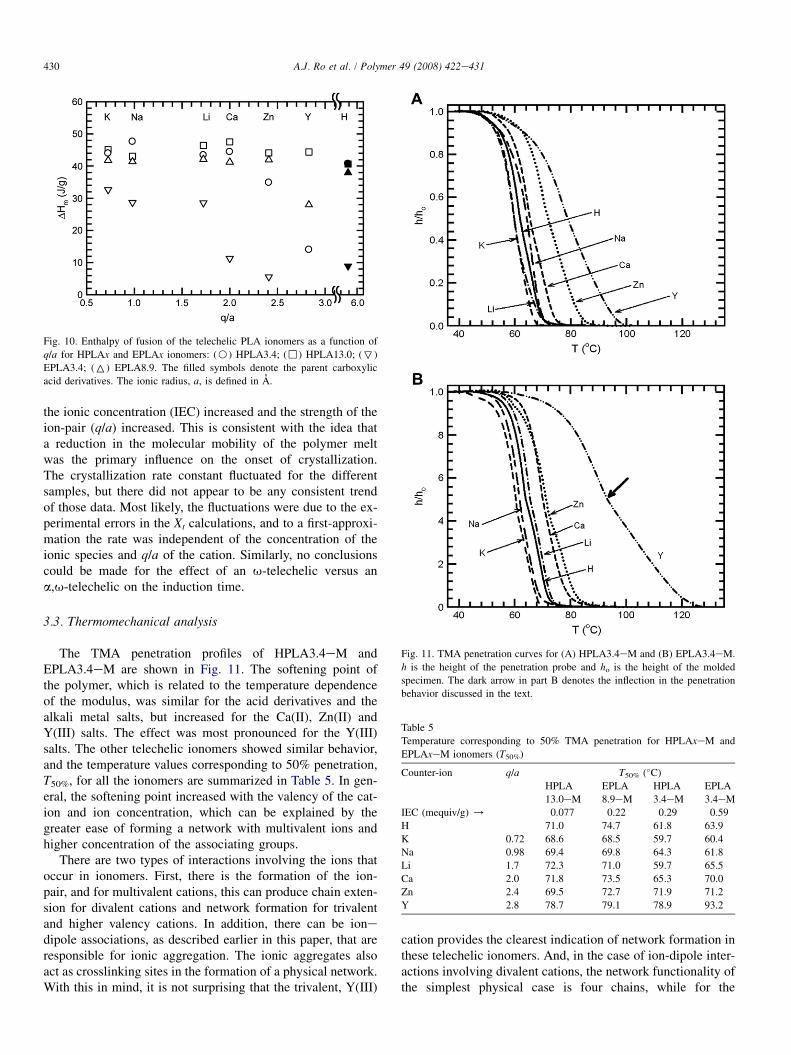
Fig. 10. Enthalpy of fusion of the telechelic PLA ionomers as a function of
q/a for HPLAx and EPLAx ionomers: (B) HPLA3.4; (,) HPLA13.0; (7)
EPLA3.4; (6) EPLA8.9. The filled symbols denote the parent carboxylic
acid derivatives. The ionic radius, a, is defined in A.
430 A.J. Ro et al. / Polymer 49 (2008) 422e431
the ionic concentration (IEC) increased and the strength of theion-pair (q/a) increased. This is consistent with the idea thata reduction in the molecular mobility of the polymer meltwas the primary influence on the onset of crystallization.The crystallization rate constant fluctuated for the differentsamples, but there did not appear to be any consistent trendof those data. Most likely, the fluctuations were due to the ex-perimental errors in the Xt calculations, and to a first-approxi-mation the rate was independent of the concentration of theionic species and q/a of the cation. Similarly, no conclusionscould be made for the effect of an u-telechelic versus ana,u-telechelic on the induction time.
3.3. Thermomechanical analysis
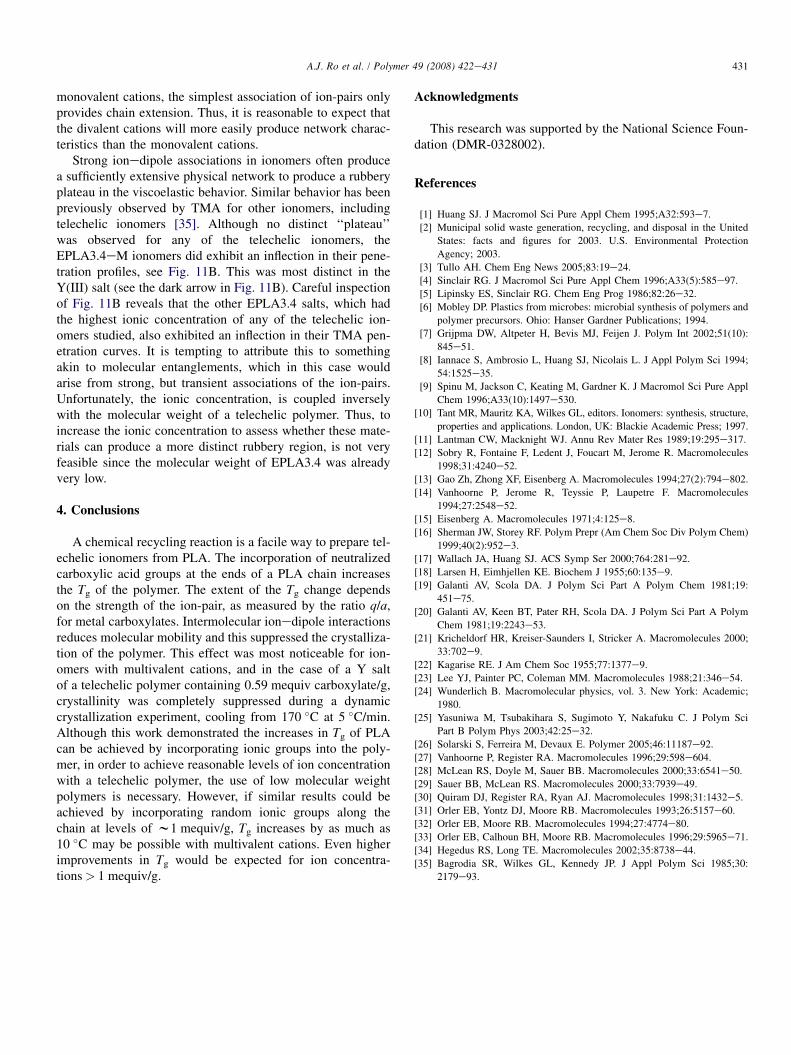
Fig. 11. TMA penetration curves for (A) HPLA3.4eM and (B) EPLA3.4eM.
h is the height of the penetration probe and ho is the height of the molded
specimen. The dark arrow in part B denotes the inflection in the penetration
behavior discussed in the text.
Table 5
Temperature corresponding to 50% TMA penetration for HPLAxeM and
EPLAxeM ionomers (T50%)
Counter-ion q/a T50% (�C)
HPLA
13.0eM
EPLA
8.9eM
HPLA
3.4eM
EPLA
3.4eM
IEC (mequiv/g) / 0.077 0.22 0.29 0.59
H 71.0 74.7 61.8 63.9
K 0.72 68.6 68.5 59.7 60.4
Na 0.98 69.4 69.8 64.3 61.8
Li 1.7 72.3 71.0 59.7 65.5
Ca 2.0 71.8 73.5 65.3 70.0
Zn 2.4 69.5 72.7 71.9 71.2
Y 2.8 78.7 79.1 78.9 93.2
The TMA penetration profiles of HPLA3.4eM andEPLA3.4eM are shown in Fig. 11. The softening point ofthe polymer, which is related to the temperature dependenceof the modulus, was similar for the acid derivatives and thealkali metal salts, but increased for the Ca(II), Zn(II) andY(III) salts. The effect was most pronounced for the Y(III)salts. The other telechelic ionomers showed similar behavior,and the temperature values corresponding to 50% penetration,T50%, for all the ionomers are summarized in Table 5. In gen-eral, the softening point increased with the valency of the cat-ion and ion concentration, which can be explained by thegreater ease of forming a network with multivalent ions andhigher concentration of the associating groups.
There are two types of interactions involving the ions thatoccur in ionomers. First, there is the formation of the ion-pair, and for multivalent cations, this can produce chain exten-sion for divalent cations and network formation for trivalentand higher valency cations. In addition, there can be ionedipole associations, as described earlier in this paper, that areresponsible for ionic aggregation. The ionic aggregates alsoact as crosslinking sites in the formation of a physical network.With this in mind, it is not surprising that the trivalent, Y(III)
cation provides the clearest indication of network formation inthese telechelic ionomers. And, in the case of ion-dipole inter-actions involving divalent cations, the network functionality ofthe simplest physical case is four chains, while for the
431A.J. Ro et al. / Polymer 49 (2008) 422e431
monovalent cations, the simplest association of ion-pairs onlyprovides chain extension. Thus, it is reasonable to expect thatthe divalent cations will more easily produce network charac-teristics than the monovalent cations.
Strong ionedipole associations in ionomers often producea sufficiently extensive physical network to produce a rubberyplateau in the viscoelastic behavior. Similar behavior has beenpreviously observed by TMA for other ionomers, includingtelechelic ionomers [35]. Although no distinct ‘‘plateau’’was observed for any of the telechelic ionomers, theEPLA3.4eM ionomers did exhibit an inflection in their pene-tration profiles, see Fig. 11B. This was most distinct in theY(III) salt (see the dark arrow in Fig. 11B). Careful inspectionof Fig. 11B reveals that the other EPLA3.4 salts, which hadthe highest ionic concentration of any of the telechelic ion-omers studied, also exhibited an inflection in their TMA pen-etration curves. It is tempting to attribute this to somethingakin to molecular entanglements, which in this case wouldarise from strong, but transient associations of the ion-pairs.Unfortunately, the ionic concentration, is coupled inverselywith the molecular weight of a telechelic polymer. Thus, toincrease the ionic concentration to assess whether these mate-rials can produce a more distinct rubbery region, is not veryfeasible since the molecular weight of EPLA3.4 was alreadyvery low.
4. Conclusions
A chemical recycling reaction is a facile way to prepare tel-echelic ionomers from PLA. The incorporation of neutralizedcarboxylic acid groups at the ends of a PLA chain increasesthe Tg of the polymer. The extent of the Tg change dependson the strength of the ion-pair, as measured by the ratio q/a,for metal carboxylates. Intermolecular ionedipole interactionsreduces molecular mobility and this suppressed the crystalliza-tion of the polymer. This effect was most noticeable for ion-omers with multivalent cations, and in the case of a Y saltof a telechelic polymer containing 0.59 mequiv carboxylate/g,crystallinity was completely suppressed during a dynamiccrystallization experiment, cooling from 170 �C at 5 �C/min.Although this work demonstrated the increases in Tg of PLAcan be achieved by incorporating ionic groups into the poly-mer, in order to achieve reasonable levels of ion concentrationwith a telechelic polymer, the use of low molecular weightpolymers is necessary. However, if similar results could beachieved by incorporating random ionic groups along thechain at levels of w1 mequiv/g, Tg increases by as much as10 �C may be possible with multivalent cations. Even higherimprovements in Tg would be expected for ion concentra-tions> 1 mequiv/g.
Acknowledgments
This research was supported by the National Science Foun-dation (DMR-0328002).
References
[1] Huang SJ. J Macromol Sci Pure Appl Chem 1995;A32:593e7.
[2] Municipal solid waste generation, recycling, and disposal in the United
States: facts and figures for 2003. U.S. Environmental Protection
Agency; 2003.
[3] Tullo AH. Chem Eng News 2005;83:19e24.
[4] Sinclair RG. J Macromol Sci Pure Appl Chem 1996;A33(5):585e97.
[5] Lipinsky ES, Sinclair RG. Chem Eng Prog 1986;82:26e32.
[6] Mobley DP. Plastics from microbes: microbial synthesis of polymers and
polymer precursors. Ohio: Hanser Gardner Publications; 1994.
[7] Grijpma DW, Altpeter H, Bevis MJ, Feijen J. Polym Int 2002;51(10):
845e51.
[8] Iannace S, Ambrosio L, Huang SJ, Nicolais L. J Appl Polym Sci 1994;
54:1525e35.
[9] Spinu M, Jackson C, Keating M, Gardner K. J Macromol Sci Pure Appl
Chem 1996;A33(10):1497e530.
[10] Tant MR, Mauritz KA, Wilkes GL, editors. Ionomers: synthesis, structure,
properties and applications. London, UK: Blackie Academic Press; 1997.
[11] Lantman CW, Macknight WJ. Annu Rev Mater Res 1989;19:295e317.
[12] Sobry R, Fontaine F, Ledent J, Foucart M, Jerome R. Macromolecules
1998;31:4240e52.
[13] Gao Zh, Zhong XF, Eisenberg A. Macromolecules 1994;27(2):794e802.
[14] Vanhoorne P, Jerome R, Teyssie P, Laupetre F. Macromolecules
1994;27:2548e52.
[15] Eisenberg A. Macromolecules 1971;4:125e8.
[16] Sherman JW, Storey RF. Polym Prepr (Am Chem Soc Div Polym Chem)
1999;40(2):952e3.
[17] Wallach JA, Huang SJ. ACS Symp Ser 2000;764:281e92.
[18] Larsen H, Eimhjellen KE. Biochem J 1955;60:135e9.
[19] Galanti AV, Scola DA. J Polym Sci Part A Polym Chem 1981;19:
451e75.
[20] Galanti AV, Keen BT, Pater RH, Scola DA. J Polym Sci Part A Polym
Chem 1981;19:2243e53.
[21] Kricheldorf HR, Kreiser-Saunders I, Stricker A. Macromolecules 2000;
33:702e9.
[22] Kagarise RE. J Am Chem Soc 1955;77:1377e9.
[23] Lee YJ, Painter PC, Coleman MM. Macromolecules 1988;21:346e54.
[24] Wunderlich B. Macromolecular physics, vol. 3. New York: Academic;
1980.
[25] Yasuniwa M, Tsubakihara S, Sugimoto Y, Nakafuku C. J Polym Sci
Part B Polym Phys 2003;42:25e32.
[26] Solarski S, Ferreira M, Devaux E. Polymer 2005;46:11187e92.
[27] Vanhoorne P, Register RA. Macromolecules 1996;29:598e604.
[28] McLean RS, Doyle M, Sauer BB. Macromolecules 2000;33:6541e50.
[29] Sauer BB, McLean RS. Macromolecules 2000;33:7939e49.
[30] Quiram DJ, Register RA, Ryan AJ. Macromolecules 1998;31:1432e5.
[31] Orler EB, Yontz DJ, Moore RB. Macromolecules 1993;26:5157e60.
[32] Orler EB, Moore RB. Macromolecules 1994;27:4774e80.
[33] Orler EB, Calhoun BH, Moore RB. Macromolecules 1996;29:5965e71.
[34] Hegedus RS, Long TE. Macromolecules 2002;35:8738e44.
[35] Bagrodia SR, Wilkes GL, Kennedy JP. J Appl Polym Sci 1985;30:
2179e93.