Embed Size (px)
Citation preview
ـــــــــــــــــــــــــــــــــــــــــــــــــــــــــــــــ ـــــــــــــــــــــــــــــــــــــــــــــــــــــــــــــــــــــــــــــــــــــــــــــــــــــــــــــــــــــــــــــ J. Sci. Res. Sci.,Vol.(36), 2019 ــــــــــــــــــــــــــــــــــــــــــــــــــــــــــــــــــــــــــــــــــــــــــــــــــــــــــــــــــــــــــــــــــــــــــــــــــــــــــــــــــــــــ
163
Synthesis and study of electrical properties of Li2O modified P2O5-ZnO-Na2O
glasses
N. F. Osman a
, M. M. Elokr b, L. I. Soliman
c, H. A. Zayed
d
a Physics Department, Modern Academy for Engineering and Technology in Maadi, Cairo, Egypt
b Physics Department, Faculty of Science, Al-Azhar University, Cairo, Egypt
c National Research Center, Dokki, Cairo, Egypt
d Physics Department, Faculty of Women, Ain Shams University, Cairo, Egypt
Abstract
The transparent glasses of composition 40P2O5-20ZnO-(40-x)Na2O-xLi2O have been
prepared using conventional melt quenching technique (where 0 ≤ x ≤ 25 Li2O mol. %). The
amorphous nature of the prepared glass samples is confirmed by x-ray powder diffraction (XRD).
By increasing the Li2O content, the density and oxygen packing density increase while the molar
volume decreases which indicates that the structure is more compact. The differential thermal
analysis (DTA) studies showes that 15 mol.% Li2O glass sample has the highest thermal stability
and the glass transition temperature (Tg) decreases as the content of Li2O increases till 25 mol.%
Li2O . The ac and dc electrical conductivities and dielectric constants of the prepared glass
samples have been investigated. It is found that the dc conductivity increases with the
concentration of Li2O mol.% and the temperature dependence of the dc conductivity at low
temperature (303 – 383 K) and at high temperature (403 – 473 K) obey the Arrhenius law. The
activation energies ΔEdc1 (at high temperatures) and ΔEdc2 (at low temperatures) were determined.
The values of ζdc can be obtained also from the impedance study at different temperatures and
different concentrations using Cole-Cole plot. To determine the conduction mechanism, the ac
conductivity and its frequency exponent (s) have been analyzed by correlated barrier hoping
model (CBH). It is found that s has values between 0.89-0.996; consequently. The correlated
barrier hopping (CBH) seems to be the most interesting model related to the obtained results.
Real and imaginary parts of dielectric constant (ε' and ε'') have been found to decrease with
increasing frequency and temperature and this result would be discussed by means of dielectric
polarization mechanism of material. The maximum value of the maximum barrier height Wm
obtained from Guitini equation was found to increase with increasing of Li2O mol. %.
Key words: phosphate glasses, structure properties, electrical properties.
*Corresponding Author : [email protected]
ـــــــــــــــــــــــــــــــــــــــــــــــــــــــــــــــ ـــــــــــــــــــــــــــــــــــــــــــــــــــــــــــــــــــــــــــــــــــــــــــــــــــــــــــــــــــــــــــــ J. Sci. Res. Sci.,Vol.(36), 2019 ــــــــــــــــــــــــــــــــــــــــــــــــــــــــــــــــــــــــــــــــــــــــــــــــــــــــــــــــــــــــــــــــــــــــــــــــــــــــــــــــــــــــ
164
Introduction
Recently, the synthesis and the study properties of phosphate glasses have attracted much
attention because of their potential technological applications. Phosphate glasses possess a series
of interesting and unique physical properties better than other glasses such as transparency at
room temperature, sufficient strength, hardness, excellent corrosion resistance, low melting
and softening
temperature, high thermal expansion, high electrical conductivity, low glass transition
temperature, ultraviolet and far-infrared transition and other optical characteristics
[Yahia H. Elbashar et al. (2016), R. K. Brow (2000), Samir Y. Marzouk et al
(2009), A. Bhide et al (2007), I. Abrahams et al (2000)]. For laser application
phosphate glasses used as transmitting optical components, as modulators, for photonic
switching and magneto-optic materials [D. D. Ramteke et al (2017)] and have been
considered as a promising group of glasses for optical amplifiers, fibers, etc. [A.V.
Chandrasekhar et al (2003), Nehal Aboulfotoh et al (2014)]. Several studies have
been shown that a chemical durability of phosphate based glasses can be improved by
the addition of various oxides [S. T. Reis et al (2001), D. E. Day et al (1998)]. ZnO
acts as a glass modifier, where Zn2+
occupies interstitial sites in glass network [D.
Carta et al (2009)]. With the addition of ZnO to phosphate glasses, the P―O―P
bonds are replaces by more chemically durable P―O―Zn bond [R. K. Brow et al
(1995)] and also, it is interesting because the ZnO – P2O5 systems show unusual change
in correlation between the structural and optical properties (e.g.: refractive index and
ultraviolet absorption edge) at the metaphosphate composition [P. M. V. Teja et al
(2012)]. Among oxide glasses, sodium and lithium phosphate glasses are well known
due to their variety of technological applications such as solid electrolytes for battery
applications [Paramjyot Komar Jha et al (2015), A. Yamano et al (2014)]. Sodium
phosphate glasses are in a great demand because of their strong glass forming nature,
low crystallization and melting temperature. It is expected that the replacement of Na2O
by Li2O in P2O5-ZnO based glasses exhibit better ionic conductivity due to smaller size
of Li+ (0.76A
o) as compared to Na
+ (1.02A
o). Recently the structural properties of P2O5
– Na2O – Li2O glasses strongly depend on Na2O and Li2O content.
In literature we find that the dc and ac electrical conductivity of P2O5 – ZnO – Na2O –
Li2O glass system have not been studied extensively for this reason, the present work gives the
preparation of 40P2O5-20ZnO-(40-x)Na2O-xLi2O glasses containing varying
concentration of Li2O reaching to 25 mol.% and deals with the dc and ac electrical
conductivity over a wide range of temperature and frequency to determine the possible
conduction mechanisms and to determine the activation energy.
ـــــــــــــــــــــــــــــــــــــــــــــــــــــــــــــــ ـــــــــــــــــــــــــــــــــــــــــــــــــــــــــــــــــــــــــــــــــــــــــــــــــــــــــــــــــــــــــــــ J. Sci. Res. Sci.,Vol.(36), 2019 ــــــــــــــــــــــــــــــــــــــــــــــــــــــــــــــــــــــــــــــــــــــــــــــــــــــــــــــــــــــــــــــــــــــــــــــــــــــــــــــــــــــــ
165
2. Experimental
2.1. Preparation of the glasses
The investigated glasses 40P2O5-20ZnO-(40-x)Na2O-xLi2O (0 ≤ x ≤ 25) were prepared by
the conventional melt quenching technique using high purity analytical grade chemicals
(NH4)2HPO4, ZnO, Na2CO3 and LiCl as the raw material. The appropriate quantity of these
chemicals was weighted and mixed in agate mortar and were hand ground for about one hour.
The weighted batches were heated in an electric furnace at 673K for 1/2 h in porcelain crucibles
to release the ammonia then melted at 1273K for 1 h with intermediate stirring to achieve the
homogeneity of the melt. So, samples of the desired shape were obtained by quenching the melt
at 623K on a stainless steel mold for 2h to eliminate the mechanical and thermal stresses
produced during casting and left to cool to room temperature. The 40P2O5-20ZnO-(40-x)Na2O-
xLi2O glasses varied from 0 to 25 mol. % in steps of 5 mol. %. The prepared glass
samples were polished by silicon carbide water proof abrasive papers of various grades ranging
between 320 and 1000 to achieve a good optical transparency samples.
2.2. X- ray Diffraction measurements (XRD)
The amorphous nature of synthesized glass samples was checked by PANalytical X’Pert
PRO diffractometer using CuKα target of wavelength 1.5406 Ao and scanning rate 2 ⁰/min. XRD
patterns were recorded in 2θ range between 4 ⁰ and 80 ⁰.
2.3. Density measurements
The density (ρ) of the glass samples were determined at room temperature by the standard
Archimedes principle using toluene as an immersion liquid ( = 0.86455 gm. /cm3). The density
was obtained from the relation,
ρ = [Wa / (Wa –Wb)] . , (1)
Where, Wa is the weight of the glass sample in air, Wb is the weight of the glass sample when
immersed in toluene. The relative error in these measurements was about 1 mg/cm3. Also, the
molar volume (VM) and the oxygen packing density (OPD) of the glass samples were calculated
by using the molecular weight (M) and density (ρ) according to the following relations.
VM = M / ρ (2),
and OPD = 1000 . (ρ / M) . n (3)
Where, n is the no. of oxygen atoms per formula unit.
ـــــــــــــــــــــــــــــــــــــــــــــــــــــــــــــــ ـــــــــــــــــــــــــــــــــــــــــــــــــــــــــــــــــــــــــــــــــــــــــــــــــــــــــــــــــــــــــــــ J. Sci. Res. Sci.,Vol.(36), 2019 ــــــــــــــــــــــــــــــــــــــــــــــــــــــــــــــــــــــــــــــــــــــــــــــــــــــــــــــــــــــــــــــــــــــــــــــــــــــــــــــــــــــــ
166
2.4. Differential Thermal Analysis (DTA)
The glass transition temperature (Tg) and the crystallization temperature (TC), were
evaluated for all the glass samples by using SDT Q600 V20.9 and scanned at a heating rate 10
K/min.
2.5. Electrical measurements
The prepared samples of the 40P2O5-20ZnO-(40-x)Na2O-xLi2O glasses were coated with
silver paint on both sides for dc and ac electrical conductivity measurements and using a special
designed holder.
The dc and ac electrical conductivity ζ for the prepared samples was carried out in the
temperature range (303 - 473 K). The sample temperature was measured and controlled by using
a calibrated Chromel-Alumel thermocouple connected to (TCN4M-24R Aulonics-Korea)
temperature controller. For ac electrical conductivity measurements a programmable automatic
LCR bridge (Hioki, 3532-50) was used in a wide frequency range (50 Hz to 5 MHz).
3. Results and Discussion
3.1. X- ray Diffraction measurements (XRD)
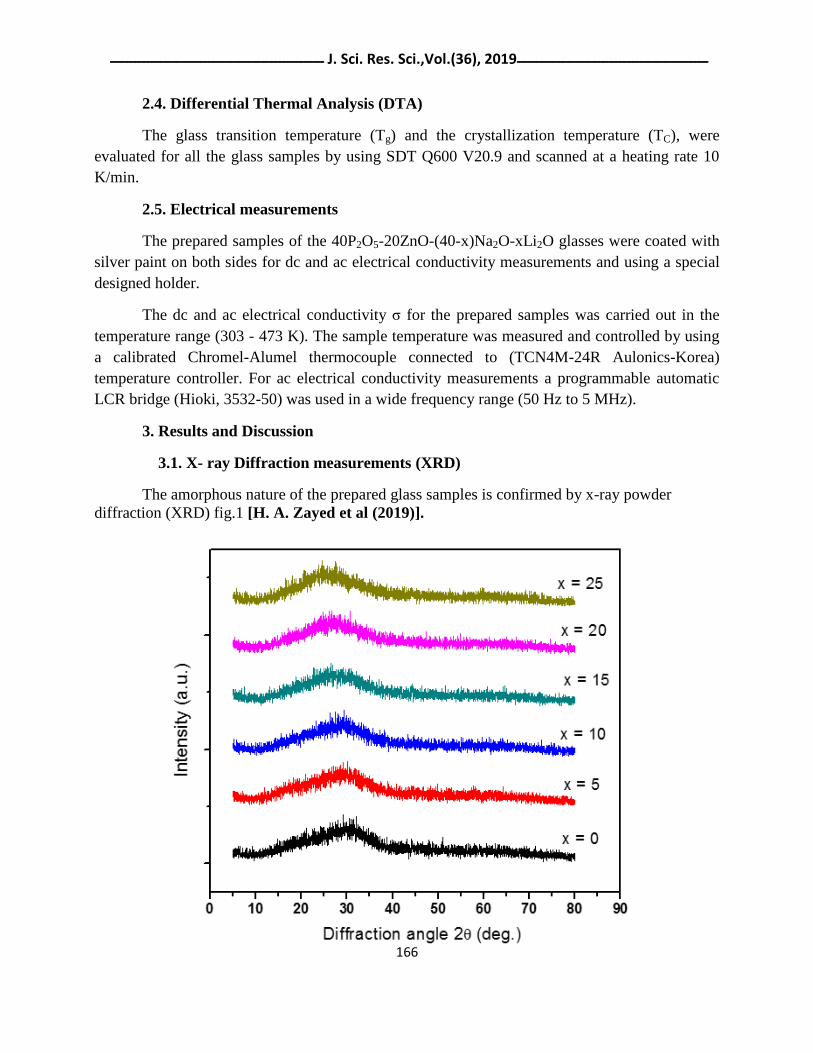
The amorphous nature of the prepared glass samples is confirmed by x-ray powder
diffraction (XRD) fig.1 [H. A. Zayed et al (2019)].
ـــــــــــــــــــــــــــــــــــــــــــــــــــــــــــــــ ـــــــــــــــــــــــــــــــــــــــــــــــــــــــــــــــــــــــــــــــــــــــــــــــــــــــــــــــــــــــــــــ J. Sci. Res. Sci.,Vol.(36), 2019 ــــــــــــــــــــــــــــــــــــــــــــــــــــــــــــــــــــــــــــــــــــــــــــــــــــــــــــــــــــــــــــــــــــــــــــــــــــــــــــــــــــــــ
167
Fig.1: XRD patterns of the 40P2O5-20ZnO-(40-x)Na2O-xLi2O glasses with different
concentrations of Li2O mol.%.
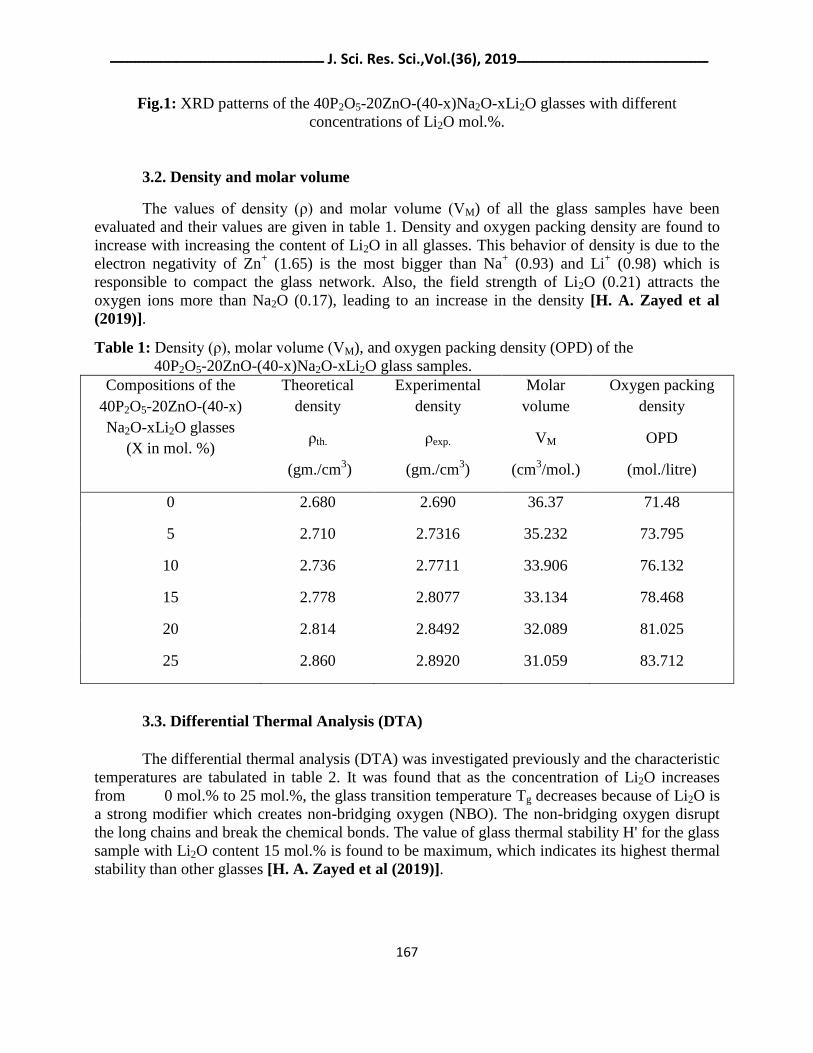
3.2. Density and molar volume
The values of density (ρ) and molar volume (VM) of all the glass samples have been
evaluated and their values are given in table 1. Density and oxygen packing density are found to
increase with increasing the content of Li2O in all glasses. This behavior of density is due to the
electron negativity of Zn+ (1.65) is the most bigger than Na
+ (0.93) and Li
+ (0.98) which is
responsible to compact the glass network. Also, the field strength of Li2O (0.21) attracts the
oxygen ions more than Na2O (0.17), leading to an increase in the density [H. A. Zayed et al
(2019)].
Table 1: Density (ρ), molar volume (VM), and oxygen packing density (OPD) of the
40P2O5-20ZnO-(40-x)Na2O-xLi2O glass samples.
Compositions of the
40P2O5-20ZnO-(40-x)
Na2O-xLi2O glasses
(X in mol. %)
Theoretical
density
ρth.
(gm./cm3)
Experimental
density
ρexp.
(gm./cm3)
Molar
volume
VM
(cm3/mol.)
Oxygen packing
density
OPD
(mol./litre)
0 2.680 2.690 36.37 71.48
5 2.710 2.7316 35.232 73.795
10 2.736 2.7711 33.906 76.132
15 2.778 2.8077 33.134 78.468
20 2.814 2.8492 32.089 81.025
25 2.860 2.8920 31.059 83.712
3.3. Differential Thermal Analysis (DTA)
The differential thermal analysis (DTA) was investigated previously and the characteristic
temperatures are tabulated in table 2. It was found that as the concentration of Li2O increases
from 0 mol.% to 25 mol.%, the glass transition temperature Tg decreases because of Li2O is
a strong modifier which creates non-bridging oxygen (NBO). The non-bridging oxygen disrupt
the long chains and break the chemical bonds. The value of glass thermal stability H' for the glass
sample with Li2O content 15 mol.% is found to be maximum, which indicates its highest thermal
stability than other glasses [H. A. Zayed et al (2019)].
ـــــــــــــــــــــــــــــــــــــــــــــــــــــــــــــــ ـــــــــــــــــــــــــــــــــــــــــــــــــــــــــــــــــــــــــــــــــــــــــــــــــــــــــــــــــــــــــــــ J. Sci. Res. Sci.,Vol.(36), 2019 ــــــــــــــــــــــــــــــــــــــــــــــــــــــــــــــــــــــــــــــــــــــــــــــــــــــــــــــــــــــــــــــــــــــــــــــــــــــــــــــــــــــــ
168
Table 2: Thermal constants observed from DTA for the 40P2O5-20ZnO-(40-x) Na2O-xLi2O glass
samples.
Glass sample
(X in mol. %)
Glass transition temp.
Tg(K)
Crystallization temp.
TC(K)
Glass thermal stability
H' = ΔT / Tg
0 558.08 623.01 0.116
5 551.15 617.1 0.120
10 548.02 616.1 0.124
15 545.6 615.6 0.128
20 545.5 614.6 0.126
25 546.7 615.2 0.125
3.4. Electrical conductivity
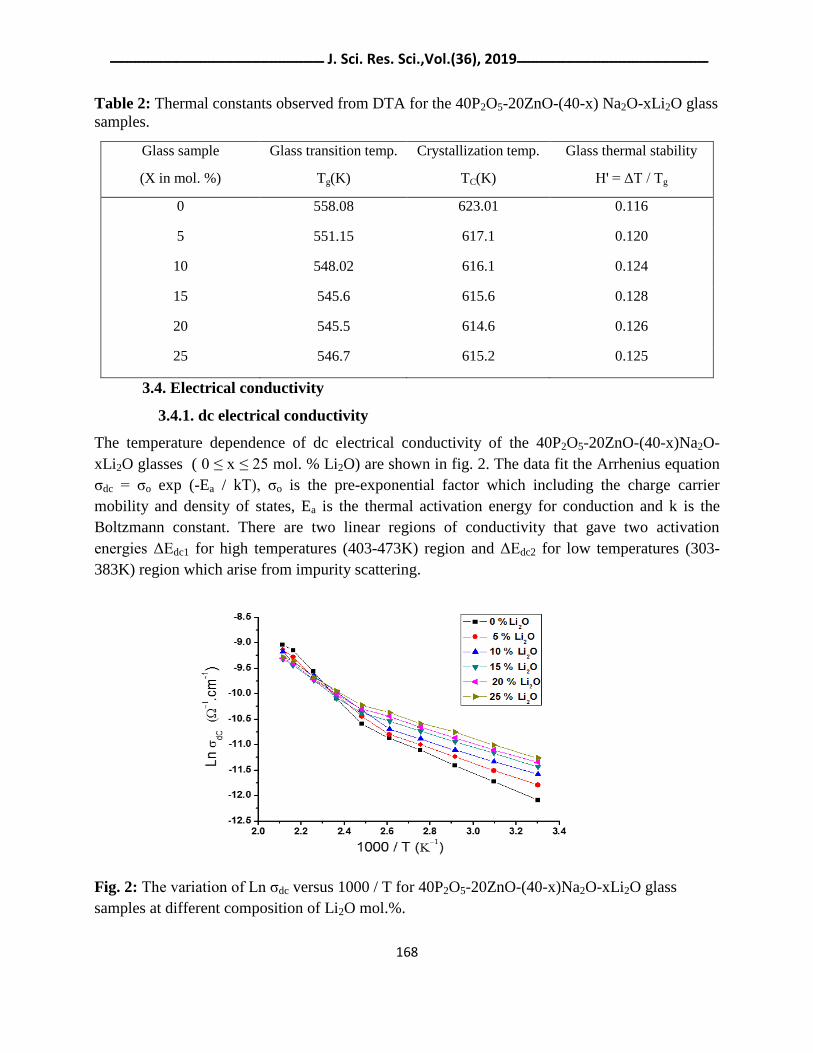
3.4.1. dc electrical conductivity
The temperature dependence of dc electrical conductivity of the 40P2O5-20ZnO-(40-x)Na2O-
xLi2O glasses ( 0 ≤ x ≤ 25 mol. % Li2O) are shown in fig. 2. The data fit the Arrhenius equation
ζdc = ζo exp (-Ea / kT), ζo is the pre-exponential factor which including the charge carrier
mobility and density of states, Ea is the thermal activation energy for conduction and k is the
Boltzmann constant. There are two linear regions of conductivity that gave two activation
energies ΔEdc1 for high temperatures (403-473K) region and ΔEdc2 for low temperatures (303-
383K) region which arise from impurity scattering.
Fig. 2: The variation of Ln ζdc versus 1000 / T for 40P2O5-20ZnO-(40-x)Na2O-xLi2O glass
samples at different composition of Li2O mol.%.
ـــــــــــــــــــــــــــــــــــــــــــــــــــــــــــــــ ـــــــــــــــــــــــــــــــــــــــــــــــــــــــــــــــــــــــــــــــــــــــــــــــــــــــــــــــــــــــــــــ J. Sci. Res. Sci.,Vol.(36), 2019 ــــــــــــــــــــــــــــــــــــــــــــــــــــــــــــــــــــــــــــــــــــــــــــــــــــــــــــــــــــــــــــــــــــــــــــــــــــــــــــــــــــــــ
169
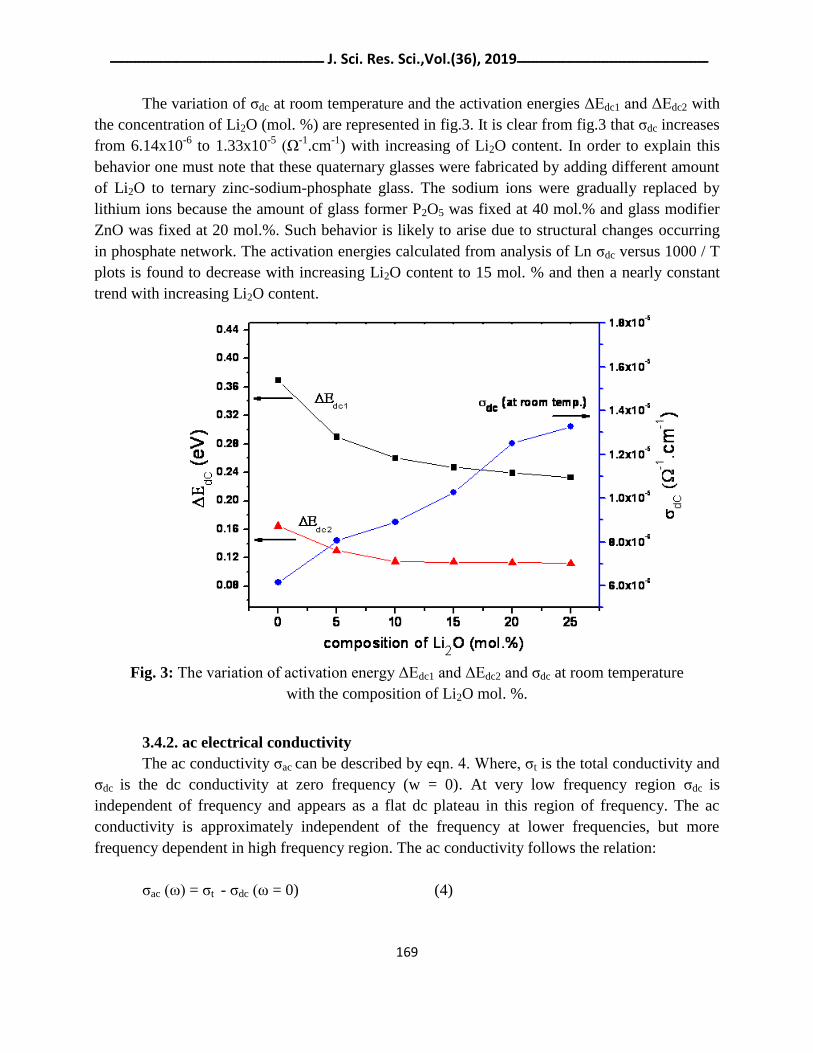
The variation of ζdc at room temperature and the activation energies ΔEdc1 and ΔEdc2 with
the concentration of Li2O (mol. %) are represented in fig.3. It is clear from fig.3 that ζdc increases
from 6.14x10⁻⁶
to 1.33x10⁻⁵
(Ω-1
.cm-1
) with increasing of Li2O content. In order to explain this
behavior one must note that these quaternary glasses were fabricated by adding different amount
of Li2O to ternary zinc-sodium-phosphate glass. The sodium ions were gradually replaced by
lithium ions because the amount of glass former P2O5 was fixed at 40 mol.% and glass modifier
ZnO was fixed at 20 mol.%. Such behavior is likely to arise due to structural changes occurring
in phosphate network. The activation energies calculated from analysis of Ln ζdc versus 1000 / T
plots is found to decrease with increasing Li2O content to 15 mol. % and then a nearly constant
trend with increasing Li2O content.
Fig. 3: The variation of activation energy ΔEdc1 and ΔEdc2 and ζdc at room temperature
with the composition of Li2O mol. %.
3.4.2. ac electrical conductivity
The ac conductivity ζac can be described by eqn. 4. Where, ζt is the total conductivity and
ζdc is the dc conductivity at zero frequency (w = 0). At very low frequency region ζdc is
independent of frequency and appears as a flat dc plateau in this region of frequency. The ac
conductivity is approximately independent of the frequency at lower frequencies, but more
frequency dependent in high frequency region. The ac conductivity follows the relation:
ζac (ω) = ζt - ζdc (ω = 0) (4)
ـــــــــــــــــــــــــــــــــــــــــــــــــــــــــــــــ ـــــــــــــــــــــــــــــــــــــــــــــــــــــــــــــــــــــــــــــــــــــــــــــــــــــــــــــــــــــــــــــ J. Sci. Res. Sci.,Vol.(36), 2019 ــــــــــــــــــــــــــــــــــــــــــــــــــــــــــــــــــــــــــــــــــــــــــــــــــــــــــــــــــــــــــــــــــــــــــــــــــــــــــــــــــــــــ
170
In this relation, the dc conductivity is taken to represent the ac conductivity at ω tends to zero.
The ac conductivity has been analyzed used Almond-West type power law with single exponent
[D. P. Almond et al. (1984)].
ζac = A . ωs (5)
Where A is a temperature dependent constant, ω = 2πf is the angular frequency and s is the
frequency exponent which depend on temperature. Such a dependence on temperature determines
the ac conduction mechanism and has been found to be material dependent.
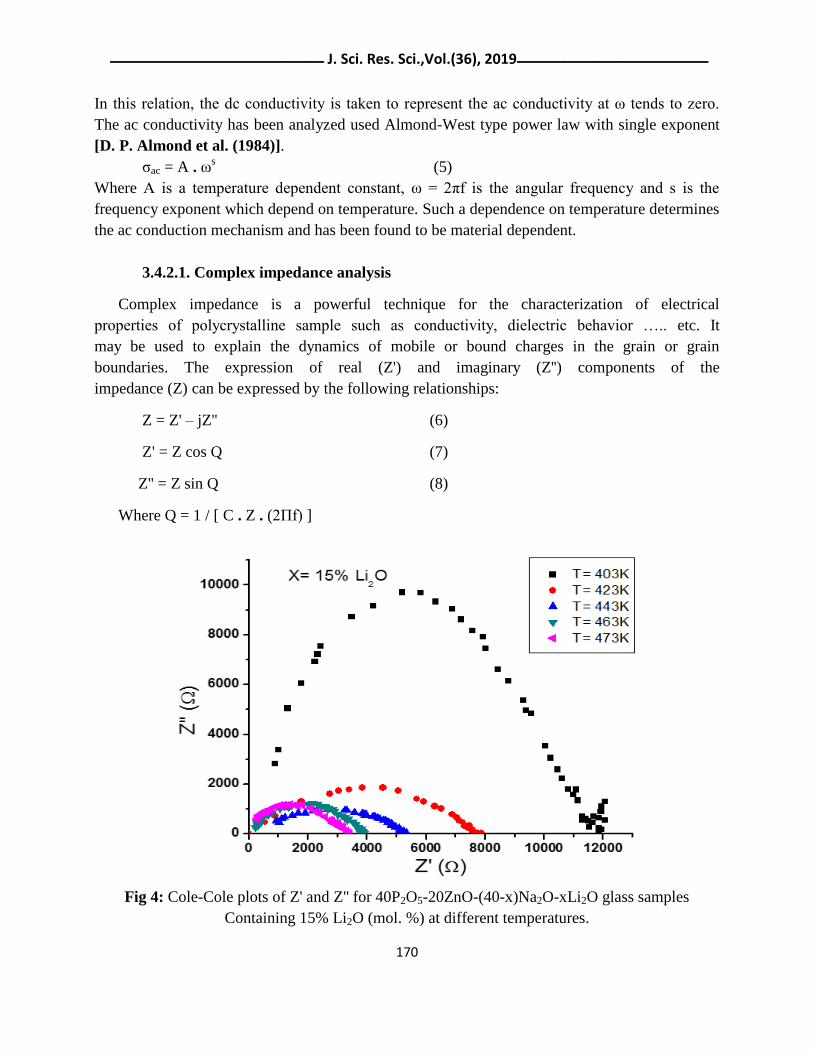
3.4.2.1. Complex impedance analysis
Complex impedance is a powerful technique for the characterization of electrical
properties of polycrystalline sample such as conductivity, dielectric behavior ….. etc. It
may be used to explain the dynamics of mobile or bound charges in the grain or grain
boundaries. The expression of real (Z') and imaginary (Z'') components of the
impedance (Z) can be expressed by the following relationships:
Z = Z' – jZ'' (6)
Z' = Z cos Q (7)
Z'' = Z sin Q (8)
Where Q = 1 / [ C . Z . (2Πf) ]
Fig 4: Cole-Cole plots of Z' and Z'' for 40P2O5-20ZnO-(40-x)Na2O-xLi2O glass samples
Containing 15% Li2O (mol. %) at different temperatures.
ـــــــــــــــــــــــــــــــــــــــــــــــــــــــــــــــ ـــــــــــــــــــــــــــــــــــــــــــــــــــــــــــــــــــــــــــــــــــــــــــــــــــــــــــــــــــــــــــــ J. Sci. Res. Sci.,Vol.(36), 2019 ــــــــــــــــــــــــــــــــــــــــــــــــــــــــــــــــــــــــــــــــــــــــــــــــــــــــــــــــــــــــــــــــــــــــــــــــــــــــــــــــــــــــ
171
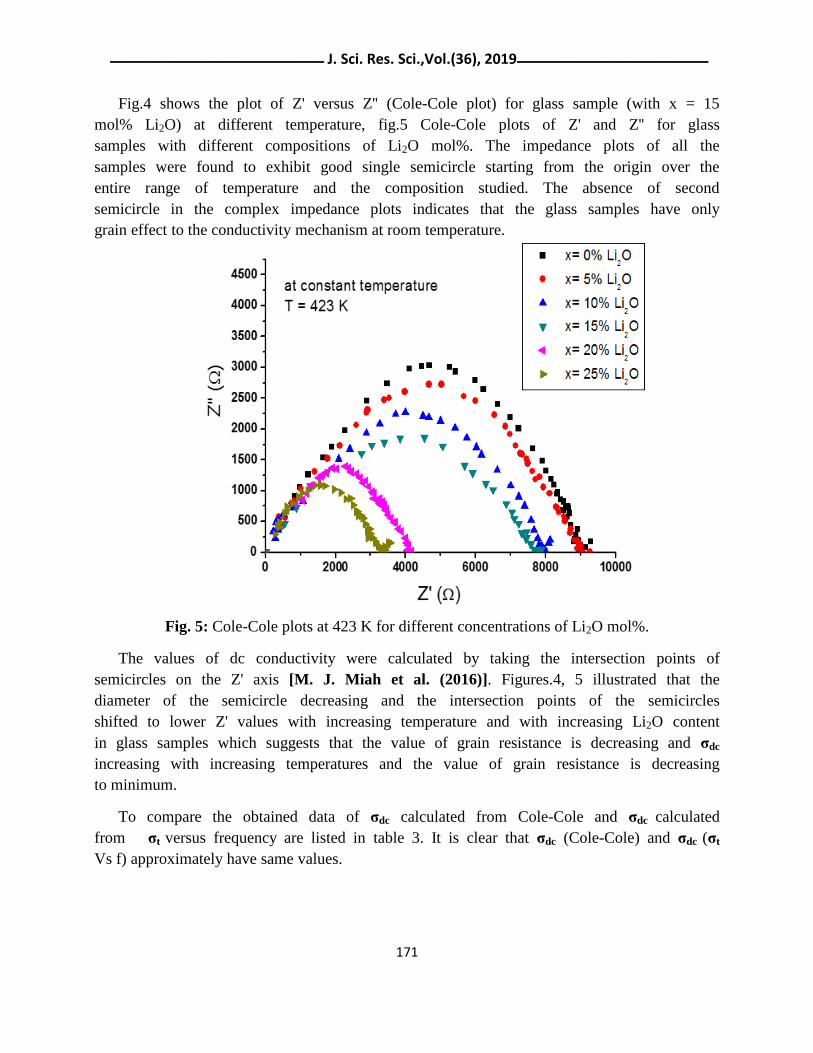
Fig.4 shows the plot of Z' versus Z'' (Cole-Cole plot) for glass sample (with x = 15
mol% Li2O) at different temperature, fig.5 Cole-Cole plots of Z' and Z'' for glass
samples with different compositions of Li2O mol%. The impedance plots of all the
samples were found to exhibit good single semicircle starting from the origin over the
entire range of temperature and the composition studied. The absence of second
semicircle in the complex impedance plots indicates that the glass samples have only
grain effect to the conductivity mechanism at room temperature.
Fig. 5: Cole-Cole plots at 423 K for different concentrations of Li2O mol%.
The values of dc conductivity were calculated by taking the intersection points of
semicircles on the Z' axis [M. J. Miah et al. (2016)]. Figures.4, 5 illustrated that the
diameter of the semicircle decreasing and the intersection points of the semicircles
shifted to lower Z' values with increasing temperature and with increasing Li2O content
in glass samples which suggests that the value of grain resistance is decreasing and σdc
increasing with increasing temperatures and the value of grain resistance is decreasing
to minimum.
To compare the obtained data of σdc calculated from Cole-Cole and σdc calculated
from σt versus frequency are listed in table 3. It is clear that σdc (Cole-Cole) and σdc (σt
Vs f) approximately have same values.
ـــــــــــــــــــــــــــــــــــــــــــــــــــــــــــــــ ـــــــــــــــــــــــــــــــــــــــــــــــــــــــــــــــــــــــــــــــــــــــــــــــــــــــــــــــــــــــــــــ J. Sci. Res. Sci.,Vol.(36), 2019 ــــــــــــــــــــــــــــــــــــــــــــــــــــــــــــــــــــــــــــــــــــــــــــــــــــــــــــــــــــــــــــــــــــــــــــــــــــــــــــــــــــــــ
172
Table 3: values of ζdc (Cole-Cole) and ζdc (ζt Vs f) at different temperatures (for constant
concentration
15% Li2O mol. %).
T(k) σdc (Cole-Cole) σdc (σt Vs f)
403 2.83 * 10-5
3.136 * 10-5
423 4.17 * 10-5
4.190 * 10-5
443 6.41 * 10-5
6.706 * 10-5
463 8.43 * 10-5
8.524 * 10-5
373 9.73 * 10-5
9.708 * 10-5
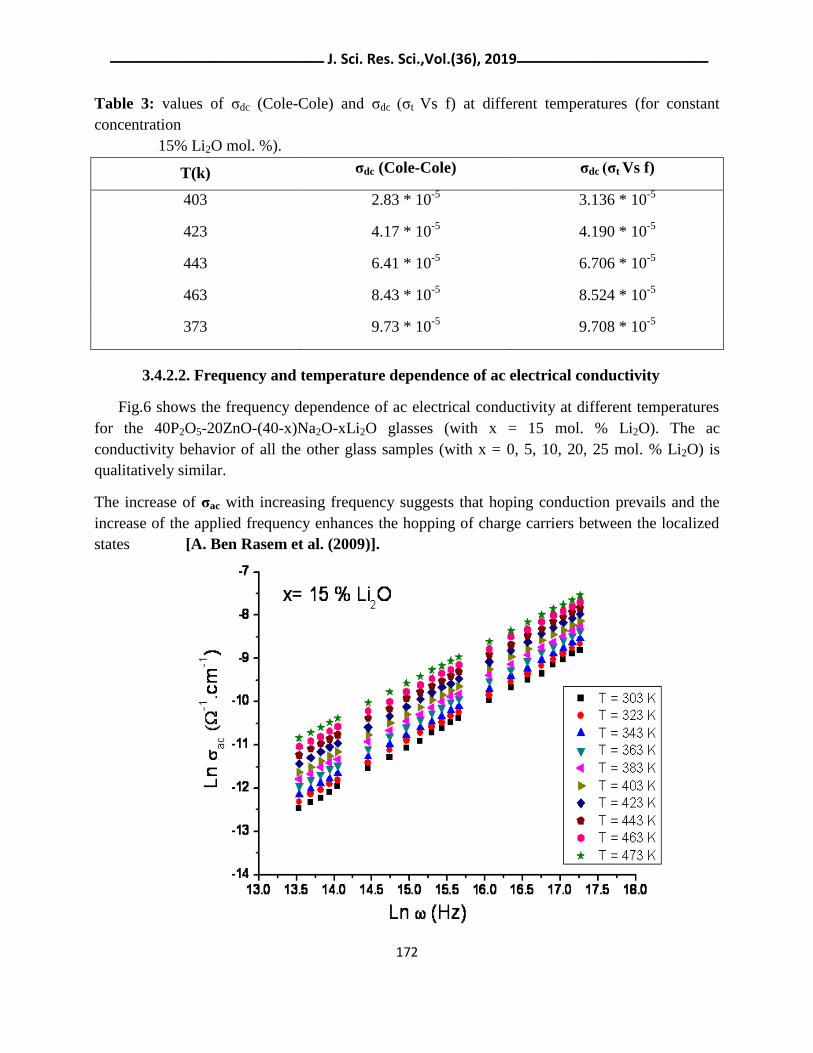
3.4.2.2. Frequency and temperature dependence of ac electrical conductivity
Fig.6 shows the frequency dependence of ac electrical conductivity at different temperatures
for the 40P2O5-20ZnO-(40-x)Na2O-xLi2O glasses (with x = 15 mol. % Li2O). The ac
conductivity behavior of all the other glass samples (with x = 0, 5, 10, 20, 25 mol. % Li2O) is
qualitatively similar.
The increase of σac with increasing frequency suggests that hoping conduction prevails and the
increase of the applied frequency enhances the hopping of charge carriers between the localized
states [A. Ben Rasem et al. (2009)].
ـــــــــــــــــــــــــــــــــــــــــــــــــــــــــــــــ ـــــــــــــــــــــــــــــــــــــــــــــــــــــــــــــــــــــــــــــــــــــــــــــــــــــــــــــــــــــــــــــ J. Sci. Res. Sci.,Vol.(36), 2019 ــــــــــــــــــــــــــــــــــــــــــــــــــــــــــــــــــــــــــــــــــــــــــــــــــــــــــــــــــــــــــــــــــــــــــــــــــــــــــــــــــــــــ
173
Fig.6: Frequency dependence of ζdc for 40P2O5-20ZnO-(40-x)Na2O-xLi2O glasses containing
15 mol% Li2O at different temperatures.
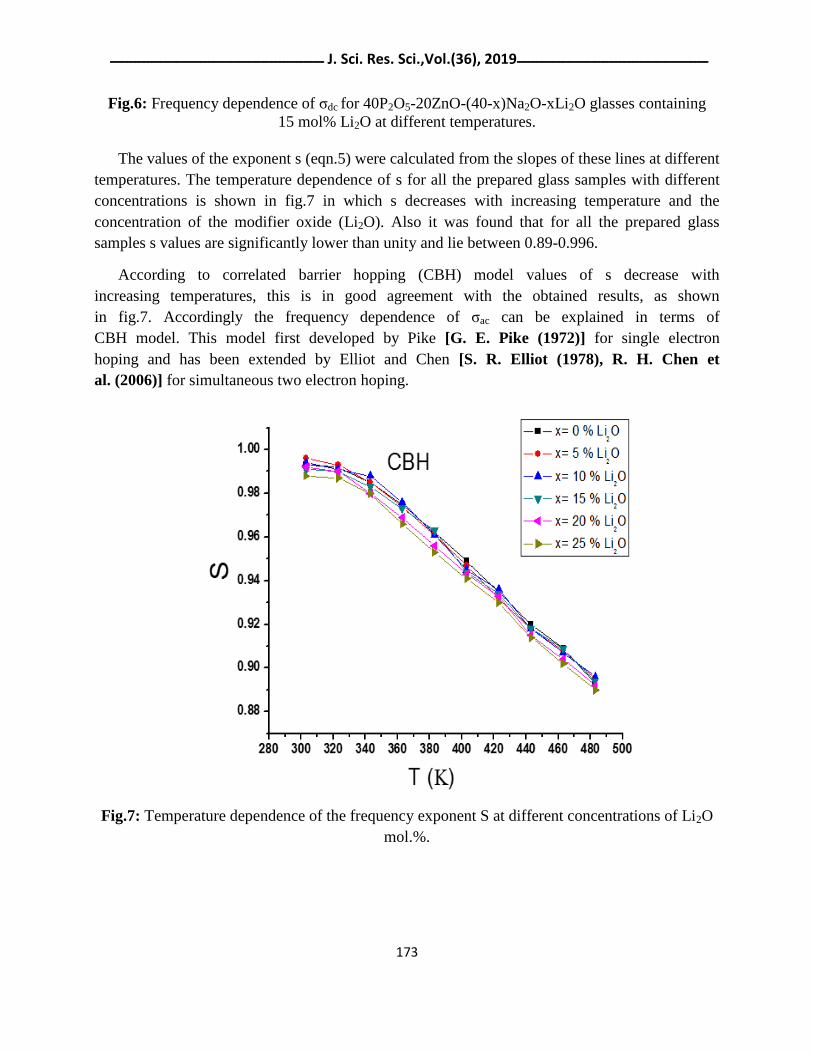
The values of the exponent s (eqn.5) were calculated from the slopes of these lines at different
temperatures. The temperature dependence of s for all the prepared glass samples with different
concentrations is shown in fig.7 in which s decreases with increasing temperature and the
concentration of the modifier oxide (Li2O). Also it was found that for all the prepared glass
samples s values are significantly lower than unity and lie between 0.89-0.996.
According to correlated barrier hopping (CBH) model values of s decrease with
increasing temperatures, this is in good agreement with the obtained results, as shown
in fig.7. Accordingly the frequency dependence of ζac can be explained in terms of
CBH model. This model first developed by Pike [G. E. Pike (1972)] for single electron
hoping and has been extended by Elliot and Chen [S. R. Elliot (1978), R. H. Chen et
al. (2006)] for simultaneous two electron hoping.
Fig.7: Temperature dependence of the frequency exponent S at different concentrations of Li2O
mol.%.
ـــــــــــــــــــــــــــــــــــــــــــــــــــــــــــــــ ـــــــــــــــــــــــــــــــــــــــــــــــــــــــــــــــــــــــــــــــــــــــــــــــــــــــــــــــــــــــــــــ J. Sci. Res. Sci.,Vol.(36), 2019 ــــــــــــــــــــــــــــــــــــــــــــــــــــــــــــــــــــــــــــــــــــــــــــــــــــــــــــــــــــــــــــــــــــــــــــــــــــــــــــــــــــــــ
174
2.0 2.2 2.4 2.6 2.8 3.0 3.2 3.4
-13
-12
-11
-10
-9
-8
-7
-6
-5 f = 120 KHz
f = 200 KHz
f = 600 KHz
f = 1 MHz
f = 2 MHz
f = 3 MHz
f = 4 MHz
f = 5 MHz
x= 15 % Li2O
1000 / T (K -1)
ln
ac
.c
m-1)
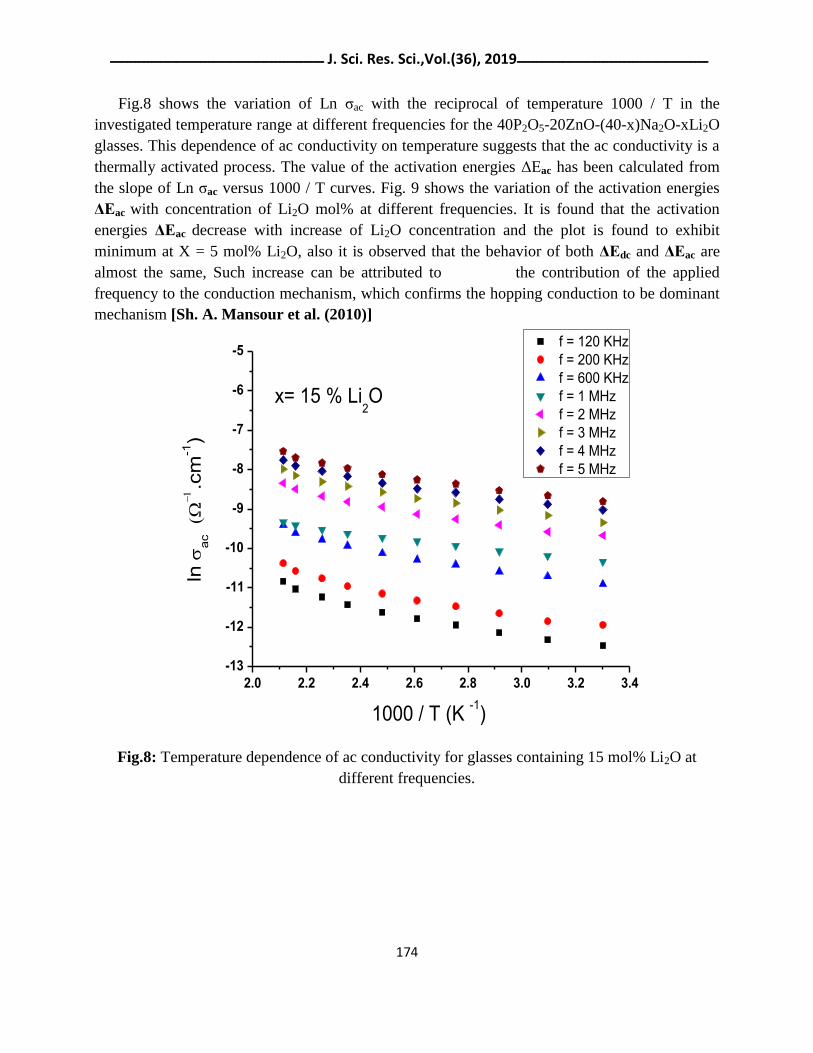
Fig.8 shows the variation of Ln ζac with the reciprocal of temperature 1000 / T in the
investigated temperature range at different frequencies for the 40P2O5-20ZnO-(40-x)Na2O-xLi2O
glasses. This dependence of ac conductivity on temperature suggests that the ac conductivity is a
thermally activated process. The value of the activation energies ΔEac has been calculated from
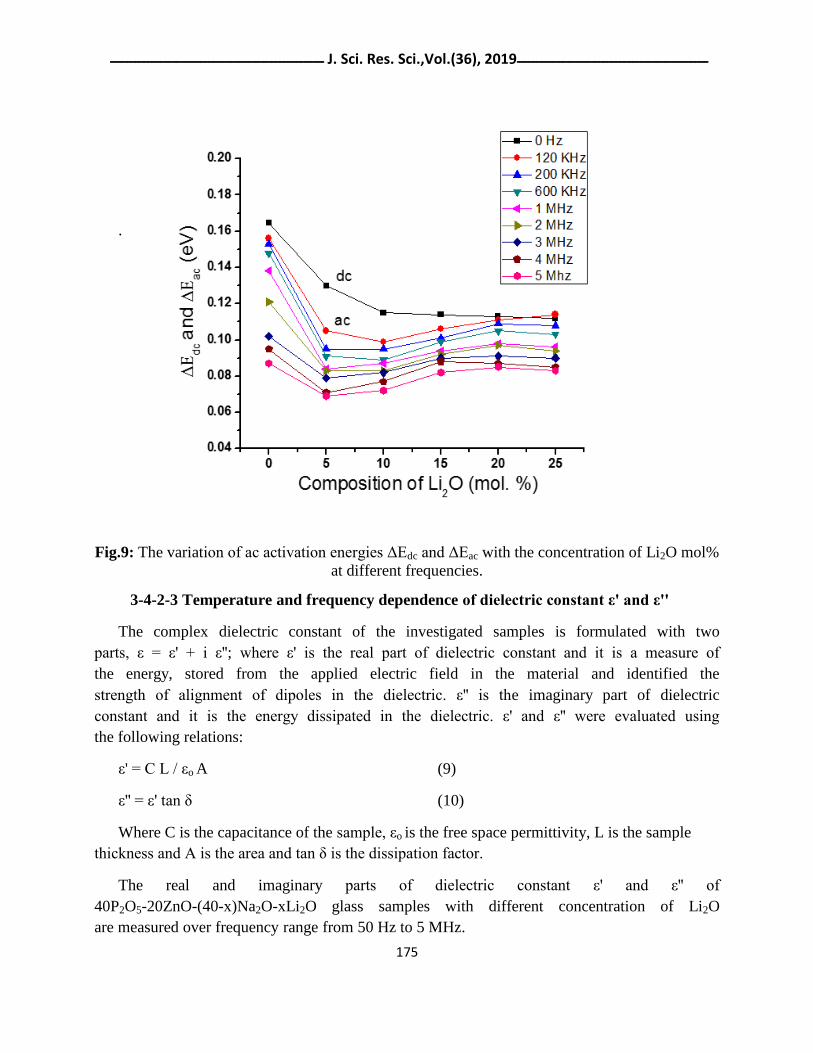
the slope of Ln ζac versus 1000 / T curves. Fig. 9 shows the variation of the activation energies
ΔEac with concentration of Li2O mol% at different frequencies. It is found that the activation
energies ΔEac decrease with increase of Li2O concentration and the plot is found to exhibit
minimum at X = 5 mol% Li2O, also it is observed that the behavior of both ΔEdc and ΔEac are
almost the same, Such increase can be attributed to the contribution of the applied
frequency to the conduction mechanism, which confirms the hopping conduction to be dominant
mechanism [Sh. A. Mansour et al. (2010)]
Fig.8: Temperature dependence of ac conductivity for glasses containing 15 mol% Li2O at
different frequencies.
ـــــــــــــــــــــــــــــــــــــــــــــــــــــــــــــــ ـــــــــــــــــــــــــــــــــــــــــــــــــــــــــــــــــــــــــــــــــــــــــــــــــــــــــــــــــــــــــــــ J. Sci. Res. Sci.,Vol.(36), 2019 ــــــــــــــــــــــــــــــــــــــــــــــــــــــــــــــــــــــــــــــــــــــــــــــــــــــــــــــــــــــــــــــــــــــــــــــــــــــــــــــــــــــــ
175
.
Fig.9: The variation of ac activation energies ΔEdc and ΔEac with the concentration of Li2O mol%
at different frequencies.
3-4-2-3 Temperature and frequency dependence of dielectric constant ε' and ε''
The complex dielectric constant of the investigated samples is formulated with two
parts, ε = ε' + i ε''; where ε' is the real part of dielectric constant and it is a measure of
the energy, stored from the applied electric field in the material and identified the
strength of alignment of dipoles in the dielectric. ε'' is the imaginary part of dielectric
constant and it is the energy dissipated in the dielectric. ε' and ε'' were evaluated using
the following relations:
ε' = C L / εo A (9)
ε'' = ε' tan δ (10)
Where C is the capacitance of the sample, εo is the free space permittivity, L is the sample
thickness and A is the area and tan δ is the dissipation factor.
The real and imaginary parts of dielectric constant ε' and ε'' of
40P2O5-20ZnO-(40-x)Na2O-xLi2O glass samples with different concentration of Li2O
are measured over frequency range from 50 Hz to 5 MHz.
ـــــــــــــــــــــــــــــــــــــــــــــــــــــــــــــــ ـــــــــــــــــــــــــــــــــــــــــــــــــــــــــــــــــــــــــــــــــــــــــــــــــــــــــــــــــــــــــــــ J. Sci. Res. Sci.,Vol.(36), 2019 ــــــــــــــــــــــــــــــــــــــــــــــــــــــــــــــــــــــــــــــــــــــــــــــــــــــــــــــــــــــــــــــــــــــــــــــــــــــــــــــــــــــــ
176
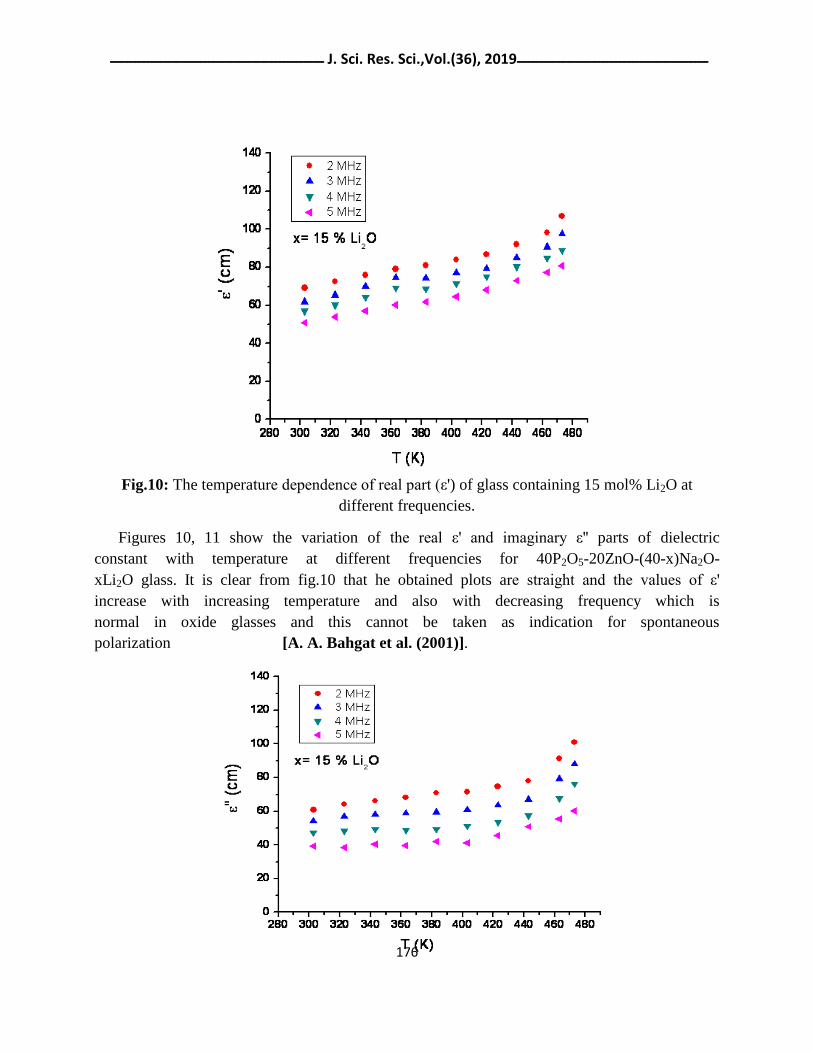
Fig.10: The temperature dependence of real part (ε') of glass containing 15 mol% Li2O at
different frequencies.
Figures 10, 11 show the variation of the real ε' and imaginary ε'' parts of dielectric
constant with temperature at different frequencies for 40P2O5-20ZnO-(40-x)Na2O-
xLi2O glass. It is clear from fig.10 that he obtained plots are straight and the values of ε'
increase with increasing temperature and also with decreasing frequency which is
normal in oxide glasses and this cannot be taken as indication for spontaneous
polarization [A. A. Bahgat et al. (2001)].
ـــــــــــــــــــــــــــــــــــــــــــــــــــــــــــــــ ـــــــــــــــــــــــــــــــــــــــــــــــــــــــــــــــــــــــــــــــــــــــــــــــــــــــــــــــــــــــــــــ J. Sci. Res. Sci.,Vol.(36), 2019 ــــــــــــــــــــــــــــــــــــــــــــــــــــــــــــــــــــــــــــــــــــــــــــــــــــــــــــــــــــــــــــــــــــــــــــــــــــــــــــــــــــــــ
177
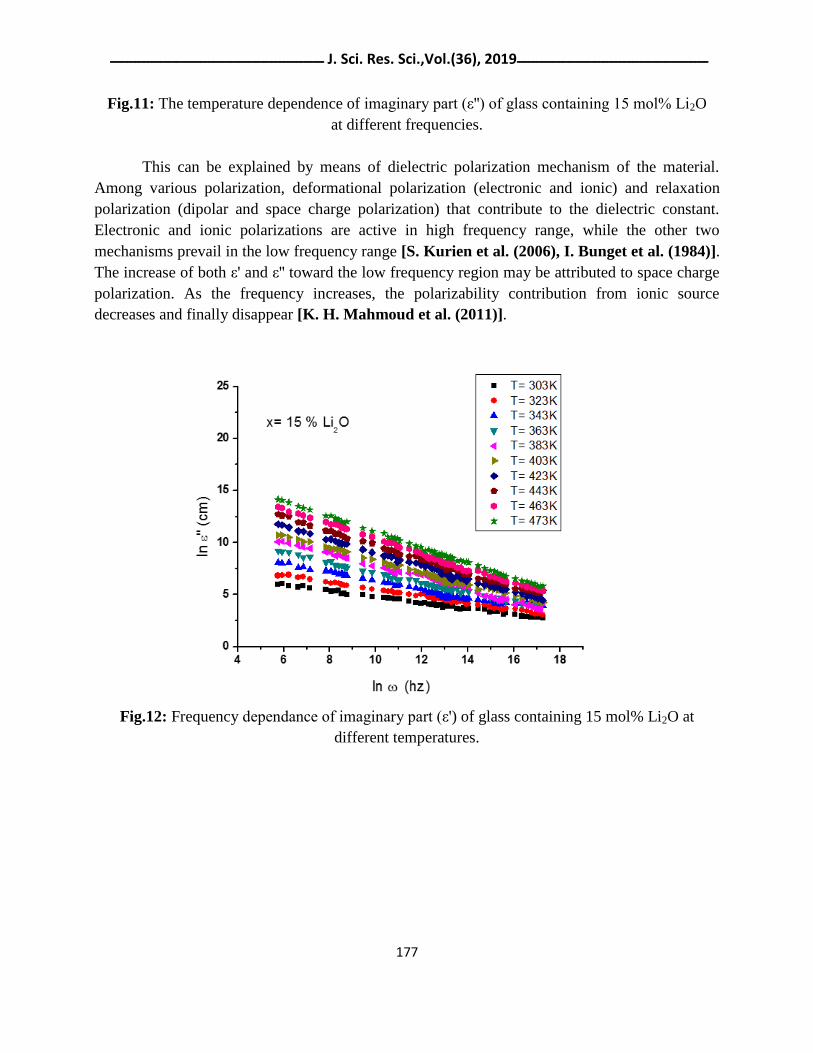
Fig.11: The temperature dependence of imaginary part (ε'') of glass containing 15 mol% Li2O
at different frequencies.
This can be explained by means of dielectric polarization mechanism of the material.
Among various polarization, deformational polarization (electronic and ionic) and relaxation
polarization (dipolar and space charge polarization) that contribute to the dielectric constant.
Electronic and ionic polarizations are active in high frequency range, while the other two
mechanisms prevail in the low frequency range [S. Kurien et al. (2006), I. Bunget et al. (1984)].
The increase of both ε' and ε'' toward the low frequency region may be attributed to space charge
polarization. As the frequency increases, the polarizability contribution from ionic source
decreases and finally disappear [K. H. Mahmoud et al. (2011)].
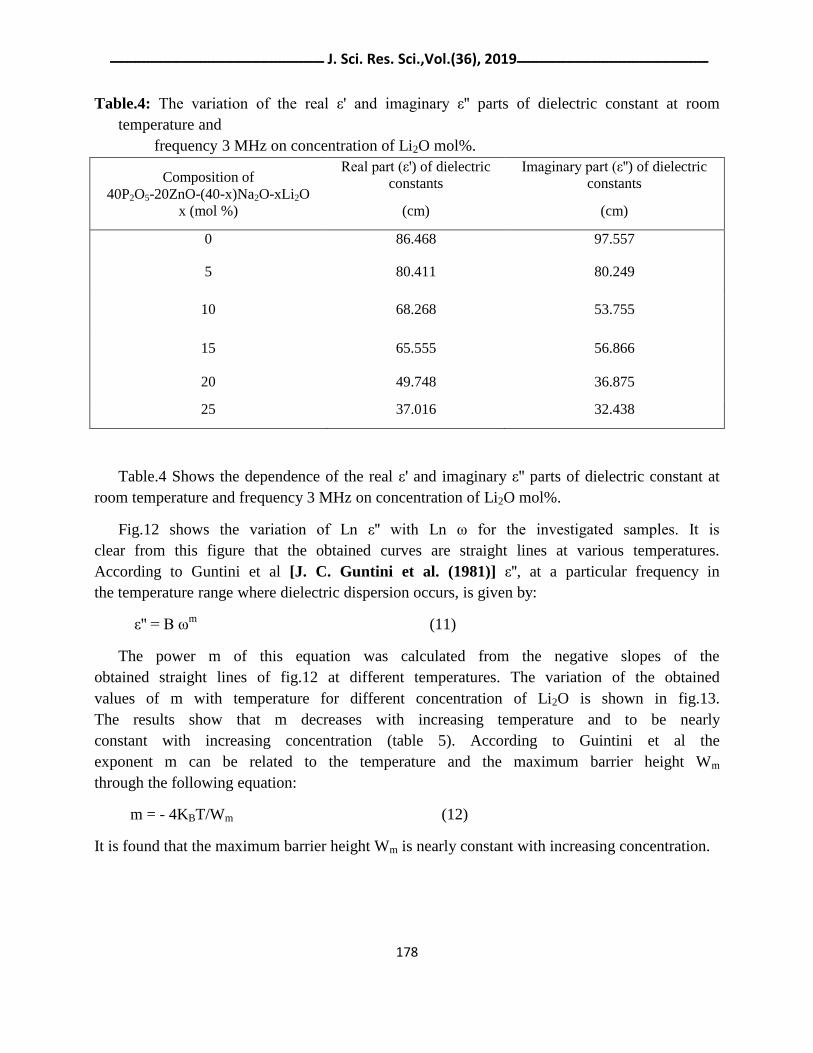
Fig.12: Frequency dependance of imaginary part (ε') of glass containing 15 mol% Li2O at
different temperatures.
ـــــــــــــــــــــــــــــــــــــــــــــــــــــــــــــــ ـــــــــــــــــــــــــــــــــــــــــــــــــــــــــــــــــــــــــــــــــــــــــــــــــــــــــــــــــــــــــــــ J. Sci. Res. Sci.,Vol.(36), 2019 ــــــــــــــــــــــــــــــــــــــــــــــــــــــــــــــــــــــــــــــــــــــــــــــــــــــــــــــــــــــــــــــــــــــــــــــــــــــــــــــــــــــــ
178
Table.4: The variation of the real ε' and imaginary ε'' parts of dielectric constant at room
temperature and
frequency 3 MHz on concentration of Li2O mol%.
Composition of
40P2O5-20ZnO-(40-x)Na2O-xLi2O
x (mol %)
Real part (ε') of dielectric
constants
(cm)
Imaginary part (ε'') of dielectric
constants
(cm)
0 86.468 97.557
5 80.411 80.249
10 68.268 53.755
15 65.555 56.866
20 49.748 36.875
25 37.016 32.438
Table.4 Shows the dependence of the real ε' and imaginary ε'' parts of dielectric constant at
room temperature and frequency 3 MHz on concentration of Li2O mol%.
Fig.12 shows the variation of Ln ε'' with Ln ω for the investigated samples. It is
clear from this figure that the obtained curves are straight lines at various temperatures.
According to Guntini et al [J. C. Guntini et al. (1981)] ε'', at a particular frequency in
the temperature range where dielectric dispersion occurs, is given by:
ε'' = B ωm
(11)
The power m of this equation was calculated from the negative slopes of the
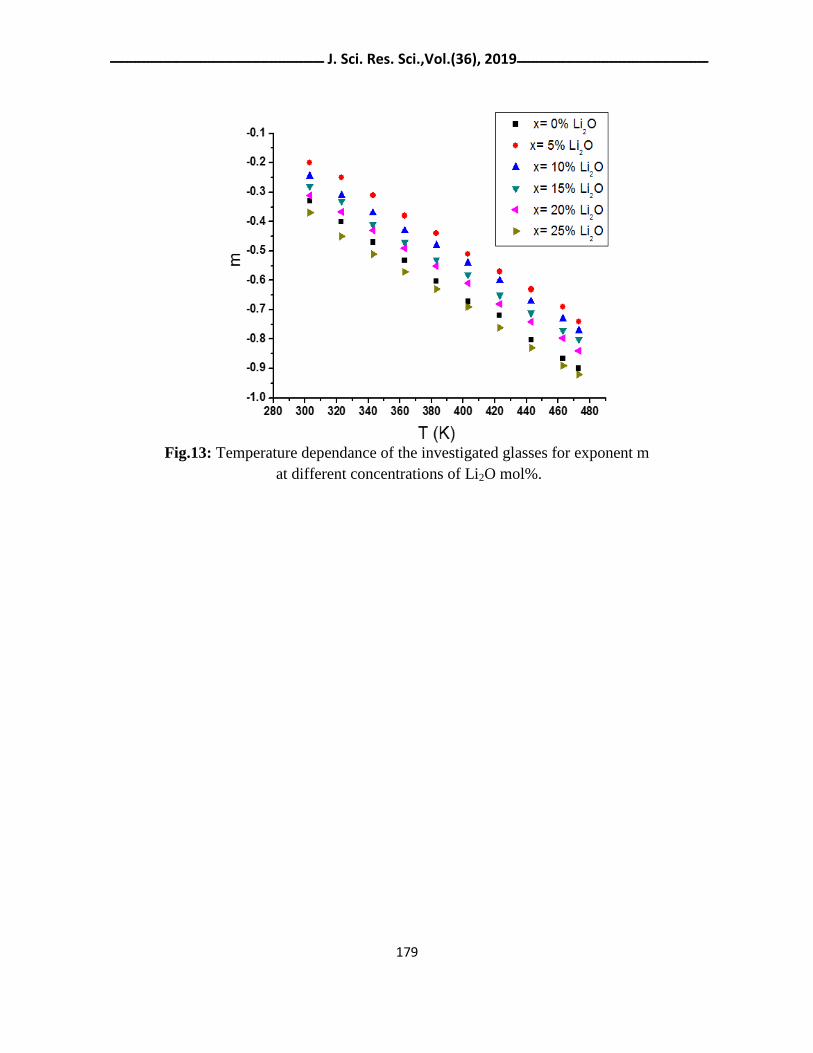
obtained straight lines of fig.12 at different temperatures. The variation of the obtained
values of m with temperature for different concentration of Li2O is shown in fig.13.
The results show that m decreases with increasing temperature and to be nearly
constant with increasing concentration (table 5). According to Guintini et al the
exponent m can be related to the temperature and the maximum barrier height Wm
through the following equation:
m = - 4KBT/Wm (12)
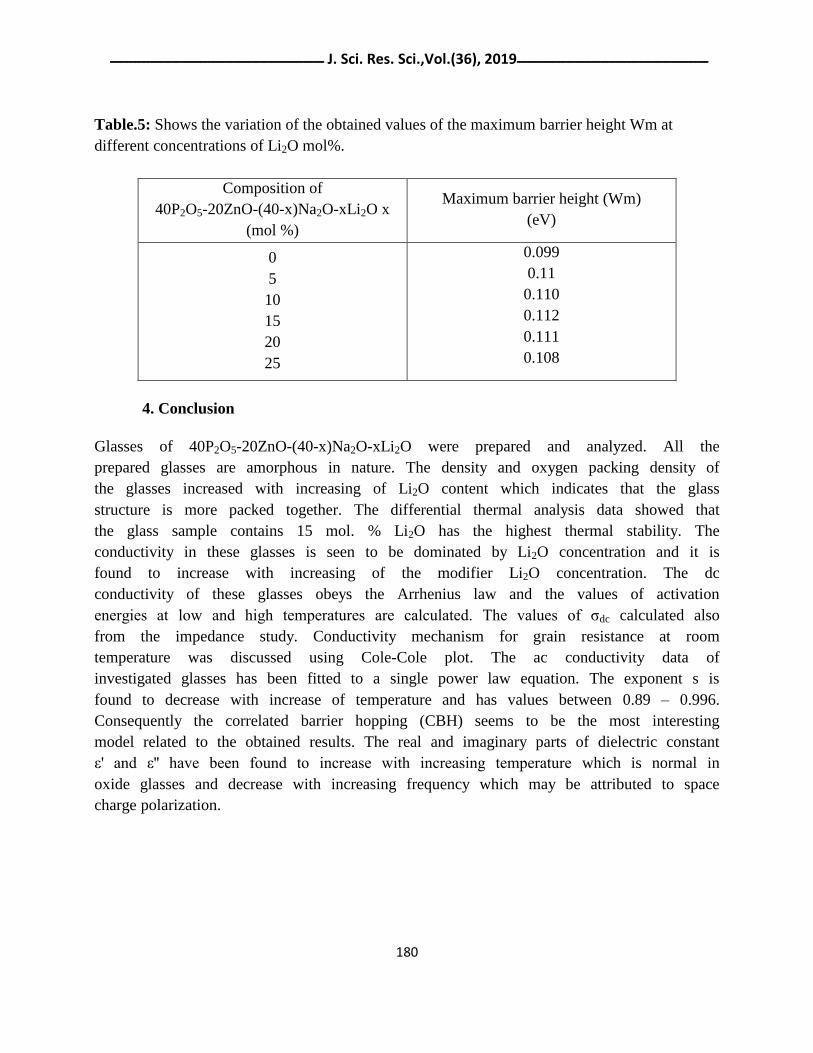
It is found that the maximum barrier height Wm is nearly constant with increasing concentration.
ـــــــــــــــــــــــــــــــــــــــــــــــــــــــــــــــ ـــــــــــــــــــــــــــــــــــــــــــــــــــــــــــــــــــــــــــــــــــــــــــــــــــــــــــــــــــــــــــــ J. Sci. Res. Sci.,Vol.(36), 2019 ــــــــــــــــــــــــــــــــــــــــــــــــــــــــــــــــــــــــــــــــــــــــــــــــــــــــــــــــــــــــــــــــــــــــــــــــــــــــــــــــــــــــ
179
Fig.13: Temperature dependance of the investigated glasses for exponent m
at different concentrations of Li2O mol%.
ـــــــــــــــــــــــــــــــــــــــــــــــــــــــــــــــ ـــــــــــــــــــــــــــــــــــــــــــــــــــــــــــــــــــــــــــــــــــــــــــــــــــــــــــــــــــــــــــــ J. Sci. Res. Sci.,Vol.(36), 2019 ــــــــــــــــــــــــــــــــــــــــــــــــــــــــــــــــــــــــــــــــــــــــــــــــــــــــــــــــــــــــــــــــــــــــــــــــــــــــــــــــــــــــ
180
Table.5: Shows the variation of the obtained values of the maximum barrier height Wm at
different concentrations of Li2O mol%.
4. Conclusion
Glasses of 40P2O5-20ZnO-(40-x)Na2O-xLi2O were prepared and analyzed. All the
prepared glasses are amorphous in nature. The density and oxygen packing density of
the glasses increased with increasing of Li2O content which indicates that the glass
structure is more packed together. The differential thermal analysis data showed that
the glass sample contains 15 mol. % Li2O has the highest thermal stability. The
conductivity in these glasses is seen to be dominated by Li2O concentration and it is
found to increase with increasing of the modifier Li2O concentration. The dc
conductivity of these glasses obeys the Arrhenius law and the values of activation
energies at low and high temperatures are calculated. The values of ζdc calculated also
from the impedance study. Conductivity mechanism for grain resistance at room
temperature was discussed using Cole-Cole plot. The ac conductivity data of
investigated glasses has been fitted to a single power law equation. The exponent s is
found to decrease with increase of temperature and has values between 0.89 – 0.996.
Consequently the correlated barrier hopping (CBH) seems to be the most interesting
model related to the obtained results. The real and imaginary parts of dielectric constant
ε' and ε'' have been found to increase with increasing temperature which is normal in
oxide glasses and decrease with increasing frequency which may be attributed to space
charge polarization.
Composition of
40P2O5-20ZnO-(40-x)Na2O-xLi2O x
(mol %)
Maximum barrier height (Wm)
(eV)
0
5
10
15
20
25
0.099
0.11
0.110
0.112
0.111
0.108
ـــــــــــــــــــــــــــــــــــــــــــــــــــــــــــــــ ـــــــــــــــــــــــــــــــــــــــــــــــــــــــــــــــــــــــــــــــــــــــــــــــــــــــــــــــــــــــــــــ J. Sci. Res. Sci.,Vol.(36), 2019 ــــــــــــــــــــــــــــــــــــــــــــــــــــــــــــــــــــــــــــــــــــــــــــــــــــــــــــــــــــــــــــــــــــــــــــــــــــــــــــــــــــــــ
181
5. References
A. A. Bahgat, Y.M. Abou eZeid, Phys. Chem. Glasses 42 (2001) 51.
A. Bhide, K. Hariharan, Mater. Chem. Phys.105 (2007) 213.
A. Ben Rasem, F. Hlel, K. Guidara, M. Gargouri, J. Alloys Compds. 385 (2009) 718.
A. V. Chandrasekhar, A. Radhapathy, B. I. Reddy, Opt. Mater. 22 (2003) 215.
A. Yamano, M. Morishita, G. Park, T. Sakamoro, H. Yamauchi, T. Nagakane, M.Ohji,
A. Sakamoto, T. Sakai, J. Electrochem. Soc. 161 (2014) A1094-A1099.
D. Carta, J. Knowles, P. Guerry, M. Smith, R. New. Port, J. Mater. Chem., 19 (2009) 150-
158.
D. E. Day, Z. Wu, C. S. Ray and P. Hrna, J. Non-Cryst. Solids, 1 (1998) 241.
D. D. Ramteke, R. E. Kroon, H. C. Swart, J. Non-Cryst. Solids 457 (2017) 157-163.
D. P. Almond, C. C. Hunter, A. R. West, J. Mater. Sci. 19 (1984) 3236.
G.E. Pike, Phys. Rev. B6 (1972) 157.
H. A. Zayed, N. F. Osman, M. M. El Okr, L. I. Soliman, accepted for publication (2356-8372),
J. Sci. Res. Sci. 36 (2019).
I. Abrahams, E. Hadzifejzovic, Solid State Ionic 134 (2000) 249.
I. Bunget, M. Popescu, Phys. Solid Dielectric, Elsevier, New York, 1984.
J. C. Guntini, J. V. Zan Chetta, D. Julien, R. Eholie, P. Houenou, J. Non-Cryst. Solids
45 (1981).
K. H. Mahmoud, F. M. Abdel-Rahim, K. Atef, Y. B. Saddeek, Current Applied Physics
11(2011)55- 60.
M. J. Miah, A. K. M. Akther Hossain, Acta Metall. Sin. (Engl. Lett.) (2016).
ـــــــــــــــــــــــــــــــــــــــــــــــــــــــــــــــ ـــــــــــــــــــــــــــــــــــــــــــــــــــــــــــــــــــــــــــــــــــــــــــــــــــــــــــــــــــــــــــــ J. Sci. Res. Sci.,Vol.(36), 2019 ــــــــــــــــــــــــــــــــــــــــــــــــــــــــــــــــــــــــــــــــــــــــــــــــــــــــــــــــــــــــــــــــــــــــــــــــــــــــــــــــــــــــ
182
Nehal Aboulfotoh, Yahia El bashar, Mohamed Ibrahem, Mohamed El Okr, Ceramics
International 40 (2014) 10305-10399.
P. M. V. Teja, C. Rajyasree, P. S. Rao, A. R. Babu, C. Tirupataiah, D. K. Rao, J. Mol. Struct.
1014 (2012) 119-125.
Paramjyot Komar Jha, O. P. Pandey, K. Singh, J. Mol. Struct. 1094 (2015) 174-182.
R.H. Chen, R.Y. Chang, C.S. Shem, Solid State Ion. 177 (2006) 2857.
R. K. Brow, D. R. Tallant, S. T. Myers and C. C. Phifer, J. Non- Cryst. Solids, 191 (1995) 45.
R. K. Brow, J. Non-Cryst. Solids, 1 (2000) 263-264.
S. Kurien, J. Mathew, S. Sebastian, S.N. Pottv, Kc. George. Mater.Chem.Phys. 98 (2006) 470.
S. R. Elliot, Philos. Mag. B.36 (1978) 129.
S. T. Reis, M. Karabulut and D. E. Day, J. Non-Cryst. Solids, 292, 150 (2001).
Samir Y. Marzouk, Materials Chemistry and Physics 114 (2009) 188-193.
Sh. A. Mansour, I. S. Yahia, G. B. Sakr, Solid State Communication 150 (2010) 1386-1391.
Yahia H. Elbashar, Ali M. Badr, Haron A. Elshaikh, Ahmed G. Mostafa, Ali M. Ibrahim,
Processing and Application of Ceramics 10 (4) (2016) 277-286.
ـــــــــــــــــــــــــــــــــــــــــــــــــــــــــــــــ ـــــــــــــــــــــــــــــــــــــــــــــــــــــــــــــــــــــــــــــــــــــــــــــــــــــــــــــــــــــــــــــ J. Sci. Res. Sci.,Vol.(36), 2019 ــــــــــــــــــــــــــــــــــــــــــــــــــــــــــــــــــــــــــــــــــــــــــــــــــــــــــــــــــــــــــــــــــــــــــــــــــــــــــــــــــــــــ
183
باللغة العربيةلملخص ا
المعذلة بأكسيذ صىديىم و الأكسيذ فىسفات الزنك زجاجياتل تحضير و دراسة الخىاص الكهربية
الليثىم
aعلاء فرؽ عصا،
b، يؽذ يؽد انعقش
c، عهيانيه اتشايى
d ثذ انؽيذ صايذؼذيح ع
a .يصش – انقاشج - الأكادييح انؽذيصح نهذعح انركنظيا - قغى انفيضياء - يذسط يغاعذ b
.يصش – انقاشج -ظايعح الأصش - كهيح انعهو - قغى انفيضياء - فيضياء انعايذ راعراc
.يصش – جانقاش - انشكض انقي نهثؽز - قغى انفيضياء - فيضياء انعايذ راعراd
.يصش – انقاشج - ظايعح عي شظ - كهيح انثاخ - قغى انفيضياء - فيضياء انعايذ راعرا
ؼيس - x Li2O 40 P2O5 - 20 ZnO - (40-x)Na2O يا انثؽس ذى ذؽضيش صظاض شفاف زف
كذ أ انضظاض قذ ذا ،انصش انرثشيذ انفاظء ذقيحتاعرخذاو ( % .mol. % ≤ X ≤ 25 mol 0) ا
ذشكيض قذ ظذ أ تضياد، (XRD)انؽضش راخ طثيعح ايسفي ي خلال اعرخذاو ذقي ؼيد اشعح اكظ
Li2O انكصافح ذضيذ كم ي (ρ) انؽضيح الأكغعييح كصافح (OPD) تيا انؽعى انلاس (Vm) زا يقم
اعه دسظ ( أ DTAيم انؽشاس انرفاضه )اظشخ دساعاخ انرؽه .يؤكذ ا انضظاض اصثػ اكصش ذشاتطا
ذى .Li2O ( ذقم يع صيادج ذشكيضTgدسظح انرؽل نهضظاض ) ا % .mol 15 شثاخ ؼشاس عذ ذشكيض
،”ε’ε يعايلاخ شاتد انعضل ذى ذعييي انرياس انغرش انرياس انرشدد دساعح انخاص انكشتيح نكم
عذ K) ) ΔEdc2 473 - 403عذ دسظاخ انؽشاسج انشذفعح ΔEdc1شيظ ي انذساعح ذى ذعيي طاقري انر
عذ دسظاخ ؼشاسج يخرهفح ζdcذعيي ذى ايضا قذ ( (K 383 - 303 دسظاخ انؽشاسج انخفضح
ذى دساعح نرعيي ييكايكيح انرصيم .ΔEac ذى ذعيي كزنك Cole-Cole plot تأعرخذاو ذشكيضاخ يخرهفح
عذ ذشدداخ يخرهفح ذى ذؽهيها عهي اعاط يع دسظح انؽشاسج صهيح انكشتيح نهرياس انرشددان ذغيش
correlated barrier hopping (CBH)، ( قذ ظذ ا قيىs)exponent 0.996ذرشاغ يا تي –
لاخ شاتد قذ ظذ ي دساعح يعاي ،( اغة يديم يرفق يع انرائطCBH تاء عهي يعرثش ) ،0.89
dielectricانرائط تاعطح ز ذى ششغ انؽشاسج صيادج انرشدداخ انخرهفح يعاا ذقم ”ε’ εانعضل
polarization mechanism of material. كزنك ذى ؼغاب قيحmaximum barrier height (Wm)
. %Li2O mol ظذ ا يضداد تضيادج Guitiniتأعرخذاو يعادلاخ