Embed Size (px)
Citation preview
Synthesis and Site Structure of a Replica Platinum-Carbon Composite Formed UtilizingOrdered Mesopores of Aluminum-MCM-41 for Catalysis in Fuel Cells
Kazuki Oka,† Yoshiyuki Shibata,‡ Takaomi Itoi,§ and Yasuo Izumi*,†
Department of Chemistry, Graduate School of Science, Department of Nanomaterial Science, Graduate Schoolof AdVanced Integration Science, and Department of Mechanical Engineering, Graduate School of Engineering,Chiba UniVersity, Yayoi 1-33, Inage-ku, Chiba 263-8522, Japan
ReceiVed: October 16, 2009
Platinum nanoparticles have been reported with mean sizes between 1.5 and 7 nm supported on carbon. Thecontact between Pt nanoparticles and C has never been controlled and monitored nanoscopically. In thispaper, stable Pt nanoparticles with a mean size of 1.2 nm were synthesized embedded on/in a C matrixcatalytically produced from acetylene over the Pt nanoparticles. The replica Pt-C composite was synthesizedinside of the ordered mesopores (2.7 nm) of Al-MCM-41 followed by removal of the template. The contactbetween the Pt nanoparticle and C was experimentally observed by high-energy resolution Pt L2-edge XANESspectra tuned to 11065.7 eV, at a lower energy by 5 eV than the Pt L�1 peak top for the replica Pt-C pressedto electrolyte polymer (Nafion). The spectra were nicely reproduced in a theoretical spectrum using ab initiomultiple scattering calculations for the interface Pt site between cuboctahedral Pt38 and graphite layers. OtherPt sites detected in state-selective Pt L2-edge XANES were exclusively metallic for replica Pt-C/Nafioneither in air or in H2. The thus-characterized replica Pt-C composite was tentatively tested as a cathode ofa H2-air polymer electrolyte fuel cell in comparison to commercial 20 wt % Pt/Vulcan XC-72 as the cathode.The improvement of Pt dispersion stabilized on/in a C matrix, effective contact of Pt with C, and diffusionof O2 in a few nanometers of replica Pt-C powder was suggested.
Introduction
The control of platinum nanoparticle size between 1.5 and 7nm supported on carbon is essential in the application to fuelcells1 and detoxification of exhaust gas from automobiles.2 Ptnanoparticles on C nanofibers (mean Pt size of 1.7-4 nm),3,4 Cnanotubes (mean Pt size of 2-6.7 nm),4–10 ordered mesoporousC (mean Pt size of 1.5-3 nm),11–13 C powder (mean Pt size of1.6-4.8 nm),14–17 and spherical C (mean Pt size of 2.9 nm)18
and Pt monolayer on nanoparticles of other metals19 have beensynthesized in narrow particle size distribution.
The polymer electrolyte fuel cell (PEFC) is expected to be aportable and compact power source to start at atmospherictemperature and be operated at lower than 373 K for automobileand home use.20 In the design of PEFCs, the cathode catalystfor the oxygen reduction reaction (O2 + 4H+ + 4e- f 2H2O)is most critical because the physical contact of Pt with C (electriccontact), the electrolyte (wet polymer to transport protons), andoxygen gas needs to be enabled at the same time.1 Themorphologic effects of Pt nanoparticles, films, and alloys onthe oxygen reduction reaction were reported.1,21 In contrast thatthe Pt nanoparticles have been formed on various types ofcontrolled C materials,3–17 the electric contact of Pt with C hasnever been controlled and monitored nanoscopically.
In this work, the contact of Pt with C was controlled basedon the idea of catalytic acetylene decomposition over Ptnanoparticles in a narrow size distribution centered at 1.2 nmformed inside of Al-exchanged ordered mesoporous silica Al-
MCM-41 to produce Pt-C composites in mesopores. Thereplica Pt-C composite was separated via the removal of Al-MCM-41 using hydrofluoric acid. The synthesis of the replicaPt-C composite was monitored using high-resolution transmis-sion electron microscope (TEM), X-ray diffraction (XRD), andBrunauer, Emmett, and Teller (BET) adsorption of N2. The localstructure and heterogeneity of Pt sites were analyzed based onconventional Pt L3- and L2-edge X-ray absorption fine structure(XAFS) and state-selective Pt L�1-selecting Pt L2-edge XAFS,respectively. State-selective XAFS was applied to Pt catalystsfor the first time.
The Pt nanoparticles in a narrow size distribution centeredat 1.2 nm are advantageous to use most of the Pt sites (80%)for oxygen reduction;1 however, mass-specific activity foroxygen reduction is still under debate and/or critically dependson reaction conditions. The rate constant values were nearlyconstant for mean Pt particles between 1.6 and 4.8 nm on C.17
The mass-specific activity gradually decreased when the meanPt particle size decreased from 30 to 1 nm22 or reached amaximum at 3.5 nm.23 The instability of Pt particles as smallas 1 nm was suggested to be transformed into amorphous andless active.9 In this paper, stabilization of Pt nanoparticles (mean1.2 nm) was tried on/in a C matrix catalytically formed fromacetylene in mesoporous space. The electronic structure of theinterface Pt site between Pt nanoparticles and C was investi-gated. The replica Pt-C was pressed as a tentative cathodecatalyst of membrane electrolyte assembly (MEA).
Experimental Section
Synthesis. Ten milliliters of an 8.4 mM aqueous solution oftetraammineplatinum(II) hydroxide hydrate PtII(NH3)4(OH)2 ·2H2O(Strem Chemicals) and 1.0 g of Al-MCM-41 (molar ratio SiO2/
* To whom correspondence should be addressed. E-mail: [email protected]. Phone and Fax: +81-43-290-3696.
† Graduate School of Science.‡ Graduate School of Advanced Integration Science.§ Graduate School of Engineering.
J. Phys. Chem. C 2010, 114, 1260–12671260
10.1021/jp909934r 2010 American Chemical SocietyPublished on Web 12/17/2009
Al2O3 ) 0.9875/0.0125, 1.11 wt % Al; Aldrich) were mixed andstirred at 353 K for 2 days. The suspension was filtered, washed,and heated in vacuum at 573 K for 2 h. The obtained powder(Pt-Al-MCM-41, 1.3 wt % Pt) was in a 30 mL min-1 H2
(>99.99%; 101 kPa) flow at 573 K for 2 h and then in a 200 mLmin-1 C2H2 (>98%) + N2 (>99.999%) flow (molar ratio 1:9, total101 kPa) at 973 K for 1 h. The obtained black powder (0.72 wt %Pt) was treated with 30 mL of hydrofluoric acid (15%; specialgrade, Wako Pure Chemical) to give the replica Pt-C composite(0.84 wt % Pt). Fortunately, in view of electric conductivity,amorphous C dissolved in hydrofluoric acid, and Pt-graphite waspreferably obtained.6,24 Somanathan et al. prepared Pt nanoparticlesstarting from hydrogen hexachloroplatinate(IV) in Al-MCM (molarratio SiO2/Al2O3 ) 0.995/0.005) followed by calcination at 823K. In 200 mL min-1 of C2H2 + N2 flow (molar ratio 3:7), the startof C decomposition at 923 K, carbon nanotube formation between973 and 1073 K, the maximum C decomposed at 1073 K, andpreferable formation of graphitic sheets and amorphous C at 1173K were reported.6 The starting temperature of C decompositionand the maximum decomposed C yield were reproduced in thiswork, but we chose a relatively low temperature of 973 K for C2H2
decomposition to prevent the thermal growth of Pt nanoparticles.Replica Pt-C powder (76 mg) was dispersed in 1.0 mL of
15% Nafion dispersion solution (DE2021-CS, Wako PureChemical) using ultrasonic treatment (85 W, 28 kHz) and wasmounted on 190 µm thick C paper coated with polytetrafluo-roethylene (TGP-H-060H, Chemix). Similarly, 25 mg of com-mercial 20 wt % Pt supported on C (Vulcan XC-72, Cabot)was dispersed on TGP-H-060H using a 5-10% Nafion disper-sion solution. As a reference, mechanically dispersed Pt/VulcanXC-72 on TGP-H-060H was also prepared. A 50 µm thickelectrolyte polymer Nafion film (NR-212, Dupont; >95%; acidcapacity > 9.2 × 10⁻⁴ equiv g-1) was pressed with replica Pt-C/TGP-H-060H as the cathode and 20 wt % Pt/Vulcan XC-72/TGP-H-060H as the anode for MEA. Another MEA was madeusing the same Nafion film pressed with 20 wt % Pt/VulcanXC-72/TGP-H-060H on both sides. The area of the electrodecatalysts was 5 cm2.
Characterization. Nitrogen adsorption measurements wereperformed at 77 K with the pressures between 1.0 and 90 kPain a vacuum system connected to diffusion and rotary pumps(10-6 Pa) and equipped with a capacitance manometer (modelsCCMT-1000A and GM-2001, ULVAC). The samples wereevacuated at 393 K for 2 h before measurements. High-resolution TEM images were taken using LaB6 source TEMequipment (JEOL, Model JEM-4000FX) with an acceleratingvoltage of 400 kV. Samples were dispersed in ethanol (>99.5%,Wako Pure Chemical) and mounted on amorphous C-coatedcopper mesh (CU150 Mesh, JEOL).
XRD data were obtained using a Rigaku MiniFlex diffrac-tometer at a Bragg angle of 2θB ) 2-10° for ordered mesoporesand 10-75° for crystallites of C and Pt. The conditions involvedwere 30 kV and 15 mA, Cu KR emission, and a nickel filter.The replica Pt-C powder and each intermediate compositeduring the synthesis were set in a dip of 18 × 2 × 1 mm3 onglass plate to measure the electric conductivity with the two-point method.25
The powder samples for synchrotron X-ray measurementswere prepared in the vacuum system (10-6 Pa) and transferredin situ to a Pyrex glass cell equipped with 25-50 µm thickKapton (Dupont) windows on both sides. The samples in H2,air, or argon were sealed with fire and transported to thebeamline. The replica Pt-C powder was mounted on TGP-H-060H, as described above, but pressed to only one side of Nafion
(NR-212) for synchrotron X-ray study. The Nafion and protec-tion polyester films (50 µm) were used as a window of Pyrexglass cells.
Conventional Pt L3- and L2-edge XAFS spectra were mea-sured at 290 K in transmission mode in the Photon Factory atthe High-Energy Accelerator Research Organization (Tsukuba,Japan) on beamlines 9C and 12C. The storage-ring energy was2.5 GeV, and the ring current was between 450 and 250 mA.A Si(111) double-crystal monochromator and cylindrical doublemirror were inserted into the X-ray beam path. The parallelnessof the double crystals was set to 65% intensity and to themaximum flux using a piezo translator. The slit opening sizewas 1 mm × 1 mm in front of the I0 ionization chamber. TheI0 and It ionization chambers were purged with the mixture ofAr(15%) + N2(85%) and Ar, respectively. The scan steps were∼7.8, ∼0.46, and ∼2.5 eV in the pre-edge, edge, and postedgeregions, respectively. The accumulation time was 1-10 s for adata point. The Pt L3- and L2 absorption edge energy valueswere calibrated to 11562 and 13272.3 eV, respectively, for thespectra of Pt metal.26,27
State-selective Pt L2-edge XAFS measurements were per-formed at 290 K at the beamline 37XU of SPring-8 (Sayo,Japan). The storage ring energy was 8 GeV at the top-up ringcurrent of 100 mA. A Si(111) monochromator and rhodium-coated mirror were used. The undulator gap was optimized tomaximize the X-ray beam flux at each data point. To stabilizethe X-ray beam position on the surface of the sample, themonochromator stabilization mechanism was used.28
The Pt L�1 emission spectra were measured using a home-made Rowland-type fluorescence spectrometer set at beamline37XU.28–30 A Johann-type spherically bent Ge(844) crystal(Saint-Gobain; curvature radius of 450 mm, d ) 0.57737 Å)and NaI(Tl) scintillation counter (SC; Model SP-10, Oken) weremounted. The energy resolution of the fluorescence spectrometerwas estimated to be 3.4 eV at Pt L�1, including the contributionof the beamline. The apparent core-hole lifetime width for PtL�1-selecting XAFS was estimated to be 2.0 eV based on theformula31
The gas for the ion chamber was 30% N2 and 70% He infront of the sample. The slit opening in the front of the ionizationchamber was 0.3 mm (horizontal) × 1.0 mm (vertical). Thesample was placed in a plane near horizontal, tilted by 6° towardthe incident X-ray and by 7° toward the Ge crystal. The samplesurface, Ge crystal, and slit in front of the SC were controlledon a Rowland circle (radius 225 mm) in the vertical plane. Theopenings of the receiving slit and the slit in front of the SCwere 8.0 mm (h) × 0.1 mm (v). The sample and SC werecovered with a lead plate housing, except for the X-ray paths.
With the excitation energy set to 13298.8 eV, Pt L�1 emission(M4 f L2; θB ) 75.895°) spectra were measured. The scanstep was ∼0.58 eV, and the accumulation time was 60 s for adata point. The fluorescence spectrometer was tuned to eachenergy around the Pt L�1 emission peak, and Pt L2-edge XANES(X-ray absorption near edge structure) spectra were measured.The scan step was ∼0.46 eV with an accumulation time of40-60 s for a data point. The Pt L�1 fluorescence energy valuewas calibrated to 11070.84 eV for the spectrum of Pt metal.26,27
The energy positions of the monochromator and the fluorescence
1
ΓApp2) 1
ΓPt 3d3/2
2+ 1
ΓPt 2p1/2
2
Analysis and Catalysis of a Replica 1.2 nm Pt-C Composite J. Phys. Chem. C, Vol. 114, No. 2, 2010 1261
spectrometer were reproduced within (0.1 and (0.2 eV,respectively.
Analyses. The XAFS data were analyzed with XDAP (XAFSServices International).32 The pre-edge background was ap-proximated by a modified Victoreen function C2/E2 + C1/E +C0. The background of the postedge oscillation was ap-proximated by a smoothing spline function, calculated by anequation for the number of data points where k was thewavenumber of photoelectrons.
Multiple shell curve fit analyses were performed for theFourier-filtered k3-weighted EXAFS data in k and R space usingempirical amplitude and phase shift parameters extracted fromEXAFS of PtO2 and Pt metal for Pt-O [bond distance R(Pt-O)) 0.1993 nm with the coordination number (N) of 6]33 andPt-Pt bonds [R(Pt-Pt) ) 0.2775 nm with the N of 12]4 basedon reported crystal structures. The many-body reduction factorS0
2 was assumed to be equal for the sample and reference. Thegoodness of fit was given as requested by the Committee onStandards and Criteria in X-ray Absorption Spectroscopy.
The Pt L3- and L2-edge XANES spectra were theoreticallygenerated using ab initio calculation code FEFF 8.4,34 operatedin a self-consistent field and full multiple scattering modes.Theoretical calculations of Pt XANES were reported to clarifythe Pt cluster size effect and spectral change upon H/COadsorption.35–37 The exchange-correlation potential of Hedin-Lundqvist was chosen and corrected by adding a constant shiftof +1.0 eV to the Fermi level. The calculated potential wasalso corrected by adding a constant shift of -1.6 eV to the “pureimaginary optical potential” to compare to Pt L�1-selecting PtL2-edge spectra, but no shift was given for comparison toconventional XANES. The energy of the theoretically generatedspectrum was shifted by +4.7 eV to compare to conventionalPt L3/2-edge spectra and Pt L2-edge spectra tuned to the Pt L�1
peak top (11070.7-11070.8 eV). Corresponding to the Pt L2-edge spectra tuned to 11065.7 and 11075.4 eV, the energies ofthe theoretically generated spectra were shifted by 0 and +8.2eV, respectively.
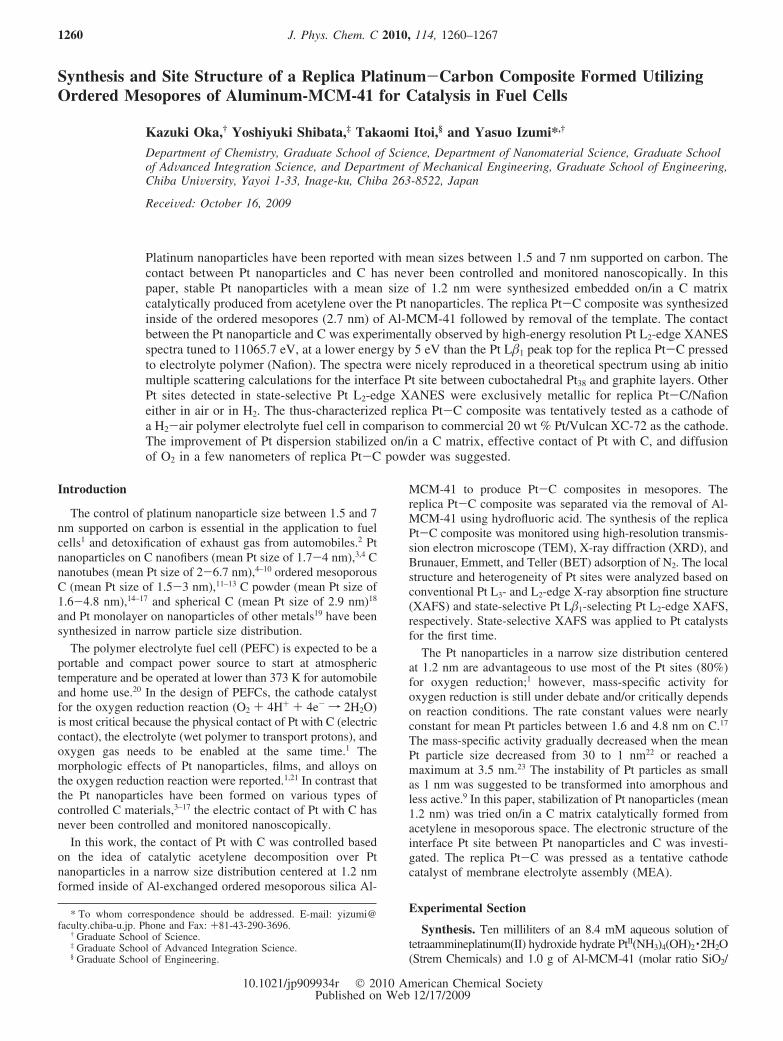
The Pt metal site model consisted of 38 atoms of a face-centered cubic (fcc) Pt metal cuboctahedron. Among the Ptatoms, N(Pt-Pt) values of 6, 8, and 24 atoms were 12, 9, and6, respectively.38 The central Pt atom in the (111) surface (N )9) was considered as a representative Pt site for calculations(Figure 1) compared to an average N of 7.6 for all of the Ptsites. A central Pt atom in the (111) surface was in vacuum orat the interface with 177 atoms of three layers of graphite[R(C-C) ) 0.1418 nm]. The Pt-C bond length was variedbetween 0.16 and 0.22 nm based on the crystal structures oforganometallic compounds.39 Relatively long R(Pt-C) valuesof 0.320-0.359 nm were used in the calculation model of Pt37
on graphite.40 The Pt L2-edge spectrum tuned to 11065.7 eVfor replica Pt-C/Nafion was best reproduced theoretically bysetting the R(Pt-C) to 0.18 nm. Thus, the nearest Pt-C bonddistance was fixed to 0.18 nm. Average R(Pt-C) and N valueswere 2.0 nm and 1.9, respectively, for seven Pt atoms at theinterface (Figure 1).
Results
N2 Adsorption, XRD, TEM, and Conductivity. The specificsurface area (SBET) of 970 m2 g-1 for Al-MCM-41 decreased
by 21% upon impregnation of Pt (Table 1). In contrast to thispartial block of mesopores, the SBET for Pt-Al-MCM-41decreased by 95% after catalytic C2H2 decomposition, suggest-ing that a (nearly) complete block of mesopores by C formed.The loss of SBET was recovered to 540 m2 g-1 with the HFtreatment (Table 1).
The regularity of the MCM-41 framework was monitored byXRD during the synthesis step of replica Pt-C. The distancebetween the pore and neighboring pore (a0 of the unit cell) was4.7 nm (d100 ) 4.1 nm) for Al-MCM-41 (Table 1).6,41 The valuedecreased to 4.5 nm (d100 ) 3.9 nm) upon impregnation of Pt,in a similar trend to ref 6. In contrast, no peak was detected inXRD for Pt-C-Al-MCM-41 probably because the electrondensity of C formed in Al-MCM-41 mesopores was similar tothat of the Al-SiO2 template. The lower-angle peaks recoveredat d ) 3.7 and 3.2 nm for replica Pt-C composites, but theintensity was weaker compared to the peak for Pt-Al-MCM-41. No distinct peaks derived from the Pt or C crystallite wereobserved throughout the synthesis step of replica Pt-C. Aftera fuel cell test for 3 h, the replica Pt-C composite used as thecathode was re-examined by XRD. No peak was observed inthe range of 2θB ) 10-75°, suggesting the Pt particle sizeremained small.
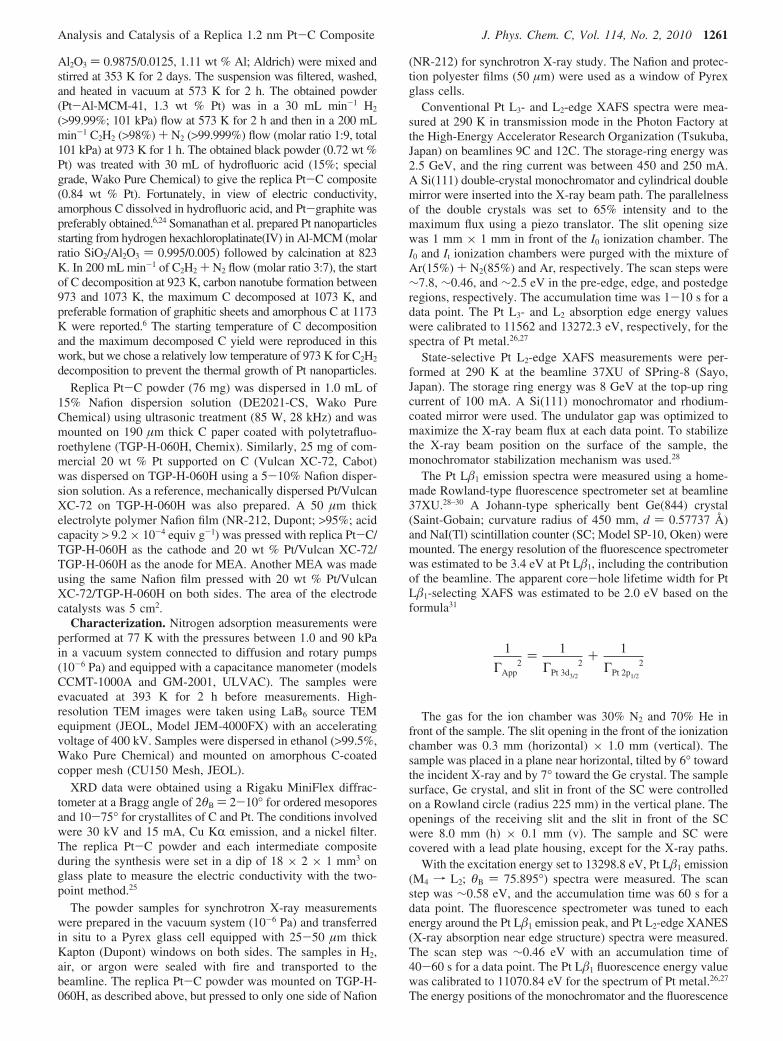
The TEM image for replica Pt-C is depicted in Figure 2A.Darker dots of Pt particles are clearly observed between 0.38and 3.33 nm (Figure 2C). The mean particle size is 1.2 nm,with a standard deviation of 0.5 nm. The mean size correspondsto a total of 66 atoms in one particle.38 Most of the Pt particlesare within the pore size of Al-MCM-41 (2.7 nm) (Figure 2C).The replica C is not clear in TEM images probably because theaxis of replica Pt-C may randomly distribute, and the diameterof the rod/tube-like structure should be less than 3 nm dispersedover amorphous C coated on Cu mesh. However, the straightarrangement of darker Pt spots is observed, reminiscent of theordered mesoporous structure of the Al-MCM-41 framework(Figure 2B).
The electric conductivity for Pt-Al-MCM-41 of less than 1µS cm-1 dramatically increased to 263 mS cm-1 upon catalyticC2H2 decomposition (Table 1). The value was by 17% superior
∑i)1
data_points (µxi - BGi)2
exp(-0.075ki2)e smoothing factor
Figure 1. The Pt38 cluster model on three layers of graphite for XAFSanalyses.
1262 J. Phys. Chem. C, Vol. 114, No. 2, 2010 Oka et al.
to that for 20 wt % Pt/Vulcan XC-72. The value for replicaPt-C (259 mS cm-1) was comparable to that for Pt-C-Al-MCM-41 (Table 1).
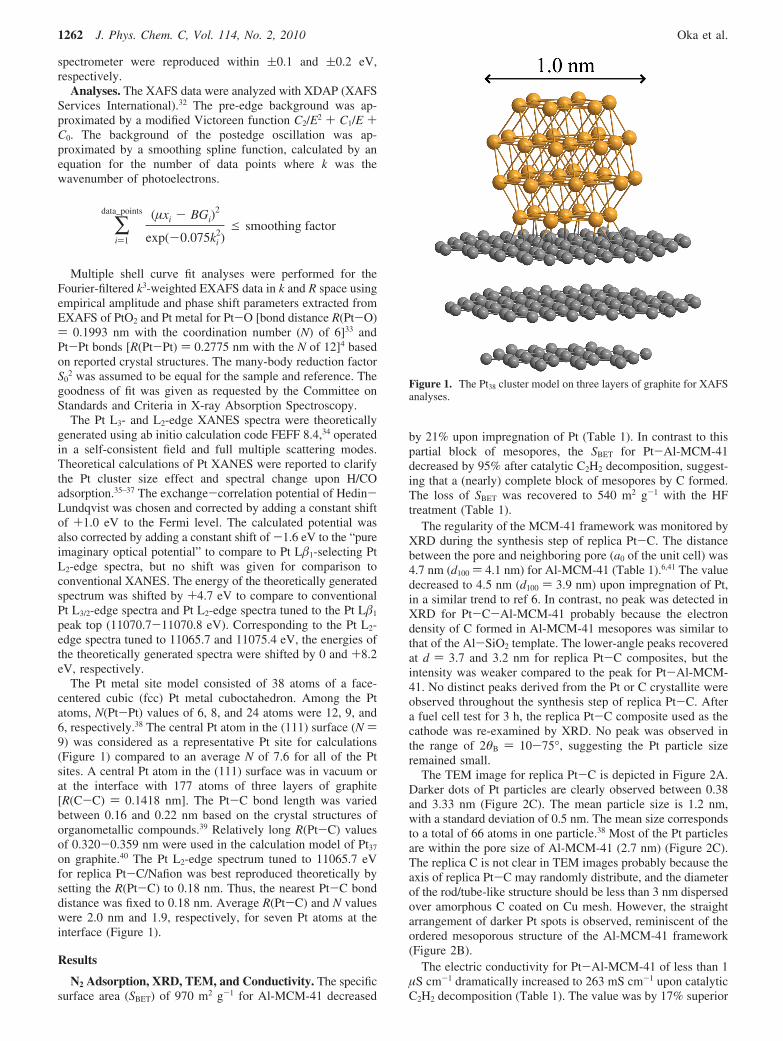
Conventional XANES. Conventional Pt L3-edge XANESspectra were measured during synthesis steps of the replicaPt-C composite (Figure 3). The peak positions of XANES forPt-Al-MCM-41 (11565.7, 11580.5, and 11594.2 eV; spectrum(a)) were similar to those for Pt metal (spectrum (e)). Theintensity of three postedge peaks was weaker for Pt-Al-MCM-41 compared to that for corresponding peaks for Pt metal,demonstrating that the Pt particles in Pt-Al-MCM-41 were onthe nanometer scale.
The peak at 11566.5 eV for Pt-C-Al-MCM-41 (spectrum(b)) became weaker and broader compared to that at 11565.7eV in spectrum (a). An attempt was made to fit spectra (a) and(b) with theoretical spectra for a metallic Pt site or interface Ptsite between the metal and graphite. It was difficult to fit becausespectrum (a) seemed to be a mixture of metallic and oxidic Ptsites. Spectrum (b) seemed to be a mixture of metallic Pt andPt at the interface with C. Instead, Pt L�1-selecting XANESspectra were compared to theoretical data because the Pt statewas selected and the spectral pattern was sharpened.28,29,42–47
The XANES spectrum for the replica Pt-C composite in airis shown in Figure 3c. The energy of first peak above theabsorption edge (11566.7 eV) is intermediate between the peakat 11565.6 eV for the Pt metal (spectrum (e)) and the one at11567.3 eV for PtO2 (spectrum (f)). The first peak for spectrum(c) is more intense (1.47) than those for spectra (a) and (b)(1.33-1.19), and the postedge pattern of spectrum (c) becamefeatureless. Thus, oxidation of part of metallic Pt in Pt-C-Al-MCM-41 was suggested after the removal of the Al-MCM-41framework. In the XANES spectrum for Pt sites in replica Pt-C/Nafion in air (Figure 3d), the first peak above the absorptionedge shifted down to 11566.5 eV, and the intensity decreased(1.34). The peak intensity was essentially identical to that forspectrum (a) (1.34 versus 1.33). No peak feature at 11590.5 eVfor PtO2 (spectrum (f)) was detected in spectrum (d). Thepostedge pattern of spectrum (d) was most like that of spectrum(b).
In comparison, a XANES pattern of 20 wt % Pt/Vulcan XC-72/Nafion (Figure 3g) corresponded exactly to that for Pt metal(spectrum (e)). The mean Pt particle size in the sample was 4.8nm based on the peak width of XRD, much greater than that inthe replica Pt-C composite (1.2 nm) and in less contact withNafion.
TABLE 1: Physicochemical Characterization of Intermediate and Final Materials in the replica Pt-C Composite Synthesis
TEMd XRDe
sample
specificSBET
(m2 g-1)RPore-Pore
(nm)aPt loading
(wt%)b NPt-Ptc
NPt-O orNPt-C
c dPt-Pt (nm)
electricconductivity(mS cm-1) ref
Al-MCM-41 970 4.7 - - - - <0.001 this workPt-Al-MCM-41 767 4.5 1.3 - - - <0.001 this workPt-C-Al-MCM-41 35 n.p.f 0.72 5.1 2.1 - n.p.f 263 this workreplica Pt-C 540 - 0.84 6.1 2.2 1.2 n.p.,f n.p. f,g 259 this workPt/Vulcan XC-72 - - 20 12 - - 4.8 224 this workhexagonal Pt-block copolymer composite 18 30 74 2.5 25
a Distance from the center of the pore to the center of the neighboring pore based on XRD. b Based on the Pt L3-edge jump value.c Coordination number based on the Pt L3-edge EXAFS curve fit analysis. d Average particle size of Pt based on TEM image. e Average particlesize of Pt based on XRD. f No peak detected. g Sample after PEFC cell test for 3 h.
Figure 2. High-resolution TEM image for replica Pt-C (A). Theinternal size of mesopores of Al-MCM-41 was added in (B). The sizedistribution of the darker dots of Pt particles (C).
Figure 3. Normalized Pt L3-edge XANES spectra for Pt-Al-MCM-41 (a), Pt-C-Al-MCM-41 (b), replica Pt-C in air (c), replica Pt-C/Nafion in air (d), Pt metal of 5 µm thickness (e), PtO2 (f), and 20 wt% Pt/Vulcan XC-72/Nafion (g).
Analysis and Catalysis of a Replica 1.2 nm Pt-C Composite J. Phys. Chem. C, Vol. 114, No. 2, 2010 1263
X-ray Emission and State-Selective XANES. The Pt L�1
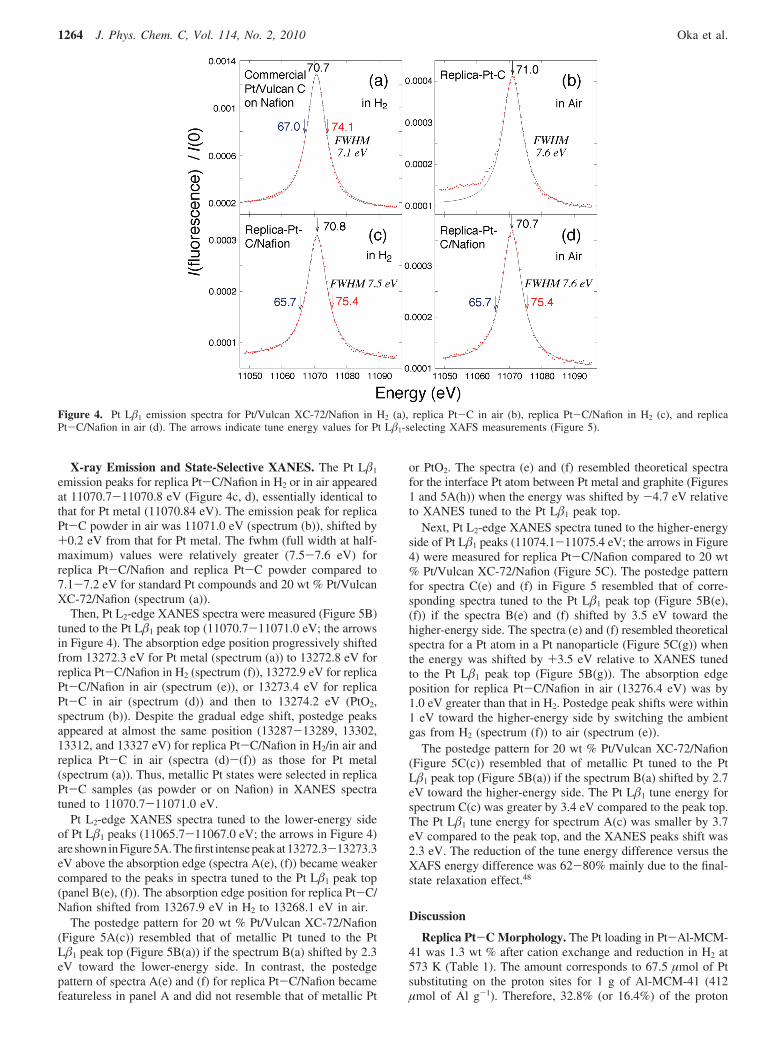
emission peaks for replica Pt-C/Nafion in H2 or in air appearedat 11070.7-11070.8 eV (Figure 4c, d), essentially identical tothat for Pt metal (11070.84 eV). The emission peak for replicaPt-C powder in air was 11071.0 eV (spectrum (b)), shifted by+0.2 eV from that for Pt metal. The fwhm (full width at half-maximum) values were relatively greater (7.5-7.6 eV) forreplica Pt-C/Nafion and replica Pt-C powder compared to7.1-7.2 eV for standard Pt compounds and 20 wt % Pt/VulcanXC-72/Nafion (spectrum (a)).
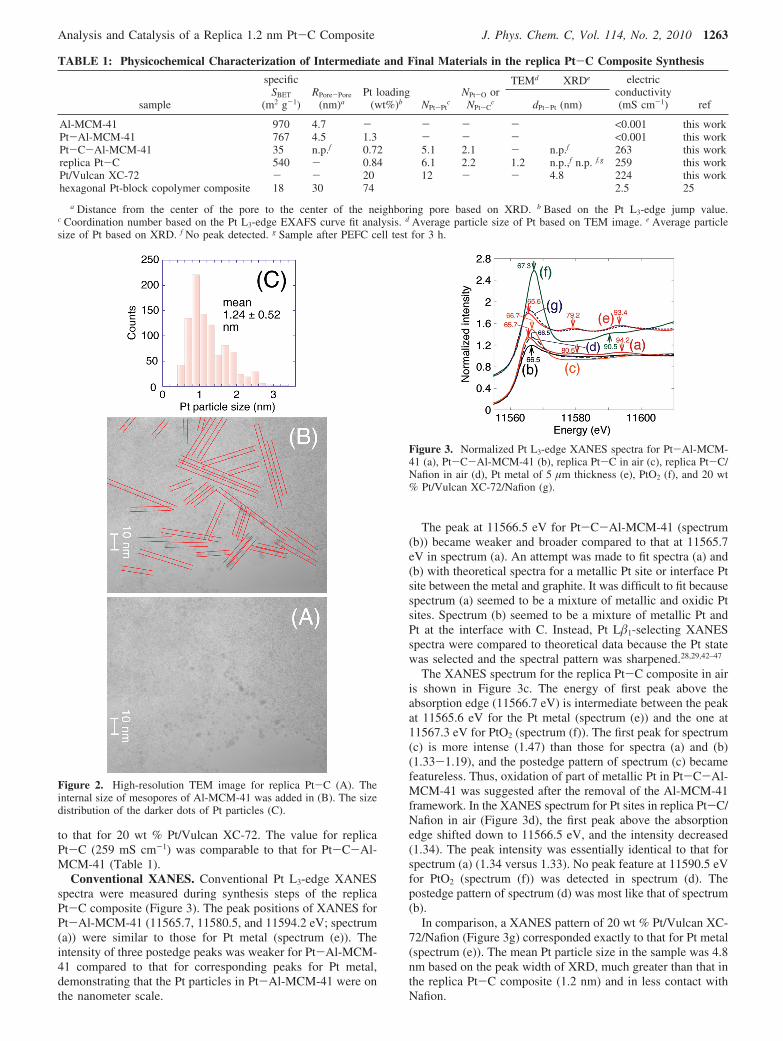
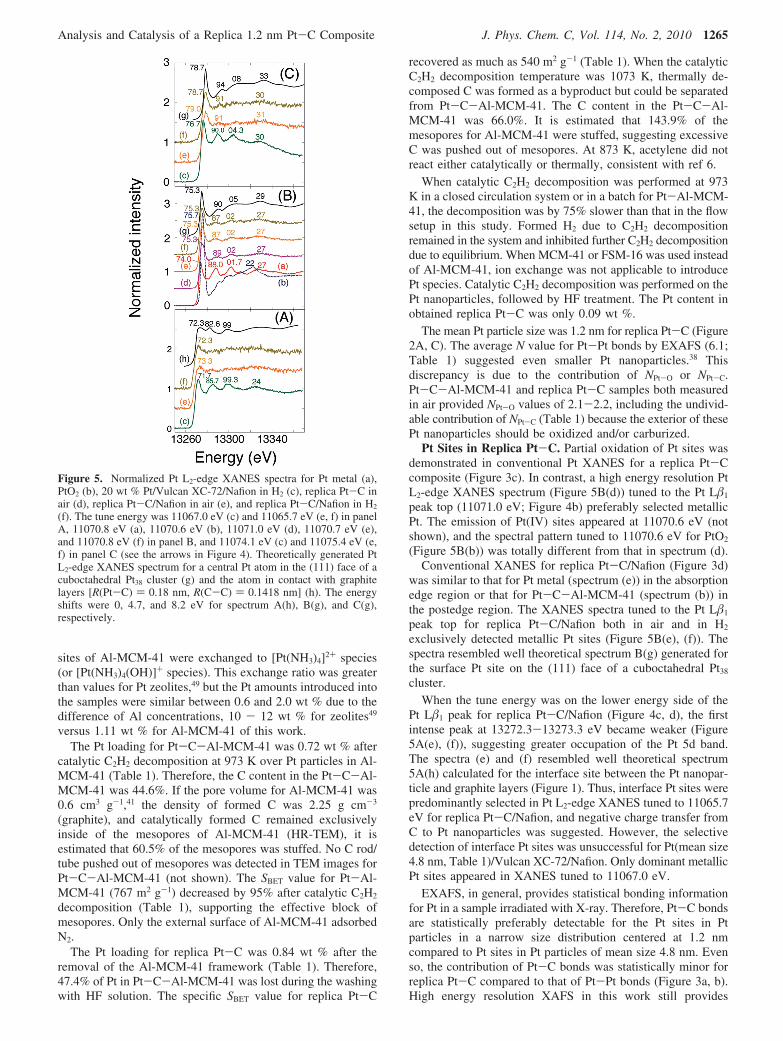
Then, Pt L2-edge XANES spectra were measured (Figure 5B)tuned to the Pt L�1 peak top (11070.7-11071.0 eV; the arrowsin Figure 4). The absorption edge position progressively shiftedfrom 13272.3 eV for Pt metal (spectrum (a)) to 13272.8 eV forreplica Pt-C/Nafion in H2 (spectrum (f)), 13272.9 eV for replicaPt-C/Nafion in air (spectrum (e)), or 13273.4 eV for replicaPt-C in air (spectrum (d)) and then to 13274.2 eV (PtO2,spectrum (b)). Despite the gradual edge shift, postedge peaksappeared at almost the same position (13287-13289, 13302,13312, and 13327 eV) for replica Pt-C/Nafion in H2/in air andreplica Pt-C in air (spectra (d)-(f)) as those for Pt metal(spectrum (a)). Thus, metallic Pt states were selected in replicaPt-C samples (as powder or on Nafion) in XANES spectratuned to 11070.7-11071.0 eV.
Pt L2-edge XANES spectra tuned to the lower-energy sideof Pt L�1 peaks (11065.7-11067.0 eV; the arrows in Figure 4)are showninFigure5A.Thefirst intensepeakat13272.3-13273.3eV above the absorption edge (spectra A(e), (f)) became weakercompared to the peaks in spectra tuned to the Pt L�1 peak top(panel B(e), (f)). The absorption edge position for replica Pt-C/Nafion shifted from 13267.9 eV in H2 to 13268.1 eV in air.
The postedge pattern for 20 wt % Pt/Vulcan XC-72/Nafion(Figure 5A(c)) resembled that of metallic Pt tuned to the PtL�1 peak top (Figure 5B(a)) if the spectrum B(a) shifted by 2.3eV toward the lower-energy side. In contrast, the postedgepattern of spectra A(e) and (f) for replica Pt-C/Nafion becamefeatureless in panel A and did not resemble that of metallic Pt
or PtO2. The spectra (e) and (f) resembled theoretical spectrafor the interface Pt atom between Pt metal and graphite (Figures1 and 5A(h)) when the energy was shifted by -4.7 eV relativeto XANES tuned to the Pt L�1 peak top.
Next, Pt L2-edge XANES spectra tuned to the higher-energyside of Pt L�1 peaks (11074.1-11075.4 eV; the arrows in Figure4) were measured for replica Pt-C/Nafion compared to 20 wt% Pt/Vulcan XC-72/Nafion (Figure 5C). The postedge patternfor spectra C(e) and (f) in Figure 5 resembled that of corre-sponding spectra tuned to the Pt L�1 peak top (Figure 5B(e),(f)) if the spectra B(e) and (f) shifted by 3.5 eV toward thehigher-energy side. The spectra (e) and (f) resembled theoreticalspectra for a Pt atom in a Pt nanoparticle (Figure 5C(g)) whenthe energy was shifted by +3.5 eV relative to XANES tunedto the Pt L�1 peak top (Figure 5B(g)). The absorption edgeposition for replica Pt-C/Nafion in air (13276.4 eV) was by1.0 eV greater than that in H2. Postedge peak shifts were within1 eV toward the higher-energy side by switching the ambientgas from H2 (spectrum (f)) to air (spectrum (e)).
The postedge pattern for 20 wt % Pt/Vulcan XC-72/Nafion(Figure 5C(c)) resembled that of metallic Pt tuned to the PtL�1 peak top (Figure 5B(a)) if the spectrum B(a) shifted by 2.7eV toward the higher-energy side. The Pt L�1 tune energy forspectrum C(c) was greater by 3.4 eV compared to the peak top.The Pt L�1 tune energy for spectrum A(c) was smaller by 3.7eV compared to the peak top, and the XANES peaks shift was2.3 eV. The reduction of the tune energy difference versus theXAFS energy difference was 62-80% mainly due to the final-state relaxation effect.48
Discussion
Replica Pt-C Morphology. The Pt loading in Pt-Al-MCM-41 was 1.3 wt % after cation exchange and reduction in H2 at573 K (Table 1). The amount corresponds to 67.5 µmol of Ptsubstituting on the proton sites for 1 g of Al-MCM-41 (412µmol of Al g-1). Therefore, 32.8% (or 16.4%) of the proton
Figure 4. Pt L�1 emission spectra for Pt/Vulcan XC-72/Nafion in H2 (a), replica Pt-C in air (b), replica Pt-C/Nafion in H2 (c), and replicaPt-C/Nafion in air (d). The arrows indicate tune energy values for Pt L�1-selecting XAFS measurements (Figure 5).
1264 J. Phys. Chem. C, Vol. 114, No. 2, 2010 Oka et al.
sites of Al-MCM-41 were exchanged to [Pt(NH3)4]2+ species(or [Pt(NH3)4(OH)]+ species). This exchange ratio was greaterthan values for Pt zeolites,49 but the Pt amounts introduced intothe samples were similar between 0.6 and 2.0 wt % due to thedifference of Al concentrations, 10 - 12 wt % for zeolites49
versus 1.11 wt % for Al-MCM-41 of this work.The Pt loading for Pt-C-Al-MCM-41 was 0.72 wt % after
catalytic C2H2 decomposition at 973 K over Pt particles in Al-MCM-41 (Table 1). Therefore, the C content in the Pt-C-Al-MCM-41 was 44.6%. If the pore volume for Al-MCM-41 was0.6 cm3 g-1,41 the density of formed C was 2.25 g cm-3
(graphite), and catalytically formed C remained exclusivelyinside of the mesopores of Al-MCM-41 (HR-TEM), it isestimated that 60.5% of the mesopores was stuffed. No C rod/tube pushed out of mesopores was detected in TEM images forPt-C-Al-MCM-41 (not shown). The SBET value for Pt-Al-MCM-41 (767 m2 g-1) decreased by 95% after catalytic C2H2
decomposition (Table 1), supporting the effective block ofmesopores. Only the external surface of Al-MCM-41 adsorbedN2.
The Pt loading for replica Pt-C was 0.84 wt % after theremoval of the Al-MCM-41 framework (Table 1). Therefore,47.4% of Pt in Pt-C-Al-MCM-41 was lost during the washingwith HF solution. The specific SBET value for replica Pt-C
recovered as much as 540 m2 g-1 (Table 1). When the catalyticC2H2 decomposition temperature was 1073 K, thermally de-composed C was formed as a byproduct but could be separatedfrom Pt-C-Al-MCM-41. The C content in the Pt-C-Al-MCM-41 was 66.0%. It is estimated that 143.9% of themesopores for Al-MCM-41 were stuffed, suggesting excessiveC was pushed out of mesopores. At 873 K, acetylene did notreact either catalytically or thermally, consistent with ref 6.
When catalytic C2H2 decomposition was performed at 973K in a closed circulation system or in a batch for Pt-Al-MCM-41, the decomposition was by 75% slower than that in the flowsetup in this study. Formed H2 due to C2H2 decompositionremained in the system and inhibited further C2H2 decompositiondue to equilibrium. When MCM-41 or FSM-16 was used insteadof Al-MCM-41, ion exchange was not applicable to introducePt species. Catalytic C2H2 decomposition was performed on thePt nanoparticles, followed by HF treatment. The Pt content inobtained replica Pt-C was only 0.09 wt %.
The mean Pt particle size was 1.2 nm for replica Pt-C (Figure2A, C). The average N value for Pt-Pt bonds by EXAFS (6.1;Table 1) suggested even smaller Pt nanoparticles.38 Thisdiscrepancy is due to the contribution of NPt-O or NPt-C.Pt-C-Al-MCM-41 and replica Pt-C samples both measuredin air provided NPt-O values of 2.1-2.2, including the undivid-able contribution of NPt-C (Table 1) because the exterior of thesePt nanoparticles should be oxidized and/or carburized.
Pt Sites in Replica Pt-C. Partial oxidation of Pt sites wasdemonstrated in conventional Pt XANES for a replica Pt-Ccomposite (Figure 3c). In contrast, a high energy resolution PtL2-edge XANES spectrum (Figure 5B(d)) tuned to the Pt L�1
peak top (11071.0 eV; Figure 4b) preferably selected metallicPt. The emission of Pt(IV) sites appeared at 11070.6 eV (notshown), and the spectral pattern tuned to 11070.6 eV for PtO2
(Figure 5B(b)) was totally different from that in spectrum (d).Conventional XANES for replica Pt-C/Nafion (Figure 3d)
was similar to that for Pt metal (spectrum (e)) in the absorptionedge region or that for Pt-C-Al-MCM-41 (spectrum (b)) inthe postedge region. The XANES spectra tuned to the Pt L�1
peak top for replica Pt-C/Nafion both in air and in H2
exclusively detected metallic Pt sites (Figure 5B(e), (f)). Thespectra resembled well theoretical spectrum B(g) generated forthe surface Pt site on the (111) face of a cuboctahedral Pt38
cluster.When the tune energy was on the lower energy side of the
Pt L�1 peak for replica Pt-C/Nafion (Figure 4c, d), the firstintense peak at 13272.3-13273.3 eV became weaker (Figure5A(e), (f)), suggesting greater occupation of the Pt 5d band.The spectra (e) and (f) resembled well theoretical spectrum5A(h) calculated for the interface site between the Pt nanopar-ticle and graphite layers (Figure 1). Thus, interface Pt sites werepredominantly selected in Pt L2-edge XANES tuned to 11065.7eV for replica Pt-C/Nafion, and negative charge transfer fromC to Pt nanoparticles was suggested. However, the selectivedetection of interface Pt sites was unsuccessful for Pt(mean size4.8 nm, Table 1)/Vulcan XC-72/Nafion. Only dominant metallicPt sites appeared in XANES tuned to 11067.0 eV.
EXAFS, in general, provides statistical bonding informationfor Pt in a sample irradiated with X-ray. Therefore, Pt-C bondsare statistically preferably detectable for the Pt sites in Ptparticles in a narrow size distribution centered at 1.2 nmcompared to Pt sites in Pt particles of mean size 4.8 nm. Evenso, the contribution of Pt-C bonds was statistically minor forreplica Pt-C compared to that of Pt-Pt bonds (Figure 3a, b).High energy resolution XAFS in this work still provides
Figure 5. Normalized Pt L2-edge XANES spectra for Pt metal (a),PtO2 (b), 20 wt % Pt/Vulcan XC-72/Nafion in H2 (c), replica Pt-C inair (d), replica Pt-C/Nafion in air (e), and replica Pt-C/Nafion in H2
(f). The tune energy was 11067.0 eV (c) and 11065.7 eV (e, f) in panelA, 11070.8 eV (a), 11070.6 eV (b), 11071.0 eV (d), 11070.7 eV (e),and 11070.8 eV (f) in panel B, and 11074.1 eV (c) and 11075.4 eV (e,f) in panel C (see the arrows in Figure 4). Theoretically generated PtL2-edge XANES spectrum for a central Pt atom in the (111) face of acuboctahedral Pt38 cluster (g) and the atom in contact with graphitelayers [R(Pt-C) ) 0.18 nm, R(C-C) ) 0.1418 nm] (h). The energyshifts were 0, 4.7, and 8.2 eV for spectrum A(h), B(g), and C(g),respectively.
Analysis and Catalysis of a Replica 1.2 nm Pt-C Composite J. Phys. Chem. C, Vol. 114, No. 2, 2010 1265
statistical bonding information; however, the information isspecific for Pt sites corresponding to a lower Pt L�1 emissionenergy of 11065.7 eV for replica Pt-C/Nafion (Figure 5A(e),(f)) and Pt/Vulcan XC-72/Nafion (Figure 5A(c)). Thus, thediscussion is reasonable that Pt sites in contact with C werediscriminated among smaller Pt particles in replica Pt-C/Nafion,and the XANES spectrum was compared to theoretical XANESdata (Figure 5A(h)) for the interface Pt sites depicted in Figure1. Even after being tuned to a lower Pt L�1 energy of 11067.0eV, the Pt-C interface site was not discriminated for Pt/VulcanXC-72/Nafion because the site population was too small amongPt sites corresponding to lower Pt L�1 emission energy. It isapparent that the reason was the greater mean Pt particle sizeand predominant population of Pt-Pt bonds in Pt/Vulcan XC-72/Nafion.
The XANES spectra tuned on the higher-energy side of PtL�1 (Figure 4c, d) for replica Pt-C/Nafion resembled thetheoretical spectrum in Figure 5C(g) generated for surface thePt site on the (111) face of Pt38, shifted by +3.5 eV fromspectrum B(g). This XANES shift was rationalized based onthe difference of the fluorescence tune energy and the final-state relaxation effect. Metallic Pt state was selected in theXANES tuned to 11075.4 eV.
Due to the selection rule of the electronic transition (azimuthalquantum number ∆l ) (1; total angular momentum ∆j ) 0,(1), the near-edge transition from L2 (2P1/2) is limited to O4
(2D3/2) at a deeper energy than O5 (2D5/2), whereas those fromL3 (2P3/2) are both limited to O4 and O5.49 This is the reasonwhy the Pt L2-edge white line is weaker than that in Pt L3-edgespectra.35 By changing the fluorescence tune energy between11065.7 and 11075.4 eV (Figure 4c, d), electron-sufficient Ptsites in contact with C (Figure 5A(e), (f)) and relatively electrondeficient Pt sites on/in Pt nanoparticles (Figure 5B, C(e), (f))were discriminated, respectively. In contrast, a negligibledifference was detected by switching the ambient gas from H2
to air for replica Pt-C/Nafion, except for an absorption edgeshift less of than 1 eV (Figure 5e, f). The shape resonance peaknear the L3-edge was reported, for example, by H adsorptionon Pt.35,36,49 One of the possibilities is that the antibonding levelbetween Pt 5d3/2 and the frontier level of the adsorbent wasoccupied for replica Pt-C/Nafion samples. It is also possiblethat a similar shape resonance peak appeared due to adsorbedH in H2 and adsorbed O2 in air. A technical reason may be thatthe XAFS measurements for Pt catalysts on Nafion were doneas in a half-cell and no water was supplied/catalytically producedin samples during the measurements. The contact of Pt withC(solid) and Nafion(liquid) was found to be secure; however,Nafion in pure H2 or air was not entirely mobile and thus mayblock the Pt/gas interface sites.
Implications to the PEFC Cathode Catalyst of ReplicaPt-C. The electric conductivity for Pt-C-Al-MCM-41 wasby 17% superior to that for conventional 20 wt % Pt/VulcanXC-72 (Table 1) probably because catalytically formed C inmesopores was regularly oriented in the [001] direction of Al-MCM-41, despite the low Pt content in Pt-C-Al-MCM-41(0.72 wt %). The comparable conductivity values for Pt-C-Al-MCM-41 and replica Pt-C (Table 1) were also understandableif we think that the nonconducting Al-MCM-41 part wasremoved, but regular orientation of the C rod/tube would belost for the latter.
To enable 0.13 mg Pt cm-2 as the cathode catalyst, 76 mg ofreplica Pt-C (0.84 wt % Pt) was mounted on C paper versus25 mg of 20 wt % Pt/Vulcan XC-72 on C paper (1 mg Pt cm-2)(see Supporting Information). The greater amount of replica
Pt-C mounted caused difficulty in making physical contact ofPt with the electrolyte (wet polymer to transport protons) andoxygen gas at the same time.1 Hence, to enable practical electricpower generation using replica Pt-C catalyst, the Pt content inreplica Pt-C powder should be increased to 20 wt % Pt typicalfor other commercial Pt/C catalysts while keeping the Pt particlesize of 1.2 nm. One possibility is to increase the Al contentfrom 1.11 wt % to the zeolite level of 10-12 wt % to augmentthe cationic Pt complexes exchanged. Another possibility is toutilize a three-dimensional mesoporous template, for example,MCM-48, to stabilize Pt nanoparticles on/in formed C in thethree-dimensional mesopores. The advantage to synthesize metalparticles in a narrow size distribution centered at ∼1 nm and tosecure contact of the metal and C demonstrated in this papercan be applied to nonprecious metal-C catalysts, for example,cobalt or iron porphyrin decomposition50 in mesoporous SiO2-based templates. Carbonization of block copolymer self-assembled with Pt, Pb, and Nb species is another possibility toproduce a Pt-C composite, as recently reported for an anodematerial resistive to CO poisoning.51
Conclusions
Pt nanoparticles introduced by cation group exchange andformed by heating in vacuum at 573 K inside of Al-MCM-41catalyzed C2H2 decomposition to form a C rod/tube. The Al-MCM-41 template was removed with a 15% HF solution. Ptnanoparticles with a mean size of 1.2 nm were obtainedembedded on/in the C matrix. The Pt loading was 0.84 wt %.The replica Pt-C synthesis procedure was supported by thechanges of the specific SBET value from 767 m2 g-1 for Pt-Al-MCM-41 to 35 m2 g-1 for Pt-C-Al-MCM-41 and then to 540m2 g-1 for replica Pt-C. The Pt particles could not be monitoredby XRD both before and after cathode catalytic tests in PEFC,suggesting the stability of 1.2 nm Pt particles embedded on/inthe C matrix. The Pt sites in replica Pt-C pressed to Nafionwere analyzed by Pt L�1-selecting high energy resolution PtL2-edge XANES spectra. The first peak above the absorptionedge for the spectra tuned to 11065.7 eV was weak, suggestingthat interface Pt site received electron transfer from the C incontact. The high energy resolution XANES spectra for bothinterfacial Pt with C and metallic Pt sites were nicely reproducedin theoretical spectra generated using FEFF 8.4. The shaperesonance peak in H2 or in air was not certain probably becausethe antibonding levels were below the Fermi level or the shaperesonance peaks for H and O2 adsorbed were similar. Superiorturnover numbers were tentatively evaluated for the Pt-Creplica in the cathode compared to Pt/Valcun XC-72 due to thedifferences of effective contact of Pt with C versus Pt impregna-tion on C and the diffusion efficiency of O2 in replica Pt-Cpowder (see Supporting Information).
Acknowledgment. The authors are thankful for financialsupport from the Sumitomo Foundation for Basic ScientificResearch (No. 070110). The conventional X-ray absorptionexperiments were performed under the approval of the PhotonFactory Proposal Review Committee (No. 2008G167). The PtL�1 emission and high energy resolution Pt L2-edge X-rayabsorption experiments were performed under the approval ofthe SPring-8 Program Review Committee (No. 2008B1111).The authors thank Dr. Uruga, Dr. Tanida, and Dr. Terada forthe adjustment of beamline optics and technical help at SPring-8and Prof. Kaneko and Prof. Kanoh for the XRD apparatus. Thispaper is part 31 of a state-selective X-ray absorption finestructure series.
1266 J. Phys. Chem. C, Vol. 114, No. 2, 2010 Oka et al.
Supporting Information Available: Supporting text andFigure S1 for PEFC tests. This material is available free ofcharge via the Internet at http://pubs.acs.org.
References and Notes
(1) Gasteiger, H. A.; Markovic, N. M. Science 2009, 324 (5923), 48–49.(2) Zhang, G.; Yamaguchi, T.; Kawakami, H.; Suzuki, T. Appl. Catal.,
B 1992, 1 (3), L15–L20.(3) Xuyen, N. T.; Jeong, H. K; Kim, G.; So, K. P.; An, K. H.; Lee,
Y. H. J. Mater. Chem. 2009, 19 (9), 1283–1288.(4) Plomp, A. J.; Schubert, T.; Storr, U.; de Jong, H. P.; Bitter, J. H.
Topics Catal. 2009, 52 (4), 424–430.(5) Du, H. Y.; Wang, C. H.; Hsu, H. C.; Chang, S. T.; Chen, U. S.;
Yen, S. C.; Chen, L. C.; Shih, H. C.; Chen, K. H. Diamond Relat. Mater.2008, 17 (4/5), 535–541.
(6) Somanathan, T.; Pandurangan, A. J. Porous Mater. 2009, 16 (4),459–464.
(7) Saha, M. S.; Li, R.; Ye, S. Electrochem. Commun. 2009, 11 (2),438–441.
(8) Chen, C.; Chen, M.; Yu, H.; Lu, S.; Chen, C. Jpn. J. Appl. Phys.2008, 47 (4), 2324–2329.
(9) Sun, Y.; Zhuang, L.; Lu, J.; Hong, X.; Liu, P. J. Am. Chem. Soc.2007, 129 (50), 15465–15467.
(10) Sun, C.; Chen, L.; Su, M.; Hong, L.; Chyan, O.; Hsu, C.; Chen,K.; Chang, T.; Chang, L. Chem. Mater. 2005, 17 (14), 3749–3753.
(11) Hayashi, A.; Kitajima, K.; Miyamoto, J.; Yagi, I. Chem. Lett. 2009,38 (4), 346–347.
(12) Wikander, K.; Hungria, A. B.; Midgley, P. A.; Palmqvist, E. C.;Holmberg, K.; Thomas, J. M. J. Colloid Interface Sci. 2007, 305 (1), 204–208.
(13) Joo, S. H.; Choi, S. J.; Oh, I.; Kwak, J.; Liu, Z.; Terasaki, O.; Ryoo,R. Nature 2001, 412 (6843), 169–172.
(14) Hui, C. L.; Li, X. G.; Hsing, I. M. Electrochim. Acta 2005, 51 (4),711–719.
(15) Prabhuram, J.; Wang, X.; Hui, C. L.; Hsing, I. M. J. Phys. Chem.B 2003, 107 (40), 11057–11064.
(16) Wikander, K.; Ekstrom, H.; Palmqvist, A. E. C.; Lindbergh, G.Electrochim. Acta 2007, 52, 6848–6855.
(17) Yano, H.; Inukai, J.; Uchida, H.; Watanabe, M.; Babu, P. K.;Kobayashi, T.; Chung, J. H.; Oldfield, E.; Wieckowski, A. Phys. Chem.Chem. Phys. 2006, 8, 4932–4939.
(18) Ng, Y. H.; Ikeda, S.; Harada, T.; Higashida, S.; Sakata, T.; Mori,H.; Matsumura, M. AdV. Mater. 2007, 19 (4), 597–601.
(19) Zhang, J.; Lima, H. B.; Shao, M. H.; Sasaki, K.; Wang, J. X.;Hanson, J.; Adzic, R. R. J. Phys. Chem. B 2005, 109 (48), 22701–22704.
(20) Service, R. F.; Voss, D. Science 1999, 285 (5428), 682–685.(21) Lim, B.; Jiang, M.; Camargo, P. H. C.; Cho, E. C.; Tao, J.; Lu, X.;
Zhu, Y.; Xia, Y. Science 2009, 324 (5932), 1302–1305.(22) Mayrhofer, K. J. J.; Blizanac, B. B.; Arenz, M.; Stamenkovic, V. R.;
Ross, P. N.; Markovic, N. M. J. Phys. Chem. B 2005, 109 (30), 14433–14440.
(23) Kinoshita, K. J. Electrochem. Soc. 1990, 137 (3), 845–848.(24) Wei, L.; Wang, B.; Wang, Q.; Li, L.; Yang, Y.; Chen, Y. J. Phys.
Chem. C 2008, 112 (45), 17567–17575.
(25) Warren, S. C.; Messina, L. C.; Slaughter, L. S.; Kamperman, M.;Zhou, Q.; Gruner, S. M.; DiSalvo, F. J.; Wiesner, U. Science 2008, 320(5884), 1748–1752.
(26) Bearden, J. A. ReV. Mod. Phys. 1967, 39 (1), 78–124.(27) Zschornack, G. Handbook of X-ray Data; Springer: Berlin/
Heidelberg, Germany, 2007.(28) Izumi, Y.; Obaid, D. M.; Konishi, K.; Masih, D.; Takagaki, M.;
Terada, Y.; Tanida, H.; Uruga, T. Inorg. Chim. Acta 2008, 361, 1149–1156.
(29) Izumi, Y.; Nagamori, H.; Kiyotaki, F.; Masih, D.; Minato, T.;Roisin, E.; Candy, J. P.; Tanida, H.; Uruga, T. Anal. Chem. 2005, 77 (21),6969–6975.
(30) Izumi, Y.; Masih, D.; Roisin, E.; Candy, J. P.; Tanida, H.; Uruga,T. Mater. Lett. 2007, 61, 3833–3936.
(31) de Groot, F. M. F.; Krisch, M. H.; Vogel, J. Phys. ReV. B: Condens.Matter 2002, 66, 195112/1–195112/7.
(32) Vaarkamp, M.; Linders, H.; Koningsberger, D. XDAP, version 2.2.7(2006); XAFS Services International: Woudenberg The Netherlands.
(33) Siegel, S.; Hoekstra, H. R.; Tani, B. S. J. Inorg. Nucl. Chem. 1969,31, 3803–3807.
(34) Ankudinov, L.; Ravel, B.; Rehr, J. J.; Condradson, S. D. Phys. ReV.B 1998, 58, 7565–7576.
(35) Ankudinov, A. L.; Rehr, J. J.; Low, J. J.; Bare, S. R. J. SynchrotronRadiat. 2001, 8, 578–580.
(36) Bazin, D.; Sayers, D.; Rehr, J. J.; Mottet, C. J. Phys. Chem. B1997, 101 (27), 5332–5336.
(37) Safonova, O. V.; Tromp, M.; Bokhoven, J. A. v.; de Groot,F. M. W.; Evans, J.; Glatzel, P. J. Phys. Chem. B 2006, 110 (33), 16162–16164.
(38) Humbolt, F.; Didillon, D.; Lepeltier, F.; Candy, J. P.; Corker, J.;Clause, O.; Bayard, F.; Basset, J. M. J. Am. Chem. Soc. 1998, 120 (1),137–146.
(39) Terheijiden, J.; Van Koten, G.; Van Beek, J. A. M.; Vriesema, B. K.;Kellogg, R. M.; Zoutberg, M. C.; Stam, C. H. Organometallics 1987, 6,89–93.
(40) Wang, L.; Johnson, D. D. J. Am. Chem. Soc. 2007, 129 (12), 3658–3664.
(41) Kruk, M.; Jaroniec, M.; Kim, J. M.; Ryoo, R. Langmuir 1999, 15(16), 5279–5284.
(42) Glatzel, P.; Bergmann, U. Coord. Chem. ReV. 2005, 249, 65–95.(43) de Groot, F. Chem. ReV. 2001, 101 (6), 1779–1808.(44) Izumi, Y.; Nagamori, H. Bull. Chem. Soc. Jpn. 2000, 73 (7), 1581–
1587.(45) Izumi, Y.; Kiyotaki, F.; Minato, T.; Seida, Y. Anal. Chem. 2002,
74 (15), 3819–3823.(46) Izumi, Y.; Kiyotaki, F.; Seida, Y. J. Phys. Chem. B 2002, 106 (7),
1518–1520.(47) Izumi, Y.; Masih, D.; Aika, K.; Seida, Y. J. Phys. Chem. B 2005,
109 (8), 3227–3232.(48) Izumi, Y.; Glaser, T.; Rose, K.; McMaster, J.; Basu, P.; Enemark,
J. H.; Hedman, B.; Hodgson, K. O.; Solomon, E. I. J. Am. Chem. Soc.1999, 121 (43), 10035–10046.
(49) Koningsberger, D. C.; de Graaf, J.; Mojet, B. L.; Ramaker, D. E.;Miller, J. T. Appl. Catal., A 2000, 191, 205–220.
(50) Bashyam, R.; Zelenay, P. Nature 2006, 443 (7107), 63–66.(51) Orilall, M. C.; Matsumoto, F.; Zhou, Q.; Sai, H.; Abruna, H. D.;
DiSalvo, F. J.; Wiesner, U. J. Am. Chem. Soc. 2009, 131 (26), 9389–9395.
JP909934R
Analysis and Catalysis of a Replica 1.2 nm Pt-C Composite J. Phys. Chem. C, Vol. 114, No. 2, 2010 1267