Embed Size (px)
Citation preview

1
Synthesis and Rheological Characterization of Latexes
Stabilized by Methacrylic Acid Containing
Macromonomers
Ingeborg Schreur-Piet,a Alexander M. van Herk,a,b Jozua Laven,a and Johan P.A. Heutsa*
aDepartment of Chemical Engineering & Chemistry, Eindhoven University of Technology, PO
Box 513, 5600 MB Eindhoven, The Netherlands
bInstitute of Chemical and Engineering Sciences, Agency for Science, Technology and
Research, 1 Pesek Road, Jurong Island, Singapore 627833
*Author for correspondence: [email protected]
KEYWORDS: Emulsion polymerization, reactive surfactant, latex rheology, catalytic chain
transfer
Page 1 of 49
ACS Paragon Plus Environment
Industrial & Engineering Chemistry Research
123456789101112131415161718192021222324252627282930313233343536373839404142434445464748495051525354555657585960

2
ABSTRACT
A range of copolymers of methacrylic acid (MAA) macromonomers prepared by cobalt-
catalyzed chain transfer and methyl methacrylate (MMA) and/or butyl acrylate (BA) was
synthesized and used as stabilizer in the emulsion polymerization of MMA. Although clear
differences were observed in polymerization rates using the different MAAx-MMAy
stabilizers, these differences were not as clearly reflected in the particle sizes, nor in the rates
per particle. However, a clear difference between these systems and those stabilized by
MAAx-BAy was observed. The latter systems were all characterized by much smaller particle
sizes and corresponding higher rates of polymerization. In addition, the molar masses in the
latter systems were all significantly larger than those obtained in the MAAx-MMAy stabilized
system, in which the stabilizers act as "sulfur-free" RAFT agents. Interestingly, the prepared
latexes showed a range of appearances varying from "milky" to "gel-like" depending on the
used stabilizer. The MAAx-BAy stabilized latexes had in general a lower viscosity and a
significantly smaller (if any) yield stress than the MAAx-MMAy stabilized latexes, and in the
latter case the rheological behavior was found to depend on the block lengths in and
concentration of the stabilizer.
Page 2 of 49
ACS Paragon Plus Environment
Industrial & Engineering Chemistry Research
123456789101112131415161718192021222324252627282930313233343536373839404142434445464748495051525354555657585960
3
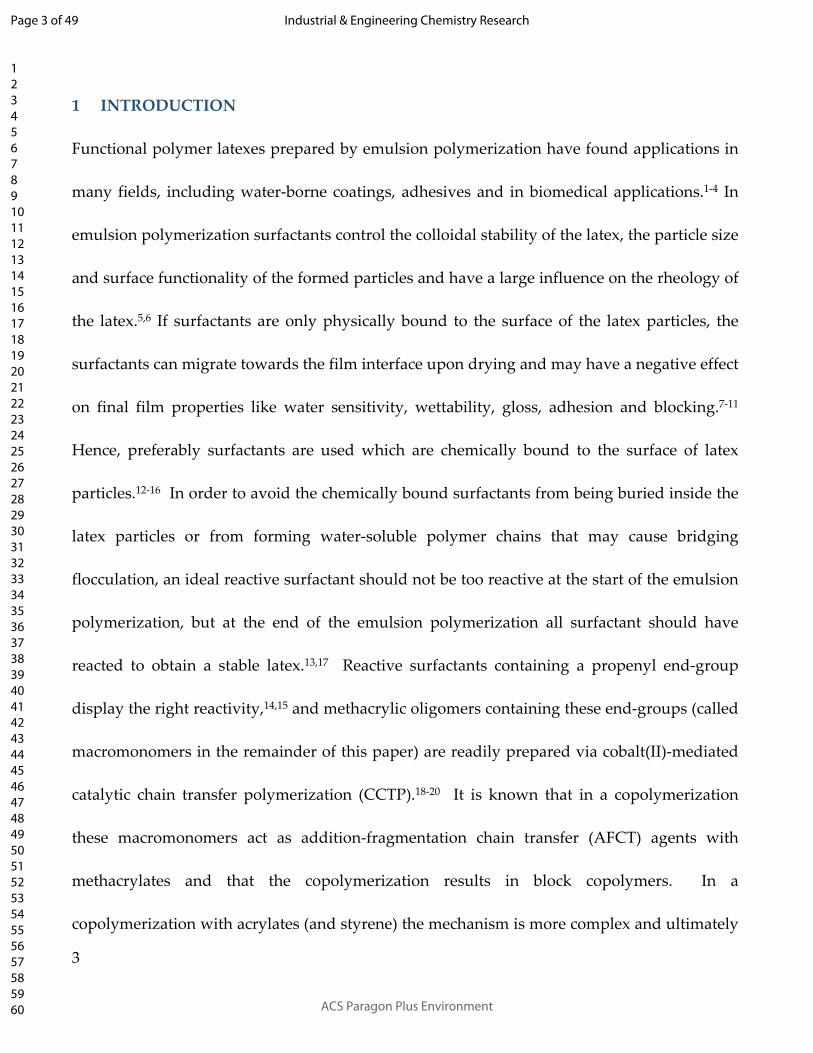
1 INTRODUCTION
Functional polymer latexes prepared by emulsion polymerization have found applications in
many fields, including water-borne coatings, adhesives and in biomedical applications.1-4 In
emulsion polymerization surfactants control the colloidal stability of the latex, the particle size
and surface functionality of the formed particles and have a large influence on the rheology of
the latex.5,6 If surfactants are only physically bound to the surface of the latex particles, the
surfactants can migrate towards the film interface upon drying and may have a negative effect
on final film properties like water sensitivity, wettability, gloss, adhesion and blocking.7-11
Hence, preferably surfactants are used which are chemically bound to the surface of latex
particles.12-16 In order to avoid the chemically bound surfactants from being buried inside the
latex particles or from forming water-soluble polymer chains that may cause bridging
flocculation, an ideal reactive surfactant should not be too reactive at the start of the emulsion
polymerization, but at the end of the emulsion polymerization all surfactant should have
reacted to obtain a stable latex.13,17 Reactive surfactants containing a propenyl end-group
display the right reactivity,14,15 and methacrylic oligomers containing these end-groups (called
macromonomers in the remainder of this paper) are readily prepared via cobalt(II)-mediated
catalytic chain transfer polymerization (CCTP).18-20 It is known that in a copolymerization
these macromonomers act as addition-fragmentation chain transfer (AFCT) agents with
methacrylates and that the copolymerization results in block copolymers. In a
copolymerization with acrylates (and styrene) the mechanism is more complex and ultimately
Page 3 of 49
ACS Paragon Plus Environment
Industrial & Engineering Chemistry Research
123456789101112131415161718192021222324252627282930313233343536373839404142434445464748495051525354555657585960

4
leads to graft copolymers.18-23 In earlier work we synthesized methacrylic acid (MAA)
macromonomers via CCTP and used these directly in an emulsion polymerization to form in
situ amphiphilic copolymers,24 in a mechanism similar to what is commonly known as
polymerization induced self-assembly (PISA).25-28 We observed that only in cases in which
these water-soluble MAA macromonomers were sufficiently quickly converted into
amphiphilic copolymers stable latexes could be produced. This was the case for emulsion
polymerizations of the (hydrophobic) monomers butyl acrylate (BA) and butyl methacrylate
(BMA), but in the case of (the more hydrophilic) methyl methacrylate (MMA) the reaction
with the MAA macromonomer was probably too slow and no stable latexes could be
produced. In order to circumvent this problem, we decided to separate the phases of
stabilizer formation and emulsion polymerization in the current study. Hence we pre-
polymerized the MAA macromonomer with MMA and BA to yield the amphiphilic
copolymers M and B, respectively, and used these as stabilizers in the emulsion
polymerization of MMA.
Page 4 of 49
ACS Paragon Plus Environment
Industrial & Engineering Chemistry Research
123456789101112131415161718192021222324252627282930313233343536373839404142434445464748495051525354555657585960

5
R
COOBu
v
COOH
yCOOH
BuOOC
R'
z
BuOOC
Hx(B)
The different structures of M (MAAx-MMAy) and B (MAAx-BAy) reflect the fact that
methacrylates and acrylates react differently with the methacrylic macromonomers. 18,22 These
different architectures (but similar overall compositions) lead to potentially different
stabilizing and resulting rheological properties and these properties are discussed in the final
part of this paper.
2 EXPERIMENTAL SECTION
2.1 Materials
All monomers, MMA, BA and t-BMA were obtained from Sigma-Aldrich (99 %). The
monomers were passed over a column of inhibitor remover (Aldrich) to remove the inhibitor.
Page 5 of 49
ACS Paragon Plus Environment
Industrial & Engineering Chemistry Research
123456789101112131415161718192021222324252627282930313233343536373839404142434445464748495051525354555657585960

6
N,N'-azobis(isobutyronitrile) (AIBN, Merck) was recrystallized from methanol. The bis-
methanol complex of cobaltoxime boron fluoride (COBF) was prepared as described
previously29 (chain transfer constant CT for MMA in bulk = 34·103 at 60 °C). Toluene (AR,
Biosolve), dichloromethane (AR, Biosolve), tetrahydrofuran (stabilized with BHT, Biosolve)
and trifluoro acetic acid (95%, Aldrich) were used as received. Potassium persulfate (KPS, p.a.)
and sodium carbonate (dehydrated, p.a.) were purchased from Merck and used as received.
2.2 Synthesis of Copolymer Stabilizers
First, a range of t-BMA-macromonomers with number-average degrees of polymerization,
DPn, of 4, 6 and 12 (as determined by 1H-NMR) were prepared as described previously.24
These macromonomers were then reacted with MMA or BA to give t-BMAx-MMAy and t-
BMAx-BAy "pre-cursor" copolymers, respectively, which were subsequently treated with
trifluoro acetic acid to yield the corresponding MAAx-MMAy and MAAx-BAy copolymer
stabilizers. As a typical example of the followed procedure we report here the synthesis of
MAA12-MMA2; for the exact quantities used for all other copolymer stabilizers we refer to the
SI. First, 4.0 g of MMA (0.04 mol) was added to a 100 mL round bottom flask containing a
magnetic stirring bar. After the addition of 22 mg AIBN (0.13·10-3 mol), the flask was sealed
airtight with a septum and the solution was deoxygenated by purging with nitrogen in an ice
bath for 30 minutes. Simultaneously 45 g of a toluene solution containing t-BMA
macromonomer (44 wt% macromonomer, DPn = 12) was deoxygenated in a separate 100 mL
Page 6 of 49
ACS Paragon Plus Environment
Industrial & Engineering Chemistry Research
123456789101112131415161718192021222324252627282930313233343536373839404142434445464748495051525354555657585960
7
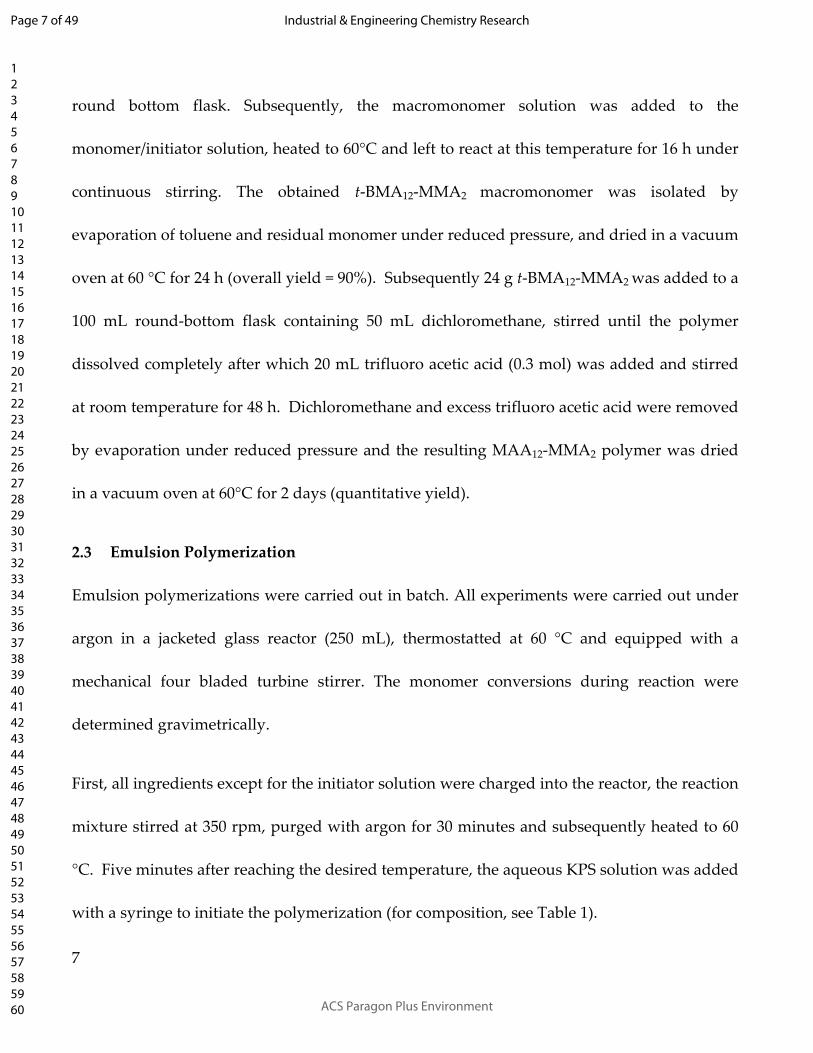
round bottom flask. Subsequently, the macromonomer solution was added to the
monomer/initiator solution, heated to 60°C and left to react at this temperature for 16 h under
continuous stirring. The obtained t-BMA12-MMA2 macromonomer was isolated by
evaporation of toluene and residual monomer under reduced pressure, and dried in a vacuum
oven at 60 °C for 24 h (overall yield = 90%). Subsequently 24 g t-BMA12-MMA2 was added to a
100 mL round-bottom flask containing 50 mL dichloromethane, stirred until the polymer
dissolved completely after which 20 mL trifluoro acetic acid (0.3 mol) was added and stirred
at room temperature for 48 h. Dichloromethane and excess trifluoro acetic acid were removed
by evaporation under reduced pressure and the resulting MAA12-MMA2 polymer was dried
in a vacuum oven at 60°C for 2 days (quantitative yield).
2.3 Emulsion Polymerization
Emulsion polymerizations were carried out in batch. All experiments were carried out under
argon in a jacketed glass reactor (250 mL), thermostatted at 60 °C and equipped with a
mechanical four bladed turbine stirrer. The monomer conversions during reaction were
determined gravimetrically.
First, all ingredients except for the initiator solution were charged into the reactor, the reaction
mixture stirred at 350 rpm, purged with argon for 30 minutes and subsequently heated to 60
°C. Five minutes after reaching the desired temperature, the aqueous KPS solution was added
with a syringe to initiate the polymerization (for composition, see Table 1).
Page 7 of 49
ACS Paragon Plus Environment
Industrial & Engineering Chemistry Research
123456789101112131415161718192021222324252627282930313233343536373839404142434445464748495051525354555657585960

8
Page 8 of 49
ACS Paragon Plus Environment
Industrial & Engineering Chemistry Research
123456789101112131415161718192021222324252627282930313233343536373839404142434445464748495051525354555657585960

9
Table 1. Recipe of a batch emulsion polymerization at T = 60 °C
Ingredient Amount
Water 120 g
Na2CO3 0.4 g (0.02 M)
Polymeric stabilizer Variable; 1.5 g (5 wt%a) is standard level
MMA 30 g (solids content = 20%)
K2S2O8 (KPS) 0.08 g (0.25 wt%a = 2.5·10-3 M)
a wt% = weight percentage relative to monomer (= g/100 g of monomer).
2.4 Analysis
Nuclear Magnetic Resonance
1H NMR spectra were recorded on a Varian MercuryVx spectrometer at 400 MHz chloroform-
d1, methanol-d4, DMSO-d6, THF-d8 and tetramethylsilane were used as solvents and internal
standard, respectively. All NMR results were obtained after solvent suppression of D2Oδ=4.8.
MALDI-ToF MS
MALDI-ToF MS spectra were measured on a PerSeptive Biosystems Voyager-DE STR
MALDI-ToF MS spectrometer equipped with 2 m flight tubes for linear mode and 3 m flight
tubes for reflector mode and a 337 nm nitrogen laser (3 ns pulse). All mass spectra were
obtained with an accelerating potential of 20 kV in positive ion and reflector mode with
delayed extraction. Data were processed with Voyager software. Simulations were performed
Page 9 of 49
ACS Paragon Plus Environment
Industrial & Engineering Chemistry Research
123456789101112131415161718192021222324252627282930313233343536373839404142434445464748495051525354555657585960
10
with the MaldiAnalysis software by Staal and Willemse.30,31 As matrix 2,4,6-
trihydroxyacetophenone (80 mg/mL THF or methanol) was used and diammonium hydrogen
citrate (5 mg/mL THF or methanol) as cationating agent. Acrylate containing polymer samples
were dissolved in THF and methacrylic acid containing polymer samples were dissolved in
methanol at concentrations of 5 mg/mL solvent. Analyte solutions were prepared by mixing
solutions of matrix, salt and polymer at a 4:1:4 volume ratio. Subsequently, a spot of 0.30 µL of
such a mixture was put on the sample plate and dried at room temperature.
Dynamic Light Scattering
Dynamic light scattering (DLS) measurements were performed on a Nanotrac Ultra (Microtrac
systems). The used laser was a gallium-aluminum-arsenide semiconductor diode laser with a
wavelength of 780 nm and a power of 3-5 mW. Angle of incident-to-scattered light is 180°
(backscatter). This technique uses the Brownian motion of the molecules. The number-average
diameters (Dn) and the polydispersity indices (DPI) were determined using the cumulant
algorithm according to international standards ISO22412 and ISO13321).32,33
Size Exclusion Chromatography
Size exclusion chromatography (SEC) was carried out using a Waters Alliance system
equipped with a Waters 2695 separation module, a Waters 2414 refractive index detector (40
°C), a Waters 2487 dual UV absorbance detector, a PSS SDV 5 µm bead size guard column
followed by two PSS SDV 5 µm bead size linearXL columns in series (300 * 8 mm) at 40°C.
Page 10 of 49
ACS Paragon Plus Environment
Industrial & Engineering Chemistry Research
123456789101112131415161718192021222324252627282930313233343536373839404142434445464748495051525354555657585960

11
THF with 1 v/v-% acetic acid was used as eluent at a flow rate of 1.0 mL min-1. The system
was calibrated with polystyrene standards (Polymer Laboratories, Mn = 580 - 7.1·106 g mol-1).
Potentiometric Titrations
Potentiometric titrations were conducted with a Scott Titronic Titration System with a Scott
pHG201 pH glass electrode. A 0.0099 M aqueous NaOH solution was used as titrant. The
precise concentration of NaOH was obtained by titrating with a sodium oxalate solution of a
known concentration. The titrations were performed at room temperature, in a titration vessel
filled with an exactly measured quantity (ca. 10 mL) of a sample, under continuous stirring.
The titration was carried out by adding titrant in doses of 0.2-0.04 mL. A 10 s time interval
was allowed between two subsequent doses to ensure that the equilibrium of the reaction was
reached.
For the determination of the carboxylic acid content in the water phase the latex was
centrifuged at 40,000 rpm for 3 h and a part of the clear top layer was used for titration. For
the determination of the carboxylic acid content at the surface of the particles the latex was
diluted to a solid content of 5 wt%, and titrated with the NaOH solution; the earlier obtained
amount of acid in the water phase was subtracted to obtain the amount of acid on the particles
surface. The amount of carboxylic acid buried inside the particles was determined by means
of a mass balance, i.e., deduced from the initial amount of carboxylic monomer introduced
Page 11 of 49
ACS Paragon Plus Environment
Industrial & Engineering Chemistry Research
123456789101112131415161718192021222324252627282930313233343536373839404142434445464748495051525354555657585960

12
and the determined amounts of carboxylic groups on the surface of the particles and in the
water phase.34-37
Zeta Potential Analysis and Critical Micelle Concentration Measurements
Zeta potential measurements using Laser Doppler Micro-electrophoresis were performed on a
Zetasizer Nano ZS (Malvern Instruments). An electric field was applied to a highly diluted
dispersion of latex particles, which then move with a velocity related to their zeta potential.
The velocity was measured using PALS (Phase Analysis Light Scattering); the used laser was a
4 mW He-Ne laser with a wavelength of 633 nm. The critical micelle concentrations (CMC)
were determined from the intensity of the scattered light as a function of the concentration of
the copolymer. All copolymers were dissolved in an aqueous Na2CO3 solution (4·10-2 M) at
pH = 10; dilutions were made with the same Na2CO3 solution.38,39
Rheology
Rheological measurements were performed at 20 °C in the auto optimization mode using the
Smoluchowski model, on an Anton Paar Physica MCR 301 Rheometer with the concentric
cylinder CC27 system (inner and outer diameter are 26.66 mm and 28.92 mm, respectively).
For each latex first dynamic measurements were performed twice with a constant frequency
of 6.3 rad/s and a strain of 0.001. Before and between measurements the latex was “stirred” at
Page 12 of 49
ACS Paragon Plus Environment
Industrial & Engineering Chemistry Research
123456789101112131415161718192021222324252627282930313233343536373839404142434445464748495051525354555657585960

13
a rate of 100 s-1 for 100 s. Then steady state viscosity measurements were performed using
different shear rates between 0.001 and 100 s-1 (for these experiments we report the viscosities
after the viscosities reached a constant value). The linear viscoelastic region was determined
by performing a strain sweep experiment at angular frequency of 6.3 rad/s. A strain of 0.001
was chosen because this strain was sufficiently high to effectively suppress noise and small
enough to stay in the linear region (see SI).
3 RESULTS AND DISCUSSION
3.1 Synthesis and Characterization of Copolymer Stabilizers
A range of amphiphilic copolymers of MMA and BA with MAA blocks were synthesized from
t-BMA macromonomers produced via CCTP and characterized. A summary of these results is
given in Table 2 (for details, see SI). The copolymer compositions were determined by 1H
NMR. Since MAAx-MMAy is a block copolymer with a vinylic end group, the intensity of the
signal of the vinyl end group could also be used to determine the (number average) molar
mass (Mn). In the case of MAAx-BAy, the end groups are less well-defined and therefore Mn
was estimated from SEC.
Page 13 of 49
ACS Paragon Plus Environment
Industrial & Engineering Chemistry Research
123456789101112131415161718192021222324252627282930313233343536373839404142434445464748495051525354555657585960

14
Table 2. Characteristics of Copolymer Stabilizersa
Sample codeb fMc Mn
d
(g/mol)
Ðe FMf CMCg
(M)
MAA12-MMA2 0.22 1.3·103 2.7 0.16 3.2·10-3
MAA12-MMA6 0.42 1.6·103 6.1 0.32 5.4·10-5
MAA12-MMA15 0.59 2.6·103 3.9 0.56 1.6·10-5
MAA4-BA6 0.54 2.3·103 1.9 0.60 3.3·10-3
MAA6-BA6 0.54 5.5·103 2.2 0.51 2.2·10-3
MAA12-BA2 0.20 2.1·103 1.3 0.19 1.1·10-3
MAA12-BA6 0.40 3.2·103 1.7 0.47 2.0·10-3
MAA12-BA14 0.60 1.3·104 2.1 0.61 3.1·10-4
a Copolymers of MAAx-MMAy and MAAx-BAy synthesized from t-BMAx macromonomer DPnNMR = 4,
6 resp. 12. b The sample code reflects the average copolymer composition. For MAAx-MMAy, x = number of MAA units and y = number of MMA units in the copolymer; for MAAx-BAy, x : y = number of MAA units : BA units in the copolymer. In both cases, x and y are estimated from FM using DPn = 4, 6 resp. 12 for the MAAx block. c fM = mole fraction of the comonomer MMA or BA in the feed (wrt to all monomer units - all MAA units in the MAA-macromonomes are counted separately). d Number-average molar mass estimated via 1H NMR (for MAAx-MMAy, determined from chain length of MAAx and FM) and SEC (for MAAx-BA)y. e Dispersity of t-BMAx-MMAy and t-BMAx-BAy copolymers determined by SEC. f FM = mole fraction of comonomer MMA or BA in the copolymer, estimated from 1H NMR (see S.I.); standard error ≈ 0.04, all NMR results were obtained after solvent suppression of D2Oδ=4.8; g At 25 °C, standard error ca. 5%.
Page 14 of 49
ACS Paragon Plus Environment
Industrial & Engineering Chemistry Research
123456789101112131415161718192021222324252627282930313233343536373839404142434445464748495051525354555657585960

15
Critical micelle concentrations (CMC) of the copolymers were determined by DLS and from
Table 2 it can be seen that, as expected, the CMC of the copolymers are all lower than that of
sodium dodecyl sulfate (CMC = 9.0·10-3 M at 25°C),40,41 a commonly used surfactant in
emulsion polymerization. For the MAAx-MMAy copolymers the CMC clearly decreases with
increasing MMA block length (at fixed MAA block length), but for the MAAx-BAy copolymers
no clear trend is observed, which may be caused by the fact that these copolymers consist of a
more complex mixture of structures as discussed below.
More detailed structural information about the stabilizers was obtained by MALDI analysis
and the spectra for the MAAx-MMAy (specifically of MAA12-MMA15) and MAAx-BAy
(specifically of MAA6-BA6) stabilizers are shown Figures 1 and 2, respectively. In order to aid
the interpretation of these spectra, simplified reaction mechanisms for the two
copolymerizations of the t-BMA macromonomer precursors are shown in Schemes 1 and 2,
respectively. The copolymerization of the t-BMA macromonomer with MMA (Scheme 1)
proceeds via the addition-fragmentation chain transfer process first described by Moad and
co-workers23 and recently coined "sulfur-free RAFT" by Haddleton and coworkers.42,43 The
main product of this reaction is a block copolymer with propenyl end group (pM2), with
potential other products being macromonomers pM1', pM2' and pM3, and possible
termination (by combination) products that we lumped into the same overall structure pM4.
This is indeed observed in the MALDI spectra in Figure 1, where the simulated spectrum of
M2 (i.e., the MAA-containing macromonomer that results from hydrolysis of the precursor
Page 15 of 49
ACS Paragon Plus Environment
Industrial & Engineering Chemistry Research
123456789101112131415161718192021222324252627282930313233343536373839404142434445464748495051525354555657585960

16
pM2) in Figure 1c shows excellent agreement with the experimental spectrum shown in Figure
1b. The majority of the peaks in Figure 1 can be assigned to M2. Also peaks of M2’ are
observed, but no significant amounts of macromonomer M3 or termination products M4. (See
S.I. for more details).
Scheme 1. Simplified overview of the reaction mechanism for copolymerization and possible
products of t-BMA macromonomer and MMA, R and R’ = H or C(CH3)2CN. The labels pMX (with X
= 1 - 4) are used to indicate the precursor molecules for stabilizers MX (with X = 1 - 4) in Figure 1.
Page 16 of 49
ACS Paragon Plus Environment
Industrial & Engineering Chemistry Research
123456789101112131415161718192021222324252627282930313233343536373839404142434445464748495051525354555657585960

17
H
COOtBMA COOtBMA
x
H
COOtBMA COOMe
x
COOtBMA
y
H
COOtBMA COOtBMA
x-1
H
COOtBMA COOMe
x
COOMe
y-1
COOMe
y-1
COOMe
MMA
AIBN
CN COOMe
y
COOtBMACN
MMA
RR'
COOtBMA COOMe
x yH
COOMe
y
COOMe
Other final products
pM1'
H
COOMe
y
COOtBMA
pM2' pM4
pM2
pM1
pM3
pMX MXHydrolysis
Page 17 of 49
ACS Paragon Plus Environment
Industrial & Engineering Chemistry Research
123456789101112131415161718192021222324252627282930313233343536373839404142434445464748495051525354555657585960

18
Page 18 of 49
ACS Paragon Plus Environment
Industrial & Engineering Chemistry Research
123456789101112131415161718192021222324252627282930313233343536373839404142434445464748495051525354555657585960

19
Figure 1. MALDI-ToF MS spectrum of MAA12-MMA15; (a) overview, red rectangle shows the
range of the enlarged spectrum in (b); (b) enlarged spectrum for m/z = 970 — 1120 g/mol
(same labeling as in Scheme 1) and (c) simulation of MAAx-MMAy macromonomer (M2) with
Na+ as cationating agent, and DAC-THAP as salt-matrix combination.
The spectrum of the MAAx-BAy (Figure 2) is much more complicated than that of MAAx-
MMAy shown in Figure 1 and is virtually impossible to interpret without considering the
mechanism for the copolymerization of t-BMA macromonomer with BA shown in Scheme 2
(again we used pBX to indicate the precursor to stabilizer BX).18,22 When a radical with a BA
terminal unit reacts with an t-BMA macromonomer (pB1 in Scheme 2) then it will first
undergo an addition-fragmentation step that results in a macromonomer containing a BA
penultimate group (e.g., pB2, pB3 or pB5). This macromonomer with a BA penultimate group
will now react as a true comonomer when a BA radical adds to its double bond and a graft is
Page 19 of 49
ACS Paragon Plus Environment
Industrial & Engineering Chemistry Research
123456789101112131415161718192021222324252627282930313233343536373839404142434445464748495051525354555657585960
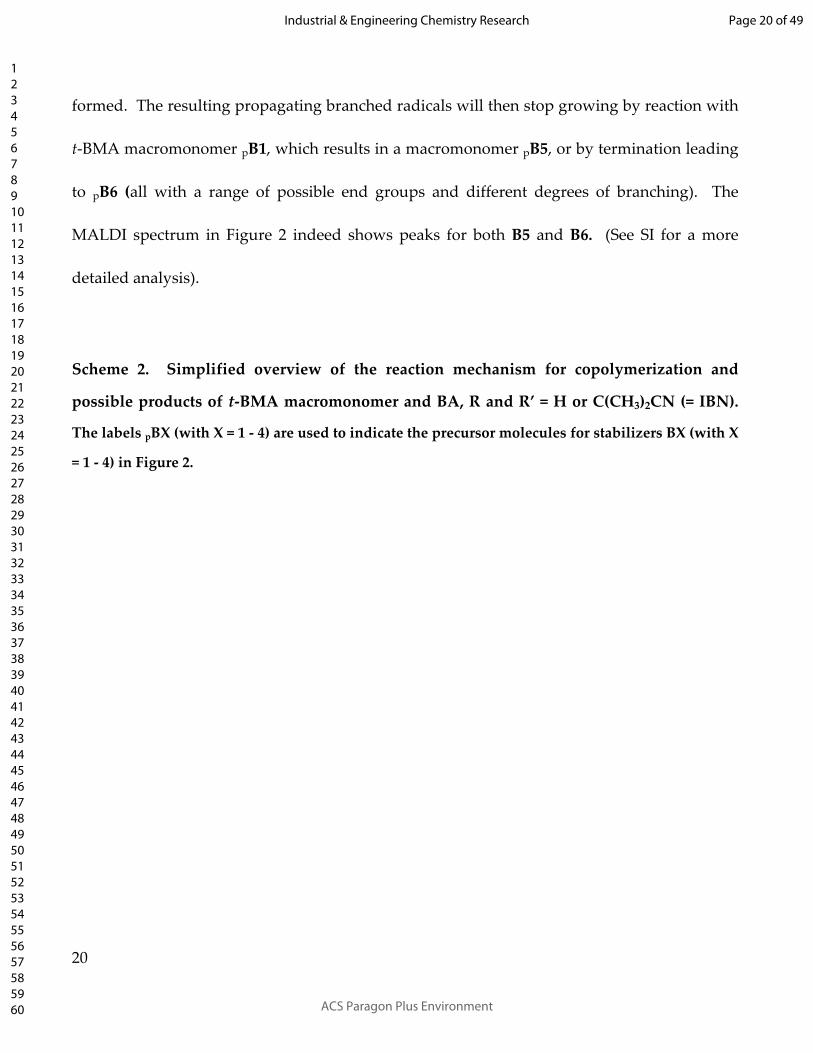
20
formed. The resulting propagating branched radicals will then stop growing by reaction with
t-BMA macromonomer pB1, which results in a macromonomer pB5, or by termination leading
to pB6 (all with a range of possible end groups and different degrees of branching). The
MALDI spectrum in Figure 2 indeed shows peaks for both B5 and B6. (See SI for a more
detailed analysis).
Scheme 2. Simplified overview of the reaction mechanism for copolymerization and
possible products of t-BMA macromonomer and BA, R and R’ = H or C(CH3)2CN (= IBN).
The labels pBX (with X = 1 - 4) are used to indicate the precursor molecules for stabilizers BX (with X
= 1 - 4) in Figure 2.
Page 20 of 49
ACS Paragon Plus Environment
Industrial & Engineering Chemistry Research
123456789101112131415161718192021222324252627282930313233343536373839404142434445464748495051525354555657585960

21
H
COOtBMA COOtBMA
x
R
COOtBMA COOBu
x
COOBu
y-1
BA
H
COOtBMA COOtBMA
x-1
R
COOBu
v
COOtBMA
yBuOOC
CN
R
COOtBMA COOBu
x
COOtBMA
y
pB2
pB1
R
COOBu
v
COOtBMA
yCOOtBMA
BuOOC
z
COOBu COOBu
COOtBMA
RxHx
BA+
in terms of mass
Possible end products
R
COOBu
v
COOtBMA
yCOOtBMA
BuOOC
z'
COOBu
R1
Hx
IBN
COOBu COOtBMA
y'
pB3
pB5
IBNR
COOBu
y'
pB4 pB6
R
COOBu
v
COOtBMA
yCOOtBMA
BuOOC
z'
BuOOC
Hx
COOH
=
Page 21 of 49
ACS Paragon Plus Environment
Industrial & Engineering Chemistry Research
123456789101112131415161718192021222324252627282930313233343536373839404142434445464748495051525354555657585960

22
Figure 2. (a) MALDI–ToF MS spectrum of MAA6-BA6, m/z = 650 — 2650 g/mol, used salt-
matrix combination: DAC-THAP, red rectangle shows the range of the enlarged spectrum in
(b); (b) Enlarged spectrum m/z = 950 — 1100 g/mol.
Page 22 of 49
ACS Paragon Plus Environment
Industrial & Engineering Chemistry Research
123456789101112131415161718192021222324252627282930313233343536373839404142434445464748495051525354555657585960

23
3.2 Emulsion Polymerization of Methyl Methacrylate
Batch emulsion polymerizations of MMA have been performed with MAAx-MMAy and
MAAx-BAy copolymeric stabilizers. For all polymerizations the kinetics were studied and the
final latexes were characterized.
In Figure 3 the conversion vs. time curves of the emulsion polymerizations with the different
stabilizers always at 5 wt% are shown and it is clear that all display typical ab initio emulsion
polymerization behavior.
Figure 3. (a) Conversion vs. time curve of the emulsion polymerization of MMA containing 5 wt% of stabilizer, other conditions as in Table 1: (a) MAAx-MMAy copolymers: () MAA12-
MMA2; () MAA12-MMA6 and () MAA12MMA15. (b) MAAx-BAy copolymers: () MAA4-BA6; () MAA6-BA6; () MAA12-BA2; () MAA12-BA6 and () MAA12-BA14.
In Figure 3a the conversion-time curves for the emulsion polymerization of MMA with
MAA12-MMAy stabilizers are shown. The curves show clearly that the overall polymerization
rate increases with an increasing hydrophobic block length of the stabilizer. This would
Page 23 of 49
ACS Paragon Plus Environment
Industrial & Engineering Chemistry Research
123456789101112131415161718192021222324252627282930313233343536373839404142434445464748495051525354555657585960

24
suggest that with increasing hydrophobic block length a larger number of particles (Np) is
obtained, but this is not supported by the measured particle sizes and derived particle
numbers as listed in Table 3 (it should be noted here that the polymerization using MAA12-
MMA2 showed significant coagulation - 7% - which was removed before further analyses).
We cannot discern an obvious trend in these data and we expect the polymerization behavior
to be more complicated than what can be captured by simple emulsion polymerization theory.
What can, however, be concluded from Figure 3a is that nucleation is fastest for the stabilizer
with the largest hydrophobic block and this is conceivably explained by the fact that these
stabilizers more easily form (block copolymer) micelles that act as a "seed" for the
polymerization. The results for other concentrations of the stabilizers not shown graphically
are summarized in Table 3 and when considering the concentration dependencies within a
series of the same stabilizer molecule, some clearer trends appear. In general (with the
exception of the lowest concentration of MAA12-MMA2), particles sizes decrease (and Np
increases) with increasing stabilizer concentration, as expected for conventional surfactants.
Rates per particle are relatively constant and experimental uncertainty precludes us from
drawing any definite conclusions. However, it is interesting to note that the systems with the
smallest particles also have the lowest rates per particle.
The conversion vs time data for a range of MAAx-BAy stabilized emulsion polymerizations are
shown in Figure 3b and the first thing that one notices is that all these polymerizations are
significantly faster than the MAAx-MMAy stabilized polymerizations (Figure 3a) with the
Page 24 of 49
ACS Paragon Plus Environment
Industrial & Engineering Chemistry Research
123456789101112131415161718192021222324252627282930313233343536373839404142434445464748495051525354555657585960

25
same stabilizer contents (all 5 wt% - with similar molar quantities of hydrophilic MAA units).
Comparing these two systems we may conclude that this large difference in rate is caused by
different particle numbers, as the obtained particle sizes in the MAAx-BAy systems are
significantly smaller than those obtained in the MAAx-MMAy systems (see Table 3). This in
turn suggests that the stabilizing properties of the MAAx-BAy molecules are better than those
of MAAx-MMAy.44 Within this series of MAAx-BAy experiments, no clear trends are
discernable in Figure 3b and Table 3. The only result that "sticks out" are those for MAA12-
BA2, which is the most hydrophilic stabilizer (and it should be noted here that MAA12-BA2 is
an "average composition" denoting a range of different molecules, including those with only 1
or 0 BA units). This system is significantly slower than all the others and the particle sizes are
much larger, which in retrospect, is not unexpected. Rates per particle are similar for all these
systems, but are all smaller than those for the MAAx-MMAy systems. When considering all
the rates per particle summarized in Table 3, then the data suggest that the rate per particle
increases with increasing particle size, which would be consistent with decreasing exit and
termination rates.45
Table 3. Characteristics of the Synthesized Latexes
Stabilizer CSa
(mM)
CMAAb
(mM)
Dnc
(nm)
dX/dtd
(min-1)
Npe
(m-3)
rppf
(m3/min)
Mng
(kg/mol
)
Mpg
(kg/mol
)
Ðg
MAA12-MMA2 5.2 62 162 ± 14 7·10-3 8·1019 9·10-23 212 830 2.5
Page 25 of 49
ACS Paragon Plus Environment
Industrial & Engineering Chemistry Research
123456789101112131415161718192021222324252627282930313233343536373839404142434445464748495051525354555657585960

26
7.0 83 177 ± 19 1·10-2 6·1019 2·10-22 65 620 9.110* 118 162 ± 20 9·10-3 6·1019 2·10-22 70 370 5.819 230 120 ± 9 5·10-3 8·1019 6·10-23 15 140 9.0
5.0 60 157 ± 14 1·10-2 1·1020 1·10-22 111 420 4.3MAA12-MMA6
7.7* 92 141 ± 25 1·10-2 1·1020 1·10-22 46 230 6.3
4.9* 59 161 ± 15 2·10-2 5·1019 3·10-22 116 1070 6.5MAA12-
MMA15
7.7 92 138 ± 17 1·10-2 1·1020 8·10-23 56 450 9.3MAA4-BA6 5.8* 51 83 ± 22 3·10-2 7·1020 5·10-23 >104 h
MAA6-BA6 2.4* 61 69 ± 17 4·10-2 1·1021 3·10-23 >104 h
MAA12-BA2 6.2* 124 118 ± 9 2·10-2 2·1020 8·10-23 >104 h
MAA12-BA6 4.1* 88 84 ± 12 4·10-2 7·1020 6·10-23 >104 h
MAA12-BA14 1.0* 55 83 ± 13 3·10-2 7·1020 5·10-23 >104 h
a Concentration of MAAx-MMAy or MAAx-BAy stabilizer (* corresponds to 5 wt% with respect to
overall monomer content), determined from used mass and Mn; b Overall concentration of MAA units, determined from the used mass and the weight fraction of MAA in the stabilizer; c Number-average diameter and standard deviation determined by SEM, particle count > 100; d Overall conversion rate between 20 and 60% conversion; e Number of particles per m3 water; f rate per particle = (dX/dt)/Np; g Number-average and peak molar mass and dispersity determined by SEC and reported against polystyrene standards; h estimates, exclusion limit reached.
In Table 3 also the molar masses of the produced PMMA are shown and two things clearly
stand out: the PMMA latexes stabilized by MAAx-BAy are characterized by much higher
molar masses than those stabilized by MAAx-MMAy, and in the latter systems, a higher
stabilizer concentration leads to lower molar masses. In Figure 4, the stabilizer concentration
dependence of the molar mass distributions for a range of latexes is shown, in Figure 4a for
the latexes stabilized by MAA12-MMA2 and in Figure 4b for those stabilized by MAAx-BAy.
Page 26 of 49
ACS Paragon Plus Environment
Industrial & Engineering Chemistry Research
123456789101112131415161718192021222324252627282930313233343536373839404142434445464748495051525354555657585960

27
Figure 4. Molar mass distributions of latexes made different stabilizers: (a) MAA12-MMA2 at different concentrations (Cs); (b) Different MAAx-BAy stabilizers at a concentration of 5 wt%. Data are reported against polystyrene standards.
The observed differences in molar mass distributions are easily explained by the differences in
molecular structure of the used stabilizers M and B, i.e., M is representative for the MAAx-
MMAy series and B for the MAAx-BAy series. In the emulsion polymerization of MMA, M
will act as an addition-fragmentation chain transfer agent,28 and as with any other chain
transfer agent, this will lead to a molecular weight reduction. B on the other hand will largely
behave as an unreactive surfactant (except for the small fraction of the molecules that still
contains a propenyl endgroup, i.e., B1, B2, B3 and B5) and high molar masses, typical of
emulsion polymerization are expected. The unreacted stabilizers are visible in the molar mass
distribution as the low molar mass peak in Figure 4b, whereas the small "bumps" in some of
the molar mass distributions around M = 106 g/mol may be indicative of some chain transfer
going on (because of the presence of a small amount of molecules with propenyl endgroups).
Page 27 of 49
ACS Paragon Plus Environment
Industrial & Engineering Chemistry Research
123456789101112131415161718192021222324252627282930313233343536373839404142434445464748495051525354555657585960

28
We conclude this section by stating that both the MAAx-MMAy and MAAx-BAy series of
stabilizers are suitable for emulsion polymerization, be it that the former series in general
leads to slower polymerizations, larger particles and lower molar masses than the latter series.
Since the used stabilizers are not fully homogeneous in terms of molar mass and chemical
composition distributions, it is difficult to identify clear trends within each series of
experiments.
3.3 Latex Characterization
In the previous section we discussed the use of a range of short MAA-containing copolymers
as stabilizers in the emulsion polymerization of MMA and concluded that all these
copolymers in principle resulted in stable latexes. We have not, however, commented yet on
the appearance of these latexes, which varied from very liquid, "milky", to very viscous, "gel-
like". It is well known that the rheological behavior of a latex is determined by the volume
fraction and particle size of the polymer particles, and by the amount and type of stabilizer
used.46 Thus, some differences in rheological behavior are expected, but we did not anticipate
the differences we observed.
To facilitate the further discussion, we subdivide the latex appearance into three types which
are schematically shown in Figure 5. Type I is a colloidally stable, liquid-like, latex (low
viscosity, containing no visible sediment/coagulum), type II is a flocculated latex which may
Page 28 of 49
ACS Paragon Plus Environment
Industrial & Engineering Chemistry Research
123456789101112131415161718192021222324252627282930313233343536373839404142434445464748495051525354555657585960

29
contain some redispersible sediment and type III is a highly viscous latex with internal
network structure (gelated).
I II III
Figure 5. Schematic representation of the three types of appearances of the latexes produced in this work: I) fluid-like latex; II) viscous latex with reversible flocculation; III) highly viscous, gelated latex.
In Table 4 the appearances of the final latexes with corresponding stabilizers and
concentrations are listed in combination with the zeta potentials and the distributions of the
stabilizer in different phases of the latex (water, surface or inside particle). What is
immediately clear from these data is that the MAAx-MMAy-stabilized latexes (L1-L8) are in
general more viscous (mainly type II) than those stabilized by MAAx-BAy (L9-L13, mainly
type I). This difference is conceivably explained47,48 by the fact that in general (except for L11)
the amount of water-soluble molecules of stabilizer B is lower than the amount of water-
soluble molecules of stabilizer M, as shown by the titration results (i.e., the values for CMAA,w
Page 29 of 49
ACS Paragon Plus Environment
Industrial & Engineering Chemistry Research
123456789101112131415161718192021222324252627282930313233343536373839404142434445464748495051525354555657585960

30
in Table 4). Notable exceptions are L4 (type I) and L11 (type II), but these results are not
inexplicable. L4 is the latex with the highest MAA12-MMA2 concentration, which has a very
high CMAA,w, but also the highest number of stabilizing groups per m2 surface area (n"MAA,s).
L11 is the latex with the best water-soluble stabilizer, MAAx-BAy (which contains a large
fraction of molecules with only one or even no BA groups, see SI) and therefore results in a
high CMAA,w and the lowest n"MAA,s. Additionally, it is important to stress here that all the
copolymer stabilizers in this study have relatively broad molar mass and chemical
composition distributions, so preferential adsorption of only certain molecules is highly likely
and this complicates the exact interpretation of our results.
Page 30 of 49
ACS Paragon Plus Environment
Industrial & Engineering Chemistry Research
123456789101112131415161718192021222324252627282930313233343536373839404142434445464748495051525354555657585960

31
Table 4 Characteristics and MAA Distributions of the Synthesized Latexes
Latex StabilizerCS
a
(mM)
CMAAb
(mM)
Typec d
(mV)
pHe CMAA,we
(mM)nMAA,s
f
(mmol)
n'MAA,sg
(mmol/part)
n"MAA,sh
(mmol/m2)
nSi
(1/part)
MAA,pj
(%)
L1 5.2 62 III -56 8.1 3.6 0.5 5·10-17 8·10-8 3103 87
L2 7.0 83 II -56 7.2 13.6 0.5 1·10-16 9·10-8 5103 78
L3 10* 118 II -52 6.2 46.8 1.0 1·10-16 2·10-7 5103 54
L4
MAA12-MMA2
19 230 I -55 5.3 121.9 4.8 5·10-16 8·10-7 2104 29
L5 5.0 59 II -50 7.0 4.2 2.7 2·10-16 4·10-7 1104 55
L6MAA12-MMA6
7.7* 92 II -62 7.0 16.2 1.2 7·10-17 1·10-7 4103 71
L7 4.9* 59 II -55 8.2 1.8 0.06 6·10-18 1·10-8 3102 96
L8MAA12-MMA15
7.7 92 I/II -58 7.0 10.8 7.5 7·10-16 1·10-6 4103 19
L9 MAA4-BA6 5.8* 51 I -45 8.0 1.5 1.0 1·10-17 6·10-8 5102 82
L10 MAA6-BA6 2.4* 61 I -49 8.4 0.6 0.7 5·10-18 4·10-8 3102 90
L11 MAA12-BA2 6.2* 124 II -55 6.5 22.0 1.2 7·10-18 1·10-8 4102 68
L12 MAA12-BA6 4.1* 88 I -47 8.8 0.6 0.3 5·10-18 2·10-8 3102 96
L13 MAA12-BA14 1.0* 55 I -43 8.1 0.1 0.09 2·10-18 6·10-9 1102 98
a Concentration of MAAx-MMAy or MAAx-BAy stabilizer (* corresponds to 5 wt% with respect to overall monomer content), b Overall concentration of MAA
units, determined from the used mass and the weight fraction of MAA in the stabilizer; c Appearance of latex, see text and Figure 5 for definition; d -potential
in diluted solutions, pH ≈ 7; e pH of final latex; f Concentration of MAA in the water phase determined by titration; g Amount of MAA on particle surface
Page 31 of 49
ACS Paragon Plus Environment
Industrial & Engineering Chemistry Research
123456789101112131415161718192021222324252627282930313233343536373839404142434445464748495051525354555657585960

32
expressed in mmoles determined by titration; h Amount of MAA units on the particle surface in mmol per particle; i Amount of MAA units on the particle
surface in mmol per m2; j Number of stabilizer molecules on surface per particle, ignoring any preferential adsorption; k Percentage of added MAA units
buried inside the particles.
Page 32 of 49
ACS Paragon Plus Environment
Industrial & Engineering Chemistry Research
123456789101112131415161718192021222324252627282930313233343536373839404142434445464748495051525354555657585960
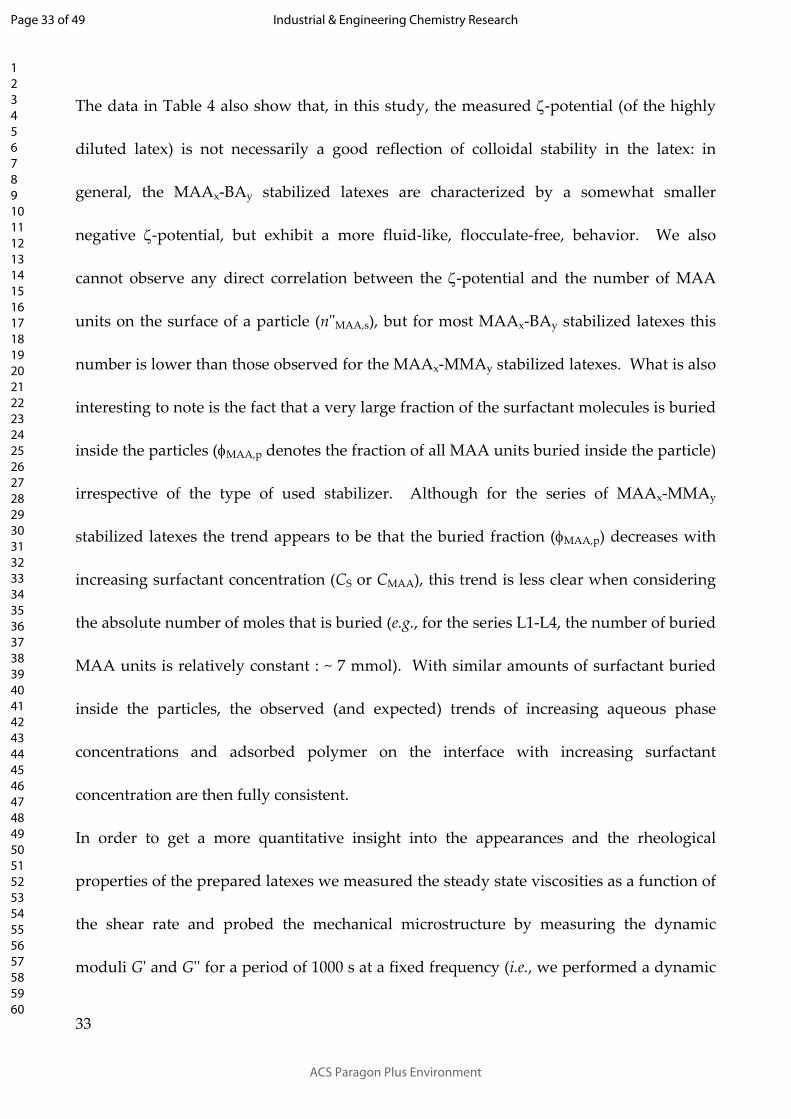
33
The data in Table 4 also show that, in this study, the measured -potential (of the highly
diluted latex) is not necessarily a good reflection of colloidal stability in the latex: in
general, the MAAx-BAy stabilized latexes are characterized by a somewhat smaller
negative -potential, but exhibit a more fluid-like, flocculate-free, behavior. We also
cannot observe any direct correlation between the -potential and the number of MAA
units on the surface of a particle (n"MAA,s), but for most MAAx-BAy stabilized latexes this
number is lower than those observed for the MAAx-MMAy stabilized latexes. What is also
interesting to note is the fact that a very large fraction of the surfactant molecules is buried
inside the particles (MAA,p denotes the fraction of all MAA units buried inside the particle)
irrespective of the type of used stabilizer. Although for the series of MAAx-MMAy
stabilized latexes the trend appears to be that the buried fraction (MAA,p) decreases with
increasing surfactant concentration (CS or CMAA), this trend is less clear when considering
the absolute number of moles that is buried (e.g., for the series L1-L4, the number of buried
MAA units is relatively constant : ~ 7 mmol). With similar amounts of surfactant buried
inside the particles, the observed (and expected) trends of increasing aqueous phase
concentrations and adsorbed polymer on the interface with increasing surfactant
concentration are then fully consistent.
In order to get a more quantitative insight into the appearances and the rheological
properties of the prepared latexes we measured the steady state viscosities as a function of
the shear rate and probed the mechanical microstructure by measuring the dynamic
moduli G' and G'' for a period of 1000 s at a fixed frequency (i.e., we performed a dynamic
Page 33 of 49
ACS Paragon Plus Environment
Industrial & Engineering Chemistry Research
123456789101112131415161718192021222324252627282930313233343536373839404142434445464748495051525354555657585960

34
time sweep) with an amplitude small enough to not disturb any possible structures. In
order to check the recoverability of the structure after such time sweep, the sample was
stirred (using a shear rate of 100 s-1 for a duration of 100 s), after which another dynamic
time sweep was recorded. In Figure 6, the results are shown for L2, L6 and L8, as an
example for the influence of the length of the MMA block on the rheological properties.
Figure 6. Rheology of latexes stabilized with 7-8 mM MAAx-MMAy copolymers. (a) Steady state viscosity; (b) Storage modulus G' (symbols) and loss modulus G" (lines) as function of time; strain = 0.001, ω = 6.3 rad/s; at 1000 s the sample was agitated using a shear rate of 100 s-1 for 100 s. () MAA12-MMA2 (L2), () MAA12-MMA6 (L6) and () MAA12-MMA15 (L8). Values of G' ~ 0 are plotted as 10-2 Pa.
In Figure 6a a comparison of the flow curves is made for latexes stabilized with 7-8 mM
MAAx-MMAy copolymer with different MMA block lengths (L2, L6 and L8). All latexes
show shear thinning behavior and at high shear rates the viscosities of the latexes tend to
level off, suggesting that internal structures are no longer broken up by increasing shear
rates. The relatively high viscosities at which the levelling off take place, however,
suggest that large agglomerates or flocs with strong interactions still exist.46 At lower
Page 34 of 49
ACS Paragon Plus Environment
Industrial & Engineering Chemistry Research
123456789101112131415161718192021222324252627282930313233343536373839404142434445464748495051525354555657585960

35
shear rates the viscosities increase, and approach a slope of -1 in double-log plot,
indicative of plastic behavior; this means that large agglomerates stick to each other and
form a soft solid with yield stress values from ~ 0.001 Pa (for L8) to ~ 0.2 Pa (for L2). In
Figure 6b the results are shown of two sequential time sweeps (duration = 1000 s, = 6.3
rad/s and strain = 0.001), separated by a period of 100 s with stirring at 100 s-1. The three
latexes show all a different behavior. The latex stabilized with MAA12-MMA2 (L2)
displays a solid like behavior (G' > G'') and the initial increase in G' is indicative of build
up of some internal structure over time. Stirring breaks up this structure, but after stirring
the structure is restored, albeit at a lower modulus level, which suggests that the mobility
of the flocs or particles is still high. In the case of MAA12-MMA6 the latex (L6), which is
more fluid-like (G" > G') also some internal structure is built up in time, and this structure
is immediately restored after stirring at the same viscosity level. G'' values give a yield
stress of ~ 0.1 Pa, which implies that network formation is minor. For the latex stabilized
with MAA12-MMA15 (L8), which also is more fluid-like (G'' > G'), it can be seen that the
internal network is destroyed after stirring after the first measurement and not built up
anymore (G' 0). The results shown in Figure 6 suggest that there is a significant effect of
hydrophobic block length on the final viscosity and stability of the latex. If we compare
these results with the results in Table 4 for the amount of MAA on the surface (nMAA,s) we
can conclude that higher amounts of MAA units on the surface of the particles give less
network formation and a lower viscosity of the latex, so at a concentration of 8 mM
MAA12-MMA15 appears to be a better dispersant than MAA12-MMA6 and MAA12-MMA2,
Page 35 of 49
ACS Paragon Plus Environment
Industrial & Engineering Chemistry Research
123456789101112131415161718192021222324252627282930313233343536373839404142434445464748495051525354555657585960

36
but the relatively high viscosities at high shear suggest that still higher concentrations are
required for a good colloidal stabilization.
Figure 7. Rheology of MAA12-MMA2 stabilized latexes of pMMA (a) Steady state viscosity; (b) Storage modulus G' (symbol) and loss modulus G'' (dotted line) as function of time, strain = 0.001, ω = 6.3 rad/s. Different concentrations of MAA12-MMA2 stabilizer: () 5 mM (L1), () 7 mM (L2), () 10 mM (L3), () 19 mM (L4).
The effect of stabilizer concentration on latex rheology is shown in Figure 7 for the MAA12-
MMA2 systems (L1-L4). The results of the steady state viscosity measurements are shown
in Figure 7a. The viscosity of the latex stabilized with 19 mM MAA12-MMA2 (L4) was so
low that it could not be determined at low shear rates. Plastic behavior is observed for the
other latexes, comparable to what is observed in Figure 6a. The high viscosities at high
shear rates are indicative of large agglomerates with strong interactions, which is
supported by the dynamic time sweep results shown in Figure 7b. All latexes behave like
soft solids (G' > G") and the behavior of L1 to L3 is consistent with a space-filled
flocculated packing where the flocs break up the bonds with their neighboring flocs when
sheared, but on rest immediately restore these bonds.
Page 36 of 49
ACS Paragon Plus Environment
Industrial & Engineering Chemistry Research
123456789101112131415161718192021222324252627282930313233343536373839404142434445464748495051525354555657585960

37
Figure 8. Rheology of latex stabilized with 5 wt% MAA-BA: (a) Steady state viscosity; (b) Storage modulus G' (symbols) and loss modulus G" (dotted lines) as a function of time; strain = 0.001, ω = 6.3 rad/s; () MAA4-BA6 (L9); () MAA6-BA6 (L10); () MAA12-BA2 (L11); () MAA12-BA6 (L12);() MAA12-BA14 (L13).
Finally, in Figure 8 the results of the steady state viscosity and the results of the dynamic
time sweep experiments for the latexes stabilized with MAAx-BAy copolymers are shown.
The low shear rate data for the low viscous systems were left out because they were below
the equipment sensitivity limit. From Figure 8a can be seen that none of these latexes show
noticeable plastic behavior (slope -1 in a double-log plot), with the exception of L13
(stabilized with MAA12-BA14). From the Newtonian plateau at around 0.005 Pa·s in the
shear rate range of 0.1-100 s-1 it can be concluded that these non-plastic latexes are well-
stabilized, non-aggregating dispersions. L13 clearly shows a slight plasticity with a yield
value of about 0.2 Pa. We consider this as indication that the colloidal stability may be not
perfect. At shear rates > 100 s-1 an increase of the viscosity is observed due to Taylor
turbulences.49,50 The results of the oscillatory deformation tests shown in Figure 8b further
confirm that the extent of agglomeration at rest is very limited. The elastic component of
Page 37 of 49
ACS Paragon Plus Environment
Industrial & Engineering Chemistry Research
123456789101112131415161718192021222324252627282930313233343536373839404142434445464748495051525354555657585960

38
the dynamic modulus is for all latexes larger than the viscous component (G' > G"). The
loss moduli (G'') give a value of around 0.1 Pa and in combination with a low viscosity
these latexes could be suitable to be used in a coating formulation.47
When comparing the appearances of latexes stabilized with MAAx-MMAy and MAAx-BAy
it can be seen that the latter are all characterized by a low viscosity and a low yield stress
(types I or II), whereas the former show more flocculation, higher viscosities and higher
yield stresses (types II or III). These differences in appearances and rheological behavior
can partly be explained by the final distribution of the stabilizers over the different phases
in the polymer latex. Due to the more hydrophilic nature of the MAAx-MMAy
copolymeric stabilizers, more molecules may dissolve in the water phase thus increasing
the viscosity of the solution. These molecules may form aggregates, be present on the
surface of the polymer particles thus increasing the effective volume fraction of particles,
or form links between particles and thus form an internal network which can be destroyed
at higher shear rates.47,48 These effects will be less in the case of the more hydrophobic
MAAx-BAy stabilizers.
4 CONCLUSIONS
Copolymers of MMA or BA with MAA macromonomers prepared via catalytic chain
transfer polymerization were prepared, characterized and used as efficient stabilizers in
the emulsion polymerization of MMA. The MAAx-MMAy copolymers (M) have a blocky
Page 38 of 49
ACS Paragon Plus Environment
Industrial & Engineering Chemistry Research
123456789101112131415161718192021222324252627282930313233343536373839404142434445464748495051525354555657585960

39
structure and act as (reversible) chain transfer agents in the emulsion polymerization. The
MAAx-BAy copolymers (B) have a more complex structure, which on average resembles
more that of a graft copolymer, and are (in general) unreactive in the emulsion
polymerization. This difference in behavior manifests itself in the polymerization kinetics
(B leads to smaller particles and much faster rates), molar masses of the emulsion polymer
(M leads to significantly reduced molar masses) and distribution of the stabilizer
molecules over the three different locations, i.e., the water phase, the particle surface and
the particle interior. In the case of M, more molecules are located in the water phase, and
this may be the cause for the significant difference in appearances of the B- and M-
stabilized latexes. The former latexes are all characterized by a low viscosity and no
significant aggregation (low yield stresses), whereas the latter latexes are characterized by
higher viscosities, stronger aggregation and yield stresses, which depend on block length
and concentration.
ASSOCIATED CONTENT
Supporting Information
The Supporting Information is available free of charge on the ACS Publications website at
DOI:
xxxx
Details related to characteristics (NMR, MALDI-ToF-MS, SEC, CMC, DLS) of
synthesized macromonomers and latexes (pdf).
Page 39 of 49
ACS Paragon Plus Environment
Industrial & Engineering Chemistry Research
123456789101112131415161718192021222324252627282930313233343536373839404142434445464748495051525354555657585960

40
xxxx.pdf
AUTHOR INFORMATION
Corresponding Author
* E-mail: [email protected]
ORCID
Johan PA Heuts: 0000-0002-9505-8242
Ingeborg Schreur-Piet: 0000-0002-2079-4333
Alex M van Herk: 0000-0001-9398-5408
Jozua Laven: 0000-0002-1860-8677
Funding
This work was partially funded by the Stichting Emulsion Polymerization
Notes
The authors declare no competing financial interest.
ACKNOWLEDGMENTS
We gratefully acknowledge financial support by the Stichting Emulsion Polymerization.
Electron microscopy was performed at the Center for Multiscale Electron Microscopy at
Eindhoven University of Technology.
Page 40 of 49
ACS Paragon Plus Environment
Industrial & Engineering Chemistry Research
123456789101112131415161718192021222324252627282930313233343536373839404142434445464748495051525354555657585960

41
(1) Urban, D.; Takamura, K. (Eds.); Polymer dispersions and their industrial applications;
Wiley-VCH, Weinheim, 2002.
(2) Elaissari, A.; Colloidal polymers: synthesis and characterization; Marcel Dekker, New
York, 2003, 115.
(3) Lovell, P.A.; El-Aasser, M.S. (Ed.), Emulsion polymerization and emulsion polymers,
Wiley, Chichester, 1997.
(4) Gurnani, P.; Sanchez-Cano, C.; Abraham, K.; Xandri-Monje, H.; Cook, A.B.; Hartlieb,
M.; Lévi, F.; Dallmann, R.; Perrier, S. RAFT emulsion polymerization as a platform to
generate well-defined biocompatible latex nanoparticles, Macromol. Biosci. 2018, 18,
1800213. DOI: 10.1002/mabi.201800213
(5) Zhang, X.; Fu, H.; Huang, H.; Chen, H. Influence of carboxyl groups on the particle size
and rheological properties of polyacrylate latices, J. Wuhan Univ. Technol. Mat. Sci. Edit.
2010, 25, 492. DOI.org/10.1007/s11595-010-0030-2.
(6) Russell W.B.; Saville, D.A.; Schowater, W.R. Colloidal dispersions, Batchelor, G.K. (Ed.),
Cambridge University Press, Cambridge, 1991.
(7) Holmberg, K.; Jönsson, B.; Kronberg, B.; Lindman, B. Surfactants and polymers in
aqueous solution, John Wiley & Sons, Ltd, 2nd Edition, 2003.
(8) Aramendia, E.; Mallégol, J.; Jeynes, C.; Barandiaran, M.J.; Keddie, J.L.; Asua, J.M.
Distribution of surfactants near acrylic latex film surfaces: A Comparison of
Conventional and reactive surfactants (Surfmers), Langmuir, 2003, 19, 3212–3221.
Page 41 of 49
ACS Paragon Plus Environment
Industrial & Engineering Chemistry Research
123456789101112131415161718192021222324252627282930313233343536373839404142434445464748495051525354555657585960

42
(9) Evanson, K.W.; Thorstenson,T.A.; Urban, M.W. Surface and interfacial FTIR
spectroscopic studies of latexes. II. Surfactant–copolymer compatibility and mobility
of surfactants. J. Appl. Polym. Sci., 1991, 42, 2297–2307.
(10) Steward, A.; Hearn, J.; Wilkinson, M.C. An overview of polymer latex film formation
and properties, Adv. Colloid Interface Sci., 2000, 86, 195–267.
(11) Winnik, M.A. Latex film formation, Curr. Opin. Colloid & Interface Sci., 1997, 2, 192–199.
(12) Vidal, F.; Guillot, J.; Guyot, A., Surfactants with transfer agent properties (transurfs) in
styrene emulsion polymerization, Colloid Polym. Sci., 1995, 273, 999–1007.
(13) a. Asua, J.M.; Schoonbrood, H.A.S. Reactive surfactants in heterophase
polymerization, Acta Polym., 1998, 49, 671–686;
b. Dimonie, V.L., Sudol, E.D., El-Aasser, M.S. Role of Surfactants in Emulsion
Polymerization Polymers by design, Rev. Chim. (Bucureºti), 2008, 59 (11), 1218-1221.
(14) Guyot, A.; Tauer, K.; Asua, J.M., Van Es, S.; Gauthier, C.; Hellgren, A.C.;
Sherrington, D.C; Montoya-Goni, A.; Sjoberg, M.; Sindt, O.; Vidal, F.; Unzue, M.;
Schoonbrood, H.; Shipper, E.; Lacroix-Desmazes, P. Reactive surfactants in
heterophase polymerization, Acta Polym., 1999, 50, 57-66.
(15) Monteiro, M.J.; Bussels, R.; Wilkinson, T.S. Emulsion polymerization of methyl
methacrylate in the presence of a novel addition-fragmentation chain-transfer
reactive surfactant (transurf), J. Polym. Sci., Polym. Chem., 2001, 39, 2813-2820.
(16) Guyot, A. Advances in reactive surfactants, Adv. Colloid Interface Sci., 2004, 108-109,
3-22.
Page 42 of 49
ACS Paragon Plus Environment
Industrial & Engineering Chemistry Research
123456789101112131415161718192021222324252627282930313233343536373839404142434445464748495051525354555657585960

43
(17) Gregory, J. Polymer adsorption and flocculation in sheared suspensions, Colloids
Surfaces, 1988, 31, 231–253.
(18) Heuts, J.P.A.; Smeets, N.M.B. Catalytic chain transfer and its derived
macromonomers, Polym. Chem., 2011, 2, 2407.
(19) Gridnev, A.A.; Ittel, S.D. Catalytic chain transfer in free-radical polymerizations,
Chem. Rev., 2001, 101, 3611–3660.
(20) Slavin, S.; McEwan, K.; Haddleton, D.M. Cobalt-Catalyzed Chain Transfer
Polymerization: A Review, Polym. Sci. Compr. Rev., 2012, 3, Ch. 9
(21) Haddleton, D.M.; Maloney, D.R.; Suddaby Adam Clarke, K.G.; Richards, S.N.
Radical-addition fragmentation and co-polymerization of methyl methacrylate
macromonomers from catalytic chain transfer polymerization (CCTP), Polymer,
1997, 38, 6207–6217.
(22) Yamada, B.; Oku, F.; Harada, T. Substituted propenyl end groups as reactive
intermediates in radical polymerization, J. Polym. Sci., Polym. Chem., 2003, 41, 645–654.
(23) Krstina, J.; Moad, C.L.; Moad, G.; Rizzardo, E.; Berge, C.T.; Fryd, M. A new form of
controlled growth free radical polymerization, Macromol. Symp., 1996, 111, 13–23.
(24) Schreur-Piet, I.; Heuts, J.P.A. In situ stabilizer formation from methacrylic acid
macromonomers in emulsion polymerization, Polym. Chem., 2017, 8, 6654-6664.
(25) Canning, S.L.; Smith G.N. ; Armes, S.P. A critical appraisal of RAFT-mediated
polymerization induced self-assembly, Macromolecules, 2016, 49, 1985-2001.
Page 43 of 49
ACS Paragon Plus Environment
Industrial & Engineering Chemistry Research
123456789101112131415161718192021222324252627282930313233343536373839404142434445464748495051525354555657585960

44
(26) Charleux, B. Delaittre, G.; Rieger J.; D'Agosto, F. Polymerization-induced self-
assembly: from soluble macromolecules to block copolymer nano-objects in one step,
Macromolecules, 2012, 45, 6753-6765.
(27) Lotierzo, A.; Schofield, R.M.; Bon, S. Towards sulfur-free RAFT polymerization
induced self-assembly, ACS Macro Lett., 2017, 6, 1438-1443.
(28) Zhou, D.; Kuchel, R.P.; Zetterlund, P.B. A new paradigm in polymerization induced
self-assembly (PISA): exploitation of "non-living" addition-fragmentation chain
transfer (AFCT) polymerization, Polym. Chem., 2017, 8, 4177.
(29) Bakač, A.; Brynildson, M.E.; Espenson, J.H. Characterization of the structure,
properties, and reactivity of a cobalt(II) macrocyclic complex, Inorg. Chem., 1986, 25,
4108–4114.; DOI: 10.1021/ic00243a012.
(30) Staal, B.B.P. Characterization of (co)polymers by MALDI-TOF-MS, Thesis, University of
Technology Eindhoven, 2005; DOI: 10.6100/IR583506.
(31) Willemse, R.X.E., New insights into free-radical (co)polymerization kinetics, Thesis,
University of Technology Eindhoven, 2005.
(32) International Standard ISO22412, Particle size analysis - dynamic light scattering,
International Organisation for Standardisation (ISO); 2008.
(33) International Standard ISO13321, Methods for determination of particle size
distribution part 8: photon correlation spectroscopy, International Organisation for
Standardisation (ISO), 1996.
Page 44 of 49
ACS Paragon Plus Environment
Industrial & Engineering Chemistry Research
123456789101112131415161718192021222324252627282930313233343536373839404142434445464748495051525354555657585960

45
(34) Zwetsloot, J.P.H.; Leyte, J.C. Conductometric titration of latex with acidic surface
groups, J. Colloid. Interface Sci., 1994, 163, 362–371.
(35) Wang, C.; Tam, K.C.; Jenkins, R.D.; Bassett, D.R. Potentiometric titration and
dynamic light scattering of hydrophobically modified alkali soluble emulsion (HASE)
polymer solutions, Phys. Chem. Chem. Phys., 2000, 2, 1967–1972.
(36) Oliveira, M.; Giordani, D.; Santos, A. The role of itaconic and fumaric acid in the
emulsion copolymerization of methyl methacrylate and n-butyl acrylate, Eur. Pol. J.,
2006, 42, 5, 1196-1205.
(37) Kawaguchi, S.; Yekta, A.; Winnik, M.A. Surface characterization and dissociation
properties of carboxylic acid core–shell latex particle by potentiometric and
conductometric titration, J. Colloid Interface Sci., 1995, 176, 362–369.
(38) Topel, O.; Çakır, B.A.; Budama, L.; Hoda, N. Determination of critical micelle
concentration of polybutadiene-block-poly(ethyleneoxide) diblock copolymer by
fluorescence spectroscopy and dynamic light scattering, J. Molecular Liq., 2013, 177,
40-43, DOI.org /10.1016/j.molliq.2012.10.013.
(39) Gaillard, N.; Claverie, J.; Guyot, A. Synthesis and characterization of block-
copolymer surfactants with specific interactions with associative thickeners, Prog.
Org. Coatings, 2006, 57, 98–109.
(40) Riess, G.; Labbe, C. Block copolymers in emulsion and dispersion polymerization,
Macromol. Rapid Commun., 2004, 25, 401–435, DOI. 10.1002/marc.200300048.
Page 45 of 49
ACS Paragon Plus Environment
Industrial & Engineering Chemistry Research
123456789101112131415161718192021222324252627282930313233343536373839404142434445464748495051525354555657585960

46
(41) Berthod, A.; Garcia-Alvarez-Coque, C. Micellar liquid chromatography, 83, Marcel
Dekker Inc., New York, 2000, 33-35.
(42) Nurumbetov, G.; Enelis, N.; Godfrey, J.; Hand, R.; Anastasaki, A.; Simula, A.;
Nikolaou, V.; Haddleton, D.M. Methacrylic block copolymers by sulfur free RAFT
(SF RAFT) free radical emulsion polymerisation, Polym. Chem., 2017, 8, 1084-1094.
(43) Engelis, G.; Anastasaki, A.; Nurumbetov, G.; Truong, N.P.; Nikolaou, V.; Shegiwal,
A.; Whittaker, M.R.; Davis, T.P.; Haddleton, D.M. Sequence-controlled methacrylic
multiblock copolymers via sulfur-free RAFT emulsion polymerization, Nature
Chemistry, 2017, 9, 171-178.
(44) Müller, H.; Leube, W.; Tauer, K.; Förster, S.; Antonietti, M. Polyelectrolyte block
copolymers as effective stabilizers in emulsion polymerization, Macromolecules, 1997,
30 (8), 2288–2293, DOI: 10.1021/ma9615516
(45) Thickett, S.C.; Gilbert, R.G., Emulsion polymerization: State of the art in kinetics and
mechanisms, Polymer, 2007, 48, 6965-6991, DOI:10.1016/j.polymer.2007.09.031
(46) Fitch, R.M. (Ed.) Polymer colloids: a comprehensive introduction, Acadamic Press,
London, 1997, Ch. 7, 10.
(47) Koleske, J.V. (Ed.) Paint and coatings testing manual, 15th Edition, ASTM Manual Series,
Bridgeport, 2012, Ch. 33.
(48) Mewis, J.; Wagner, N.; Colloidal suspension rheology (Cambridge Series in Chemical
Engineering), Cambridge, Cambridge University Press, 2011. Ch. 1,
DOI:10.1017/CBO9780511977978.004.
Page 46 of 49
ACS Paragon Plus Environment
Industrial & Engineering Chemistry Research
123456789101112131415161718192021222324252627282930313233343536373839404142434445464748495051525354555657585960

47
(49) Davey, A.; Di Prima, R.C.; Stuart, J.T. On the instability of Taylor vortices, J. Fluid
Mech., 1968, 31, 17–52.
(50) Taylor, G.I., Stability of a viscous liquid contained between two rotating cylinders,
Philos, Trans R. Soc., London, Ser. A, 1923, 223, 289–343.
Page 47 of 49
ACS Paragon Plus Environment
Industrial & Engineering Chemistry Research
123456789101112131415161718192021222324252627282930313233343536373839404142434445464748495051525354555657585960

48
Page 48 of 49
ACS Paragon Plus Environment
Industrial & Engineering Chemistry Research
123456789101112131415161718192021222324252627282930313233343536373839404142434445464748495051525354555657585960

Graphical Abstract
Page 49 of 49
ACS Paragon Plus Environment
Industrial & Engineering Chemistry Research
123456789101112131415161718192021222324252627282930313233343536373839404142434445464748495051525354555657585960