Embed Size (px)
Citation preview
1
Synthesis and Physical Properties of
Polyester Amides Derived from
Lipid-Based Components
By: Jiaqing Zuo
Trent Biomaterials Research Group
March 2011
2
Outline
Introduction of polyester amide (PEA)
What is polyester amide
Applications
Advantage of Lipid-based components
Previous Examples of Lipid-based PEA
Objectives and Results
Conclusions
3
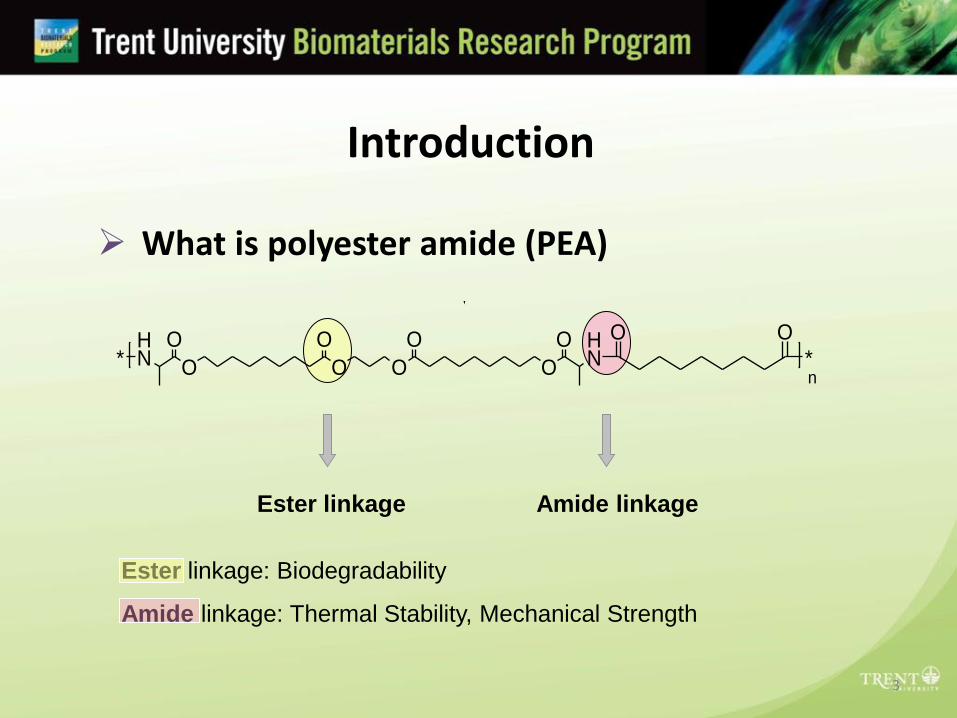
Introduction
What is polyester amide (PEA)
Boc
HN COOH
Boc
HN
O O O O
HN
Boc
O OOO
TFA
HN O O O O
HN
O OOO
Cl Cl
O O
H2N O O O O NH2
O OOO
*
O
*
O
n
HO O O OH
O O
1
2
Ester linkage Amide linkage
Ester linkage: Biodegradability
Amide linkage: Thermal Stability, Mechanical Strength
4
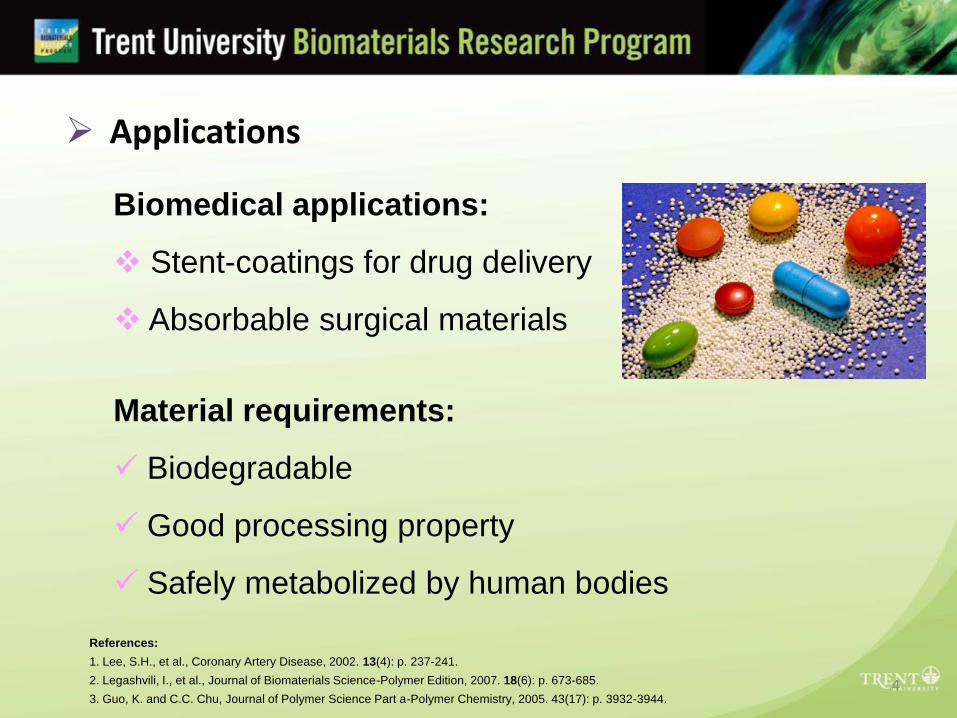
Applications
Biomedical applications:
Stent-coatings for drug delivery
Absorbable surgical materials
Material requirements:
Biodegradable
Good processing property
Safely metabolized by human bodies
References:
1. Lee, S.H., et al., Coronary Artery Disease, 2002. 13(4): p. 237-241.
2. Legashvili, I., et al., Journal of Biomaterials Science-Polymer Edition, 2007. 18(6): p. 673-685.
3. Guo, K. and C.C. Chu, Journal of Polymer Science Part a-Polymer Chemistry, 2005. 43(17): p. 3932-3944.
5
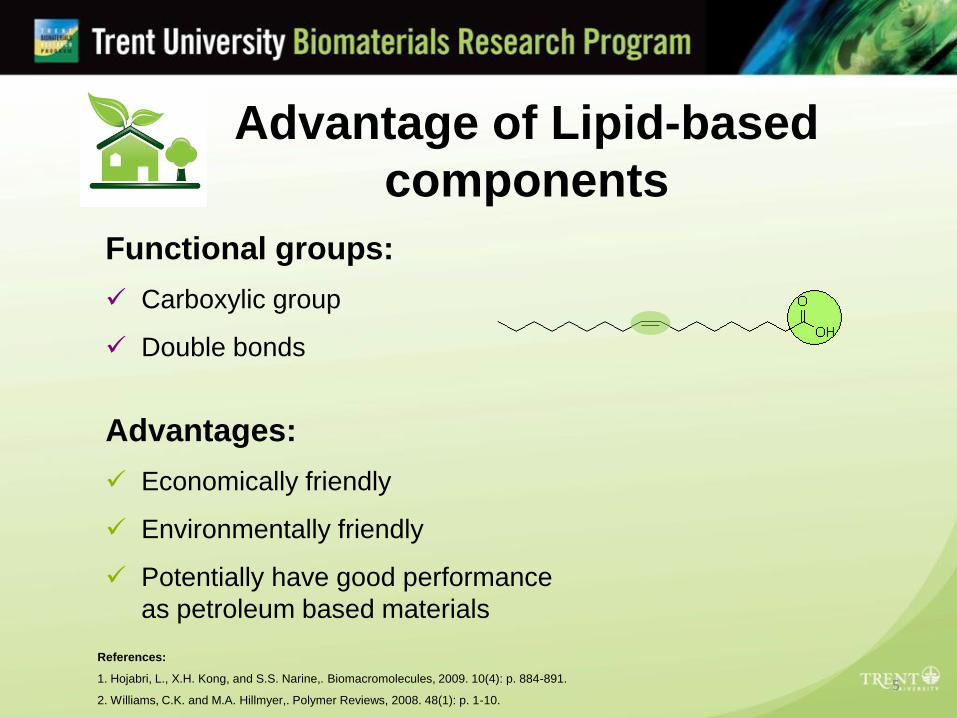
Advantage of Lipid-based
components
Functional groups:
Carboxylic group
Double bonds
Advantages:
Economically friendly
Environmentally friendly
Potentially have good performance
as petroleum based materials
References:
1. Hojabri, L., X.H. Kong, and S.S. Narine,. Biomacromolecules, 2009. 10(4): p. 884-891.
2. Williams, C.K. and M.A. Hillmyer,. Polymer Reviews, 2008. 48(1): p. 1-10.

6
Previous Examples of Lipid-based PEA
PEA derived from:
Pongamia glabra oil Linseed oil
Disadvantages:
Not all building blocks are from sustainable materials
Not suitable for biomedical applications
References:
1. Ahmad, S., S.M. Ashraf, and F. Zafar,. Journal of Applied Polymer Science, 2007. 104(2): p. 1143-1148.
2. Zafar, F., et al.,. Journal of Applied Polymer Science, 2005. 97(5): p. 1818-1824.
3. Ahmad, S., et al.,. Progress in Organic Coatings, 2003. 47(2): p. 95-102.
O
O
O
O
R
R
O
R
O
HN
OH
OH
+ N
OH
OHR
O
OH
O
HO
O
NaOCH3
Diethanolamine
7
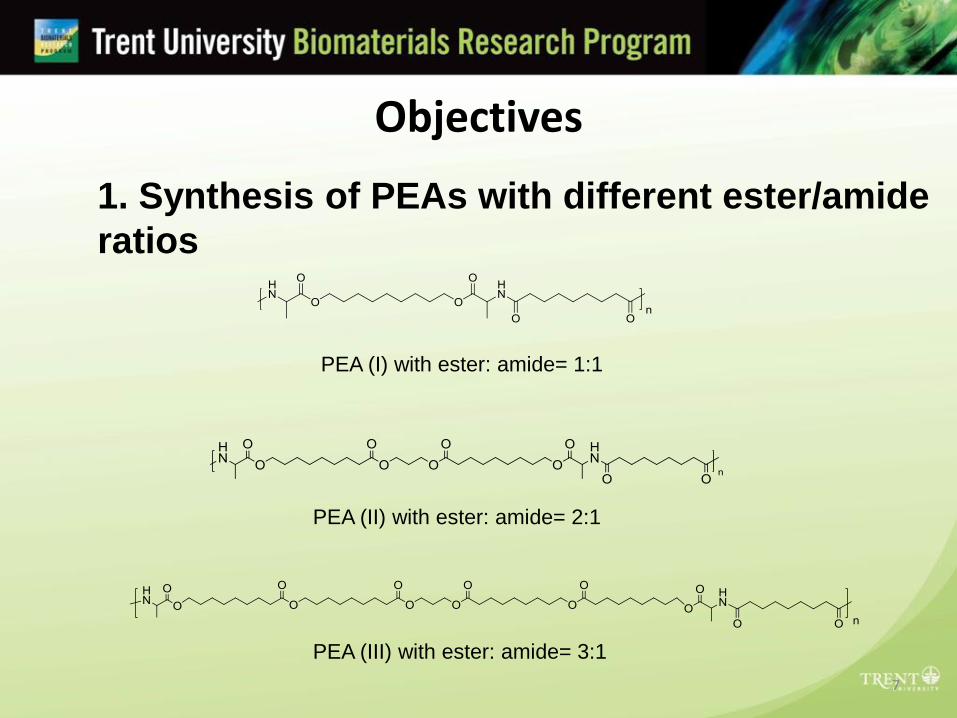
Objectives
1. Synthesis of PEAs with different ester/amide
ratios
PEA (I) with ester: amide= 1:1
PEA (II) with ester: amide= 2:1
PEA (III) with ester: amide= 3:1
8
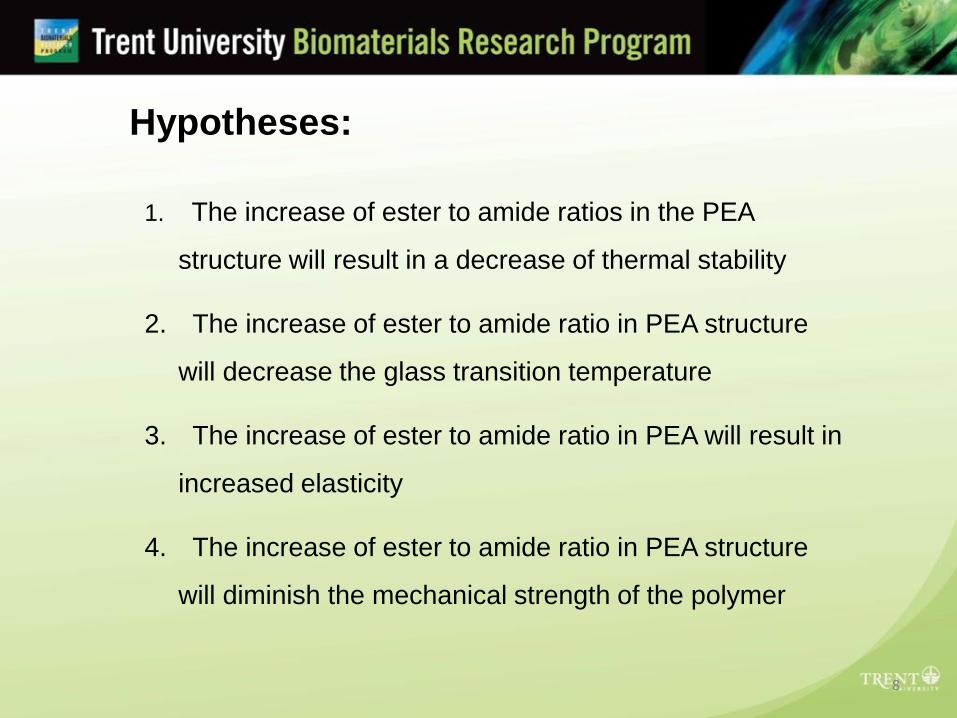
Hypotheses:
1. The increase of ester to amide ratios in the PEA
structure will result in a decrease of thermal stability
2. The increase of ester to amide ratio in PEA structure
will decrease the glass transition temperature
3. The increase of ester to amide ratio in PEA will result in
increased elasticity
4. The increase of ester to amide ratio in PEA structure
will diminish the mechanical strength of the polymer
9
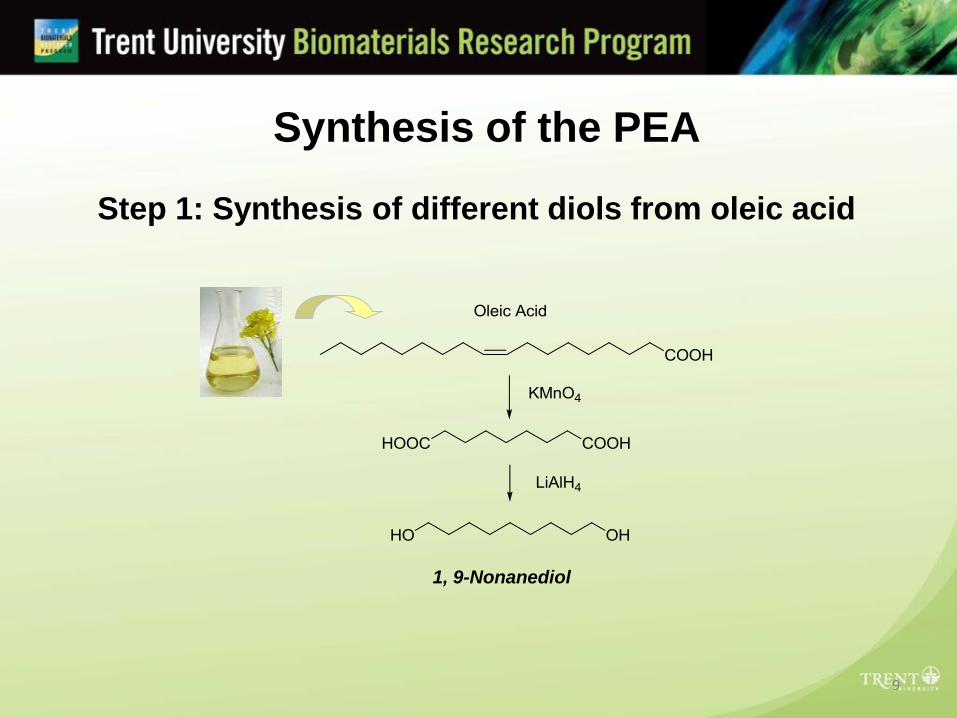
Step 1: Synthesis of different diols from oleic acid
1, 9-Nonanediol
Synthesis of the PEA

10
Di-ester diol
Tetra-ester diol
Step 1: Synthesis of different diols from oleic acid
11
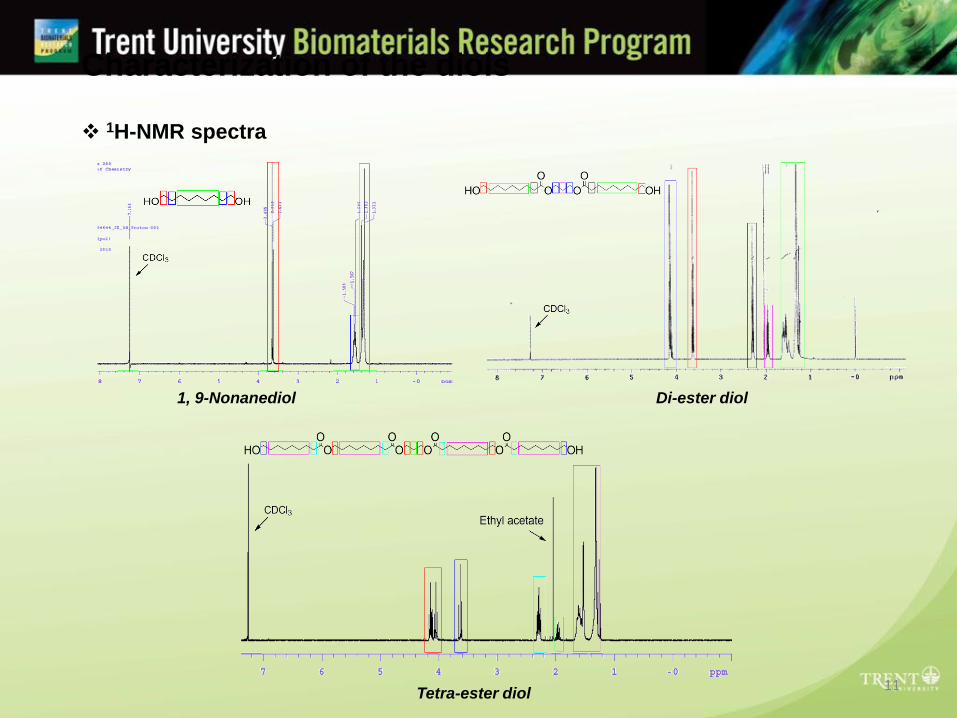
Characterization of the diols
1H-NMR spectra
1, 9-Nonanediol Di-ester diol
Tetra-ester diol
12
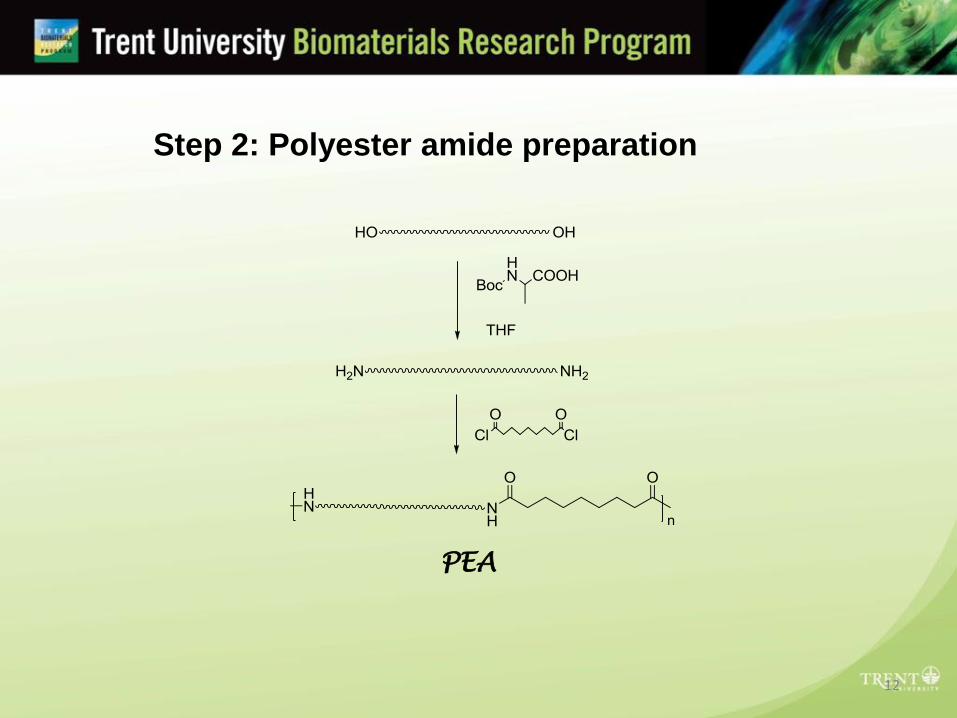
Step 2: Polyester amide preparation
PEA
13
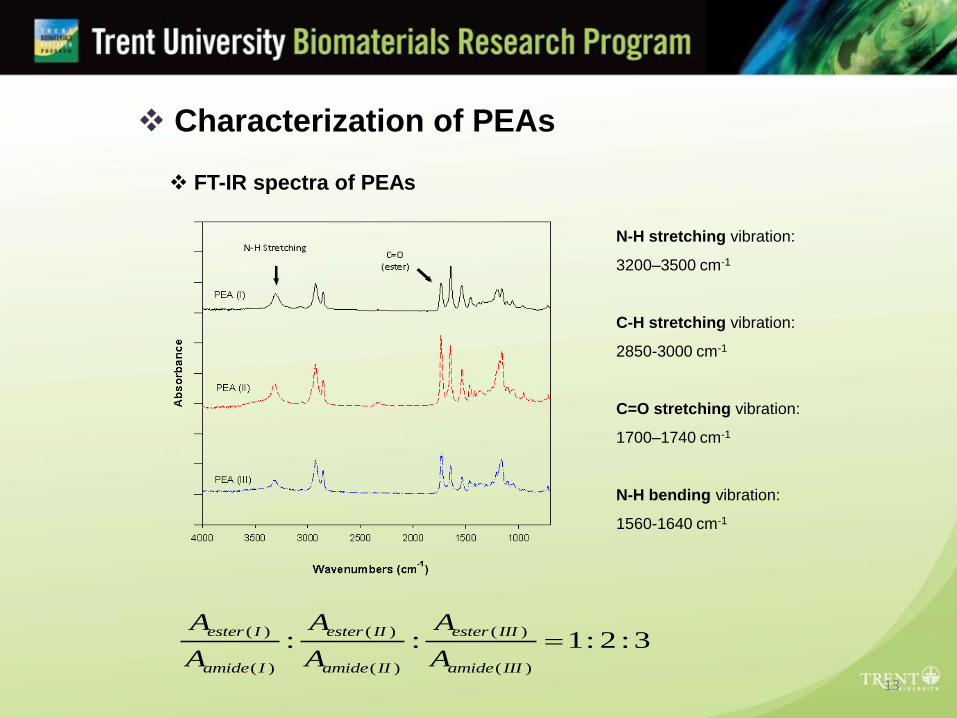
FT-IR spectra of PEAs
Characterization of PEAs
N-H stretching vibration:
3200–3500 cm-1
C-H stretching vibration:
2850-3000 cm-1
C=O stretching vibration:
1700–1740 cm-1
N-H bending vibration:
1560-1640 cm-1
( ) ( ) ( )
( ) ( ) ( )
: : 1: 2 :3ester I ester II ester III
amide I amide II amide III
A A A
A A A
14
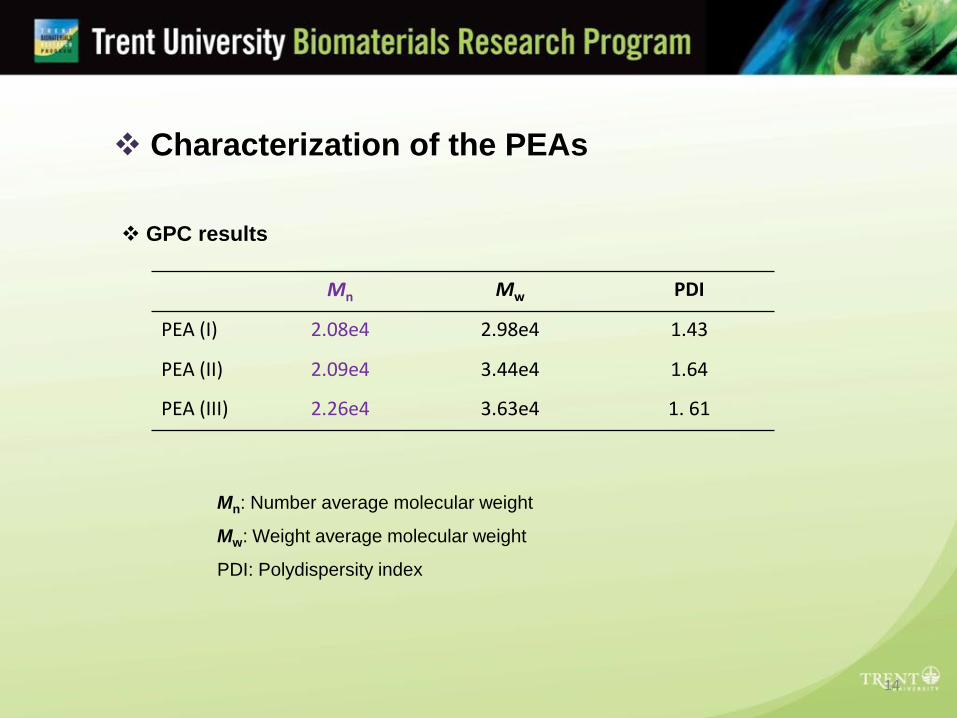
Characterization of the PEAs
Mn Mw PDI
PEA (I) 2.08e4 2.98e4 1.43
PEA (II) 2.09e4 3.44e4 1.64
PEA (III) 2.26e4 3.63e4 1. 61
GPC results
Mn: Number average molecular weight
Mw: Weight average molecular weight
PDI: Polydispersity index
15
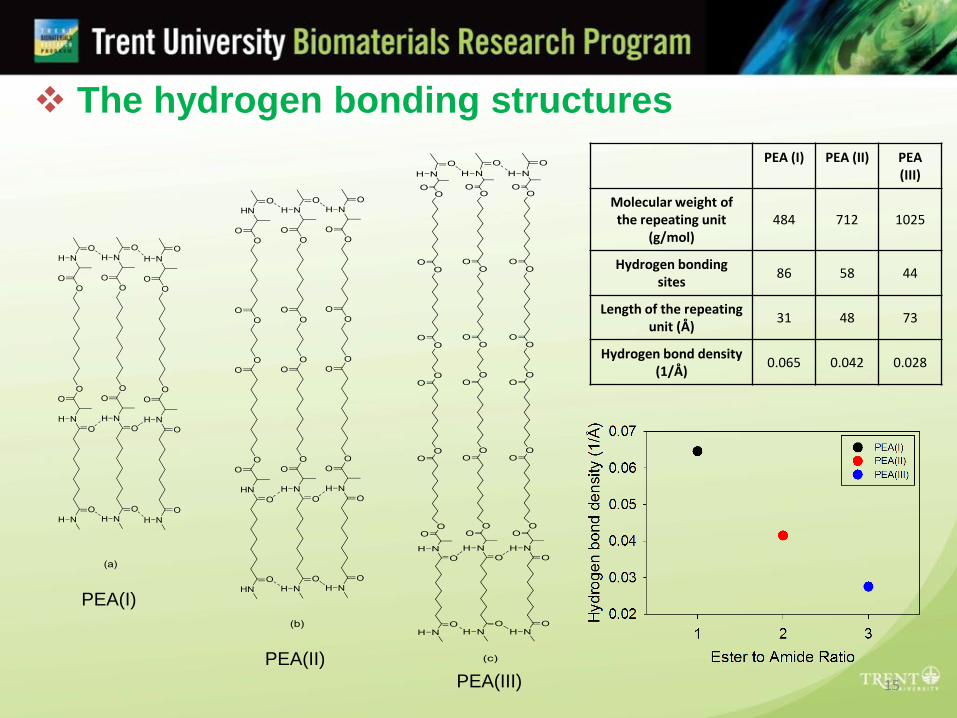
The hydrogen bonding structures
PEA(I)
PEA(II)
PEA(III)
PEA (I) PEA (II) PEA (III)
Molecular weight of the repeating unit
(g/mol)484 712 1025
Hydrogen bonding sites
86 58 44
Length of the repeating unit (Å)
31 48 73
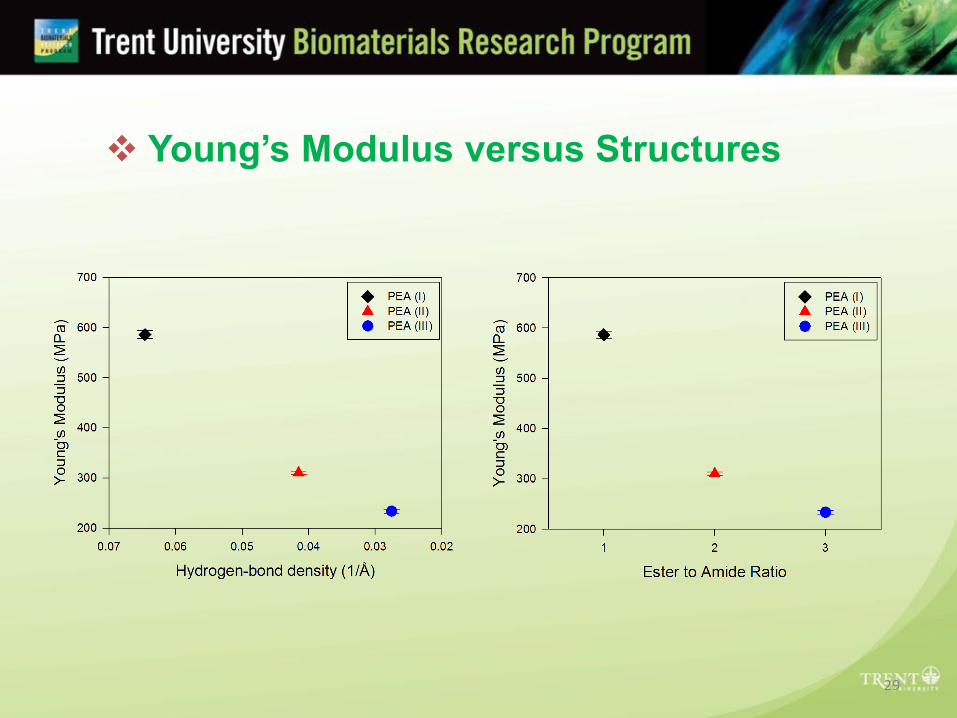
Hydrogen bond density (1/Å)
0.065 0.042 0.028
16
Physical Tests
1) Thermogravimetric Analysis (TGA)
• Thermal stability
• Weight changes vs. Temperature
17
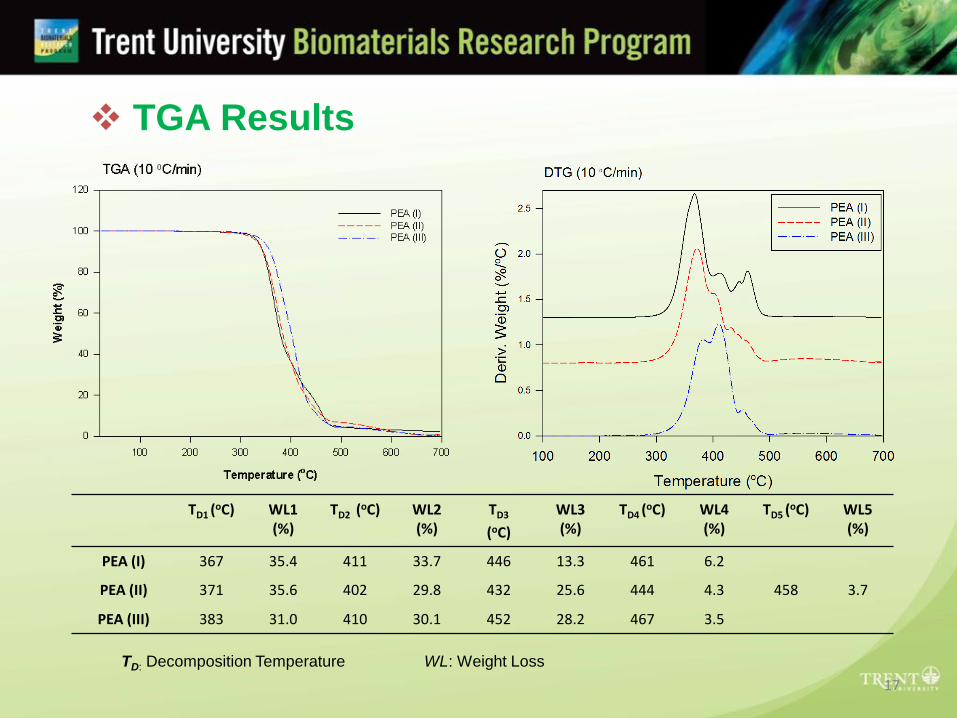
TGA Results
TD1 (oC) WL1
(%)TD2 (oC) WL2
(%)TD3
(oC)
WL3 (%)
TD4 (oC) WL4
(%)TD5 (
oC) WL5 (%)
PEA (I) 367 35.4 411 33.7 446 13.3 461 6.2
PEA (II) 371 35.6 402 29.8 432 25.6 444 4.3 458 3.7
PEA (III) 383 31.0 410 30.1 452 28.2 467 3.5
TD: Decomposition Temperature WL: Weight Loss
18
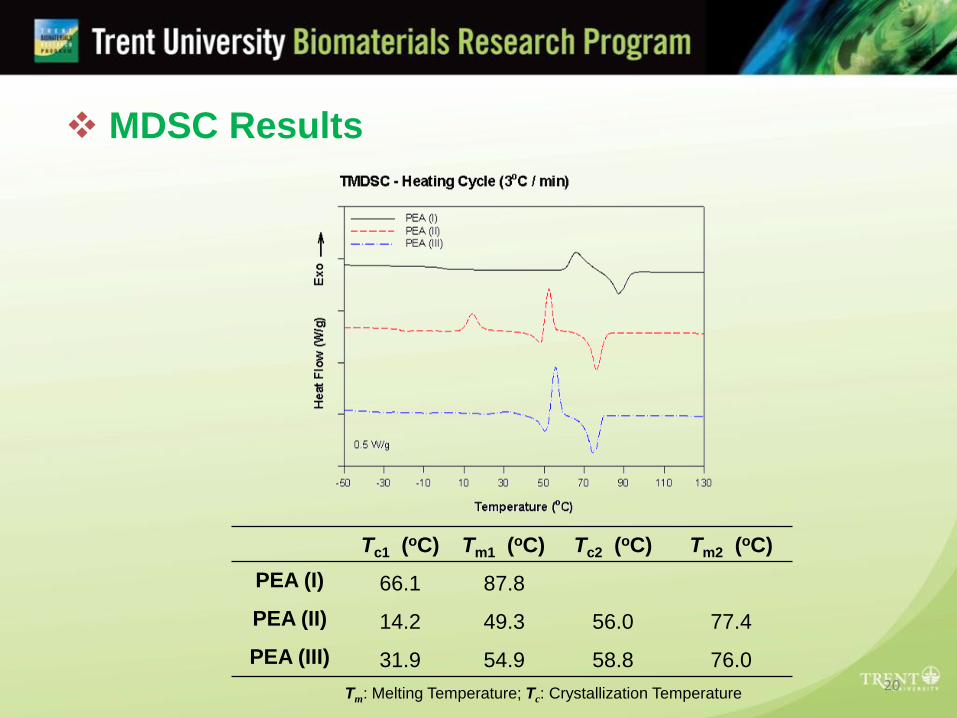
2) Modulated Differential Scanning Calorimetry (MDSC)
• Melting temperature (Tm)
• Crystallization temperature (Tc)
• Glass transition temperature (Tg)
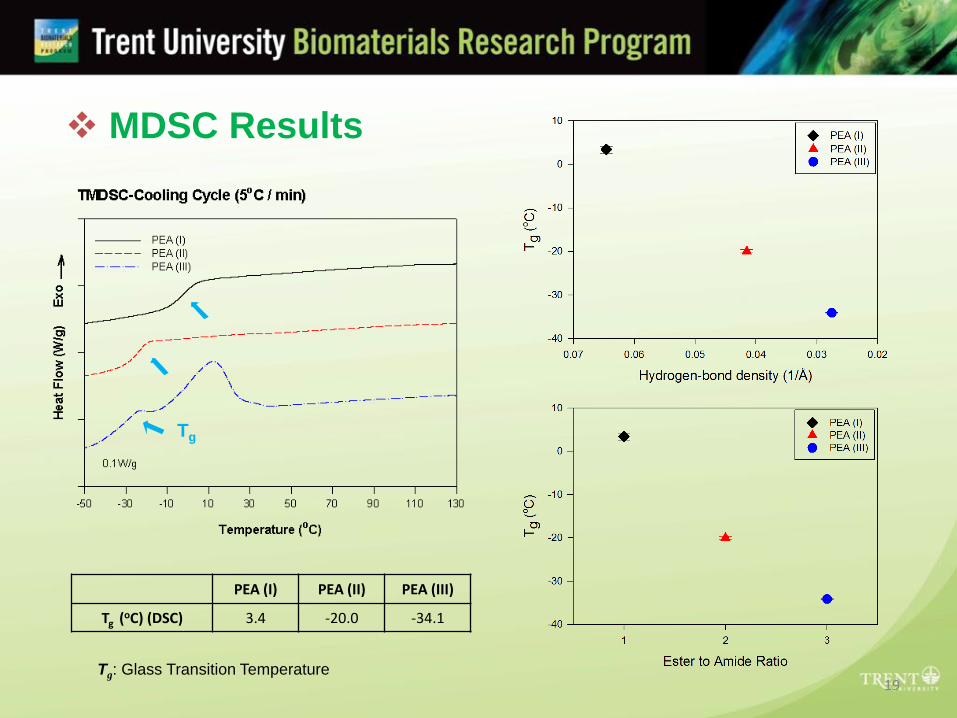
19Tg: Glass Transition Temperature
Tg
MDSC Results
PEA (I) PEA (II) PEA (III)
Tg (oC) (DSC) 3.4 -20.0 -34.1
20
Tc1 (oC) Tm1 (oC) Tc2 (oC) Tm2 (oC)
PEA (I) 66.1 87.8
PEA (II) 14.2 49.3 56.0 77.4
PEA (III) 31.9 54.9 58.8 76.0
Tm: Melting Temperature; Tc: Crystallization Temperature
MDSC Results
21
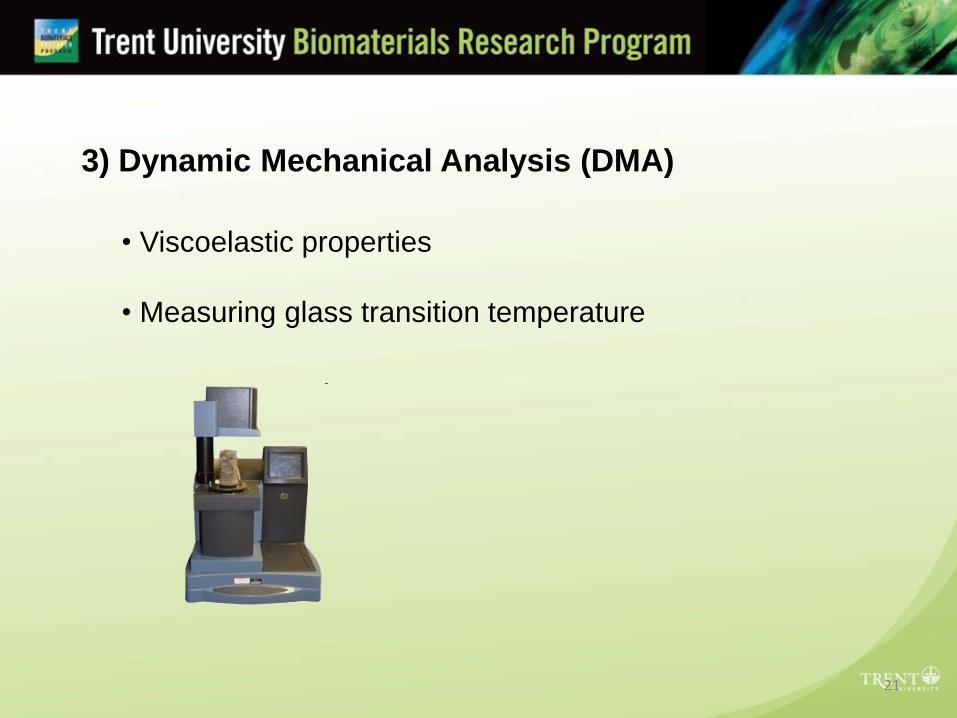
• Viscoelastic properties
• Measuring glass transition temperature
3) Dynamic Mechanical Analysis (DMA)

22
DMA ResultsStorage Modulus at 37 oC
23
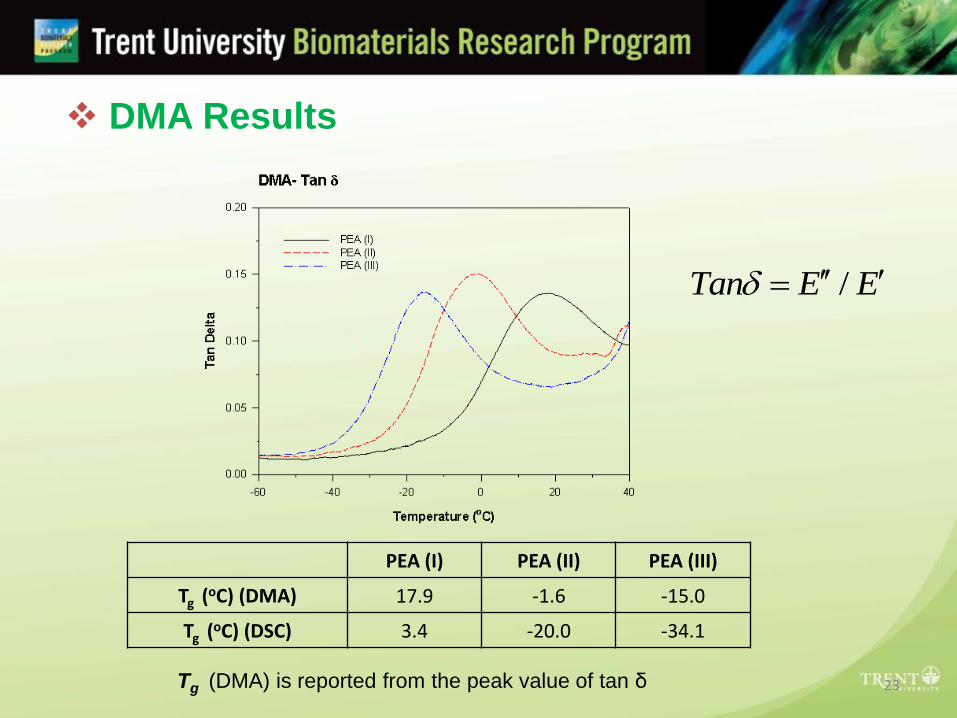
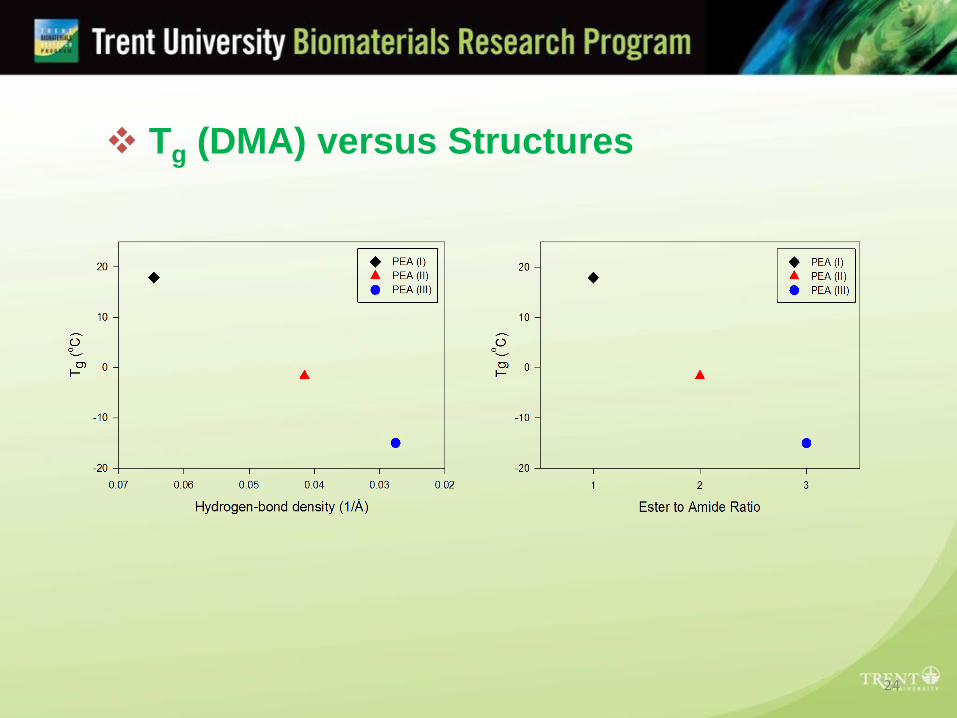
PEA (I) PEA (II) PEA (III)
Tg (oC) (DMA) 17.9 -1.6 -15.0
Tg (oC) (DSC) 3.4 -20.0 -34.1
Tg (DMA) is reported from the peak value of tan δ
DMA Results
/Tan E E
24
Tg (DMA) versus Structures
25
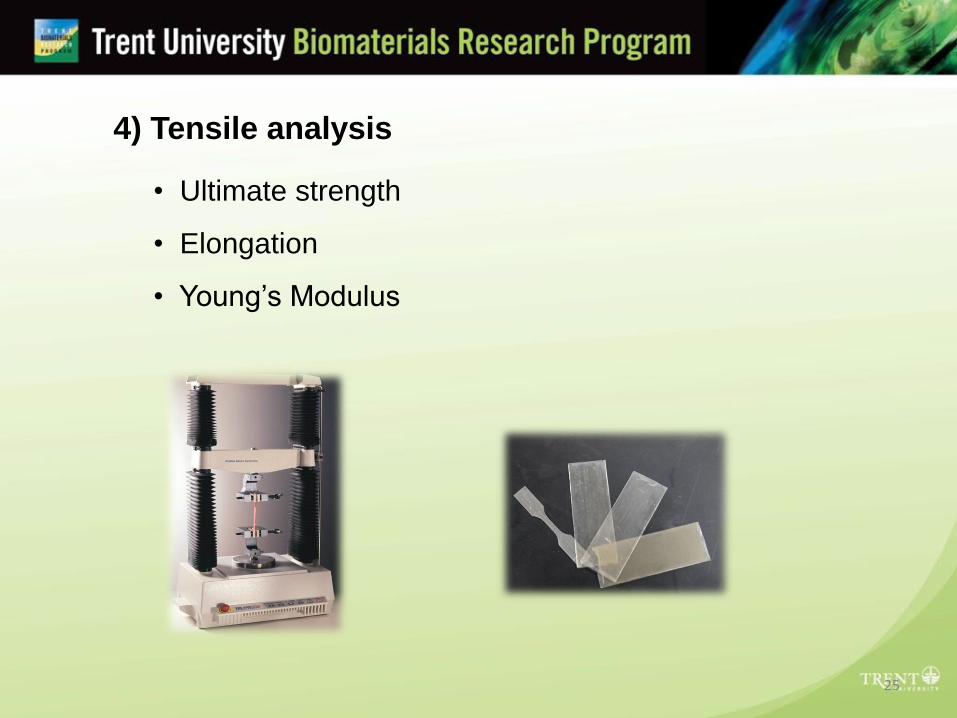
4) Tensile analysis
• Ultimate strength
• Elongation
• Young’s Modulus
26
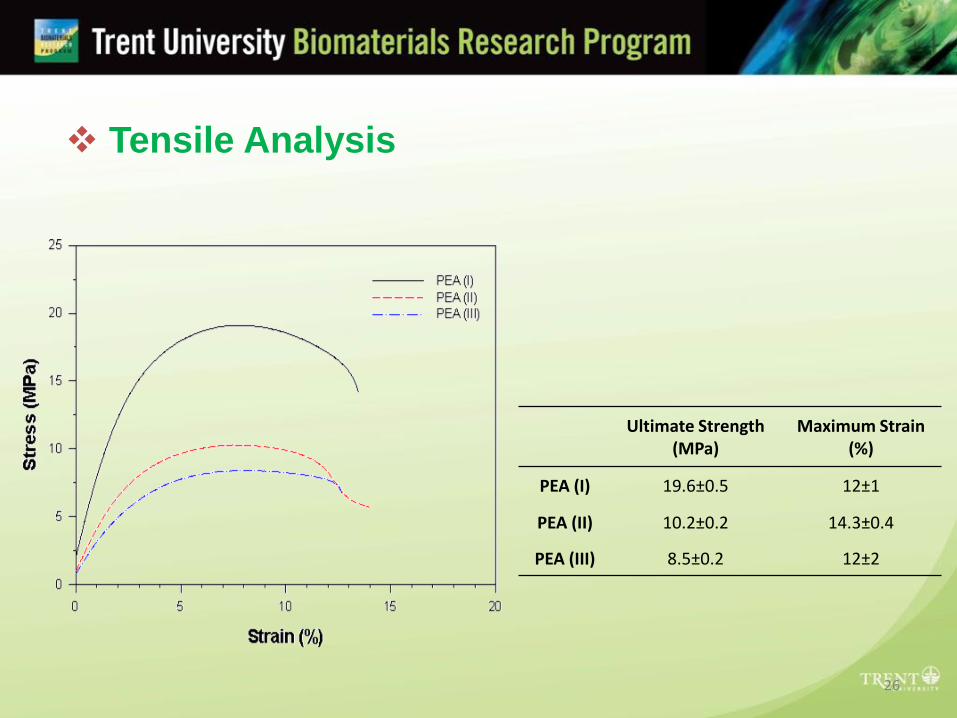
Ultimate Strength(MPa)
Maximum Strain(%)
PEA (I) 19.6±0.5 12±1
PEA (II) 10.2±0.2 14.3±0.4
PEA (III) 8.5±0.2 12±2
Tensile Analysis
27
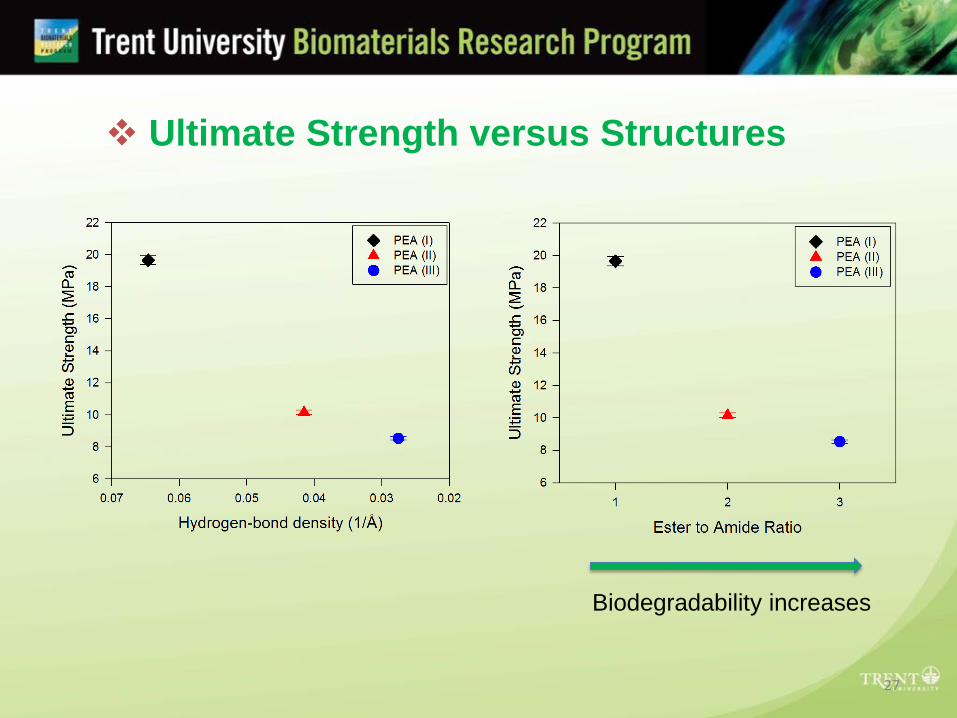
Ultimate Strength versus Structures
Biodegradability increases

28
Young’s Modulus (MPa)
PEA (I) 535.1
PEA (II) 319.2
PEA (III) 239.8
Tensile Analysis
29
Young’s Modulus versus Structures

30
X-ray Diffraction
2θ (º) d-spacing (Å)
α-form(helical
conformation)
16.8 5.23
19.0 4.65
23.2 3.84
β-form(planar
conformation)
6.9 12.72
21.1 4.19
24.7 3.64
Scattering Angle (2θ, Degree)
Co
un
ts
31
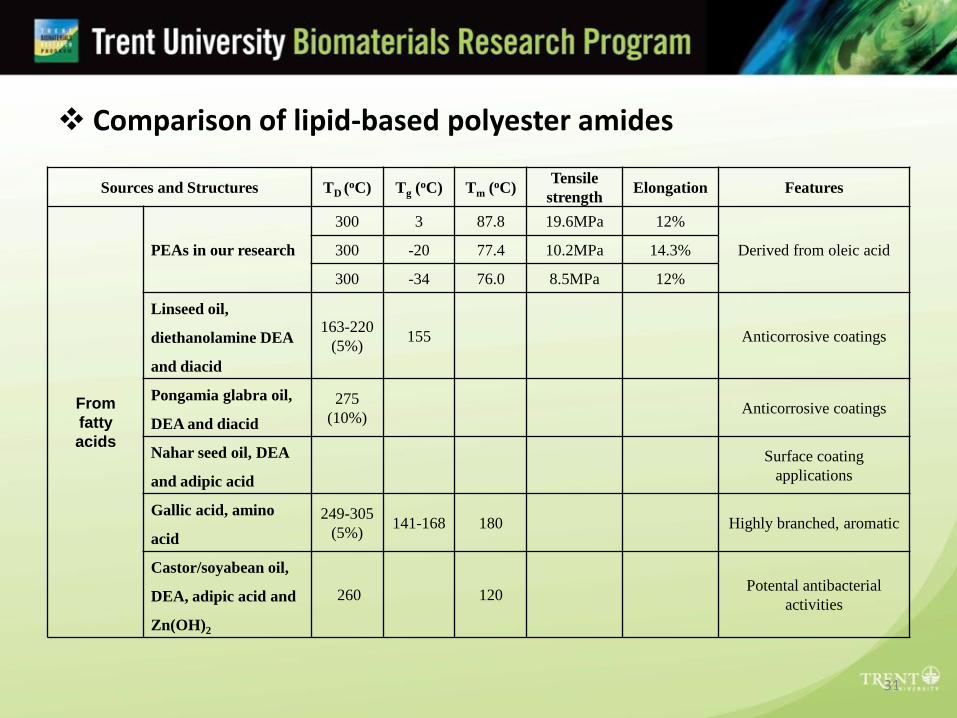
Sources and Structures TD (oC) Tg (oC) Tm (oC)
Tensile
strengthElongation Features
From
fatty
acids
PEAs in our research
300 3 87.8 19.6MPa 12%
Derived from oleic acid300 -20 77.4 10.2MPa 14.3%
300 -34 76.0 8.5MPa 12%
Linseed oil,
diethanolamine DEA
and diacid
163-220
(5%)155 Anticorrosive coatings
Pongamia glabra oil,
DEA and diacid
275
(10%)Anticorrosive coatings
Nahar seed oil, DEA
and adipic acid
Surface coating
applications
Gallic acid, amino
acid
249-305
(5%)141-168 180 Highly branched, aromatic
Castor/soyabean oil,
DEA, adipic acid and
Zn(OH)2
260 120Potental antibacterial
activities
Comparison of lipid-based polyester amides
32
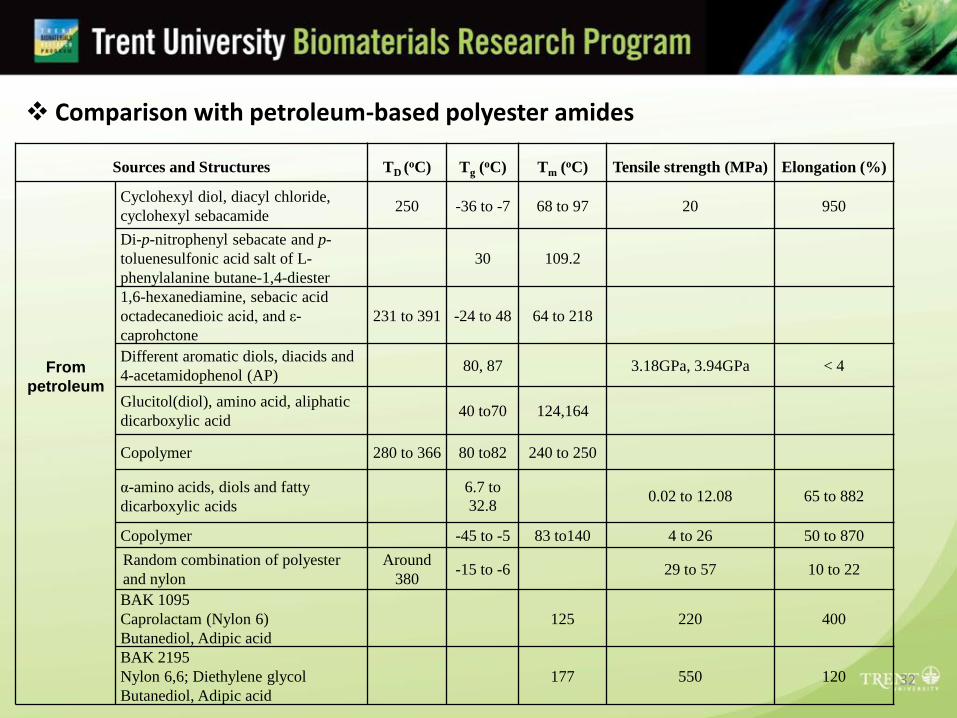
Sources and Structures TD (oC) Tg (oC) Tm (oC) Tensile strength (MPa) Elongation (%)
From
petroleum
Cyclohexyl diol, diacyl chloride,
cyclohexyl sebacamide250 -36 to -7 68 to 97 20 950
Di-p-nitrophenyl sebacate and p-
toluenesulfonic acid salt of L-
phenylalanine butane-1,4-diester
30 109.2
1,6-hexanediamine, sebacic acid
octadecanedioic acid, and ε-
caprohctone
231 to 391 -24 to 48 64 to 218
Different aromatic diols, diacids and
4-acetamidophenol (AP)80, 87 3.18GPa, 3.94GPa < 4
Glucitol(diol), amino acid, aliphatic
dicarboxylic acid40 to70 124,164
Copolymer 280 to 366 80 to82 240 to 250
α-amino acids, diols and fatty
dicarboxylic acids
6.7 to
32.80.02 to 12.08 65 to 882
Copolymer -45 to -5 83 to140 4 to 26 50 to 870
Random combination of polyester
and nylon
Around
380-15 to -6 29 to 57 10 to 22
BAK 1095
Caprolactam (Nylon 6)
Butanediol, Adipic acid
125 220 400
BAK 2195
Nylon 6,6; Diethylene glycol
Butanediol, Adipic acid
177 550 120
Comparison with petroleum-based polyester amides

Conclusions
Three PEAs with different ratios of ester and amide
linkages were synthesized from lipid-based components
The PEAs were fully characterized
Functionality of the PEAs were investigated from a
structural perspective
PEA’s had superior properties to all other lipid-based
PEAs
PEA’s had comparable and sometimes superior
properties to petroleum-based PEAs
34
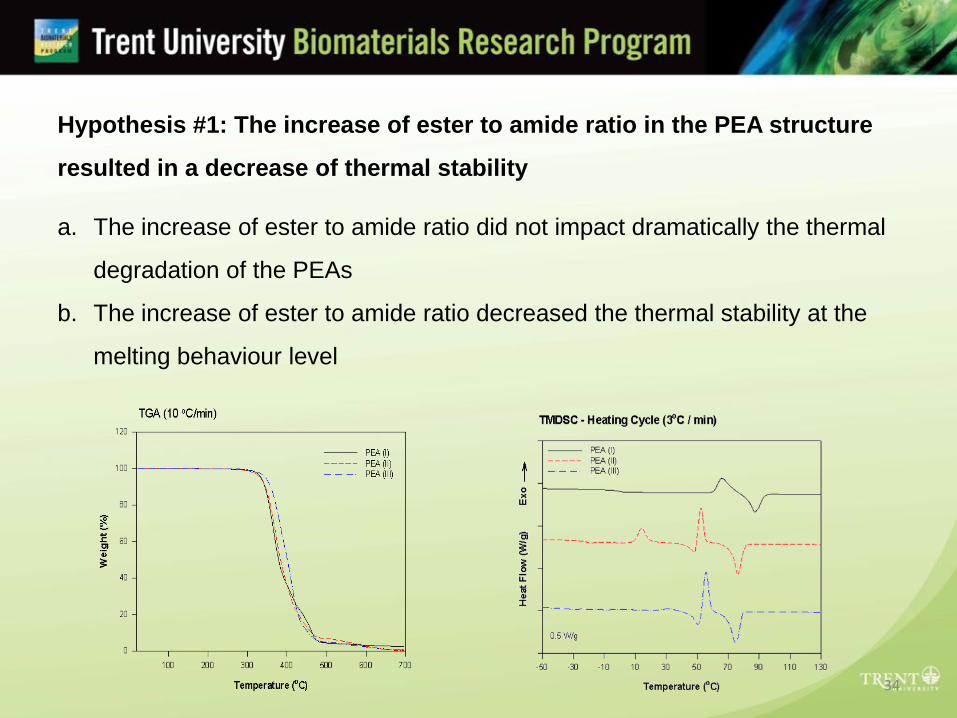
Hypothesis #1: The increase of ester to amide ratio in the PEA structure
resulted in a decrease of thermal stability
a. The increase of ester to amide ratio did not impact dramatically the thermal
degradation of the PEAs
b. The increase of ester to amide ratio decreased the thermal stability at the
melting behaviour level
35
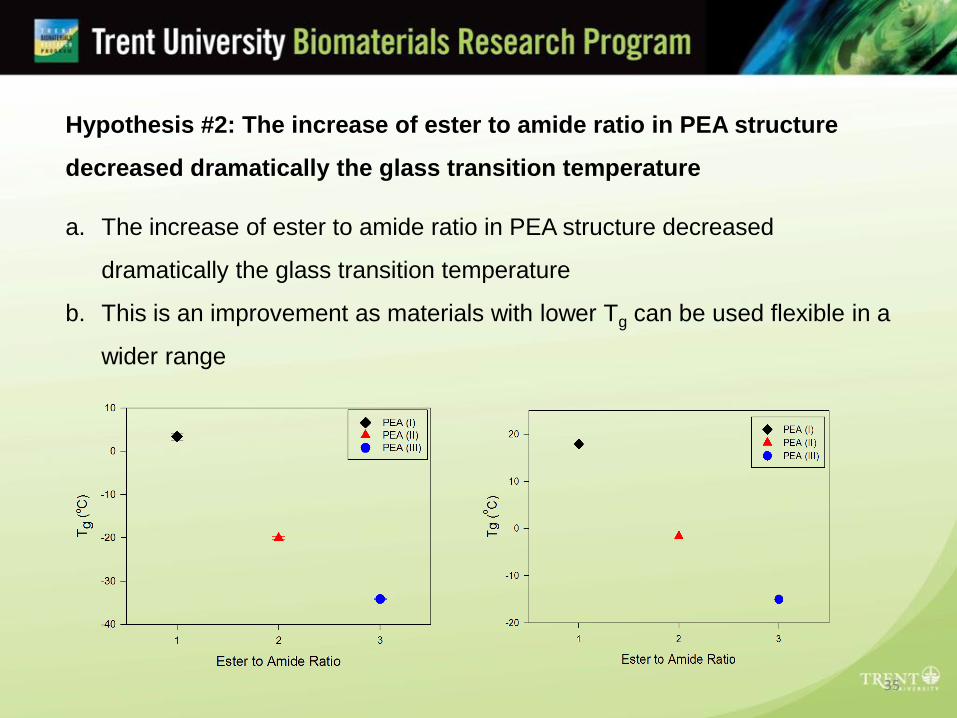
Hypothesis #2: The increase of ester to amide ratio in PEA structure
decreased dramatically the glass transition temperature
a. The increase of ester to amide ratio in PEA structure decreased
dramatically the glass transition temperature
b. This is an improvement as materials with lower Tg can be used flexible in a
wider range
36
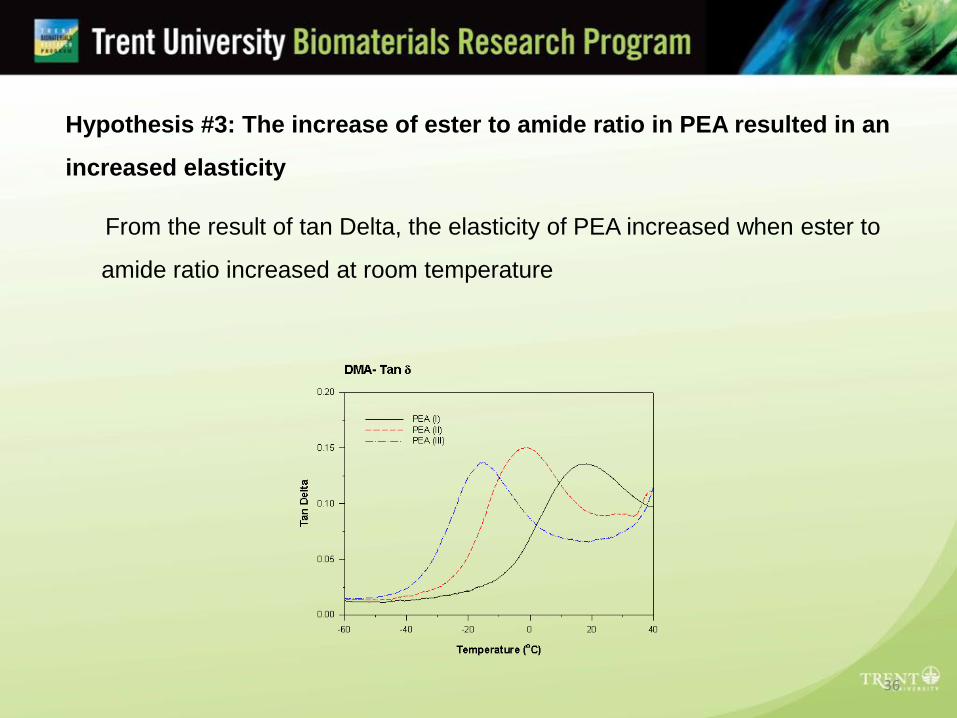
Hypothesis #3: The increase of ester to amide ratio in PEA resulted in an
increased elasticity
From the result of tan Delta, the elasticity of PEA increased when ester to
amide ratio increased at room temperature
37
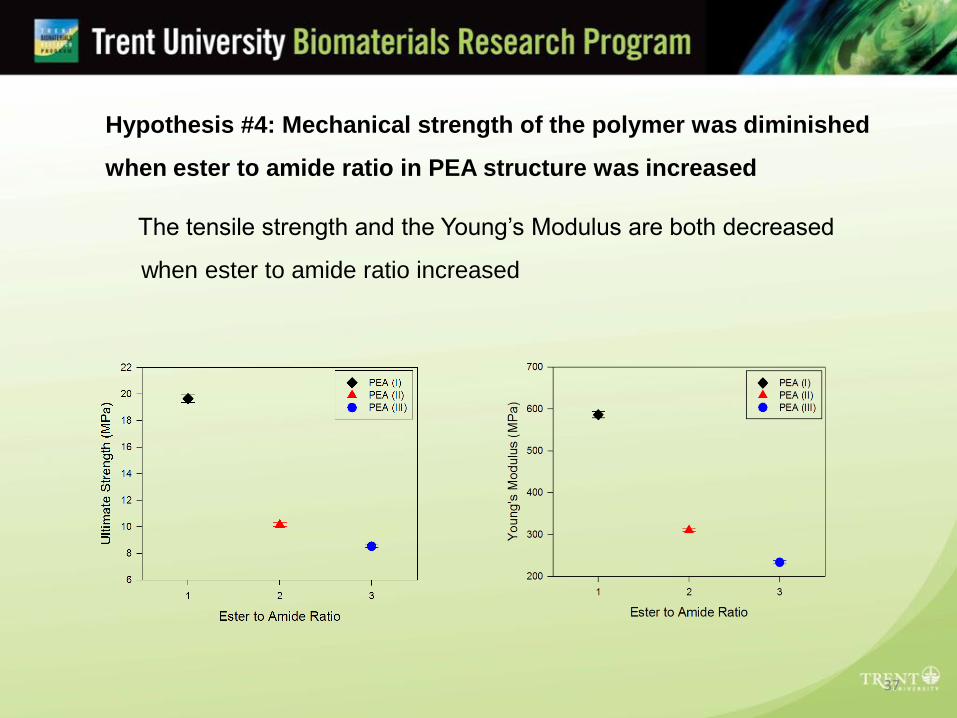
Hypothesis #4: Mechanical strength of the polymer was diminished
when ester to amide ratio in PEA structure was increased
The tensile strength and the Young’s Modulus are both decreased
when ester to amide ratio increased

38
Future Work
Investigate the biodegradability of PEAs with varying ratios of ester to amide groups
Increase the molecular weights of the synthesized PEAs to further improve the thermal and mechanical properties (such as changing the amino acid to polypeptide or increasing the reaction temperature)
Study the effects of crystallinity on the physical properties of the PEAs
Prepare a PEA with an ester to amide ratio of 4:1 in order to model the trend observed in the physical properties versus ester to amide ratio
Acknowledgment
• Ontario Soybean Growers / Grain Farmers of Ontario
• Elevance Renewable Sciences
• NSERC
• GPA- EDC
• Industry Canada
• Trent University
39

40
Thank You !