Embed Size (px)
Citation preview

POUR L'OBTENTION DU GRADE DE DOCTEUR ÈS SCIENCES
acceptée sur proposition du jury:
Prof. J. Brugger, président du juryProf. H. Hofmann, Dr D. M. Opris, directeurs de thèse
Dr A. Testino, rapporteurProf. M. Niederberger, rapporteur
Dr Y. Leterrier, rapporteur
Synthesis and Functionalization of Silver Nanoparticles for the Preparation of High Permittivity Nanocomposites
THÈSE NO 6686 (2015)
ÉCOLE POLYTECHNIQUE FÉDÉRALE DE LAUSANNE
PRÉSENTÉE LE 18 AOÛT 2015
À LA FACULTÉ DES SCIENCES ET TECHNIQUES DE L'INGÉNIEURLABORATOIRE DE TECHNOLOGIE DES POUDRES
PROGRAMME DOCTORAL EN SCIENCE ET GÉNIE DES MATÉRIAUX
Suisse2015
PAR
Jose Enrico Quijano QUINSAAT

“I know it seems hard sometimes but remember one thing. Through every dark night, there's a
bright day after that. So no matter how hard it get, stick your chest out, keep ya head up.... and
handle it.”
- 2Pac Shakur -

Acknowledgements First of all, I would like to address my deepest gratitude to my two thesis directors, Prof. Dr.
Heinrich Hofmann and Dr. Dorina Opris of the Laboratory of Powder Technology (LTP) of
the Swiss Federal Institute of Technology Lausanne (EPFL) and of the Laboratory for
Functional Polymers of the Swiss Federal Laboratories for Materials Science and Technology
(Empa), respectively, for giving me the opportunity to conduct my thesis under their guidance
and allow me to be part of their research activities.
My special thanks go out to Prof. Dr. Frank Nüesch, the head of the Laboratory for Functional
Polymers at Empa, for giving me the chance to conduct my research in his laboratories. I
would also like to extend my gratitude to Dr. Andrea Testino and his group at Paul Scherrer
Institut (Chemical Processes and Materials) and Prof. Dr. Paul Bowen of the LTP at EPFL for
their significant contributions to this project which includes providing experimental assistance
up to fruitful discussions towards the successful outcome of this work.
Furthermore, I would like to thank the members of my groups from both EPFL and Empa,
especially my group members from the Polymer Materials Division, Yee Song Ko, Simon
Dünki, Dr. Monica Circu, Dr. Mihaela Alexandru, Dr. Elena Perju, for their kind assistance
and support during my PhD thesis. It was a pleasure to have worked and learned from such
talented people like you.
I also thank Mrs. Beatrice Fischer, Mr. Adrian Wichser, Mr. Michael Schneider, Mr. Daniel
Schreier and Dr. Andreas Borgschulte for their respective contributions to this project, as well
as Dr. Christian Scheller and Dr. Eduardo Cuervo-Reyes for the fruitful discussions involving
experimental physics.
I would also like to acknowledge EPFL, Empa, Paul Scherrer Institut and the Swiss National
Science Foundation (SNF project no. 132101) for enabling this work by providing the
essential infrastructure and financial assistance.
Finally, I would like to thank my loved ones which are my family and friends for their love
and never ending support which kept me going throughout this whole time. I am very lucky to
have you all in my life and will always keep you in my heart forever, even when I will have to
part from some of you. The times with you were unforgettable and I will always cherish these
memories.

Thank you, Switzerland, for having been a great host country to me and giving me the
opportunity of having a good education. I enjoyed the ten years that I’ve spent here very
much. I hope to see you again in the future.

Zusammenfassung Im Laufe des letzten Jahrzehnts ist das Interesse an der Nanochemie gewachsen, insbesondere
aufgrund der interessanten Eigenschaften der Nanomaterialien, die von der Grösse, Form
sowie der Oberflächenstruktur bestimmt werden. Dabei haben metallische Nanopartikel für
grosses Aufsehen gesorgt, da ihre Eigenschaften es ihnen ermöglicht, in verschiedenen
naturwissenschaftlichen Disziplinen eingesetzt zu werden. Trotz der Tatsache, dass sich die
Eigenschaften von metallischen Nanopartikeln von der Masse unterscheiden, bleiben einige
Eigenschaften weiterhin unverändert, darunter die unendlich grosse Dielektrizitätskonstante,
die in Metallen vorgefunden werden. Aus diesem Grunde wurden metallische Nanopartikel
benutzt, um Verbundwerkstoffe mit Polymere als Matrix herzustellen. Aus diesen
Verbundwerkstoffen sollen dielektrische Materialien mit hohen Dielektrizitätskonstanten
hervorgehen, die für die Energiespeicherung oder für die Energieumwandlung eingesetzt
werden sollen.
Trotz der grossen Anzahl an Publikationen in den letzten Jahren, die sich mit der Herstellung
von Verbundwerkstoffen mit hohen Dielektrizitätskonstanten befassen, gibt es weiterhin
Verbesserungsmöglichkeiten für bestehende Materialien. Zum Beispiel werden in einigen
Materialien weiterhin hohe dielektrische Verluste verzeichnet, und ausserdem führt die
Nutzung von gewissen Füllmaterialien zu einer deutlichen Verschlechterung der
mechanischen Eigenschaften, insbesondere mit zunehmendem Anteil des Füllmaterials. Dazu
besitzen eine grosse Zahl von Verbundwerkstoffen keine gute Kontrolle über die Grösse und
Form der Füllmaterialien sowie unzureichende Informationen bezüglich der
Oberflächenbehandlung, die insgesamt zu weiteren Komplexitäten für das Verständnis der
Materialeigenschaften beitragen.
Diese Arbeit versucht, sich mit den genannten Problemen von Verbundwerkstoffen zu
befassen. Aus diesem Grunde wurden Silbernanopartikel (AgNPs) als Füllmaterial eingesetzt,
während Polydimethylsiloxan (PDMS) als Polymermatrix auserwählt wurde. Die Vorteile von
Silbernanopartikeln sind ihre relativ leichte Herstellungsmöglichkeiten sowie ihre Resistenz
gegenüber Korrosion und Oxidation. Die Herstellung von grossen Mengen Silbernanopartikel
wurde durch die Durchführung der Polyolsynthese in einem segmentierendem Rohrreaktor
(SFTR) ermöglicht. Die Silbernanopartikel wurden mit einer Siliziumdioxidschicht umgeben,
um der Entwicklung von leitfähigen Pfaden innerhalb des Verbundwerkstoffs vorzubeugen.
Die dielektrischen Eigenschaften von diesen „Core-shell“-Partikeln wurden zudem in

Abhängigkeit von der Schalendicke untersucht. Die Siliziumdioxidschicht ermöglicht auch
die Verbesserung der Kompatibilität zwischen den Partikeln und dem PDMS. Die Wahl von
PDMS als Matrix erfolgte aufgrund ihrer guten elektromechanischen Eigenschaften wie etwa
hohe Dehnbarkeit, niedrige Viskosität und elektrische Leitfähigkeit sowie tiefe Werte für den
Verlustfakor (tan δ).
Die hergestellten Verbundwerkstoffe haben im Vergleich zu PDMS höhere
Dielektrizitätskonstanten. Ausserdem können die Materialien trotz des hohen Volumenanteils
von Silber (20 vol%) weiterhin stark gedehnt werden (800 %). Andere Eigenschaften wie
etwa die elektrische Leitfähigkeit oder der Verlustfaktor wurden niedrig gehalten, sodass die
jeweiligen Materialien das Potential haben, als dielektrische Elastomere eingesetzt zu werden.
Stichwörter: Silbernanopartikel, Polyolsynthese, Rohrreaktor, Öberflächenbehandlung,
Verbundwerkstoffe, dielektrische Elastomere.

Abstract Over the last decade, a growing interest in nanochemistry has emerged due to the interesting
features of nanomaterials that vary with size, shape and surface structure. In particular, metal
nanoparticles have received much attention due to their properties that enable their use in
various scientific disciplines. Although metal nanoparticles exhibit a number of properties
that differ from bulk, some properties, such as their infinite permittivity, remain unchanged.
As a result, metal nanoparticles have also been used to prepare nanocomposites with polymers
in order to provide dielectric materials featuring high permittivities which can be used for
applications such as energy storage (capacitors) or as materials for the conversion of electrical
energy into mechanical motion (actuators).
Despite the large number of publications on the preparation of nanocomposites exhibiting
high permittivities which have emerged over the years, there is still room for further
improvement in the current materials properties. For instance, dielectric losses are still quite
high in some materials, and the use of certain types of filler lead to a large deterioration in the
mechanical properties of the nanocomposites, especially with increasing filler content. In
addition, a large number of the fillers used for the preparation of the nanocomposites feature
poor size and shape control as well as poorly defined surface properties thus adding to the
complexity of understanding the resulting material properties.
This work tries to address some of the current issues concerning the preparation of dielectric
materials. Therefore, silver nanoparticles (AgNPs) were used as filler, while polydimethyl-
siloxane (PDMS) was employed as the polymeric matrix. The advantages of using AgNPs as
filler consist of their relative facile preparation, as well as the possibility of controlling their
surface properties due to their resistance towards oxidation and corrosion. The possibility of
preparing AgNPs in large amounts with control over the average size of the particles was
realized by conducting the polyol synthesis of AgNPs in a Segmented Flow Tubular Reactor
(SFTR). A SiO2 layer was grown around the AgNPs to prevent the loss of the insulating
nature of the composite due to the formation of conductive pathways, and the thickness
dependency of the dielectric properties of the core-shell particles was also investigated in this
work. Furthermore, the SiO2 shell also provided the possibility of further surface
functionalization, which was conducted in order to compatibilize the core-shell particles with
the PDMS matrix. PDMS was chosen as the polymeric matrix due to its good

electromechanical properties, which include high elasticity, low viscosity as well as low
conductivity and low tangent losses (tan δ).
The resulting nanocomposites featured enhanced permittivities compared to PDMS, while
further optimization in the reaction conditions as well as in the processing procedure yielded
nanocomposites with high flexibility that can undergo strains as high as 800 % at a silver
content of 20 vol%. Other properties such as electric conductivity and the tan δ were kept low
which emphasizes the potential of the nanocomposites to being used as flexible dielectric
materials.
Keywords: silver nanoparticles, polyol synthesis, segmented flow tubular reactor, surface
functionalization, nanocomposites, dielectric elastomer.

Table of Contents
i
Table of Contents
Chapter 1: Introduction .............................................................................................................. 1
1.1 General Overview on Electroactive Polymers (EAPs)......................................................... 1
1.2 Basic Principle of Elastomers ............................................................................................... 6
1.3 Dielectric Properties of Materials....................................................................................... 13
1.4. Polarization Mechanisms in Molecular Structures ............................................................ 16
1.5. Enhancing the Permittivity of Elastomers ......................................................................... 20
1.5.1 Enhancing the Permittivity through Molecular Dipoles.................................................. 21
1.5.2 Enhancing the Permittivity with the Introduction of High Permittivity Filler ................ 24
1.6 Synthesis of Metal Nanoparticles ....................................................................................... 31
1.6.1 The Mechanisms Towards the Formation of Metal Nanoparticles ................................. 31
1.6.2 Preparation of Metal Nanoparticles: The Case of Silver ................................................. 37
1.6.2.1 Preparation of Silver Nanoparticles with Inorganic Reducing Agents ........................ 39
1.6.2.2 Preparation of Silver Nanoparticles with Organic Reducing Agents ........................... 39
1.7 Surface Functionalization of Metal Nanoparticles ............................................................. 44
1.8 Current State of Functionalized Metals/Polymer Nanocomposites ................................... 48
1.9 Goals of the Thesis ............................................................................................................. 51
1.10 Structure of the Thesis ...................................................................................................... 51
1.11 References ........................................................................................................................ 53

Table of Contents
ii
Chapter 2: Continuous Production of Tailored Silver Nanoparticles by Polyol Synthesis
and Reaction Yield Measured by X-ray Absorption Spectroscopy: Towards a Growth
Mechanism. .............................................................................................................................. 75
2.1. Introduction ....................................................................................................................... 76
2.2. Experimental Section ........................................................................................................ 80
2.2.1. Continuous Segmented Flow Tubular Reactor (SFTR) ................................................. 80
2.2.2 Polyol Synthesis of Silver Nanoparticles in the SFTR.................................................... 81
2.2.3. Materials and Methods ................................................................................................... 82
2.3. Results ............................................................................................................................... 86
2.4. Discussion ......................................................................................................................... 98
2.5. Conclusions ..................................................................................................................... 101
2.6 Acknowledgements .......................................................................................................... 101
2.7 References ........................................................................................................................ 102
2.8 Supporting information .................................................................................................... 110
Chapter 3: Dielectric Properties of Silver Nanoparticles Coated with Silica Shells of
Different Thicknesses ............................................................................................................. 113
3.1 Introduction ...................................................................................................................... 114
3.2 Experimental Section ....................................................................................................... 117
3.2.1 Synthesis of Silver Nanoparticles (38 nm) .................................................................... 117
3.2.2 Synthesis of Silica Coated Silver Nanoparticles Ag@SiO2(x nm) ............................... 118
3.2.3 Synthesis of Hydrophobic Coating: (Ag@SiO2(17 nm)@alkylsilane) ......................... 119

Table of Contents
iii
3.3 Materials and Methods ..................................................................................................... 119
3.4 Results .............................................................................................................................. 120
3.4.1 Synthesis and Characterization of AgNPs Coated with SiO2 ........................................ 120
3.4.2 Dielectric Properties of Ag@SiO2 in Pressed Pellets ................................................... 126
3.5 Conclusions ...................................................................................................................... 132
3.6 Acknowledgments ............................................................................................................ 132
3.7 References ........................................................................................................................ 133
3.8 Supporting Information .................................................................................................... 140
Chapter 4: Highly Stretchable Dielectric Elastomer Composites Containing High Volume
Fraction of Silver Nanoparticles (AgNPs) ............................................................................. 143
4.1 Introduction ...................................................................................................................... 145
4.2 Experimental Section ....................................................................................................... 148
4.2.1 Materials and Methods .................................................................................................. 148
4.2.2 Synthesis of AgNPs ....................................................................................................... 150
4.2.3 Synthesis Ag@SiO2 Core-shell Particles ...................................................................... 150
4.2.4 Synthesis of Ag@SiO2@Si(CH3)3 ................................................................................ 151
4.2.5 Synthesis of Composites of Series A ............................................................................ 151
4.2.6 Synthesis of Composites of Series B ............................................................................. 151
4.2.7 Synthesis of Composite B31 ........................................................................................... 151
4.3 Results and Discussion ..................................................................................................... 152
Table of Contents
iv
4.3.1 Synthesis and Characterization of the Filler Particles ................................................... 152
4.3.2 Synthesis and Characterization of AgNP Composites .................................................. 157
4.3.3 Dielectric Properties of the Filler and Composites ....................................................... 164
4.4 Conclusions and Outlook ................................................................................................. 170
4.5 Acknowledgements .......................................................................................................... 170
4.6 References ........................................................................................................................ 171
4.7 Supporting Information .................................................................................................... 177
Chapter 5: Surface Hydrophobization of Silver Nanoparticles (AgNPs) through Surface-
initiated Atom Transfer Radical Polymerization (SI-ATRP) ................................................. 185
5.1 Introduction ...................................................................................................................... 186
5.2 Experimental Section ....................................................................................................... 188
5.2.1 Materials and Methods .................................................................................................. 188
5.2.2 Synthesis of AgNPs ....................................................................................................... 189
5.2.3 Synthesis of Ag@SiO2 Core-shell Particles .................................................................. 189
5.2.4 Synthesis of APTES-Br ................................................................................................. 189
5.2.5 Synthesis of Initiator-coated Ag@SiO2 Core-shell Particles (Ag@SiO2@Br) ............. 190
5.2.6 Surface-initiated (SI) ATRP on Initiator Coated Ag@SiO2 Core-shell Particles ......... 190
5.3 Results and Discussion ..................................................................................................... 191
5.3.1 Synthesis of AgNPs and Surface Functionalization with SiO2 ..................................... 191
5.3.2 Surface-initiated (SI) ATRP on the Ag@SiO2 Core-shell Particles ............................. 191

Table of Contents
v
5.4 Conclusion and Outlook ................................................................................................... 202
5.5 Acknowledgements .......................................................................................................... 202
5.6 References ........................................................................................................................ 203
6. Conclusions ........................................................................................................................ 209
7. Outlook ............................................................................................................................... 211
8. Appendix ............................................................................................................................ 213
A1. Preparation of Silver Nanoparticles by Inverse Miniemulsions (Water-in-Oil System) . 213
A2. The Preparation of Ag/PDMS Nanocomposites with Varying Particle Size and their
Resulting Dielectric Properties ............................................................................................... 219
A3. References ....................................................................................................................... 231
9. Curriculum Vitae ................................................................................................................ 233
Fig. 1: Composition and working principle of DEA. Upon application of a voltage (right
side) the film is compressed and elongated thus leading to the conversion of electrical
energy into mechanical work. .................................................................................................... 3
Fig. 2: Typical stress-strain curve for an elastomer (PDMS). .................................................... 7
Fig. 3: Structure of hydroxyl-terminated PDMS. ....................................................................... 8
Fig. 4: Chemical structure of di-n-butyltin dilaureate DBTDL.................................................. 9
Fig. 5μ Chemical structure of Karstedt’s catalyst. ...................................................................... 9

Table of Contents
vi
Fig. 6: Schematic illustration of a real polymer network. The present structural defects are
encircled. .................................................................................................................................. 12
Fig. 7: Schematic illustration of randomly oriented dipole molecules (left) and their
realignment towards the direction of the applied electric field (right) in a DEA. .................... 22
Fig. 8: Polymer network of PDMS with dipoles grafted onto the polymer backbone. ............ 22
Fig. 9: Dipole molecule with vinyl functionality enabling the grafting onto PDMS. .............. 23
Fig. 10: Overview of typical dimension ranges of nanoparticles and colloids, together with
some representative colloidal systems. .................................................................................... 33
Fig. 11: LaMer model for the generation of nanocrystals involving the nucleation and
growth stages. ........................................................................................................................... 34
Fig. 12: LaMer model for the generation of nanocrystals involving the nucleation and
growth stages. The product quality depending on the nucleation time is also depicted in the
image. ....................................................................................................................................... 36
Fig. 13: Schematic illustration of surface plasmon resonance (SPR). The free conduction
electrons in the metal nanoparticles undergo oscillation as a result of the strong interaction
with the incident light. .............................................................................................................. 38
Fig. 14: Proposed reaction mechanism for the preparation of AgNPs with DMF. .................. 40
Fig. 15: Proposed reaction mechanism for the preparation of AgNPs with the Tollens
reaction. .................................................................................................................................... 40
Fig. 16: Proposed reaction mechanism for the preparation of AgNPs through the reduction
with formaldehyde. ................................................................................................................... 41
Fig. 17: Proposed reaction mechanism for the preparation of AgNPs with the Turkevich
method ...................................................................................................................................... 42
Fig. 18: Proposed reaction mechanism for the preparation of AgNPs by the polyol process. . 43
Table of Contents
vii
Fig. 19: TEM micrographs of different silver nanostructures: (a) Silver nanocubes
(AgNCs), (b) silver nanowires (AgNWs) and (c) silver nanoparticles (AgNPs). .................... 44
Fig. 20: Agglomeration of conductive particles within the polymeric matrix leading to
percolation pathways (left) and insulated particles without agglomeration (right). ................. 44
Fig. 21: Silica nanoparticles prepared with the Stöber method. ............................................... 45
Fig. 22: Transformation of the PVP molecule to the enol conformation under basic
conditions. ................................................................................................................................ 46
Fig. 23: Schematic illustration of the SFTR. The two reactants are introduced separately
into the system and pass through various systems (micromixer, segmenter) in order to
produce reaction microdroplets prior to going through the heated reactor where the
formation of the particles occur................................................................................................ 80
Fig. 24: AgNPs prepared with PVP 10k: (a) G0, (b) G1, (c) G2 and (d) G3. .......................... 88
Fig. 25: AgNPs prepared with PVP 40k: (a) G4, (b) G5 and (c) G7. ...................................... 89
Fig. 26: UV-vis spectra of the AgNPs prepared with the SFTR. ............................................. 90
Fig. 27: Correlation of the mean particle diameter (measured with TEM) with the position
of the absorption maxima in the UV-vis spectra. ..................................................................... 91
Fig. 28: Particle size number distribution measured by DLS of the AgNPs prepared with
the SFTR................................................................................................................................... 91
Fig. 29: Particle size number distribution measured by DLS of the AgNPs prepared during
the long term reaction (L1). Particles were analysed at different reaction times. .................... 92
Fig. 30: Example of LC fit for (a) Sample G3 (Ag-L3) and (b) Sample G4 (Ag-K) edge
XANES spectrum. Circles: experimental data; Red line: LC fit; Blue line: fraction of Ag+
making up the fit; Pink line: fraction of Ag0 making up the fit; Green line: Difference
between experimental data and LC fit. ..................................................................................... 95
Table of Contents
viii
Fig. 31: TGA measurements conducted on the recovered powders from samples G3, G7
and L1. ...................................................................................................................................... 97
Fig. 32: Diffraction patterns collected on powder (G7) or on the as prepared suspension
(G3, G4, G5) after background subtraction. ............................................................................. 98
Fig. 33: DLS spectra of the samples Ag_1, Ag_2 and Ag_3. ................................................ 111
Fig. 34: UV-vis spectra of the samples Ag_1, Ag_2 and Ag_3. ............................................ 111
Fig. 35: TEM micrographs of the samples (a) Ag_1, (b) Ag_2 and (c) Ag_3 with
corresponding particle size distribution (PSD). ..................................................................... 112
Fig. 36: Insulator shell (light grey) on conductive Ag nanoparticles (dark grey) defining the
minimum distance between the cores as twice the shell thickness. ....................................... 116
Fig. 37: TEM images of AgNPs prepared by reduction of AgNO3 with ethylene glycol. The
reaction was done starting with 6 g AgNO3. .......................................................................... 121
Fig. 38: TEM images of the AgNPs coated with a silica shell. The average diameters of
AgNPs were 38 nm while the SiO2 shells were about 20 ± 2 nm (a); 17 ± 2 nm (b); 8 ± 1.5
nm (c); 6.6 ± 1.5 nm (d); 3.6 ± 1 nm (e). ............................................................................... 123
Fig. 39: EDX of the naked AgNPs (a) and of the AgNPs coated with SiO2 (b). .................... 123
Fig. 40: UV-vis absorption spectra of AgNPs and of AgNPs coated with a silica shell
recorded in MeOH. A small bathochromic shift is seen with increasing shell thickness. ..... 125
Fig. 41: Hydrodynamic diameter DH determined by DLS of AgNPs before and after
coating with silica shell recorded in EtOH. An increase in particle size is observed with
increasing shell thickness, except for Ag@SiO2 (3.6) the DH-value of which does not match
single particle size. For explanation, see text. ........................................................................ 126
Fig. 42: Permittivity, dielectric loss, and conductivity of AgNPs coated with silica shells of
different thickness as function of frequency. ......................................................................... 127

Table of Contents
ix
Fig. 43: The permittivity and conductivity of AgNPs coated with a 17 ± 2 nm silica shell
and of a silica hydrophobized with a silane reagent. .............................................................. 129
Fig. 44: Wettability test in water/toluene for the Ag@SiO2 (left) and that of hydrophobized
with silane reagent (right). The hydrophobized particles are transferred in organic phase. .. 140
Fig. 45: Solid-state 29Si CP-MAS NMR spectrum of silver nanoparticles coated with silica
shell and surface functionalized with octyl chains showing the chemical shift for the silicon
nucleus of the surface- bound alkyl chains at = 13 ppm. .................................................... 140
Fig. 46: SEM image of Ag@SiO2 (6.6 nm) powder in pressed pellet. The sample was
measured in high vacuum mode using 3 kV and a TLD detector. ......................................... 141
Fig. 47: SEM image of Ag@SiO2 (6.6 nm) powder in pressed pellet. The sample was
measured in low vacuum mode using 7 kV and a LVD detector. .......................................... 141
Fig. 48: SEM image of Ag@SiO2 (6.6 nm) powder in pressed pellet. The sample was
measured in low vacuum mode using 7 kV and a LVD detector. .......................................... 142
Fig. 49a-b: TEM micrographs of AgNPs prepared by reduction of AgNO3 with
ethylene glycol (left) and of their coating with a thin silica shell of about 3.3 nm
(right). .................................................................................................................................... 153
Fig. 50: UV-vis spectra of AgNPs (Δ) and silica-coated Ag@SiO2 core-shell
particles (□) recorded in ethanol. ....................................................................................... 155
Fig. 51: DLS spectra of AgNPs (Δ) and silica-coated Ag@SiO2 core-shell particles
(□) recorded in ethanol. ....................................................................................................... 155
Fig. 52: Wetting test of Ag@SiO2 core-shell particles conducted in toluene/water
mixture before (left) and after (right) surface functionalization with HMDS. ............. 157
Fig. 53a-g: SEM images of the freeze-broken Ag/PDMS nanocomposites of series A
containing 5, 12, 18, 25 vol% and Ag (a-d) and of series B containing 9, 14, and 20

Table of Contents
x
vol% Ag (e-g). Some present agglomerates are shown in the red circles. The scale
bar is 50 m. ......................................................................................................................... 158
Fig. 54: Stress–strain curves of the composites of series A containing different vol%
of Ag and of the neat matrix. The vol% of Ag was determined after the films were
cross-linked by using ICP-OES. ......................................................................................... 159
Fig. 55: Stress-strain curves of the matrix B0, stiffB20, B20, B14, and B9; the
enlargement for the low strains (insert); and photos of B20 in its relaxed and strained
form (bottom) (the scale bar represents 1 cm). ................................................................. 162
Fig. 56: Cyclic stress-strain relaxation curves of B14 at 50% strain (left) and dynamic
mechanical analysis for B20 at different frequencies (right). .......................................... 163
Fig. 57: TGA curves of composites B and of the matrix under helium. ........................ 164
Fig. 58: Permittivity, tan , and conductivity as function of frequency for series A
(left) and series B and the filler (right). ............................................................................. 168
Fig. 59: Specific energy density per volume at a given electric field. ................................... 169
Fig. 60: Size distribution of AgNPs and Ag@SiO2 core-shell. The sizes were determined
through TEM image analysis. ................................................................................................ 177
Fig. 61: XRD spectrum of the AgNPs prepared by polyol synthesis at 130 °C. The typical
cubic silver diffraction was observed. .................................................................................... 178
Fig. 62: TEM micrographs of the Ag@SiO2 produced via upscaling through the addition of
0.6 vol% ethanolic TEOS solution into the reaction mixture................................................. 178
Fig. 63: TEM micrographs of the AgNPs (left) and Ag@SiO2 core-shell particles (right)
and their corresponding EDX spectrum below. ..................................................................... 179
Fig. 64: Elemental analysis of the core-shell particles before and after surface treatment
with HMDS recorded for both batches................................................................................... 179

Table of Contents
xi
Fig. 65: XPS spectra of AgNPs prepared with the polyol synthesis at 130 °C. The peak
indicative for the oxidized silver species is missing. ............................................................. 180
Fig. 66: The mechanical properties of B20 aged at room temperature for 10 days and at 150
°C for 5 days: the cyclic (left) and the stress-strain (right) tests. ........................................... 180
Fig. 67: The strain reloading stress-strain curves after initial strain excursions of 50, 75,
100, all the way up to 450 % for B14. ..................................................................................... 181
Fig. 68: Permittivity as function of filler content of the composite of series A and B. ......... 181
Fig. 69: Breakdown field EB as function of filler content of the composite of series A (red)
and B (black). The averaged values are depicted with error bars and were obtained from
the measurements using the electrodes with an area of 1 mm2. ............................................. 182
Fig. 70: Electrodes used for breakdown strength measurements and the overall set-up of
the system (from left to right)................................................................................................. 182
Fig. 71: The setup used for measuring the dielectric properties. ........................................... 183
Fig. 72: General scheme towards the preparation of PMMA-coated Ag@SiO2 core-shell
particles. ................................................................................................................................. 187
Fig. 73: TEM micrographs of AgNPs (a), Ag@SiO2 (b), APTES-Br (c) and PMMA-coated
Ag@SiO2 core-shell particles (d). .......................................................................................... 192
Fig. 74: UV-vis spectra of AgNPs, Ag@SiO2 and APTES-Br coated Ag@SiO2 core-shell
particles. The spectra were recorded in EtOH. ....................................................................... 193
Fig. 75: DLS spectra of AgNPs, Ag@SiO2, APTES-Br and PMMA-coated Ag@SiO2 core-
shell particles recorded in EtOH. ........................................................................................... 195
Fig. 76: Particle size distribution of AgNPs, Ag@SiO2 core-shell particles and PMMA-
coated Ag@SiO2 core-shell particles obtained from the image analysis of TEM
micrographs. ........................................................................................................................... 196
Table of Contents
xii
Fig. 77: UV-vis spectra of APTES-Br coated Ag@SiO2 core-shell particles and PMMA-
coated Ag@SiO2 core-shell obtained from the aliquots taken after a prescribed amount of
time. The spectra were recorded in THF. ............................................................................... 197
Fig. 78: Water/toluene extraction tests of AgNPs (a), Ag@SiO2 (b), APTES-Br -coated
Ag@SiO2 (c) and PMMA-coated Ag@SiO2 core-shell particles (d). The organic phase is
above the aqueous phase. ....................................................................................................... 198
Fig. 79: Semi-logarithmic plot of the monomer conversion versus the polymerization
reaction time. .......................................................................................................................... 199
Fig. 80: Molecular weight (Mn) of free, sacrificial PMMA obtained from GPC
measurements of aliquots taken after a prescribed amount of reaction time. ........................ 200
Fig. 81: The development of the molecular weight Mn and the polymer dispersity index
(PDI) with time. ...................................................................................................................... 201
Fig. 82: TGA curves of Ag@SiO2, APTES-Br and PMMA-coated Ag@SiO2 core-shell
particles. ................................................................................................................................. 201
Fig. 83: Structure of Span 85 (left) and D4 (right). ................................................................ 213
Fig. 84: TEM Micrographs of the samples 1-8 and the particle size distribution inserted in
the images. .............................................................................................................................. 215
Fig. 85: TEM Micrographs of the samples 7 and 8 and the particle size distribution inserted
in the images. .......................................................................................................................... 216
Fig. 86: DLS spectra of AgNPs (Tab. 16, samples 1-8) which were prepared by reverse
miniemulsions measured in toluene. ...................................................................................... 216
Fig. 87: UV-vis spectra of AgNPs (Tab. 16, samples 1-8) which were prepared by the
inverse miniemulsions technique measured in hexadecane. .................................................. 217
Fig. 88a-d: TEM micrographs and size distribution (inserted) of the different AgNPs. ........ 221
Table of Contents
xiii
Fig. 89: UV-vis spectra of AgNPs of different sizes recorded in EtOH. ............................... 222
Fig. 90: DLS spectra of AgNPs of different sizes recorded in EtOH. ................................... 222
Fig. 91a-d: TEM micrographs of the different Ag@SiO2 core-shell particles. The diameter
of the AgNPs as well as the thickness of the SiO2 shell is mentioned in parenthesis. ........... 223
Fig. 92: UV-vis spectra of Ag@SiO2 core-shell particles (~ 4 nm thick SiO2 shell) of
different core sizes recorded in EtOH. ................................................................................... 224
Fig. 93: DLS spectra of Ag@SiO2 core-shell particles (~ 4 nm thick SiO2 shell) of different
core sizes recorded in EtOH. .................................................................................................. 224
Fig. 94: The permittivity of the Ag@SiO2/PDMS nanocomposites with varying Ag core
and filler content. .................................................................................................................... 229
Fig. 95: The tan values of the Ag@SiO2/PDMS nanocomposites with varying Ag core
and filler content. .................................................................................................................... 229
Tab. 1: Measured properties of few polymer dielectric materials. ............................................. 4
Tab. 2: List of composites and their resulting dielectric properties. ........................................ 30
Tab. 3: List of composites using Ag as filler and their corresponding dielectric properties. ... 50
Tab. 4: Summary of the polyol synthesis of AgNPs in the SFTR. In the parenthesis is
reported the measured standard deviation of the particle population. ...................................... 87
Tab. 5: Percentile Diameters measured with DLS for AgNPs (L1) prepared at 150 °C
running over 4 hours................................................................................................................. 93
Tab. 6: Mean diameter for AgNPs (L1) prepared at 150 °C running over 4 hours. In the
parenthesis is reported the measured standard deviation of the particle population. ............... 93

Table of Contents
xiv
Tab. 7: Summary of the amount of Ag+ and Ag0 of selected samples determined by
XANES spectroscopy (L3-edge or K-edge). The yield is determined by Eq. 1. ...................... 95
Tab. 8: Different batch reactions with constant AgNO3/PVP ratio performed at 150 °C. The
reaction volume was varied for each reaction by a factor of 10. ............................................ 110
Tab. 9: Percentile and mean diameters of the samples Ag_1, Ag_2 and Ag_3. .................... 112
Tab. 10: The amount of reagents used for the coating of AgNPs with different thickness
silica shell. .............................................................................................................................. 119
Tab. 11: The calculated and measured ’ for different silica thicknesses. ............................. 131
Tab. 12: Size and max data of AgNPs and Ag@SiO2 obtained by TEM, DLS and
UV-vis of the core-shell particles before and after the surface treatment with
HMDS. .................................................................................................................................. 156
Tab. 13: The amount of components used for the synthesis of the matrix and of
materials of series A and B. ................................................................................................ 161
Tab. 14: Summary of the densities, permittivity, loss factor, and breakdown field of the
composites of series A and B. ................................................................................................ 167
Tab. 15: Determined size parameters of AgNPs, Ag@SiO2 core-shell particles (before and
after immobilization of APTES-Br) and PMMA-coated Ag@SiO2 core-shell particles. ...... 197
Tab. 16: List of experiments conducted for the preparation of AgNPs via miniemulsions ... 218
Tab. 17: Summary of the size parameters of the different AgNPs and Ag@SiO2 core-shell
particles. ................................................................................................................................. 225
Tab. 18: Composition of the nanocomposites using functionalized Ag@SiO2@Si(CH3)3
core-shell particles as high permittivity filler......................................................................... 226
Tab. 19: Summary of the dielectric properties of the different nanocomposites using
different filler ......................................................................................................................... 230
Table of Contents
xv
Abbreviations
AC Alternating Current Ag Silver AgNCs Silver nanocubes AgNPs Silver nanoparticles AgNRs Silver nanorods AgNWs Silver nanowires Al Aluminum APTMS 3-(Aminopropyl)trimethoxysilane APTES 3-(Aminopropyl)triethoxysilane Ar Argon a.u. Arbitrary units AuNPs Gold nanoparticles BI-XDC Brookhaven Instrument - X-ray disk centrifuge BSED Backscatter Electron Detector CL Cross-linker Cu Copper DBTDL Dibutyltindilaureate DDA Dodecanoic acid DEA Dielectric Elastomer Actuators DEG Dielectric Elastomer Generator DET Dielectric Elastomer Transducer DLS Dynamic Light Scattering DMA Dimethylamine or Dynamic mechanical analysis DMF Dimethylformamide D4 Octamethylcyclotetrasiloxane EAP Electroactive polymer EDX Enery-dispersive X-ray spectroscopy EG Ethylene glycol EtOH Ethanol eV Electron volt GNP Graphene nanoplatelets GPC Gel permeation chromatography GSAS General Structure Analysis Software h Hours hcp Hexagonal close-packed He Helium HMDS Hexamethyldisilazane

Table of Contents
xvi
HPLC High Performance Liquid Chromatography Hz Hertz ICP-OES Inductively Coupled Plasma-Optical Emission Spectroscopy ICP-MS Inductively Coupled Plasma-Mass Spectroscopy J Joules (k)Da (Kilo)Dalton ICSD Inorganic Crystal Structure Database L Litre LCF Linear Combination Fitting LSPR Localized surface plasmon resonance MeOH Methanol (m)g (Milli)gram(s) MHA 16-Mercaptohexadecanoic acid Min Minute(s) (m)M (Milli)molar MMA/PMMA Methyl methacrylate/Poly(methyl methacrylate) Mn Number average molecular weight MNP Metal nanoparticle MPa Megapascal MSA Mercaptosuccinic acid Mw Weight average molecular weight MWCNTs Multiwalled carbon nanotubes N Newton n-C12 Dodecane Ni Nickel nm nanometre NMR Nuclear Magnetic Resonance PAA Poly(acrylic acid) Pa Pascal PANI Polyaniline PDI Polymer (or particle) dispersity index PDMS Polydimethylsiloxane PG Propylene glycol PMDETA Pentamethyldiethylenetriamine ppm Parts per million PTFE Poly(tetrafluoroethylene) PVDF Poly(vinylidene difluoride) PVP Poly(vinyl pyrrolidinone) PSD Particles size distribution

Table of Contents
xvii
Ref. References rpm Rounds per minute RTV Room temperature vulcanization Sn Tin SEM Scannin Electron Microscopy SFTR Segrmented Flow Tubular Reactor SI-ATRP Surface-initiated atom transfer radical polymerization Span 85 Sorbitane trioleate
Tan δ Tangents of the loss angle δ
UV-vis Ultraviolet-visible spectroscopy TEA Triethylamine TEM Transmission Electron Microscopy TEOS Tetraethoxysilane TGA Thermogravimetric analysis THF Tetrahydrofurane TiO2 Titanium dioxide (titania) TPU Thermoplastic polyurethane V Volts VHB (of 3 M) Polyacrylate-based elastomer vol Volume wt Weight XANES X-ray Absorption Near End Spectroscopy XAS X-ray absorption spectroscopy XPS X-ray photoelectron spectroscopy XRD X-ray diffraction

Table of Contents
xviii

1. Introduction
1
Chapter 1: Introduction
1.1 General Overview on Electroactive Polymers (EAPs)
The research community has shown a growing interest in the development of high
dielectric permittivity ( ’) materials due to their multiple application fields in the electrical
industry. They are commonly used for electronic applications such as in capacitors, gate
dielectrics, memories, pulse power energy storage and electroactive materials.1–5 Non-
electronic applications of high ’ materials include their use in biomedical imaging, non-
destructive testing, active vibration control and aerospace.6
One of the fields where high ’ materials find potential application is in the preparation of
Electroactive polymers (EAPs). EAPs are a class of smart materials that have the ability to
change their size and shape through the influence of an electric field. The concept of EAPs
can be traced back to 1880 when Roentgen observed that a film made of natural rubber
could change its shape by applying an electric field across it.7 Since the mid-1990s, the
research on EAPs has been intensified by the scientific community, and novel polymeric
materials featuring large amounts of deformations (also known as actuation) through the
application of external forces have emerged over the years. The high standing of the EAP
research can also be attributed by the fact that, compared to inorganic materials, polymers
are lightweight and can be produced in various shapes at relatively low costs.8 As for now,
applications of EAPs are being considered for loudspeakers, tunable optical elements,9 cell
and tissue engineering,10 robotics11 and prosthetic devices.9,11–16 A more detailed list of
applications for EAPs is reported elsewhere.5,17 The growing demand for EAPs and the
need for interdisciplinary collaborations also led to the creation of the European Scientific
Network for Artificial Muscles (ESNAM) in Europe, an organization consisting of both
academic and industrial researchers.18 Global companies dealing with the development of
EAPs are Artificial Muscle (USA), Danfoss PolyPower Eamex (Denmark/Japan),

1. Introduction
2
Environmental Robots (USA), Optotune (Switzerland), Creganna-Micromuscle (Ireland)
and Strategic Polymer Sciences.19
In general, EAPs can be divided into the two subclasses: Ionic EAPs or electronic
EAPs.19,20 Within the electronic EAPs, dielectric elastomers (DEs) have attracted
significant interest due to their very large strains and high-power applications, which are
properties of interest for the development of high performance actuators.5,8 Compared to
the features of a mammalian skeletal muscle, DEs come close to mimicking their
properties like strain and stress.21 With their proposal as actuators dating back to 1998,
DEAs are electromechanical transducers which can transform electric energy into
mechanical energy.22 The working principles of DEAs will be explained in this paragraph.
A DEA consists of two electrodes separated by a dielectric elastomer film. The actuation in
the electronic EAPs is induced by the application of a voltage difference between the
electrodes (Fig. 1).17 This phenomenon leads to the buildup and accumulation of different
charges on the opposing electrodes thus giving rise to Coulomb attraction between them.
An electrostatic pressure p, also known as Maxwell stress, acts on the sandwiched film and
causes it to be strained in thickness direction sz and expand in-plane due to the
incompressible nature of the elastomer. The electrostatic pressure p acting on the film for a
given voltage U can be calculated using equations Eq. 1 and Eq. 2, where 0 = 8.85 x 10⁻¹²
F∙m-1 is the vacuum permittivity, r is the permittivity or dielectric constant of the material,
Y the Young’s modulus and d is the initial thickness of the elastomer. After switching off
the voltage, the DEA will return to its unstrained state.8
= (Eq. 1)
� = −� (Eq. 2)

1. Introduction
3
Fig. 1: Composition and working principle of DEA. Upon application of a voltage (right side) the film is compressed and elongated thus leading to the conversion of electrical energy into mechanical work.
Apart from generating mechanical motion from electrical energy, the reverse scenario can
be exploited for energy storage. The latter can be produced through the charging of the DE
in the stretched state followed by its gradual relaxation into the original state.23 As a result,
the tensile forces are reduced which leads to the thickening of the elastomer as it is
released from the stretched state. This leads to the compression of like charges while
opposite charges are brought further apart. This phenomenon leads to an increase in the
voltage of the system. Overall, such dielectric elastomer generators (DEG) serve as
capacitors, with some materials demonstrating energy densities as high as 400 mJ/g.24,25
The widely used materials in DEAs and DEGs are silicones (PDMS) and acrylic VHB (of
3 M) due to their ability to undergo large strains during deformation.26 A list of elastomers
that have been used in DEAs or DEGs is shown in Tab. 1.

1. Introduction
4

1. Introduction
5
Despite the good attributes of current DEs, the biggest remaining challenge is the high
driving (electric) field required for the actuation process (10 - 150 V/µm) which hampers
their applications within the proximity of human bodies due to safety issues.17
Eq. 1 illustrates that the film thickness as well as the other material properties such as the
Young’s modulus and the relative permittivity r require optimization in order to enhance
the electromechanical properties of the DEAs. As generally suggested,20,29 the reduction of
d and Y as well as the enhancement of r are necessary to lower the electric fields required
for the actuation.
Conventional film formation techniques include dip coating and casting procedures, which
also enable the formation of complex shapes. For thin films, spin coating is a commonly
used method. Elastomeric films as thin as 1 µm with high uniformity have been prepared
with this technique which effectively leads to the reduction of the driving voltage.27 The
typical film thickness of polymer membranes used for DEAs is around 50 m.30
The Young’s modulus of elastomers can be reduced by reducing the amount of cross-linker
in the system which leads to a lower cross-linking density.31,32 The lower cross-linking
density allows the polymer chains to shear much easier as the chemical bonds between
neighboring polymer chains is decreased. A detailed explanation on the relationship
between the Y and the cross-linking density will be shown in the course of this chapter.
Another solution is the use of plasticizers to soften the material.33 The increase in the
plasticizer content has led to a decrease in Y of the silicone elastomer, while r remained
quasi unaffected by the increasing content of the plasticizer. Further softening of the
material properties to improve the electromechanical properties has been reported for tri-
block copolymers using specific oil as the plasticizer.34
Despite the feasibility of the mentioned strategies to improve the device performance, there
are other obstacles that tend to occur along the way. For example, it is essential to lower
the possibility of defects from occurring in the material.27 Defects within the structure can
propagate through the straining of the material (either during the assembly of the device or

1. Introduction
6
during the actual device performance) thus causing the premature destruction of the
dielectric film.29 This phenomenon manifests itself more strongly in thin films than in
thicker materials and leads to a shorter life-time of the device. As for the reduction of Y,
the method is limited by the fact that a very soft material becomes difficult to process. The
mere increase in plasticizer leads to a reduction of the maximum absolute achievable
strains and therefore the amount of plasticizer has to be adjusted to an optimal level.33 The
main motivation of this project is to enhance the dielectric properties of materials by
exploiting the possibilities of increasing the permittivity r of the material. Additionally,
the materials should feature high degree of flexibility, which should manifest itself in the
capability of the material to undergo large mechanical strains when subjected to external
forces. The basic concepts and strategies towards the preparation of such high performance
materials will be elucidated in the following chapters.
1.2 Basic Principle of Elastomers
Elastomers are amorphous polymers which exhibit a number of useful properties, including
good electrical and thermal insulation as well as good mechanical properties.35 The good
mechanical properties of elastomers manifest itself in their low Young’s modulus Y and
their capability to undergo large mechanical strains through application of mechanical
stress. The Young’s modulus Y is mathematically described by Hooke’s law which states
that the deformation of an elastic material is proportional to the applied stress and hereby
leads to
� = � (Eq. 3)
where σ is the stress that results in the corresponding strain s of the material. For small
strains, the Young’s modulus can also be calculated as Y = σ/s.35

1. Introduction
7
Once released from the applied stress, the elastomer will return to its original
configuration. A typical stress-strain curve is illustrated in Fig. 2. The stress-strain curve of
an elastomer can be divided into three different regions a, b and c, which is typically
observed for elastomers. The elastomer features a “hard” characteristic in the low strain
region a, which manifests itself through the steep slope of the stress-strain curve.
Thereafter, the material softens and the slope of the stress-strain curve decreases as it
enters the region b. As the chains are stretched further, the slope of the curve increases
again and the material undergoes strain-hardening.30
0 250 500 750 10000.0
0.5
1.0
a
Str
ess
(M
Pa
)
Strain (%)
b
c
Fig. 2: Typical stress-strain curve for an elastomer (PDMS).
The elastomer is produced by cross-linking the polymer chains under the formation of a
network. The cross-linking can occur through the physical interaction between segments in
the polymer chains or through the chemical reaction of the polymer chains with cross-
linker molecules which can be regarded as physical netpoints. Physical cross-linking is

1. Introduction
8
found in thermoplastic polymers (e.g. thermoplastic polyurethane (TPU)) while chemical
cross-linking is observed for another group of elastomers which include synthetic and
natural rubbers, polydimethylsiloxane (PDMS, Fig. 3) and polyacrylates.36 For the cross-
linking process, also known as curing or vulcanization, the addition of other ingredients,
including curing agents, activators or accelerators is essential for obtaining the elastomeric
film.35
Fig. 3: Structure of hydroxyl-terminated PDMS.
In the case of PDMS, various methods have been applied to induce the chemical cross-
linking reaction and eventually yield an elastomer. The cross-linking of PDMS has been
achieved through condensation reactions between the hydroxy end-groups of the PDMS
chain and the cross-linker (e.g. tetraethoxysilane (TEOS)) catalyzed by organotin or
organotitanium catalysts e.g. di-n-butyltin dilaureate (DBTDL, Fig. 4).31,37An alternative
approach consists of the cross-linking via hydrosilylation. This method consists of an
addition step involving the reaction of a hydrosilane group (Si-H) with the vinyl moiety in
the presence of platinum catalyst (e.g. Karstedt’s catalyst, Fig. 5). In this case, it is essential
for the PDMS to be equipped with either hydrosilane- or vinyl functional groups. The
advantage of the hydrosilylation is that no side-products are formed unlike the
condensation-based cross-linking where alcohols are produced.38 Additionally, only a very
small material shrinkage is observed with this preparation method during the curing
process.39 The cross-linking by hydrosilylation can be accelerated by UV-activation. As a

1. Introduction
9
result, the cross-linking is accomplished after a few minutes.40 The thiol-ene addition is
another UV-initiated reaction which has been exploited for the cross-linking of PDMS as
the reaction occurs at high yields in a matter of minutes.41–44
Fig. 4: Chemical structure of di-n-butyltin dilaureate DBTDL.37
Fig. 5: Chemical structure of Karstedt’s catalyst.38
From a thermodynamic point of view, the cause of the elasticity in elastomers is the change
in the Helmholtz free energy H of the system during deformation which is given by:
� = � − � (Eq. 4)

1. Introduction
10
Eq. 4 shows that H consists of two contributions: The internal energy U and the entropic
term TdS. The force acting during the deformation is given by the derivative of H over the
deformation length l.
= (Eq. 5)
The deformation of the elastomer leads to an ordering of the polymer chains by causing
their alignment along the direction of the deformation. The elastomeric behavior is
dominated by the entropic contribution in H as the change in entropy is larger than the
change in the internal energy.45 The return of the elastomer into its original state upon
release from external forces is attributed to the system’s objective to maximize its entropy.
The calculation of the entropy change of the system ΔS has been conducted in previous
works and will be briefly summarized in the following paragraph.46–49 The change of the
entropy ΔS of the elastomer system is given as
� = − + − (Eq. 6)
where kB is the Boltzmann constant, N the number of the polymer chains within the
network and the relative change in the length of the elastomer as a result of the
deformation. The deformation of the elastomer by applying an external force induces a
mechanical stress. The mechanical stress σ is defined as the ratio between the applied force
F over a cross sectional area A.

1. Introduction
11
� = (Eq. 7)
The combination of Eq. 6 and Eq. 7 leads to the following expression:
� = − = − (Eq. 8)
Here, the quantity n/V defines the network density γ. The correlation between γ and Y can
be obtained by using the relationship of the shear modulus G with Y given as
� = + (Eq. 9)
where = 0.5 for incompressible materials thus giving rise to Y = 3G. With the expression
kBTγ = G, the expression for Y is given by
� = (Eq. 10)
In an ideal elastomer, the polymer chains are interconnected by cross-linker molecules, and
the mechanical properties can be tuned by the cross-linking density γ and the temperature T
as depicted in Eq. 10. However, the real scenario is much more complex as structural
defects are present within the entire network and are responsible for non-equilibrium
mechanical properties of the network which manifests itself in the viscoelastic behavior of
the elastomer.50 Examples for such structural defects are the presence of dangling and

1. Introduction
12
unattached polymer chains as well as the entanglement of individual polymer chains thus
giving rise to branched structures (Fig. 6). Both the dangling and branching of polymer
chains are responsible for the extremely slow relaxation of the elastomer into its
undeformed state. In the meanwhile, the effect of the unattached chains on the mechanical
properties of the elastomer is more pronounced with increasing molecular weight.50
Fig. 6: Schematic illustration of a real polymer network. The present structural defects are encircled.
In conclusion, the prediction of the mechanical properties of elastomers is quite difficult as
the presence of structural defects have the ability to influence the mechanical properties in
a more or less pronounced way depending on their chemical structure. Therefore,
knowledge on the chemical information of the system is essential in order to find
arguments explaining the obtained mechanical parameters and their potential deviation
from the predicted values observed in ideal elastomers which neglect the influence of
structural defects.

1. Introduction
13
1.3 Dielectric Properties of Materials
Dielectric materials are electrical insulators which can be polarized by an external electric
field. They are generally applied in capacitors which are devices used for energy storage.
In the capacitor, the dielectric material is sandwiched by two opposing conductive plates.
When a capacitor is subjected to an external field by the application of a voltage, opposite
charges are built up in the area covered by the two opposing conductive plates due to the
field-induced polarization and subsequent charge separation within the dielectric. This
phenomenon gives rise to an internal electric field acting in the opposite direction. The
resulting charge density φ which is found in the area A covered by the conductive plates
with opposing charges Q is given by the expression
� = (Eq. 11)
while the external electric field E induced by the applied voltage U is given by
= (Eq. 12)
where d is the distance between the plates. The amount of accumulated charges on the
capacitor plates is proportional to the applied voltage and the capacitance C of the
dielectric material. As a result, C is also detrimental for the total energy Wel stored in the
capacitor device. This gives rise to the two following expressions:
= � (Eq. 13)

1. Introduction
14
= = � (Eq. 14)
The permittivity is a parameter which indicates the ability of a material to store electrical
charge for a given volume.35 The permittivity is a complex number and is given by
= ′ − � ′′ (Eq. 15)
where r’ and r’’ are the real and imaginary parts of the permittivity. In an alternating
electric field, both ’ and ’’ depend on the angular frequency � = � (f being the
ordinary frequency) of the oscillating electric field as the mobility of the charge carriers in
the material responds to changes in the applied electric field.51 As a result, can also be
written as
� = ′ � − � ′′ � (Eq. 16)
The two parts of the complex permittivity i.e. ’ and ’’ can be used to define the
dissipative energy losses of the dielectric system.52 For instance, the tangents of the loss
angle (tan ) can be calculated as
tan = �′′�′ (Eq. 17)

1. Introduction
15
while the dielectric conductivity is given by
� = � ′′ (Eq. 18)
Generally, it is a convention to use tan , ’’ and σ as parameters which describe the
conductive and dissipative energy loss of a material. Therefore, they have to be kept as low
as possible for DEs. The relative permittivity r (or dielectric constant) describes the
change of the electric field within the material compared to vacuum. This property is given
as a dimensionless number and can be obtained from the permittivity by the expression
below.52
= �� = ′ − � ′′ (Eq. 19)
The relative permittivity r is an essential parameter to quantify the ability of materials to
serve as a dielectric in capacitors for energy storage. From this point on, we will simply
refer to r as “permittivity” or dielectric constant.
The relationship between the permittivity and capacitance is given by
= (Eq. 20)

1. Introduction
16
where C0 is the capacitance of the capacitor in vacuum.35 Besides r, the geometry of the
capacitor is important to determine the capacitance. Considering the geometry of a parallel
plate capacitor, the capacitance of the material is given by:
� = � � (Eq. 21)
The performance of dielectric materials is limited by failure mechanisms which can be
classified into the following categories: thermal, mechanical and electric breakdown.53 The
electrical breakdown is a failure mechanism in capacitors which leads to the destruction of
the insulating capability of the material through the resulting formation of conducting
pathways. Each dielectric material features an electrical breakdown strength which is
normally given by the breakdown electric field EB or by the corresponding voltage UB. In
DEAs, the electric breakdown causes the failure of the device prior to reaching the
mechanical limits of the materials. In polymers, the electric breakdown is dependent on
their initial physico-chemical properties as well as on inhomogeneities and defects within
the material which can cause secondary breakdown mechanisms.54 In order to increase the
life-time of devices, the modification and improvement of current materials have been
essential measures undertaken by various research groups. In DEAs, improvements in the
breakdown strength of the devices include the pre-stretching of the actuator films,26,55,56 the
use of self-clearing electrodes29,57 and by exploiting the effects of dielectric oil
encapsulation. 58–60
1.4. Polarization Mechanisms in Molecular Structures
As stated earlier, the external electric field is responsible for the polarization of charges
within the elastomer. The permittivity of a material is dependent on the polarization P of
the material which can be described by the following equation (see next page):51

1. Introduction
17
= − (Eq. 22)
Principally, there are four polarization mechanisms that can be induced within a material
by the application of an electric field. They are known as (1) electronic, (2) atomic, (3)
interfacial, and (4) orientation polarization.35 The first two mechanisms are found in all
materials and involve the displacement of electrons relative to the nucleus of the atoms and
the separation of atomic nuclei from each other, respectively. The third mechanism has to
be taken into account for inhomogenous materials (e.g. polymer blends) while the fourth
mechanism occurs in polar molecules with a permanent dipole moment µ and lead to a net
orientation of the dipole along with the field. Permanent dipoles are present if the
gravitational centers of positive and negative charges do not overlap within a molecule.
The net orientation vanishes again in the absence of the external electric field. The
Polarization P can be given by summing up the dipole moments within a given volume V
as shown by Eq. 23.
= ∑ � (Eq. 23)
The polarizability α of an atom/molecule is the sum over all three polarization
contributions.35
The scalar quantity α of an atom/molecule is directly correlated to the permittivity and is
defined by the Clausius-Mossotti equation as
�� = � −� + �� = � − �� + (Eq. 24)

1. Introduction
18
where N is the number of atoms or molecules per volume. The Clausius-Mossotti can also
be written as a function of the molecular weight Mw and density ρ of the material to obtain
the expression NAα/3 0 which is also known as molar polarization. However, this equation
assumes the dielectric to be perfect, homogenous and isotropic and is only valid for
nonpolar or weakly polar dielectric materials in the absence of permanent dipoles.35,61 In
the case of polar molecules, the effect of orientation polarization has to be considered and
the term becomes
� � + = � −� + (Eq. 25)
where µ is the permanent dipole moment, kB the Boltzmann factor and T the temperature.51
The equation is also well-known as the Debye formula. It has to be noted that the Debye
formula is generally accepted for the treatment of dielectric gases. However, it assumes
that dipoles do not interact and influence each other thus neglecting those shielding effects
also known as internal reaction fields, which is only an accurate approximation for very
dilute systems. The Clausius-Mossotti and Debye formula are based on Lorentz’s treatment
of the problem where he considered a spherical cavity with polarization P in an infinitely
extended media.62 In their theory, the orientation polarization is caused by a local electric
field given as = + � .51 Onsager took the interactions of the dipoles with each
other into account and defined the theory of reaction field where the polarization of the
environment contributes to the enhancement of the permanent dipole moment of a
molecule.63 Considering the same model used by Lorentz, the overall dipole moment m of
the molecule can be described by = + � . The contribution of the orientation
polarization to the dielectric function will be given by (see next page)

1. Introduction
19
� = − ∞ = � (Eq. 26)
where
= �� �∞+��+�∞ (Eq. 27)
The quantity (N/V) defines the density volume of dipoles and Δ is the dielectric
strength/intensity arising from the orientation polarization with = lim → ′ � and ∞ = lim →∞ ′ � .51 The Onsager formula holds for the treatment of non-associating,
polar liquids. However, it fails for associating liquids and a correlation factor g, also
known as the Kirkwood-Fröhlich correlation factor, has to be introduced into the equation
to give
− ∞ = � (Eq. 28)
where
= ⟨∑ ∑ ⟩ = � (Eq. 29)
and µ2 gives the mean square dipole moment of non-interacting, isolated dipoles.64–66
Depending on the orientation of the molecules to each other, g can obtain values below or
above 1. To further simplify the problem, Kirkwood and Fröhlich considered a region with
N* molecules and treated them while considering the remaining N-N* molecules as infinite
continuum with s characterizing their dielectric behavior.51,67

1. Introduction
20
As a result, g can be written as
= ⟨∑ ∑ ⟩<�∗= + (Eq. 30)
A good statistical approximation requires N* to be chosen as high as possible.
1.5. Enhancing the Permittivity of Elastomers
After mentioning potential difficulties and disadvantages associated with the strategies
involving the reduction of the Young’s modulus Y and the film thickness d (Fig. 1), the
increase in the permittivity of the DE is the main guideline in this work in order to enhance
their performance. Although existing elastomers exhibit good mechanical properties, their
permittivity r is rather low and offers room for further improvement (Tab. 1). The
permittivity of the material can be enhanced by undertaking the following strategies:
attaching permanent dipoles onto existing polymer structures
or
dispersing high permittivity fillers into the polymeric matrix
1. Introduction
21
1.5.1 Enhancing the Permittivity through Molecular Dipoles
As indicated by the Debye equation, an increase in the polarizability α and dipole moment
of the compounds forming the DE consists is required in return for an enhancement in the
permittivity. Eventually, this concept has defined the method of grafting polar substituents
with permanent dipoles onto the backbone of existing, low permittivity polymers. Through
the application of an external electric field, the randomly oriented dipoles on the polymer
backbone will tend to align along the field direction. As a result, the polymers will
experience strain and dimensional changes are produced Fig. 7. This feature makes “polar
silicones” suitable materials as membranes for DEAs. Silicones, have been outstanding
candidates for this approach due to their initial asset of having tunable mechanical
properties through chemical modification steps and their ability to undergo chemical
modification. The modifications of the silicone backbone generally requires the presence
of vinyl groups in order to graft substituents which involves Pt-catalyzed hydrosilylation
reactions.68–70 Other modification reactions were conducted with the thiol-ene44 or click
chemistry.71 As shown in Tab. 1, fluorosilicones exhibit higher permittivities than the
unmodified PDMS. The observation of the higher permittivity for fluorosilicones has been
attributed to the asymmetric charge distribution in the molecule due to the high
electronegativity of the fluorine atom.27 Kussmaul et al. reported the successful
introduction of organic dipole molecules into the backbone of silicone (Fig. 8 and Fig.
9).72,73 Effectively, the variation of the dipole content to 13.4 wt% led to an increase in the
permittivity of the elastomers from 3 to 5.λ8, while the Young’s modulus decreased from
1900 to 550 kPa as both the PDMS chain and the dipole molecule compete for the reaction
with the cross-linker. This affected the network density and featured the decrease in the gel
content of the compound.

1. Introduction
22
Fig. 7: Schematic illustration of randomly oriented dipole molecules (left) and their realignment
towards the direction of the applied electric field (right) in a DEA.44
Fig. 8: Polymer network of PDMS with dipoles grafted onto the polymer backbone.

1. Introduction
23
Fig. 9: Dipole molecule with vinyl functionality enabling the grafting onto PDMS.73
Aside from grafting organic dipole molecules, functional groups such as chlorine and
cyanopropyl groups can also serve as dipoles within the PDMS network. Madsen et al.
reported the preparation of alkyl-chlorine siloxane copolymers which featured an increase
in the permittivity compared to PDMS as well as low dielectric losses (< 0.001 at 100
Hz).74 The alkyl-chlorine units are separated by dimethylsiloxane spacer units with
different chain lengths. Despite the variation of the content of chloropropyl side-chains, the
maximum permittivity observed just amounted to 4.7, which is still relatively low
considering the permittivity of the reference PDMS in this study to be at 3.3. In
comparison, the introduction of cyanopropyl groups has led to a larger increase in the
permittivity of silicone. Racles et al. reported the preparation of silicones with tunable
amounts of cyanopropyl side groups.32 This involves the preparation of the functionalized
silicones through three (3) different methods involving cationic and anionic ring opening
as well as copolymerization reactions. The grafting of the cyanopropyl groups onto the
silicone was also conducted with the Pt-catalyzed hydrosylilation reaction as Si-H bonds
are present in both the cycles and polymer backbone. The obtained copolymers with
cyanopropyl functionalities featured an increase in the permittivity from 2.4 to 6.5 by
tuning the number of repeating units equipped with cyanopropyl groups from 0 to 23 % in
relation to the total polymer repeating units. Furthermore, the reduction of the amount of
cross-linker led to the formation of materials with a lower Y compared to commercial
PDMS although the strain at break was lower for the modified material. Further

1. Introduction
24
investigations in this subject provided PDMS modified up to 89 mol% with cyanopropyl
groups exhibiting a permittivity of 15.9 at 10 kHz.69 More recently, Dünki et al. have
achieved the preparation of cyanopropyl-modified silicones by exploiting the thiol-ene
addition reaction. The modified elastomers gave rise to good electromechanical properties
by featuring a high permittivity (~ 10 at 10 kHz), a low Y (0.15 kPa) and a strain at failure
amounting to 260 %.44
1.5.2 Enhancing the Permittivity with the Introduction of High Permittivity
Filler
The other approach is based on the blending of high permittivity materials into a relatively
low permittivity polymeric matrix. The blending of fillers showed significant changes in
the electromechanical properties of the resulting composites. Different theoretical
approaches to calculate the resulting permittivity values of mixtures have been made,
including the volume-fraction average, the Maxwell-Garnett as well as the Bruggemann
model. Those theoretical approaches to estimate the permittivity assumed simplified
geometry and structure within the material in order to obtain models which can predict the
permittivity values for the resulting composites. The effective permittivity eff of the
composite can be calculated by the volume-fraction average approach as
= � + � (Eq. 31)
where 1 and 2 are the permittivities of the matrix and filler and �1 and �2 are the
respective volume fractions of the components. A linear increase in eff with increasing
filler content is described by this model which, however, is not supported by conducted

1. Introduction
25
experiments.75,76 However, the results from the volume-fraction average can still be used as
an upper limit for eff.
The mean-field theory gives rise to more realistic models to describe the resulting
permittivity of a binary mixture. The Maxwell-Garnett equation was obtained from the
Clausius-Mossotti formula where the macroscopic permittivity and the polarizability α
are interconnected.77 This model assumes the scenario of a spherical inclusions being
surrounded by a continuous matrix consisting of polymer. The composite permittivity eff
can be calculated by:
� −�� − � = � � −�� + � (Eq. 32)
However, the Maxwell-Garnett equation only finds validity if the filler fraction approaches
the conditions of infinite dilution � → and multiple interactions between the spherical
inclusions are neglected.78,79 Therefore the Maxwell-Garnett equation gives out values
which could serve as lower limit of the composite permittivity. The Bruggeman model,
which is also based on the mean field theory, describes the composition of the mixture as
repeating unit cells consisting of spherical inclusions surrounded by the polymer matrix. In
other words, the inclusions and their environment are treated symmetrically. The effective
permittivity becomes
� ( � −�� + � ) + � ( � −�� + � ) = (Eq. 33)

1. Introduction
26
The model predicts the sharp increase of eff at a filler content of around 20 vol% and
above which is the region of the percolation threshold which has been mentioned by
various reports dealing with the dispersion of high permittivity filler into a polymeric
matrix.80,81 There are also existing models for the prediction of the composite permittivity
of complex structures.
For three-phase systems (e.g. core-shell type inclusions), Sihvola proposed the calculation
of eff by
� −�� + � = � + � � � −� +� � � −�� � + � +� � � + � (Eq. 34)
where = �� + � . The subscripts 1, 2 and 3 in this equation refer here to the matrix and
the two different filler components, respectively. The formula is useful to treat composites
using fillers with layered compositions such as core-shell particles.
So far, the models for the composite permittivity describe the behavior of spherical fillers.
However, fillers which feature a deviation from the spherical shape lead to a different
behavior in the resulting composite permittivity. Furthermore, their alignment within the
material under the influence of an external electric field also has an impact on the
composite permittivity.82 Overall, reports have shown that non-spherical filler with high
aspect ratio lead to a higher increase in eff compared to the use of spherical inclusions.6
The dispersion of filler into the polymeric matrix also influences the mechanical properties
of the resulting nanocomposites. In most cases, the Young’s modulus Y of the filler
exceeds that of the matrix by orders of magnitude which leads to a deterioration of the
mechanical properties with increasing filler content, although there are a few reports on the
filler-induced increase of the composite permittivity without increasing Y as a result of

1. Introduction
27
using softeners as additives.83,84 The increase in Y is a major drawback of this approach
compared to the chemical modification of polymers with dipole molecules. However,
higher values for eff are feasible, a fact which is the main asset of this method. The
estimation of the resulting Y of a binary mixture can be calculated by adding the two
different moduli according to their volume fraction assuming the arrangement of stacks
between the two components and their equal subjection to the applied force acting in stack
direction.85,86 The resulting composite modulus Yeff can be calculated as
� = � � + − � � (Eq. 35)
where Y1 and Y2 are the Young’s moduli of the matrix and filler, respectively, and �2 is the
volume content of the filler. This equation, however, gives values for Yeff exceeding that of
the actual composite at different filler content and can therefore be regarded as an upper
limit for the calculation of Yeff.86,87 In contrary, the orthogonal mixing rule assumes the
perpendicular arrangement of the assumed stacking formation towards the applied force
and Yeff can be calculated by:
� = �� + −�� (Eq. 36)
The orthogonal mixing rule gives out values corresponding to the lower limit of Yeff with
varying filler content. Further models that provide a more detailed and realistic estimation
of the development of the composite modulus with varying filler content are featured in the
report published by Bigg.88 It was eventually determined that the polymer-filler interaction

1. Introduction
28
is decisive for the determination of the composite tensile strengths. The reinforcement of
the materials through the use of filler is a direct result of a good adhesion of the polymer
matrix to the inorganic filler which can be improved through the chemical modification of
both the filler and the polymer.
Throughout the years, numerous reports on nanocomposites with high permittivities have
emerged. A wide variety of composite materials have been prepared and investigated,
including phthalocyanine/polymer composites,89 ferroelectric ceramic/polymer
composite,90–94 as well as conductive particle/polymer composites.80,95–98 Apart from
PDMS, other polymeric matrices such as epoxy resin and poly(vinylidene
difluoride)(PVDF) (Tab. 2) have been used for the preparation of high permittivity
composites. Epoxy resin is commonly used in high voltage applications as insulating
material and features good electrical and chemical properties as well as chemical
stability.99 PVDF belongs to the class of ferroelectric polymers which exhibit a permanent
electric polarization as a result of their non-centrosymmetric structure. Upon application of
an electric field, the dipoles of PVDF will align along the field direction and can be
maintained even in the absence of the electric field.20,27 The main motivation for the use of
PVDF as polymeric matrix lies in the ability of producing large eff values as a result of the
combination of the high permittivity of both the matrix and the filler.100 However, PVDF is
relatively stiff and is incapable of undergoing large strains as PDMS thus limiting its
possibility of being used for the production of flexible composites.20 Therefore, the use of
PDMS as matrix is attributed to their tunable mechanical properties. Despite the ability to
obtain high permittivity values, the use of certain fillers exhibited some drawbacks in their
application. Phthalocyanines have been praised for their high permittivity values, but
thorough investigations have proven that the large eff values are not a direct result of their
intrinsic features but due to observed proton conductivity in the presence of water.101
Ceramic powders such as BaTiO3 and TiO2 feature permittivity values of 1’700 and 80,
respectively.102 As a result, BaTiO3 is very attractive for the preparation of high
permittivity composites. However, a large amount of ceramic filler is required to reach a
substantial increase in the eff, which eventually leads to a deterioration of the mechanical

1. Introduction
29
properties. By producing composites using ceramic BaTiO3 as filler with a content f ≥ 0.5,
the material becomes increasingly brittle and breaks easily. For instance, a BaTiO3/epoxy
composite using 70 vol% of filler only led to an eff of 60, not particularly high considering
the very high filler loading.90 Even the resulting composites with PVDF only gave
moderate increases in the composite permittivity.103As a result, ceramics are unattractive as
filler for the preparation of films where, apart from the increase of the permittivity, good
mechanical properties such as a high degree of elasticity is desired.92 In particular, the use
of conductive filler seems to have good perspectives. Having an infinite permittivity, they
can lead to a significant enhancement of the resulting composite permittivity. Higher
permittivity values were achieved with the use of conductive filler compared to the values
obtained by using ceramic fillers (Tab. 2).

1. Introduction
30

1. Introduction
31
When using conductive filler, eff increases linearly with the filler content until reaching
the vicinity of the percolation threshold where a dramatic increase of the permittivity is
usually observed. This behavior can be described by the power law given as
q
c
mreff
ff )(
(Eq. 37)
whereby eff and mr are the permittivity of the composite and of the polymer matrix
respectively, fc is the percolation threshold fraction, f is the volume fraction of the filler,
and q is a scaling constant.110 Metal particles,80,91,95,104,105,111–116 metal oxide particles,117
carbon nanotubes (CNTs),107,118 graphene,106,119 and conductive polymers89,96,97 have
already been used as conductive fillers and confirmed their ability to enhance eff
significantly. In particular, metal nanoparticles are interesting due to the feasibility of
preparing them with defined sizes and shapes. A large number of publications on the
synthesis of metal nanoparticles currently exist, which provides us with a large variety of
methods to obtain and use them as high permittivity filler. The preparation of metal
nanoparticles, together with further necessary steps to compatibilize them with the
corresponding matrix, will be illustrated in the following subchapters.
1.6 Synthesis of Metal Nanoparticles
1.6.1 The Mechanisms Towards the Formation of Metal Nanoparticles
In general, nanomaterials are objects that have, depending on their structure, at least one of
their dimensions in the nanometer scale (1-100 nm, Fig. 10). They exhibit an array of
interesting properties which differ from the corresponding bulk properties. While most of
the bulk properties remain constant, the properties of nanomaterials vary with their size,

1. Introduction
32
shape and surface structure.120 Particularly, metal nanoparticles have attracted significant
interest from research groups around the world due to their wide range of application fields
which include electronics,121–123 biomedicine,124–129 catalysis130–133 and photovoltaics.134,135
As a result, the research on the preparation of metal nanoparticles has been intensified over
the last decades, and it has since become an ultimate goal to develop synthesis methods
which feature a control over the size and shape of nanomaterials. The preparation of
nanomaterials can be conducted in the vapor-, liquid and solid-phase.136 The preparation of
nanomaterials can generally be divided into two fundamental approaches: (a) top-down
and (b) bottom-up approach (Fig. 10). While the top-down approach involves the
formation of nanostructures by breaking down large structures, the bottom-up method
deals with the formation of the nanostructures through the assembly of atoms or
molecules.120 Basically, it is very difficult to generate nanoparticles of very small sizes
with controlled shapes with the top-down approach. In contrary, the bottom-up approach is
much more suitable for the size-and shape-controlled preparation of nanoparticles.137
However, there are reported cases where both approaches have been able to produce high
quality particles. For instance, Wang et al. reported the preparation of bismuth colloids
with a size range of 100-600 nm using both approaches. In both cases, the particles were
relatively monodisperse.138 For the bottom-up approach, the formation of nanoparticles
involves the stages of nucleation and growth. The formation of metallic nanoparticles
requires the generation of reduced metal species, which can be generated through the
reduction of metal salts or precursors. The nucleation process is essential for the
preparation of nanoparticles with defined shape. This process involves the initiation of a
discontinuous phase transformation by a metastable system e.g. a supersaturated solution.
The whole process of particle formation involving the nucleation and growth steps is
illustrated in Fig. 11 which is the model described by LaMer.139 In the case of the
preparation of metal nanoparticles via liquid phase chemistry, the supersaturated solution is
generated by the increase in the concentration of metal atoms through the continuous
reduction of their corresponding ionic species (Phase I). Nucleation can occur as soon as a
minimum concentration of metal atoms Cmin is present in the solution (Phase II). Once a
critical concentration of metal atoms has been reached, the atoms will separate out from
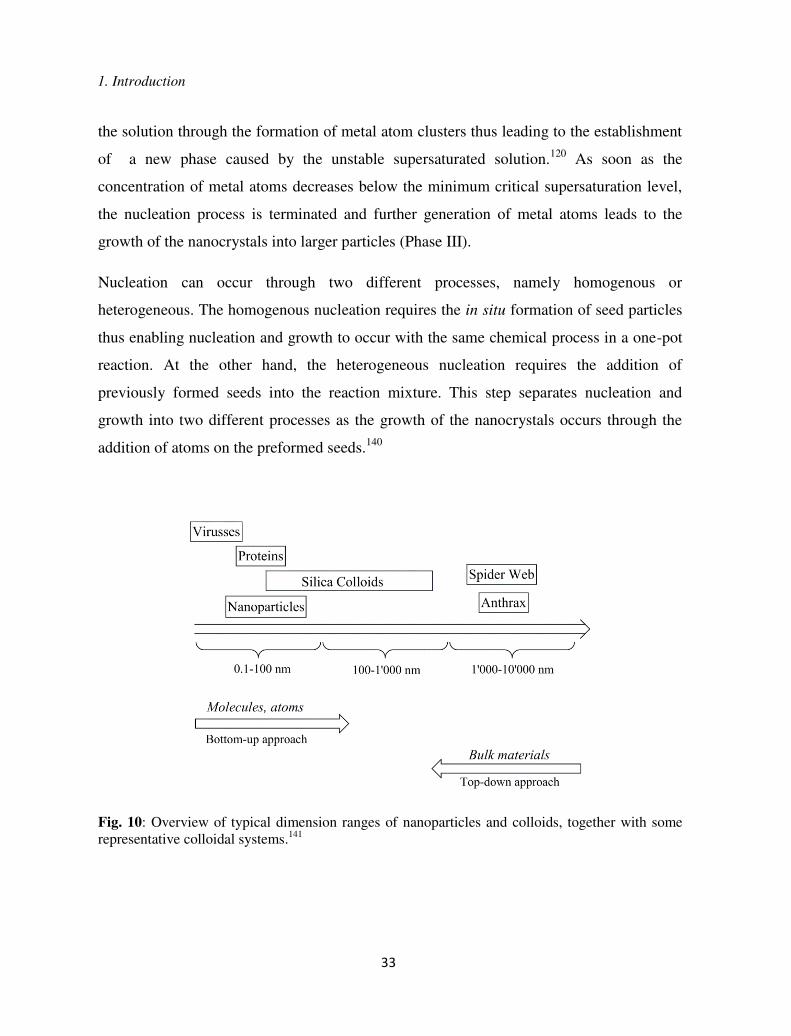
1. Introduction
33
the solution through the formation of metal atom clusters thus leading to the establishment
of a new phase caused by the unstable supersaturated solution.120 As soon as the
concentration of metal atoms decreases below the minimum critical supersaturation level,
the nucleation process is terminated and further generation of metal atoms leads to the
growth of the nanocrystals into larger particles (Phase III).
Nucleation can occur through two different processes, namely homogenous or
heterogeneous. The homogenous nucleation requires the in situ formation of seed particles
thus enabling nucleation and growth to occur with the same chemical process in a one-pot
reaction. At the other hand, the heterogeneous nucleation requires the addition of
previously formed seeds into the reaction mixture. This step separates nucleation and
growth into two different processes as the growth of the nanocrystals occurs through the
addition of atoms on the preformed seeds.140
Fig. 10: Overview of typical dimension ranges of nanoparticles and colloids, together with some representative colloidal systems.141
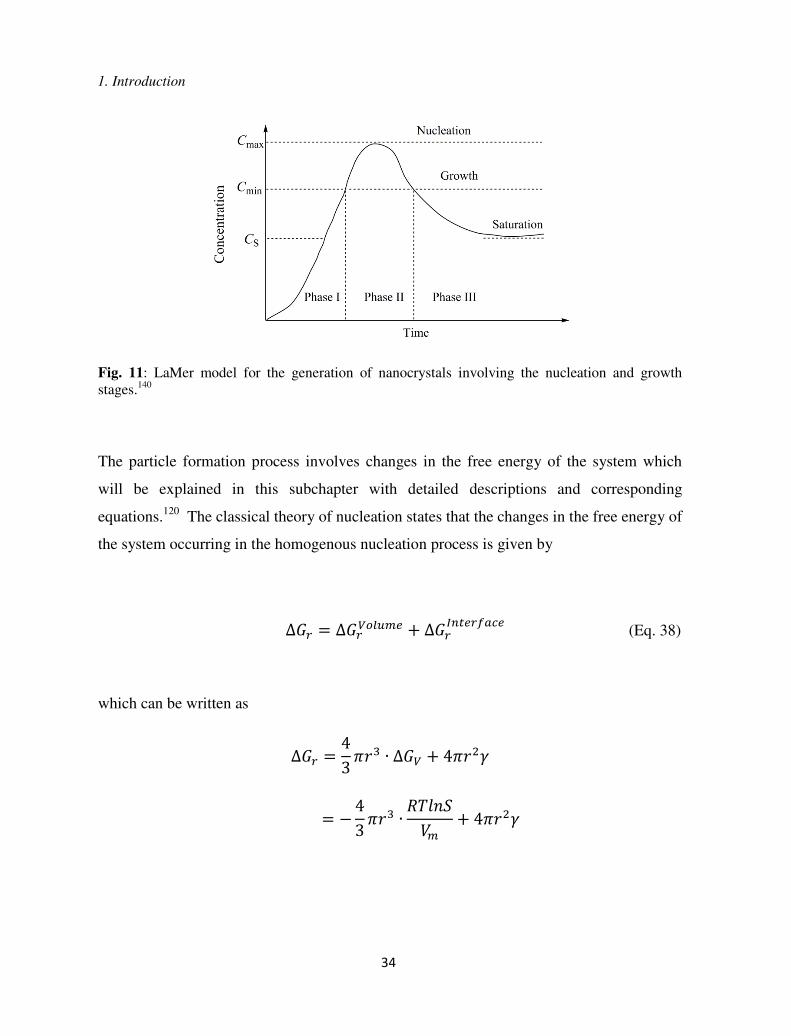
1. Introduction
34
Fig. 11: LaMer model for the generation of nanocrystals involving the nucleation and growth stages.140
The particle formation process involves changes in the free energy of the system which
will be explained in this subchapter with detailed descriptions and corresponding
equations.120 The classical theory of nucleation states that the changes in the free energy of
the system occurring in the homogenous nucleation process is given by
∆ = ∆ + ∆ � (Eq. 38)
which can be written as
∆ = � ∙ ∆ + �
= − � ∙ + �

1. Introduction
35
where ΔGr is the change in free energy per unit volume between atoms in solution and bulk
crystal, γ is the surface free energy per unit area, R is the ideal gas constant, T the reaction
temperature, r the radius of the spherical metal cluster, Vm is the molar volume of bulk
crystal while S stands for the supersaturation ratio which gives the ratio between metal
species in solution to that in the equilibrium saturation at the corresponding temperature.
When S > 1, the solution is supersaturated and leads to negative values for ΔGr. When
plotting ΔGr as a function of the radius r, a minimum within the curve is observed thus
giving rise to two critical parameters, rc and ΔGc. Both parameters can be calculated by the
following equations:
= � (Eq. 39)
∆ = � � Eq. 40)
Metal clusters with a particle radius surpassing the critical radius rc are thermodynamically
stable and can undergo further growth through the continuous reduction of metal atoms.
Basically, Eq. 38 and Eq. 39 show that the supersaturation level S directly influences rc. A
high value for S would lead to a decrease in rc, which would facilitate the nucleation
process as the reduction in rc would enable small clusters to survive and experience further
growth rather than undergoing dissolution. The surface energy γ can also be reduced
through the attachment of surfactants or ligands in order to reduce rc. A small rc is essential
for the preparation of monodisperse particles which also requires the clear separation of the
nucleation and growth processes (Fig. 12). This requires the acceleration of the nucleation
rate which can be conducted by reducing rc, subsequently leading to a reduction in ΔGc, and
a high supersaturation ratio S.

1. Introduction
36
By upholding these conditions, the nucleation rate J is enhanced which is given by:
� = � ∙ exp − ∆ Eq. 41)
Fig. 12: LaMer model for the generation of nanocrystals involving the nucleation and growth stages. The product quality depending on the nucleation time is also depicted in the image.140
Apart from ΔGc, a high temperature T can also lead to an enhancement in the nucleation
rate. Another method of initiating a rapid nucleation is through the application of the hot-
injection method. The injection of the precursors into a hot solution induces a nucleation
burst which leads to the growth of monodisperse nanocrystals. In comparison, the particles
obtained from the slow addition of the precursor solution yielded a high polydispersity.142
This method is commonly used for the preparation of semiconductor quantum dots.143,144
To summarize, the particle quality depends on the ability to control the nucleation and
growth phases. By reducing the nucleation time, both processes can be separated from each

1. Introduction
37
other. This can be achieved by manipulating reaction parameters and by the variation of
the preparation method.
1.6.2 Preparation of Metal Nanoparticles: The Case of Silver
Metal nanoparticle dispersions consisting of gold, silver or copper feature intensive colors
which vary with the corresponding size of the particles. As a matter of fact, these metal
nanoparticles are known to undergo strong and specific interactions with the
electromagnetic radiation when the particle size is much smaller than the wavelength of
the incident light.145,146 This manifests itself in the observation of an intense and broad
band absorption in the corresponding UV-vis spectra of the particle solution. The
absorption band is referred to as surface plasmon resonance (SPR) which features the
oscillation of the free conduction electrons under the generation of a dipole within the
particle as a result of the interaction with the incident light (Fig. 13).146 The discovery of
SPR dates back to the 19th century which was documented by Michael Faraday.147 When
the frequency of the incident light corresponds to the frequency of the oscillation of the
electrons, the resonance condition is satisfied and gives rise to the localized surface
plasmon resonance (LSPR).
Plasmonics have attracted the attention of research groups working on photovoltaics due to
their ability to improve the performance of photovoltaic devices which includes the
enhancement in absorption and the potential of reducing the physical thickness of solar
photovoltaic absorbers layers.134 Quite recently, plasmonic polymer solar cells using metal
nanoparticles achieved a power efficiency of 8.92 % and an external quantum efficiency of
81.5 %, which were the highest values obtained for such devices at that time.148

1. Introduction
38
Fig. 13: Schematic illustration of surface plasmon resonance (SPR). The free conduction electrons in the metal nanoparticles undergo oscillation as a result of the strong interaction with the incident light.146
There is no doubt that the potential of metal nanoparticles as an essential component in
photovoltaics contributed immensely to the current research activity on metal nanoparticle
preparation. In particular, silver exhibits the greatest band intensity.145 Additionally, the
cost of silver is cheaper than most of the other metals considered for plasmonic
applications. The cost of silver amounts to ~ US$ 472.6 per kilogram, which is much lower
compared to the price of gold or platinum (US$ 33’506 and US$ 42’570 per kilogram,
respectively). Although aluminum is a cheaper alternative to silver, it features certain
drawbacks such as few feasible nanostructures as well as the susceptibility to surface
oxidation thus requiring surface passivation for stabilization.149 Apart from photovoltaics,
silver nanostructures can also be used in other fields such as electronics,80,115,150
biomedicine124–126 and photocatalysis.133,151,152
The preparation of silver nanostructures can be divided into the two following categories:
(a) conventional and (b) unconventional methods.145 The conventional method refers to the
chemical synthesis of silver nanostructures, while the unconventional method is composed
of a variety of preparation ways such as laser ablation, radiolysis, biosynthesis as well as
vacuum evaporation. The following subchapter will only focus on a few methods involving
1. Introduction
39
the chemical synthesis of the silver nanostructures. The main route consists of the chemical
reduction of silver salts such as AgNO3,153–155 Ag(OAc),156 AgClO4
157,158 or AgCO2CF3159
into their metallic form.
1.6.2.1 Preparation of Silver Nanoparticles with Inorganic Reducing Agents
Favored by its high reactivity and low toxicity, sodium boron hydride (NaBH4) is
commonly used as reducing agent in Organic Chemistry. The first synthesis of AgNPs
using sodium boron hydride was reported by Creighton and coworkers160 which gave
particles in the size range of 1-10 nm. Compared to other methods, this method can only
give small particles as a result of the strong reducing power of the boron hydride.161
Hydrazine (N2H4) has also been used to generate AgNPs through the reduction of AgNO3.
The reaction is conducted at room temperature using water as reaction medium. A basic
pH (~ 11) is required for obtaining a stable solution. Particle sizes between 10-50 nm are
feasible with this method, but it is difficult to control the size polydispersity.162 Another
drawback is the toxic nature of hydrazine, making future industrial applications of this
method very unlikely.
1.6.2.2 Preparation of Silver Nanoparticles with Organic Reducing Agents
N,N-dimethylformamide (DMF) is well known for its high synthetic value due to its wide
liquid temperature range, chemical and thermal stability (boiling point at 153 °C), high
polarity and wide solubility range for organic and inorganic compounds.163 It has
previously been reported that DMF can act as a powerful reductant to gold and silver
salts.155,164 The first synthesis of AgNPs using DMF was pioneered by the group of Liz-
Marzan in 1999.155 It was shown that Ag+ ions can be reduced at room temperature, with
the possibility of increasing the reduction rate at higher temperature. Carbamic acid is
formed during the course upon reduction of the silver ions to metallic silver, which can

1. Introduction
40
further decompose to carbon dioxide and dimethylamine at elevated temperatures (Fig.
14). The use of capping agents ought to ensure the long term stability of the silver
dispersion. So far, stabilizers in form of 3-(aminopropyl)trimethoxysilane (APTMS),
poly(vinyl pyrrolidinone), tetrabutoxytitanate and macrocyclic thiols have been
employed.165–167 With this method, the synthesis of nanoparticles with a size range of 5-30
nm has been reported.
Fig. 14: Proposed reaction mechanism for the preparation of AgNPs with DMF.155
The Tollens reaction, or silver mirror reaction, is famous for the chemical deposition of
silver mirrors on various substrates as well as a suitable method to detect aldehydes.149,168
This method can also be applied for the synthesis of AgNPs.158,169 The advantage in this
method lies in the mild preparative conditions as AgNPs are prepared at room temperature.
Performed in aqueous medium, silver salts form the Tollens reagents, Ag(NH3)2OH, which
is reduced by the sugar RCHO (Fig. 15).169 With this method, nanoparticle sizes ranging
from 20-100 nm have been prepared so far.158,170 Despite the limited shape control
associated with this method,158,171 the use of triazole sugar ligands have featured improved
control over the reaction with enhanced size and shape control.172
Fig. 15: Proposed reaction mechanism for the preparation of AgNPs with the Tollens reaction.149

1. Introduction
41
In 2007, Hsu and coworkers reported the reduction of AgNO3 with formaldehyde (CH2O).
In this method, organic bases such as triethylamine (TEA) and pyridine were used as
reaction promoter.173 The mechanism is shown in Fig. 16. While using TEA in the reaction
afforded particle sizes between 20-30 nm, the particle sizes obtained with pyridine were
smaller (10-20 nm) which can be explained by the weaker basicity of pyridine thus slowing
down the reduction rate. High pH values favor the aggregation of primary particles which
lead to the formation of larger particles. This effect was observed by Liu and coworkers as
they succeeded in varying the particle size between 40-2’000 nm by adjusting the reaction
conditions, including the pH, the reaction temperature as well as the amount of
stabilizer.174
Fig. 16: Proposed reaction mechanism for the preparation of AgNPs through the reduction with
formaldehyde.175
The citrate synthesis, also known as Turkevich method, is a popular method to generate
silver nanoparticles (AgNPs) and is still very commonly used due to its facile preparation
manner. Back in 1951, Turkevich succeeded in preparing gold nanoparticles (AuNPs)
through the reduction of chloroauric acid with sodium citrate in a boiling aqueous solution
(Fig. 17).176 The citrate ions simultaneously act as stabilizer and reducing agent. Since
then, the method has also been extended to the preparation of AgNPs.177 The outcome of
the process mainly depends on the pH value of the solution since the reduction rate and the
particle shape are influenced by this parameter. While high pH values favor the preparation
of spherical and rod-like particles, low pH values lead to the formation of anisotropic
shapes such as triangle and polygons.145,178 The formation of anisotropic nanowire

1. Introduction
42
structures has also been achieved with this method.179 Overall, this method does not
establish a defined control over the particle size and shape which effectively leads to the
production of polydisperse particles (20-600 nm) with diverse shapes in a single batch
reaction.149 Another disadvantage of this method is the use of high amounts of water which
makes the scale-up of the reaction a rather difficult task.180
Fig. 17: Proposed reaction mechanism for the preparation of AgNPs with the Turkevich method.179
Although a variety of methods for the preparation of AgNPs has been presented, most of
the reactions suffer from drawbacks including toxicity, limited size and shape control and
feasibility as well as high dilution conditions, with the latter causing problems for the
upscaling of the synthesis. However, those limitations can be circumvented through the use
of the polyol synthesis.
The polyol synthesis represents a very versatile way of generating silver nanostructures
with varying sizes and morphologies.181,182 Extensive work on the polyol synthesis of
silver nanostructures was conducted by the research group of Xia.181,182 The control over
nucleation and growth process, which is crucial for the determination of quality and
morphology of the resulting particles, can be achieved through varying reaction conditions
such as temperature and concentration of reagents as well as the addition of additives and
trace metal impurities.153,181–183 The type of seeds (formed from the growth of nuclei)
present in the reaction mixture direct the future structure and morphology of the particles.
The three different seeds structures which can grow into distinct morphologies of the silver
nanostructures are classified as single crystal, singly- and multiply twinned seeds.181 In this
process, a polyol (e.g. ethylene glycol (EG), propylene glycol (PG)) serves both as solvent
and reductant while polymers such as poly(vinyl pyrrolidinone) (PVP),142,159,184,185
polyacrylamide186 or polyacrylic acid (PAA)187 act as stabilizing agent. The stabilizers can

1. Introduction
43
also direct the morphology of the nanostructures through preferential binding onto certain
crystal facets. For instance, PVP is believed to undergo preferential binding to the {110}
and {100} planes through the coordination of its carbonyl group onto the metal surface.140
When the {111} planes are completely bounded by PVP, the deposition of metal atoms
occurs on the {100} which leads to the formation of octahedrons. Considering the reverse
scenario, the deposition will occur on the {111} site thus leading to the formation of
nanocubes.188 At elevated temperatures, glycoaldehyde, which is the actual reductant of the
Ag+ ions, is formed in the presence of oxygen (Fig. 18). The amount of glycoaldehyde is
increased with increasing temperature thus affecting reduction kinetics.189
Fig. 18: Proposed reaction mechanism for the preparation of AgNPs by the polyol process.149
So far, this method is regarded as the most convenient way of preparing different types of
silver nanostructures. In summary, the polyol synthesis exhibits the possibility to control
the size and shape of the particles through the careful variation of the reaction conditions
(Fig. 19).142,182,190 Furthermore, it has also demonstrated the potential of upscaling the
reaction by using continuous production methods.191,192 As a direct result, the polyol
synthesis is quite attractive to prepare large amounts of silver nanostructures, a feature
which makes this method stand out from the other methods.

1. Introduction
44
Fig. 19: TEM micrographs of different silver nanostructures: (a) Silver nanocubes (AgNCs), (b) silver nanowires (AgNWs) and (c) silver nanoparticles (AgNPs).
1.7 Surface Functionalization of Metal Nanoparticles
The surface functionalization of metal nanoparticles is often required to provide stability as
well as compatibility of the resulting particles towards different media. In the case of the
use of metal nanoparticles as conductive fillers for high permittivity materials, surface
functionalization is essential due to the increasing dielectric loss and electrical conductivity
at fc where the insulator-conductor transition occurs thus diminishing the filler’s prospect
of being used for the preparation of high performance materials in spite of their high
permittivities.80,81,104,193,194 At filler contents approaching fc, the possibility of agglomerated
particles forming a percolation pathways increases thus leading to electric shortcuts (Fig.
20).
Fig. 20: Agglomeration of conductive particles within the polymeric matrix leading to percolation pathways (left) and insulated particles without agglomeration (right).96

1. Introduction
45
In order to overcome these limitations and prevent electric shortcuts from occurring, the
insulation of the particles prior to their dispersion into the matrix has become a common
method to avoid electric breakdown due to agglomerated particles. For instance, Ni, Cu,
and Al can undergo self-passivation in air which leads to the growth of an oxide shell on
the surface.195–197 For noble metals, this process does not occur under ambient conditions
due to their high reduction potential.198 Therefore, additional materials need to serve as
surface coating. In the case of AuNPs and AgNPs, it is possible to coat them with silica
(SiO2) with controllable shell thickness by using a modified Stöber method.170,199–203 Back
in 1968, Stöber and coworkers reported the preparation of monodisperse SiO2 colloids with
varying sizes through the hydrolysis of tetraethoxysilane (TEOS) which was catalyzed by
ammonia.204 Silica colloids prepared with this method are depicted in Fig. 21.
Fig. 21: Silica nanoparticles prepared with the Stöber method.204
Further research conducted over the years enabled this method to be extended to the
coating of colloids and particles. For example, the main motivation to coat noble metal
nanoparticles with SiO2, in particular Ag and Au, is the control over their plasmonic
properties by stabilizing the dielectric environment of the metal core and by controlling the
interparticle distance through the silica shell thickness.205–207 The SiO2 shell also allows the
deposition of other molecular structures such as quantum dots, dyes and
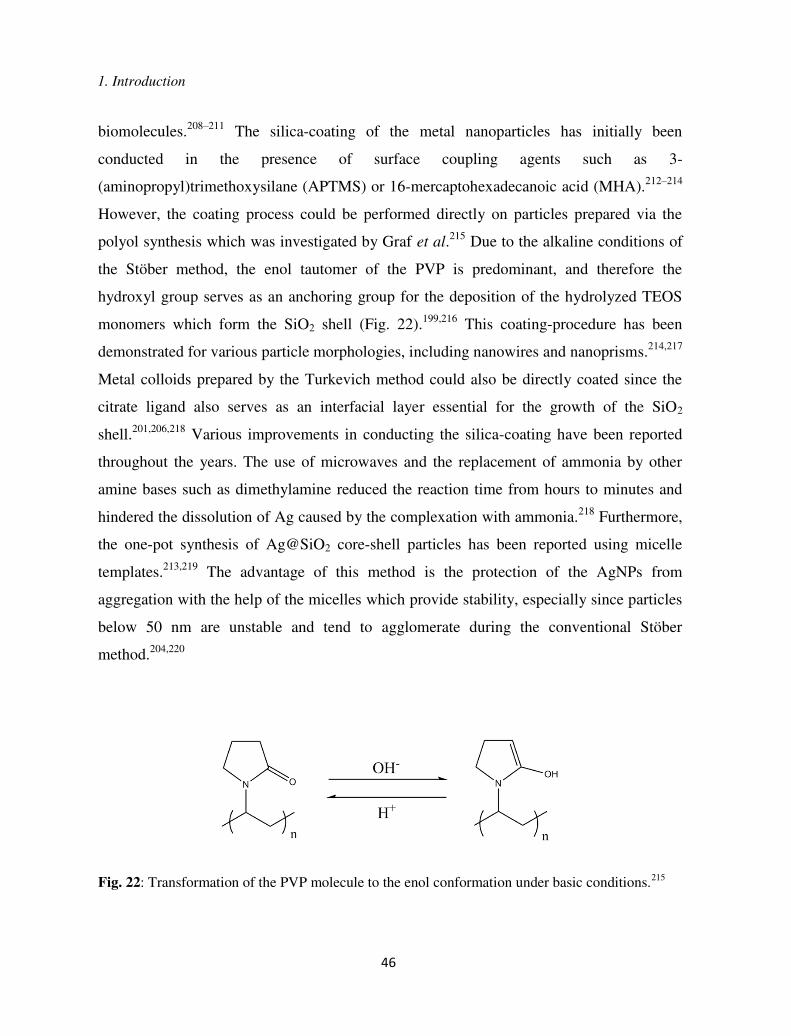
1. Introduction
46
biomolecules.208–211 The silica-coating of the metal nanoparticles has initially been
conducted in the presence of surface coupling agents such as 3-
(aminopropyl)trimethoxysilane (APTMS) or 16-mercaptohexadecanoic acid (MHA).212–214
However, the coating process could be performed directly on particles prepared via the
polyol synthesis which was investigated by Graf et al.215 Due to the alkaline conditions of
the Stöber method, the enol tautomer of the PVP is predominant, and therefore the
hydroxyl group serves as an anchoring group for the deposition of the hydrolyzed TEOS
monomers which form the SiO2 shell (Fig. 22).199,216 This coating-procedure has been
demonstrated for various particle morphologies, including nanowires and nanoprisms.214,217
Metal colloids prepared by the Turkevich method could also be directly coated since the
citrate ligand also serves as an interfacial layer essential for the growth of the SiO2
shell.201,206,218 Various improvements in conducting the silica-coating have been reported
throughout the years. The use of microwaves and the replacement of ammonia by other
amine bases such as dimethylamine reduced the reaction time from hours to minutes and
hindered the dissolution of Ag caused by the complexation with ammonia.218 Furthermore,
the one-pot synthesis of Ag@SiO2 core-shell particles has been reported using micelle
templates.213,219 The advantage of this method is the protection of the AgNPs from
aggregation with the help of the micelles which provide stability, especially since particles
below 50 nm are unstable and tend to agglomerate during the conventional Stöber
method.204,220
Fig. 22: Transformation of the PVP molecule to the enol conformation under basic conditions.215

1. Introduction
47
Aside from silica, various other inorganic materials have also been used to coat metal
colloids. The preparation of core-shell particles with titania (TiO2) has also been a hot
topic in the research community due to the possibility of combining the properties of the
two moieties. TiO2 is very attractive due to its chemical and thermal stability as well as its
excellent electronic, optical and photocatalytic activity.221–223 Although numerous efforts
on the preparation of Ag@TiO2 core-shell particles exist,151,202,224–227 the obtained TiO2
shells do not feature a well-defined uniformity and some of the reported synthesis routes
are difficult to reproduce. While the Stöber method is used for the silica-coating, there are
few existing reports on the preparation of TiO2 shells using this method.228 In one of the
few reports on the titania-coating with the Stöber method, the TiO2 shells are produced
through the hydrolysis and condensation of tetrabutyltitanate which was realized on the
surface of Fe2O3 particles. In comparison to the silica-coating, the preparation of TiO2
shells is quite difficult as the reaction kinetics of the hydrolysis/condensation of the titania
precursor has to be controlled carefully in order to obtain core-shell structures with
uniform TiO2 shells.228
Other inorganic insulating shells which have also been demonstrated on metal cores
include Al2O3, Fe3O4, Ni(OH)2, MnO, Eu2O3, CdS, ZnS, ZnO and ZrO2.112,226,229–231
While the insulation of metal nanoparticles has usually been achieved with inorganic
materials, organic-based shell materials have also been successful in providing metal
nanoparticles with an insulating layer. Shen and coworkers successfully insulated silver
nanoparticles (AgNPs) with an organic shell and the produced Ag@C core-shell particles
also featured a further advantage through the enhanced dispersibility in organic polymers.
As a result, the organic shell facilitated the dispersion of the particles in order to form a
homogenous composite. In direct comparison, surface treatment is generally required in
order to enhance the compatibility of the core-shell particles with the matrix which is
usually hydrophobic (e.g. PDMS). The shells could be tuned from 4-6 nm up to 8-10 nm.
Qi and coworkers have used mercaptosuccinic acid (MSA) and dodecanoic acid (DDA) as
a surfactant solution to prepare AgNPs which could be readily dispersed in epoxy in and

1. Introduction
48
form composites. Other routes to equip metal nanoparticles with a surrounding organic
shell include the preparation of polymer-coated metal nanoparticles either through the
grafting of the polymers onto the surface or by conducting a surface-initiated
polymerization. The organic shell could be tuned from 2-50 nm although some of the
reported polymer shells are hydrophilic in nature and therefore do not facilitate the
dispersion in hydrophobic media.232–238 Further treatment such as the cross-linking of the
polymer chains dangling around the particles can provide additional stability to the
particles towards agglomeration, especially at high temperatures where polymer desorption
from the surface can occur.239
1.8 Current State of Functionalized Metals/Polymer Nanocomposites
Metal fillers allowed a large increase in the permittivity eff of the resulting composites
with different polymer matrices (Tab. 2). As mentioned, metals such as Cu and Al obtain
an insulating layer through self-passivation which disables the formation of a percolation
pathway, even at high filler content. The passivating oxide layers are relatively thin and
therefore the dispersion of the filler still leads to large permittivity values for the resulting
composite.197 However, the passivation does not seem to be a controlled reaction, and it is
unclear whether further oxidation can occur with time which leads to the increase in the
insulating layer. As a result, noble metal nanoparticles provide a better control which
enables the precise control over the insulating shell surrounding them. In addition, noble
metals offer the possibility of preparing different nanostructures, which can also be
attractive for the investigation of the effects of the morphology on the composite
properties. Silver nanostructures have already been used as filler for the preparation of high
permittivity composites and gave high permittivity values upon reaching the percolation
threshold. In the previous works involving the use of Ag as high permittivity filler, the
main motivation for the preparation of the composites was their potential use as
dielectrics/capacitors.1,80,114,240 The particles were insulated with various materials,
including SiO2, Al2O3 and carbonaceous shells as stated in the previous subchapter.

1. Introduction
49
Additional to the high permittivity values of the composites attributed to the use of Ag, the
insulation of the particles also led to tan values as low as 0.02 (Tab. 3). While thinner
shells provided higher permittivities, the thicker shells led to an increase in the breakdown
field EB of the resulting composites.81 Ag was also used in the preparation of multiple-
phase composites in order to yield a further increase in the permittivity eff of the
composite. This was observed by the addition of Ag@SiO2 core-shell particles unto a
BaTiO3/PVDF composite as the permittivity increased by more than 20 times in the
presence of 20 vol% of the core-shell particles.150
The previous works involving the use of AgNPs as filler demonstrate the preparation of
high permittivity composites and are an inspiration for further investigations on the
potential of Ag particles as high permittivity filler.
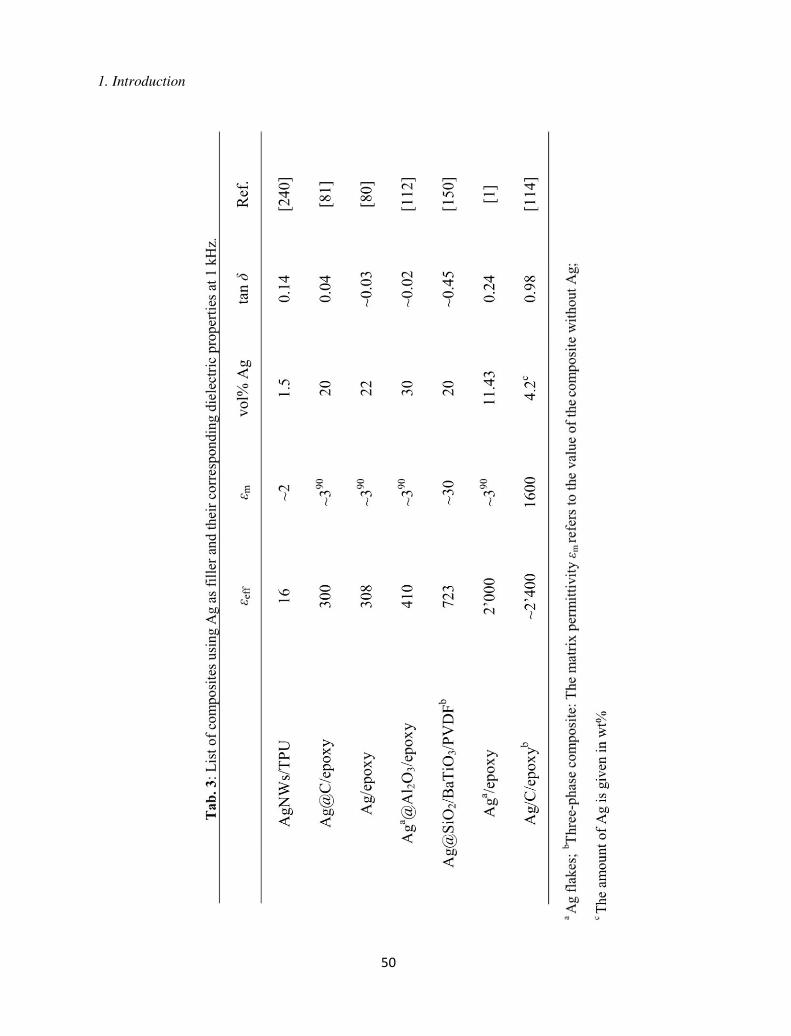
1. Introduction
50
1. Introduction
51
1.9 Goals of the Thesis
The goal of this project is to provide a model system for the preparation of silicone
elastomer composites blended with functionalized AgNPs as fillers with potential use in
actuators and generators. Tab. 3 shows a number of composites where Ag is used as filler,
but a number of them do not feature a control over the particles size, morphology and
surface properties. Furthermore, the reported nanocomposites generally neglect the
corresponding mechanical properties. This work will try to address the mentioned issues,
and therefore each step towards the preparation of the nanocomposites will be subjected to
investigations. The initial part of this project consists of the preparation and
functionalization of AgNPs. Since the preparation of nanocomposites requires substantial
amounts of filler, a reliable method to prepare AgNPs in high amounts with control over
size and shape will also be sought. The purpose of the surface functionalization of the
AgNPs is to provide them with an insulating layer followed by the hydrophobization of the
surface in order to enhance compatibility with PDMS, the latter being chosen as the
polymeric matrix material due to the possibility of obtaining flexible materials with it. The
insulating shell can be both of inorganic and organic nature. After the functionalization of
the particles, they will be used as filler in order to prepare nanocomposites with enhanced
dielectric and mechanical properties. The preparation of the nanocomposites and
subsequent film-formation will be conducted with the doctor blade method to yield thin
elastic films (< 200 µm). Thereafter, the dielectric and mechanical properties of the
resulting nanocomposites will be investigated by conducting mechanical tensile tests and
by analyzing the dielectric properties via impedance spectroscopy in the range of 1-105 Hz.
1.10 Structure of the Thesis
Chapter 2 illustrates the attempts of preparing AgNPs of different sizes in a continuous
fashion with the use of the Segmented Flow Tubular Reactor (SFTR) as an alternative

1. Introduction
52
route to the conventional preparation of AgNPs with batch reactions which has also been
used in this work. The goal is to develop a reliable and reproducible method to prepare
AgNPs in large amounts with a good control over the product quality (particle size,
morphology, particle size distribution).
Chapter 3 deals with the investigation of the effects of the insulating silica (SiO2) shell
thickness on the resulting permittivity of the core-shell particles.
Chapter 4 shows the use of Ag@SiO2 core-shell particles (hydrophobized through the
surface treatment with alkyl silanes) as filler for the preparation of nanocomposites with
PDMS. The investigation of the dielectric and mechanical properties of the resulting
nanocomposites is the key topic of this chapter, and steps towards the optimization of the
nanocomposite properties are featured.
Another alternative for the hydrophobization of the Ag@SiO2 core-shell particles is shown
in Chapter 5. Here, the Ag@SiO2 core-shell particles are subjected to the surface-initiated
atom transfer radical polymerization (SI-ATRP) which provides the possibility of
conducting polymerizations on the particle surface. By polymerizing monomers such as
methyl methacrylate (MMA), the particle surface is rendered hydrophobic and allows their
redispersion in organic, non-polar solvents which would enhance their compatibility with
hydrophobic media.
The chapters were originally written as manuscripts for peer-reviewed journals, and
therefore certain texts and references might be repeated in the process. While Chapters 2, 3
and 4 have already been accepted for publication (J. Phys. Chem. C 2014, 118, 11093-
11103, RSC Adv. 2013, 3, 6964-6971 and J. Mater. Chem. A 2015, 3, 14675-14685),
Chapter 5 is still outstanding. The appendix exhibits additional results, including the
synthesis of AgNPs through the inverse miniemulsions technique as well as the dielectric
properties of nanocomposites using different sizes of AgNPs (with constant SiO2 shell
thickness). They are placed in the appendix as they were either aborted projects or do not
give results substantial for publications. The arrangement of the chapters is mainly based
1. Introduction
53
on the steps towards the preparation of the nanocomposites and do not necessarily
correspond to the chronological order of events.
1.11 References
(1) Rao, Y.; Wong, C. P. Novel Ultra-High Dielectric Constant Polymer Based Composite Development for Embedded Capacitor Application. 4th Electron. Packag. Technol. Conf. 2002. 2002, 65–69.
(2) Wilk, G. D.; Wallace, R. M.; Anthony, J. M. High-Κ Gate Dielectrics: Current Status and Materials Properties Considerations. J. Appl. Phys. 2001, 89, 5243–5275.
(3) Kingon, A. I.; Maria, J.; Streiffer, S. K. Alternative Dielectrics to Silicone Dioxide for Memory and Logic Devices. Nature 2000, 406, 1032–1038.
(4) Barber, P.; Balasubramanian, S.; Anguchamy, Y.; Gong, S.; Wibowo, A.; Gao, H.; Ploehn, H. J.; zur Loye, H.-C. Polymer Composite and Nanocomposite Dielectric Materials for Pulse Power Energy Storage. Materials (Basel) 2009, 2, 1697–1733.
(5) Pelrine, R.; Sommer-Larsen, P.; Kornbluh, R.; Heydt, R.; Kofod, G.; Pei, Q.; Gravesen, P. Applications of Dielectric Elastomer Actuators. Proc. SPIE 2001, 4329, 335–349.
(6) Dang, Z.-M.; Yuan, J.-K.; Zha, J.-W.; Zhou, T.; Li, S.-T.; Hu, G.-H. Fundamentals, Processes and Applications of High-Permittivity Polymer–matrix Composites. Prog. Mater. Sci. 2012, 57, 660–723.
(7) Röntgen, W. C. Ueber Die Durch Elektricität Bewirkten Form-Und Volumenänderungen von Dielektrischen Körpern. Ann. Phys. 1880, 247, 771–786.
(8) Pelrine, R.; Kornbluh, R.; Kofod, G. High-Strain Actuator Materials Based on Dielectric Elastomers. Adv. Mater. 2000, 12, 1223–1225.
(9) Keplinger, C.; Kaltenbrunner, M.; Arnold, N.; Bauer, S. Rontgen’s Electrode-Free Elastomer Actuators without Electromechanical Pull-in Instability. Proc. Natl. Acad. Sci. U. S. A. 2010, 107, 4505–4510.
(10) Akbari, S.; Shea, H. R. Microfabrication and Characterization of an Array of Dielectric Elastomer Actuators Generating Uniaxial Strain to Stretch Individual Cells. J. Micromechanics Microengineering 2012, 22, 045020.

1. Introduction
54
(11) Kovacs, G.; Lochmatter, P.; Wissler, M. An Arm Wrestling Robot Driven by Dielectric Elastomer Actuators. Smart Mater. Struct. 2007, 16, S306–S317.
(12) Ashley, S. Artificial Muscles. Sci. Am. 2003, 289, 52–59.
(13) Ha, S. M.; Yuan, W.; Pei, Q.; Pelrine, R.; Stanford, S. Interpenetrating Polymer Networks for High-Performance Electroelastomer Artificial Muscles. Adv. Mater. 2006, 18, 887–891.
(14) Mirfakhrai, T.; Madden, J. D. W.; Baughman, R. H. Polymer Artificial Muscles. Mater. Today 2007, 10, 30–38.
(15) Biddiss, E.; Chau, T. Dielectric Elastomers as Actuators for Upper Limb Prosthetics: Challenges and Opportunities. Med. Eng. Phys. 2008, 30, 403–418.
(16) Bar-Cohen, Y. Electroactive Polymer (EAP) Actuators as Artificial Muscles: Reality, Potential, and Challenges; 2nd ed.; SPIE Press: Bellingham, Washington, 2004.
(17) O’Halloran, A.; O’Malley, F.; McHugh, P. A Review on Dielectric Elastomer Actuators, Technology, Applications, and Challenges. J. Appl. Phys. 2008, 104, 071101.
(18) Carpi, F. The European Scientific Network for Artificial Muscles and the EuroEAP Conference.
(19) Carpi, F.; Kornbluh, R.; Sommer-Larsen, P.; Alici, G. Electroactive Polymer Actuators as Artificial Muscles: Are They Ready for Bioinspired Applications? Bioinspir. Biomim. 2011, 6, 045006.
(20) Brochu, P.; Pei, Q. Advances in Dielectric Elastomers for Actuators and Artificial Muscles. Macromol. Rapid Commun. 2010, 31, 10–36.
(21) Pei, Q.; Rosenthal, M. Multifunctional Electroelastomer Roll Actuators and Their Application for Biomimetic Walking Robots. Proceeding SPIE, Electroact. Polym. Actuators Devices 2003, 5051, 281–290.
(22) Pelrine, R. E. R.; Kornbluh, R. R. D. R.; Joseph, J. J. P. J.; International, S. R. I.; Ave, R.; Park, M. Electrostriction of Polymer Dielectrics with Compliant Electrodes as a Means of Actuation. Sensors Actuators A Phys. 1998, 64, 77–85.
(23) McKay, T. G.; O’Brien, B. M.; Calius, E. P.; Anderson, I. A. Soft Generators Using Dielectric Elastomers. Appl. Phys. Lett. 2011, 98, 2009–2012.
1. Introduction
55
(24) Koh, S. J. A.; Keplinger, C.; Li, T.; Bauer, S.; Suo, Z. Dielectric Elastomer Generators: How Much Energy Can Be Converted? IEEE/ASME Trans. Mechatronics 2011, 16, 33–41.
(25) Pelrine, R.; Kornbluh, R. D.; Eckerle, J.; Jeuck, P.; Oh, S.; Pei, Q.; Stanford, S. Dielectric Elastomers: Generator Mode Fundamentals and Applications. SPIE’s 8th Annu. Int. Symp. Smart Struct. Mater. 2001, 4329, 148–156.
(26) Pelrine, R.; Kornbluh, R.; Pei, Q.; Joseph, J. High-Speed Electrically Actuated Elastomers with Strain Greater than 100%. Science 2000, 287, 836–840.
(27) Pelrine, R.; Kornbluh, R.; Joseph, J.; Heydt, R.; Pei, Q.; Chiba, S. High-Field Deformation of Elastomeric Dielectrics for Actuators. Mater. Sci. Eng. C 2000, 11, 89–100.
(28) Kim, H.; Park, J.; Chuc, N. H.; Choi, H. R.; Nam, J. D.; Lee, Y.; Jung, H. S.; Koo, J. C.; Huu Chuc, N. Development of Dielectric Elastomer Driven Micro-Optical Zoom Lens System. Proc. SPIE 6524, Electroact. Polym. Actuators Devices 2007, 6524, 65241V – 65241V – 10.
(29) Rosset, S.; Shea, H. R. Flexible and Stretchable Electrodes for Dielectric Elastomer Actuators. Appl. Phys. A Mater. Sci. Process. 2013, 110, 281–307.
(30) Dielectric Elastomers as Electromechanical Transducers; Carpi, F.; De Rossi, D.; Kornbluh, R.; Pelrine, R.; Sommer-Larsen, P., Eds.; Elsevier: Amsterdam, 2008.
(31) Opris, D. M.; Molberg, M.; Walder, C.; Ko, Y. S.; Fischer, B.; Nüesch, F. a. New Silicone Composites for Dielectric Elastomer Actuator Applications In Competition with Acrylic Foil. Adv. Funct. Mater. 2011, 21, 3531–3539.
(32) Racles, C.; Cazacu, M.; Fischer, B.; Opris, D. M. Synthesis and Characterization of Silicones Containing Cyanopropyl Groups and Their Use in Dielectric Elastomer Actuators. Smart Mater. Struct. 2013, 22, 104004.
(33) Galantini, F.; Carpi, F.; Gallone, G. Effects of Plasticization of a Soft Silicone for Dielectric Elastomer Actuation. Smart Mater. Struct. 2013, 22, 104020.
(34) Shankar, R.; Ghosh, T. K.; Spontak, R. J. Electromechanical Response of Nanostructured Polymer Systems with No Mechanical Pre-Strain. Macromol. Rapid Commun. 2007, 28, 1142–1147.
(35) Drobny, J. G. Polymers for Electricity and Electronics; John Wiley & Sons, Inc.: Hoboken, New Jersey, 2012.

1. Introduction
56
(36) Harper, C. A. Handbook of Plastics, Elastomers, and Composites; Mc Graw-Hill Companies Inc.: New York, 2002.
(37) Cervantes, J.; Zárraga, R.; Salazar-Hernández, C. Organotin Catalysts in Organosilicon Chemistry. Appl. Organomet. Chem. 2012, 26, 157–163.
(38) Lewis, L. N.; Stein, J.; Gao, Y.; Colborn, R. E.; Hutchins, G. Platinum Catalysts Used in the Silicone Industry. Platin. Matals Rev. 1997, 41, 66–75.
(39) Li, Z.; Hansen, K.; Yao, Y.; Ma, Y.; Moon, K.; Wong, C. P. The Conduction Development Mechanism of Silicone-Based Electrically Conductive Adhesives. J. Mater. Chem. C 2013, 1, 4368–4374.
(40) Sangermano, M.; Marchi, S.; Meier, P.; Kornmann, X. UV-Activated Hydrosilation Reaction for Silicone Polymer Crosslinking. J. Appl. Polym. Sci. 2013, 128, 1521–1526.
(41) Lv, Y.; Lin, Z.; Svec, F. “Thiol-Ene” Click Chemistryμ A Facile and Versatile Route for the Functionalization of Porous Polymer Monoliths. Analyst 2012, 137, 4114–4118.
(42) Müller, U.; Kunze, A.; Herzig, C.; Weis, J. Photocrosslinking of Silicones. Part 13. Photoinduced Thiol-Ene Crosslinking of Modified Silicones. J. Macromol. Sci. Part A 1996, 33, 439–457.
(43) Rissing, C.; Son, D. Y. Thiol-Ene Reaction for the Synthesis of Multifunctional Branched Organosilanes. Organometallics 2008, 27, 5394–5397.
(44) Dünki, S. J.; Ko, Y. S.; Nüesch, F. A.; Opris, D. M. Self-Repairable , High Permittivity Dielectric Elastomers with Large Actuation Strains at Low Electric Fields. Adv. Funct. Mater. 2015, 25, 2467–2475.
(45) Tieke, B. Makromolekulare Chemie: Eine Einführung; VCH: Weinheim, 1997.
(46) Kuhn, W. Beziehungen Zwischen Molekülgrösse, Statistischer Molekülgestalt Und Elastischen Eigenschaften Hochpolymerer Stoffe. Colloid Polym. Sci. 1936, 76, 258–271.
(47) Rubinstein, M.; Panyukov, S. Elasticity of Polymer Networks. Macromolecules 2002, 35, 6670–6686.
(48) Rubinstein, M.; Colby, R. Polymers Physics; Oxford, 2003.
(49) Treloar, L. R. G. The Physics of Rubber Elasticity; Oxford university press, 1975.
1. Introduction
57
(50) Kramer, O. Non-Equilibrium Mechanical Properties of Model Networks. Br. Polym. J. 1985, 17, 129–133.
(51) Broadband Dielectric Spectroscopy; Kremer, F.; Schönhals, A., Eds.; Springer Berlin Heidelberg: Berlin, Heidelberg, 2003.
(52) Chen, L.; Ong, C.; Neo, C. Electromagnetic Properties of Materials. In Microwave Elecronics: Measurement and Materials Characterization; John Wiley & Sons, Ltd: Chichester, UK, 2004.
(53) Ieda, M.; Nagao, M.; Hikita, M. High-Field Conduction and Breakdown in Insulating Polymers. Present Situation and Prospects. IEEE Trans. Dielectr. Electr. Insul. 1994, 1, 934–945.
(54) Ieda, M. Dielectric Breakdown Process of Polymers. IEEE Trans. Electr. Insul. 1980, EI-15, 206–224.
(55) Huang, J.; Shian, S.; Diebold, R. M.; Suo, Z.; Clarke, D. R. The Thickness and Stretch Dependence of the Electrical Breakdown Strength of an Acrylic Dielectric Elastomer. Appl. Phys. Lett. 2012, 101, 122905.
(56) Koh, S. J. A.; Li, T.; Zhou, J.; Zhao, X.; Hong, W.; Zhu, J.; Suo, Z. Mechanisms of Large Actuation Strain in Dielectric Elastomers. J. Polym. Sci. Part B Polym. Phys. 2011, 49, 504–515.
(57) Michel, S.; Chu, B. T. T.; Grimm, S.; Nüesch, F. A.; Borgschulte, A.; Opris, D. M. Self-Healing Electrodes for Dielectric Elastomer Actuators. J. Mater. Chem. 2012, 22, 20736.
(58) La, T.; Lau, G.; Shiau, L.; Tan, A. W. Muscle-like High-Stress Dielectric Elastomer Actuators with Oil Capsules. Smart Mater. Struct. 2014, 23, 105006.
(59) Schneuwly, A; Groning, P.; Schlapbach, L. Breakdown Behavior of Oil-Im Polypropylene as Dielectric in Film Capacitors. IEEE Trans. Dielectr. Electr. Insul. 1998, 5, 862–868.
(60) Yuan, W.; Brochu, P.; Ha, S. M.; Pei, Q. Dielectric Oil Coated Single-Walled Carbon Nanotube Electrodes for Stable, Large-Strain Actuation with Dielectric Elastomers. Sensors Actuators, A Phys. 2009, 155, 278–284.
(61) Van Rysselberghe, P. Remarks Concerning The Clausius-Mossotti Law. J. Phys. Chem. 1929, 49, 1152-1155.

1. Introduction
58
(62) Lorentz, H. A. Über Die Beziehung Zwischen Der Fortpflanzungsgeschwindigkeit Des Lichtes Und Der Körperdichte. Ann. Phys. 1879, 245, 641–665.
(63) Onsager, L. Electric Moments of Molecules in Liquids. J. Am. Chem. Soc. 1936, 58, 1486–1493.
(64) Kirkwood, J. G. The Dielectric Polarization of Polar Liquids. J. Chem. Phys. 1939, 7, 911–919.
(65) Fröhlich, H. Theoretical Dipolar Interaction. Trans. Faraday Soc. 1946, 42, A003.
(66) Kirkwood, G. The Influence of Hindered Molecular Rotation on the Dielectric Polarization of Polar Liquids. Trans. Faraday Soc. 1946, 42, A007.
(67) Fröhlich, H. Theory of Dielectrics μ Dielectric Constant and Dielectric δoss; Monographs on the physics and chemistry of materials; Clarendon Press: Oxford, 1958.
(68) Chen, D.; Yi, S.; Fang, P.; Zhong, Y.; Huang, C.; Wu, X. Synthesis and Characterization of Novel Room Temperature Vulcanized (RTV) Silicone Rubbers Using Octa[(trimethoxysilyl)ethyl]-POSS as Cross-Linker. React. Funct. Polym. 2011, 71, 502–511.
(69) Racles, C.; Alexandru, M.; Bele, A.; Musteata, V. E.; Cazacu, M.; Opris, D. M. Chemical Modification of Polysiloxanes with Polar Pendant Groups by Co-Hydrosilylation. RSC Adv. 2014, 4, 37620–37628.
(70) Risse, S.; Kussmaul, B.; Krüger, H.; Kofod, G. A Versatile Method for Enhancement of Electromechanical Sensitivity of Silicone Elastomers. RSC Adv. 2012, 2, 9029–9035.
(71) Madsen, F. B.; Dimitrov, I.; Daugaard, A. E.; Hvilsted, S.; Skov, A. L. Novel Cross-Linkers for PDMS Networks for Controlled and Well Distributed Grafting of Functionalities by Click Chemistry. Polym. Chem. 2013, 4, 1700–1707.
(72) Risse, S.; Kussmaul, B.; Krüger, H.; Waché, R.; Kofod, G. DEA Material Enhancement with Dipole Grafted PDMS Networks. Proc. SPIE, Electroact. Polym. Actuators Devices 2011, 7976, 79760N – 79760N – 7.
(73) Kussmaul, B.; Risse, S.; Kofod, G.; Waché, R.; Wegener, M.; McCarthy, D. N.; Krüger, H.; Gerhard, R. Enhancement Of Dielectric Permittivity And Electromechanical Response In Silicone Elastomers: Molecular Grafting Of Organic Dipoles To The Macromolecular Network. Adv. Funct. Mater. 2011, 21, 4589–4594.
1. Introduction
59
(74) Madsen, F. B.; Yu, L.; Daugaard, A. E.; Hvilsted, S.; Skov, A. L. A New Soft Dielectric Silicone Elastomer Matrix with High Mechanical Integrity and Low Losses. RSC Adv. 2015, 5, 10254–10259.
(75) Myroshnychenko, V.; Brosseau, C. Finite-Element Modeling Method for the Prediction of the Complex Effective Permittivity of Two-Phase Random Statistically Isotropic Heterostructures. J. Appl. Phys. 2005, 97.
(76) Brosseau, C. Modelling and Simulation of Dielectric Heterostructures: A Physical Survey from an Historical Perspective. J. Phys. D. Appl. Phys. 2006, 39, 1277–1294.
(77) Maxwell Garnett, J. C. Colours in Metal Glasses and in Metallic Films. Phil. Trans. R. Soc. Lond. 1904, 203, 385–420.
(78) Koh, G. Effective Dielectric Constant of a Medium with Spherical Inclusions. IEEE Trans. Geosci. Remote Sens. 1992, 30, 184–186.
(79) Sihvola, A.; Saastamoinen, S.; Heiska, K. Mixing Rules and Percolation. Remote Sens. Rev. 1994, 9, 39–50.
(80) Qi, L.; Lee, B. I.; Chen, S.; Samuels, W. D.; Exarhos, G. J. High-Dielectric-Constant Silver-Epoxy Composites as Embedded Dielectrics. Adv. Mater. 2005, 17, 1777–1781.
(81) Shen, Y.; Lin, Y.; Li, M.; Nan, C.-W. High Dielectric Performance of Polymer Composite Films Induced by a Percolating Interparticle Barrier Layer. Adv. Mater. 2007, 19, 1418–1422.
(82) Sihvola, A. Mixing Rules with Complex Dielectric Coefficients. Subsurf. Sens. Technol. Appl. 2000, 1, 393–415.
(83) Nguyen, H. C.; Doan, V. T.; Park, J.; Koo, J. C.; Lee, Y.; Nam, J.; Choi, H. R. The Effects of Additives on the Actuating Performances of a Dielectric Elastomer Actuator. Smart Mater. Struct. 2008, 18, 015006.
(84) Stiubianu, G.; Bele, A.; Tugui, C.; Musteata, V. New Dielectric Elastomers with Improved Properties for Energy Harvesting and Actuation. Proc. SPIE 2015, 9258, 925808.
(85) Hashin, Z.; Rosen, B. W. The Elastic Moduli of Fiber-Reinforced Materials. J. Appl. Mech. 1964, 63, 223–232.
1. Introduction
60
(86) Krimmer, A. A Direct Approach for the Explicit Determination of the in-Situ Modulus of Matrices in Fibre Reinforced Plastics. In ECCM15 - 15th European Conference on Composite Materials; Venice, Italy, 2012; pp. 24–28.
(87) Beer, F. Die Festigkeitseigenschaften Kreuzweise Bewehrter Kunststoffe. VDI-Zeitschrift 1959, 101, 463–468.
(88) Bigg, D. M. Mechanical Properties of Particulate Filled Polymers. Polym. Compos. 1987, 8, 115–122.
(89) Opris, D. M.; Crespy, D.; Löwe, C.; Molberg, M.; Nüesch, F. Phtalocyanine and Encapsulated Polyaniline Nanoparticles as Fillers for Dielectric Elastomers. Proc. SPIE, Electroact. Polym. Actuators Devices (EAPAD)Electroactive Polym. Actuators Devices 2009, 7287, 72870L – 72870L – 8.
(90) Dang, Z.-M.; Yu, Y.-F.; Xu, H.-P.; Bai, J. Study on Microstructure and Dielectric Property of the BaTiO3/epoxy Resin Composites. Compos. Sci. Technol. 2008, 68, 171–177.
(91) Choi, H.-W.; Heo, Y.-W.; Lee, J.-H.; Kim, J.-J.; Lee, H.-Y.; Park, E.-T.; Chung, Y.-K. Effects of BaTiO3 on Dielectric Behavior of BaTiO3–Ni–polymethyl Methacrylate Composites. Appl. Phys. Lett. 2006, 89, 132910.
(92) Vrejoiu, I.; Pedarnig, J. D.; Dinescu, M.; Bäuerle, D. Rapid Communication Flexible Ceramic – Polymer Composite Films with Temperature-Insensitive and Tunable Dielectric Permittivity. Appl. Phys. A 2002, 409, 407–409.
(93) Gallone, G.; Carpi, F.; De Rossi, D.; Levita, G.; Marchetti, A. Dielectric Constant Enhancement in a Silicone Elastomer Filled with Lead Magnesium Niobate-Lead Titanate. Mater. Sci. Eng. C 2007, 27, 110–116.
(94) Stoyanov, H.; Brochu, P.; Niu, X.; Della Gaspera, E.; Pei, Q. Dielectric Elastomer Transducers with Enhanced Force Output and Work Density. Appl. Phys. Lett. 2012, 100, 2010–2013.
(95) Kurimoto, M.; Okubo, H.; Kato, K.; Hanai, M.; Hoshina, Y.; Takei, M.; Hayakawa, N. Dielectric Properties of Epoxy/alumina Nanocomposite Influenced by Control of Micrometric Agglomerates. IEEE Trans. Dielectr. Electr. Insul. 2010, 17, 662–670.
(96) Molberg, M.; Crespy, D.; Rupper, P.; Nüesch, F.; Månson, J.-A. E.; Löwe, C.; Opris, D. M. High Breakdown Field Dielectric Elastomer Actuators Using Encapsulated Polyaniline as High Dielectric Constant Filler. Adv. Funct. Mater. 2010, 20, 3280–3291.
1. Introduction
61
(97) Yuan, J.-K.; Dang, Z.-M.; Yao, S.-H.; Zha, J.-W.; Zhou, T.; Li, S.-T.; Bai, J. Fabrication and Dielectric Properties of Advanced High Permittivity Polyaniline/poly(vinylidene Fluoride) Nanohybrid Films with High Energy Storage Density. J. Mater. Chem. 2010, 20, 2441–2447.
(98) Li, G.; Yu, S.; Sun, R.; Lu, D. Clean and in-Situ Synthesis of Copper-Epoxy Nanocomposite as a Matrix for Dielectric Composites with Improved Dielectric Performance. Compos. Sci. Technol. 2014, 110, 95–102.
(99) Wang, Q.; Chen, G. Effect of Nanofillers on the Dielectric Properties of Epoxy Nanocomposites. Adv. Mater. Res. 2012, 1, 93–107.
(100) Jayasundere, N.; Smith, B. V. Dielectric Constant for Binary Piezoelectric 0-3 Composites. J. Appl. Phys. 1993, 73, 2462–2466.
(101) Opris, D. M.; Nüesch, F. A.; Löwe, C.; Molberg, M.; Nagel, M. Synthesis, Characterization, and Dielectric Properties of Phthalocyanines with Ester and Carboxylic Acid Functionalities. Chem. Mater. 2008, 53, 6889–6896.
(102) Nalwa, H. S. Handbook of Low and High Dielectric Constant Materials and Their Applications, Two-Volume Set; Academic Press: San Diego, 1999.
(103) Niu, Y.; Yu, K.; Bai, Y.; Wang, H.; Member, S. Enhanced Dielectric Performance of BaTiO3 / PVDF Composites Prepared by Modified Process for Energy Storage Applications. IEEE Trans. Ultrason. Ferroelectr. Freq. Control 2015, 62, 108–115.
(104) Dang, Z.-M.; Lin, Y.-H.; Nan, C.-W. Novel Ferroelectric Polymer Composites with High Dielectric Constants. Adv. Mater. 2003, 15, 1625–1629.
(105) Singh, V.; Kulkarni, A. R.; Mohan, T. R. R. Dielectric Properties of Aluminum – Epoxy Composites. J. Appl. Polym. Sci. 2003, 90, 3602-3608.
(106) Nelson, J. K.; Linhardt, R. J.; Schadler, L. S.; Hillborg, H. Effect of High Aspect Ratio Filler on Dielectric Properties of Polymer Composites: A Study on Barium Titanate Fibers and Graphene Platelets. IEEE Trans. Dielectr. Electr. Insul. 2012, 19, 960–967.
(107) Goswami, K.; Daugaard, A. E.; Skov, A. L. Dielectric Properties of Ultraviolet Cured Poly(dimethyl Siloxane) Sub-Percolative Composites Containing Percolative Amounts of Multi-Walled Carbon Nanotubes. RSC Adv. 2015, 5, 12792–12799.
(108) Wang, L.; Dang, Z.-M. Carbon Nanotube Composites with High Dielectric Constant at Low Percolation Threshold. Appl. Phys. Lett. 2005, 87, 042903.

1. Introduction
62
(109) Nayak, S.; Kumar Chaki, T.; Khastgir, D. Development of Poly(dimethylsiloxane)/BaTiO3 Nanocomposites as Dielectric Material. Adv. Mater. Res. 2012, 622-623, 897–900.
(110) Grannan, D. M.; Garland, J. C.; Tanner, D. B. Critical Behavior of the Dielectric Constant of a Random Composite near the Percolation Threshold. Phys. Rev. Lett. 1981, 46, 375–379.
(111) Xu, J.; Wong, C. P. Effects of the Low Loss Polymers on the Dielectric Behavior of Novel Aluminum-Filled High-K Nano-Composites. 2004 1st IEEE Consum. Commun. Netw. Conf. (IEEE Cat. No.04EX745) 158–170.
(112) Rajesh, S.; Sonoda, K.; Uusimaki, A.; Yang, K. H.; Lu, H. Y.; Jantunen, H. Effective Dielectric Response of Polymer Composites with Ceramic Coated Silver Flakes. J. Mater. Sci. Mater. Electron. 2012, 24, 191–195.
(113) Dang, Z.-M.; Peng, B.; Xie, D.; Yao, S.-H.; Jiang, M.-J.; Bai, J. High Dielectric Permittivity Silver/polyimide Composite Films with Excellent Thermal Stability. Appl. Phys. Lett. 2008, 92, 112910.
(114) Lu, J.; Moon, K.-S.; Xu, J.; Wong, C. P. Synthesis and Dielectric Properties of Novel High-K Polymer Composites Containing in-Situ Formed Silver Nanoparticles for Embedded Capacitor Applications. J. Mater. Chem. 2006, 16, 1543–1548.
(115) Lu, J.; Moon, K.-S.; Wong, C. P. Silver/polymer Nanocomposite as a High-K Polymer Matrix for Dielectric Composites with Improved Dielectric Performance. J. Mater. Chem. 2008, 18, 4821–4826.
(116) Xu, J.; Moon, K.-S. K. S. K.-S.; Tison, C.; Wong, C. P. P. A Novel Aluminum-Filled Composite Dielectric for Embedded Passive Applications. IEEE Trans. Adv. Packag. 2006, 29, 295–306.
(117) Lin, Y.; Jiang, L.; Zhao, R.; Nan, C.-W. High-Permittivity Core/shell Stuctured NiO-Based Ceramics and Their Dielectric Response Mechanism. Phys. Rev. B 2005, 72, 014103.
(118) Dang, Z.-M.; Wang, L.; Yin, Y.; Zhang, Q.; Lei, Q.-Q. Giant Dielectric Permittivities in Functionalized Carbon-Nanotube/ Electroactive-Polymer Nanocomposites. Adv. Mater. 2007, 19, 852–857.
(119) Tian, M.; Wei, Z.; Zan, X.; Zhang, L.; Zhang, J.; Ma, Q.; Ning, N.; Nishi, T. Thermally Expanded Graphene Nanoplates/polydimethylsiloxane Composites with High

1. Introduction
63
Dielectric Constant, Low Dielectric Loss and Improved Actuated Strain. Compos. Sci. Technol. 2014, 99, 37–44.
(120) Andrey, L.; Sau, T. K. Complex-Shaped εetal Nanoparticles μ Bottom-Up Syntheses and Applications; WILEY-VCH Verlag: Weinheim, 2012.
(121) Li, Z.; Moon, K. S.; Kim, S.; Wong, C. P. Enhancement of Dielectric Strength and Processibility of High Dielectric Constant Al Nanocomposite by Organic Molecule Treatment. Proc. - Electron. Components Technol. Conf. 2011, 2073–2078.
(122) Lee, Y.; Choi, J.-R.; Lee, K. J.; Stott, N. E.; Kim, D. Large-Scale Synthesis of Copper Nanoparticles by Chemically Controlled Reduction for Applications of Inkjet-Printed Electronics. Nanotechnology 2008, 19, 415604.
(123) Xu, J.; Moon, K.-S.; Tison, C.; Wong, C. P. A Novel Aluminum-Filled Composite Dielectric for Embedded Passive Applications. IEEE Trans. Adv. Packag. 2006, 29, 295–306.
(124) Reszczyńska, J.; Jurek, A.; Łącka, I.; Skwarek, E.; Zaleska, A. Preparation of Silver Nanoparticles in Reverse Micelles and Antibacterial Activity of Silver Modified-Paints. Adv. Mater. Sci. 2010, 10, 12–20.
(125) Sharma, V. K.; Yngard, R. A.; Lin, Y. Silver Nanoparticles: Green Synthesis and Their Antimicrobial Activities. Adv. Colloid Interface Sci. 2009, 145, 83–96.
(126) Goyal, A.; Kumar, A.; Patra, P. K.; Mahendra, S.; Tabatabaei, S.; Alvarez, P. J. J.; John, G.; Ajayan, P. M. In Situ Synthesis of Metal Nanoparticle Embedded Free Standing Multifunctional PDMS Films. Macromol. Rapid Commun. 2009, 30, 1116–1122.
(127) Yu, M. K.; Jeong, Y. Y.; Park, J.; Park, S.; Kim, J. W.; Min, J. J.; Kim, K.; Jon, S. Drug-Loaded Superparamagnetic Iron Oxide Nanoparticles for Combined Cancer Imaging and Therapy in Vivo. Angew. Chemie - Int. Ed. 2008, 47, 5362–5365.
(128) Lee, H.; Yu, M. K.; Park, S.; Moon, S.; Min, J. J.; Jeong, Y. Y.; Kang, H.-W.; Jon, S. Thermally Cross-Linked Superparamagnetic Iron Oxide Nanoparticles: Synthesis and Application as a Dual Imaging Probe for Cancer in Vivo. J. Am. Chem. Soc. 2007, 129, 12739–12745.
(129) Hu, M.; Chen, J.; Li, Z.-Y.; Au, L.; Hartland, G. V; Li, X.; Marquez, M.; Xia, Y. Gold Nanostructures: Engineering Their Plasmonic Properties for Biomedical Applications. Chem. Soc. Rev. 2006, 35, 1084–1094.

1. Introduction
64
(130) Xu, R.; Wang, D.; Zhang, J.; Li, Y. Shape-Dependent Catalytic Activity of Silver Nanoparticles for the Oxidation of Styrene. Chem. - An Asian J. 2006, 1, 888–893.
(131) Burda, C.; Chen, X.; Narayanan, R.; El-Sayed, M. A. Chemistry and Properties of Nanocrystals of Different Shapes. Chem. Rev. 2005, 105, 1025–1102.
(132) Daniel, M.-C.; Astruc, D. Gold Nanoparticles: Assembly, Supramolecular Chemistry, Quantum-Size-Related Properties, and Applications toward Biology, Catalysis, and Nanotechnology. Chem. Rev. 2004, 104, 293–346.
(133) Lu, J.; Su, F.; Huang, Z.; Zhang, C.; Liu, Y.; Ma, X.; Gong, J. N-Doped Ag/TiO2 Hollow Spheres for Highly Efficient Photocatalysis under Visible-Light Irradiation. RSC Adv. 2013, 3, 720–724.
(134) Atwater, H. A.; Polman, A. Plasmonics for Improved Photovoltaic Devices. Nat. Mater. 2010, 9, 205–213.
(135) Qi, J.; Dang, X.; Hammond, P. T.; Belcher, A. M. Highly Efficient Plasmon-Enhanced Dye-Sensitized Solar Cells through Metal@Oxide Core-Shell Nanostructure. 2011, 5, 7108–7116.
(136) Tavakoli, A.; Sohrabi, M.; Kargari, A. A Review of Methods for Synthesis of Nanostructured Metals with Emphasis on Iron Compounds. Chem. Pap. 2007, 61, 151–170.
(137) Klabunde, K. J. Nanoscale Materials in Chemistry; Wiley-Interscience: New York, 2001.
(138) Wang, Y.; Xia, Y. Bottom-up and Top-down Approaches to the Synthesis of Monodispersed Spherical Colloids of Low Melting-Point Metals. Nano Lett. 2004, 4, 2047–2050.
(139) LaMer, V. K.; Dinegar, R. H. . Theory, Production and Mechanism of Formation of Monodispersed Hydrosols. J. Am. Chem. Soc. 1950, 72, 4847–4854.
(140) Tao, A. R.; Habas, S.; Yang, P. Shape Control of Colloidal Metal Nanocrystals. Small 2008, 4, 310–325.
(141) Wang, D.; Möhwald, H. Template-Directed Colloidal Self-Assembly - the Route to “Top-down” Nanochemical Engineering. J. Mater. Chem. 2004, 14, 459–468.
(142) Kim, D.; Jeong, S.; Moon, J. Synthesis of Silver Nanoparticles Using the Polyol Process and the Influence of Precursor Injection. Nanotechnology 2006, 17, 4019–4024.

1. Introduction
65
(143) Murray, C. B.; Kagan, C. R.; Bawendi, M. G. Synthesis and Characterization of Monodisperse Nanocrystals and Close-Packed Nanocrystal Assemblies. Annu. Rev. Mater. Sci. 2000, 30, 545–610.
(144) De Mello Donegá, C.; Liljeroth, P.; Vanmaekelbergh, D. Physicochemical Evaluation of the Hot-Injection Method, a Synthesis Route for Monodisperse Nanocrystals. Small 2005, 1, 1152–1162.
(145) Krutyakov, Y. A; Kudrinskiy, A. A.; Olenin, A. Y.; Lisichkin, G. V. Synthesis and Properties of Silver Nanoparticles: Advances and Prospects. Russ. Chem. Rev. 2008, 77, 233–257.
(146) Notarianni, M.; Vernon, K.; Chou, A.; Aljada, M.; Liu, J.; Motta, N. Plasmonic Effect of Gold Nanoparticles in Organic Solar Cells. Sol. Energy 2014, 106, 23–37.
(147) Thompson, D. Michael Faraday’s Recognition of Ruby Gold μ The Birth of Modern Nanotechnology His 1857 Lecture to the Royal Society in London. Gold Bull. 2007, 40, 267–269.
(148) Choi, H.; Lee, J.-P.; Ko, S.-J.; Jung, J.-W.; Park, H.; Yoo, S.; Park, O.; Jeong, J.-R.; Park, S.; Kim, J. Y. Multipositional Silica-Coated Silver Nanoparticles for High-Performance Polymer Solar Cells. Nano Lett. 2013, 13, 2204–2208.
(149) Rycenga, M.; Cobley, C. M.; Zeng, J.; Li, W.; Moran, C. H.; Zhang, Q.; Qin, D.; Xia, Y. Controlling the Synthesis and Assembly of Silver Nanostructures for Plasmonic Applications. Chem. Rev. 2011, 111, 3669–3712.
(150) Liang, X.; Yu, S.; Sun, R.; Luo, S.; Wan, J.; Yu, S.; Sun, R.; Luo, S.; Liang, X.; Wan, J.; et al. Microstructure and Dielectric Behavior of the Three-Phase Ag@SiO2/BaTiO3/PVDF Composites with High Permittivity. J. Mater. Res. 2012, 27, 991–998.
(151) Yang, X. H.; Fu, H. T.; Wong, K.; Jiang, X. C.; Yu, A. B. Hybrid Ag@TiO2 Core-Shell Nanostructures with Highly Enhanced Photocatalytic Performance. Nanotechnology 2013, 24, 415601.
(152) Chin, S. F.; Pang, S. C.; Dom, F. E. I. Sol-Gel Synthesis of Silver/titanium Dioxide (Ag/TiO2) Core-Shell Nanowires for Photocatalytic Applications. Mater. Lett. 2011, 65, 2673–2675.
(153) Cobley, C. M.; Rycenga, M.; Zhou, F.; Li, Z.-Y.; Xia, Y. Etching and Growth: An Intertwined Pathway to Silver Nanocrystals with Exotic Shapes. Angew. Chem. Int. Ed. Engl. 2009, 48, 4824–4827.

1. Introduction
66
(154) Farrell, Z.; Shelton, C.; Dunn, C.; Green, D. Straightforward, One-Step Synthesis of Alkanethiol-Capped Silver Nanoparticles from an Aggregative Model of Growth. Langmuir 2013, 29, 9291–9300.
(155) Pastoriza-Santos, I.; Liz-Marzán, L. Formation and Stabilization of Silver Nanoparticles through Reduction by N, N-Dimethylformamide. Langmuir 1999, 15, 948–951.
(156) Hiramatsu, H.; Osterloh, F. E. Communications A Simple Large-Scale Synthesis of Nearly with Exchangeable Surfactants. Chem. Mater. 2004, 16, 801–802.
(157) Sarkar, A.; Kapoor, S.; Mukherjee, T. Preparation, Characterization, and Surface Modification of Silver Nanoparticles in Formamide. J. Phys. Chem. B 2005, 109, 7698–7704.
(158) Yin, Y.; Li, Z.-Y.; Zhong, Z.; Gates, B.; Xia, Y.; Venkateswaran, S. Synthesis and Characterization of Stable Aqueous Dispersions of Silver Nanoparticles through the Tollens process. J. Mater. Chem. 2002, 12, 522–527.
(159) Zhang, Q.; Li, W.; Wen, L.-P.; Chen, J.; Xia, Y. Facile Synthesis of Ag Nanocubes of 30 to 70 Nm in Edge Length with CF3COOAg as a Precursor. Chem. - A Eur. J. 2010, 16, 10234–10239.
(160) Creighton, J. A.; Blatchford, C. G.; Albrecht, M. G. Plasma Resonance Enhancement of Raman Scattering by Pyridine Adsorbed on Silver or Gold Sol Particles of Size Comparable to the Excitation Wavelength. J. Chem. Soc. Faraday Trans. 2 1979, 75, 790–798.
(161) Korgel, B. A.; Fitzmaurice, D. Self-Assembly of Silver Nanocrystals into Two-Dimensional Nanowire Arrays. Adv. Mater. 1998, 10, 661–665.
(162) Nickel, U.; Mansyreff, K.; Schneider, S. Production of Monodisperse Silver Colloids by Reduction with Hydrazine: The Effect of Chloride and Aggregation on SER(R)S Signal Intensity. J. Raman Spectrosc. 2004, 35, 101–110.
(163) Riddick, J. A. Organic Solvents μ Physical Properties and εethods of Purification; Bunger, W. B.; Sakano, T. K., Eds.; Techniques of chemistry; 4th ed.; New York, N.Y. μ Wiley, 1986; Vol. vol.2.
(164) Pastoriza-Santos, I.; Liz-Marzán, L. M.; Santos, I.; Marzán, L. Reduction of Silver Nanoparticles in DMF. Formation of Monolayers and Stable Colloids. Pure Appl. Chem 2000, 72, 83–90.
1. Introduction
67
(165) Pastoriza-Santos, I.; Liz-Marzán, L. Formation of PVP-Protected Metal Nanoparticles in DMF. Langmuir 2002, 18, 2888–2894.
(166) Pastoriza-Santos, I.; Liz-Marzán, L. Synthesis of Silver Nanoprisms in DMF. Nano Lett. 2002, 2, 903–905.
(167) Pastoriza-Santos, I.; Liz-Marzán, L. M. N , N -Dimethylformamide as a Reaction Medium for Metal Nanoparticle Synthesis. Adv Funct Mater 2009, 19, 679–688.
(168) Kemp, M.; Slotnick, H. Silver Mirror. J. Chem. Educ. 1981, 58, 655–656.
(169) Qu, L.; Dai, L. Novel Silver Nanostructures from Silver Mirror Reaction on Reactive Substrates. J. Phys. Chem. B 2005, 109, 13985–13990.
(170) Niitsoo, O.; Couzis, A. Facile Synthesis of Silver Core - Silica Shell Composite Nanoparticles. J. Colloid Interface Sci. 2011, 354, 887–890.
(171) Kvitek, L.; Prucek, R.; Panacek, A.; Novotny, R.; Hrbac, J.; Zboril, R. The Influence of Complexing Agent Concentration on Particle Size in the Process of SERS Active Silver Colloid Synthesis. J. Mater. Chem. 2005, 15, 1099–1105.
(172) Dondi, R.; Su, W.; Griffith, G. A.; Clark, G.; Burley, G. A. Highly Size- and Shape-Controlled Synthesis of Silver Nanoparticles via a Templated Tollens Reaction. Small 2012, 8, 770–776.
(173) Hsu, S. L. C.; Wu, R. T. Synthesis of Contamination-Free Silver Nanoparticle Suspensions for Micro-Interconnects. Mater. Lett. 2007, 61, 3719–3722.
(174) Liu, T.; Li, D.; Yang, D.; Jiang, M. Size Controllable Synthesis of Ultrafine Silver Particles through a One-Step Reaction. Mater. Lett. 2011, 65, 628–631.
(175) Pandey, S.; Pandey, S. K.; Parashar, V.; Mehrotra, G. K.; Pandey, A. C. Ag/PVA Nanocomposites: Optical and Thermal Dimensions. J. Mater. Chem. 2011, 21, 17154–17159.
(176) Turkevich, J.; Stevenson, P. C.; Hillier, J. A Study of the Nucleation and Growth Processes in the Synthesis of Colloidal Gold. Discuss. Faraday Soc. 1951, 11, 55–75.
(177) Lee, P. C.; Meisel, D. Adsorption and Surface-Enhanced Raman of Dyes on Silver and Gold Sols. J.Phys.Chem. 1982, 86, 3391–3395.
(178) Dong, X.; Ji, X.; Wu, H.; Zhao, L.; Li, J.; Yang, W. Shape Control of Silver Nanoparticles by Stepwise Citrate Reduction. J. Phys. Chem. C 2009, 113, 6573–6576.
1. Introduction
68
(179) Yang, Z.; Qian, H.; Chen, H.; Anker, J. N. One-Pot Hydrothermal Synthesis of Silver Nanowires via Citrate Reduction. J. Colloid Interface Sci. 2010, 352, 285–291.
(180) Pyatenko, A.; Yamaguchi, M.; Suzuki, M. Synthesis of Spherical Silver Nanoparticles with Controllable Sizes in Aqueous Solutions. J. Phys. Chem. C 2007, 111, 7910–7917.
(181) Wiley, B.; Sun, Y.; Xia, Y. Synthesis of Silver Nanostructures with Controlled Shapes and Properties. Acc. Chem. Res. 2007, 40, 1067–1076.
(182) Wiley, B.; Sun, Y.; Mayers, B.; Xia, Y. Shape-Controlled Synthesis of Metal Nanostructures: The Case of Silver. Chem. - A Eur. J. 2005, 11, 454–463.
(183) Wiley, B.; Herricks, T.; Sun, Y.; Xia, Y. Polyol Synthesis of Silver Nanoparticles: Use of Chloride and Oxygen to Promote the Formation of Single-Crystal, Truncated Cubes and Tetrahedrons. Nano Lett. 2004, 4, 1733–1739.
(184) Liang, H.; Wang, W.; Huang, Y.; Zhang, S.; Wei, H.; Xu, H. Controlled Synthesis of Uniform Silver Nanospheres †. J. Phys. Chem. C 2010, 114, 7427–7431.
(185) Sun, Y.; Mayers, B.; Herricks, T.; Xia, Y. Polyol Synthesis of Uniform Silver Nanowires: A Plausible Growth Mechanism and the Supporting Evidence. Nano Lett. 2003, 3, 955–960.
(186) Xiong, Y.; Siekkinen, A. R.; Wang, J.; Yin, Y.; Kim, M. J.; Xia, Y. Synthesis of Silver Nanoplates at High Yields by Slowing down the Polyol Reduction of Silver Nitrate with Polyacrylamide. J. Mater. Chem. 2007, 17, 2600–2602.
(187) Hu, Y.; Ge, J.; Lim, D.; Zhang, T.; Yin, Y. Size-Controlled Synthesis of Highly Water-Soluble Silver Nanocrystals. J. Solid State Chem. 2008, 181, 1524–1529.
(188) Sun, Y.; Xia, Y. Shape-Controlled Synthesis of Gold and Silver Nanoparticles. Science 2002, 298, 2176–2179.
(189) Skrabalak, S.; Wiley, B.; Kim, M.; Formo, E.; Xia, Y. On the Polyol Synthesis of Silver Nanostructures: Glycolaldehyde as a Reducing Agent. Nano Lett. 2008, 8, 2077–2081.
(190) Silvert, P.; Herrera-Urbina, R.; Tekaia-Elhsissen, K. Preparation of Colloidal Silver Dispersions by the Polyolprocess. J. Mater. Chem. 1997, 6, 573–577.

1. Introduction
69
(191) Nishioka, M.; Miyakawa, M.; Kataoka, H.; Koda, H.; Sato, K.; Suzuki, T. M. Continuous Synthesis of Monodispersed Silver Nanoparticles Using a Homogeneous Heating Microwave Reactor System. Nanoscale 2011, 3, 2621–2626.
(192) Mehenni, H.; Sinatra, L.; Mahfouz, R.; Katsiev, K.; Bakr, O. M. Rapid Continuous Flow Synthesis of High-Quality Silver Nanocubes and Nanospheres. RSC Adv. 2013, 3, 22397–22403.
(193) Zhang, Q.; Li, H.; Poh, M.; Xia, F.; Cheng, Z. An All-Organic Composite Actuator Material with a High Dielectric Constant. Nature 2002, 419, 284–287.
(194) Huang, C.; Zhang, Q. M.; deBotton, G.; Bhattacharya, K. All-Organic Dielectric-Percolative Three-Component Composite Materials with High Electromechanical Response. Appl. Phys. Lett. 2004, 84, 4391.
(195) Lucchini, M. A.; Testino, A.; Ludwig, C.; Kambolis, A.; El-Kazzi, M.; Cervellino, A.; Riani, P.; Canepa, F. Continuous Synthesis of Nickel Nanopowders: Characterization, Process Optimization, and Catalytic Properties. Appl. Catal. B Environ. 2014, 156-157, 404–415.
(196) Park, B. K.; Jeong, S.; Kim, D.; Moon, J.; Lim, S.; Kim, J. S. Synthesis and Size Control of Monodisperse Copper Nanoparticles by Polyol Method. J. Colloid Interface Sci. 2007, 311, 417–424.
(197) Xu, J.; Wong, C. P. Low-Loss Percolative Dielectric Composite. Appl. Phys. Lett. 2005, 87, 082907.
(198) CRC Handbook of Chemistry and Physics; Weast, R. C., Ed.; CRC Press: Boca Raton, FL, 1979.
(199) Graf, C.; Vossen, D. L. J.; Imhof, A.; van Blaaderen, A. A General Method To Coat Colloidal Particles with Silica. Langmuir 2003, 19, 6693–6700.
(200) Kobayashi, Y.; Katakami, H.; Mine, E.; Nagao, D.; Konno, M.; Liz-Marzán, L. M. Silica Coating of Silver Nanoparticles Using a Modified Stober Method. J. Colloid Interface Sci. 2005, 283, 392–396.
(201) Mine, E.; Yamada, A.; Kobayashi, Y.; Konno, M.; Liz-Marzán, L. M. Direct Coating of Gold Nanoparticles with Silica by a Seeded Polymerization Technique. J. Colloid Interface Sci. 2003, 264, 385–390.
(202) Liz-Marzan, L.; Mulvaney, P. The Assembly of Coated Nanocrystals. J. Phys. Chem. B 2003, 107, 7312–7326.

1. Introduction
70
(203) Mulvaney, P.; Liz-Marzán, L. M.; Giersig, M.; Ung, T. Silica Encapsulation of Quantum Dots and Metal Clusters. J. Mater. Chem. 2000, 10, 1259–1270.
(204) Stöber, W.; Fink, A.; Bohn, E. Controlled Growth of Monodisperse Silica Spheres in the Micron Size Range. J. Colloid Interface Sci. 1968, 69, 62–69.
(205) Baida, H.; Billaud, P.; Marhaba, S.; Christofilos, D.; Cottancin, E.; Crut, a; Lermé, J.; Maioli, P.; Pellarin, M.; Broyer, M.; et al. Quantitative Determination of the Size Dependence of Surface Plasmon Resonance Damping in Single Ag@SiO2 Nanoparticles. Nano Lett. 2009, 9, 3463–3469.
(206) Rainville, L.; Dorais, M.-C.; Boudreau, D. Controlled Synthesis of Low Polydispersity Ag@SiO2 Core–shell Nanoparticles for Use in Plasmonic Applications. RSC Adv. 2013, 3, 13953.
(207) Gao, T.; Jelle, B. P.; Gustavsen, A. Core-Shell-Typed Ag@SiO2 Nanoparticles as Solar Selective Coating Materials. J. Nanoparticle Res. 2013, 15, 1370.
(208) Li, J.; Zhang, B.; Wang, F.; Liu, C. Silver/carbon-Quantum-Dot Plasmonic Luminescent Nanoparticles. New J. Chem. 2011, 35, 554-557.
(209) Yang, J.; Zhang, F.; Chen, Y.; Qian, S.; Hu, P.; Li, W.; Deng, Y.; Fang, Y.; Han, L.; Luqman, M.; et al. Core-Shell Ag@SiO2@mSiO2 Mesoporous Nanocarriers for Metal-Enhanced Fluorescence. Chem. Commun. (Camb). 2011, 47, 11618–11620.
(210) Bai, Z.; Chen, R.; Si, P.; Huang, Y.; Sun, H.; Kim, D. H. Fluorescent pH Sensor Based on Ag@SiO2 Core-Shell Nanoparticle. ACS Appl. Mater. Interfaces 2013, 5, 5856–5860.
(211) Liu, S. H.; Han, M. Y. Synthesis, Functionalization, and Bioconjugation of Monodisperse, Silica-Coated Gold Nanoparticles: Robust Bioprobes. Adv. Funct. Mater. 2005, 15, 961–967.
(212) Ung, T.; Liz-Marzan, L. M. Controlled Method for Silica Coating of Silver Colloids . Influence of Coating on the Rate of Chemical Reactions. Langmuir 1998, 14, 3740–3748.
(213) Wang, W.; Zhipeng, L.; Baohua, G.; Zhenyu, Z.; Hongxin, X. Ag@SiO2 Core-Shell Nanoparticles for Probing Spatial Distribution of Electromagnetic Field Enhancement via Surface-Enhanced Raman Scattering. 2009, 3, 3493–3496.
(214) Xue, C.; Chen, X.; Hurst, S. J.; Mirkin, C. A. Self-Assembled Monolayer Mediated Silica Coating of Silver Triangular Nanoprisms. Adv. Mater. 2007, 19, 4071–4074.

1. Introduction
71
(215) Graf, C.; Gao, Q.; Schütz, I.; Noufele, C. N.; Ruan, W.; Posselt, U.; Korotianskiy, E.; Nordmeyer, D.; Rancan, F.; Hadam, S.; et al. Surface Functionalization of Silica Nanoparticles Supports Colloidal Stability in Physiological Media and Facilitates Internalization in Cells. Langmuir 2012, 28, 7598–7613.
(216) Liu, S.; Han, M.-Y. Silica-Coated Metal Nanoparticles. Chem. Asian J. 2010, 5, 36–45.
(217) Yin, Y.; Lu, Y.; Sun, Y.; Xia, Y. Silver Nanowires Can Be Directly Coated with Amorphous Silica To Generate Well-Controlled Coaxial Nanocables of Silver/Silica. Nano Lett. 2002, 2, 427–430.
(218) Bahadur, N. M.; Furusawa, T.; Sato, M.; Kurayama, F.; Siddiquey, I. A.; Suzuki, N. Fast and Facile Synthesis of Silica Coated Silver Nanoparticles by Microwave Irradiation. J. Colloid Interface Sci. 2011, 355, 312–320.
(219) Bastakoti, B. P.; Guragain, S.; Yusa, S.; Nakashima, K. Novel Synthesis Route for Ag@SiO2 Core–shell Nanoparticles via Micelle Template of Double Hydrophilic Block Copolymer. RSC Adv. 2012, 2, 5938–5940.
(220) Prasad, B. L. V; Arumugam, S. K.; Bala, T.; Sastry, M. Solvent-Adaptable Silver Nanoparticles. Langmuir 2005, 21, 822–826.
(221) Chen, X.; Mao, S. S. Titanium Dioxide Nanomaterials μ Synthesis, Properties, Modifications , and Applications. Chem. Rev. 2007, 107, 2891–2959.
(222) Zhang, N.; Liu, S.; Fu, X.; Xu, Y. Synthesis of M@TiO2 (M= Au, Pd, Pt) Core–shell Nanocomposites with Tunable Photoreactivity. J. Phys. Chem. C 2011, 2, 9136–9145.
(223) Yang, X.; Fu, H.; Yu, A.; Jiang, X. Large-Surface Mesoporous TiO2 Nanoparticles: Synthesis, Growth and Photocatalytic Performance. J. Colloid Interface Sci. 2012, 387, 74–83.
(224) Pastoriza-Santos, I.; Koktysh, D. One-Pot Synthesis of Ag@TiO2 Core-Shell Nanoparticles and Their Layer-by-Layer Assembly. Langmuir 2000, 16, 2731–2735.
(225) Hirakawa, T.; Kamat, P. V; Uni, V.; Dame, N. Charge Separation and Catalytic Activity of Ag@TiO2 Core - Shell Composite Clusters under UV - Irradiation. J. Am. Chem. Soc. 2005, 127, 3928–3934.
(226) Sun, H.; He, J.; Wang, J.; Zhang, S.-Y.; Liu, C.; Sritharan, T.; Mhaisalkar, S.; Han, M.-Y.; Wang, D.; Chen, H. Investigating the Multiple Roles of Polyvinylpyrrolidone for a General Methodology of Oxide Encapsulation. J. Am. Chem. Soc. 2013, 135, 9099–9110.

1. Introduction
72
(227) Dong, Q.; Yu, H.; Jiao, Z.; Lu, G.; Bi, Y. New Facile Synthesis of One-Dimensional Ag@TiO2 Anatase Core–shell Nanowires for Enhanced Photocatalytic Properties. RSC Adv. 2014, 4, 59114–59117.
(228) Li, W.; Yang, J.; Wu, Z.; Wang, J.; Li, B.; Feng, S.; Deng, Y.; Zhang, F.; Zhao, D. A Versatile Kinetics-Controlled Coating Method to Construct Uniform Porous TiO2 Shells for Multifunctional Core-Shell Structures. J. Am. Chem. Soc. 2012, 134, 11864–11867.
(229) Aguirre, M. E.; Rodríguez, B.; Rom, E. S.; Feldho, A.; Grela, M. A. Ag @ ZnO Core À Shell Nanoparticles Formed by the Timely Reduction of Ag+ Ions and Zinc Acetate Hydrolysis in N,N-Dimethylformamide μ Mechanism of Growth and Photocatalytic Properties. J. Phys. Chem. C 2011, 115, 24967–24974.
(230) Encina, E. R.; Pérez, M. A.; Coronado, E. A. Synthesis of Ag@ZnO Core–shell Hybrid Nanostructures: An Optical Approach to Reveal the Growth Mechanism. J. Nanoparticle Res. 2013, 15, 1688.
(231) Tom, R. T.; Nair, A. S.; Singh, N.; Aslam, M.; Nagendra, C. L.; Philip, R.; Vijayamohanan, K. .; Pradeep, T. Freely Dispersible Au@TiO2, Au@TiO2, and Ag@ ZrO2 Core-Shell Nanoparticles: One-Step Synthesis, Characterization, Spectroscopy, and Optical Limiting Properties. Langmuir 2003, 19, 3439–3445.
(232) Moran, C. H.; Rycenga, M.; Zhang, Q.; Xia, Y. Replacement of Poly(vinyl Pyrrolidone) by Thiols: A Systematic Study of Ag Nanocube Functionalization by Surface-Enhanced Raman Scattering. J. Phys. Chem. C. Nanomater. Interfaces 2011, 115, 21852–21857.
(233) Gries, K.; Bubel, K.; Wohlfahrt, M.; Agarwal, S.; Koert, U.; Greiner, A. Preparation of Gold Nanoparticle–Poly (L-Menthyl Methacrylate) Conjugates via ATRP Polymerization. Macromol. Chem. Phys. 2011, 212, 2551–2557.
(234) Quaroni, L.; Chumanov, G. Preparation of Polymer-Coated Functionalized Silver Nanoparticles. J. Am. Chem. Soc. 1999, 121, 10642–10643.
(235) Mandal, T. K.; Fleming, M. S.; Walt, D. R. Preparation of Polymer Coated Gold Nanoparticles by Surface-Confined Living Radical Polymerization at Ambient Temperature. Nano Lett. 2002, 2, 3–7.
(236) Ohno, K.; Koh, K.; Tsujii, Y.; Fukuda, T. Synthesis of Gold Nanoparticles Coated with Well-Defined, High-Density Polymer Brushes by Surface-Initiated Living Radical Polymerization. Macromolecules 2002, 35, 8989–8993.

1. Introduction
73
(237) Nuss, S.; Böttcher, H. Gold Nanoparticles with Covalently Attached Polymer Chains. Angew. Chemie (International ed. English)) 2001, 40, 4016–4018.
(238) Li, D.; He, Q.; Cui, Y.; Wang, K.; Zhang, X.; Li, J. Thermosensitive Copolymer Networks Modify Gold Nanoparticles for Nanocomposite Entrapment. Chem. - A Eur. J. 2007, 13, 2224–2229.
(239) Dong, H.; Zhu, M.; Yoon, J. A.; Gao, H.; Jin, R.; Matyjaszewski, K. One-Pot Synthesis of Robust Core/shell Gold Nanoparticles. J. Am. Chem. Soc. 2008, 130, 12852–12853.
(240) Mi, H.-Y.; Li, Z.; Turng, L.-S.; Sun, Y.; Gong, S. Silver Nanowire/thermoplastic Polyurethane Elastomer Nanocomposites: Thermal, Mechanical, and Dielectric Properties. Mater. Des. 2014, 56, 398–404.

1. Introduction
74
2. Continuous Production of Tailored Silver Nanoparticles by Polyol Synthesis and Reaction Yield Measured by X-ray Absorption Spectroscopy: Towards a Growth Mechanism.
75
Chapter 2: Continuous Production of Tailored Silver
Nanoparticles by Polyol Synthesis and Reaction Yield
Measured by X-ray Absorption Spectroscopy: Towards a
Growth Mechanism.
Declaration: The SFTR was modified by Dr. Andrea Testino for the experiments, who also
conducted the XRD experiments and particle size measurement with the BI-XDC. XANES
measurements were conducted by Dr. Sonia Pin and Dr. Thomas Huthwelker. The
nanoparticles synthesis as well as the analysis (TEM, SEM, DLS, UV-vis) were performed
by Jose Enrico Q. Quinsaat.
Jose Enrico Q. Quinsaat1, Andrea Testino2(*), Sonia Pin3, Thomas Hutwelker3, Frank A.
Nüesch1, Paul Bowen4, Heinrich Hofmann4, Christian Ludwig2,5, and Dorina M. Opris1(*)
1Swiss Federal Laboratories for Materials Science and Technology (Empa), Laboratory
for Functional Polymers, Überlandstrasse 129, 8600 Dübendorf, Switzerland
2General Energy Research Department, Paul Scherrer Institut, Villigen PSI, 5303 Villigen,
Switzerland
3 Swiss Light Source (SLS), Paul Scherrer Institut, Villigen PSI, 5303 Villigen, Switzerland
4Ecole Polytechnique Fédérale de Lausanne (EPFL), Materials Institute, Powder
Technology Laboratory (LTP), 1015 Lausanne, Switzerland
5École Polytechnique Fédérale de Lausanne, School of Architecture, Civil and
Environmental Engineering, EPFL ENAC, 1015 Lausanne, Switzerland

2. Continuous Production of Tailored Silver Nanoparticles by Polyol Synthesis and Reaction Yield Measured by X-ray Absorption Spectroscopy: Towards a Growth Mechanism.
76
Abstract: In this paper two complementary topics are discussed: (i) the continuous
production of silver nanoparticles (AgNPs) and (ii) the measurement of reaction yield by
X-ray Absorption Near Edge Spectroscopy (XANES). The continuous polyol synthesis of
AgNPs in grams amount and in the size range of 7-104 nm was carried out in the
Segmented Flow Tubular Reactor (SFTR). Particle size was tailored by controlling the
synthesis parameters such as temperature, reactant concentrations, and
polyvinylpyrrolidone (PVP) molecular weight. The continuous production was tested for 4
h and the product has shown constant particle size distribution over the whole production
time. Reliable continuous production of 2.3 g∙h-1 of about 100 nm AgNPs can be achieved
with a lab-scale SFTR. The produced particles were fully characterized with respect to
size, size distribution and chemical purity. To better understand the growth mechanism,
synchrotron-radiation high-resolution X-ray diffraction and X-ray absorption spectroscopy
data were collected directly on the AgNPs suspension. In particular, from XANES
experiments the conversion yield of Ag+ to Ag0 was measured. The results are consistent
with a two steps process where PVP controls the particle nucleation while growth is
ensured by thermally induced ethylene glycol oxidation.
2.1. Introduction
Over the last couple of decades, noble metal nanoparticles have attracted significant
interest in science and industry due to their wide range of applications. Thanks to their
interesting optical properties, AgNPs have gained a lot of attention in applications such as
surface-enhanced Raman spectroscopy,1,2 optical sensing,3-5 electronics6 and plasmonic
enhancement of absorption.7 Noble metal nanoparticles have also excellent surface
properties that find application in catalysis8. AgNPs in the size range 20-50 nm are
required for the preparation of conductive paste for ink-jet9-12 or screen printing13,14 as well
as for joining of power electronics components.15-17 For these latter applications, a narrow
particle size distribution is mandatory because few larger particles cause nozzle clogging

2. Continuous Production of Tailored Silver Nanoparticles by Polyol Synthesis and Reaction Yield Measured by X-ray Absorption Spectroscopy: Towards a Growth Mechanism.
77
or defects in the conductive wires or joining layers. Excellent electrical and thermal
properties, very close to the silver bulk values, are obtained upon sintering. When flexible
organic substrates are used (e.g. polymeric films) the sintering temperature has to be as low
as possible, ideally below 250 C. Sintering temperature decreases with particle size
driving the technology toward AgNPs. Nevertheless, very high solid loads (> 50 wt%) are
required in metal pastes in order to produce optimal electrical and thermal conductivities
but such ultrafine particles are very difficult to retrieve quantitatively from the synthesis
mother solution. Thus, a trade-off between a low sintering temperature and facile particle
retrieving is for instance the use of larger particles (30-100 nm).
Moreover, AgNPs are particularly interesting as conductive filler for the preparation of
composite materials with high dielectric properties. Epoxy-based nanocomposites using Ag
as filler with dielectric constants up to 300 have been reported so far.18,19 For this
application, AgNPs with an average size up to 200 nm and narrow particle size distribution
are of great interest.
Liquid phase chemical reduction is a simple and popular method to prepare metal
nanoparticles from salts, since no hazardous by-products are generated. Among these
methods, the polyol synthesis, intensively investigated by Xia and co-workers,20,21 stands
out as a convenient and environmentally friendly way to generate silver nanostructures.
Different stabilizers have been used in the polyol synthesis, which include
polyacrylamide,22 polyacrylic acid (PAA)23 and polyvinylpyrrolidinone (PVP).24 By tuning
the synthesis parameters such as concentration,24 precursor addition rate and method,
temperature25, average molecular weight of the stabilizer,26,27 reactant stoichiometry28, 29 or
additives,30-33 size and shape of the nanocrystals can be controlled.
One of the limitations in producing high quality AgNPs is the poor control of mixing
conditions, stirring efficiency, temperature inhomogeneity, heating and cooling rates, in the
batch type reactors used. This hampers the reproducibility and product quality and

2. Continuous Production of Tailored Silver Nanoparticles by Polyol Synthesis and Reaction Yield Measured by X-ray Absorption Spectroscopy: Towards a Growth Mechanism.
78
uniformity.24,34,35 Despite the influence of the aforementioned parameters, good product
quality may be obtained when working with low reactant concentrations; the product
quality degradation, such as particle size distributions broadening, becomes very
pronounced when attempting to scale up e.g. by increasing the reaction volume or
increasing the precursor concentration. The preparation of AgNPs in batch conditions with
different reaction volumes show the differing product properties and indicate that the
reproducibility of the small scale reaction cannot be obtained by simply increasing the
reaction volume (see Supporting Information). The heat transfer in a small volume is more
efficient than in a large volume, and this affects the nucleation process. The batch reaction
at smaller reaction volume yields smaller particles since there is a more rapid nucleation
due to the faster heating of the reaction mixture. This also manifests itself on the better
particle size distribution achieved in small scale reactions. Overall, the obtained yields of
the reactions were around 70 %. The difficulty of the upscaling of the reaction can also be
seen in ref. [24] where the best particle variation coefficient was obtained at a AgNO3
concentration of around 31 mM. A further increase in the concentration, despite keeping the
precursor ratio constant, led to a deterioration of the particle size distribution. A possibility
to overcome scaling up problems is by multiplying or “numbering up” the small batch
syntheses but can become cumbersome and expensive. An alternative is to use a
continuous flow reactor. Few attempts for the continuous production of AgNPs have been
reported in literature, mainly focused on small particle sizes (< 10 nm) prepared by
microfluidic devices36-38 or in a tubular reactors39 and syringe pumps40 (semi-continuous):
these papers deal with flow rates < 1 ml∙min-1, millimolar Ag concentrations and limited
treated volumes, thus not suitable for a relatively large production (few g∙h-1). An
interesting experimental work is reported by Nishioka38 et al., where AgNPs are produced
in a tubular reactor heated in a microwave oven. The authors claim that by conventional
heating in an oil bath, metal silver is deposited on the tubular reactor wall and the product
quality deteriorates over time while by microwave heating the process is reliable over time.
Similar fouling problems are reported by Lin and coworkers.40

2. Continuous Production of Tailored Silver Nanoparticles by Polyol Synthesis and Reaction Yield Measured by X-ray Absorption Spectroscopy: Towards a Growth Mechanism.
79
In this work we present the continuous polyol synthesis of AgNPs in the size range 10-120
nm using high precursor concentrations ([Ag+] 120 mM in the reaction mixture). The
reaction was carried out in the Segmented Flow Tubular Reactor (SFTR)41 heated in a
conventional oil bath. A prominent feature in this experimental set-up is that an inert and
immiscible solvent is introduced into the system and separates the reaction mixture into
identical micro-volumes before transporting them into the reactor. This principle avoids
back-mixing of the reaction mixture and creates identical conditions for the produced
micro-volumes in terms of heat transfer and residence time within the reactor. Moreover,
as already shown for several precipitation reactions42,43 and here presented for the first time
for AgNPs production, the immiscible fluid protects the internal tubular wall reactor
allowing long production time without product quality deterioration or fouling. In this
paper the effects of the reaction temperature and the average molecular weight of PVP on
the resulting particle size and distribution are investigated. The products were fully
characterized by Transmission Electron Microscopy (TEM), high resolution X-ray
Diffraction (XRD), Thermogravimetric Analysis (TGA), Inductively Coupled Plasma
Mass Spectrometry (ICP-MS), Dynamic Light Scattering (DLS), Ultraviolet-Visible
Spectroscopy (UV-vis), and X-ray Disk Centrifuge Particle Size Analysis (Brookhaven
Instrument, BI-XDC).
Synchrotron radiation was used both for X-ray diffraction (XRD) and for X-ray absorption
spectroscopy (XAS). X-ray diffraction patterns were collected on dried powder as well as
directly on the as prepared suspensions. X-ray Absorption Near Edge Spectroscopy
(XANES) was used for the first time to directly measure the reaction yield.
Additionally, a correlation between the major plasmon peak in the UV-vis spectra and the
TEM particle size was identified. It is demonstrated that a series of relevant analytical data
can be measured directly on the particle suspension. The combination of the applied
analytical techniques allowed a growth mechanism to be proposed which can explain the
experimental results obtained in the continuous production using the SFTR.
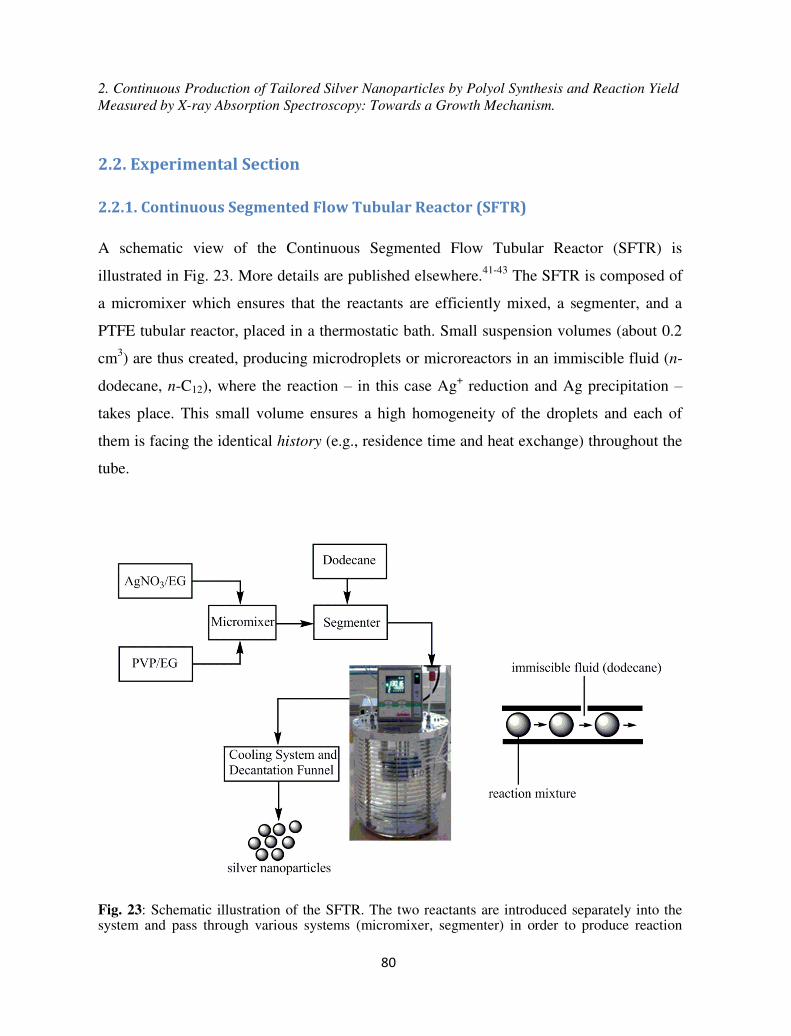
2. Continuous Production of Tailored Silver Nanoparticles by Polyol Synthesis and Reaction Yield Measured by X-ray Absorption Spectroscopy: Towards a Growth Mechanism.
80
2.2. Experimental Section
2.2.1. Continuous Segmented Flow Tubular Reactor (SFTR)
A schematic view of the Continuous Segmented Flow Tubular Reactor (SFTR) is
illustrated in Fig. 23. More details are published elsewhere.41-43 The SFTR is composed of
a micromixer which ensures that the reactants are efficiently mixed, a segmenter, and a
PTFE tubular reactor, placed in a thermostatic bath. Small suspension volumes (about 0.2
cm3) are thus created, producing microdroplets or microreactors in an immiscible fluid (n-
dodecane, n-C12), where the reaction – in this case Ag+ reduction and Ag precipitation –
takes place. This small volume ensures a high homogeneity of the droplets and each of
them is facing the identical history (e.g., residence time and heat exchange) throughout the
tube.
Fig. 23: Schematic illustration of the SFTR. The two reactants are introduced separately into the system and pass through various systems (micromixer, segmenter) in order to produce reaction
2. Continuous Production of Tailored Silver Nanoparticles by Polyol Synthesis and Reaction Yield Measured by X-ray Absorption Spectroscopy: Towards a Growth Mechanism.
81
microdroplets prior to going through the heated reactor where the formation of the particles occurs.
The reaction or the precipitation occurs in the mixing chamber and/or induced by the rapid
temperature change when the microreactors are heated in the thermostatic bath. According
to fluid dynamic modelling, the temperature of the droplets reaches 95 % and 99 % of the
bath temperature within 6 and 10 s, respectively.44 Fouling on the inner tubular reactor wall
is avoided due to the immiscible fluid by forming a thin film on the tube surface42,45 and
thus allowing long continuous process times (> 12 h). The residence time is determined by
the pump flow rates and the tube length and adjusted according to the specific reaction
kinetics. This is a steady-state process in which each step (mixing and reaction) is well
separated, leading to a better control and reproducibility. If needed, after the tubular
reactor, in the process line, a heat-exchanger can be placed to cool down the reacting
mixture and quench the reaction. Finally, a separation unit or decanter allows the
separation of the product from the immiscible fluid; the product – particle in suspension –
is collected, while the immiscible fluid is recycled in the process for environmental and
cost concerns.
2.2.2 Polyol Synthesis of Silver Nanoparticles in the SFTR
All chemicals were purchased from Sigma Aldrich and used as received. Ethylene glycol
(EG) was distilled prior to use. A modified procedure from Xia and co-workers was
applied for AgNPs synthesis.46 Two separate solutions of AgNO3 (0.236 M) and PVP 10:
Mw = 10’000 g∙mol-1 or PVP 40: Mw = 40’000 g∙mol-1 (2.16 M in terms of repeating units)
were prepared. PVP and AgNO3 were dissolved at 70 °C under sonication and at room
temperature under magnetic stirring, respectively. In order to protect the AgNO3 solution
from sunlight, the container was shielded off by wrapping aluminium foil around it. The
two reactants were introduced into the reactor system by pumping with two HPLC pumps
at a rate of 1.5 mL/min. After forming the reaction mixture in the micromixer, the micro-
volumes were made in the segmenter by passing through n-C12 at a speed of 24.8 mL/min.

2. Continuous Production of Tailored Silver Nanoparticles by Polyol Synthesis and Reaction Yield Measured by X-ray Absorption Spectroscopy: Towards a Growth Mechanism.
82
In the experimental trial, the temperature range was kept between 120 and 150 °C. The
residence time of the micro-volumes within the tube in the thermostatic bath was 12 min.
In a second tubular section, the segmented suspension was cooled down. The silver sol was
then collected in the decantation funnel and n-C12 separated. The theoretical AgNPs
production (100 % yield) corresponds to 2.26 g AgNPs h-1.
2.2.3. Materials and Methods
Particles were characterized by TEM images (Philips CM30) measuring over 400 particles,
DLS (Malvern Zetasized Nano ZS), BI-XDC (Brookhaven Instruments) and UV-vis (Cary
50 Spectrophotometer). TGA was carried out with a Mettler Toledo TGA/SDTA 851e in
the temperature range 25-500 C (heating rate 5 K min-1). About 20 mg of Ag powders
were treated in Ar/O2 (20 % O2, 15 ml∙min-1) atmosphere. A second run under reducing
atmosphere Ar/H2 (5 % H2, 10 mL∙min-1) was carried out on selected samples. Chemical
analysis was carried out with an Agilent 7700x ICP-MS after digestion of the samples in
HNO3 and dilution in milliQ water, using external calibration standards. XRD patterns and
XANES measurements were done at the Swiss Light Source (SLS, Paul Scherrer Institut,
Villigen PSI, Switzerland). XRD were collected at the Material Science beam line
(X04SA), at 25 keV and using a 0.3 mm glass capillary.47 Cell parameters were calculated
by Rietveld refinement using the GSAS (General Structural Analysis Software)48 and ICSD
(Inorganic Crystal Structure Database).49 Crystallite sizes (dXRD) were estimated from the
full path refinement using the GSAS (profile function #4).50 Moreover, diffraction patterns
were collected directly on the as prepared suspension, through a liquid cell sample holder
with 10 mm of optical path.
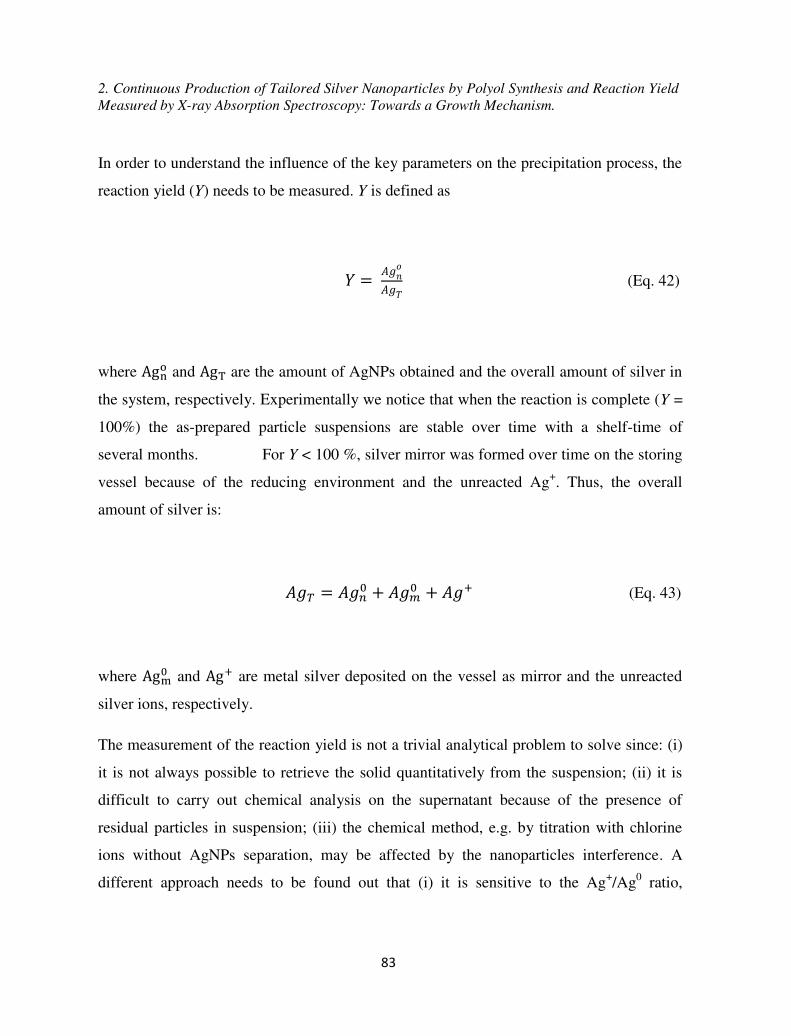
2. Continuous Production of Tailored Silver Nanoparticles by Polyol Synthesis and Reaction Yield Measured by X-ray Absorption Spectroscopy: Towards a Growth Mechanism.
83
In order to understand the influence of the key parameters on the precipitation process, the
reaction yield (Y) needs to be measured. Y is defined as
� = �� (Eq. 42)
where Ag and AgT are the amount of AgNPs obtained and the overall amount of silver in
the system, respectively. Experimentally we notice that when the reaction is complete (Y =
100%) the as-prepared particle suspensions are stable over time with a shelf-time of
several months. For Y < 100 %, silver mirror was formed over time on the storing
vessel because of the reducing environment and the unreacted Ag+. Thus, the overall
amount of silver is:
� = � + � + � + (Eq. 43)
where Ag and Ag+ are metal silver deposited on the vessel as mirror and the unreacted
silver ions, respectively.
The measurement of the reaction yield is not a trivial analytical problem to solve since: (i)
it is not always possible to retrieve the solid quantitatively from the suspension; (ii) it is
difficult to carry out chemical analysis on the supernatant because of the presence of
residual particles in suspension; (iii) the chemical method, e.g. by titration with chlorine
ions without AgNPs separation, may be affected by the nanoparticles interference. A
different approach needs to be found out that (i) it is sensitive to the Ag+/Ag0 ratio,

2. Continuous Production of Tailored Silver Nanoparticles by Polyol Synthesis and Reaction Yield Measured by X-ray Absorption Spectroscopy: Towards a Growth Mechanism.
84
(ii) does not require solid-liquid separation, (iii) can be carried out on the liquid suspension
just after the synthesis, ideally on-line, when Ag = .
Here, a novel approach to measure the reaction yield by X-ray Absorption Near Edge
Spectroscopy (XANES) is presented. XANES is a direct method to quantify the oxidation
state of the absorbing atom. By fitting (Linear Combination Fitting, see later in this
section), the relative amount of Ag+ and Ag0 can be calculated. Thus, when Ag = , the
reaction yield is calculated as
� = + + − (Eq. 44)
In this paper, two Ag absorption edges were measured (K and L3) and compared in terms
of analytical results and experimental requirements.
The Ag L3-edge XANES spectra were collected at the PHOENIX beamline (X07MA). The
beamline was equipped with a Si(111) monochromator tuned to the Ag L3-edge, assigned
to 3351 eV using a thin Ag metal foil, also used as a standard for Ag0 specie. The
experimental set-up closely follows the one reported in ref. [51]. The measurements were
carried out in fluorescence mode, at room temperature in a 100 mbar He atmosphere. An
appropriate sample concentration was chosen, in order to give the maximum contrast at the
Ag-L3 edge and minimize the over-absorption effects. Actually, the as-synthetized
suspensions were used without dilution because preliminary tests demonstrate that over-
absorption effects were negligible. To measure the incoming photon flux (I0), a polyester
foil (Goodfellow), coated with 50 nm of Ni, was put into the beam at the exit of the
focusing optics, thus behind the last aperture before the sample. The total electron yield
generated on the foil by the beam served as measure of I0.

2. Continuous Production of Tailored Silver Nanoparticles by Polyol Synthesis and Reaction Yield Measured by X-ray Absorption Spectroscopy: Towards a Growth Mechanism.
85
The Ag-K edge XANES spectra were collected at the Super-XAS beamline (X10DA). The
intensity of the incident beam (I0) was measured with an argon filled ion chamber. The Ag+
standard and the sample suspensions were properly diluted in order to minimize hole-
effects and then placed in 1 mm glass capillaries. X-ray absorption data from the sample
were measured in transmission mode. A second argon filled ion chamber was used to
measure I1. A thin sample of Ag metal foil was used for calibration and also as a standard
for Ag0 specie. The calibration measurement was made with a third argon filled ion
chamber (I2) placed after I1. The position of the metal absorption edge (Ag, 25514 eV)
could then be determined by placing the Ag metal standard between ion chambers I1 and I2
and measuring the absorption coefficient of the metal standard. In both XAS experiments a
solution of Ag+, stabilized with HNO3, was used as standard for Ag+ species.
The XANES spectra were analysed by using the Linear Combination Fitting (LCF)52-55
option available in ATHENA.56 With this method, the X-ray absorption spectrum is
modelled by least squares fitting using linear combination of known species to fit the
unknown spectrum. The underlying principle is the additive nature of the absorption from
each species in the sample. The total absorption coefficient can be written as a sum of the
chemical forms or species. Mathematically, ii i STDfModel where Model is the least
square fit to the sample spectrum over a selected energy range, and fi is the scaling factors
applied to each spectrum of the corresponding standard (STDi) across the energy range of
the fit. The scaling factors obtained from LCF represent the fraction of each standard
species in the unknown sample. The LC fit has been carried out in the energy range
25400 – 25700 eV for the Ag-K edge and in the 3300 – 3450 eV range for the Ag-L3 edge.
The relative weights of the two reference standards (Ag0 and Ag+) are allowed to vary from
0 to 1, and the absorption edge energies, previously aligned, are kept fixed during the
analysis.

2. Continuous Production of Tailored Silver Nanoparticles by Polyol Synthesis and Reaction Yield Measured by X-ray Absorption Spectroscopy: Towards a Growth Mechanism.
86
2.3. Results
Following a single droplet within the tubular reactor, a clear colour evolution occurs over
time, from colourless transparent to pale transparent yellow to deep red or dark
suspensions. The colour change is due to the well-known localized surface plasmon
resonance spectra that highly depend upon their size, shape, and surrounding environment.
The transparent solution indicates that no reduction occurs during mixing at room
temperature, while the reaction starts, induced by the temperature, in the thermostatic bath.
The colour change is thus due to the AgNPs nucleation and growth. Dark suspensions are
obtained at high reaction yield and for rather large particle (> 60 nm).
The collected products, in form of suspensions, were characterized both as suspension and
as washed and dried powders. Tab. 4 summarizes the synthesis condition and the average
particle size of the 7 series of samples produced. The samples were collected for about 30
minutes of continuous production. At T= 120 °C and PVP 40k, the reaction does not occur.
It is worth noting that, in the tested temperature conditions (≤ 150 C), if the process is
carried out without PVP, the silver reduction does not occur. Fig. 24 shows representative
TEM images of the samples G0, G1, G2, and G3 prepared with PVP 10k. The average
particle size obtained ranged from 23(4), 25(4), 47(8) and 58(7) nm by conducting the
experiments at temperature 120, 130, 140 and to 150 °C, respectively. In the parenthesis,
the measured standard deviation of the particle population is reported, which evaluates the
particle size distribution span. Fig. 25 show the products (samples G4, G5 and G7)
obtained when PVP 40k was used. The particle sizes was 7(2), 79(15) and 104(20) nm for
temperatures of 130, 140 and 150 °C, respectively. The particle size distribution measured
from the TEM images are also reported as inset (Fig. 24 and Fig. 25).

2. Continuous Production of Tailored Silver Nanoparticles by Polyol Synthesis and Reaction Yield Measured by X-ray Absorption Spectroscopy: Towards a Growth Mechanism.
87
Tab. 4: Summary of the polyol synthesis of AgNPs in the SFTR. In the parenthesis is reported the measured standard deviation of the particle population.
aMean numerical diameter. In the parenthesis is reported the measured standard deviation of the
particle population.
Sample Temperature
(°C)
PVP Mw
(g∙mol-1)
TEM
size (nm)
Mean
diameter
(nm)a
G0 120 10k 23 (4) 14 (4)
G1 130 10k 25 (4) 20 (8)
G2 140 10k 47 (8) 33 (12)
G3 150 10k 58 (7) 56 (17)
G4 130 40k 7 (2) 9 (2)
G5 140 40k 79 (15) 107 (30)
G7 150 40k 104 (20) 123 (32)

2. Continuous Production of Tailored Silver Nanoparticles by Polyol Synthesis and Reaction Yield Measured by X-ray Absorption Spectroscopy: Towards a Growth Mechanism.
88
Fig. 24: AgNPs prepared with PVP 10k: (a) G0, (b) G1, (c) G2 and (d) G3.
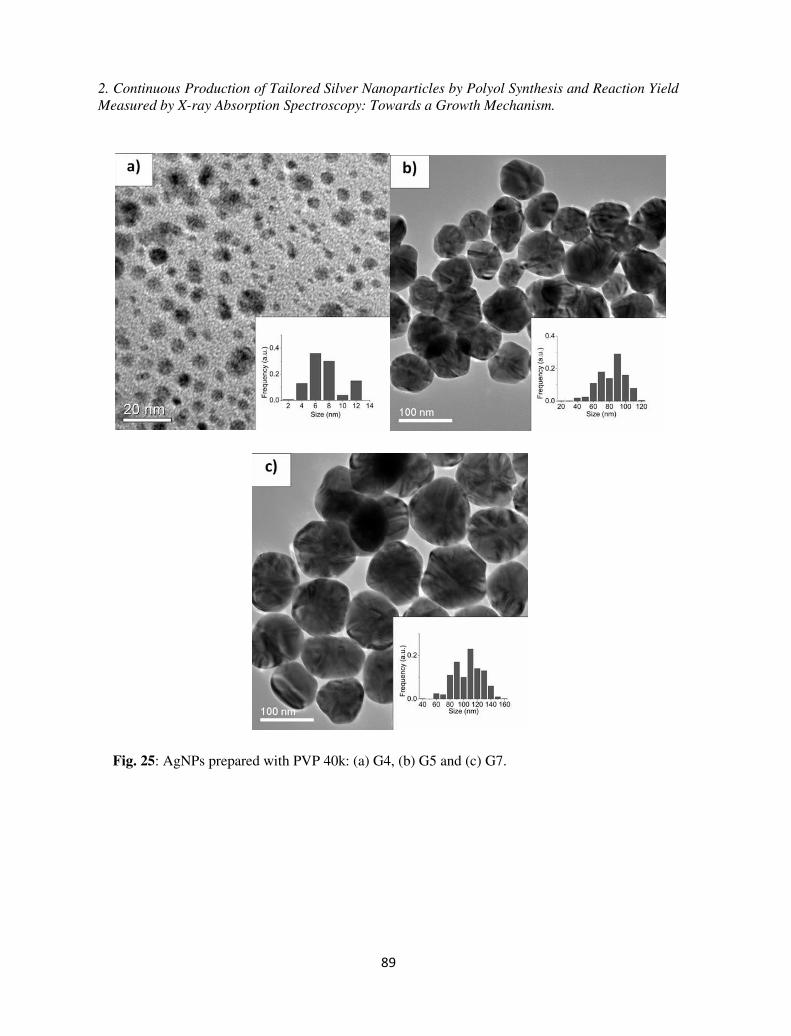
2. Continuous Production of Tailored Silver Nanoparticles by Polyol Synthesis and Reaction Yield Measured by X-ray Absorption Spectroscopy: Towards a Growth Mechanism.
89
Fig. 25: AgNPs prepared with PVP 40k: (a) G4, (b) G5 and (c) G7.

2. Continuous Production of Tailored Silver Nanoparticles by Polyol Synthesis and Reaction Yield Measured by X-ray Absorption Spectroscopy: Towards a Growth Mechanism.
90
After washing, the surface plasmon bands in the visible region were measured by UV-Vis
spectrometry. A batochromic shift of the major plasmon peak max from 402 to 453 nm was
observed as the average TEM diameter increases from 7 to 104 nm (Fig. 26 and Fig. 27).
This correlation is shown in Fig. 26. The position of max depends on the solvent used for
the measurements.57 The presence of a second broad plasmon peak for the sample with
particles of 23 nm diameter might be indicative for some occurring agglomeration,
although the DLS spectrum (Fig. 28) and TEM images did not provide substantial proof
for their existence. Nevertheless, particle agglomeration can be assumed, especially with
decreasing particle size due to enhanced attractive forces acting between them. The
shoulders evident on the UV-vis spectra of the sample G0 can also be explained either by
the occurrence of non-spherical shapes within the particle population e.g. oblate spheroids.
This effect is pronounced for small particle sizes, but vanishes at larger particle sizes due
to the larger particle size distribution.58
Fig. 26: UV-vis spectra of the AgNPs prepared with the SFTR.

2. Continuous Production of Tailored Silver Nanoparticles by Polyol Synthesis and Reaction Yield Measured by X-ray Absorption Spectroscopy: Towards a Growth Mechanism.
91
Fig. 27: Correlation of the mean particle diameter (measured with TEM) with the position of the absorption maxima in the UV-vis spectra.
Fig. 28: Particle size number distribution measured by DLS of the AgNPs prepared with the SFTR.
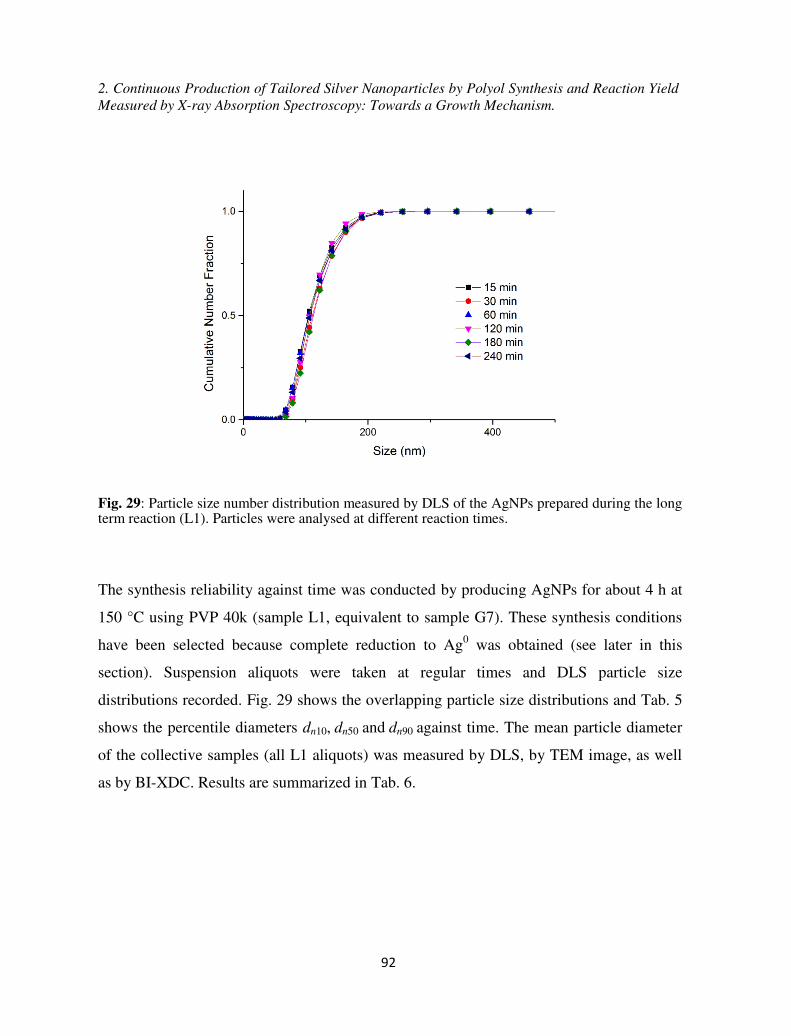
2. Continuous Production of Tailored Silver Nanoparticles by Polyol Synthesis and Reaction Yield Measured by X-ray Absorption Spectroscopy: Towards a Growth Mechanism.
92
Fig. 29: Particle size number distribution measured by DLS of the AgNPs prepared during the long term reaction (L1). Particles were analysed at different reaction times.
The synthesis reliability against time was conducted by producing AgNPs for about 4 h at
150 °C using PVP 40k (sample L1, equivalent to sample G7). These synthesis conditions
have been selected because complete reduction to Ag0 was obtained (see later in this
section). Suspension aliquots were taken at regular times and DLS particle size
distributions recorded. Fig. 29 shows the overlapping particle size distributions and Tab. 5
shows the percentile diameters dn10, dn50 and dn90 against time. The mean particle diameter
of the collective samples (all L1 aliquots) was measured by DLS, by TEM image, as well
as by BI-XDC. Results are summarized in Tab. 6.
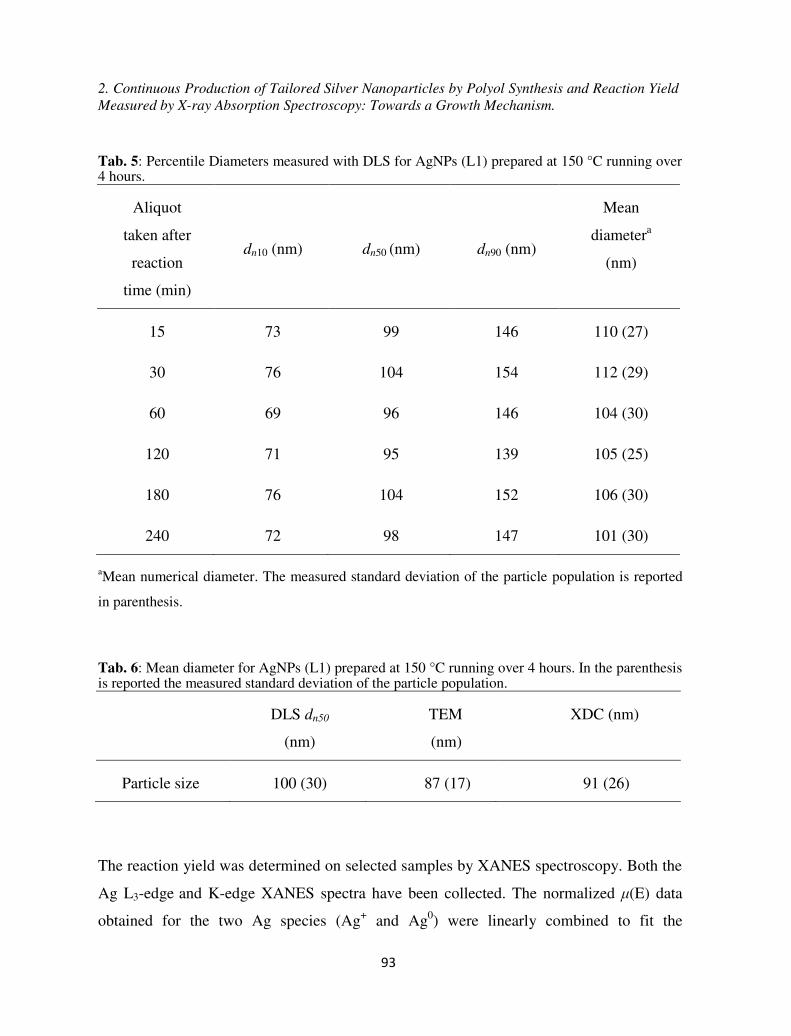
2. Continuous Production of Tailored Silver Nanoparticles by Polyol Synthesis and Reaction Yield Measured by X-ray Absorption Spectroscopy: Towards a Growth Mechanism.
93
Tab. 5: Percentile Diameters measured with DLS for AgNPs (L1) prepared at 150 °C running over 4 hours.
Aliquot
taken after
reaction
time (min)
dn10 (nm) dn50 (nm) dn90 (nm)
Mean
diametera
(nm)
15 73 99 146 110 (27)
30 76 104 154 112 (29)
60 69 96 146 104 (30)
120 71 95 139 105 (25)
180 76 104 152 106 (30)
240 72 98 147 101 (30)
aMean numerical diameter. The measured standard deviation of the particle population is reported
in parenthesis.
Tab. 6: Mean diameter for AgNPs (L1) prepared at 150 °C running over 4 hours. In the parenthesis is reported the measured standard deviation of the particle population.
DLS dn50
(nm)
TEM
(nm)
XDC (nm)
Particle size 100 (30) 87 (17) 91 (26)
The reaction yield was determined on selected samples by XANES spectroscopy. Both the
Ag L3-edge and K-edge XANES spectra have been collected. The normalized (E) data
obtained for the two Ag species (Ag+ and Ag0) were linearly combined to fit the

2. Continuous Production of Tailored Silver Nanoparticles by Polyol Synthesis and Reaction Yield Measured by X-ray Absorption Spectroscopy: Towards a Growth Mechanism.
94
normalized (E) data of selected samples using the Linear Combination Fitting (LCF)
method.49-52 The low energy of the Ag-L3 edge (3351 eV) allows reducing the radiation
damage on the samples during the measurements, but the interference from other edges
(i.e. Ag-L2 at 3524 eV) cannot be excluded, limiting the energy range in which the samples
can be measured. Moreover, the low energy of the Ag-L3 edge challenges the measurement
from the point of view of the experimental set-up and materials needed for the optical
windows. For these reasons, on selected samples, Ag-K edge (25514 eV) XANES spectra
have been collected as well. In this case, because of the higher energy used, the beam
damage is more probable, but the measurement can be much faster and the experimental
setup as simple as a standard glass capillary.
The percentage of Ag+ and Ag0, the corresponding errors, the goodness-of-fit (R-factor, i.e.
a measure of mean square sum of the misfit at each data point), the calculated yield, and
the gravimetric yield, which was measured by weighting the collected product after 3
consecutive washing and centrifugation cycles, is reported in Tab. 7. The reported
incertitude on the measurement is obtained from the ATHENA software and refers to the
error on the LCF. Sample G7 and L1 are completely converted to Ag0 and the fitting is
actually not necessary because their XANES spectra overlap the Ag metal standard. It is
worth noting that the incertitude of the measurement technique has to be experimentally
evaluated by ad-hoc trials. For the time being, based on our experience and the literature59-
61, the measurement incertitude can be estimate below 3 %.
As example, Fig. 30 reports the normalized of Ag L3-edge and K-edge XANES spectra for
the sample G3 and G4, respectively. The goodness-of-fit can also be seen from the little
difference (plotted as green line) between the experimental and LC fitted data.
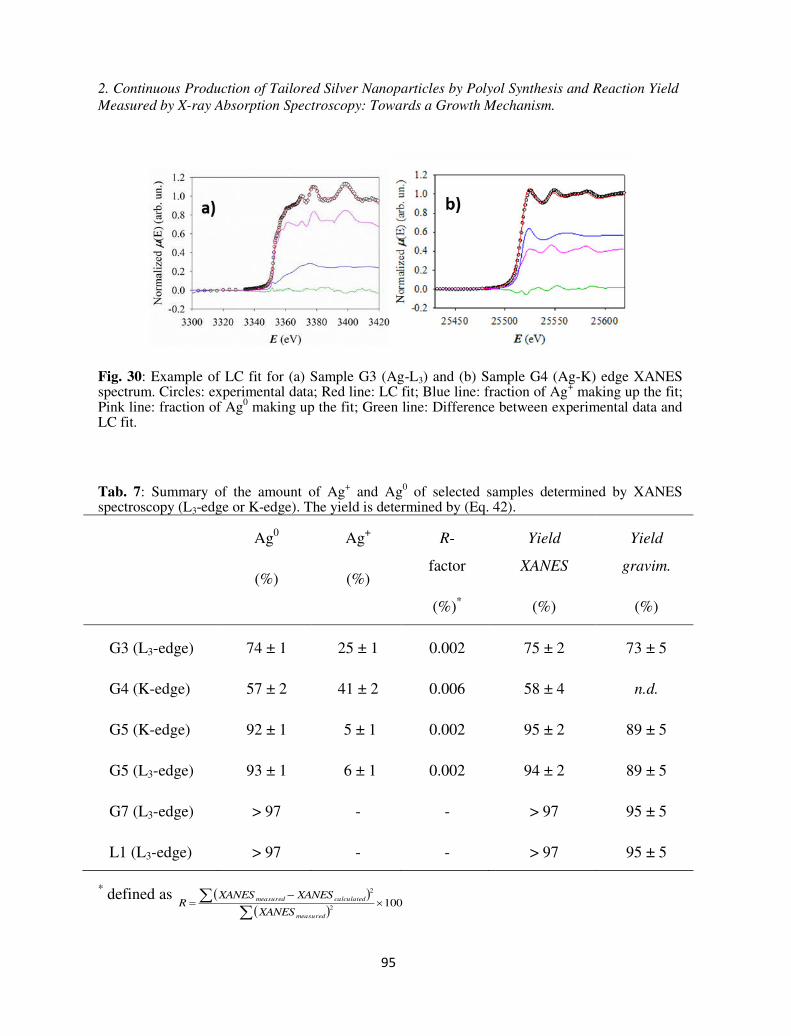
2. Continuous Production of Tailored Silver Nanoparticles by Polyol Synthesis and Reaction Yield Measured by X-ray Absorption Spectroscopy: Towards a Growth Mechanism.
95
Fig. 30: Example of LC fit for (a) Sample G3 (Ag-L3) and (b) Sample G4 (Ag-K) edge XANES spectrum. Circles: experimental data; Red line: LC fit; Blue line: fraction of Ag+ making up the fit; Pink line: fraction of Ag0 making up the fit; Green line: Difference between experimental data and LC fit.
Tab. 7: Summary of the amount of Ag+ and Ag0 of selected samples determined by XANES spectroscopy (L3-edge or K-edge). The yield is determined by (Eq. 42).
Ag0
(%)
Ag+
(%)
R-
factor
(%)*
Yield
XANES
(%)
Yield
gravim.
(%)
G3 (L3-edge)
G4 (K-edge)
G5 (K-edge)
G5 (L3-edge)
G7 (L3-edge)
L1 (L3-edge)
74 ± 1
57 ± 2
92 ± 1
93 ± 1
> 97
> 97
25 ± 1
41 ± 2
5 ± 1
6 ± 1
-
-
0.002
0.006
0.002
0.002
-
-
75 ± 2
58 ± 4
95 ± 2
94 ± 2
> 97
> 97
73 ± 5
n.d.
89 ± 5
89 ± 5
95 ± 5
95 ± 5
* defined as
1002
2
measured
calculatedmeasured
XANES
XANESXANESR

2. Continuous Production of Tailored Silver Nanoparticles by Polyol Synthesis and Reaction Yield Measured by X-ray Absorption Spectroscopy: Towards a Growth Mechanism.
96
Tab. 7 reports the yield measured by the gravimetric method. In this case the product needs
to be washed and retrieved by centrifuging for at least three times. This procedure was not
possible for sample G4 because of the small particle size. The gravimetric yields are in
good agreement with the XANES values, considering that a fraction of NPs can be lost
during the washing and centrifugation treatments.
The purity of selected solid samples, after centrifugation, washing, and drying were
analyzed by ICP-MS and TGA. The chemical analysis carried out on samples G3 and G7
showed no relevant contaminants (Fe 20 ppm; Na 5 ppm; Ni, Zn, Mo 2 ppm) and the
Ag content were about 90 % and 97 %, respectively. These results are coherent with the
TGA experiments which show that the weight loss against temperature (Fig. 31) may be
attributed to organic residuals on the particle surface. The organics are completely burned
out at about 280 C for samples L1 and G7. Sample G3 shows a different behaviour with a
clear two-step weight loss. The reason of the second weight loss, which is completed at
500 C, is under investigation, but could be ascribed to the lower molecular weight of PVP
used in the synthesis.
A subsequent thermal treatment under reducing conditions (5 % H2, balance Ar) up to 500
C (not shown) was performed. The absence of weight changes confirm that the samples
were not oxidized due to the thermal treatment carried out in air.

2. Continuous Production of Tailored Silver Nanoparticles by Polyol Synthesis and Reaction Yield Measured by X-ray Absorption Spectroscopy: Towards a Growth Mechanism.
97
Fig. 31: TGA measurements conducted on the recovered powders from samples G3, G7 and L1.
High resolution XRD patterns on powders where collected on selected samples (G3, G4,
G5, G7). As example, Fig. 32 shows the powder diffraction pattern for sample G7. Organic
residues, in agreement with the TGA experiments, gave a relevant background
contribution. The best fit obtained by Rietveld refinement suggests the presence of two
populations of crystallites of about 10 nm and 80 nm. The calculated crystallite size is
smaller than the TEM particle size but in agreement with the multi-domain substructure of
the particles (Fig. 24 and Fig. 25). The diffraction patterns do not show any crystalline
secondary phases. Fig. 32 shows the diffraction patterns collected on the as prepared
suspensions (G3, G4, G5) as well. In these cases, the peak broadening is a complex
convolution of particle size and the liquid suspension thickness under analysis but the
collected patterns show good signal-to-noise ratio. It can be seen that sample G4 has no
diffraction peaks because the particles are both small (7 nm) and few (low conversion
yield), while G3 and G5 (and G7, not showed) gave excellent signals. Again, no secondary
phases were detected.

2. Continuous Production of Tailored Silver Nanoparticles by Polyol Synthesis and Reaction Yield Measured by X-ray Absorption Spectroscopy: Towards a Growth Mechanism.
98
Fig. 32: Diffraction patterns collected on powder (G7) or on the as prepared suspension (G3, G4, G5) after background subtraction.
2.4. Discussion
Due to the evident colour change during the reaction progress (due the surface plasmon
effect which strongly dependents on the Ag0 particle size), the drop-to-drop homogeneity
can be easily verified along the tubular reactor. The constant and reproducible colour of the
droplets is a clear demonstration of the system stability. However, in some cases, for
instance when a small gas bubble was dosed by one pump at the beginning of an
experimental trial, a droplet of different colour was immediately recognized in the tube due
the chemical difference of that droplet with respect to the neighbours’ droplets.
The powders produced over 4 h shows constant particle size distribution, demonstrating
that the preparation of AgNPs can be extended for a long production time with constant
product properties.

2. Continuous Production of Tailored Silver Nanoparticles by Polyol Synthesis and Reaction Yield Measured by X-ray Absorption Spectroscopy: Towards a Growth Mechanism.
99
Thermogravimetric measurements and chemical analysis gave coherent results: the product
consists of pure Ag and organic residues (about 3 wt%), most probably PVP on the
particles surface. The organic residues are burned out at about 250 C. The overall metallic
contaminants concentration is below 50 ppm.
The particle size distributions of the produced samples were measured by several
techniques and a general good agreement among the measurements were demonstrated.
We can conclude that the most convenient method is DLS because (i) limited amount of
product is needed, (ii) it is fast and (iii) inexpensive, and (iv) reliable results are obtained.
The major drawback is that DLS is an offline method. Nevertheless, the correlation
between TEM size and UV-Vis spectroscopy (Fig. 27) open the possibility to monitor
particle size on-line using UV-Vis spectroscopy.
The AgNPS conversion yield was measured from XANES spectra using both K and L3-
edges, giving comparable results (Sample G5, Tab. 4). The higher energy of the K-edge
greatly simplifies the experimental set-up and the feasibility of the direct measurement of
the reaction yield on the suspension was demonstrated (Fig. 30). Similarly, X-ray
diffraction patterns of the powder may be efficiently measured from the suspension with a
liquid sample holder cell, as demonstrated in Fig. 32. It turns out that these investigations
may be carried out directly on the as prepared suspension, ideally in situ in the SFTR
reactor. In principle, the most relevant particle formation parameters such as primary
particle size by XRD (the crystallite size), secondary particle size by UV-vis spectroscopy
(thanks to correlation with the TEM size) the particles, and conversion yield by XANES
might be studied in situ and time-resolved, allowing the detailed kinetic study of particle
formation.
As shown in Tab. 4, average particle diameter can be tuned by changing the reaction
temperature and the PVP average molecular weight. The effect of the temperature has also
a relevant influence on the conversion yield and size: higher temperatures gave higher
yields and bigger particle sizes. Moreover, the particle size distribution span remains

2. Continuous Production of Tailored Silver Nanoparticles by Polyol Synthesis and Reaction Yield Measured by X-ray Absorption Spectroscopy: Towards a Growth Mechanism.
100
almost unchanged against yield. Such behaviour may be explained by a two stage process
where nucleation and growth occur on two different times scales. It is plausible to consider
that particle nucleation occurs only in a limited time frame at the beginning of the
precipitation – which visually corresponds to the time frame from colourless solution to
pale yellow suspension – producing a defined number of small particles. Then, this
population of particles grow over time, consuming Ag+ ions, confirming that reduction to
Ag0 occurs. The reducing agent is the in situ generated glycolaldehyde formed by
oxidation of EG at elevated temperatures. It should be mentioned here that this oxidation
process is strongly accelerated by the temperature.62 For this reason, at 130 C and 12 min
of reaction time, the conversion yield is very low while at 150 C the reaction is
quantitative for the same reaction time.
Nucleation could be controlled by PVP.63 This hypothesis is supported by the fact that (i)
tests carried out without PVP led to no precipitation of AgNPs at all, (ii) it is known that
PVP acts both as stabilizer and reductant,64 and (iii) the particle size decreases with PVP
molecular weight. Commercially available PVP are commonly terminated with hydroxyl
(-OH) end-groups65. These terminal groups act as reducing agent: keeping constant the
ratio between polymer repetition unit and silver, the number of terminal groups increases
for shorter polymer backbone, i.e., PVP 10k has more hydroxyl groups compared to PVP
40k. Thus, provided that the particles can grow (i.e., the temperature is high enough), PVP
10k can produce more nuclei, (i.e., smaller particles) than PVP 40k.
We conclude that our experimental results are coherent with a two sub-sequent steps: (i)
nucleation, which is controlled by the amount of PVP terminal groups and (ii) particle
growth, which is tuned by the temperature through its influence on the EG reduction
potential. In order to consolidate these findings, a detailed experimental trial on
precipitation kinetics is currently in progress.

2. Continuous Production of Tailored Silver Nanoparticles by Polyol Synthesis and Reaction Yield Measured by X-ray Absorption Spectroscopy: Towards a Growth Mechanism.
101
2.5. Conclusions
A novel method to prepare AgNPs in a continuous way has been presented. Here, the
segmented flow kept in the reactor provides optimization beyond to state-of-the-art of
continuous synthesis methods by creating more homogenous reaction conditions. The
variation of the reaction temperature and the average molecular weight of the PVP lead to
the systematic change in the average particle sizes and reaction yield. Our experimental
data suggest that PVP is controlling the nucleation step while particle growth is tuned by
the temperature through its influence on the EG reduction potential.
Particle size and reaction yield data have been combined in order to outline a rational
(nucleation and growth) formation path. The method to measure the reaction yield was one
of the most relevant achievements of this experimental work. Yield was measured directly
in the produced particle suspension by linear fit of XANES spectra. Synchrotron-light
diffraction patterns were also collected from the suspension. Moreover, a clear correlation
between TEM size and the major plasmon peak of the UV-Vis spectra has been identified.
We have demonstrated that key parameters such as primary particle size, secondary
particle size, and conversion yield may be investigated in situ and time-resolved. Thus, a
comprehensive particle formation mechanism can be investigated.
Finally, the potential of the SFTR to prepare high amounts of AgNPs over a long period
was demonstrated by running the reaction for 4 h, obtaining constant particle size
distribution with production rate > 2 g∙h-1.
2.6 Acknowledgements
We gratefully acknowledge the Swiss National Science Foundation, the Swiss Federal
Laboratories for Materials Science and Technology (Empa, Dübendorf) and Paul-Scherrer
Institut (Villigen) for providing financial support and infrastructure for our research. We

2. Continuous Production of Tailored Silver Nanoparticles by Polyol Synthesis and Reaction Yield Measured by X-ray Absorption Spectroscopy: Towards a Growth Mechanism.
102
thank Dr. Luca Quaroni, Dr. Antonio Cervellino, Dr. Mohammed Tarik, and Mr. Albert
Schuler for their contribution to the sample characterization. The XRD and FTIR data were
collected at the X01DC and X04SA-MS beamlines of the Swiss Light Source (PSI).
2.7 References
(1) Evanoff, D. D. Jr.; Chumanov, G. Synthesis and Optical Properties of Silver
Nanoparticles and Arrays. ChemPhysChem 2005, 6, 1221.
(2) Rycenga, M.; Cobley, C. M.; Zeng, J.; Li, W.; Moran, C. H.; Zhang, Q.; D. Qin, D.;
Xia, Y. Controlling the Synthesis and Assembly of Silver Nanostructures for Plasmonic
Applications. Chem. Rev. 2011, 111, 3669-3712.
(3) Cobley, C. M.; Skrabalak, S. E.; Campbell, D. J.; Xia, Y. Shape-Controlled Synthesis
of Silver Nanoparticles for Plasmonics and Sensing Applications. Plasmonics 2009, 4,
171-179.
(4) McFarland, A. D.; Van Duyne, R. P. Single Silver Nanoparticles as Real-Time Optical
Sensors with Zeptomole Sensitivity. Nano Lett. 2003, 3, 1057-1062.
(5) Lee, K. –Y.; El-Sayed, M. A. Gold and Silver Nanoparticles in Sensing and Imaging:
Sensitivity of Plasmon Response to Size, Shape and Metal Composition. J. Phys. Chem B
2006, 110, 19220-19225.
(6) Gittins, D. I.; Bethell, D.; Schiffrin, D. J.; Nichols, R. J. A Nanometre-Scale
Electronics Switch Consisting of a Metal Cluster and Redox Addressable Groups. Nature
2000, 408, 67-69.
(7) Atwater, H. A.; Polman, A. Plasmonics for Improved Photovoltaic Devices. Nat. Mat.
2010, 9, 205-213.

2. Continuous Production of Tailored Silver Nanoparticles by Polyol Synthesis and Reaction Yield Measured by X-ray Absorption Spectroscopy: Towards a Growth Mechanism.
103
(8) Crooks, R. M.; Zhao, M.; Sun, L.; Chechik, V.; Yeung, L. K. Dendrimer-Encapsulated
Metal Nanoparticles: Synthesis, Characterization, Applications to Catalysis. Acc. Chem.
Res. 2001, 34, 181-190.
(9) Lee, H. –H.; Chou, K. –S.; Huang, K. –C. Inkjet Printing of Nanosized Silver
Colloids. Nanotechnology 2005, 16, 2436-2441.
(10) Kim, D.; Jeong, S.; Lee, S.; Park, B. K.; Moon, J. Organic Thin Film Transistor
Using Silver Electrodes by the Ink-Jet Printing Technology. Thin Solid Films 2007, 515,
7692-7696.
(11) Balantrapu, K.; Goia, D. Silver Nanoparticles for Printable Electronics and Biological
Applications. J. Mat. Res. 2009, 24, 2828-2836.
(12) Balantrapu, K.; McMurran, M.; Goia, D. Inkjet Printable Silver Dispersions: Effect of
Bi-modal Particle Size Distribution on Film Formation and Electrical Conductivity. J. Mat.
Res. 2010, 25, 821-827.
(13) Yin, W.; Lee, D. –H.; Choi, J.; Park, C.; Cho, S. M. Screen Printing of Silver
Nanoparticle Suspension for Metal Interconnects. Kor. J. Chem. Eng. 2008, 25, 1358-
1361.
(14) Jakubowska, M.; Jarosz, M.; Kielbasinski, K.; Mlozniak, A. New Conductive Thick-
Film Paste Based on Silver Nanopowder for High Power and High Temperature
Applications. Microelectron. Reliab. 2011, 51, 1235-1240.
(15) Suganuma, K.; Sakamoto, S.; Kagami, N.; Wakuda, D.; Kim, K. –S.; Nogi, M. Low-
Temperature Low-Pressure Die Attach with Hybrid Silver Particle Paste. Microelectron.
Reliab. 2012, 52, 375-380.
(16) Kisiel, R.; Szczepanski, Z. Die-Attachment Solutions for SiC Power Devices.
Microrelectron. Reliab. 2009, 49, 627-629.

2. Continuous Production of Tailored Silver Nanoparticles by Polyol Synthesis and Reaction Yield Measured by X-ray Absorption Spectroscopy: Towards a Growth Mechanism.
104
(17) Hu, A.; Guo, J. Y.; Alarifi, H.; Patane, G.; Zhou, Y.; Compagnini, G.; Xu, C. X. Low
Temperature Sintering of Ag Nanoparticles for Flexible Electronics Packaging. Appl. Phys.
Lett. 2010, 97, 153117-3.
(18) Qi, L.; Lee, B. I.; Chen, S.; Samuels, W. D.; Exarhos, G. J. High-Dielectric-Constant
Silver-Epoxy Composites as Embedded Dielectrics. Adv. Mater. 2005, 17, 1777-1781.
(19) Rajesh, S.; Sonoda, K.; Uusimäki, A.; Yang, K. H.; Lu, H. Y.; Jantunen, H. Effective
Dielectric Response of Polymer Composites with Ceramic Coated Silver Flakes J. Mater.
Sci.: Mater. Electron 2013, 24, 191-195.
(20) Wiley, B.; Sun, Y.; Mayers, B.; Xia, Y. Shape-Controlled Synthesis of Metal
Nanostructures. Chem. Eur. J. 2005, 11, 454-463.
(21) Wiley, B.; Sun, Y.; Xia, Y. Synthesis of Silver Nanostructures with Controlled
Shapes and Properties. Acc. Chem. Res. 2007, 40, 1067-1076.
(22) Xiong, Y.; Siekkinen, A. R.; Wang, J.; Yin, Y.; Kim, M. J.; Xia, Y. Synthesis of
Silver Nanoplates at High Yields by Slowing Down the Polyol Reduction of Silver Nitrate
with Polyacrylamide. J. Mater. Chem. 2007, 17, 2600-2602.
(23) Hu, Y.; Ge, J.; Lim, D.; Zhang, T.; Yin, Y. Size-Controlled Synthesis of Highly
Water-Soluble Silver Nanocrystals. Solid State Chem. 2008, 181, 1524-1529.
(24) Silvert, P. –Y.; Herrera-Urbina, R.; Duvauchelle, N.; Vijayakrishnan, V.; Elhsissen,
K. T. Preparation of Colloidal Silver Dispersions by the Polyol Process. J. Mater. Chem.
1996, 6, 573-577.
(25) Kim, D.; Jeong, S.; Moon, J. Synthesis of Silver Nanoparticles Using the Polyol
Process and the Influence of Precursor Injection. Nanotechnology 2006, 17, 4019-4024.

2. Continuous Production of Tailored Silver Nanoparticles by Polyol Synthesis and Reaction Yield Measured by X-ray Absorption Spectroscopy: Towards a Growth Mechanism.
105
(26) Shin, H. S.; Yang, H. J.; Kim, S. B.; Lee, M. S. Mechanism of Growth of Colloidal
Silver Nanoparticles Stabilized by Polyvinyl Pyrrolidinone in γ-Irradiated Silver Nitrate
Solution. Colloid Interface Sci. 2004, 274, 89-94.
(27) Tsuji, M.; Nishizawa, Y.; Matsumoto, K.; Kubokawa, M.; Miyamae, N.; Tsuji, T.
Effects of Chain Length of Polyvinyl Pyrrolidinone for the Synthesis of Silver
Nanostructures by a Microwave-Polyol Method. Mater. Lett. 2006, 60, 834-838.
(28) Sun, Y.; Xia, Y. Shape-Controlled Synthesis of Gold and Silver Nanoparticles.
Science 2002, 298, 2176-2179.
(29) Zhao, T.; Sun, R.; Yu, S.; Zhang, Z.; Zhou, L.; Huang, H.; Du, R. Size-Controlled
Preparation of Silver Nanoparticles by a Modified Polyol Method. Colloids and Surfaces
A: Physicochem. Eng. Aspects 2010, 366, 197-202.
(30) Washio, I.; Xiong, Y.; Yin, Y.; Xia, Y. Reduction by the End-Groups of Poly(vinyl
pyrrolidinone): A New and Versatile Route to the Kinetically Controlled Synthesis of Ag
Triangular Nanoplates. Adv. Mater. 2006, 18, 1745-1749.
(31) Xiong, Y.; Siekkinen, A. R.; Wang, J.; Yin, Y.; Kim, M. J.; Xia, Y. Synthesis of
Silver Nanoplates at High Yields by Slowing Down the Polyol Reduction of Silver Nitrate
with Polyacrylamide. J. Mater. Chem. 2007, 17, 2600-2602.
(32) Sun, Y.; Mayers, B.; Herricks, T.; Xia, Y. Polyol Synthesis of Uniform Silver
Nanowires: A Plausible Growth Mechanism and Supporting Evidence. Nano Lett. 2003, 3,
955-960.
(33) Siekkinen, A. R.; McLellan, J. M.; Chen, J.; Xia, Y. Rapid Synthesis of Small
Nanocubes by Mediating Polyol Reduction with a Trace Amount of Sodium Sulfide or
Sodium Hydrosulfide. Chem. Phys. Lett. 2006, 432, 491-496.

2. Continuous Production of Tailored Silver Nanoparticles by Polyol Synthesis and Reaction Yield Measured by X-ray Absorption Spectroscopy: Towards a Growth Mechanism.
106
(34) Yen, B. K. H.; Stott, N. E.; Jensen, K. F.; Bawenchi, M. G. A Continuous-Flow
Microcapillary Reactor for the Preparation of a Size Series of CdSe Nanocrystals. Adv.
Mater. 2003, 15, 1858-1862.
(35) Yan, J.; Zou, G.; Wang, X.; Bai, H.; Mu, F.; Wu, A. In A Study on the Low
Temperature Sintering-Bonding Through In-situ Formation of Ag Nanoparticles Using
Ag2O Microparticles. Proceedings of the International Conference on Electronic Packaging
Technology and High Density Packaging, 12th, Shanghai, China, Aug. 8-11.
(36) Silvestrini, S.; Carofiglio, T.; Maggini, M. Shape-Selective Growth of Silver
Nanoparticles under Continuous Flow Photochemical Conditions. Chem. Comm. 2013, 49,
84-86.
(37) He, S. T.; Liu, Y. L.; Maeda, H. Controlled Synthesis of Colloidal Silver
Nanoparticles in Capillary Micro-Flow Reactor. J. Nanopart. Res. 2008, 10, 209-215.
(38) Nishioka, M.; Miyakawa, M.; Kataoka, H.; Koda, H.; Sato, K.; Suzuki, T. M.
Continuous Synthesis of Monodispersed Silver Nanoparticles Using a Homogenous
Heating Microwave Reactor System. Nanoscale 2011, 3, 2621-2626.
(39) Huang, J.; Lin, L.; Li, Q.; Sun, D.; Wang, Y.; Lu, Y.; He, N.; Yang, K.; Yang, X.;
Wang, H.; Wang, W.; Lin, W. Continuous-Flow Biosynthesis of Silver Nanoparticles by
Lixivium of Sundried Cinnamomum Camphora Leaf in Tubular Microreactors. Ind. Eng.
Chem. Res. 2008, 47, 6081-6090.
(40) Lin, X. Z.; Terepka, A. D.; Yang, H. Synthesis of Silver Nanoparticles in a
Continuous Flow Tubular Reactor. Nano Lett. 2004, 4, 2227-2232.
(41) Jongen, N.; Donnet, M.; Bowen, P.; Lemaitre, J.; Hofmann, H.; Schenk, R.; Hofmann,
C.; Aoun-Habbache, M.; Guillermet-Fritsch, S.; Sarrias, J. et al. Development of a
Continuous Segmented Flow Tubular Reactor and the “Scale-out” Concept – In Search of
Perfect Powders. Chem. Eng. Techn. 2003, 26, 303-305.

2. Continuous Production of Tailored Silver Nanoparticles by Polyol Synthesis and Reaction Yield Measured by X-ray Absorption Spectroscopy: Towards a Growth Mechanism.
107
(42) Aimable, A.; Jongen, N.; Testino, A.; Donnet, M.; Lemaitre, J.; Hofmann, H.; Bowen,
P. Precipitation of Nanosized and Nanostructured Powders: Process Intensification Using
SFTR, Applied to BaTiO3, CaCO3 and ZnO. Chem. Eng. Tech. 2011, 34, 344-352.
(43) Lucchini, M. A.; Testino, A.; Ludwig, C.; Kambolis, A.; El-Kazzi, M.; Cervellino, A.;
Riani, P.; Canepa, F. Continuous Synthesis of Nickel Nanopowders: Characterization,
Process Optimization, and Catalytic Properties”, Appl. Cat., B, 2014, accepted.
(44) Testino, A. Aqueous Synthesis of BaTiO3 Nanopowders. Experiments and Kinetic
Modelling. Ph.D. dissertation, University of Genoa, 2004.
(45) Kashid, M. N.; Agar, W. D. Hydrodynamics of Liquid-Liquid Slug Flow Capillary
Microreactor: Flow Regimes, Slug Size and Pressure Drop. Chem. Eng. J. 2007, 131, 1-13.
(46) Wiley, B. J.; Im, S. H.; Li, Z. Y.; McLellan, J.; Siekkinen, A.; Xia, Y. Maneuvering
the Surface Plasmon Resonance of Silver Nanostructures Through Shape-Controlled
Synthesis. J. Phys. Chem. B 2006, 110, 15666-15675.
(47) Willmott, P. R.; Meister, D.; Leake, S. J.; Lange, M.; Bergamaschi, A.; Böge, M.;
Calvi, M.; Cancellieri, C.; Casati, N.; Cervellino, A. et al. The Material Science Beamline
Upgrade at the Swiss Light Source. J. Synchrotron Rad. 2013, 20, 667-682.
(48) A. C. Larson, R. B. Von Dreele, General Structure Analysis System (GSAS),
Technical Report LAUR 86-748; Los Alamos National Laboratory: New Mexico, 2000.
(49) Inorganic Crystal Structure Database (ICSD), Fachinformationsezentrum Karlsruhe
and Gemlin Institute, Karlsruhe 1997: Ni # 41508.
(50) GSAS Manual (http://www.ccp14.ac.uk/solution/gsas/).
(51) Rouff, A. A.; Rabe, S.; Nachtegaal, M.; Vogel, F. X-Ray Absorption Fine Structure
Study of the Effect of Protonation on Disorder and Multiple Scattering in Phosphate
Solutions and Solids. J. Phys. Chem. A 2009, 113 (25), 6895-6903.
2. Continuous Production of Tailored Silver Nanoparticles by Polyol Synthesis and Reaction Yield Measured by X-ray Absorption Spectroscopy: Towards a Growth Mechanism.
108
(52) Ajiboye, B.; Akinremi, O.; Jurgensen, A. Experimental Validation of Quantitative
XANES Analysis for Phosphorous Speciation. Soil. Sci. Soc. Am. 2007, 71, 1288-1291.
(53) Berry, A. J.; Hack, A.C.; Mavrogenes, J. A.; Newville, M.; Sutton, S.R. A XANES
Study of Cu Speciation in High-Temperature Brines Using Synthetic Fluid Inclusions. Am.
Mineral. 2006, 91, 1773-1782.
(54) Takaoka, M.; Yamamoto, T.; Shiono, A.; Takeda, N.; Oshita, K.; Matsumoto, T.;
Tanaka, T. The Effect of Copper Speciation on the Formation of Chlorinated Aromatics on
Real Municipal Solid Waste Incinerator Fly Ash. Chemosphere 2005, 59, 1497-1503.
(55) Kretschmer, X. C.; Meitzner, G.; Gardea, J. L.; Webb, R. Determination of Cu
Environments in the Cyanobacterium Anabaena Flos-Aquae by X-Ray Absorption
Spectroscopy. Appl. and Environ. Microbiol. 2004, 70, 771-780.
(56) Ravel, B.; Newville, M. Athena, Artemis, Hephaestus: Data Analysis for X-Ray
Absorption Spectroscopy Using IFEFFIT. J. Synchrotron Rad. 2005, 12, 537-541.
(57) Slistan-Grijalva, A.; Herrera-Urbina, R.; Rivas-Silva, J. F.; Avalos-Borja, M.;
Castillon-Barraza, F. F.; Posada-Amarillas, A. Classical Theoretical Characterization of the
Surface Plasmon Absorption Band for Silver Spherical Nanoparticles Suspended in Water
and Ethylene Glycol. Physica 2005, 27, 104-112.
(58) Lance Kelly, K.; Coronado; E. Zhao, L. L.; Schatz, G. C. The Optical Properties of
Metal Nanoparticles: The Influence of Size, Shape and Dielectric Environment. J. Phys.
Chem. B. 2003, 107 (3), 668-677.
(59) Huang, Y. –J.; Paul Wang, H.; Hsiao, M. C.; Tai, C. C.; Huang, H.–L.; Liu, S. H.
Speciation of Copper in Micropores. Water, Air, and Soil Pollution 2004, 153, 187–194.
(60) Arcon, I.; Kolar, J.; Kodre, A.; Hanzel, D.; Strlic, M. XANES Analysis of Fe Valence
in Iron Gall Inks. X-Ray Spectrom. 2007, 36, 199–205

2. Continuous Production of Tailored Silver Nanoparticles by Polyol Synthesis and Reaction Yield Measured by X-ray Absorption Spectroscopy: Towards a Growth Mechanism.
109
(61) Dœlsch, E.; Basile-Dœlsch, I.; Rose, J.; Masion, A.; Borschneck, D.; Hazemann, J.-
L.; Saint Macary, H., Bottero, J.-Y. New Combination of EXAFS Spectroscopy and
Density Fractionation for the Speciation of Chromium Within an Andosol. Environ. Sci.
Technol. 2006, 40, 7602-7608
(62) Skrabalak, S. E.; Wiley, B. J.; Kim, M.; Formo, E.; Xia, Y. On the Polyol Synthesis
of Silver Nanostructures: Glycoaldehyde as a Reducing Agent. Nano Lett. 2008, 8, 2077-
2081.
(63) Yun, H.; Lee, I. –M.; Im, S. H.; Lee, S. –Y.; Lee, B. Site-Selective Synthesis of Silver
Nanoparticles in Pre-Patterned Trenches and their Localized Surface Plasmon Resonances.
Nanotechnology 2012, 23, 015306.
(64) Tao, A. R.; Habas, S.; Yang, P. Shape Control of Colloidal Metal Nanocrystals. Small
2008, 4, 310-325
(65) Xiong, Y.; Washio, I.; Chen, J.; Cai, H.; Li, Z. –Y.; Xia, Y. Poly(vinyl pyrrolidinone):
A Dual Functional Reductant and Stabilizer for the Facile Synthesis of Noble Metal
Nanoplates in Aqueous Solutions. Langmuir 2006, 22, 8563-8570.

2. Continuous Production of Tailored Silver Nanoparticles by Polyol Synthesis and Reaction Yield Measured by X-ray Absorption Spectroscopy: Towards a Growth Mechanism.
110
2.8 Supporting information
Experimental Part
Three different batch reactions were performed at 150 °C with different reaction volumes
(Tab. 8). Briefly, PVP 40 (Mw = 40’000 g/mol) was dissolved in ethylene glycol (EG)
under sonication. Thereafter, AgNO3 solution in EG was added, the resulting mixture
stirred at 25 °C for a minute before placing the reaction vessel into a preheated oil bath
(150 °C). The reaction mixture was stirred for 1 h where color changes were observed
(from yellow to olive). Then, the vessel was cooled in a water bath, the mixture diluted
with acetone, centrifuged, decanted and further washed thrice with an EtOH/acetone
mixture before redispersion in EtOH for further analysis. The yield of the reaction was
determined by measuring the collected powder after washing and centrifugation followed
by drying in vacuo.
Tab. 8: Different batch reactions with constant AgNO3/PVP ratio performed at 150 °C. The reaction volume was varied for each reaction by a factor of 10.
Entry m(AgNO3)/g m(PVP)/g V(EG)/mL Yield (%)
Ag_1 0.02 0.12 1 72 ± 5
Ag_2 0.2 1.2 10 72 ± 5
Ag_3 2 12 100 68 ± 5
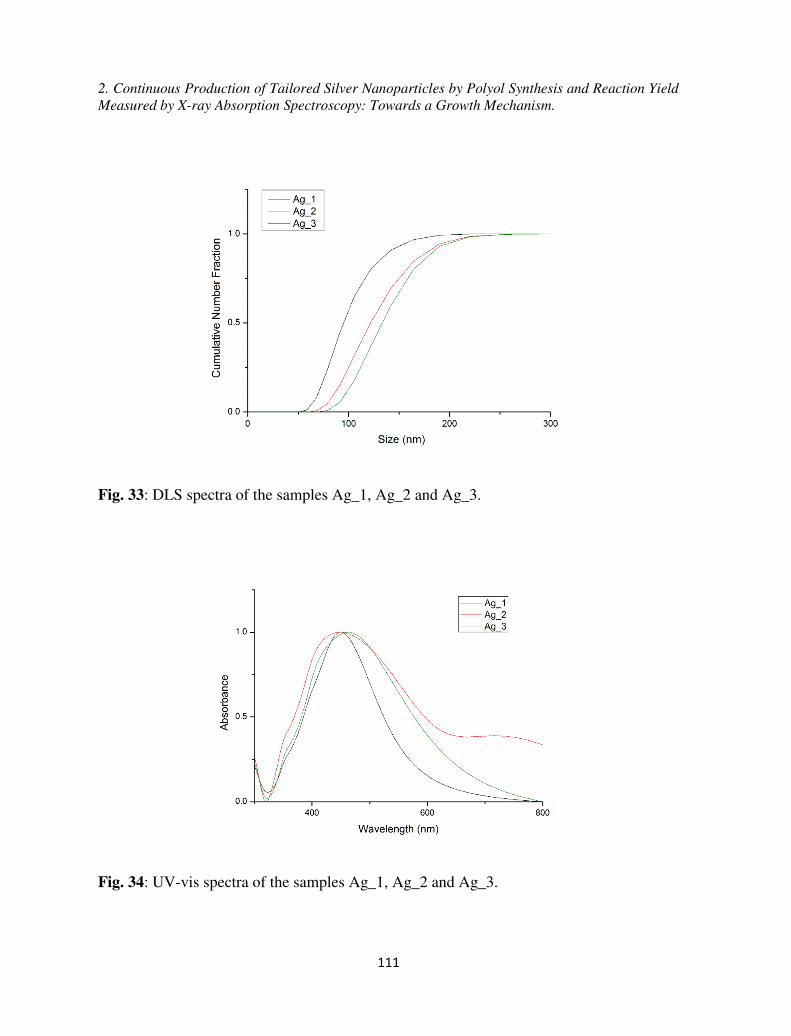
2. Continuous Production of Tailored Silver Nanoparticles by Polyol Synthesis and Reaction Yield Measured by X-ray Absorption Spectroscopy: Towards a Growth Mechanism.
111
Fig. 33: DLS spectra of the samples Ag_1, Ag_2 and Ag_3.
Fig. 34: UV-vis spectra of the samples Ag_1, Ag_2 and Ag_3.

2. Continuous Production of Tailored Silver Nanoparticles by Polyol Synthesis and Reaction Yield Measured by X-ray Absorption Spectroscopy: Towards a Growth Mechanism.
112
Tab. 9: Percentile and mean diameters of the samples Ag_1, Ag_2 and Ag_3.
Entry dn10
(nm)a dn50
(nm)a dn90
(nm)a
Mean diameter
(nm)a
TEM size (nm)
Ag_1 66 88 129 94(24) 71(13)
Ag_2 80 112 163 118(32) 79(21)
Ag_3 92 125 174 127(31) 92(21)
a Mean numerical diameter. Mean value of 3 measurements, performed by DLS.
Fig. 35: TEM micrographs of the samples (a) Ag_1, (b) Ag_2 and (c) Ag_3 with corresponding particle size distribution (PSD).

3. Dielectric Properties of Silver Nanoparticles Coated with Silica Shells of Different Thicknesses
113
Chapter 3: Dielectric Properties of Silver Nanoparticles
Coated with Silica Shells of Different Thicknesses
Declaration: The nanoparticles synthesis and functionalization as well as the microscopy
analysis with TEM/SEM were conducted by Jose Enrico Q. Quinsaat, while the dielectric
measurements of the particles that were pressed into pellets were conducted by Dr. Dorina
Opris.
Jose Enrico Q. Quinsaat1,2, Frank A. Nüesch1, Heinrich Hofmann2, Dorina M. Opris1*
1Swiss Federal Laboratories for Materials Science and Technology (Empa), Laboratory
for Functional Polymers, Überlandstrasse 129, 8600 Dübendorf, Switzerland
2Ecole Polytechnique Fédérale de Lausanne (EPFL), Materials Institute, Powder
Technology Laboratory (LTP), 1015 Lausanne, Switzerland

3. Dielectric Properties of Silver Nanoparticles Coated with Silica Shells of Different Thicknesses
114
Abstract: Core/shell nanoparticles having metallic silver nanoparticle cores of ~ 38 nm in
diameter and silica shells of different thicknesses ranging from ~3.6–20 nm were prepared.
For the silica coating, a slightly modified Stöber method was used which allowed
preparing grams of core/shell nanoparticles for the first time. The particles were
characterized by UV-vis spectroscopy, dynamic light scattering, scanning electron
microscopy, transmission electron microscopy, and energy-dispersive X-ray scattering.
Their dielectric properties were measured as pellets in parallel-plate capacitors. It was
found that the permittivity is much influenced by the silica shell thickness with an increase
in permittivity for thinner shells. A shell thickness of 20 ± 2 nm allowed fabrication of
capacitors which have similar characteristics to those of silica, thus, there is no influence of
the metal core on the dielectric properties anymore. However, by decreasing the silica shell
to 17 ± 2, 8 ± 1.5, and 6.6 ± 1.5 nm the permittivity at high frequencies is increasing from
10, 34, to 41, respectively. The insulator to metal transition was observed for a silica shell
thickness of 3.6 ± 1 nm. Functionalization of the silica surface with a hydrophobic coating
removes surface adsorbed water as observed by the flat dielectric permittivity over a large
frequency domain.
3.1 Introduction
Properties of metals change significantly when going from macroscopic to nanoparticle
sizes.1 In the last couple of years, much development has been done with respect to the
synthesis of metal nanoparticles and quite some understanding of how to prepare different
shapes and sizes was achieved.2 Blending such nanoparticles in polymeric, ceramic
matrices allowed fabrication of new materials with unprecedented properties which might
find their way in optical, electrical, and magnetic applications. Materials with high
dielectric permittivity ( ’) are of great interest for future electronic capacitors with high
energy storage densities and low operating voltage.3 For such applications not only high ’
is required, but also low conductivity and high breakdown field are desired properties.
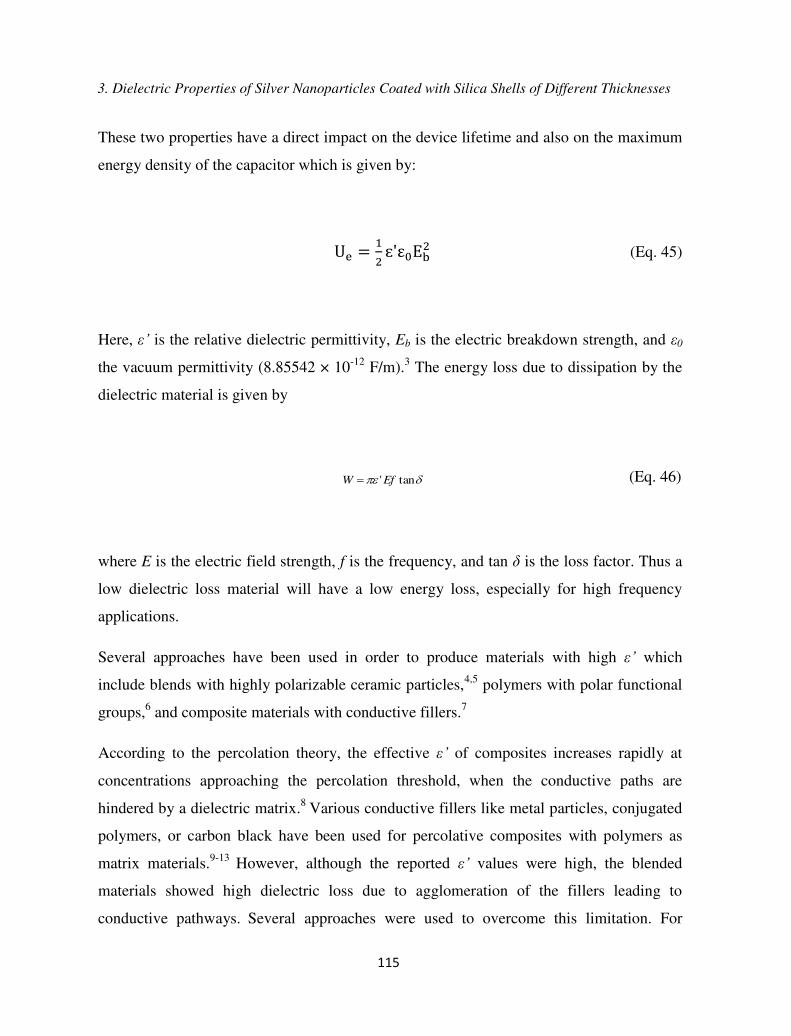
3. Dielectric Properties of Silver Nanoparticles Coated with Silica Shells of Different Thicknesses
115
These two properties have a direct impact on the device lifetime and also on the maximum
energy density of the capacitor which is given by:
�e = ɛ'ε Eb (Eq. 45)
Here, ’ is the relative dielectric permittivity, Eb is the electric breakdown strength, and 0
the vacuum permittivity (8.85542 × 10⁻¹² F/m).3 The energy loss due to dissipation by the
dielectric material is given by
tan'EfW (Eq. 46)
where E is the electric field strength, f is the frequency, and tan is the loss factor. Thus a
low dielectric loss material will have a low energy loss, especially for high frequency
applications.
Several approaches have been used in order to produce materials with high ’ which
include blends with highly polarizable ceramic particles,4,5 polymers with polar functional
groups,6 and composite materials with conductive fillers.7
According to the percolation theory, the effective ’ of composites increases rapidly at
concentrations approaching the percolation threshold, when the conductive paths are
hindered by a dielectric matrix.8 Various conductive fillers like metal particles, conjugated
polymers, or carbon black have been used for percolative composites with polymers as
matrix materials.9-13 However, although the reported ’ values were high, the blended
materials showed high dielectric loss due to agglomeration of the fillers leading to
conductive pathways. Several approaches were used to overcome this limitation. For

3. Dielectric Properties of Silver Nanoparticles Coated with Silica Shells of Different Thicknesses
116
example, Xu et al. used Al particles covered with an Al2O3 insulating shell, and obtained
composites with low dielectric losses.14 Kempa et al. used silica coated conductive
particles and observed that the shape and monodispersity of the nanoparticles strongly
affect the dielectric properties of the composites. Li et al. used effective medium
approximation of a composite made of three-phase material and showed that the effective
’, the breakdown strength, and the electrical energy density are strongly affected by the
microstructure of the nanocomposite and therefore must be carefully controlled.15
From the literature, it became clear that in order to prepare reliable materials the
percolation paths in composites containing conductive fillers should be avoided. This can
be achieved by surrounding the particles with an insulating shell that precisely defines the
minimum approach distance of twice the shell thickness (Fig. 36).16
Fig. 36: Insulator shell (light grey) on conductive Ag nanoparticles (dark grey) defining the minimum distance between the cores as twice the shell thickness.
Several approaches were already reported in the literature on how to prepare core/shell
particles.17 The most common one uses wet chemistry on preformed cores including
interfacial polymerization of the shell onto the core, controlled phase separation
techniques, and heterocoagulation.18 Although high temperature formation of dielectric
oxide shell is occasionally used, it is less attractive since the shell thickness is difficult to
control.19 Another way of preparing core/shell particles is by using layer by layer
deposition.20 Despite these advances in the synthesis of core/shell particles, a challenge
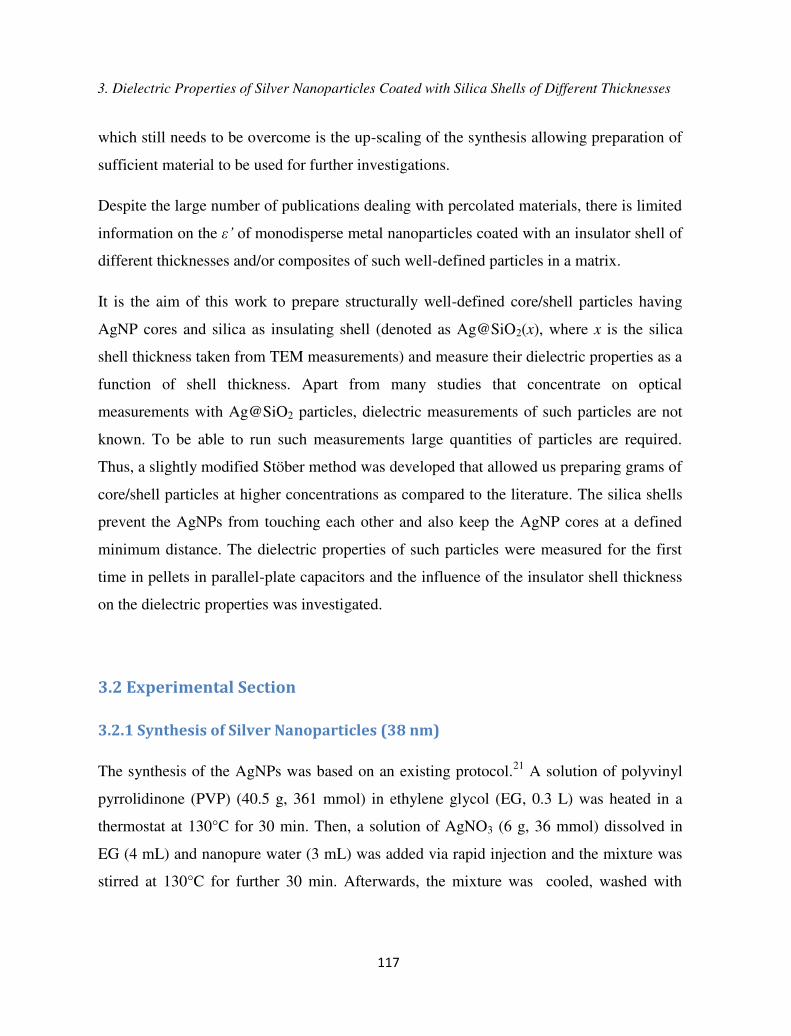
3. Dielectric Properties of Silver Nanoparticles Coated with Silica Shells of Different Thicknesses
117
which still needs to be overcome is the up-scaling of the synthesis allowing preparation of
sufficient material to be used for further investigations.
Despite the large number of publications dealing with percolated materials, there is limited
information on the ’ of monodisperse metal nanoparticles coated with an insulator shell of
different thicknesses and/or composites of such well-defined particles in a matrix.
It is the aim of this work to prepare structurally well-defined core/shell particles having
AgNP cores and silica as insulating shell (denoted as Ag@SiO2(x), where x is the silica
shell thickness taken from TEM measurements) and measure their dielectric properties as a
function of shell thickness. Apart from many studies that concentrate on optical
measurements with Ag@SiO2 particles, dielectric measurements of such particles are not
known. To be able to run such measurements large quantities of particles are required.
Thus, a slightly modified Stöber method was developed that allowed us preparing grams of
core/shell particles at higher concentrations as compared to the literature. The silica shells
prevent the AgNPs from touching each other and also keep the AgNP cores at a defined
minimum distance. The dielectric properties of such particles were measured for the first
time in pellets in parallel-plate capacitors and the influence of the insulator shell thickness
on the dielectric properties was investigated.
3.2 Experimental Section
3.2.1 Synthesis of Silver Nanoparticles (38 nm)
The synthesis of the AgNPs was based on an existing protocol.21 A solution of polyvinyl
pyrrolidinone (PVP) (40.5 g, 361 mmol) in ethylene glycol (EG, 0.3 L) was heated in a
thermostat at 130°C for 30 min. Then, a solution of AgNO3 (6 g, 36 mmol) dissolved in
EG (4 mL) and nanopure water (3 mL) was added via rapid injection and the mixture was
stirred at 130°C for further 30 min. Afterwards, the mixture was cooled, washed with
3. Dielectric Properties of Silver Nanoparticles Coated with Silica Shells of Different Thicknesses
118
acetone, and centrifuged. The washing procedure was repeated twice before redispersion of
the residue in ethanol (EtOH) (100 mL). AgNPs were prepared in 81% yield.
3.2.2 Synthesis of Silica Coated Silver Nanoparticles Ag@SiO2(x nm)
The encapsulation of the AgNPs with SiO2 was based on an existing protocol.22 From the
above dispersion of AgNPs in ethanol, 5 ml was taken and diluted with ethanol to 31.5 ml
in order to obtain a conc. of 46 mM AgNPs. This dispersion was treated with NH4OH
(29 %, 1.3 mL) under gentle stirring (Tab. 10) at 25 °C followed by the dropwise addition
of different concentrations of tetraethoxysilane (TEOS) in EtOH (3 mL) which was
completed after 60 s (For concentrations see Tab. 10). The reaction mixture was stirred for
further 20 h, then diluted with acetone, washed, centrifuged (4'000 rpm, 45 min) and
decanted. The washing procedure was repeated 3 times. The residue was redispersed in
MeOH for further analysis. The particles were dried in high vacuum at 25 °C for 8 h.

3. Dielectric Properties of Silver Nanoparticles Coated with Silica Shells of Different Thicknesses
119
Tab. 10: The amount of reagents used for the coating of AgNPs with different thickness silica shell.
aWhere x is the silica shell thickness and y is the deviation of the silica shell from TEM, stirring rate: b550 rpm, c500 rpm, and d400 rpm, e31.5 ml of 46 mM AgNP dispersed in ethanol was used.
3.2.3 Synthesis of Hydrophobic Coating: (Ag@SiO2(17 nm)@alkylsilane)
Ag@SiO2 (60 mg) was dispersed in EtOH (10 mL) and treated with dimethylamine
(DMA) (40%, 166 µL, 1.34 mmol) under gentle stirring (500 rpm) followed by the
dropwise addition of n-octyldimethylmethoxysilane (334 µL, 1.34 mmol) which was
completed within a minute. The mixture was stirred for further 48 h, then diluted with
acetone, washed, centrifuged (13’000 rpm, 25 min) and decanted followed by redispersion
and further washing in isopropanol (13’000 rpm, 25 min) for 4 times. The particles were
dried in high vacuum at 25 °C for 8 h.
3.3 Materials and Methods
All chemicals were purchased from Aldrich and used as received.
The nanoparticles were observed by SEM on a Hitachi S-4800 and FEI NovaNanoSEM
230, TEM were done with Philips CM30 TEM and JEOL 2200FS TEM/STEM, UV-vis
absorption spectra were recorded with a Cary 50 spectrophotometer, DLS were done with a
Sample
Ag@SiO2(x ± y nm)a
Vol % TEOS in EtOH [3 mL]e
Particles size by
TEM (nm)
Particles size by
DLS (nm)
Ag@SiO2(20 ± 2 nm)b 20% 78 79
Ag@SiO2(17 ± 2 nm)b 15% 72 72
Ag@SiO2(8 ± 1.5 nm)c 8% 54 57
Ag@SiO2(6.6 ± 1.5 nm)c 5% 51 54
Ag@SiO2(3.6 ± 1 nm)d 2.5% 45 366
3. Dielectric Properties of Silver Nanoparticles Coated with Silica Shells of Different Thicknesses
120
Malvern Zetasized Nano ZS, and 29Si NMR spectra were recorded with a Bruker Avance-
400 spectrometer. Image analysis was used for the TEM micrographs to estimate the
particles size. The number of particles measured was about 400 for Ag core by using
ImageJ and about 100 for the coated particles with the help of a ruler for Windows.
Permittivity measurements were done in the frequency range of 100 Hz to 1 MHz using an
HP 4284A LCR meter. The amplitude of the probing AC electric signal applied to the
samples was 1 V. The permittivity was determined from the capacitance: dAC 0 , where
A is the electrode area, d is the thickness of the capacitor, and 0 is the vacuum permittivity.
Before use, the samples were dried for 8 h at 2×10⁻² mbar. Pellets were prepared by
pressing at 3 tons (Ø = 3 mm) and were then covered with silver paste electrodes. Their
microstructures were measured with SEM (see supporting information) All the samples
were measured immediately after pellet preparation in order to avoid changes in the water
content.
3.4 Results
3.4.1 Synthesis and Characterization of AgNPs Coated with SiO2
A wide range of different shapes and sizes of AgNPs have been prepared including sphere,
spheroid, cube, octahedron, tetrahedron, bipyramid, rod, and wire starting from cheap and
readily available silver salts.23 For a general overview of the state of the art on the shape
controlled syntheses of AgNPs the reader is referred to the excellent review article by Xia
et al.24 The most common way for preparing AgNPs includes the reduction of silver salt by
boron hydrides, polyols, or hydrogen.25
We prepared AgNPs by reduction of AgNO3 with EG in the presence of PVP as capping
agent at 130°C. The particles were stabilized by polyvinylpyrrolidone (PVP). The reactions
were initially done on a small scale (0.2 g AgNO3), however in order to be able to make
dielectric investigations of AgNPs, gram quantities are required. Thus, the possibility of
up-scaling the synthesis was investigated. Since the reaction temperature influences
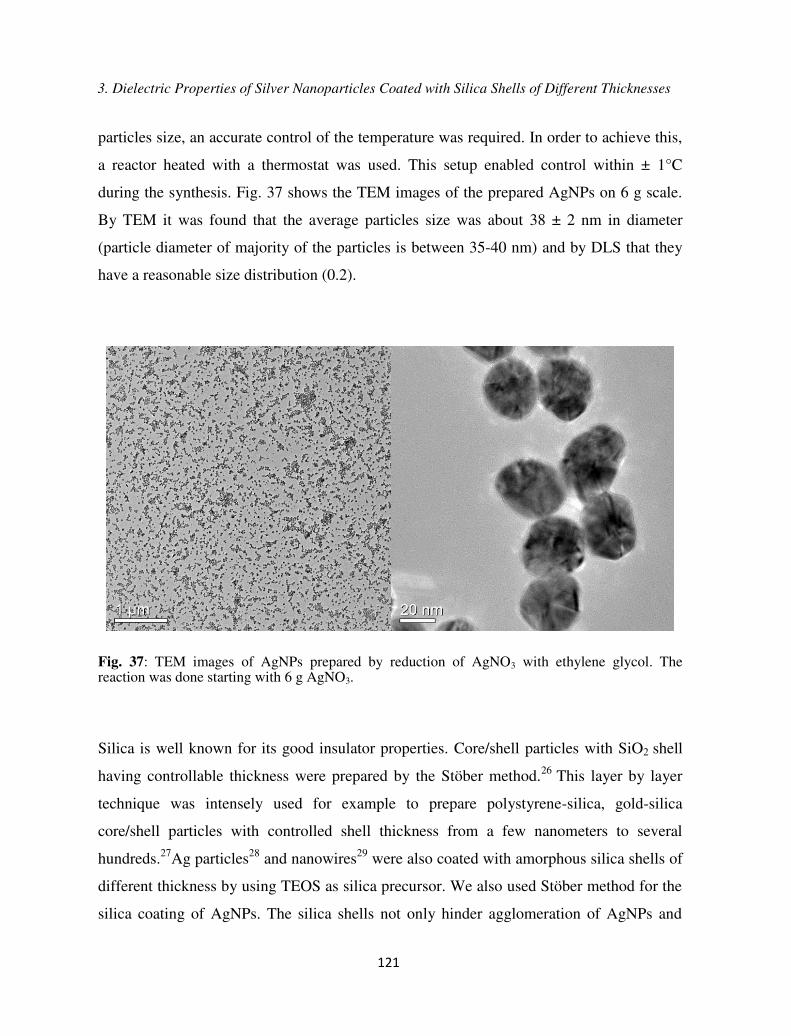
3. Dielectric Properties of Silver Nanoparticles Coated with Silica Shells of Different Thicknesses
121
particles size, an accurate control of the temperature was required. In order to achieve this,
a reactor heated with a thermostat was used. This setup enabled control within ± 1°C
during the synthesis. Fig. 37 shows the TEM images of the prepared AgNPs on 6 g scale.
By TEM it was found that the average particles size was about 38 ± 2 nm in diameter
(particle diameter of majority of the particles is between 35-40 nm) and by DLS that they
have a reasonable size distribution (0.2).
Fig. 37: TEM images of AgNPs prepared by reduction of AgNO3 with ethylene glycol. The reaction was done starting with 6 g AgNO3.
Silica is well known for its good insulator properties. Core/shell particles with SiO2 shell
having controllable thickness were prepared by the Stöber method.26 This layer by layer
technique was intensely used for example to prepare polystyrene-silica, gold-silica
core/shell particles with controlled shell thickness from a few nanometers to several
hundreds.27Ag particles28 and nanowires29 were also coated with amorphous silica shells of
different thickness by using TEOS as silica precursor. We also used Stöber method for the
silica coating of AgNPs. The silica shells not only hinder agglomeration of AgNPs and

3. Dielectric Properties of Silver Nanoparticles Coated with Silica Shells of Different Thicknesses
122
enhance their stability, but also allow surface functionalization.30 In a typical synthesis, the
AgNPs are dispersed at a certain concentration in ethanol and TEOS is hydrolyzed and
deposited on the surface of the nanoparticles. A disadvantage of Stöber method is the high
dilution required (typical concentration range from 0.01 mM to 1 mM) which made up-
scaling of the process unpractical. We therefore slightly modified the reaction conditions
and systematically increased the concentration of AgNPs (46 mM) such that about 0.1 g of
AgNPs per batch was coated. The strong contrast between the black silver core and the
gray shell in the TEM images (Fig. 38) confirms that core/shell nanoparticles were formed.
Despite the use of NH4OH which was thought to trigger the dissolution of the silver cores,
no core-free silica shells were observed in the TEM images. In comparison, the use of
DMA as catalyst for the hydrolysis of TEOS did not give uniform and spherical silica
shells as suggested in the literature.31 Furthermore, the presence of the silica shell was
confirmed by EDX done on the naked AgNPs and on the coated particles as shown in Fig.
39. Only in the latter spectrum, silicon is detected. The Cu and C peaks correspond to the
carbon-coated copper grid on which the particles were deposited for this test.

3. Dielectric Properties of Silver Nanoparticles Coated with Silica Shells of Different Thicknesses
123
Fig. 38: TEM images of the AgNPs coated with a silica shell. The average diameters of AgNPs were 38 nm while the SiO2 shells were about 20 ± 2 nm (a); 17 ± 2 nm (b); 8 ± 1.5 nm (c); 6.6 ± 1.5 nm (d); 3.6 ± 1 nm (e).
Fig. 39: EDX of the naked AgNPs (a) and of the AgNPs coated with SiO2 (b).
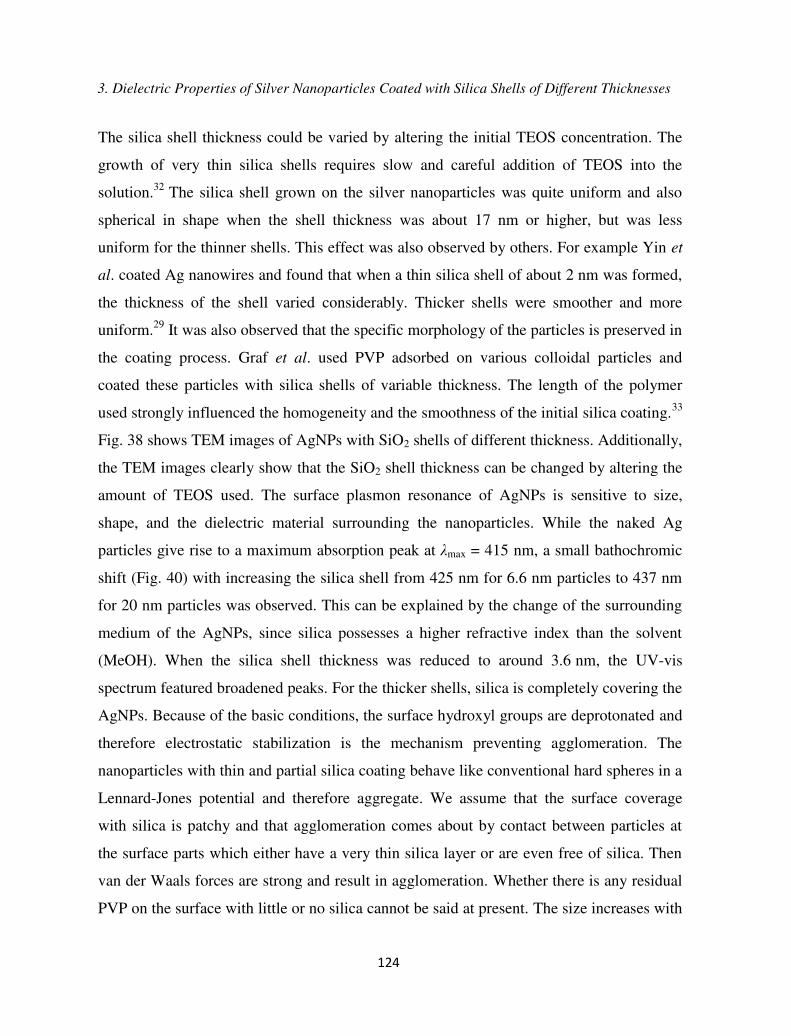
3. Dielectric Properties of Silver Nanoparticles Coated with Silica Shells of Different Thicknesses
124
The silica shell thickness could be varied by altering the initial TEOS concentration. The
growth of very thin silica shells requires slow and careful addition of TEOS into the
solution.32 The silica shell grown on the silver nanoparticles was quite uniform and also
spherical in shape when the shell thickness was about 17 nm or higher, but was less
uniform for the thinner shells. This effect was also observed by others. For example Yin et
al. coated Ag nanowires and found that when a thin silica shell of about 2 nm was formed,
the thickness of the shell varied considerably. Thicker shells were smoother and more
uniform.29 It was also observed that the specific morphology of the particles is preserved in
the coating process. Graf et al. used PVP adsorbed on various colloidal particles and
coated these particles with silica shells of variable thickness. The length of the polymer
used strongly influenced the homogeneity and the smoothness of the initial silica coating.33
Fig. 38 shows TEM images of AgNPs with SiO2 shells of different thickness. Additionally,
the TEM images clearly show that the SiO2 shell thickness can be changed by altering the
amount of TEOS used. The surface plasmon resonance of AgNPs is sensitive to size,
shape, and the dielectric material surrounding the nanoparticles. While the naked Ag
particles give rise to a maximum absorption peak at max = 415 nm, a small bathochromic
shift (Fig. 40) with increasing the silica shell from 425 nm for 6.6 nm particles to 437 nm
for 20 nm particles was observed. This can be explained by the change of the surrounding
medium of the AgNPs, since silica possesses a higher refractive index than the solvent
(MeOH). When the silica shell thickness was reduced to around 3.6 nm, the UV-vis
spectrum featured broadened peaks. For the thicker shells, silica is completely covering the
AgNPs. Because of the basic conditions, the surface hydroxyl groups are deprotonated and
therefore electrostatic stabilization is the mechanism preventing agglomeration. The
nanoparticles with thin and partial silica coating behave like conventional hard spheres in a
Lennard-Jones potential and therefore aggregate. We assume that the surface coverage
with silica is patchy and that agglomeration comes about by contact between particles at
the surface parts which either have a very thin silica layer or are even free of silica. Then
van der Waals forces are strong and result in agglomeration. Whether there is any residual
PVP on the surface with little or no silica cannot be said at present. The size increases with

3. Dielectric Properties of Silver Nanoparticles Coated with Silica Shells of Different Thicknesses
125
increasing the silica shell is also reflected by DLS and further confirms the coating (Fig.
41). Interestingly, while almost all dispersed particles have similar sizes as those
determined by TEM, the size of Ag@SiO2 (3.6 ± 1) with a TEM diameter of 45 nm
appears much larger (Tab. 10) a sign for agglomerated particles. A direct comparison of
our results with the literature is not possible since no DLS data are given for metal particles
coated with a silica shell.
400 600 8000.0
0.5
1.0 AgNPs (38) Ag@SiO2(20)
Ag@SiO2(17)
Ag@SiO2(8)
Ag@SiO2(6.6)
Ag@SiO2(3.6)
Ab
so
rba
nce
Wavelength (nm)
Fig. 40: UV-vis absorption spectra of AgNPs and of AgNPs coated with a silica shell recorded in MeOH. A small bathochromic shift can be seen with increasing shell thickness.

3. Dielectric Properties of Silver Nanoparticles Coated with Silica Shells of Different Thicknesses
126
Fig. 41: Hydrodynamic diameter DH determined by DLS of AgNPs before and after coating with silica shell recorded in EtOH. An increase in particle size is observed with increasing shell thickness, except for Ag@SiO2 (3.6) the DH-value of which does not match single particle size. For explanations, see text.
3.4.2 Dielectric Properties of Ag@SiO2 in Pressed Pellets
The real part of the dielectric function ’ of pressed pellets of powder samples composed of
Ag@SiO2 nanoparticles were obtained by measuring the capacitance of the pellets using
the sandwich architecture Ag/ Ag@SiO2 /Ag in the frequency range of 100 Hz to 1 MHz
(see experimental part). The dielectric response of Ag@SiO2 pellets is given in Fig. 42. As
expected, an increase in ’ with decreasing shell thickness was observed at all frequencies.
Concretely, for shell thicknesses of 20 ± 2, 17 ± 2, 8 ± 1.5, and 6.6 ± 1.5 nm ’-values of
4.6, 10, 34 and 41, respectively, were obtained (Fig. 42). AgNPs coated with a very thin
insulating shell of about 3.6 ± 1 nm were conductive and it was not possible to run the
dielectric measurement. For thicker shells, the ’ of Ag@SiO2 pellets is almost constant at
high frequencies but increases at lower frequencies. The reason for this might be due to the
presence of traces of ions and residual water absorbed on the silica surface which is rather
difficult to remove which would increase the ion conductivity at low frequencies.
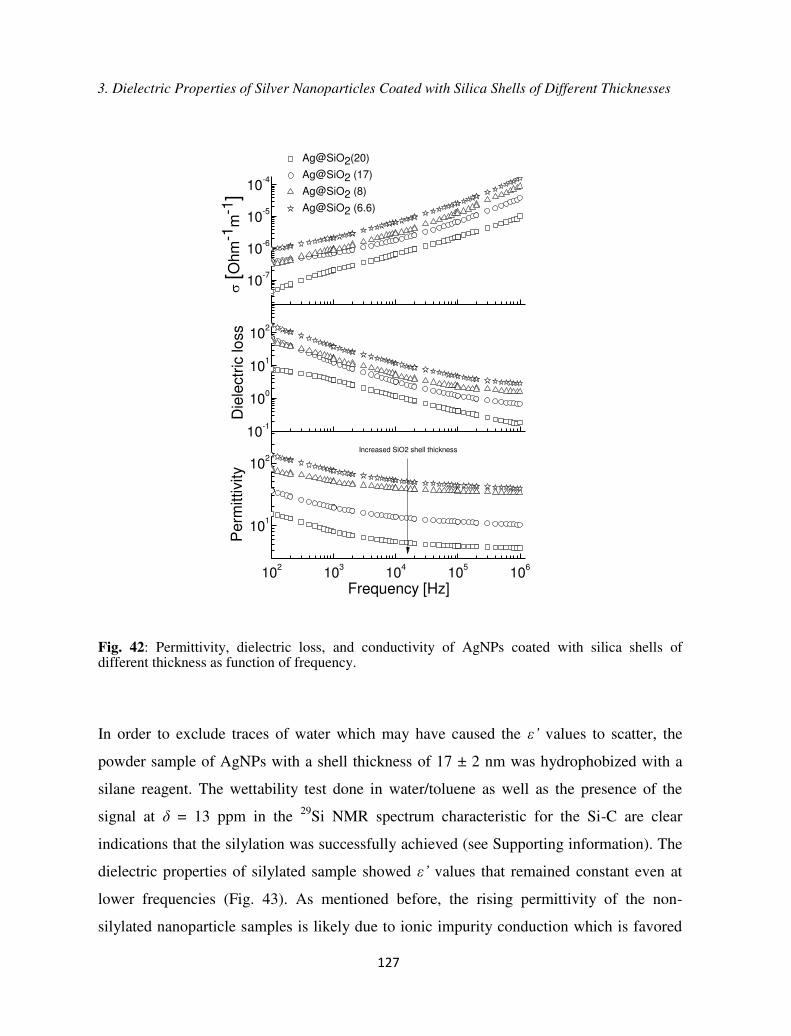
3. Dielectric Properties of Silver Nanoparticles Coated with Silica Shells of Different Thicknesses
127
102
103
104
105
106
101
102
10-1
100
101
102
10-7
10-6
10-5
10-4
Perm
ittivi
ty
Frequency [Hz]
Increased SiO2 shell thickness
Die
lect
ric lo
ss [O
hm
-1m
-1]
Ag@SiO2(20)
Ag@SiO2 (17)
Ag@SiO2 (8)
Ag@SiO2 (6.6)
Fig. 42: Permittivity, dielectric loss, and conductivity of AgNPs coated with silica shells of different thickness as function of frequency.
In order to exclude traces of water which may have caused the ’ values to scatter, the
powder sample of AgNPs with a shell thickness of 17 ± 2 nm was hydrophobized with a
silane reagent. The wettability test done in water/toluene as well as the presence of the
signal at = 13 ppm in the 29Si NMR spectrum characteristic for the Si-C are clear
indications that the silylation was successfully achieved (see Supporting information). The
dielectric properties of silylated sample showed ’ values that remained constant even at
lower frequencies (Fig. 43). As mentioned before, the rising permittivity of the non-
silylated nanoparticle samples is likely due to ionic impurity conduction which is favored

3. Dielectric Properties of Silver Nanoparticles Coated with Silica Shells of Different Thicknesses
128
by water adsorption in the porous nanoparticle film. Silylation creates a hydrophobic shell
around the Ag nanoparticles and removes the water from the surface. At high frequencies,
typically above 104 Hz, the ion conduction mechanism no longer contributes to the
permittivity of the nanoporous samples. The difference between silylated and non-silylated
samples in the high frequency region is rather small and is attributed to slightly different
packing of the nanoparticle in the pellets and to the experimental uncertainty. Since the ’
of air is rather low, and the air voids are filled by alkyl chains which have a ’ of about 2, a
slight increase in the ’ should be observed for the hydrophobized sample. Such effect was
observed by others. For example the permittivity of bulk TiO2 value of 80 decreased to 58
for TiO2 nanoparticles due to the presence of voids.34
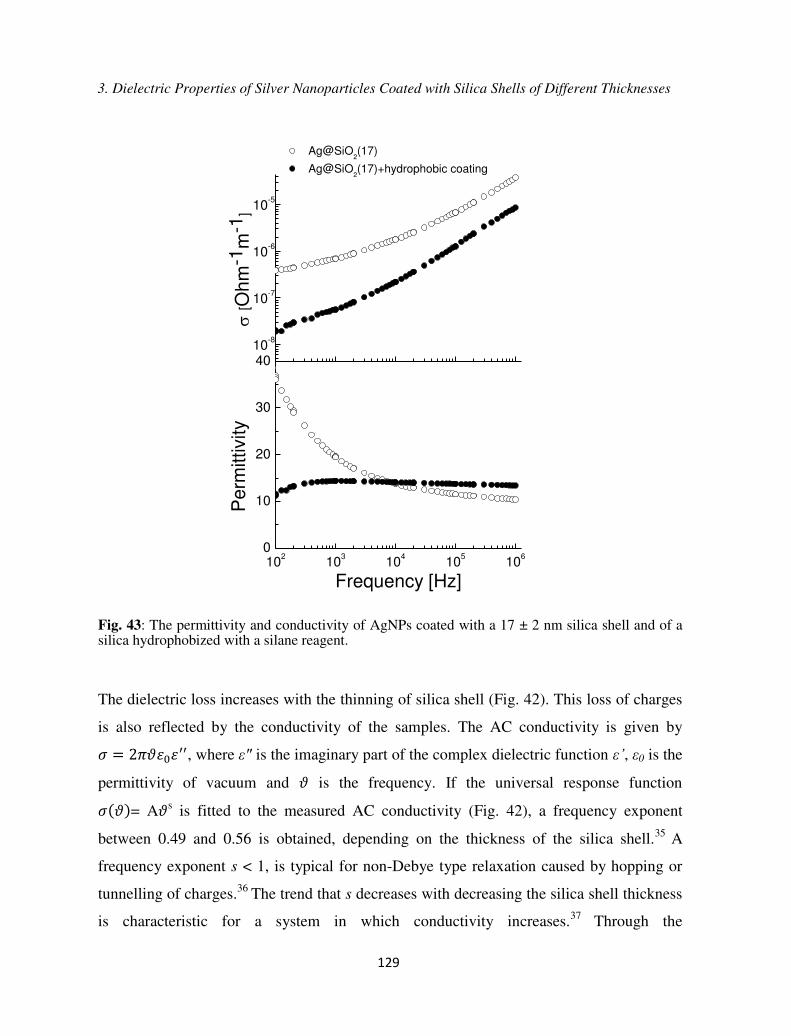
3. Dielectric Properties of Silver Nanoparticles Coated with Silica Shells of Different Thicknesses
129
102
103
104
105
106
0
10
20
30
4010
-8
10-7
10-6
10-5
Perm
ittiv
ity
Frequency [Hz]
[O
hm
-1m
-1]
Ag@SiO2(17)
Ag@SiO2(17)+hydrophobic coating
Fig. 43: The permittivity and conductivity of AgNPs coated with a 17 ± 2 nm silica shell and of a silica hydrophobized with a silane reagent.
The dielectric loss increases with the thinning of silica shell (Fig. 42). This loss of charges
is also reflected by the conductivity of the samples. The AC conductivity is given by � = �� ′′, where " is the imaginary part of the complex dielectric function ’, 0 is the
permittivity of vacuum and � is the frequency. If the universal response function � � = A�s is fitted to the measured AC conductivity (Fig. 42), a frequency exponent
between 0.49 and 0.56 is obtained, depending on the thickness of the silica shell.35 A
frequency exponent s < 1, is typical for non-Debye type relaxation caused by hopping or
tunnelling of charges.36 The trend that s decreases with decreasing the silica shell thickness
is characteristic for a system in which conductivity increases.37 Through the

3. Dielectric Properties of Silver Nanoparticles Coated with Silica Shells of Different Thicknesses
130
hydrophobization of the silica surface the conductivity of the sample decreases
significantly at all frequencies as compared to the sample where no hydrophobic coating
was used. Hydrophobization of the silica surface is required not only to stabilize the
dielectric properties of the Ag@SiO2 but it helps to compatibilize the particles with an
organic matrix where such particles could be used as high ’ filler. Further work is
presently going in this direction.
Our samples can be considered as percolating conductive particles held apart by the twice
the thickness of the insulating shell. If we do not have water inclusion in our pellet
samples, the voids can be considered to be filled with air. Therefore the calculation of the
effective electrical permittivity of the samples amounts to calculation of highly
concentrated core-shell particles in an air matrix ( m = 1). It is well known that only
effective medium theories such as the one derived by Bruggemann can reasonably well
describe non-dilute particle inclusion in a matrix.38 Here we applied an effective-medium
theory that has been developed for two-phase random composites with an interfacial shell
given by39
022
)1(
ceff
ceff
meff
meff FF
(Eq. 47)
4
]44)61812()9189([2)33( 2222222cmcmcmcmcmcmcmmc
eff
FFF
(Eq. 48)
with )(2
)(22
1221
12211
c (Eq. 49)
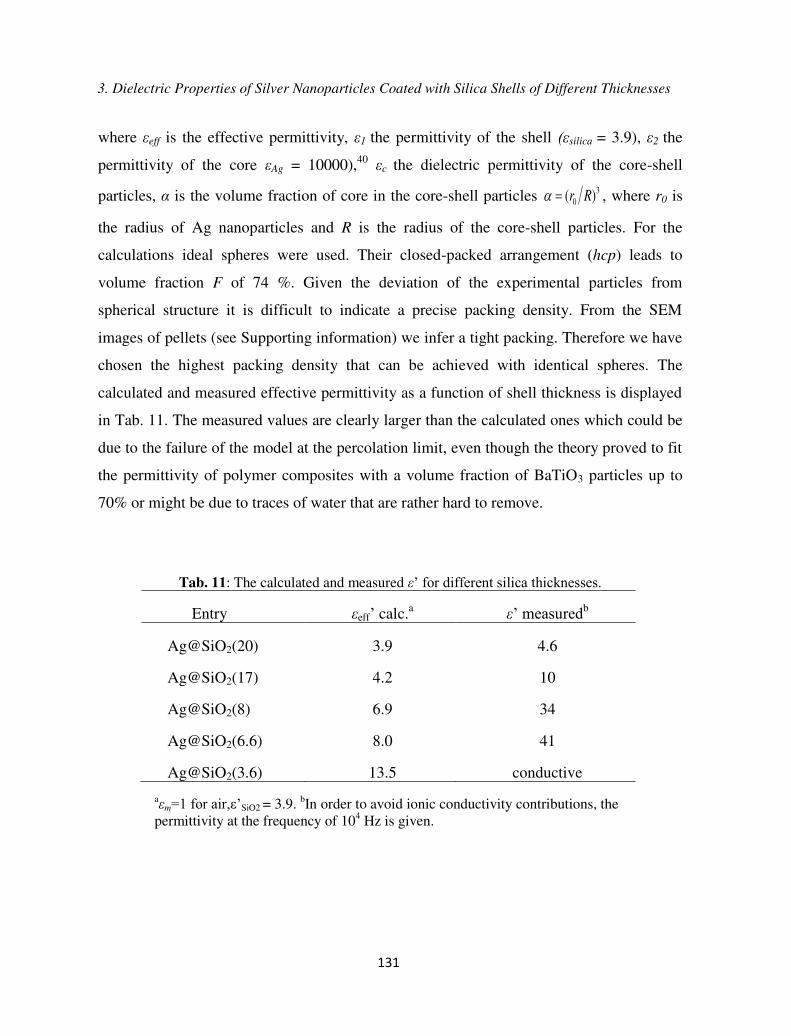
3. Dielectric Properties of Silver Nanoparticles Coated with Silica Shells of Different Thicknesses
131
where eff is the effective permittivity, 1 the permittivity of the shell ( silica = 3.9), 2 the
permittivity of the core Ag = 10000),40 c the dielectric permittivity of the core-shell
particles, α is the volume fraction of core in the core-shell particles 30 )( Rr , where r0 is
the radius of Ag nanoparticles and R is the radius of the core-shell particles. For the
calculations ideal spheres were used. Their closed-packed arrangement (hcp) leads to
volume fraction F of 74 %. Given the deviation of the experimental particles from
spherical structure it is difficult to indicate a precise packing density. From the SEM
images of pellets (see Supporting information) we infer a tight packing. Therefore we have
chosen the highest packing density that can be achieved with identical spheres. The
calculated and measured effective permittivity as a function of shell thickness is displayed
in Tab. 11. The measured values are clearly larger than the calculated ones which could be
due to the failure of the model at the percolation limit, even though the theory proved to fit
the permittivity of polymer composites with a volume fraction of BaTiO3 particles up to
70% or might be due to traces of water that are rather hard to remove.
Tab. 11: The calculated and measured ’ for different silica thicknesses.
Entry eff’ calc.a ’ measuredb
Ag@SiO2(20) 3.9 4.6
Ag@SiO2(17) 4.2 10
Ag@SiO2(8) 6.9 34
Ag@SiO2(6.6) 8.0 41
Ag@SiO2(3.6) 13.5 conductive
am=1 for air,ε’SiO2 = 3.9. bIn order to avoid ionic conductivity contributions, the
permittivity at the frequency of 104 Hz is given.

3. Dielectric Properties of Silver Nanoparticles Coated with Silica Shells of Different Thicknesses
132
3.5 Conclusions
We report an upscale of the synthesis of Ag nanoparticles of 38 nm size as well as their
coating with a silica shell of different thicknesses by the Stöber method. The silica shell
was varied from ~ 3.6 nm to ~ 20 nm. The core/shell structure of the prepared particles was
clearly proven by using a combination of techniques: UV-vis, DLS, SEM, TEM, and EDX.
Parallel-plate capacitors of pellets composed of pressed powder of Ag nanoparticles coated
with different silica shells were made and the dielectric properties were investigated as
function of the shell thickness. For a shell of 3.6 ± 1 nm, the insulator layer is too thin and
the particles are conductive while increasing the shell thickness to 6.6 ± 1.5 nm, a shift
from conductive to dielectric behaviour was observed. A further increase in the shell to
20 ± 2 nm hides the presence of the metal core and the resulting particles behave similar to
silica. The conductivity of the samples due to absorbed water on the silica surface can be
reduced by hydrophobization of the surface with an alkyl silane. Such hydrophobized
particles have high permittivity, small dielectric losses, and are ready dispersible in
nonpolar solvents and are therefore attractive fillers particularly for polydimethylsiloxane
material for transducer and more generally for large energy storage capacitors.
3.6 Acknowledgments
We gratefully acknowledge D. Schreier for helping with the TEM and SEM measurements,
Dr. F. La Mattina for providing us with the infrastructure for the impedance measurements
(all Empa), Dr. D. Rentsch for the 29Si NMR measurement, and B. Sinnet from Eawag for
helping with DLS measurement. We also gratefully acknowledge Swiss National Science
Foundation (SNF132101) and Swiss Federal Laboratories for Materials Science and
Technology (Empa, Dübendorf) for financial support.

3. Dielectric Properties of Silver Nanoparticles Coated with Silica Shells of Different Thicknesses
133
3.7 References
(1) Kelly, L. K.; Coronado, E.; Zhao, L. L.; Schatz, G. C. The Optical Properties of Metal
Nanoparticles: The Influence of Size, Shape, and Dielectric Environment. J. Phys. Chem.
B, 2003, 107, 668-677; Welles, A. E. Silver Nanoparticles Properties, Characterization and
Applications, Nova Science Pub. Inc. New York 2012; Alivisatos, A. P. Semiconductor
Clusters, Nanocrystals, and Quantum Dots. Science, 1996, 271, 933-937; Murphy, C. J.;
Jana, N. R. Controlling the Aspect Ratio of Inorganic Nanorods and Nanowires. Adv.
Mater. 2002, 14, 80-82.
(2) Zeng, J.; Xia, X.; Rycenga, M.; Henneghan, P.; Li, Q.; Xia, Y. Successive Deposition
of Silver on Silver Nanoplates: Lateral Versus Vertical Growth. Angew. Chem. Int. Ed.
2011, 50, 244 –249.
(3) Guo, N.; DiBenedetto, S. A.; Tewari, P.; Lanagan, M. T.; Ratner, M. A.; Marks, T. J.
Nanoparticle, Siza, Shape, and Interfacial Effects on Leakage Current Density,
Permittivity, and Breakdown Strength of Metal Oxide-Polyolefin Nanocomposites:
Experiment and Theory. Chem. Mater. 2010, 22, 1567–1578; Pan, J.; Li, K.; Li, J.; Hsu,
T.; Wang, Q. Dielectric Characteristics of Poly (ether ketone ketone) for High Temperature
Capacitive Energy Storage. Appl. Phys. Lett. 2009, 95, 022902; Claude, J.; Lu, Y.; Li, K.;
Wang, Q. Electrical Storage in Poly(vinylidene fluoride) based Ferroelectric Polymers:
Correlating Polymer Structure to Electrical Breakdown Strength. Chem. Mater. 2008, 20,
2078–2080; B. Chu, B.; X. Zhou, X.; K. Ren, K.; Neese, B.; Lin, M.; Wang, Q.; Bauer, F.;
Zhang, Q. M. A Dielectric Polymer with High Electric Energy Density and Fast Discharge
Speed. Science, 2006, 313, 334–336.
(4) Bai, Y.; Cheng, Z.-Y.; Bharti, V.; Xu, H. S.; Zhang, Q. M. High-Dielectric-Constant
Ceramic-Powder Polymer Composites. Appl. Phys. Lett. 2000, 76, 3804-3806; Li, J.;
Seok, S.; Chu, B.; Dogan, F.; Zhang, Q.; Wang, Q. Nanocomposites of Ferroelectric
Polymers with TiO2 Nanoparticles Exhibiting Significantly Enhanced Electrical Energy
Density. Adv. Mater. 2009, 21, 217–221; Gallone, G.; Carpi, F.; De Rossi, D.; Levita, G.;

3. Dielectric Properties of Silver Nanoparticles Coated with Silica Shells of Different Thicknesses
134
Marchetti, A. Dielectric Constant Enhancement in Silicone Elastomer Filled with Lead
Magnesium Niobate-Lead Titanate. Mat. Sci. Eng. C 2007, 27, 110–116; Stoyanov, H.;
Kollosche, M.; Risse, S.; McCarthy, D. N.; Kofod, G. Elastic Block Copolymer
Nanocomposites with Controlled Interfacial Interactions for Artificial Muscles with Direct
Voltage Control. Soft Matter 2011, 7, 194-202.
(5) Z. Li, Z.; L. A. Fredin, L. A.; P. Tewari, P.; S. A. DiBenedetto, S. A.; M. T. Lanagan,
M. T.; M. A. Ratner, M. A.; T. J. Marks, T. J. In Situ Catalytic Encapsulation of Core-Shell
Nanoparticles Having Variable Shell Thickness: Dielectric and Energy Storage Properties
of High Permittivity Metal Oxide Nanocomposites. Chem. Mater. 2010, 22, 5154-5164.
(6) P. Hedvin, Dielectric Spectroscopy of Polymers, Adam Higler LTD, Budapest, 1977.
(7) Huang, C.; Zhang, Q. Enhanced Dielectric and Electromechanical Responses in High
Dielectric Constant All-Polymer Percolative Composites. Adv. Funct. Mater. 2004, 14,
501-506; Kirkparck, S. Percolation and Conduction. Rev. Mod. Phys. 1973, 45, 574-588;
Nan, C. W. Physics of Inhomogenous Inorganic Materials. Prog. Mater. Sci. 1993, 37, 1-
116; Pecharroman, C.; Moya, J. S. Experimental Evidence of a Giant Capacitance in
Insulator-Conductor Composites at the Percolation Threshold. Adv. Mater. 2000, 12, 294-
297; Dang, Z.-M., Shen, S.; Nan, C. W. Dielectric Behavior of Three-Phase Percolative
Ni-BaTiO3/Polyvinylidene Fluoride Composites. Appl. Phys. Lett. 2002, 81, 4814-4816.
(8) Moya, J. S. Experimental Evidence of a Giant Capacitance in Insulator-Conductor
Composites at the Percolation Threshold. Adv. Mater. 2000, 12, 294-297;
(9) Rao, Y.; Wong, C. P.; Xu, J. High Dielectric Polymer Composites and Methods of
Preparation Thereof. US Pat. 6864306, 2005; Choi, H. W.; Heo, Y. W.; Lee, J. H.; E. Park,
E. T.; Chung, Y. K. Effects of BaTiO3 on Dielectric Behavior of BaTiO3-Ni-Polymethyl
Methacrylate Composites. Appl. Phys. Lett. 2006, 89, 132910; Lu, J.; K. Moon, K. S.; Xu,
J.; Wong, C. P. Synthesis and Dielectric Properties of Novel High-K Polymer Composites
Containing In-Situ Formed Silver Nanoparticles for Embedded Capacitor Applications. J.
Mat. Chem. 2006, 16, 1543-1548.
3. Dielectric Properties of Silver Nanoparticles Coated with Silica Shells of Different Thicknesses
135
(10) Qi, L.; Lee, B. I.; Chen, S.; Samuels, W. D.; Exarhos, G. J. High-Dielectric-Constant
Silver-Epoxy Composites as Embedded Dielectrics. Adv. Mater. 2005, 17, 1777-1781.
(11) Shen, Y.; Lin, Y.; Li, M.; Nan, C. W. High Dielectric Performance of Polymer
Composite Films Induced by a Percolating Interparticle Barrier. Adv. Mat. 2007, 19, 1418-
1422.
(12) T. Kempa, T.; Carnahan, D.; Olek, M.; Correa, M.; Giersig, M.; Cross, M.; Benham,
G.; Sennett, M.; Ren, Z.; Kempa, K. Dielectric Media Based on Isolated Metallic
Nanostructures. J. Appl. Phys. 2005, 98, 034310.
(13) Yang, T. I.; Brown, R. N. C.; Kempel, L. C.; Kofinas, P.; Controlled Synthesis of
Core-Shell Iron-Silica Nanoparticles and Their Magneto-Dielectric Properties in Polymer
Composites. Nanotechnology 2011, 22, 105601.
(14) Xu, J.; Wong, C. P. Low-Loss Percolative Dielectric Composite. Appl. Phys. Lett.
2005, 87, 082907.
(15) Li, J. Y.; Zhang, L.; Ducharme, S. Electric Energy Density of Dielectric
Nanocomposite. Appl. Phys. Lett. 2007, 90, 132901.
(16) Wilkinson, D.; Langer, J. S.; Sen, P. N. Enhancement of the Dielectric-Constant Near
a Percolation Threshold. Phys. Rev. B 1983, 28, 1081-1087.
(17) Goh, H.; Lee, H. –J.; Nam, B.; Lee, Y. B.; Choi, W. S. A Chemical Reactor for
Hierarchical Nanomaterials with Tuneable Structures: A Metal-Triggered Reaction in the
Confined Heat Chamber. Chem. Mat. 2011, 23, 4832-4837; Niitsoo, O.; Couzis, A. Facile
Synthesis of Silver Core-Silica Shell Composite Nanoparticles. J. Coll. Interf. Sci. 2011,
354, 887-890; Schmidt, A. M. The Synthesis of Magnetic Core-Shell Nanoparticles by
Surface-Initiated Ring-Opening Polymerization of ε-Caprolactone. Macromol. Rapid
Commun. 2005, 26, 93-97; Li, H.; Han, J.; Panioukhine, A.; Kumacheva, E. From
Heterocoagulated Colloids to Core-Shell Particles. J. Coll. Interf. Sci. 2002, 255, 119-128;
Vogel, N.; Fernandez-Lopez, C.; Perez-Juste, C. J.; Liz-Marzan, L. M.; Landfester, K.;

3. Dielectric Properties of Silver Nanoparticles Coated with Silica Shells of Different Thicknesses
136
Weiss, C. K. Ordered Arrays of Gold Nanostructures From Interfacially Assembled
Au@PNIPAM Hybrid Nanoparticles. Langmuir 2012, 28, 8985-8993.
(18) Pham, H. H.; Kumacheva, E. Core-Shell Particles: Building Blocks for Advanced
Polymer Materials. Macromol. Symp. 2003, 192, 191-205.
(19) Burns, G. P. Titanium Dioxide Dielectric Films Formed by Rapid Thermal Oxidation.
J. Appl. Phys. 1988, 65, 2095-2097; Biener, J.; Farfan-Arriba, E.; Bienel, M.; C. Friend, C.
M.; Madix, R. J. Synthesis of TiO2 Nanoparticles on the Au(111) Surface. J. Chem. Phys.
2005, 123, 094705-1-094705-6.
(20) Guerrero-Martinez, A.; Perez-Juste, J.; Liz-Marzan, L. M. Recent Progress on Silica
Coating of Nanoparticles and related Nanomaterials. Adv. Mater. 2010, 22, 1182-1195;
Iijima, M.; Kaniya, H. Layer-by-Layer Surface Modification of Functional Nanoparticles
for Dispersion in Organic Solvents. Langmuir 2010, 26, 17943-17948; Fernandez-Lopez,
C.; Mateo-Mateo, C.; Alvarez-Puebla, R. A.; Perez-Juste, J.; Pastoriza-Santos, I.; Liz-
Marzan, L. M. Highly Controlled Silica-Coating of PEG-Capped Metal Nanoparticles and
Preparation of SERS-Encoded Particles. Langmuir 2009, 25, 13894-13899.
(21) Wiley, B. J.; Im, S. H.; Li, Z. Y.; McLellan, J.; Siekkinen, A.; Xia, Y. Maneuvering
the Surface Plasmon Resonance of Silver Nanostructures Through Shape-Controlled
Synthesis. J. Phys. Chem. B, 2006, 110, 15666-15675; Kim, D.; Jeong, S.; Moon, J.
Synthesis of Silver Nanoparticles Using the Polyol Synthesis and the Influence of
Precursor Injection. Nanotechnology 2006, 17, 4019-4024.
(22) Baida, H.; Billaud, P.; Marhaba, S.; Christofilos, D.; Cottancin, E.; Crut, A.; Lerm,
J.; Maioli, P.; Pellarin, M.; Broyer, M.; Del Fatti, N.; Valle, F. Quantitative Determination
of the Size Dependence of Surface Plasmon Resonance Damping in Single Ag@SiO2
Nanoparticles. Nano Lett. 2009, 9, 3463-3469; Zhang, F.; Braun, G.; Shi, Y.; Zhang, Y.;
Sun, X.; Reich, N.; Zhao, D.; Stucky, G. Fabrication of Ag@SiO2@Y2O3:Er
Nanostructures for Bioimaging: Tuning of the Upconversion Fluorescence with Silver
Nanoparticles. J. Am. Chem. Soc. 2010, 132, 2850-2851.

3. Dielectric Properties of Silver Nanoparticles Coated with Silica Shells of Different Thicknesses
137
(23) Im, S. H.; Lee, Y. T.; Wiley, B.; Xia, Y. Large-Scale Synthesis of Silver Nanocubes:
The Role of HCl in Promoting Cube Perfection and Monodispersity. Angew. Chem. 2005,
117, 2192-2195; Yu, D.; Yam, V. W. -W. Controlled Synthesis of Monodisperse Silver
Nanocubes in Water. J. Am. Chem. Soc. 2004, 126, 13200-13201.
(24) Xia, Y.; Xiong, Y.; Lim, B.; Skrabalak, S. E. Shape-Controlled Synthesis of Metal
Nanocrystals: Simple Chemistry Meets Complex Physics? Angew. Chem. Int. Ed. 2009,
48, 60-103.
(25) Siekkinen, A. R.; McLellan, J. M.; Chen, J.; Xia, Y. Rapid Synthesis of Small Silver
Nanocubes by Mediating Polyol Reduction with a Trace Amount of Sodium Sulfide or
Sodium Hydrosulfide. Chem. Phys. Lett. 2006, 432, 491-496; D. D. Evanoff, D. D.; G.
Chumanov, G. Size-Controlled Synthesis of Nanoparticles. 1. “Silver-Only” Aqueous
Suspensions via Hydrogen Reduction. J. Phys. Chem. B 2004, 108, 13948-13956.
(26) Stöber, W.; Fink, A.; Bohn, E. Controlled Growth of Monodisperse Silica Spheres in
the Micron Size Range. J. Colloid Interface Sci. 1968, 26, 62-69
(27) Caruso, F.; Caruso, R. A.; Möhwald, H. Nanoengineering of Inorganic and Hybrid
Hollow Spheres by Colloidal Templating. Science 1998, 282, 1111-1114; Lu, Y.;
McLellan, J.; Xia, Y. Synthesis and Crystallization of Hybrid Spherical Colloids
Composed of Polystyrene Cores and Silica Shells. Langmuir, 2004, 20, 3464-3470.
(28) Xu, K.; Wang, J. –X.; Kang, X. –L.; Chen, J. –F. Fabrication of Antibacterial
Monodispersed Ag-SiO2 Core-Shell Nanoparticles with High Concentration. Mat. Lett.
2009, 63, 31-33; Ung, T.; Liz-Marzan, L. M.; Mulvaney, P. Controlled Method for Silica
Coating of Silver Colloids. Influence of Coating on the Rate of Chemical Reactions.
Langmuir 1998, 14, 3740-3748; Hardikar, V. V.; Matijevic, E. Coating of Nanosize Silver
Particles with Silica. J. Colloid Interace. Sci. 2000, 221, 133-136; Han, Y.; Jiang, J.; Lee,
S. S.; Ying, J. Y. Reverse Microemulsion-Mediated Synthesis of Silica-Coated Gold and
Silver Nanoparticles. Langmuir 2008, 24, 5842-5848.

3. Dielectric Properties of Silver Nanoparticles Coated with Silica Shells of Different Thicknesses
138
(29) Yin, Y.; Lu, Y.; Sun, Y.; Xia, Y. Silver Nanowires Can Be Directly Coated with
Amorphous Silica To Generate Well-Controlled Coaxial Nanocables of Silver/Silica. Nano
Lett. 2002, 2, 427-430.
(30) Kong, X.; Yu, Q.; Zhang, X.; Du, X.; Gong, H.; Jiang, H. Synthesis and Application
of Surface Enhanced Raman Scattering (SERS) tags of Ag@SiO2 Core/Shell Nanoparticles
in Protein Detection. J. Mater. Chem. 2012, 22, 7767-7774.
(31) Kobayashi, Y.; Katakami, Y. H.; Mine, E.; Nagao, D.; Konno, M.; Liz-Marzan, L. M.
Silica Coating of Silver Nanoparticles Using a Modified Stöber Method. J. Colloid.
Interface Sci. 2005, 283, 392-396
(32) Yang, J.; Zhang, F.; Chen, Y.; Qian, S.; Hu, P.; Li, W.; Deng, Y.; Fang, Y.; Han, L.;
Luqman, M.; Zhao, D. Core-Shell Ag@SiO2@mSiO2 Mesoporous Nanocarriers for Metal-
Enhanced Fluorescence. Chem. Commun. 2011, 47, 11618-11620.
(33) Graf, C.; Vossen, D. L. J.; Imhof, A.; van Blaaderen, A. A General Method To Coat
Colloidal Particles with Silica. Langmuir 2003, 19, 6693-6700.
(34) Balasubramanian, B.; Kraemer, K. L.; Reding, N. A.; Skomski, R.; Ducharme, S.;
Sellyer, D. J. Synthesis of Monodisperse TiO2-Paraffin Core-Shell Nanoparticles for
Improved Dielectric Properties. ACS Nano 2010, 4, 1893-1900.
(35) Ahmad, M. M.; Makhlouf, S. A.; Khalil, K. M. S. Dielectric Behavior and AC
Conductivity Study of NiO/Al2O3 Nanocomposites in Humid Atmosphere. J. Appl. Phys.
2006, 100, 094232; Garcia-Belmonte, G.; Kytin, V.; Dittrich, T.; Bisquert, J. Effect of
Humidity on the AC Conductivity of Nanoporous TiO2. J. Appl. Phys. 2003, 94, 155262.
(36) Jonscher, A. K. The Universal Dielectric Response. Nature 1977, 267, 673-679.
(37) Elliott, S. R. AC Conduction in Amorphous Chalcogenide and Pnictide
Semiconductors. Adv. Phys. 1987, 36, 135-217.

3. Dielectric Properties of Silver Nanoparticles Coated with Silica Shells of Different Thicknesses
139
(38) Tinga, W. R. Progress in Electromagnetics Research; Dielectric Properties of
Heterogeneous Materials, eds. Kong, J. A., Priou, A. Elsevier Science Publishing Co. Inc.,
New York, 1992.
(39) Xue, Q. J. Effective-Medium Theory for Two-Phase Random Composites with an
Interfacial Shell. Mater. Sci. Technol. 2000, 16, 367-369.
(40) Bowman, D. R.; Strout, D. Model for Dielectric Breakdown in Metal-Insulator
Composites. Phys. Rev. B 1989, 40, 4641. For metal insulator composites, the permittivity
diverges close to the percolation threshold of the metallic fillers. In order to reflect this
behavior using the effective medium theory applied in our paper, an infinite value for Ag
would have to be chosen. Here, an arbitrary high enough Ag number that yields the same
results as an infinite Ag value was chosen.

3. Dielectric Properties of Silver Nanoparticles Coated with Silica Shells of Different Thicknesses
140
3.8 Supporting Information
Fig. 44: Wettability test in water/toluene for the Ag@SiO2 (left) and that of hydrophobized with silane reagent (right). The hydrophobized particles are transferred in organic phase.
Fig. 45: Solid-state 29Si CP-MAS NMR spectrum of silver nanoparticles coated with silica shell and surface functionalized with octyl chains showing the chemical shift for the silicon nucleus of the surface- bound alkyl chains at = 13 ppm.

3. Dielectric Properties of Silver Nanoparticles Coated with Silica Shells of Different Thicknesses
141
Fig. 46: SEM image of Ag@SiO2 (6.6 nm) powder in pressed pellet. The sample was measured in high vacuum mode using 3 kV and a TLD detector.
Fig. 47: SEM image of Ag@SiO2 (6.6 nm) powder in pressed pellet. The sample was measured in low vacuum mode using 7 kV and a LVD detector.

3. Dielectric Properties of Silver Nanoparticles Coated with Silica Shells of Different Thicknesses
142
Fig. 48: SEM image of Ag@SiO2 (6.6 nm) powder in pressed pellet. The sample was measured in low vacuum mode using 7 kV and a LVD detector.

4. Highly Stretchable Dielectric Elastomer Composites Containing High Volume Fraction of AgNPs
143
Chapter 4: Highly Stretchable Dielectric Elastomer Composites
Containing High Volume Fraction of Silver Nanoparticles
(AgNPs)
Declaration: The nanoparticles synthesis and functionalization, the microscopy analysis
with TEM/SEM, the nanocomposite formation as well as the mechanical tests were
conducted by Jose Enrico Q. Quinsaat, while dielectric measurements of the filler and the
resulting nanocomposite were conducted by Dr. Dorina Opris. The high molecular weight
PDMS was prepared by Dr. Mihaela Alexandru, while Dr. Borgschulte performed the XPS
measurements for the nanoparticles.
Jose Enrico Q. Quinsaat1,2, Mihaela Alexandru1, Frank A. Nüesch1,2, Heinrich Hofmann2, Andreas Borgschulte3 and Dorina M. Opris*1
1 Swiss Federal Laboratories for Materials Science and Technology (Empa), Laboratory
for Functional Polymers, Überlandstrasse 129, 8600 Dübendorf, Switzerland
2 Ecole Polytechnique Fédérale de Lausanne (EPFL), Materials Institute, 1015 Lausanne,
Switzerland
3 Swiss Federal Laboratories for Materials Science and Technology (Empa), Laboratory
for Advanced Analytical Technologies, Überlandstrasse 129, 8600 Dübendorf, Switzerland

4. Highly Stretchable Dielectric Elastomer Composites Containing High Volume Fraction of AgNPs
144
Abstract: The relative permittivity ( ') of a polymeric material can be significantly
increased when blended with conductive fillers at concentrations approaching percolation
threshold. However, reproducible synthesis of such composites is after decades of research
still a major challenge and a bottleneck for their application. Difficulties arise in
controlling size and shape of the filler as well as in its homogenous distribution within the
composite. These parameters strongly affect the dielectric as well as the mechanical
properties of the composite. While a substantial amount of literature is dealing with the
influence of conductive filler on the dielectric properties of composites, little is known
about their mechanical properties. It is therefore still an important goal to synthesize
materials with simultaneously high ' and good mechanical properties. Here, we report the
synthesis of dielectric elastomers that combine key properties such as high flexibility and
stretchability, high thermal stability, increased ', low dielectric loss and conductivity.
Such materials were prepared by solution processing using quasi-spherical silver
nanoparticles (AgNPs) of defined size in a polydimethylsiloxane matrix (Mw = 692 kDa).
To prevent percolation, the AgNPs were coated with a thin silica shell (< 4 nm). To
increase their compatibility with the silicone matrix, these core/shell nanoparticles were
passivated with a silane reagent. The insulating silica shell around the particles precisely
defines the minimum approach distance between the cores as twice the shell thickness. The
dielectric properties of those passivated particles (filler) were measured in pellets and
found to have an almost frequency independent values of ' = 90 and a very low loss factor
tan = 0.023 at high frequencies. When such particles were used as filler in a
polydimethylsiloxane matrix, composites with low dielectric losses were obtained. A
composite containing 31 vol% filler with ' = 21 and a tan = 0.03 at ~ 1 kHz was
achieved. At a AgNPs volume fraction of 20%, the composite has a ' = 5.9 at ~ 1 kHz, a
dielectric strength of 13.4 V/µm, elastic modulus as low as 350 kPa at 100 % strain, and a
strain at break of 800 %. Due to the high specific energy density per volume at low electric
fields, these composites are attractive materials in applications involving low electric
fields.
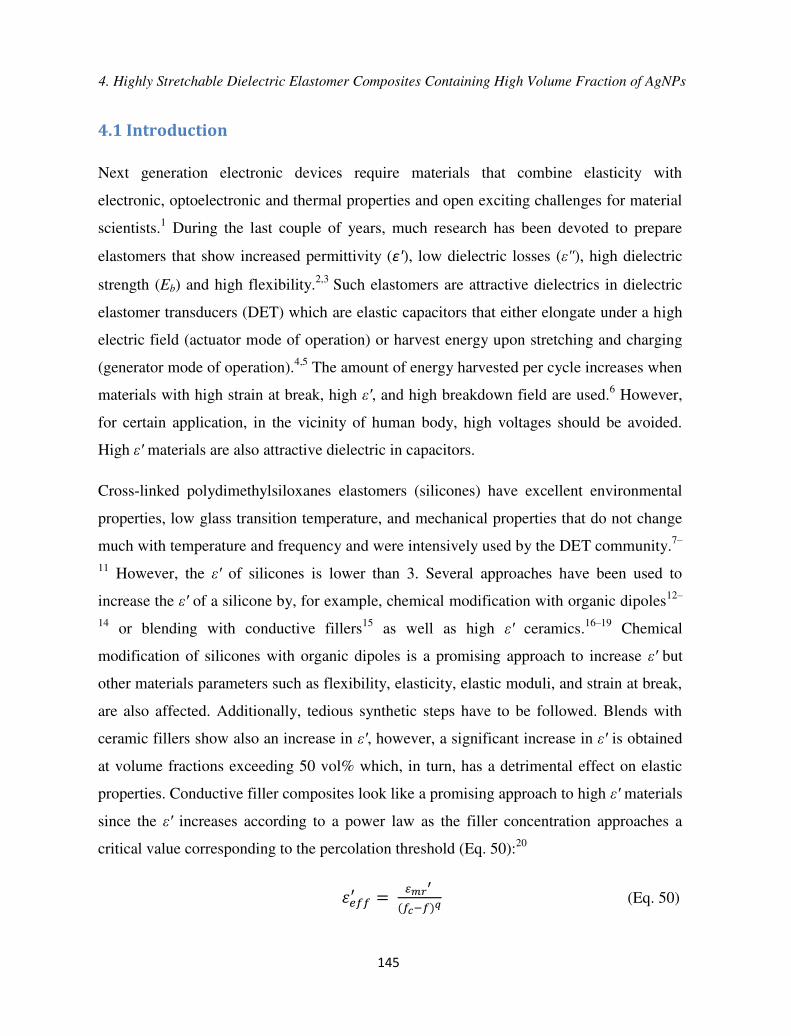
4. Highly Stretchable Dielectric Elastomer Composites Containing High Volume Fraction of AgNPs
145
4.1 Introduction
Next generation electronic devices require materials that combine elasticity with
electronic, optoelectronic and thermal properties and open exciting challenges for material
scientists.1 During the last couple of years, much research has been devoted to prepare
elastomers that show increased permittivity (ε'), low dielectric losses ( "), high dielectric
strength (Eb) and high flexibility.2,3 Such elastomers are attractive dielectrics in dielectric
elastomer transducers (DET) which are elastic capacitors that either elongate under a high
electric field (actuator mode of operation) or harvest energy upon stretching and charging
(generator mode of operation).4,5 The amount of energy harvested per cycle increases when
materials with high strain at break, high ', and high breakdown field are used.6 However,
for certain application, in the vicinity of human body, high voltages should be avoided.
High ' materials are also attractive dielectric in capacitors.
Cross-linked polydimethylsiloxanes elastomers (silicones) have excellent environmental
properties, low glass transition temperature, and mechanical properties that do not change
much with temperature and frequency and were intensively used by the DET community.7–
11 However, the ' of silicones is lower than 3. Several approaches have been used to
increase the ' of a silicone by, for example, chemical modification with organic dipoles12–
14 or blending with conductive fillers15 as well as high ' ceramics.16–19 Chemical
modification of silicones with organic dipoles is a promising approach to increase ' but
other materials parameters such as flexibility, elasticity, elastic moduli, and strain at break,
are also affected. Additionally, tedious synthetic steps have to be followed. Blends with
ceramic fillers show also an increase in ', however, a significant increase in ' is obtained
at volume fractions exceeding 50 vol% which, in turn, has a detrimental effect on elastic
properties. Conductive filler composites look like a promising approach to high ' materials
since the ' increases according to a power law as the filler concentration approaches a
critical value corresponding to the percolation threshold (Eq. 50):20
′ = � ′ �− (Eq. 50)

4. Highly Stretchable Dielectric Elastomer Composites Containing High Volume Fraction of AgNPs
146
whereby eff' and mr’ are the permittivity of the composite and of the polymer matrix
respectively, fc is the percolation threshold fraction, f is the volume fraction of the filler,
and q is a scaling constant. Metal particles, metal oxide particles, carbon black, carbon
nanotubes, and conductive polymers have been used as conductive fillers.6,21–26
Conductive polymer fillers have the advantage of being lightweight and easy to prepare.
However, when blended in a polymer matrix, the morphology of the filler is rather difficult
to control and phase separation is often observed.27,28 Since permittivity is sensitive to the
morphology, shape and size of the conductive filler, special care has be taken to control
these parameters.29 In addition, the interfacial interaction shifts the percolation threshold
toward lower volume fraction of nanoparticles and starts to be effective when the
proportion between the radius of the nanoparticles and the thickness of the shell
approaches a value of 10.30 If the filler has a large size or is agglomerated, and if its size is
close to that of the film thickness, discharge between electrodes happens.31 In many cases,
the addition of conductive nanoparticles enhances ' but increases the dielectric losses,
making the potential gain in ' useless. Therefore, to synthesize composites with reliable
and reproducible properties, the size of the filler and its dispersion in the composites must
be carefully controlled.32
Metal nanoparticles (MNPs) are easy to polarize and their shape and size can be precisely
controlled and are therefore very good model systems. When applied as fillers in the above
context, agglomeration of MNPs has to be avoided when dispersed into a matrix. Elsewise
conductive paths can form which are detrimental to the properties. MNPs can be
incorporated into a polymer matrix using in situ or ex situ approaches.33,34 In the former,
the particles are formed through reduction or decomposition of a metal salt that was
dispersed in polymer matrix.35 However, the morphology, the shape, and the size of the
MNPs in the matrix is difficult to control and composites with rather low volume fraction
of metal are formed.36,37 Furthermore, the residual components formed during
reduction/decomposition of the metal source are either left in the composite or have to be
removed by tedious swelling/extraction steps. We considered this approach therefore

4. Highly Stretchable Dielectric Elastomer Composites Containing High Volume Fraction of AgNPs
147
unattractive for our goal. In the latter approach, preformed particles are blended into a
polymer matrix. Here, the incompatibility and the agglomeration of the metal filler in the
polymer matrix are problems that have to be overcome. Although there has been
substantial amount of work devoted to the dielectric properties of MNPs polymer
composites, fillers were used that were either polydisperse, or had large particles size and
non-uniform shapes, as well as undefined/or no insulating coating. As mentioned above,
such MNPs were not attractive for our purpose.
Silver (Ag) has a high reduction potential and can be prepared in different size and shapes
and was therefore selected for our investigations.38,39 Polymer composites containing silver
nanoparticles (AgNPs) are known. Shen and coworkers used AgNPs coated with an
organic shell as filler in an epoxy matrix.40 The organic shells were tuned from 4-6 nm up
to 8-10 nm. They showed that nanocomposites with the particles surrounded by thinner
shells featured a higher ε' than the nanocomposite with thicker shells. The rather low
dielectric breakdown of the composites of less than 1 V/ m which is significantly lower as
compared to the epoxy matrix used (30 V/ m), clearly shows the importance of the type
and the thickness of the insulating shell used. Very important is also the influence of the
volume content of MNPs on the mechanical properties of the resulting materials.
Unfortunately, to the best of our knowledge, no detailed characterization of the mechanical
properties of composites containing high vol% of metal filler exist. Furthermore, elastic
composites containing high vol% of MNPs that show large reversible deformations are not
known.
It was thus a prime goal of the present work to provide robust access to metal particles that
are not susceptible to chemical oxidation and which have defined size. The present work
also aims to prepare surface-treated core/shell Ag/silica nanoparticles which we refer to as
Ag@SiO2 and to use them as filler in polydimethylsiloxane (PDMS) matrix to create high-
profile composite materials that allowed us investigating the influence of the filler on the
mechanical and dielectric properties of the composite. This would allow us elucidating
how much the ' can be increased and how other properties like dielectric loss,
conductivity and dielectric breakdown are affected, keeping an eye also on the mechanical

4. Highly Stretchable Dielectric Elastomer Composites Containing High Volume Fraction of AgNPs
148
properties. The preparation of large amounts of AgNPs was possible by using the polyol
synthesis, while the silica coating was achieved by using an optimized Stöber method.41,42
To ensure optimum performance of the composite, the compatibility of the Ag@SiO2
particles with the PDMS matrix was significantly increased by treating the surface of the
particles with hexamethyldisilazane (HMDS). Composites of surface-treated Ag@SiO2
filler in PDMS were made by solution processing. The dielectric and mechanical properties
of different vol% of Ag@SiO2 filler in PDMS were investigated for the first time.
4.2 Experimental Section
4.2.1 Materials and Methods
AgNO3, poly(vinyl pyrrolidinone) (PVP), ethylene glycol (EG),
octamethylcyclotetrasiloxane (D4), H2SO4, hexamethyldisilazane (HMDS), ammonia
(NH4OH), and dibutyltindilaurate (Sn) catalysts were purchased from Aldrich and used as
received. Linear hydroxyl end-functionalized polydimethylsiloxane (PDMS) (Mw = 139
kDa) by ABCR (25-35 % mehylhydrosiloxane)-dimethylsiloxane-copolymer (AB109380)
cross-linker by ABCR. Higher molecular weight hydroxyl end-functionalized
polydimethylsiloxane (Mw = 692 kDa) was prepared according to the literature.43
The nanoparticles were observed by SEM on a FEI NovaNanoSEM 230 using a BSED
detector, TEM analysis were done with Philips CM30 TEM and JEOL 2200FS
TEM/STEM, UV-vis absorption spectra were recorded with a Cary 50 spectrophotometer,
DLS were done with a Malvern Zetasized Nano ZS, the thermogravimetric analysis (TGA)
was conducted with a Perkin Elmer TGA7 at a heating rate of 20 °C min-1 under a He gas
flow. In situ-XPS surface analysis are performed in a modified VG EscaLab spectrometer
with the base pressure < 1 × 10⁻¹⁰ mbar. XPS spectra were collected with a SPECS
PHOIBOS 100 analyzer using a non-monochromated X-ray source (Al Kαμ 1486.6 eV,
twin anode Mg Kα/Al Kα). Image analysis was used for the TEM micrographs to estimate
the particles size. The number of particles measured was about 400 for Ag core and about

4. Highly Stretchable Dielectric Elastomer Composites Containing High Volume Fraction of AgNPs
149
100 for the coated particles with the help of a ruler for Windows. For the determination of
the amount of silver in the composites, about 50 mg of material was transferred to a pre-
cleaned quartz vessel. Thereafter, 3 mL of nitric acid (65 %) and 1 mL of H2O2 (30 %) was
added to the components. The contents were transferred into a microwave vessel which
contained 5 mL of deionized water (Milli-Q-Quality) and 1 mL H2O2. The nanocomposite
was decomposed in the microwave MLS 1200. The clear solution was transferred into a 15
mL PP Centrifuge tube with deionized water and diluted to 10 mL. For the quantification
of the silver content in the nanocomposite, the prepared solution was once again diluted by
a factor of 100. Standard silver solutions containing 1, 2, 5, 10, 20 and 50 mg/L prepared
from a commercially available 1 g/L silver standard solution were used for the calibration
of the ICP-OES (Vista pro Varian). The particle dispersions in toluene were prepared with
a tip sonicator (Sonics VCX-500 Model CV33).
The microstructures of the films were measured with SEM on samples prepared by the
freeze-breaking method in liquid nitrogen. Permittivity measurements were done in the
frequency range of 1 Hz to 1 MHz using an Novocontrol Alpha-A Frequency Analyzer
using a Hewlett Packard 16451B dielectric test fixture equipped with round electrodes.
Prior to the measurements, Au electrodes with a thickness of 50 nm were sputtered on both
sides of the films. The diameter of the electrodes was 12.5 mm (A series), 7 mm (B series)
or 21 mm (B20). To ensure a good contact and a uniform “pressure” over the samples
(because of the round electrode used), gold plates slightly smaller than the coated
electrodes were used. No dependence of the dielectric properties with the electrode size
was observed, which is supportive for homogenous materials. The amplitude of the
probing ac electric signal applied to the samples was 1 V. The permittivity was determined
from the capacitance: C = 0A/d, where A is the electrode area, d is the thickness of the
capacitor, and 0 is the vacuum permittivity.
The tensile tests were performed using a Zwick Z010 tensile test machine with a crosshead
speed of 500 mm/min. Tensile test specimens with a gauge width of 2 mm and a gauge
length of 18 mm were prepared by die cutting. The strain was determined using a traverse
moving sensor. The curves were averaged from 3 independent experiments. The tensile
4. Highly Stretchable Dielectric Elastomer Composites Containing High Volume Fraction of AgNPs
150
modulus was determined from the slope of the stress-strain curves using a linear fit to the
data points within 10% strain. Dynamic mechanical analysis was carried out on a RSA 3
DMA from TA Instruments. Stripes of 10 mm wide, 24 mm long, and 58 µm thick were
measured under a dynamic load of 2 g, at 1 % strain in the frequency range of 0.01 to 10
Hz, at 26 °C, and 65% humidity.
4.2.2 Synthesis of AgNPs
In a 250 mL round-bottom flask, PVP (Mw = 40 kDa) was dissolved in EG (100 mL) under
sonication. After complete dissolution of the polymer, the flask was stirred in an oil bath at
130 °C for 30 min, then an aqueous solution of AgNO3 (2 mL, 1 g/mL) was injected
rapidly and the reaction mixture was stirred further for 1 h at a speed of 900 rpm. The flask
was later removed from the oil bath, cooled in a water bath and the reaction mixture was
diluted with acetone, centrifuged at 5’000 rpm for 1 h and decanted. The resulting
precipitate was further washed with acetone and water 3 times before redispersion in
EtOH. The reaction was repeated 20 times and the products were redispersed in 1.5 L of
EtOH. Yield: 14.2 g (57 %).
4.2.3 Synthesis Ag@SiO2 Core-shell Particles
The silica-coating was performed based on existing protocols of the modified Stöber
method.41 From the stock solution of AgNPs prepared as described above, 200 mL was
filled in a 1 L flask and diluted to 600 mL with EtOH. The suspension was treated with
NH4OH (29 %, 25 mL) and with an ethanolic solution of TEOS (50 mL, 0.6 vol% TEOS)
and stirred at 25 °C for 1λ h. The mixture was diluted with acetone, centrifuged at 5’000
rpm for 30 min, decanted, and redissolved in EtOH. The products were washed with
acetone for further 3 times before redispersion in EtOH. The reaction was performed 7
times to obtain Ag@SiO2 core-shell particles with a very thin silica shell of 3.3 ± 0.7 nm
(~ 100 particles measured).

4. Highly Stretchable Dielectric Elastomer Composites Containing High Volume Fraction of AgNPs
151
4.2.4 Synthesis of Ag@SiO2@Si(CH3)3
The ethanolic suspension of Ag@SiO2 core-shell particles was centrifuged. Most of the
ethanol was removed by decantation and the residue was redispersed in anhydrous toluene
(200 mL) and stirred at 500 rpm. To this suspension, hexamethyldisilazane (HMDS) (23
mL) was added and stirred for 6 h. The particles were recovered by centrifugation, washed
once again with toluene to obtain the surface-treated Ag@SiO2 core-shell particles. Yield:
13.5 g (> 95 %).
4.2.5 Synthesis of Composites of Series A
The Ag@SiO2@Si(CH3)3, PDMS (Mw ~139 kDa), and (25-35 % mehylhydrosiloxane)-
dimethylsiloxane-copolymer cross-linker were mechanically mixed to a homogenous
dispersion. Toluene was used to adjust the viscosity of the mixture. The dibutyltindilaurate
was then added and films were prepared by doctor blading. The samples were aged for
about one month before testing. For the amounts used please see Tab. 13.
4.2.6 Synthesis of Composites of Series B
The Ag@SiO2@Si(CH3)3 was first dispersed in toluene by using a tip sonication operated
at a power of 40 % for at least 10 min. To this, PDMS (Mw = 692 kDa) and (25-35 %
mehylhydrosiloxane)-dimethylsiloxane-copolymer cross-linker were added and a
homogenous composite was made by mechanically mixing. The Sn-catalyst was then
added and films were prepared by doctor blading. The samples were aged for about one
month before testing.
4.2.7 Synthesis of Composite B31
The Ag@SiO2@Si(CH3)3 filler, PDMS (Mw = 692 kDa), and (25-35 %
mehylhydrosiloxane)-dimethylsiloxane-copolymer cross-linker were mechanically mixed

4. Highly Stretchable Dielectric Elastomer Composites Containing High Volume Fraction of AgNPs
152
to a homogenous dispersion using cyclohexane solvent to adjust the viscosity. After
obtaining a good dispersion, the catalyst was added. Cyclohexane was selected as solvent,
because it is more facile to be removed in high vacuum at room temperature and therefore
the speed of cross-linking reaction is lowered. To avoid agglomeration of the particles, a
sonicator bath was used during the evaporation. A sticky powder formed after the solvent
evaporation which was pressed in pellets by using an IR press, heated at 80 °C for 5 h.
Platinum electrodes were sputtered on the pellet before the dielectric measurements were
done.
4.3 Results and Discussion
4.3.1 Synthesis and Characterization of the Filler Particles
We selected Ag as metal source because AgNPs are stable against oxidation and can be
prepared in different sizes and shapes. Since other metal nanoparticles such as aluminum,
zinc, iron, nickel and copper form an insulating oxide layer when exposed to air, we did
not consider using them because their dielectric properties might change in time or when
exposed to elevated temperatures due to surface oxidation.44–48
AgNPs were prepared by using the so called polyol synthesis. Briefly, an aqueous silver
nitrate solution was injected into a preheated solution of poly(vinyl pyrrolidone) (PVP)
stabilizer in ethylene glycol (EG) at 130°C for 60 min. The particles were purified by
washing several times with ethanol/acetone. Fig. 49 shows the TEM images of the
prepared AgNPs. The average particles size was 57 ± 10 nm and DLS confirmed a
reasonable size distribution (Fig. 50 and Fig. 51). Dried particles kept in normal
atmosphere for four months did not show any change in their chemical composition as
proved by XRD and XPS spectra where no signals typical for silver oxide were observed
(see Supp. Inform.). The particles have a cubic structure with peaks at 2θμ 38.1 (111), 44.3
(200), 64.5 (220), 77.4 (311), and 81.5 (222) that are in agreement with the published data
(see Supporting Information).49 The XPS analysis shows a peak at 368.2 eV due to metallic

4. Highly Stretchable Dielectric Elastomer Composites Containing High Volume Fraction of AgNPs
153
silver. A small peak at 365.8 eV due to surface silver atoms surrounded by the PVP chain
and no peak at 367.4 eV typical for silver oxide was observed. It can be concluded that the
polyol synthesis, which is performed at temperatures exceeding 100 °C under normal
atmosphere, does not lead to an oxidation of the silver surface neither during the synthesis
nor during storage of the particles in the laboratory.
Fig. 49a-b: TEM micrographs of AgNPs prepared by reduction of AgNO3 with ethylene glycol (left) and of their coating with a thin silica shell of about 3.3 nm (right).
To avoid conductive paths through the material, AgNPs were surface-coated with an
insulating shell prior blending. Instead of using an oxidation process, we used a hydrolysis
step for the coating. We have recently showed that it is possible to synthesize AgNPs
coated with a thin insulating silica shell and also to scale-up this procedure.50 Silica is an
excellent insulator and has a good compatibility with the silicone matrix. A slightly
modified so called Stöber method was used.51 Our previous investigations have shown that
a silica shell thickness of less than 4 nm is optimal to avoid electrical conductivity and to
increase ' of the resulting nanocomposites concurrently.50 This coating was achieved by
dispersing the AgNPs at a certain concentration in ethanol and let tetraethoxysilane
(TEOS) to hydrolyze under basic conditions and deposit on the Ag surface. The silica-
coating is facilitated by the presence of residual PVP around the Ag cores since it serves as
4. Highly Stretchable Dielectric Elastomer Composites Containing High Volume Fraction of AgNPs
154
an anchoring group for the growing SiO2 layer.51,52 The successful coating was proven by
TEM, UV-vis, DLS and EDX. TEM images show a strong contrast between the black
silver cores and the grey silica shell which clearly proves the formation of Ag@SiO2
core/shell structures (Fig. 49). Further evidence for the coating is provided by surface
plasmon resonance. Upon coating the AgNPs with a thin silica shell (3.3 ± 0.7 nm), a slight
bathochromic shift of the absorption peak from = 436 nm to = 437 nm in the UV-vis
spectra is observed (Tab. 12 and Fig. 50) as a result of the higher dielectric constant of
SiO2 as the new medium compared to PVP/EtOH. DLS also confirms a slight increase in
the hydrodynamic radius after the silica-coating of the particles (Fig. 51). Generally, the
presence of the silicon peak in the EDX of the coated AgNPs further supports the presence
of the silica shell (see Supporting Information). It is important to note that each individual
AgNPs is coated with a silica shell of about the same thickness and also that no
agglomeration of the AgNPs occurred during the coating. We can also confirm that the
molecular weight of the PVP used for the synthesis is important for the functionalization of
the particles with the silica shell.51 For example PVP of Mw = 40 kDa allowed formation of
uniform silica shells as compared to PVP of Mw = 10 kDa where the silica shell was less
uniform. This effect is even more pronounced when a very thin silica shell is desired. Thin
uniform silica shells are more difficult to prepare than the thick shells. According to the
literature, lower molecular weight PVP might even lead to the agglomeration of the core-
shell particles due to the lack of shielding off the silver cores from the attractive van der
Waals forces.25
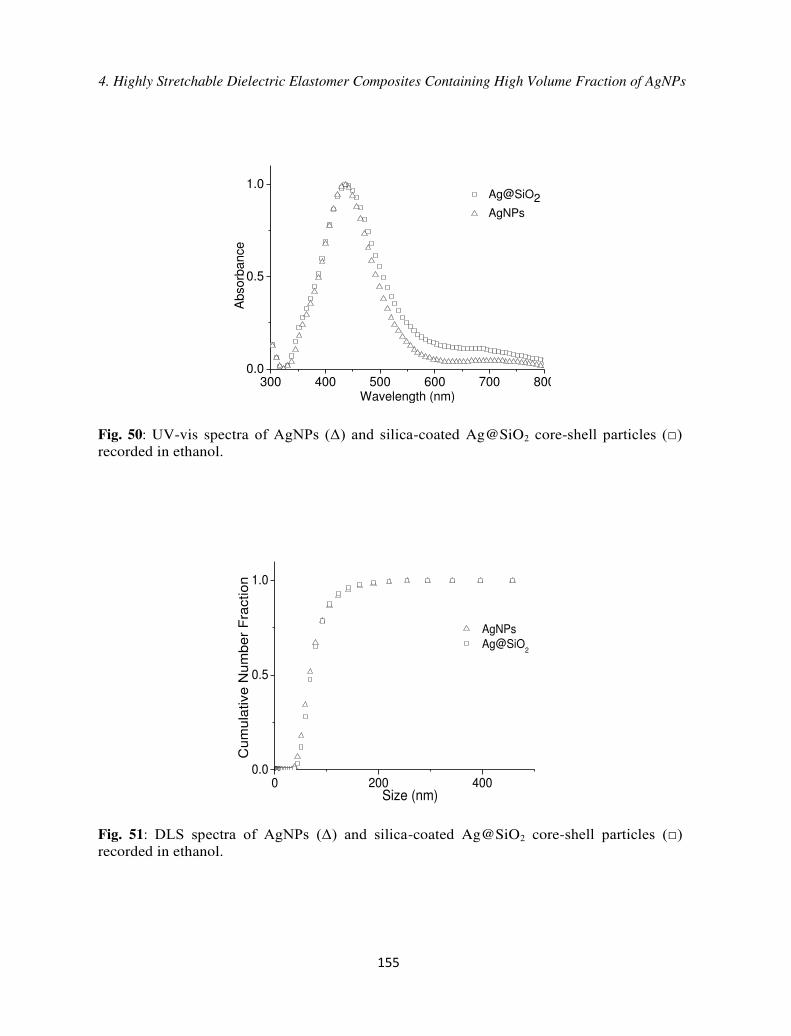
4. Highly Stretchable Dielectric Elastomer Composites Containing High Volume Fraction of AgNPs
155
300 400 500 600 700 8000.0
0.5
1.0 Ag@SiO2
AgNPs
Abso
rbance
Wavelength (nm)
Fig. 50: UV-vis spectra of AgNPs (Δ) and silica-coated Ag@SiO2 core-shell particles (□) recorded in ethanol.
0 200 4000.0
0.5
1.0
Cum
ula
tive N
um
ber
Fra
ction
Size (nm)
AgNPs Ag@SiO
2
Fig. 51: DLS spectra of AgNPs (Δ) and silica-coated Ag@SiO2 core-shell particles (□) recorded in ethanol.
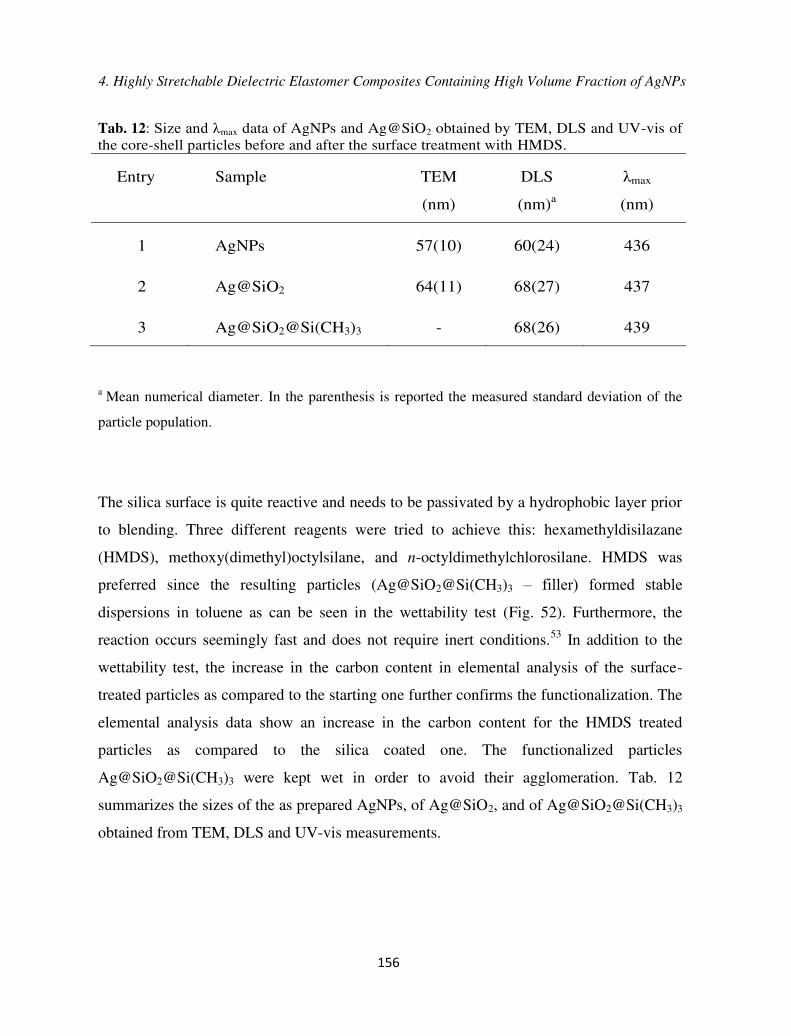
4. Highly Stretchable Dielectric Elastomer Composites Containing High Volume Fraction of AgNPs
156
Tab. 12: Size and max data of AgNPs and Ag@SiO2 obtained by TEM, DLS and UV-vis of the core-shell particles before and after the surface treatment with HMDS.
Entry Sample TEM
(nm)
DLS
(nm)a
max
(nm)
1 AgNPs 57(10) 60(24) 436
2 Ag@SiO2 64(11) 68(27) 437
3 Ag@SiO2@Si(CH3)3 - 68(26) 439
a Mean numerical diameter. In the parenthesis is reported the measured standard deviation of the
particle population.
The silica surface is quite reactive and needs to be passivated by a hydrophobic layer prior
to blending. Three different reagents were tried to achieve this: hexamethyldisilazane
(HMDS), methoxy(dimethyl)octylsilane, and n-octyldimethylchlorosilane. HMDS was
preferred since the resulting particles (Ag@SiO2@Si(CH3)3 ‒ filler) formed stable
dispersions in toluene as can be seen in the wettability test (Fig. 52). Furthermore, the
reaction occurs seemingly fast and does not require inert conditions.53 In addition to the
wettability test, the increase in the carbon content in elemental analysis of the surface-
treated particles as compared to the starting one further confirms the functionalization. The
elemental analysis data show an increase in the carbon content for the HMDS treated
particles as compared to the silica coated one. The functionalized particles
Ag@SiO2@Si(CH3)3 were kept wet in order to avoid their agglomeration. Tab. 12
summarizes the sizes of the as prepared AgNPs, of Ag@SiO2, and of Ag@SiO2@Si(CH3)3
obtained from TEM, DLS and UV-vis measurements.

4. Highly Stretchable Dielectric Elastomer Composites Containing High Volume Fraction of AgNPs
157
Fig. 52: Wetting test of Ag@SiO2 core-shell particles conducted in toluene/water mixture before (left) and after (right) surface functionalization with HMDS.
4.3.2 Synthesis and Characterization of AgNP Composites
Two series of composites were prepared and are named as Xy, where X represents the
name of the series synthesized with PDMS of different Mw and y represents the Ag vol%.
Since the particles were kept wet all the time, the amount of Ag in the composites was
determined by Inductively Coupled Plasma-Optical Emission Spectrometry (ICP-OES) and
is given as y in the samples’ code. As matrix, a commercial and a home-made hydroxyl
end-functionalized polydimethylsiloxane (PDMS) Mw = 139 kDa (for Series A) and Mw =
692 kDa (for series B) were used, respectively. These PDMS polymers were cross-linked
via a condensation reaction of the hydroxyl end-groups with the hydrosilane groups of
(25-35 % methylhydrosiloxane)-dimethylsiloxane-copolymer cross-linker (CL) (see
Experimental Section). Different volumes of highly concentrated filler solution in toluene
were dispersed in PDMS matrix. To these mixtures the CL and the Sn-catalyst were added.
Films were prepared by doctor blade technique. Depending on the Ag volume fraction the
color of the composites changes from brown (below 10-15 vol%) to grey (> 15 %). Tab. 13
gives an overview of the reagents used for the synthesis of materials of series A and B.
The use of organotin catalyst is also known as Room Temperature Vulcanization
(RTV) or ‘cold vulcanization’ which allows the formation of elastomers in about 24
h.54 Nevertheless, the samples were aged for 1 month prior to performing the
mechanical measurements to ensure the complete evaporation of residual toluene
and to allow sufficient time for the finalization of the condensation reactions. Our
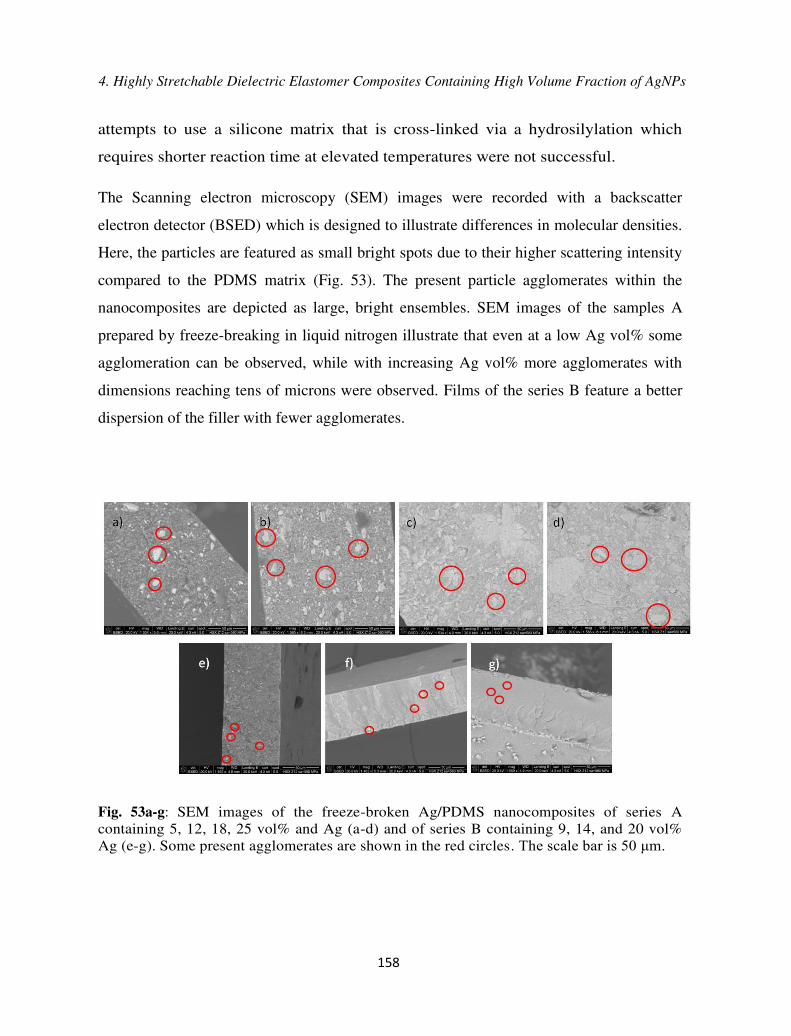
4. Highly Stretchable Dielectric Elastomer Composites Containing High Volume Fraction of AgNPs
158
attempts to use a silicone matrix that is cross-linked via a hydrosilylation which
requires shorter reaction time at elevated temperatures were not successful.
The Scanning electron microscopy (SEM) images were recorded with a backscatter
electron detector (BSED) which is designed to illustrate differences in molecular densities.
Here, the particles are featured as small bright spots due to their higher scattering intensity
compared to the PDMS matrix (Fig. 53). The present particle agglomerates within the
nanocomposites are depicted as large, bright ensembles. SEM images of the samples A
prepared by freeze-breaking in liquid nitrogen illustrate that even at a low Ag vol% some
agglomeration can be observed, while with increasing Ag vol% more agglomerates with
dimensions reaching tens of microns were observed. Films of the series B feature a better
dispersion of the filler with fewer agglomerates.
Fig. 53a-g: SEM images of the freeze-broken Ag/PDMS nanocomposites of series A containing 5, 12, 18, 25 vol% and Ag (a-d) and of series B containing 9, 14, and 20 vol% Ag (e-g). Some present agglomerates are shown in the red circles. The scale bar is 50 m.
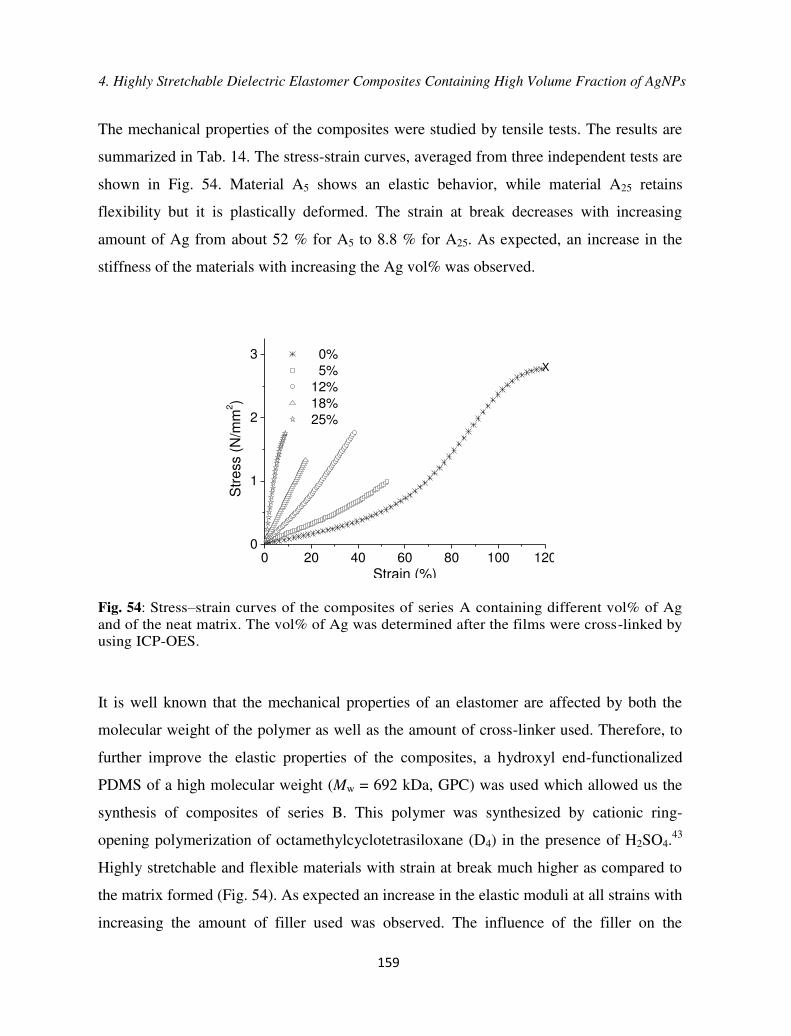
4. Highly Stretchable Dielectric Elastomer Composites Containing High Volume Fraction of AgNPs
159
The mechanical properties of the composites were studied by tensile tests. The results are
summarized in Tab. 14. The stress-strain curves, averaged from three independent tests are
shown in Fig. 54. Material A5 shows an elastic behavior, while material A25 retains
flexibility but it is plastically deformed. The strain at break decreases with increasing
amount of Ag from about 52 % for A5 to 8.8 % for A25. As expected, an increase in the
stiffness of the materials with increasing the Ag vol% was observed.
0 20 40 60 80 100 1200
1
2
3 0% 5% 12% 18% 25%
Str
ess
(N
/mm
2)
Strain (%)
X
Fig. 54: Stress–strain curves of the composites of series A containing different vol% of Ag and of the neat matrix. The vol% of Ag was determined after the films were cross-linked by using ICP-OES.
It is well known that the mechanical properties of an elastomer are affected by both the
molecular weight of the polymer as well as the amount of cross-linker used. Therefore, to
further improve the elastic properties of the composites, a hydroxyl end-functionalized
PDMS of a high molecular weight (Mw = 692 kDa, GPC) was used which allowed us the
synthesis of composites of series B. This polymer was synthesized by cationic ring-
opening polymerization of octamethylcyclotetrasiloxane (D4) in the presence of H2SO4.43
Highly stretchable and flexible materials with strain at break much higher as compared to
the matrix formed (Fig. 54). As expected an increase in the elastic moduli at all strains with
increasing the amount of filler used was observed. The influence of the filler on the

4. Highly Stretchable Dielectric Elastomer Composites Containing High Volume Fraction of AgNPs
160
mechanical properties is more pronounced in the low strain regime, while with increasing
the strain, the filler influence is less pronounced (see Fig. 55 insert and Tab. 13). Two
composites with 20 vol% Ag but different amount of cross-linker were first prepared
(stiffB20 and B20) (for the amounts used, please see Tab. 13). Composite stiffB20 has a strain
at break of 270 % and elastic moduli at low strains in the 6 MPs regime. For composite B20
the amount of cross-linker used was reduced to half. Composite B20 despite of its high Ag
vol% content, shows excellent elastic properties with a strain at break as high as 800 % and
moduli of elasticity as low as 350 kPa at 100 % strain. The Ag vol% content was further
reduced for materials B14 and B9. These composite show a slightly increase in the strain at
break and decrease in the elastic moduli as compared to B20. Composites B14 and B20 were
further subjected to extension-relaxation cycles. An initial load of 0.01 N was used. Fig. 56
shows the behavior of a freshly prepared specimen in its first five cycles of extension-
relaxation to a maximum of 50 % strain. As can be seen, for the second extension-
relaxation cycle the stress required on reloading is reduced as compared to the initial
loading and the hysteresis observed for the subsequent cycles was rather low.

4. Highly Stretchable Dielectric Elastomer Composites Containing High Volume Fraction of AgNPs
161
Tab. 13: The amount of components used for the synthesis of the matrix and of materials of series A and B.
Entry PDMS
[g]
CL
[µL]c)
Density ρ
[g/cm3]
V(toluene)
[mL]
A0 1.9a) 800 0.λλ 2
A5 0.9a) 380 1.52 1.3
A12 0.8a) 340 2.21 2.8
A18 0.7a) 295 2.λ4 3.5
A25 0.4a) 168 3.66 2.9
stiffB20 0.15b) 32 3.05 3
B20 0.15b) 16 3.05 3
B14 0.15b) 16 2.46 3
B9 0.15b) 16 1.83 3
B0 0.3 32 0.98 3.5
Hydroxyl end-functionalized PDMSs were used: a) Mw = 139 kDa and b) Mw =692 kDa. c) For all composites a solution of Sn-catalyst in toluene (50 wt%) was used and the proportion between cross-linker/catalyst was 4. Toluene was used to adjust the viscosity of the composites. The amount of Ag contained in the composite was determined after cross-linking by ICP-OES.

4. Highly Stretchable Dielectric Elastomer Composites Containing High Volume Fraction of AgNPs
162
0 200 400 600 800 10000
1
2
3
4
5
6
Str
ess
(N
/mm
2)
Strain (%)
stiff
B20
B20
B14
B9
B0
Fig. 55: Stress-strain curves of the matrix B0, stiffB20, B20, B14, and B9; the enlargement for
the low strains (insert); and photos of B20 in its relaxed and strained form (bottom) (the scale bar represents 1 cm).
The same sample was subjected to successively higher strains from 50% up to 450%
followed by the return to the original gauge length (see Supporting Information). A
strong dependence of the stress-strain curves upon increasing the strain level was
observed. This stress softening phenomenon is typical for filled rubber materials and
is known as the Mullins effect. Different mechanisms have been proposed to explain
this effect including reorganization of the polymer network, reorganization of the
filler-filler networks, and/or the detachment of the polymer network from the
filler.55 Material B20 was aged for 5 days at 150 °C and its stress-strain and the cyclic
relaxation behavior was compared with that of a B20 sample aged at 25 °C for 10 days (see
Supporting Information). The elastic properties were only slightly affected by the
temperature. Material B20 is slightly stiffer after this aging and the strain at break
decreased, but the elastic property is retained. The cyclic tests show some differences for
the first strain-release cycle and a small difference between the cycles at the used strain.
0 20 40 60
0.0
0.1
0.2
0.3
0.4

4. Highly Stretchable Dielectric Elastomer Composites Containing High Volume Fraction of AgNPs
163
The hysteresis loop at the first strain-release cycle is more pronounced for the sample that
was aged at elevated temperatures (see Supporting Information). Additionally, dynamic
mechanical analysis has been carried out on B20 (Fig. 56 right). The elastic modulus
measured at low strains (1%) and at 0.01 Hz was 2.4 MPa while by increasing the
frequency to 0.1 Hz an increase in the elastic modulus to 3.4 MPa was observed. The
viscoelastic losses (tan ) are rather low (tan < 0.2 at all frequencies) and further support
the good elastic properties of B20. Silicones are generally characterized by a pronounced
thermal stability and a single weight loss step at high temperatures. It has been
demonstrated that PDMS degrades through the depolymerisation of PDMS to give cyclic
oligomeric siloxanes.56,57 The silicone matrix used by us (B0) is stable up to 400 °C where
it starts to decompose (Fig. 57). The decomposition of the composites of series B proceeds
in one step and the degradation of the polymer is shifted to values above 500 °C. The
incorporation of filler to the PDMS restricts the chain mobility and therefore the
degradation of the nanocomposites is delayed compared to the pure silicone rubber.58,59
An increase in the amount of filler does not lead to a further change in the thermal
properties of the nanocomposites. As expected, the amount of residue left due to the
Ag@SiO2 filler increases with increasing the Ag vol% and clearly shows that the
composites have high filler content. The amount of residue roughly corresponds to the
amount of Ag@SiO2 used.
0 3 6 90.0
0.5
1.0
Str
ess
(N
/mm
2)
Strain [%]5025 0.01 0.1 1 10
105
106
107
E' Tan E''
Frequency [Hz]
E' [
Pa]
0.10
0.12
0.14
0.16
0.18
0.20
Tan
Fig. 56: Cyclic stress-strain relaxation curves of B14 at 50 % strain (left) and dynamic mechanical analysis for B20 at different frequencies (right).
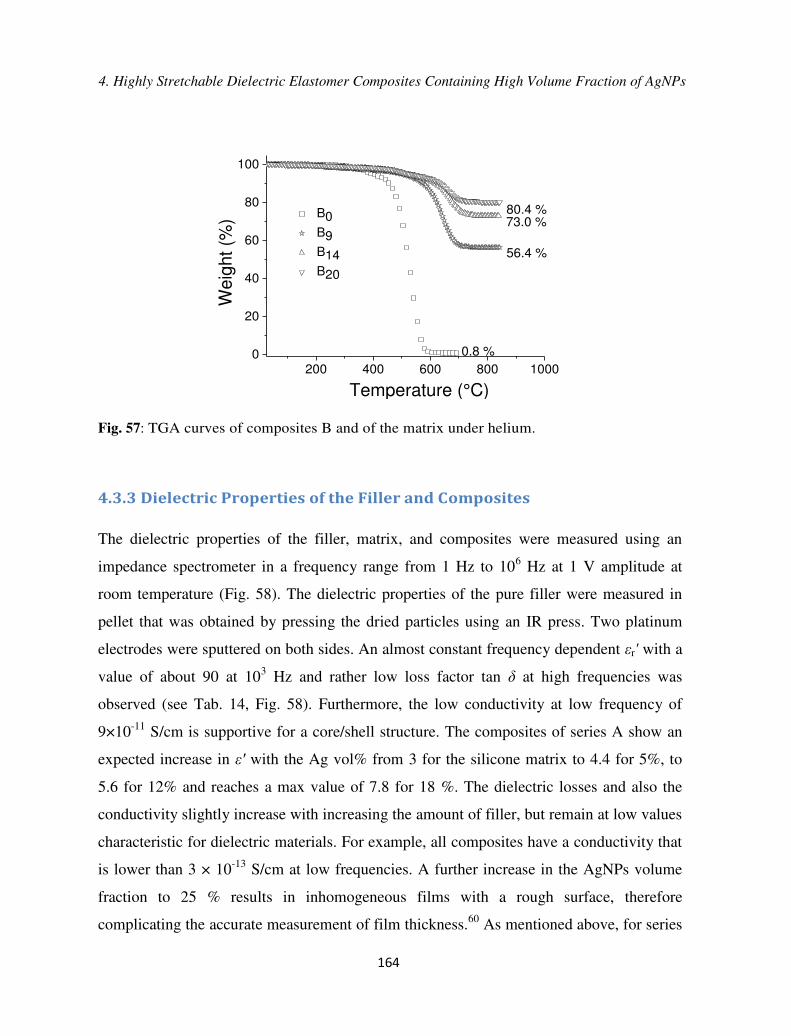
4. Highly Stretchable Dielectric Elastomer Composites Containing High Volume Fraction of AgNPs
164
200 400 600 800 10000
20
40
60
80
100
0.8 %
56.4 %
73.0 % B0 B9 B14 B20
We
igh
t (%
)
Temperature (°C)
80.4 %
Fig. 57: TGA curves of composites B and of the matrix under helium.
4.3.3 Dielectric Properties of the Filler and Composites
The dielectric properties of the filler, matrix, and composites were measured using an
impedance spectrometer in a frequency range from 1 Hz to 106 Hz at 1 V amplitude at
room temperature (Fig. 58). The dielectric properties of the pure filler were measured in
pellet that was obtained by pressing the dried particles using an IR press. Two platinum
electrodes were sputtered on both sides. An almost constant frequency dependent r' with a
value of about 90 at 103 Hz and rather low loss factor tan at high frequencies was
observed (see Tab. 14, Fig. 58). Furthermore, the low conductivity at low frequency of
9×10-11 S/cm is supportive for a core/shell structure. The composites of series A show an
expected increase in ' with the Ag vol% from 3 for the silicone matrix to 4.4 for 5%, to
5.6 for 12% and reaches a max value of 7.8 for 18 %. The dielectric losses and also the
conductivity slightly increase with increasing the amount of filler, but remain at low values
characteristic for dielectric materials. For example, all composites have a conductivity that
is lower than 3 × 10-13 S/cm at low frequencies. A further increase in the AgNPs volume
fraction to 25 % results in inhomogeneous films with a rough surface, therefore
complicating the accurate measurement of film thickness.60 As mentioned above, for series

4. Highly Stretchable Dielectric Elastomer Composites Containing High Volume Fraction of AgNPs
165
B, a PDMS of a higher molecular weight was used. The concentration of silver was varied
between 9 and 31 vol% Ag. High quality films were prepared for concentrations up to 20
% by the doctor blade technique. However, a further increase in the concentration of the
filler resulted in non-homogenous films. To nevertheless find how the dielectric properties
are changing when the filler vol% approaches the concentration where the particles are
percolating (this “mechanical” percolation should not be confused with the conductive
percolation), a different strategy was used (see Experimental Section) which allowed us the
synthesis of B31. The dielectric properties of series B are similar to those of series A. Also
here, composites with very low conductivity and low dielectric losses were obtained.
Composite B31 with a Ag vol% of 31 % has a permittivity as high as 21, a low loss factor
of 0.03 at 1 kHz with a value for the permittivity that remains almost constant with the
frequency. A value of ' = 5.9 for B20 which is also highly stretchable. It was reported
before that the conductive filler/insulator composites show a percolation like increase in
the ', however a linear increase in the permittivity with increasing the Ag vol% was
observed in our case (see Supporting Information). The increase in the ' for the two series
is slightly different. This might be due to the different ways of dispersing the filler in the
polymer matrix: mechanical mixing for series A while tip sonication was used for series B.
Through the dispersion of the filler by mechanical mixing, agglomerates in the size of tens
of microns are still present within the matrix (Fig. 53) while when the sonicator tip was
used to disperse the particles, more homogenous dispersion of the particles within the
matrix was observed. The particles within the agglomerates are in closer proximity to each
other, resulting in a collective response to the electric field from the present short-range
order of the particles, which is absent in a well dispersed, agglomerate-free system.61 It has
also been reported elsewhere that the presence of agglomerates within the nanocomposite
leads to higher ' values compared to the well dispersed system, as a direct result of
moisture inclusion as well as specific effects resulting from the agglomerated structure.62
The breakdown field of the resulting composites was also measured (see Tab. 14 and
Supporting Information). The breakdown experiments were conducted using a setup
similar to that described by Kollosche63 and also in capacitor devices that had round
electrodes (Ø = 8 mm). It should be also mentioned here that no actuation of the materials

4. Highly Stretchable Dielectric Elastomer Composites Containing High Volume Fraction of AgNPs
166
was observed when conducting the breakdown measurement. The dielectric breakdowns
are higher for series B as compare to series A which are supportive for a better dispersion
of the filler in the composites of series B as well as the increase in the molecular weight of
the polymer matrix.60,64 A decrease in the breakdown field with increasing Ag vol% was
observed from 23.1 V/ m for B9 to 13.4 V/ m for B20. The dielectric breakdown of a
material is strongly affected by the elastic moduli.65 The dielectric breakdown of our
composites is significantly higher as compared to the epoxy composites containing AgNPs
coated with an organic shell,40 despite that herein a soft matrix was used.
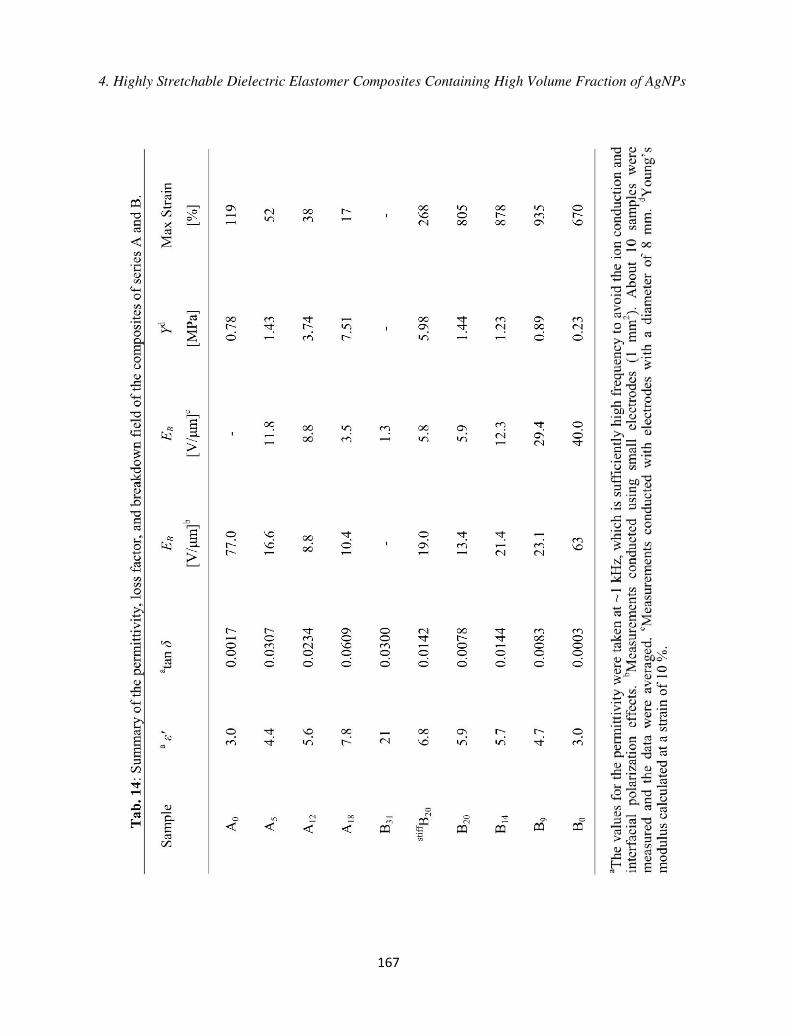
4. Highly Stretchable Dielectric Elastomer Composites Containing High Volume Fraction of AgNPs
167
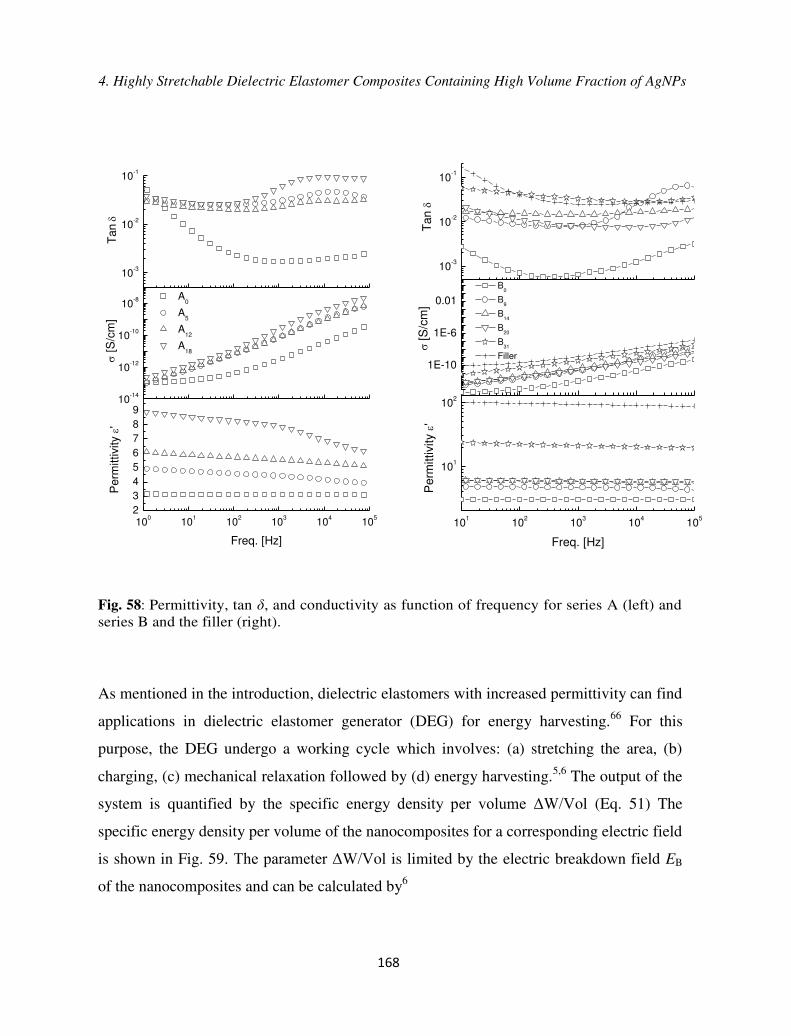
4. Highly Stretchable Dielectric Elastomer Composites Containing High Volume Fraction of AgNPs
168
100
101
102
103
104
105
2
3
4
5
6
7
8
910
-14
10-12
10-10
10-8
10-3
10-2
10-1
Pe
rmittivi
ty
'
Freq. [Hz]
[S
/cm
]
A0
A5
A12
A18
Tan
101
102
103
104
105
101
102
1E-10
1E-6
0.01
10-3
10-2
10-1
Perm
ittivi
ty
'
Freq. [Hz]
[S
/cm
]
B0
B9
B14
B20
B31
Filler
Tan
Fig. 58: Permittivity, tan , and conductivity as function of frequency for series A (left) and series B and the filler (right).
As mentioned in the introduction, dielectric elastomers with increased permittivity can find
applications in dielectric elastomer generator (DEG) for energy harvesting.66 For this
purpose, the DEG undergo a working cycle which involves: (a) stretching the area, (b)
charging, (c) mechanical relaxation followed by (d) energy harvesting.5,6 The output of the
system is quantified by the specific energy density per volume ΔW/Vol (Eq. 51) The
specific energy density per volume of the nanocomposites for a corresponding electric field
is shown in Fig. 59. The parameter ΔW/Vol is limited by the electric breakdown field EB
of the nanocomposites and can be calculated by6

4. Highly Stretchable Dielectric Elastomer Composites Containing High Volume Fraction of AgNPs
169
2
max
20
)1(
11'
2
1
sE
Vol
WB (Eq. 51)
where, 0 is the vacuum permittivity and smax is the maximum strain at break for the
corresponding elastomers. As shown in Fig. 59, the breakdown field of the nanocomposites
is lower as compared to the silicone matrix and despite of the increase in the permittivity
and the high strain at break, the maximum amount of energy that can be harvested with
these composites is lower as compared to the silicone matrix. For example at an electric
field of 20 V/ m the maximum amount of energy per cycle increases from 5.2 mJ/cm3 for
the B0 silicone matrix, to 8.2 mJ/cm3 for B9 and to 10 mJ/cm3 for B14. Therefore, these
nanocomposites might be useful as dielectric in energy harvester operated at low electric
fields.
0 20 40 600
20
40
60
W
/Vol (m
J/c
m3)
E (V/m)
B0
B9
B14
B20
Fig. 59: Specific energy density per volume at a given electric field.

4. Highly Stretchable Dielectric Elastomer Composites Containing High Volume Fraction of AgNPs
170
4.4 Conclusions and Outlook
Core/shell Ag/silica nanoparticles with Ag core of 57 nm surrounded by a thin silica shell
of ~ 4 nm and passivated by a trimethylsilyl layer show a ' = 90 very low dielectric
losses. These particles were used as filler in a polydimethylsiloxane matrix to synthesize
composites with different Ag vol%. It was shown that by a careful selection of matrix and
cross-linker amount, it is possible to prepare materials with concentrations of filler as high
as 20 vol% that have an elastic modulus as low as 350 kPa at 100 % strain and a strain at
break as high as 800 %. The stress relaxation tests show a minor hysteresis from the first to
the second cycle and almost no hysteresis for the subsequent cycles. Additionally,
composites with increased ', low dielectric losses, and high dielectric breakdowns were
obtained. An increase in the ε' with increasing the vol% of Ag was observed. For example,
a composite containing 31 vol% filler has a ' = 21 and a loss factor of 0.03 at ~ 1 kHz. The
low dielectric losses of these materials are supportive of a good encapsulation of the
metallic Ag in an insulating silica shell. A composite containing 20 vol% AgNPs has a ' =
5.9 at ~ 1 kHz, a dielectric strength of 13.4 V/µm. Because of the increased permittivity
and high strain at break, these materials might find application as dielectric in energy
harvesting devices operated at low electric fields. Furthermore, since the Ag core can in
principle be replaced by other metals, the described procedure can be used for the synthesis
of other polymer/metal composites and suggests a broad applicability of the method that
would allow the synthesis of other functional materials.
4.5 Acknowledgements
We gratefully acknowledge D. Schreier and Dr. Y. Arroyo for helping with the TEM and
SEM measurements, S. Dünki for the DMA measurements, B. Fischer for the TGA
measurements, A. Wichser for helping with the ICP-OES measurements (all Empa) and M.
Schneider from the Micro-laboratory of the Laboratory for Organic Chemistry (ETH
Zurich) for elemental analysis measurements. We thank B. Sinnet from Eawag for helping
4. Highly Stretchable Dielectric Elastomer Composites Containing High Volume Fraction of AgNPs
171
with DLS measurement. DMO thanks Dr. Racles from PPI for her kind support with the
Sciex project. We also gratefully acknowledge Swiss National Science Foundation
(SNF132101), Sciex (12.192), and Swiss Federal Laboratories for Materials Science and
Technology (Empa, Dübendorf) for financial support.
4.6 References
(1) Chae, S. H.; Yu, W. J.; Bae, J. J.; Duong, D. L.; Perello, D.; Jeong, H. Y.; Ta, Q. H.; Ly, T. H.; Vu, Q. A.; Yun, M.; et al. Transferred Wrinkled Al2O3 for Highly Stretchable and Transparent Graphene-Carbon Nanotube Transistors. Nat. Mater. 2013, 12, 403–409.
(2) Brochu, P.; Pei, Q. Advances in Dielectric Elastomers for Actuators and Artificial Muscles. Macromol. Rapid Commun. 2010, 31, 10–36.
(3) Biggs, J.; Danielmeier, K.; Hitzbleck, J.; Krause, J.; Kridl, T.; Nowak, S.; Orselli, E.; Quan, X.; Schapeler, D.; Sutherland, W.; et al. Electroactive Polymers: Developments of and Perspectives for Dielectric Elastomers. Angew. Chemie - Int. Ed. 2013, 52, 9409–9421.
(4) Dielectric Elastomers as Electromechanical Transducers; Carpi, F.; De Rossi, D.; Kornbluh, R.; Pelrine, R.; Sommer-Larsen, P., Eds.; Elsevier: Amsterdam, 2008.
(5) Pelrine, R.; Kornbluh, R. D.; Eckerle, J.; Jeuck, P.; Oh, S.; Pei, Q.; Stanford, S. Dielectric Elastomers: Generator Mode Fundamentals and Applications. SPIE’s 8th Annu. Int. Symp. Smart Struct. Mater. 2001, 4329, 148–156.
(6) Molberg, M.; Crespy, D.; Rupper, P.; Nüesch, F.; Månson, J.-A. E.; Löwe, C.; Opris, D. M. High Breakdown Field Dielectric Elastomer Actuators Using Encapsulated Polyaniline as High Dielectric Constant Filler. Adv. Funct. Mater. 2010, 20, 3280–3291.
(7) Stoyanov, H.; Brochu, P.; Niu, X.; Della Gaspera, E.; Pei, Q. Dielectric Elastomer Transducers with Enhanced Force Output and Work Density. Appl. Phys. Lett. 2012, 100, 2010–2013.
(8) Goswami, K.; Skov, A. L.; Daugaard, A. E. UV-Cured, Platinum-Free, Soft Poly(dimethylsiloxane) Networks. Chem. - A Eur. J. 2014, 20, 9230–9233.
(9) Bejenariu, A. G.; Yu, L.; Skov, A. L. Low Moduli Elastomers with Low Viscous Dissipation. Soft Matter 2012, 8, 3917-3923.

4. Highly Stretchable Dielectric Elastomer Composites Containing High Volume Fraction of AgNPs
172
(10) Galantini, F.; Carpi, F.; Gallone, G. Effects of Plasticization of a Soft Silicone for Dielectric Elastomer Actuation. Smart Mater. Struct. 2013, 22, 104020.
(11) Madsen, F. B.; Yu, L.; Daugaard, A. E.; Hvilsted, S.; Skov, A. L. A New Soft Dielectric Silicone Elastomer Matrix with High Mechanical Integrity and Low Losses. RSC Adv. 2015, 5, 10254–10259.
(12) Kussmaul, B.; Risse, S.; Kofod, G.; Waché, R.; Wegener, M.; McCarthy, D. N.; Krüger, H.; Gerhard, R. Enhancement Of Dielectric Permittivity And Electromechanical Response In Silicone Elastomers: Molecular Grafting Of Organic Dipoles To The Macromolecular Network. Adv. Funct. Mater. 2011, 21, 4589–4594.
(13) Madsen, F. B.; Dimitrov, I.; Daugaard, A. E.; Hvilsted, S.; Skov, A. L. Novel Cross-Linkers for PDMS Networks for Controlled and Well Distributed Grafting of Functionalities by Click Chemistry. Polym. Chem. 2013, 4, 1700–1707.
(14) Racles, C.; Cazacu, M.; Fischer, B.; Opris, D. M. Synthesis and Characterization of Silicones Containing Cyanopropyl Groups and Their Use in Dielectric Elastomer Actuators. Smart Mater. Struct. 2013, 22, 104004.
(15) Gallone, G.; Carpi, F.; De Rossi, D.; Levita, G.; Marchetti, A. Dielectric Constant Enhancement in a Silicone Elastomer Filled with Lead Magnesium Niobate-Lead Titanate. Mater. Sci. Eng. C 2007, 27, 110–116.
(16) Carpi, F.; Gallone, G.; Galantini, F.; De Rossi, D. Silicone-Poly(hexylthiophene) Blends as Elastomers with Enhanced Electromechanical Transduction Properties. Adv. Funct. Mater. 2008, 18, 235–241.
(17) Hu, W.; Zhang, S. N.; Niu, X.; Liu, C.; Pei, Q. 40_An Aluminum Nanoparticle–acrylate Copolymer Nanocomposite as a Dielectric Elastomer with a High Dielectric Constant. J. Mater. Chem. C 2014, 2, 1658–1666.
(18) Galantini, F.; Bianchi, S.; Castelvetro, V.; Anguillesi, I.; Gallone, G. Properties of a Dielectric Elastomer Actuator Modified by Dispersion of Functionalised Carbon Nanotubes. Adv. Sci. Technol. 2012, 79, 41–46.
(19) Goswami, K.; Daugaard, A. E.; Skov, A. L. Dielectric Properties of Ultraviolet Cured Poly(dimethyl Siloxane) Sub-Percolative Composites Containing Percolative Amounts of Multi-Walled Carbon Nanotubes. RSC Adv. 2015, 5, 12792–12799.
(20) Grannan, D. M.; Garland, J. C.; Tanner, D. B. Critical Behavior of the Dielectric Constant of a Random Composite near the Percolation Threshold. Phys. Rev. Lett. 1981, 46, 375–379.

4. Highly Stretchable Dielectric Elastomer Composites Containing High Volume Fraction of AgNPs
173
(21) Dang, Z.-M.; Wang, L.; Yin, Y.; Zhang, Q.; Lei, Q.-Q. Giant Dielectric Permittivities in Functionalized Carbon-Nanotube/ Electroactive-Polymer Nanocomposites. Adv. Mater. 2007, 19, 852–857.
(22) Yang, X. H.; Fu, H. T.; Wong, K.; Jiang, X. C.; Yu, A. B. Hybrid Ag@TiO2 Core-Shell Nanostructures with Highly Enhanced Photocatalytic Performance. Nanotechnology 2013, 24, 415601.
(23) Berdel, K.; Member, S. S.; Rivas, J. G. J.; Bolívar, P. H.; Maagt, P. De; Member, S. S.; Kurz, H. Temperature Dependence of the Permittivity and Loss Tangent of High-Permittivity Materials at Terahertz Frequencies. IEEE Trans.Microwav. Theor. 2005, 53, 1266–1271.
(24) Nelson, J. K.; Linhardt, R. J.; Schadler, L. S.; Hillborg, H. Effect of High Aspect Ratio Filler on Dielectric Properties of Polymer Composites: A Study on Barium Titanate Fibers and Graphene Platelets. IEEE Trans. Dielectr. Electr. Insul. 2012, 19, 960–967.
(25) Romasanta, L. J.; Hernández, M.; López-Manchado, M. A.; Verdejo, R. Functionalised Graphene Sheets as Effective High Dielectric Constant Fillers. Nanoscale Res. Lett. 2011, 6, 508.
(26) Zhou, Y.; Chen, Y.; Wang, H.; Wong, C. P. Creation of a Multilayer Aluminum Coating Structure Nanoparticle Polyimide Filler for Electronic Applications. Mater. Lett. 2014, 119, 64–67.
(27) Opris, D. M.; Crespy, D.; Löwe, C.; Molberg, M.; Nüesch, F. Phtalocyanine and Encapsulated Polyaniline Nanoparticles as Fillers for Dielectric Elastomers. Proc. SPIE, Electroact. Polym. Actuators Devices (EAPAD)Electroactive Polym. Actuators Devices 2009, 7287, 72870L – 72870L – 8.
(28) Huang, C.; Zhang, Q. M.; Su, J. High-Dielectric-Constant All-Polymer Percolative Composites. Appl. Phys. Lett. 2003, 82, 3502–3504.
(29) Kempa, T.; Carnahan, D.; Olek, M.; Correa, M.; Giersig, M.; Cross, M.; Benham, G.; Sennett, M.; Ren, Z.; Kempa, K. Dielectric Media Based on Isolated Metallic Nanostructures. J. Appl. Phys. 2005, 98, 3–6.
(30) Li, J. Y.; Zhang, L.; Ducharme, S. Electric Energy Density of Dielectric Nanocomposites. Appl. Phys. Lett. 2007, 90, 28–31.
(31) Qi, L.; Lee, B. I.; Chen, S.; Samuels, W. D.; Exarhos, G. J. High-Dielectric-Constant Silver-Epoxy Composites as Embedded Dielectrics. Adv. Mater. 2005, 17, 1777–1781.

4. Highly Stretchable Dielectric Elastomer Composites Containing High Volume Fraction of AgNPs
174
(32) Guo, N.; DiBenedetto, S. A.; Tewari, P.; Lanagan, M. T.; Ratner, M. A.; Marks, T. J. Nanoparticle, Size, Shape, and Interfacial Effects on Leakage Current Density, Permittivity, and Breakdown Strength of Metal Oxide−Polyolefin Nanocompositesμ Experiment and Theory. Chem. Mater. 2010, 22, 1567–1578.
(33) Grubbs, R. B. Hybrid Metal-Polymer Composites from Functional Block Copolymers. J. Polym. Sci. Part A Polym. Chem. 2005, 43, 4323–4336.
(34) Pastoriza-Santos, I.; Pérez-Juste, J.; Kickelbick, G.; Liz-Marzán, L. M. Optically Active Poly(dimethylsiloxane) Elastomer Films Through Doping with Gold Nanoparticles. J. Nanosci. Nanotechnol. 6, 453–458.
(35) Lu, J.; Moon, K.-S.; Wong, C. P. Silver/polymer Nanocomposite as a High-K Polymer Matrix for Dielectric Composites with Improved Dielectric Performance. J. Mater. Chem. 2008, 18, 4821–4826.
(36) Ellison, J.; Wykoff, G.; Paul, A.; Mohseni, R.; Vasiliev, A. Efficient Dispersion of Coated Silver Nanoparticles in the Polymer Matrix. Colloids Surfaces A Physicochem. Eng. Asp. 2014, 447, 67–70.
(37) Hoppe, C. E.; Rodríguez-Abreu, C.; Lazzari, M.; López-Quintela, M. A.; Solans, C. One-Pot Preparation of Gold-Elastomer Nanocomposites Using PDMS-Graft-PEO Copolymer Micelles as Nanoreactors. Phys. Status Solidi 2008, 205, 1455–1459.
(38) Wiley, B.; Sun, Y.; Mayers, B.; Xia, Y. Shape-Controlled Synthesis of Metal Nanostructures: The Case of Silver. Chem. - A Eur. J. 2005, 11, 454–463.
(39) Kim, D.; Jeong, S.; Moon, J. Synthesis of Silver Nanoparticles Using the Polyol Process and the Influence of Precursor Injection. Nanotechnology 2006, 17, 4019–4024.
(40) Shen, Y.; Lin, Y.; Li, M.; Nan, C.-W. High Dielectric Performance of Polymer Composite Films Induced by a Percolating Interparticle Barrier Layer. Adv. Mater. 2007, 19, 1418–1422.
(41) Baida, H.; Billaud, P.; Marhaba, S.; Christofilos, D.; Cottancin, E.; Crut, A.; Lermé, J.; Maioli, P.; Pellarin, M.; Broyer, M.; et al. Quantitative Determination of the Size Dependence of Surface Plasmon Resonance Damping in Single Ag@SiO2 Nanoparticles. Nano Lett. 2009, 9, 3463–3469.
(42) Guerrero-Martínez, A.; Pérez-Juste, J.; Liz-Marzán, L. M. Recent Progress on Silica Coating of Nanoparticles and Related Nanomaterials. Adv. Mater. 2010, 22, 1182–1195.
(43) Cazacu, M.; Racles, C.; Vlad, A.; Antohe, M.; Forna, N. Silicone-Based Composite for Relining of Removable Dental Prosthesis. J. Compos. Mater. 2009, 43, 2045–2055.

4. Highly Stretchable Dielectric Elastomer Composites Containing High Volume Fraction of AgNPs
175
(44) Xu, J.; Wong, C. P. Low-Loss Percolative Dielectric Composite. Appl. Phys. Lett. 2005, 87, 082907.
(45) Putson, C.; Jaaoh, D.; Meauma, N.; Muensit, N. Effect of Micro- and Nano-Particle Fillers at Low Percolation Threshold on the Dielectric and Mechanical Properties of Polyurethane/Copper Composites. J. Inorg. Organomet. Polym. Mater. 2012, 22, 1300–1307.
(46) Zhang, Y.; Wang, Y.; Deng, Y.; Li, M.; Bai, J. Enhanced Dielectric Properties of Ferroelectric Polymer Composites Induced by Metal-Semiconductor Zn-ZnO Core-Shell Structure. ACS Appl. Mater. Interfaces 2012, 4, 65–68.
(47) Lucchini, M. A.; Testino, A.; Ludwig, C.; Kambolis, A.; El-Kazzi, M.; Cervellino, A.; Riani, P.; Canepa, F. Continuous Synthesis of Nickel Nanopowders: Characterization, Process Optimization, and Catalytic Properties. Appl. Catal. B Environ. 2014, 156-157, 404–415.
(48) Park, B. K.; Jeong, S.; Kim, D.; Moon, J.; Lim, S.; Kim, J. S. Synthesis and Size Control of Monodisperse Copper Nanoparticles by Polyol Method. J. Colloid Interface Sci. 2007, 311, 417–424.
(49) Liu, C.; Yang, X.; Yuan, H.; Zhou, Z.; Xiao, D. Preparation of Silver Nanoparticle and Its Application to the Determination of Ct -DNA. Sensors 2007, 7, 708–718.
(50) Quinsaat, J. E. Q.; Nüesch, F. A.; Hofmann, H.; Opris, D. M. Dielectric Properties of Silver Nanoparticles Coated with Silica Shells of Different Thicknesses. RSC Adv. 2013, 3, 6964–6971.
(51) Graf, C.; Vossen, D. L. J.; Imhof, A.; van Blaaderen, A. A General Method To Coat Colloidal Particles with Silica. Langmuir 2003, 19, 6693–6700.
(52) Liu, S.; Han, M.-Y. Silica-Coated Metal Nanoparticles. Chem. Asian J. 2010, 5, 36–45.
(53) Gun’ko, V.; Vedamuthu, M.; Henderson, G.; Blitz, J. Mechanism and Kinetics of Hexamethyldisilazane Reaction with a Fumed Silica Surface. J. Colloid Interface Sci. 2000, 228, 157–170.
(54) Cervantes, J.; Zárraga, R.; Salazar-Hernández, C. Organotin Catalysts in Organosilicon Chemistry. Appl. Organomet. Chem. 2012, 26, 157–163.
(55) Boyce, M. C.; Yeh, O.; Socrate, S.; Kear, K.; Shaw, K. Micromechanics of Cyclic Softening in Thermoplastic Vulcanizates. J. Mech. Phys. Solids 2001, 49, 1343–1360.

4. Highly Stretchable Dielectric Elastomer Composites Containing High Volume Fraction of AgNPs
176
(56) Grassie, N. .; Macfarlane, I. G. . The Thermal Degradation of Polysiloxanes-I. Eur. Polym. J. 1978, 14, 875–884.
(57) Lewicki, J. P.; Liggat, J. J.; Patel, M. The Thermal Degradation Behaviour of Polydimethylsiloxane/montmorillonite Nanocomposites. Polym. Degrad. Stab. 2009, 94, 1548–1557.
(58) Silva, V. P.; Gonçalves, M. C.; Yoshida, I. V. P. Biogenic Silica Short Fibers as Alternative Reinforcing Fillers of Silicone Rubbers. J. Appl. Polym. Sci. 2006, 101, 290–299.
(59) Norkhairunnisa, M.; Azizan, A.; Mariatti, M.; Ismail, H.; Sim, L. Thermal Stability and Electrical Behavior of Polydimethylsiloxane Nanocomposites with Carbon Nanotubes and Carbon Black Fillers. J. Compos. Mater. 2011, 46, 903–910.
(60) Calebrese, C.; Hui, L.; Schadler, L.; Nelson, J. A Review on the Importance of Nanocomposite Processing to Enhance Electrical Insulation. IEEE Trans. Dielectr. Electr. Insul. 2011, 18, 938–945.
(61) Tan, Q.; Cao, Y.; Irwin, P. DC Breakdown in Polyetherimide Composites and Implication for Structural Engineering. 2007 IEEE Int. Conf. Solid Dielectr. 2007, 411–414.
(62) Kurimoto, M.; Okubo, H.; Kato, K.; Hanai, M.; Hoshina, Y.; Takei, M.; Hayakawa, N. Dielectric Properties of Epoxy/alumina Nanocomposite Influenced by Control of Micrometric Agglomerates. IEEE Trans. Dielectr. Electr. Insul. 2010, 17, 662–670.
(63) Kollosche, M.; Kofod, G. Electrical Failure in Blends of Chemically Identical, Soft Thermoplastic Elastomers with Different Elastic Stiffness. Appl. Phys. Lett. 2010, 96, 12–15.
(64) Claude, J.; Lu, Y.; Wang, Q. Effect of Molecular Weight on the Dielectric Breakdown Strength of Ferroelectric Poly(vinylidene Fluoride-Chlorotrifluoroethylene)s. Appl. Phys. Lett. 2007, 91, 2–5.
(65) Stark, K. H.; Garton, C. G. Electric Strength of Irradiated Polyethene. Nature 1955, 175, 642–643.
(66) R. Kornbluh, R. Pelrine, Q. Pei, R. Heydt, S. Stanford, S. Oh and J. Eckerle, Proc. SPIE Smart Struct. Mater. 2002, 4698, 254–270.

4. Highly Stretchable Dielectric Elastomer Composites Containing High Volume Fraction of AgNPs
177
4.7 Supporting Information
Highly stretchable dielectric elastomers composites containing high silver
nanoparticles volume fraction
Jose Enrico Q. Quinsaat, Mihaela Alexandru, Frank A. Nüesch, Heinrich Hofmann, Andreas Borgschulte, and Dorina M. Opris* J. E. Q. Quinsaat, Dr. M. Alexandru, Prof. Frank A. Nüesch, Dr. D. M. Opris
Swiss Federal Laboratories for Materials Science and Technology (Empa), Laboratory for
Functional Polymers, Überlandstrasse 129, 8600 Dübendorf, Switzerland
E-mail: [email protected]
J. E. Q. Quinsaat, Prof. H. Hofmann, Prof. F. A. Nüesch, Ecole Polytechnique Fédérale de
Lausanne (EPFL), Materials Institute, 1015 Lausanne, Switzerland
Dr. A. Borgschulte, Swiss Federal Laboratories for Materials Science and Technology (Empa),
Laboratory for Hydrogen and Energy, Überlandstrasse 129, 8600 Dübendorf, Switzerland
40 60 800.0
0.3
0.6
Fre
qu
en
cy (
a.
u.)
Size (nm)
AgNPs Ag@SiO
2
Fig. 60: Size distribution of AgNPs and Ag@SiO2 core-shell. The sizes were determined through TEM image analysis.

4. Highly Stretchable Dielectric Elastomer Composites Containing High Volume Fraction of AgNPs
178
20 40 60 80 100 1200
38
76
114
Inte
nsi
ty
2 (1
11)
(200)
(220) (3
11)
(222)
(400)
(331)
(420)
Fig. 61: XRD pattern of the AgNPs prepared by polyol synthesis at 130 °C. The typical cubic silver diffraction was observed.
Fig. 62: TEM micrographs of the Ag@SiO2 produced via upscaling through the addition of 0.6 vol% ethanolic TEOS solution into the reaction mixture.

4. Highly Stretchable Dielectric Elastomer Composites Containing High Volume Fraction of AgNPs
179
Fig. 63: TEM micrographs of the AgNPs (left) and Ag@SiO2 core-shell particles (right) and their corresponding EDX spectrum below.
Sample Elemental analysis
C [%]
H [%]
N [%]
Ag@SiO2 1.11 0.19 0.24
Ag@SiO2@Si(CH3)3 1.75 0.28 0.33
Fig. 64: Elemental analysis of the core-shell particles before and after surface treatment with HMDS.

4. Highly Stretchable Dielectric Elastomer Composites Containing High Volume Fraction of AgNPs
180
Fig. 65: XPS spectra of AgNPs prepared with the polyol synthesis at 130 °C. The peak indicative for the oxidized silver species is missing.
0 3 6 90.0
0.5
1.0
50
10 d at 25 °C 5 d at 150 °C
Str
ess
[N
/mm
2]
Strain (%)
50250
0 200 400 600 8000
1
2
3
10 d at 25 °C 5 d at 150 °C
Str
ess [
N/m
m2]
Strain (%)
Fig. 66: The mechanical properties of B20 aged at room temperature for 10 days and at 150 °C for 5 days: the cyclic (left) and the stress-strain (right) tests.

4. Highly Stretchable Dielectric Elastomer Composites Containing High Volume Fraction of AgNPs
181
0 11 22 33 44 55 66 770
1
2
3
450
Str
ess
[N
/mm
2]
Strain (%)
Fig. 67: The strain reloading stress-strain curves after initial strain excursions of 50, 75, 100, all the
way up to 450 % for B14.
0 5 10 15 20 25 30 35
4
8
12
16
20
24
28
Pe
rmittivity
' @ 1
kH
z
Vol.% Ag
A Series B Series
Fig. 68: Permittivity as function of filler content of the composite of series A and B.

4. Highly Stretchable Dielectric Elastomer Composites Containing High Volume Fraction of AgNPs
182
0 5 10 15 20
20
40
60 A
5
A12
A18
B0
B9
B14
B20E
B(V
/m
)
Vol% Ag
Fig. 69: Breakdown field EB as function of filler content of the composite of series A (red) and B (black). The averaged values are depicted with error bars and were obtained from the measurements using the electrodes with an area of 1 mm2.
Fig. 70: Electrodes used for breakdown strength measurements and the overall set-up of the system (from left to right).

4. Highly Stretchable Dielectric Elastomer Composites Containing High Volume Fraction of AgNPs
183
Fig. 71: The setup used for measuring the dielectric properties.
The thicknesses of the samples used for the dielectric measurements were below 50 µm
and were measured using a Heidenhein high accuracy gage. The samples were measured
using Hewlett Packard 16451B dielectric test fixture equipped with round electrodes (left).
To ensure a good contact and a uniform “pressure” over the samples (because of the round
electrode used), gold plates slightly smaller than the coated electrodes were used. The
setup shown above (left), allows a tender touch of the sample by the top electrode that is
connected to a micrometer. So, there should be no displacement or pressure in the samples.
The sample coated with 21 mm electrode was also measured using the setup with which
the Novocontrol Alpha-A Frequency Analyzer is equipped (right) and the dielectric results
were similar to those obtained using the other setup. Because rather thin samples were
used, which were coated with conductive layers of defined surface, even when the right
setup was used and more pressure was applied to the sample by screwing, no change in the
permittivity was observed.

4. Highly Stretchable Dielectric Elastomer Composites Containing High Volume Fraction of AgNPs
184

5. Surface Hydrophobization of AgNPs through SI-ATRP
185
Chapter 5: Surface Hydrophobization of Silver
Nanoparticles (AgNPs) through Surface-initiated Atom
Transfer Radical Polymerization (SI-ATRP)
Declaration: The nanoparticle synthesis, functionalization as well as the TEM image
analysis were conducted by Jose Enrico Q. Quinsaat.
Jose Enrico Q. Quinsaat1,2, Frank A. Nüesch1, Heinrich Hofmann2, Dorina M. Opris1*
1Swiss Federal Laboratories for Materials Science and Technology (Empa), Laboratory
for Functional Polymers, Überlandstrasse 129, 8600 Dübendorf, Switzerland
2Ecole Polytechnique Fédérale de Lausanne (EPFL), Materials Institute, Powder
Technology Laboratory (LTP), 1015 Lausanne, Switzerland
5. Surface Hydrophobization of AgNPs through SI-ATRP
186
Abstract: This work describes the preparation of poly(methyl methacrylate) (PMMA)-
coated Ag@SiO2 core-shell particles by conducting a Surface-initiated Atom Transfer
Radical Polymerization (SI-ATRP). Prior to conducting the polymerization, Silver
nanoparticles (AgNPs) formed by the polyol synthesis were subjected to preliminary
surface functionalization which includes the encapsulation in an insulating SiO2 shell. The
growth of an additional organic PMMA shell yields inorganic/organic core-shell particles
with an enhanced dispersibility in non-polar solvents.
5.1 Introduction
Silver Nanoparticles (AgNPs) are widely employed in different scientific fields due to their
array of properties. The current application fields of AgNPs include biology,1–3 optics,4–6
catalysis7,8 and electronics.9–12 The properties of AgNPs depend on both their size and
shape, and it is essential to gain control over them in order to tune their properties. While
the continuous preparation of AgNPs in flow reactors have enabled the control over the
size and distribution of the particles,13–16 the polyol synthesis has established itself as a
reliable and facile method to prepare different silver nanostructures which includes wires,
cubes, spheres, bipyramids and triangles.17 The surface functionalization is essential for
both the stability and further use of AgNPs in different application fields. Inorganic
materials such as TiO2 and SiO2 have been used to encapsulate the AgNPs with an oxide
layer in order to give core-shell particles. While Ag@TiO2 particles are exploited for their
resulting photocatalytic activity,18–20 Ag@SiO2 have been prepared in order to control their
plasmonic properties.21–23 Furthermore, Ag@SiO2 core-shell particles also feature good
dielectric properties with both low conductivities and dielectric losses.24,25 Previous studies
on the dielectric properties of the core-shell particles revealed the control over the
dielectric properties with the variation of the silica shell thickness.26 Therefore, core-shell
particles are promising candidates to be used as high permittivity filler for the preparation
of materials with enhanced dielectric properties. However, the SiO2 shell is highly
hydrophilic and has to be rendered hydrophobic in order to compatibilize it with matrices

5. Surface Hydrophobization of AgNPs through SI-ATRP
187
such as polydimethylsiloxane (PDMS), polyacrylates or polyolefins. Hybrid
organic/inorganic nanocomposites find potential applications in optics, electronics and
biomedicine.27,28 Although surface hydrophobization can be achieved with alkyl silanes29–
32 or by emulsion polymerization,33 this work exploits the possibility of growing an outer
polymer layer on the core-shell particles by conducting a Surface-initiated (SI) Atom
Transfer Radical Polymerization (ATRP).34,35 SI-ATRP has previously been used to
prepare organic/inorganic hybrid particles. In most of the cases, the growth of polymers
such as polystyrenes, polymethacrylates and polyacrylonitriles has been demonstrated on
SiO2 particles or Si-surfaces.36–38 Apart from SiO2 nanoparticles, SI-ATRP has also been
demonstrated on metal surfaces and particles such as Au, where a thiol-functionalized
ATRP-initiator was grafted directly on the particle surface.39–44 The resulting hybrid
particles featured good dispersability and thus compatibility in hydrophobic media as well
as high mechanical and thermal stability.27,36,45 These features are the targeted properties of
the polymer (PMMA)-coated Ag@SiO2 core-shell particles which were prepared in this
work (Fig. 72 and Fig. 73).
Fig. 72: General scheme towards the preparation of PMMA-coated Ag@SiO2 core-shell particles.

5. Surface Hydrophobization of AgNPs through SI-ATRP
188
5.2 Experimental Section
5.2.1 Materials and Methods
AgNO3, poly(vinyl pyrrolidinone) (PVP), ethylene glycol (EG), tetrahydrofurane
(THF), ethanol (EtOH), methanol (MeOH), α-bromoisobutyryl bromide, ammonia
(29 % solution, NH4OH), triethylamine (TEA), tetraethoxysilane (TEOS),
aminopropyl triethoxysilane (APTES), CuCl, N,N’,N’’,N’’-
pentamethyldiethylenetriamine (PMDETA), ascorbic acid, ethyl-α-bromo
isobutyrate (2-(EiB)Br), methyl methacrylate (MMA) were purchased from Aldrich.
While EG and MMA were distilled prior use, all other chemicals were used as
received. Monomer conversion in the polymerization reaction was monitored and
analyzed with a Bruker Avance III 400 NMR spectrometer using a 5 mm BBO Prodigy™
CryoProbe at 400.18, 100.63 and 79.50 MHz, respectively. Gel permeation
chromatography (GPC) measurements were done with an Agilent 1100/PSS
WinGPC 8.1 system in tetrahydrofurane calibrated with poly(methyl methacrylate)
(PMMA) standards (Polymer Standards Service). Prior to the analysis by GPC, the
polymers were subjected to cycles of purification which consists of dissolving them
in THF followed by the precipitation in MeOH. The nanoparticles were observed with
TEM using a Philips CM30 TEM. For the observation of PMMA-coated core-shell
particles, the TEM grid was stained with 2 wt% aqueous solution of phosphotungstic acid.
UV-vis absorption spectra were recorded with a Cary 50 spectrophotometer, DLS
measurements were done with a Malvern Zetasized Nano ZS, the thermogravimetric
analysis (TGA) was conducted with a Perkin Elmer TGA7 at a heating rate of 20 °C min-1
under a helium gas flow. The number of particles measured for the statistical determination
of the particle size was about 400 for Ag core and about 120-150 for the SiO2 and PMMA-
coated particles with the help of the software Imagej and a ruler for Windows, respectively.

5. Surface Hydrophobization of AgNPs through SI-ATRP
189
5.2.2 Synthesis of AgNPs
In a 100 mL round-bottom flask, PVP (6 g, 54 mmol, Mw = 40 kDa) was dissolved in EG
(50 mL) under sonication. After complete dissolution of the polymer, the flask was stirred
in an oil bath at 140 °C for 30 min, then an aqueous solution of AgNO3 (1 mL, 1 g/mL)
was injected rapidly and the reaction mixture was stirred further for 1 h at a speed of 900
rpm. The flask was later removed from the oil bath, cooled in a water bath and the reaction
mixture was diluted with acetone, centrifuged at 5’000 rpm for 0.5 h and decanted. The
resulting precipitate was further washed with acetone and water 3 times before redispersion
in EtOH. The reaction was repeated 18 times and the particles were redispersed in 400 mL
of EtOH. Yield: 9.26 g (82 %). Size: 59 ± 22 nm.
5.2.3 Synthesis of Ag@SiO2 Core-shell Particles
The silica-coating was performed based on existing protocols of the modified Stöber
method.26 For the silica-coating, 2 x 190 mL of the AgNPs dispersion in EtOH was
transferred each in a 2 L flask, diluted with EtOH (600 mL) and treated with NH4OH (29
%, 21.25 mL), ethanolic TEOS solution (2.2 vol%, 45 mL) and stirred at 25 °C for 16 h.
The mixture was diluted with acetone, centrifuged and decanted. The particles were
redispersed in EtOH and the washing procedure was repeated thrice in order to obtain the
core-shell particles (8 g) which were redispersed in EtOH (250 mL). Size: 65 ± 14 nm.
5.2.4 Synthesis of APTES-Br
APTES-Br was prepared according to a previous protocol.46 A mixture containing APTES
(10 mL, 43 mmol) and triethylamine (7.8 mL, 57 mmol) in dry THF (200 mL) was treated
dropwise with α-bromoisobutyryl bromide (5.55 mL, 51 mmol) at 0 °C. After completing
the addition, the mixture was stirred at 0 °C for further 30 min, and then warmed to 25 °C
and stirred overnight. The mixture was filtered, concentrated in vacuo to give APTES-Br

5. Surface Hydrophobization of AgNPs through SI-ATRP
190
(13.1 g, 86 %) as yellow oil. 1H NMR (CDCl3, 400 MHz): 0.6-0.7 (m, 2H, SiCH2), 1.25 (t,
9H, CH3CH2OSi), 1.63-1.73 (m, 2H, CH2), 2.00 (s, 6H, CCH3), 3.3 (q, 2H, CH2N). 3.85 (q,
6H, CH2CH3), 6.9 (s, 1H, NH).
5.2.5 Synthesis of Initiator-coated Ag@SiO2 Core-shell Particles (Ag@SiO2@Br)
The Ag@SiO2 core-shell particles (230 mL out of the 250 mL stock solution) were
transferred to a 500 mL round bottom flask, stirred at 25 °C and treated with triethylamine
(5.4 mL, 39.1 mmol) and a mixture of APTES-Br (5.4 g, 14.6 mmol) in EtOH (20 mL).
The mixture was stirred for 2 days, then diluted with acetone, centrifuged and decanted.
The residue was redispersed in EtOH, diluted with acetone, centrifuged and decanted. The
washing cycle was repeated 6× in order to obtain the initiator-coated core-shell particles
(6.4 g, 80 %) which were redispersed in EtOH (100 mL).
5.2.6 Surface-initiated (SI) ATRP on Initiator Coated Ag@SiO2 Core-shell
Particles
The initiator-coated Ag@SiO2 core-shell particles (4 g, ~ 0.54 mmol APTES-Br grafted on
the surface), MMA (35.7 mL, 336 mmol), 2-(EiB)Br (55 µL, 0.35 mmol) in DMF (10 mL)
were transferred to a 250 mL Schlenk flask, and subjected to three freeze-dry-pump-thaw
cycles. In a separate flask, a solution of CuCl (80 mg, 0.80 mmol), PMDETA (210 µL, 1
mmol), and ascorbic acid (44 mg, 0.25 mmol) in DMF (15 mL) was degassed with Ar for
30 min and then transferred to the Schlenk flask containing the particles via a cannula. The
flask was then placed in a preheated oil bath and stirred at 70 °C. During the reaction,
aliquots were taken after defined time intervals. The reaction was terminated after 7 h by
exposing the reaction to air followed by cooling the reaction mixture down to room
temperature. The mixture was dissolved in acetone, centrifuged and decanted. The washing
procedure was repeated 7 times until no free polymer chain was detected in the mother
liquor. Eventually, PMMA-coated core-shell particles (1.8 g) were obtained after the
5. Surface Hydrophobization of AgNPs through SI-ATRP
191
purification process.
5.3 Results and Discussion
5.3.1 Synthesis of AgNPs and Surface Functionalization with SiO2
The AgNPs were prepared by the polyol synthesis, an established method to prepare
nanoparticles in relatively large amounts per batch reaction.26 The average particle
diameter was 59 nm (Fig. 73). The silica-coating was conducted with a modified Stöber
method to give core-shell particles in gram quantities with a thin SiO2-shell of ~ 3 nm (Fig.
73).19,21,26 The subsequent change in the dielectric medium of the AgNPs (from PVP/EtOH
to SiO2) led to a bathochromic shift from 434 to 443 nm in the corresponding UV-vis
spectra (Fig. 74). As previously investigated, it is essential to keep the SiO2-shell very thin
in order to preserve the metallic character of the core-shell particles e.g. the dielectric
constant.26 However, the thin silica shell seemed to be insufficient in stabilizing the AgNPs
from forming some agglomerates which can be attributed to the strong van der Waals
interactions acting between the cores. The formation of some agglomerates between the
particles is indicated by the broadening of the peaks in the UV-vis spectra although DLS
does not detect it.
5.3.2 Surface-initiated (SI) ATRP on the Ag@SiO2 Core-shell Particles
Although the direct growth of polymers on gold nanoparticles (AuNPs) functionalized with
thiol-terminated initiators has previously been reported, a main drawback of this approach
is the relatively weak Au-S bond (~ 40 kcal/mol) which can undergo bond dissociation at
temperatures > 60 °C.40 In comparison, the Ag-S bond dissociation energy amounts
52 kcal/mol, which is a bit higher than the Au-S bond energy but will also undergo the
same fate at high temperatures.47 Since the polymerization has to be conducted at ambient
temperatures in order to circumvent this issue, the choice of polymerizable monomers
becomes limited. To overcome this problem the APTES-Br initiator was chemically
grafted to the silica surface of the Ag@SiO2 core-shell particles. The SiO2 shell serves as a

5. Surface Hydrophobization of AgNPs through SI-ATRP
192
protection barrier for the AgNPs towards agglomeration as a result of electrostatic
stabilization and allows chemical functionalization of the surface through the presence of
the hydroxyl groups.
Fig. 73: TEM micrographs of AgNPs (a), Ag@SiO2 (b), APTES-Br (c) and PMMA-coated Ag@SiO2 core-shell particles (d).
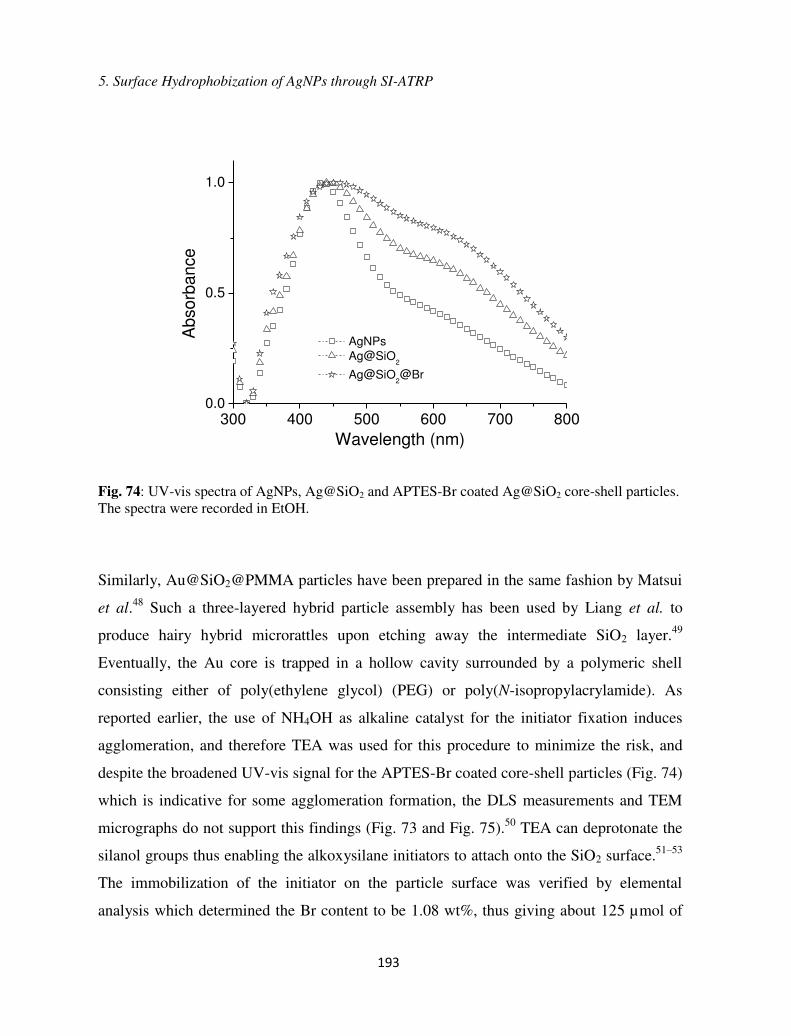
5. Surface Hydrophobization of AgNPs through SI-ATRP
193
300 400 500 600 700 8000.0
0.5
1.0A
bso
rba
nce
Wavelength (nm)
AgNPs Ag@SiO
2
Ag@SiO2@Br
Fig. 74: UV-vis spectra of AgNPs, Ag@SiO2 and APTES-Br coated Ag@SiO2 core-shell particles. The spectra were recorded in EtOH.
Similarly, Au@SiO2@PMMA particles have been prepared in the same fashion by Matsui
et al.48 Such a three-layered hybrid particle assembly has been used by Liang et al. to
produce hairy hybrid microrattles upon etching away the intermediate SiO2 layer.49
Eventually, the Au core is trapped in a hollow cavity surrounded by a polymeric shell
consisting either of poly(ethylene glycol) (PEG) or poly(N-isopropylacrylamide). As
reported earlier, the use of NH4OH as alkaline catalyst for the initiator fixation induces
agglomeration, and therefore TEA was used for this procedure to minimize the risk, and
despite the broadened UV-vis signal for the APTES-Br coated core-shell particles (Fig. 74)
which is indicative for some agglomeration formation, the DLS measurements and TEM
micrographs do not support this findings (Fig. 73 and Fig. 75).50 TEA can deprotonate the
silanol groups thus enabling the alkoxysilane initiators to attach onto the SiO2 surface.51–53
The immobilization of the initiator on the particle surface was verified by elemental
analysis which determined the Br content to be 1.08 wt%, thus giving about 125 µmol of
5. Surface Hydrophobization of AgNPs through SI-ATRP
194
Br/g of nanoparticle. By assuming a spherical shape of the core-shell particles and a silanol
group density of 5/nm2,54 the initiator density becomes around 7-8 molecules/nm2 which is
higher than the reported in the literature and the theoretically possible grafting densities,
but could be attributed to the formation of multilayered networks of the APTES-Br on the
surface.50,55 However, the calculated polymer chain density was ~ 0.1 chains/nm2, a value
which is smaller than the ones reported previously (see TGA spectra).44,50 The SI-ATRP
was performed at 70 °C in order to control the molecular weight distribution of the
polymers as well as to prevent potential effects of the present copper salts in the solution
on the morphology of the AgNPs.56 Free “sacrificial” initiator (2-(EiB)Br) was introduced
in order to achieve control over the polymerization through the accumulation of sufficient
amounts of Cu(II) species via radical termination.50,57 The use of CuCl in this work rather
than CuBr was attributed to the fact that ATRP reactions conducted with CuBr generally
led to higher polymer dispersion index (PDI) compared to the reactions which employed
CuCl catalyst.58,59 The polymerization was terminated after 7 h, which led to an overall
monomer conversion of 46 %. An increase in the particle size as a result of the growing
insulating layer was observed in both the TEM micrographs as well as in the DLS spectra
of the corresponding particles at each functionalization stage (Fig. 73 and Fig. 75).
Unfortunately, it was difficult to differentiate the SiO2- and PMMA-shell from each other
due to the amorphous nature and poor electron density featured by both entities, but an
increase in the size of the core-shell particles after the polymerization was observed in the
corresponding TEM micrographs (Fig. 73) although the size of the PMMA-coated core-
shell particles is much lower than the value obtained from the DLS measurements (Tab.
15). This can be explained by the fact that the hydrodynamic diameter of the particles is
larger in solution due to the swelling of the tethered polymer chains in organic solvents. A
similar observation was made by Ohno et al. where the hydrodynamic diameter DH of the
particles obtained from DLS measurements surpasses the size determined from the TEM
micrographs.50 In contrast, the polymers collapse in the dry state and form compact core-
shell structures thus leading to the smaller particle size observed by TEM. Additionally,
some chains might undergo interdigitation as a result of attractive forces occurring between
them thus leading to a compression of the PMMA shell.48

5. Surface Hydrophobization of AgNPs through SI-ATRP
195
0 200 400 600 800 10000.0
0.5
1.0
Cum
ula
tive N
um
ber
Fra
ction
Size (nm)
AgNPs Ag@SiO
2
Ag@SiO2@Br
Ag@SiO2@PMMA
Fig. 75: DLS spectra of AgNPs, Ag@SiO2, APTES-Br and PMMA-coated Ag@SiO2 core-shell particles recorded in EtOH.
Concerning the image analysis performed on the TEM micrographs of the
Ag@SiO2@PMMA core-shell particles, the average diameter of the particles was
increased by ~ 20 nm, therefore the resulting polymer shell composed of PMMA chains in
the dry state is estimated to be around 10 nm thick (Fig. 76). An overview of the
determined parameters for the particles after each functionalization step is shown in Tab.
15. The corresponding UV-vis spectrum of the PMMA-coated core-shell particles was
recorded in THF due to its enhanced solubility in non-polar solvents and is shown in Fig.
77. For comparison reasons, the spectrum of the APTES-Br coated core-shell particles was
also recorded in THF. After the polymerization on the APTES-Br coated core-shell
particles, the maximum absorption peak max initially experiences a blue shifting from 457
to 455 nm which could be explained by the increase in the interparticle distance through
the growing of the polymer chains as well as the change in the dielectric medium of the
particles ( PMMA < SiO2).60 The narrower peaks of the PMMA-coated Ag@SiO2 core-shell

5. Surface Hydrophobization of AgNPs through SI-ATRP
196
particles compared to the uncoated counterpart in the UV-vis spectra could be indicative
for a better dispersion of the particles in THF as a result of rendering the surface
hydrophobic. With increasing polymerization time, max experiences a small bathochromic
shift from 455 to 460 nm which might be caused by the enhanced interactions of the
particles as a result of the previously mentioned interdigitation of the polymers attributed
to the increase in the molecular weight. Despite the steric repulsion between the dangling
polymer chains, they might be able to form tight ensembles with each other due to the
entanglement/interdigitation caused by hydrophobic/hydrophobic interactions. This can
manifest itself in the broadening of the UV-vis spectra (Fig. 77) after 7h of polymerization.
0 25 50 75 100 1250.0
0.2
0.4
Fre
qu
en
cy (
a.
u.)
Size (nm)
AgNPs Ag@SiO
2
Ag@SiO2@PMMA
Fig. 76: Particle size distribution of AgNPs, Ag@SiO2 core-shell particles and PMMA-coated Ag@SiO2 core-shell particles obtained from the image analysis of TEM micrographs.

5. Surface Hydrophobization of AgNPs through SI-ATRP
197
Tab. 15: Determined size parameters of AgNPs, Ag@SiO2 core-shell particles (before and after immobilization of APTES-Br) and PMMA-coated Ag@SiO2 core-shell particles.
Size (TEM) Size (DLS)a max
AgNPs 59 (22) 75 (29)b 434b
Ag@SiO2 65 (14) 83 (35)b 443b
Ag@SiO2@Br - 86 (32)b 453b
Ag@SiO2@PMMA 84 (16) 342 (99)c 460c
a Mean numerical diameter. In the parenthesis is reported the measured standard deviation of the particle population
b measured in EtOH
c measured in THF
400 500 600 700 8000.0
0.5
1.0
Ab
so
rba
nce
Wavelength (nm)
0 min 60 min 120 min 210 min 315 min 420 min
Fig. 77: UV-vis spectra of APTES-Br coated Ag@SiO2 core-shell particles and PMMA-coated Ag@SiO2 core-shell obtained from the aliquots taken after a prescribed amount of time. The spectra were recorded in THF.

5. Surface Hydrophobization of AgNPs through SI-ATRP
198
In Fig. 78, water/toluene extraction tests of the particles after each corresponding
functionalization step are illustrated. The particles remained hydrophilic even after the
immobilization of the APTES-Br initiator which is in agreement with the literature.51
Fig. 78: Water/toluene extraction tests of AgNPs (a), Ag@SiO2 (b), APTES-Br -coated Ag@SiO2 (c) and PMMA-coated Ag@SiO2 core-shell particles (d). The organic phase is above the aqueous phase.
As expected, the grafting of PMMA on the initiator-coated Ag@SiO2 core-shell particles
led to a transfer of the particles into the hydrophobic phase due to the hydrophobic
polymer chains on the surface. The PMMA-coated core-shell particles were dispersible in
a variety of organic solvents which includes toluene, THF and acetone. In order to control
and analyze the polymerization, aliquots were taken out of the reaction solution after
defined time intervals. The reaction was terminated after a monomer conversion of 46 %
(Fig. 79).
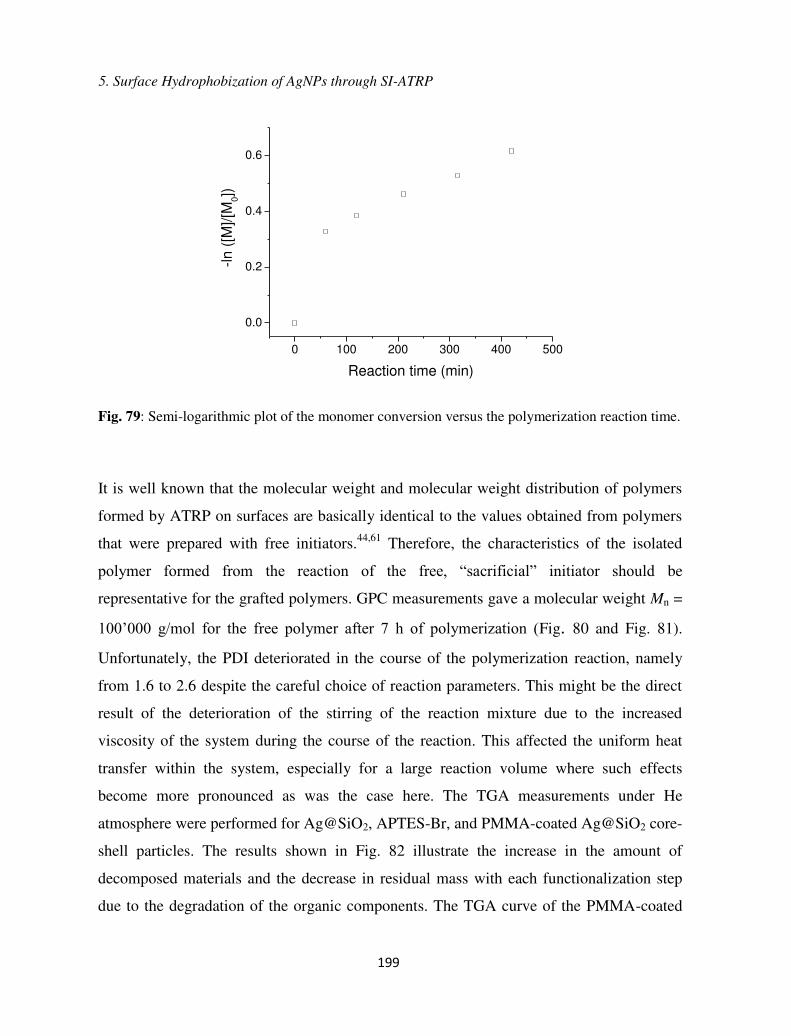
5. Surface Hydrophobization of AgNPs through SI-ATRP
199
0 100 200 300 400 500
0.0
0.2
0.4
0.6
-ln (
[M]/[M
0])
Reaction time (min)
Fig. 79: Semi-logarithmic plot of the monomer conversion versus the polymerization reaction time.
It is well known that the molecular weight and molecular weight distribution of polymers
formed by ATRP on surfaces are basically identical to the values obtained from polymers
that were prepared with free initiators.44,61 Therefore, the characteristics of the isolated
polymer formed from the reaction of the free, “sacrificial” initiator should be
representative for the grafted polymers. GPC measurements gave a molecular weight Mn =
100’000 g/mol for the free polymer after 7 h of polymerization (Fig. 80 and Fig. 81).
Unfortunately, the PDI deteriorated in the course of the polymerization reaction, namely
from 1.6 to 2.6 despite the careful choice of reaction parameters. This might be the direct
result of the deterioration of the stirring of the reaction mixture due to the increased
viscosity of the system during the course of the reaction. This affected the uniform heat
transfer within the system, especially for a large reaction volume where such effects
become more pronounced as was the case here. The TGA measurements under He
atmosphere were performed for Ag@SiO2, APTES-Br, and PMMA-coated Ag@SiO2 core-
shell particles. The results shown in Fig. 82 illustrate the increase in the amount of
decomposed materials and the decrease in residual mass with each functionalization step
due to the degradation of the organic components. The TGA curve of the PMMA-coated

5. Surface Hydrophobization of AgNPs through SI-ATRP
200
core-shell particles show different stages of degradation, a feature observed for the
decomposition of PMMA prepared through radical initiation. The different stages of
decomposition are a result of different polymer degradation mechanisms found in PMMA
which are described elsewhere.62–65 Overall, the residual mass after the degradation of
PMMA-coated Ag@SiO2 core-shell particles is about 79.9 wt%, indicating a polymer
content of 14.2 wt% by taking the residual mass of APTES-Br functionalized core-shell
particles after thermal degradation into account (Fig. 82). In volumetric terms, the Ag
content in the core-shell particles is still around 20-30 vol%, and is within the vicinity of
the percolation threshold described for Ag-based nanocomposites.10,66
104 105 1060.0
0.5
1.0
1.5
2.0
Inte
nsi
ty (
a.u
.)
Mn (g/mol)
60 min 120 min 210 min 315 min 420 min
Fig. 80: Molecular weight (Mn) of free, sacrificial PMMA obtained from GPC measurements of aliquots taken after a prescribed amount of reaction time.

5. Surface Hydrophobization of AgNPs through SI-ATRP
201
100 150 200 250 300 350 400 450
75
80
85
90
95
100
Time (min)
Mn
(kg
/mo
l)
1.5
1.8
2.1
2.4
2.7
PD
I (M
w/M
n)
Fig. 81: The development of the molecular weight Mn and the polymer dispersity index (PDI) with time.
200 400 600 800
80
85
90
95
100
96.4 %
94.1 %
We
igh
t (%
)
Temperature (°C)
Ag@SiO2
Ag@SiO2@Br
Ag@SiO2@PMMA
79.9 %
Fig. 82: TGA curves of Ag@SiO2, APTES-Br and PMMA-coated Ag@SiO2 core-shell particles.
5. Surface Hydrophobization of AgNPs through SI-ATRP
202
5.4 Conclusion and Outlook
In summary, PMMA-coated Ag@SiO2 core-shell particles which exhibit enhanced
solubility in organic, non-polar solvents have been prepared in gram scale. They can serve
as an alternative set of core-shell particles to be used for the preparation of nanocomposites
with a hydrophobic polymer matrix. The enhanced dispersibility of the particles can lead to
a homogenous dispersion of the particles into the polymer matrix and avoid the formation
of micron-sized agglomerates which are likely to occur when the particles are dispersed
into an incompatible matrix. Further work on the improvement of the PDI of the resulting
polymers will be on the agenda. The dielectric properties of the filler as well as those of
their resulting nanocomposites will be examined in the near future.
5.5 Acknowledgements
Our special thanks go out to S. Dünki and B. Fischer for conducting the GPC and TGA
measurements, respectively. We also gratefully acknowledge Swiss National Science
Foundation (SNF132101), (SNFS 150638) and Swiss Federal Laboratories for Materials
Science and Technology (Empa, Dübendorf) for financial support.
5. Surface Hydrophobization of AgNPs through SI-ATRP
203
5.6 References
(1) Reszczyńska, J.; Jurek, A.; Łącka, I.; Skwarek, E.; Zaleska, A. Preparation of Silver Nanoparticles in Reverse Micelles and Antibacterial Activity of Silver Modified-Paints. Adv. Mater. Sci. 2010, 10, 12–20.
(2) Goyal, A.; Kumar, A.; Patra, P. K.; Mahendra, S.; Tabatabaei, S.; Alvarez, P. J. J.; John, G.; Ajayan, P. M. In Situ Synthesis of Metal Nanoparticle Embedded Free Standing Multifunctional PDMS Films. Macromol. Rapid Commun. 2009, 30, 1116–1122.
(3) Sharma, V. K.; Yngard, R. A.; Lin, Y. Silver Nanoparticles: Green Synthesis and Their Antimicrobial Activities. Adv. Colloid Interface Sci. 2009, 145, 83–96.
(4) Wiley, B. J.; Chen, Y.; McLellan, J. M.; Xiong, Y.; Li, Z.-Y.; Ginger, D.; Xia, Y. Synthesis and Optical Properties of Silver Nanobars and Nanorice. Nano Lett. 2007, 7, 1032–1036.
(5) Evanoff, D. D.; Chumanov, G. Synthesis and Optical Properties of Silver Nanoparticles and Arrays. Chemphyschem 2005, 6, 1221–1231.
(6) Adam D. McFarland, R. P. V. D. Single Silver Nanoparticles As Real Time Optical Sensors With Zeptomole Sensitivity. Nano Lett. 2003, 3, 1057–1062.
(7) Xu, R.; Wang, D.; Zhang, J.; Li, Y. Shape-Dependent Catalytic Activity of Silver Nanoparticles for the Oxidation of Styrene. Chem. - An Asian J. 2006, 1, 888–893.
(8) Jiang, Z.-J.; Liu, C.-Y.; Sun, L.-W. Catalytic Properties of Silver Nanoparticles Supported on Silica Spheres. J. Phys. Chem. B 2005, 109, 1730–1735.
(9) Lu, J.; Moon, K.-S.; Wong, C. P. Silver/polymer Nanocomposite as a High-K Polymer Matrix for Dielectric Composites with Improved Dielectric Performance. J. Mater. Chem. 2008, 18, 4821–4826.
(10) Qi, L.; Lee, B. I.; Chen, S.; Samuels, W. D.; Exarhos, G. J. High-Dielectric-Constant Silver-Epoxy Composites as Embedded Dielectrics. Adv. Mater. 2005, 17, 1777–1781.
(11) Lu, J.; Moon, K.-S.; Xu, J.; Wong, C. P. Synthesis and Dielectric Properties of Novel High-K Polymer Composites Containing in-Situ Formed Silver Nanoparticles for Embedded Capacitor Applications. J. Mater. Chem. 2006, 16, 1543–1548.
(12) Atwater, H. A.; Polman, A. Plasmonics for Improved Photovoltaic Devices. Nat. Mater. 2010, 9, 205–213.

5. Surface Hydrophobization of AgNPs through SI-ATRP
204
(13) Quinsaat, J. E. Q.; Testino, A.; Pin, S.; Huthwelker, T.; Bowen, P.; Hofmann, H.; Ludwig, C.; Opris, D. M. Continuous Production of Tailored Silver Nanoparticles by Polyol Synthesis and Reaction Yield Measured by X-Ray Absorption Spectroscopy: Towards a Growth. J. Phys. Chem. C 2014, 118, 11093–11103.
(14) Nishioka, M.; Miyakawa, M.; Kataoka, H.; Koda, H.; Sato, K.; Suzuki, T. M. Continuous Synthesis of Monodispersed Silver Nanoparticles Using a Homogeneous Heating Microwave Reactor System. Nanoscale 2011, 3, 2621–2626.
(15) Mehenni, H.; Sinatra, L.; Mahfouz, R.; Katsiev, K.; Bakr, O. M. Rapid Continuous Flow Synthesis of High-Quality Silver Nanocubes and Nanospheres. RSC Adv. 2013, 3, 22397–22403.
(16) Huang, J.; Lin, L.; Li, Q.; Sun, D.; Wang, Y.; Lu, Y.; He, N.; Yang, K.; Yang, X.; Wang, H.; et al. Continuous-Flow Biosynthesis of Silver Nanoparticles by Lixivium of Sundried Cinnamomum Camphora Leaf in Tubular Microreactors. Ind. Eng. Chem. Res. 2008, 47, 6081–6090.
(17) Wiley, B.; Sun, Y.; Xia, Y. Synthesis of Silver Nanostructures with Controlled Shapes and Properties. Acc. Chem. Res. 2007, 40, 1067–1076.
(18) Dong, Q.; Yu, H.; Jiao, Z.; Lu, G.; Bi, Y. New Facile Synthesis of One-Dimensional Ag@TiO 2 Anatase Core–shell Nanowires for Enhanced Photocatalytic Properties. RSC Adv. 2014, 4, 59114–59117.
(19) Zhang, X.; Zhu, Y.; Yang, X.; Wang, S.; Shen, J.; Lin, B.; Li, C. Enhanced Visible Light Photocatalytic Activity of Interlayer-Isolated Triplex Ag@SiO2@TiO2 Core-Shell Nanoparticles. Nanoscale 2013, 5, 3359–3366.
(20) Qi, J.; Dang, X.; Hammond, P. T. .; Belcher, A. M. . Highly Efficient Plasmon-Enhanced Dye-Sensitized Solar Cells through Metal@Oxide Core-Shell Nanostructure. ACS Nano 2011, 5, 7108–7116.
(21) Baida, H.; Billaud, P.; Marhaba, S.; Christofilos, D.; Cottancin, E.; Crut, A.; Lermé, J.; Maioli, P.; Pellarin, M.; Broyer, M.; et al. Quantitative Determination of the Size Dependence of Surface Plasmon Resonance Damping in Single Ag@SiO2 Nanoparticles. Nano Lett. 2009, 9, 3463–3469.
(22) Rainville, L.; Dorais, M.-C.; Boudreau, D. Controlled Synthesis of Low Polydispersity Ag@SiO2 Core–shell Nanoparticles for Use in Plasmonic Applications. RSC Adv. 2013, 3, 13953-13960.

5. Surface Hydrophobization of AgNPs through SI-ATRP
205
(23) Wang, W.; Zhipeng, L.; Baohua, G.; Zhenyu, Z.; Hongxin, X. Ag@SiO2 Core-Shell Nanoparticles for Probing Spatial Distribution of Electromagnetic Field Enhancement via Surface-Enhanced Raman Scattering. ACS Nano 2009, 3, 3493–3496.
(24) Zhou, Y.; Wang, L.; Zhang, H.; Bai, Y.; Niu, Y.; Wang, H. Enhanced High Thermal Conductivity and Low Permittivity of Polyimide Based Composites by Core-Shell Ag@SiO2 Nanoparticle Fillers. Appl. Phys. Lett. 2012, 101, 012903.
(25) Liang, X.; Yu, S.; Sun, R.; Luo, S.; Wan, J.; Yu, S.; Sun, R.; Luo, S.; Liang, X.; Wan, J.; et al. Microstructure and Dielectric Behavior of the Three-Phase Ag@SiO2/BaTiO3/PVDF Composites with High Permittivity. J. Mater. Res. 2012, 27, 991–998.
(26) Quinsaat, J. E. Q.; Nüesch, F. A.; Hofmann, H.; Opris, D. M. Dielectric Properties of Silver Nanoparticles Coated with Silica Shells of Different Thicknesses. RSC Adv. 2013, 3, 6964–6971.
(27) Balazs, A. C.; Emrick, T.; Russell, T. P. Nanoparticle Polymer Composites: Where Two Small Worlds Meet. Science 2006, 314, 1107–1110.
(28) Cho, H. K.; Cho, H.-J.; Lone, S.; Kim, D.-D.; Yeum, J. H.; Cheong, I. W. Preparation and Characterization of MRI-Active Gadolinium Nanocomposite Particles for Neutron Capture Therapy. J. Mater. Chem. 2011, 21, 15486–15493.
(29) Suratwala, T. I.; Hanna, M. L.; Miller, E. L.; Whitman, P. K.; Thomas, I. M.; Ehrmann, P. R.; Maxwell, R. S.; Burnham, A. K. Surface Chemistry and Trimethylsilyl Functionalization of Stöber Silica Sols. J. Non. Cryst. Solids 2003, 316, 349–363.
(30) Gun’ko, V.; Vedamuthu, M.; Henderson, G.; Blitz, J. Mechanism and Kinetics of Hexamethyldisilazane Reaction with a Fumed Silica Surface. J. Colloid Interface Sci. 2000, 228, 157–170.
(31) Lee, C. H.; Park, S. H.; Chung, W.; Kim, J. Y.; Kim, S. H. Preparation and Characterization of Surface Modified Silica Nanoparticles with Organo-Silane Compounds. Colloids Surfaces A Physicochem. Eng. Asp. 2011, 384, 318–322.
(32) Kaas, R. L.; Kardos, J. L. The Interaction of Alkoxy Silane Coupling Agents with Silica Surfaces. Polym. Eng. Sci. 1971, 11, 11–18.
(33) Huang, Z. F.; Qu, X. Y.; Chen, Z. Nano-SiO2/PMMA-PU Composite Particles with Core-Shell Structure via Emulsion Polymerization and Their Application in Epoxy Resin. J. Appl. Polym. Sci. 2015, 132, n/a – n/a.

5. Surface Hydrophobization of AgNPs through SI-ATRP
206
(34) Matyjaszewski, K.; Xia, J. Atom Transfer Radical Polymerization. Chem. Rev. 2001, 101, 2921–2990.
(35) Hui, C. M.; Pietrasik, J.; Schmitt, M.; Mahoney, C.; Choi, J.; Bockstaller, M. R.; Matyjaszewski, K. Surface-Initiated Polymerization as an Enabling Tool for Multifunctional (Nano-)Engineered Hybrid Materials. Chem. Mater. 2014, 26, 745–762.
(36) Mora-Barrantes, I.; Valentín, J. Poly (styrene)/silica Hybrid Nanoparticles Prepared via ATRP as High-Quality Fillers in Elastomeric Composites. J. Mater. Chem. 2012, 22, 1403–1410.
(37) Von Werne, T.; Patten, T. E. Atom Transfer Radical Polymerization from Nanoparticles: A Tool for the Preparation of Well-Defined Hybrid Nanostructures and for Understanding the Chemistry of Controlled/“living” Radical Polymerizations from Surfaces. J. Am. Chem. Soc. 2001, 123, 7497–7505.
(38) Patten, T. E.; Matyjaszewski, K. Atom Transfer Radical Polymerization and the Synthesis of Polymeric Materials. Adv. Mater. 1998, 10, 901–915.
(39) Mandal, T. K.; Fleming, M. S.; Walt, D. R. Preparation of Polymer Coated Gold Nanoparticles by Surface-Confined Living Radical Polymerization at Ambient Temperature. Nano Lett. 2002, 2, 3–7.
(40) Dong, H.; Zhu, M.; Yoon, J. A.; Gao, H.; Jin, R.; Matyjaszewski, K. One-Pot Synthesis of Robust Core/shell Gold Nanoparticles. J. Am. Chem. Soc. 2008, 130, 12852–12853.
(41) Nuss, S.; Böttcher, H. Gold Nanoparticles with Covalently Attached Polymer Chains. Angew. Chemie (International ed. English)) 2001, 40, 4016–4018.
(42) Li, D.; Jang, Y. J.; Lee, J. J.-E.; Kochuveedu, S. T.; Kim, D. H. Grafting poly(4-Vinylpyridine) onto Gold Nanorods toward Functional Plasmonic Core–shell Nanostructures. J. Mater. Chem. 2011, 21, 16453–16460.
(43) Chakraborty, S.; Bishnoi, S. W.; Pe, H. Gold Nanoparticles with Poly (N-Isopropylacrylamide) Formed via Surface Initiated Atom Transfer Free Radical Polymerization Exhibit Unusually Slow Aggregation Kinetics. J. Phys. Chem. C 2010, 114, 5947–5955.
(44) Ohno, K.; Koh, K.; Tsujii, Y.; Fukuda, T. Synthesis of Gold Nanoparticles Coated with Well-Defined, High-Density Polymer Brushes by Surface-Initiated Living Radical Polymerization. Macromolecules 2002, 35, 8989–8993.

5. Surface Hydrophobization of AgNPs through SI-ATRP
207
(45) Zhang, J.; Jiang, L.; Pan, K.; Yi, Z.; Dan, Y. Controlled Polymerization of Methylmethacrylate from Fumed SiO2 Nanoparticles through Atom Transfer Radical Polymerization. Polym. Int. 2014, 63, 413–419.
(46) Sun, Y.; Ding, X.; Zheng, Z.; Cheng, X.; Hu, X.; Peng, Y. Surface Initiated ATRP in the Synthesis of Iron Oxide/polystyrene Core/shell Nanoparticles. Eur. Polym. J. 2007, 43, 762–772.
(47) Luo, Y.-R. Comprehensive Handbook of Chemical Bond Energies; CRC Press: Boca Raton, FL, USA 2007.
(48) Matsui, J.; Parvin, S.; Sato, E.; Miyashita, T. Preparation of Organic–ceramic–metal Multihybrid Particles and Their Organized Assembly. Polym. J. 2010, 42, 142–147.
(49) Li, G. L.; Xu, L. Q.; Neoh, K. G.; Kang, E. T. Hairy Hybrid Microrattles of Metal Nanocore with Functional Polymer Shell and Brushes. Macromolecules 2011, 44, 2365–2370.
(50) Ohno, K.; Akashi, T.; Huang, Y.; Tsujii, Y. Surface-Initiated Living Radical Polymerization from Narrowly Size-Distributed Silica Nanoparticles of Diameters Less Than 100 Nm. Macromolecules 2010, 43, 8805–8812.
(51) Husseman, M.; Malmström, E. Controlled Synthesis of Polymer Brushes by “living” Free Radical Polymerization Techniques. Macromolecules 1999, 32, 1424–1431.
(52) Carrot, G.; Diamanti, S.; Manuszak, M.; Charleux, B.; Vairon, J. P. Atom Transfer Radical Polymerization of N-Butyl Acrylate from Silica Nanoparticles. J. Polym. Sci. Part A Polym. Chem. 2001, 39, 4294–4301.
(53) Matsuura, K.; Ohno, K.; Kagaya, S.; Kitano, H. Carboxybetaine Polymer-Protected Gold Nanoparticles: High Dispersion Stability and Resistance against Non-Specific Adsorption of Proteins. Macromol. Chem. Phys. 2007, 208, 862–873.
(54) Fernandes, N. J.; Akbarzadeh, J.; Peterlik, H.; Giannelis, E. P. Terms of Use Synthesis and Properties of Highly Dispersed Ionic Silica À Poly ( Ethylene Oxide ) Nanohybrids. ACS Nano 2013, 7, 1265–1271.
(55) Naik, V. V; Crobu, M.; Venkataraman, N. V; Spencer, N. D. Multiple Transmission-Reflection IR Spectroscopy Shows That Surface Hydroxyls Play Only a Minor Role in Alkylsilane Monolayer Formation. J. Phys. Chem. Lett. 2013, 4, 2745–2751.
(56) Sun, Y.; Mayers, B.; Herricks, T.; Xia, Y. Polyol Synthesis of Uniform Silver Nanowires: A Plausible Growth Mechanism and the Supporting Evidence. Nano Lett. 2003, 3, 955–960.

5. Surface Hydrophobization of AgNPs through SI-ATRP
208
(57) Louis Chakkalakal, G.; Alexandre, M.; Abetz, C.; Boschetti-de-Fierro, A.; Abetz, V. Surface-Initiated Controlled Radical Polymerization from Silica Nanoparticles with High Initiator Density. Macromol. Chem. Phys. 2012, 213, 513–528.
(58) Edmondson, S.; Huck, W. T. S. Controlled Growth and Subsequent Chemical Modification of Poly(glycidyl Methacrylate) Brushes on Silicon Wafers. J. Mater. Chem. 2004, 14, 730–734.
(59) Chatterjee, U.; Jewrajka, S. K.; Mandal, B. M. The Beneficial Effect of Small Amount of Water in the Ambient Temperature Atom Transfer Radical Homo and Block Co-Polymerization of Methacrylates. Polymer (Guildf). 2005, 46, 1575–1582.
(60) Su, K. H.; Wei, Q. H.; Zhang, X.; Mock, J. J.; Smith, D. R.; Schultz, S. Interparticle Coupling Effects on Plasmon Resonances of Nanogold Particles. Nano Lett. 2003, 3, 1087–1090.
(61) Ohno, K.; Morinaga, T.; Koh, K.; Tsujii, Y.; Fukuda, T. Synthesis of Monodisperse Silica Particles Coated with Well-Defined, High-Density Polymer Brushes by Surface-Initiated Atom Transfer Radical Polymerization. Macromolecules 2005, 38, 2137–2142.
(62) Kashiwagi, T.; Inaba, A.; Brown, J. E.; Hatada, K.; Kitayama, T.; Masuda, E. Effects of Weak Linkages on the Thermal and Oxidative Degradation of Poly(methyl Methacrylates). Macromolecules 1986, 19, 2160–2168.
(63) Inaba, A.; Kashiwagi, T.; Brown, J. E. Effects of Initial Molecular Weight on Thermal Degradation of Poly(methyl Methacrylate): Part 1—Model 1. Polym. Degrad. Stab. 1988, 21, 1–20.
(64) Kashiwagi, T.; Inabi, A. Behavior of Primary Radicals during Thermal Degradation of Poly ( Methyl Methacrylate. Polym. Degrad. Stab. 1989, 26, 161–184.
(65) Manring, L. E. Thermal Degradation of Poly(methy1 Methacrylate). 4. Random Side-Group Scission. Macromolecules 1991, 24, 3304–3309.
(66) Rajesh, S.; Sonoda, K.; Uusimaki, A.; Yang, K. H.; Lu, H. Y.; Jantunen, H. Effective Dielectric Response of Polymer Composites with Ceramic Coated Silver Flakes. J. Mater. Sci. Mater. Electron. 2012, 24, 191–195.
6. Conclusions
209
6. Conclusions
The polyol synthesis enabled the preparation of AgNPs in large quantities which was
essential for the preparation of nanocomposites with PDMS. Although the preparation of
AgNPs in gram scale could be achieved with traditional batch reactions, the SFTR
provided the possibility of preparing large amounts of the AgNPs with an enhanced control
over the particle size and distribution at a production rate of around 2 g/h at a conversion
of almost 100 %. The tests with the SFTR showed that it was possible to prepare AgNPs
with sizes ranging from 7-104 nm by tuning the reaction parameters. The synthesis of
AgNPs with the SFTR, which was applied and accomplished in the course of this project,
will replace the conventional batch synthesis of AgNPs in the future stages of this work.
The encapsulation of the AgNPs with a SiO2 shell was possible by performing a modified
Stöber method at silver concentrations of ~ 50 mM. The dielectric properties of the
Ag@SiO2 core-shell particles depended heavily on the thickness of the insulating shell.
While a SiO2 shell thickness of ~ 3 nm (Ag core ~ 38 nm) was too thin to prevent the
AgNPs from forming a percolation pathway, the growth of the SiO2 shell to 20 nm led to
dielectric properties similar to pure SiO2 ( ’ ~ 3.9). Between those two thickness values,
the permittivity of the core-shell particles increased with decreasing SiO2 shell thickness
and reached a maximum permittivity ’ ~ 41. Therefore, a very thin SiO2 is essential to
obtain a maximum enhancement in the resulting permittivity of the core-shell particles
although the insulation should still be ensured. Therefore, the SiO2 shell was kept at 4 nm
for the other projects of this work.
The preparation of Ag@SiO2 core-shell particles allowed further surface functionalization
due to the presence of the hydroxyl-groups on the particle surface. Since the particles will
be dispersed into hydrophobic PDMS, the core-shell particles were rendered hydrophobic
through the grafting of alkyl silanes or by growing polymers on the surface though the SI-
ATRP. The hydrophobicity of the functionalized core-shell particles was observed through
their enhanced dispersion in non-polar solvents. The surface treatment is also essential in

6. Conclusions
210
order to reduce the possibility of water adsorption on the surface which can influence the
dielectric measurements.
The resulting set of nanocomposites of the functionalized Ag@SiO2 core-shell particles
with PDMS (Mw ~ 13λ’000 g/mol) denoted as series A in Chapter 4 featured enhanced
dielectric properties with increasing filler content, with a maximum of permittivity of 7.8
at 18 vol% Ag. However, an increase in the Young’s modulus Y as well as a decrease in
the strain-at-break values were observed with the increase in the Ag content in the
nanocomposites, and therefore further modifications were applied by (i) using an
ultrasonicator tip for the dispersion of the filler and (ii) by using PDMS with a higher
molecular weight (Mw ~ 6λ2’000 g/mol). The nanocomposites with the high molecular
weight PDMS featured high elasticity, but the permittivities exhibited by this new series of
nanocomposites (series B) were lower than the nanocomposites of the series A at Ag
contents exceeding 15 vol%. This can be explained by the better dispersion of the particles
in series B which leads to larger interparticle distances, while the nanocomposites of series
A feature the presence of large agglomerates (tens of microns) which give larger
permittivities as a result of the closer proximity of the particles to each other. This effect is
particularly pronounced with increasing filler contents as the nanocomposite A18 (18 vol%
Ag) has a larger permittivity than the nanocomposite B20 (20 vol% Ag). However, the
nanocomposites of series B featured lower values for tan as well as higher breakdown
strengths EB in comparison to the nanocomposites of series A. The sample B20 was
subjected to actuator tests, but did not reveal any strain in thickness direction which can be
attributed to the relatively high Young’s modulus Y of the nanocomposites compared to
conventional actuator membranes. In summary, functionalized Ag@SiO2 core-shell
particles have been used as high permittivity filler in nanocomposites. The nanocomposites
show a modest increase in permittivity, but rather low tan values and low electric
conductivities attributed to both the PDMS matrix and the effective insulation of the
AgNPs. The surrounding SiO2 serves both as an insulating material that prevents the Ag
particles from percolating and as an effective interface to enhance the compatibility of the
Ag with the PDMS matrix upon undergoing surface treatment.

7. Outlook
211
7. Outlook
Despite the remarkable elastic properties observed for the nanocomposites, there is still
room for further improvement. The permittivities of the nanocomposites are still relatively
low despite the high filler content. A potential increase in the permittivity can be expected
from the use of anisotropic structures, for example silver nanowires (AgNWs) or silver
nanorods (AgNRs). Preliminary experiments using AgNWs coated with thin SiO2 shells as
filler were performed by a co-worker, and the nanocomposites featured slightly higher
permittivities compared to the values observed for the nanocomposites using the AgNPs at
the corresponding volume fraction of Ag. However, a further increase in the content of
AgNWs led to the formation of conductive pathways, and the resulting nanocomposites
exhibited electrical conductivity. Perhaps, the use of AgNRs can lead to higher
enhancements in the composite permittivity in comparison to the use of AgNPs, but the
preparation of this particular nanostructure still remains a challenge. Further increase in the
permittivity can be achieved by replacing the silica insulator shell with a material that has a
higher permittivity (e.g. TiO2). The high strains that were achieved with the
nanocomposites using functionalized AgNPs emphasizes their potential for energy
harvesting, but the low breakdown strength is still a limiting factor for their potential
application. The optimization of this parameter is essential and would enhance their ability
to store energy thus eventually paving the way for their effective use as a novel dielectric
elastomer generator (DEG).

7. Outlook
212
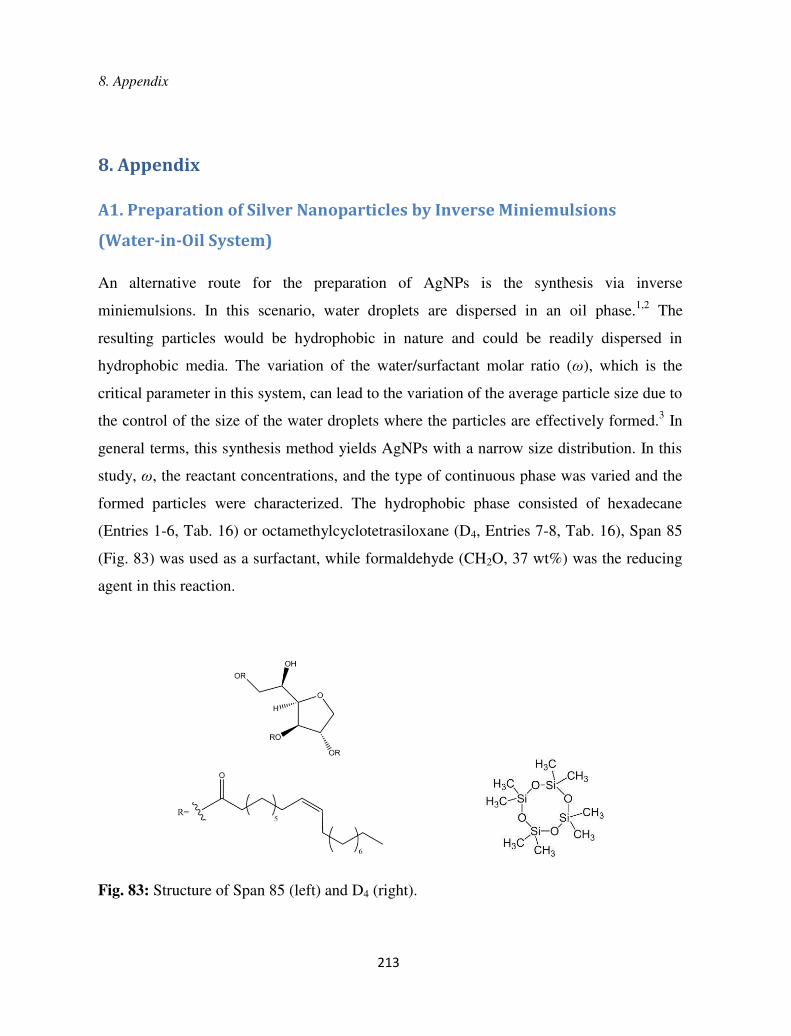
8. Appendix
213
8. Appendix
A1. Preparation of Silver Nanoparticles by Inverse Miniemulsions
(Water-in-Oil System)
An alternative route for the preparation of AgNPs is the synthesis via inverse
miniemulsions. In this scenario, water droplets are dispersed in an oil phase.1,2 The
resulting particles would be hydrophobic in nature and could be readily dispersed in
hydrophobic media. The variation of the water/surfactant molar ratio (ω), which is the
critical parameter in this system, can lead to the variation of the average particle size due to
the control of the size of the water droplets where the particles are effectively formed.3 In
general terms, this synthesis method yields AgNPs with a narrow size distribution. In this
study, ω, the reactant concentrations, and the type of continuous phase was varied and the
formed particles were characterized. The hydrophobic phase consisted of hexadecane
(Entries 1-6, Tab. 16) or octamethylcyclotetrasiloxane (D4, Entries 7-8, Tab. 16), Span 85
(Fig. 83) was used as a surfactant, while formaldehyde (CH2O, 37 wt%) was the reducing
agent in this reaction.
Fig. 83: Structure of Span 85 (left) and D4 (right).

8. Appendix
214
Briefly, the surfactant was dissolved in the organic phase and the aqueous AgNO3 and
formaldehyde solutions were added consecutively followed by the treatment of the
resulting mixture with the tip sonicator (Sonics VCX-500 Model CV33) for around 10 min.
The mixture was stirred overnight at 25 °C in order to observe an increase in the intensity
of the color of the mixture as a result of the surface plasmons which are indicative for the
formation of AgNPs. TEM, DLS and UV-vis spectra (Fig. 84, Fig. 85, Fig. 86 and Fig. 87)
show that the formed particles are quite small in size and do not vary significantly with the
variation of reaction parameters (Tab. 16). An interesting feature observed with this
preparation method is the periodic arrangement of the AgNPs with constant interparticle
distance as a result of the steric stabilization offered by the surfactant. When the amount of
Span 85 was decreased, the control over the interparticle distance deteriorated and the
periodic arrangement of the nanoparticles is perturbed as a result of the increase in the
particle size distribution. However, no clear trend in the average particle size was
established through the variation of the reactand concentration while keeping the
AgNO3/Span 85 mass ratio constant. The decrease AgNO3/Span 85 mass ratio led to the
slight decrease in the average particle size (Entries 1 and 2 in Tab. 16) as a result of the
formation of more stabilized water droplets due to the larger availability of the surfactant
in the mixture.3 At the other hand, an increase in ω subsequently led to an increase in the
particle size (Entries 4 and 6 in Tab. 16) along with an increase in the particle size
distribution. This was also observed in the case where D4 was used as the continuous
phase. The use of D4 was motivated by the possibility of polymerizing D4 in order to yield
PDMS with the AgNPs blended in situ. However, the AgNPs were not stable at elevated
temperatures and agglomerated at the polymerization temperature of 110 °C. A further
decrease in the surfactant concentration led to the destabilization of the miniemulsions
system followed by the phase separation. Overall, due to the limited particle sizes feasible,
the low reaction yield (< 5-10 %) as well as the difficulty of isolating the particles from
hexadecane or D4, this preparation method was found unsuitable for the preparation of
AgNPs for our purposes, and therefore no further optimization of this reaction was
pursued. Eventually, the focus shifted to the polyol synthesis of the silver nanostructures
due to the advantages associated with this reaction as mentioned in Chapter 1.
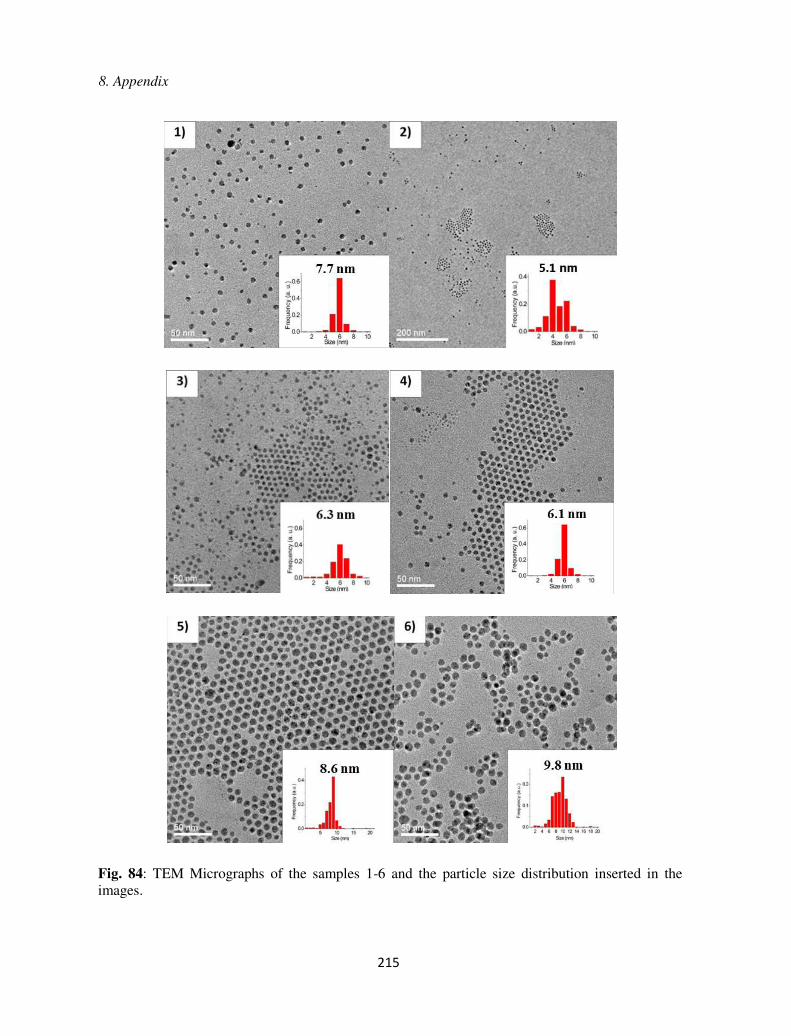
8. Appendix
215
Fig. 84: TEM Micrographs of the samples 1-6 and the particle size distribution inserted in the images.

8. Appendix
216
Fig. 85: TEM Micrographs of the samples 7 and 8 and the particle size distribution inserted in the images.
0 20 40 600.0
0.5
1.0
Cu
mula
tive
Num
ber
Fra
ctio
n
Size (nm)
8 7 6 5 4 3 2 1
Fig. 86: DLS spectra of AgNPs (Tab. 16, samples 1-8) which were prepared by reverse miniemulsions measured in toluene.

8. Appendix
217
300 400 500 600 700 800
0.0
0.5
1.0A
bsorb
ance
Wavelength (nm)
1 2 3 4 5 6 7 8
Fig. 87: UV-vis spectra of AgNPs (Tab. 16, samples 1-8) which were prepared by the inverse miniemulsions technique measured in hexadecane.

8. Appendix
218

8. Appendix
219
A2. The Preparation of Ag/PDMS Nanocomposites with Varying Particle
Size and their Resulting Dielectric Properties
The effect of the particle size on the resulting composite permittivity has also been
investigated in this work. For this purpose, different sets of AgNPs with average particle
diameters ranging from 25 to 76 nm were prepared (Fig. 88) and subjected to the surface
functionalization with SiO2 and HMDS as illustrated in Chapters 3 and 4. As the
designated preparation method, the polyol synthesis was used in order to prepare the
AgNPs intended to be used as high permittivity filler. While the AgNPs stabilized by
PVP10 (Mw ~ 10’000 g/mol) were prepared in a continuous fashion with the SFTR, the
AgNPs with the average diameter of 76 nm stabilized by PVP40 (Mw ~ 40’000 g/mol)
were prepared by performing multiple batch reactions. The reason for the deviation of the
preparation method is the high viscosity of the mixture of PVP40 in EG which prevented a
smooth introduction of the stabilizer into the SFTR (not the same as in Chapter 2).
However, the particle sizes feasible with the SFTR through the use of PVP10 as stabilizer
were limited to below 50 nm (even at a reaction temperature of 160 °C). Therefore, the
polyol synthesis involving the use of PVP40 was conducted in traditional batch reactions
in order to obtain AgNPs larger than 50 nm (similar reaction conditions as in Chapter 4,
reaction temperature was 150 °C) while the particles below 50 nm were prepared with the
SFTR at a reactor temperature 140, 150 and 160 °C, respectively. The reaction conditions
are similar to those reported in Chapter 2, although another SFTR was used for this series
of experiments which explains the deviation in the obtained particle sizes compared to the
ones reported in Chapter 2. The AgNPs were characterized by DLS, TEM and UV-vis
spectroscopy and the measurements show a clear trend with the varying particle size (Fig.
88, Fig. 89 and Fig. 90). The purified AgNPs were then subjected to the modified Stöber
method in order to insulate them with a thin SiO2 shell (~ 4 nm, Fig. 91).4 However, the
UV-vis spectra show the presence of shoulders at larger wavelengths for the particles with
sizes below 50 nm. These could indicate the presence of either agglomerates or the

8. Appendix
220
presence of particles which deviate from the spherical shape. The latter effect is more
pronounced for particles with small diameters, but disappears for larger particles as a result
of the larger particle size distribution.5 The agglomerates could have been formed through
the high reaction temperatures as a result of the low steric repulsions offered by the PVP10
compared to PVP40 where the longer polymer chains can perhaps offer a better steric
stabilization of the particles towards agglomeration. The preparation of the particles with
the SFTR was conducted for a couple of hours in order to generate sufficient particles, and
initially the reaction mixture was collected in a vessel cooled in an ice bath. Possibly, the
ice water was insufficient for the quenching/cooling of the incoming reaction mixture and
therefore, there might have been some agglomeration ongoing in the vessel where the
products are both collected and cooled simultaneously. Further modifications of this set-up
are still ongoing and will be on the future agenda which will consist of the continuous
cooling of the collecting vessel with a cooling medium. The silica-coating was performed
with a modified Stöber method and led to the successful coating of the AgNPs with a SiO2
shell thickness of ~ 4 nm. However, the surface passivation with SiO2 also led to the
formation of multiple silver cores within a SiO2 carpet. This effect is present in the silica-
coating of AgNPs with a diameter of 25 nm and manifests itself in the appearance of a
broad shoulder at larger wavelengths as well as the large particle size obtained from the
DLS measurement (Fig. 92 and Fig. 93). It has been claimed elsewhere that particles below
50 nm are unstable during the Stöber process and are thus susceptible to undergo
agglomeration.6

8. Appendix
221
Fig. 88a-d: TEM micrographs and size distribution (inserted) of the different AgNPs.
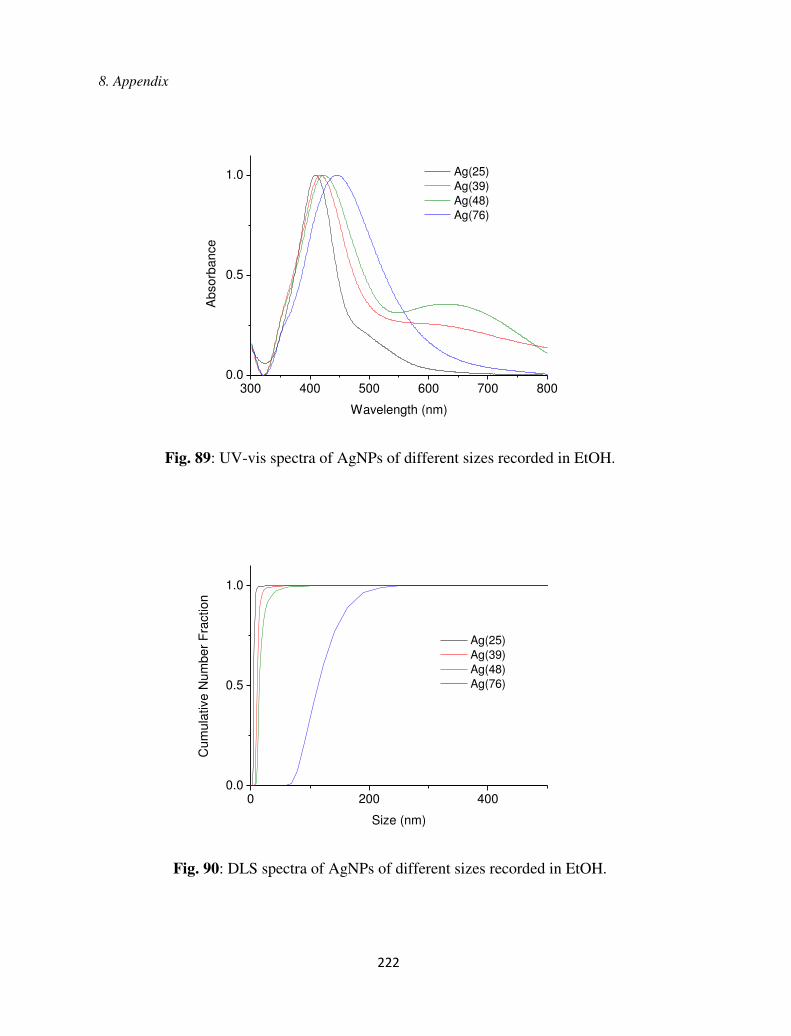
8. Appendix
222
300 400 500 600 700 8000.0
0.5
1.0 Ag(25) Ag(39) Ag(48) Ag(76)
Absorb
ance
Wavelength (nm)
Fig. 89: UV-vis spectra of AgNPs of different sizes recorded in EtOH.
0 200 4000.0
0.5
1.0
Ag(25) Ag(39) Ag(48) Ag(76)
Cum
ula
tive N
um
ber
Fra
ction
Size (nm)
Fig. 90: DLS spectra of AgNPs of different sizes recorded in EtOH.

8. Appendix
223
Fig. 91a-d: TEM micrographs of the different Ag@SiO2 core-shell particles. The diameter of the AgNPs as well as the thickness of the SiO2 shell is mentioned in parenthesis.
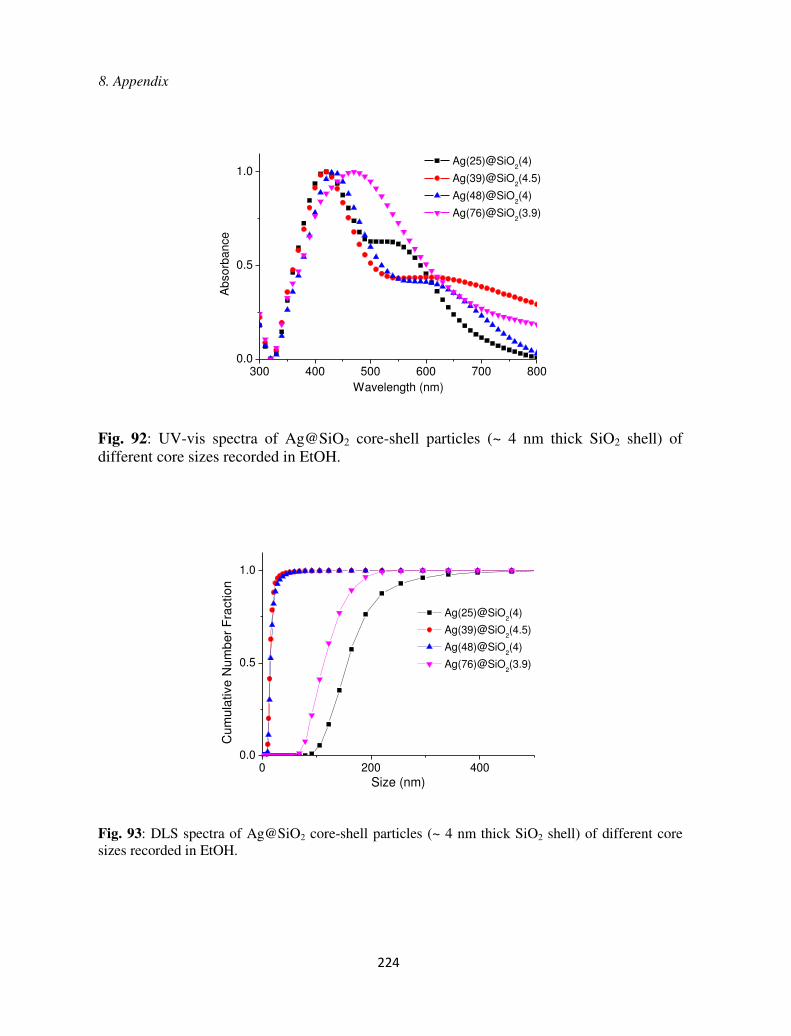
8. Appendix
224
300 400 500 600 700 8000.0
0.5
1.0 Ag(25)@SiO
2(4)
Ag(39)@SiO2(4.5)
Ag(48)@SiO2(4)
Ag(76)@SiO2(3.9)
Absorb
ance
Wavelength (nm)
Fig. 92: UV-vis spectra of Ag@SiO2 core-shell particles (~ 4 nm thick SiO2 shell) of different core sizes recorded in EtOH.
0 200 4000.0
0.5
1.0
Ag(25)@SiO2(4)
Ag(39)@SiO2(4.5)
Ag(48)@SiO2(4)
Ag(76)@SiO2(3.9)
Cu
mu
lative
Nu
mb
er
Fra
ctio
n
Size (nm)
Fig. 93: DLS spectra of Ag@SiO2 core-shell particles (~ 4 nm thick SiO2 shell) of different core sizes recorded in EtOH.

8. Appendix
225

8. Appendix
226
After the surface hydrophobization of the Ag@SiO2 core-shell particles through the
reaction with HMDS, the core-shell particles were used as filler for the preparation of
nanocomposites with high molecular weight PDMS. The nanocomposites were prepared
and characterized according to the procedure reported in Chapter 4. The essential
components for the preparation of the nanocomposites using functionalized Ag@SiO2
core-shell particles are listed in Tab. 18.
Tab. 18: Composition of the nanocomposites using functionalized Ag@SiO2@Si(CH3)3 core-shell particles as high permittivity filler. The particles used for the composites were: S1 (C-series), S2 (D-series), S3 (E-series) and S4 (F-series).
No. Ag content (vol%)
m(PDMS)/ga V(CL)/ Lb V(cat)/ Lc
C1 27 0.15 16 4
C2 23 0.15 16 4
C3 7.2 0.15 16 4
C4 3.1 0.15 16 4
D1d 19 0.15 16 4
D2 11 0.15 16 4
D3 10 0.15 16 4
E1d 21 0.15 16 4
E2 15 0.15 16 4
Fd 15 0.15 16 4
a Mw ~ 6λ2’00 g/mol; b (25-35 % mehylhydrosiloxane)-dimethylsiloxane-copolymer
c 50 wt% dibutyltindilaurate in toluene; d Cross-linking was inhibited.

8. Appendix
227
The dielectric properties of the nanocomposites are featured in Tab. 19, Fig. 94 and Fig.
95. It has to be mentioned that the nanocomposites were measured in the absence of
sputtered Au electrodes, which therefore may have led to relatively low permittivity values
due to the presence of air voids which affect the measurements. However, the results of the
measurements can still give information on the potential effects of the Ag core dimensions
on the dielectric properties of the resulting nanocomposites. The rise in the permittivity
with increasing filler content is observed for all fillers used in this work. However, the size
of the AgNPs has a profound effect on the feasible composite permittivity (Fig. 94). It
becomes evident that the decrease in the size of the AgNPs leads to larger permittivities
compared to the nanocomposites using filler with large AgNPs at the same corresponding
Ag content. A similar observation has been reported for BaTiO3/PVDF composites where
the permittivity decreased with increasing particle diameter. A plausible explanation for
this observation could be the facilitated dipole orientation for smaller BaTiO3 as well as the
great deal of phase interphases between the matrix and the small BaTiO3 particles i.e. a
larger interfacial volume to which the amount of polarization is proportional to.7 This
eventually leads to a large contribution in the resulting permittivity from the interfacial
polarization, and thus to higher composite permittivities. However, this effect is more
pronounced at low frequencies (0-100 Hz) and the size effect fades away with increasing
frequency.8 Another report states that the surface to volume ratio of the particles increases
with decreasing particle size at unaltered volume fraction of particles in the composite
system. This leads to higher multipole interactions between the neighboring particles and
causes polarization enhancement.9
The drawback of using small AgNPs (< 50 nm) is the inhibition of the cross-linking
reaction at Ag contents ≥ 15 vol%. It is possible that the mobility of the polymer chains or
the cross-linker is reduced by the presence of large amounts of core-shell particles, and this
inhibition of the cross-linking reaction is more pronounced for smaller particles due to
their ability of optimizing the occupation of a given volume which eventually serves as an
obstacle towards the cross-linking in the nanocomposite. For a given vol% of Ag, there are
quantitatively more particles in the nanocomposite when using smaller particles compared

8. Appendix
228
to the scenario where larger particles are used. The heating of these nanocomposites in an
oven was an alternative method to obtain cross-linking. However, this treatment did not
lead to the formation of cross-linked elastomers. The addition of further cross-linker or
catalyst could perhaps lead to a cross-linking of the films, but this step is associated with
an increase in the cross-linker density or a subsequent decrease in the flexibility of the
materials as well as the increase in the tin content, respectively. The effect of the latter has
yet been investigated. The mentioned changes would render it difficult to compare the
mechanical properties of the elastomers with each other. Therefore it was essential to
remain consistent with the procedure of preparing the nanocomposites. In direct contrast,
the inhibited cross-linking at high filler content does not occur in the nanocomposites using
AgNPs with a core size of 76 nm, and even the nanocomposites with Ag contents
exceeding 20 vol% still exhibit elastomeric properties, although the mechanical properties
deteriorate as a result of the increase in the Young’s modulus Y (Tab. 19). Presently, the Y
values of the nanocomposites depicted in this Chapter are already 2-10 times higher than
the Y of the pure PDMS elastomer prepared with the same reaction conditions (Chapter 4,
sample B0), and the potential application of such nanocomposites as membrane materials
for DEAs requires low values for Y in order to achieve high actuated strains in thickness
direction. The values for tan as well as the composite conductivities remained low for all
nanocomposites. Surprisingly, the former decreases with increasing filler. However, tan
is expected to increase with increasing filler content. There is no apparent size dependency
of tan on the particle size as shown in Fig. 95, which is also supported by literature
results.10,11
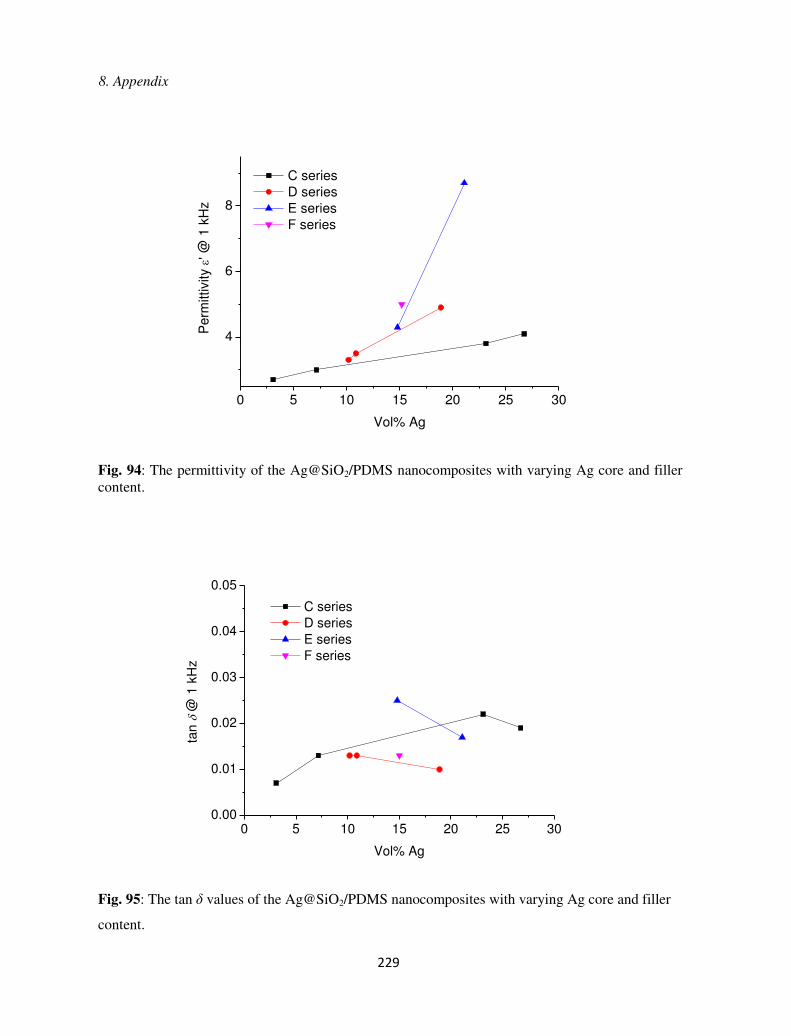
8. Appendix
229
0 5 10 15 20 25 30
4
6
8P
erm
ittiv
ity
' @ 1
kH
z
Vol% Ag
C series D series E series F series
Fig. 94: The permittivity of the Ag@SiO2/PDMS nanocomposites with varying Ag core and filler content.
0 5 10 15 20 25 300.00
0.01
0.02
0.03
0.04
0.05
tan
@
1 k
Hz
Vol% Ag
C series D series E series F series
Fig. 95: The tan values of the Ag@SiO2/PDMS nanocomposites with varying Ag core and filler
content.
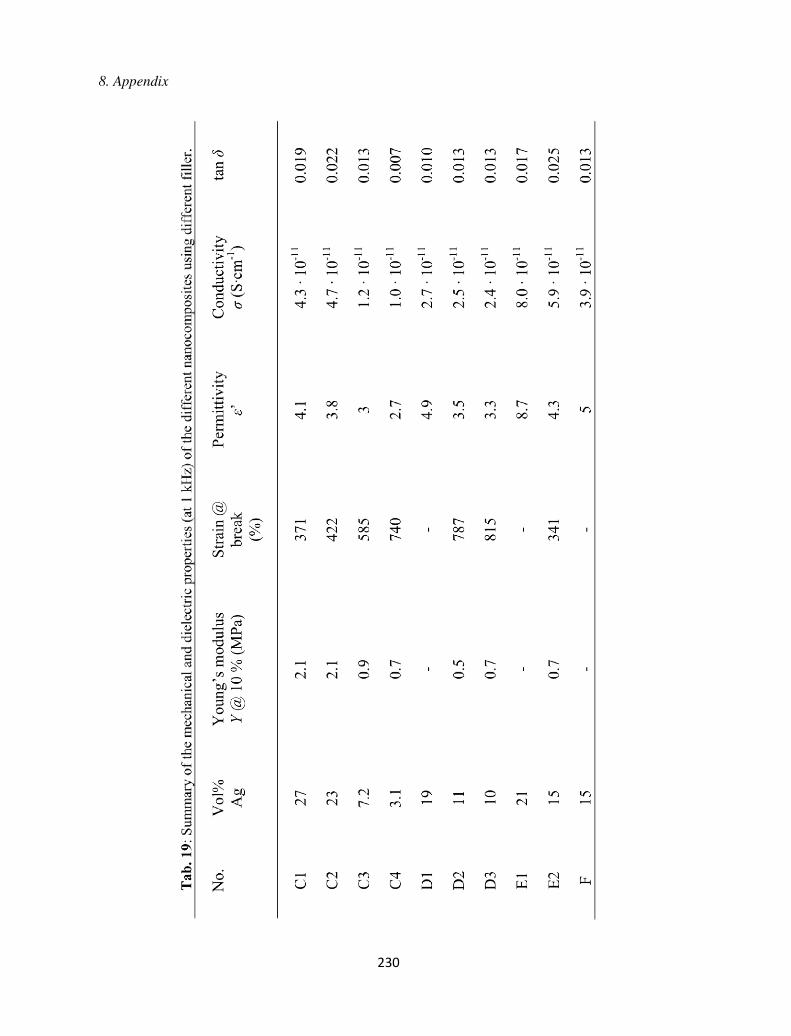
8. Appendix
230
8. Appendix
231
In conclusion, the permittivity shows a degree of dependency on the size of the Ag core,
and the rise in the permittivity is more pronounced with decreasing core diameter.
However, the preparation of flexible nanocomposites is limited to Ag contents ≤ 15 vol%
(core diameter < 50 nm) as the film formation is inhibited by the introduction of large
amounts of particles. Particles with Ag core > 50 nm enable the film formation even at
large Ag contents, but the increase in the permittivity is relatively low.
A3. References
(1) Barnickel, P., Wokaun, A., Sager, W., Eicke, H.-F. Size Tailoring of Silver Colloids by Reduction in W / O Microemulsions. J. Colloid Interface Sci. 1992, 148, 80–90.
(2) Capek, I. Preparation of Metal Nanoparticles in Water-in-Oil (w/o) Microemulsions. Adv. Colloid Interface Sci. 2004, 110, 49–74.
(3) Solanki, J. N.; Murthy, Z. V. P. Controlled Size Silver Nanoparticles Synthesis with Water-in-Oil Microemulsion Method: A Topical Review. Ind. Eng. Chem. Res. 2011, 50, 12311–12323.
(4) Quinsaat, J. E. Q.; Nüesch, F. A.; Hofmann, H.; Opris, D. M. Dielectric Properties of Silver Nanoparticles Coated with Silica Shells of Different Thicknesses. RSC Adv. 2013, 3, 6964–6971.
(5) Lance Kelly, K.; Coronado, E.; Zhao, L. L.; Schatz, G. C. The Optical Properties of Metal Nanoparticles: The Influence of Size, Shape, and Dielectric Environment. J. Phys. Chem. B 1992, 107, 7178–7186.
(6) Bastakoti, B. P.; Guragain, S.; Yusa, S.; Nakashima, K. Novel Synthesis Route for Ag@SiO2 Core–shell Nanoparticles via Micelle Template of Double Hydrophilic Block Copolymer. RSC Adv. 2012, 2, 5938–5940.
(7) Kochetov, R.; Andritsch, T.; Morshuis, P. H. F.; Smit, J. J. Effect of Filler Size on Complex Permittivity and Thermal Conductivity of Epoxy-Based Composites Filled with BN Particles. Annu. Rep. - Conf. Electr. Insul. Dielectr. Phenomena, CEIDP 2010, 3–6.

8. Appendix
232
(8) Dang, Z.-M.; Xu, H.-P.; Wang, H.-Y. Significantly Enhanced Low-Frequency Dielectric Permittivity in the BaTiO3/poly(vinylidene Fluoride) Nanocomposite. Appl. Phys. Lett. 2007, 90, 012901.
(9) Xu, L.; Liu, C.; Cao, Z.; Li, X. Particle Size Influence on Effective Permittivity of Particle-Gas Mixture with Particle Clusters. Particuology 2013, 11, 216–224.
(10) Qi, L.; Lee, B. I.; Chen, S.; Samuels, W. D.; Exarhos, G. J. High-Dielectric-Constant Silver-Epoxy Composites as Embedded Dielectrics. Adv. Mater. 2005, 17, 1777–1781.
(11) Lu, J.; Moon, K.-S.; Xu, J.; Wong, C. P. Synthesis and Dielectric Properties of Novel High-K Polymer Composites Containing in-Situ Formed Silver Nanoparticles for Embedded Capacitor Applications. J. Mater. Chem. 2006, 16, 1543–1548.

9. Curriculum Vitae
233
9. Curriculum Vitae
Personal Information
Name: Quinsaat
First Name(s): Jose Enrico Quijano
Date of Birth: 10th December 1986
Nationality: Filipino
Religion: Christian (Roman Catholic)
Occupation: Chemist/Materials Scientist
Languages: Filipino (fluent), German (fluent), English (fluent), French (basic knowledge)
Current Adress: Georg-Kempf-Strasse 27, 8046 Zürich, Switzerland
Permanent Address: Lot 29, Block 4, Yokohama St. Legacy Homes, BF Las Pinas,
Metro Manila, Philippines
Telephone No.: +41(0)765717056 (Switzerland) and +63(0)9989934935 (PH)
Email: [email protected] (work); [email protected] (private)

9. Curriculum Vitae
234
Academic/Professional Career
1991-2002: Attendance of the German School in Lagos, Nigeria.
2002-2005: Attendance of the boarding school “Schule Schloss Salem” in Salem,
Germany. Graduated from High School (“Abitur”) in 2005 (Average grade: 1.5).
2005-2009: Bachelor Studies in Chemistry at ETH Zurich, Switzerland (Swiss
Federal Institute of Technology).
2009-2011: Master Studies in Chemistry at ETH Zurich, Switzerland (Swiss Federal
Institute of Technology).
2011-2015: PhD Studies as a Research Assistant at the Functional Polymers Group
at Empa (Swiss Federal Laboratories for Material Science and Technology) in
Dübendorf, Switzerland and as member of the Powder Technology Laboratory
(LTP) in the Department of Materials Science and Technology (EDMX) at the
Swiss Federal Institute of Technology (EPFL) in Lausanne, Switzerland. Thesis
Title: “Synthesis and Functionalization of Silver Nanoparticles for the Preparation
of High Permittivity Nanocomposites”. Conclusion in August 2015. Thesis is co-
supervised by Prof. Dr. H. Hofmann (EPFL) and Dr. D.M. Opris (Empa).

9. Curriculum Vitae
235
Master Studies
Specialization in the field of Organic Chemistry
Core Subjects: Advanced Physical Chemistry: Statistical Thermodynamics; Advanced
Methods and Strategies in Organic Synthesis; Functional Inorganics.
Elective Courses: Organic Synthesis: Methods and Strategies; Reactive Intermediates
in Organic Chemistry; Inorganic and Organometallic Polymers; Introduction to
Macromolecular Chemistry; Advanced Polymer Chemistry.
Laboratory/Research Experiences
Research Project under the supervision of Prof. Dr. Ryan Gilmour at ETH Zurich,
spring semester 2009 (“Synthesis of Organofluorine Catalysts based on L-Proline
and Cinchona Alkaloids).
Research Project under the supervision of Prof. Dr. Nicolai Cramer at ETH
Zurich, spring semester 2010 (“Synthesis of 1,3-Diketones as Precursors for Grob-
type Fragmentation Reactions”).
Master Thesis under the supervision of Prof. Dr. François Diederich at ETH Zurich,
spring semester 2011 (“Novel Synthesis of Inhibitors of Parasitic Cysteine
Proteases”).
PhD Thesis on “Synthesis and Functionalization of Silver Nanoparticles for the
Preparation of High Permittivity Nanocomposites” (Conclusion by August 2015).
Teaching Experience
Teaching Assistant of the lecture “Organic Chemistry I” (held by Prof. Dr. F.
Diederich at ETH Zurich during autumn semester 2008). Workload: 4 hours/week.

9. Curriculum Vitae
236
Teaching Assistant for the lecture “Organic Chemistry for Pharmacists” (held by
Prof. Dr. B. Jaun at ETH Zurich during autumn semester 2010). Workload: 8
hours/week.
Characterization/Analytical Skills
Trained in characterization of the properties of organic compounds (LC-MS, NMR,
IR), nanoparticles and composite materials (UV-vis spectroscopy, Dynamic Light
Scattering (DLS), Transmission- and Scanning Electron Microscopy (TEM and
SEM), Impedance spectroscopy and mechanical tensile testing).
Computer/IT Skills
High knowledge in the use of Microsoft Office (Microsoft Word, Microsoft Excel,
Microsoft Powerpoint), OriginLab, ChemDraw and Digital Micrograph. Basic
knowledge in the use of MNova NMR and TopSpin NMR.
Publications
Dascalu, M.; Quinsaat, J.E.Q.; Ko, Y.S.; Dünki, S.J.; Nüesch, F.A.; Opris, D.M.
Silicone Elastomers Containing Trifluoropropyl Groups: From Synthesis to
Application. Manuscript in preparation (Submission to RSC Adv.)
Testino, A.; Pilger, F.; Lucchini, M.A.; Quinsaat, J.E.Q.; Stähli, C.; Bowen, P.
Continuous Polyol Synthesis of Metal and Metal Oxide Nanoparticles Using the
Segmented Flow Tubular Reactor, Molecules 2015, 20(6), 10566.
Quinsaat, J.E.Q.; Alexandru, M.; Nüesch, F.A.; Hofmann H.; Borgschulte, A.;
Opris, D. M. Highly Stretchable Dielectric Elastomer Composites Containing High

9. Curriculum Vitae
237
Volume Fraction of Silver Nanoparticles, J. Mater. Chem. A 2015, 3, 14675.
Opris, D.M.; Quinsaat, J.E.Q.; Dünki, S.; Ko, Y.S.; Alexandru, M.; Racles, C.;
Nüesch, F. A. Dielectric Materials, Design and Realization. Proc. SPIE
Electroact. Polym. Actuators Devices (EAPAD) 2015, 9430, 9430-9 (Invited Paper).
Quinsaat, J.E.Q.; Testino, A.; Pin, S.; Huthwelker, T.; Nüesch, F. A.; Bowen, P.;
Hofmann, H.; Ludwig, C.; Opris, D. M. Continuous Production of Tailored Silver
Nanoparticles by Polyol Synthesis and Reaction Yield Measured by X-Ray
Absorption Spectroscopy: Towards a Growth Mechanism. J. Phys. Chem. C 2014,
118, 11093.
Quinsaat, J.E.Q.; Nüesch, F.A.; Hofmann, H.; Opris, D.M. Dielectric Properties of
Silver Nanoparticles Coated with Silica Shells of Different Thicknesses. RSC Adv.
2013, 3, 6964.
Ehmke, V.; Quinsaat, J.E.Q.; Rivera-Fuentes, P.; Heindl, C.; Freymond, C.;
Rottmann, M.; Brun, R.; Schirmeister, T.; Diederich, F. Tuning and Predicting
Biological Affinity: Aryl Nitriles as Cysteine Protease Inhibitors. Org. Biomol.
Chem. 2012, 10, 5764.

9. Curriculum Vitae
238
Participations in Conferences/Workshops
2011
Swiss Chemical Society (SCS) Meeting 2012 in Lausanne (EPFL), Switzerland, on
the 9th of September, 2011.
2012
Swiss Chemical Society (SCS) Meeting 2012 in Zurich (ETH), Switzerland, on
the 13th of September, 2013.
European Scientific Network for Artificial Muscles (ESNAM) Workshop in
Neuchâtel, Switzerland, on the 16th-18th of October, 2012.
OMICS Group, International Conference and Expo on Material Science and
Engineering in Chicago, USA, on the 22nd-24th of October, 2012.
2013
Makromolekulares Kolloquium in Freiburg, Germany, on the 21st-23rd of February,
2013.
Swiss Nano Convention 2013 in Basle, Switzerland, on the 23rd-24th of May, 2013.
International Conference on Electromechanically Active Polymers (EAP),
transducers and artificial muscles, in Dübendorf, Switzerland, on the 25th-26th of
June, 2013.
Swiss Chemical Society Meeting 2013 in Lausanne (EPFL), Switzerland, on the 6th
September, 2013.
Empa PhD Student’s Symposium 2014 at Empa in Dübendorf on 23rd October, 2013.

9. Curriculum Vitae
239
6th EDMX Research Day in Lausanne (EPFL), Switzerland, on the 6th September,
2013.
Workshop on Nanocrystals in Optoelectronics in Zurich (ETH), Switzerland, on
the 11th of September, 2013.
2014
Polycoll 2014, Annual Meeting of the Division of Polymers, Colloids and
Interfaces, in Dübendorf, Switzerland, on the 20th June, 2014.
Swiss Chemical Society Meeting 2014 in Zurich (University of Zurich),
Switzerland, on the11th September, 2014.
PhD Student’s Symposium 2014 at Empa in St. Gallen on 21st October, 2014.
NANOCON 2014, 6th International Conference on Nanomaterials – Research and
Application in Brno, Czech Republic, on the 5th-7th of November, 2014.
Scientific Awards/Prizes
2nd Place Oral Presentation Award at the Empa PhD Symposium 2014 in St. Gallen,
Switzerland, on October 21, 2014.

240


![How to reduce the water footprint and improve food security in mountain communities [Hans Schreier]](https://img.pdfslide.us/doc/110x75/555564c3b4c9052b208b56b0/how-to-reduce-the-water-footprint-and-improve-food-security-in-mountain-communities-hans-schreier.jpg)
![EMF and subjective symptoms...Schreier SPM, 2006 4th EBEA Course. M. Röösli, subjective symptoms, 29/03/2008 5 Attributed causes Proportion [%] Schreier SPM, 2006 80% of the EHS](https://img.pdfslide.us/doc/110x75/5eb66971e6c4eb0d9a31212b/emf-and-subjective-schreier-spm-2006-4th-ebea-course-m-rsli-subjective.jpg)


![[Howard Schreier] PROC SQL by Example Using SQL w(BookFi.org)](https://img.pdfslide.us/doc/110x75/55cf992b550346d0339bfb2b/howard-schreier-proc-sql-by-example-using-sql-wbookfiorg.jpg)