Embed Size (px)
Citation preview
SYNTHESIS AND DISPERSION OF BARIUM STANNATE
NANOPOWDERS A THESIS SUBMITTED IN PARTIAL FULFILLMENT OF
THE REQUIREMENTS FOR THE DEGREE OF
BACHELOR OF TECHNOLOGY
By
SWAPNA SAMIR SHUKLA
UNDER THE GUIDANCE OF
DR. DEBASISH SARKAR
DEPARTMENT OF CERAMIC ENGINEERING
NATIONAL INSTITUTE OF TECHNOLOGY
ROURKELA
2007-2011
CERTIFICATE
NATIONAL INSTITUTE OF TECHNOLOGY
2011
This is to certify that the thesis entitled, “SYNTHESIS AND DISPERSION OF BARIUM
STANNATE NANOPOWDERS” submitted by Swapna Samir Shukla in partial fulfillment of the
requirements of the award of Bachelor of Technology Degree in Ceramic Engineering at the
National Institute of Technology, Rourkela is an authentic work carried out by him under my
supervision and guidance.
To the best of my knowledge, the matter embodied in the thesis has not been submitted to any
other university / institute for the award of any Degree or Diploma.
Date: Dr. DEBASISH SARKAR
Dept. of Ceramic Engineering
National Institute of Technology
Rourkela – 769008

ACKNOWLEDGEMENT
I am greatly obligated to Dr Debasish Sarkar for his ready and noble guidance throughout the
course of conducting my project and preparing the report. He conveyed me a plethora of
information about the synthesis and properties of nanomaterials. I am specially obliged to him
for his constant encouragement, efficient planning, constructive criticism and valuable guidance
during the entire course of my work.
I am highly indebted to Dr J. Bera, Dr S. Bhattacharya, Dr. S. Pratihar, Dr. S. Pal, Dr. R. Sarkar,
Dr. R. Mazumder, Dr. B.B. Nayak and Prof. A. Choudhary for giving me utmost guidance at all
times.
Special thanks to Dr. S. Pratihar for allowing me to do zeta potential measurements even on non-
working days.
I am grateful to Mr. Uday Kumar Sahu, Department of Metallurgy for doing DSC-TG of my
samples.
However, to Mr. Sanjay Kumar Swain, who took great pains in explaining me the concepts and
helping me with my experimental work, I owe to a great extent.
Submitting this report would not be possible without the help, support and suggestions from my
friends. I am very much thankful to them.
Finally, I thank my parents for their support and encouragement.
Date: SWAPNA SAMIR SHUKLA
ROLL NO: 107CR005
B.Tech, Ceramic Engineering
NIT ROURKELA
CONTENTS
PAGE NO ABSTRACT (i) List of figures (ii) List of tables (ii) CHAPTER 1 INTRODUCTION 1-6 1.1 Nanopowders 2 1.2 BaSnO3 – Structure 3 1.3 Properties 4 1.4 Application 5 1.5 Colloidal Stability 5-6 CHAPTER 2 LITERATURE REVIEW 7-10 2.1 Synthesis of BaSnO3 nanopowders 8-10 2.2 Dispersion of BaSnO3 nanopowders 10 CHAPTER 3 EXPERIMENTAL PROCEDURE 11-17 3.1 Synthesis of BaSnO3 nanopowders 12-14 3.2 Characterization of nanopowders 15-16 3.3 Dispersion of BaSnO3 nanopowders 16-17 CHAPTER 4 RESULTS AND DISCUSSION 18-24 4.1 Thermal Analysis of as-prepared BaSnO3 19 4.2 Phase analysis of the calcined powders 20 4.3 Specific surface area by BET 21 4.4 FTIR analysis of synthesized powders 21-22 4.5 Determination of IEP 23 4.6 Variation of zeta potential vs. weight
percentage of dispersant 24
CHAPTER 5 CONCLUSION 25-26
(i)
ABSTRACT
The present work deals with the synthesis and dispersion of Barium Stannate (BaSnO3)
nanopowders. BaSnO3 was prepared through a novel co-precipitation route using SnCl4.5H2O
and BaCl2.2H2O as the starting precursors and subsequent calcinations at 1100oC. X-Ray
diffraction pattern indicates the presence of single phase of BaSnO3 which was supported by
FTIR analysis. The lattice parameter was found to be 4.12 Å. The data obtained from BET
surface area indicates that the particle size is near about 250nm at pH 13. Isoelectric point (IEP)
of nanopowder suspension was determined prior to the addition of different dispersants. The
isoelectric point was found to be at pH 4.95 and the electrolyte weight percentage was optimized
for stable dispersions.
(ii)
List of figures
Sl. No Page No.
Fig 1 Perovskite structure of BaSnO3 3
Fig 2 Schematic representation of zeta potential 5
Fig 3 Flowchart for BaSnO3 synthesis 14
Fig 4 DSC-TG curve of as-synthesized BaSnO3 powders 19
Fig 5 XRD plot of calcined BaSnO3 powders 20
Fig 6 FTIR plot of synthesized BaSnO3 powders 21
Fig 7 Dependence of zeta potential of BaSnO3 powders on pH 23
Fig 8 Zeta potential vs. weight % of dispersants at pH 9 24
List of Tables
Sl. No Page No.
Table 1 Specific Surface Area and Particle Size of the powders synthesized at different pH
21

1 | P a g e
CHAPTER 1
INTRODUCTION
2 | P a g e
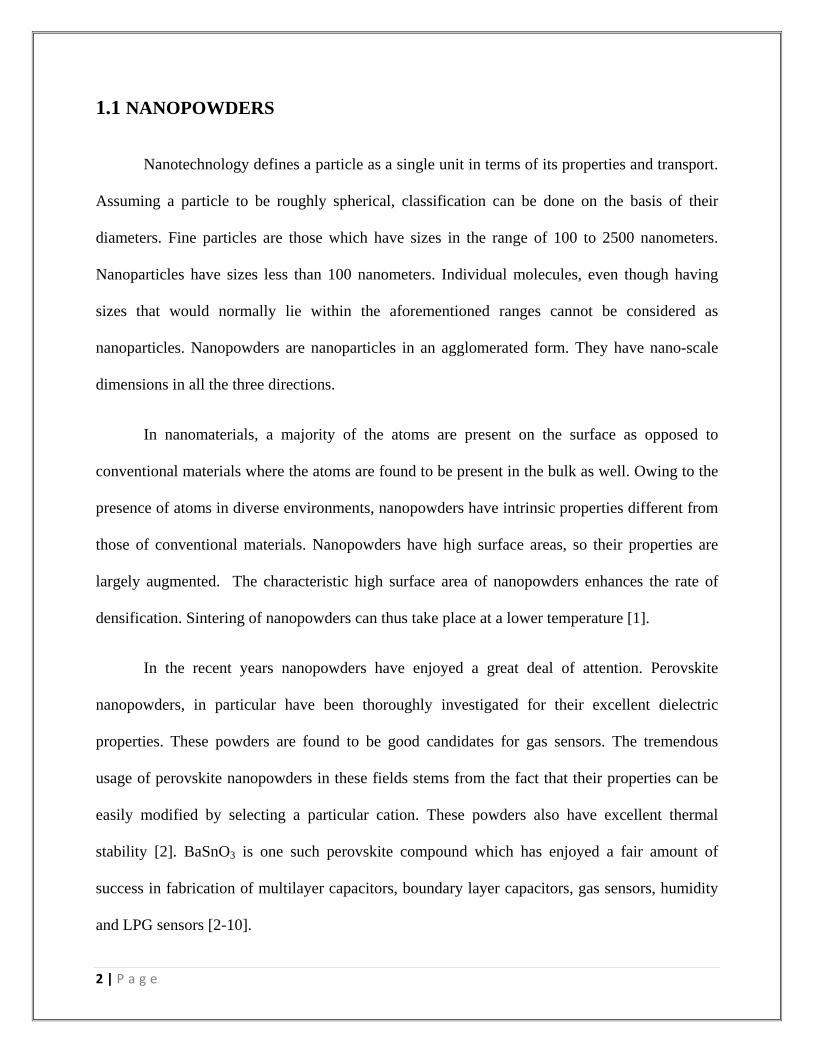
1.1 NANOPOWDERS
Nanotechnology defines a particle as a single unit in terms of its properties and transport.
Assuming a particle to be roughly spherical, classification can be done on the basis of their
diameters. Fine particles are those which have sizes in the range of 100 to 2500 nanometers.
Nanoparticles have sizes less than 100 nanometers. Individual molecules, even though having
sizes that would normally lie within the aforementioned ranges cannot be considered as
nanoparticles. Nanopowders are nanoparticles in an agglomerated form. They have nano-scale
dimensions in all the three directions.
In nanomaterials, a majority of the atoms are present on the surface as opposed to
conventional materials where the atoms are found to be present in the bulk as well. Owing to the
presence of atoms in diverse environments, nanopowders have intrinsic properties different from
those of conventional materials. Nanopowders have high surface areas, so their properties are
largely augmented. The characteristic high surface area of nanopowders enhances the rate of
densification. Sintering of nanopowders can thus take place at a lower temperature [1].
In the recent years nanopowders have enjoyed a great deal of attention. Perovskite
nanopowders, in particular have been thoroughly investigated for their excellent dielectric
properties. These powders are found to be good candidates for gas sensors. The tremendous
usage of perovskite nanopowders in these fields stems from the fact that their properties can be
easily modified by selecting a particular cation. These powders also have excellent thermal
stability [2]. BaSnO3 is one such perovskite compound which has enjoyed a fair amount of
success in fabrication of multilayer capacitors, boundary layer capacitors, gas sensors, humidity
and LPG sensors [2-10].

3 | P a g e
1.2 BaSnO3 – STRUCTURE
Barium stannate (BaSnO3) belongs to the perovskite group of compounds. These
compounds posses a similar structure as that of the mineral Perovskite(CaTiO3). Such
compounds have a structural formula which can be generalized as A2+B4+O3 where A is an
alkaline earth (group IIA) metal element or a transition metal element in +2 oxidation state and B
is a transition metal element.
Fig 1: perovskite structure of BaSnO3
The structure of BaSnO3 is shown in Fig 1. BaSnO3 has a cubic perovskite structure. Here
Ba2+ ions occupy the corners of the unit cell, Sn4+ is present at the body center and O2- ions are
present at the face centers. Thus the Ba2+ ion is coordinated with 12 O2- ions and Sn4+ with 6 O2-
ions. An O2- ion on the other hand has a co-ordination number of 4 with Ba2+ and 2 with Sn4+.
The O2- ion and Ba2+ ion form a dense cubic close packing with one-fourth of the octahedral
voids filled with Sn4+. Eight [SnO6] octahedrons are linked through corners to form a three
dimensional framework [3].
4 | P a g e
1.3 PROPERTIES
BaSnO3 has pale yellow color. Sintering temperature is presumed to be above 1600oC. A
sample sintered at 1600oC is still porous [3,13]. The melting point of BaSnO3 is reported to be
2060oC, however there are some disagreements as BaSnO3 is found to decompose into BaO and
SnO2 at 1950oC [3,14]. BaSnO3 is paraelectrical and non ferroelectric [3].
1.4 APPLICATION
Solid state gas sensors: There are two types of gas sensors – solid state sensors and
catalytic sensors. Catalytic sensors detect gases by burning them i.e. the gases react with the
material of the sensor forming certain compounds. The formation of these compounds confirms
the presence of a particular gas. Solid state sensors, on the other hand allow the gases to get
adsorbed onto their surfaces. Thus solid state sensors have better longevity as no sensor material
is consumed in the process. For better adsorption, a material with a high surface area is needed
and this calls for use of perovskite Nanopowders. BaSnO3 can be used to detect gases such as H2,
NO, CO, CH4 etc [2-10].
BaSnO3 can be used to fabricate Multilayer capacitors and boundary layer capacitors [2, 3, 4,
7, 8, 9, 10].
5 | P a g e
1.5 COLLOIDAL STABILITY
When particles are dispersed in a medium, they have a tendency to show Brownian
motion. Due to this Brownian motion, they collide with one another. Thus, colloidal stability is
influenced by particle interactions during collision. These interactions can be of two types-
attractive (van der waals force) and repulsive. A colloidal system can only be stabilized if the
repulsive forces outweigh the attractive forces, so that they do not agglomerate and settle down.
A colloidal system can be stabilized by: - Creating an electrical double layer (electrostatic
stabilization), Steric stabilization and Electrosteric stabilization.
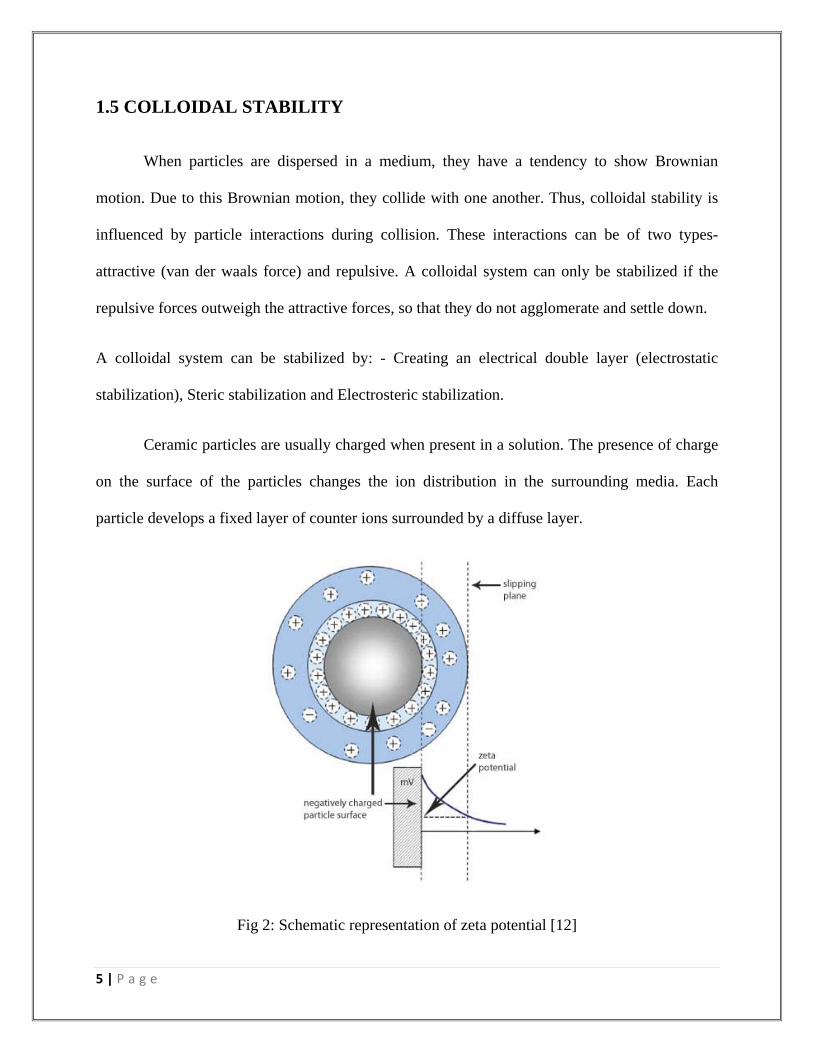
Ceramic particles are usually charged when present in a solution. The presence of charge
on the surface of the particles changes the ion distribution in the surrounding media. Each
particle develops a fixed layer of counter ions surrounded by a diffuse layer.
Fig 2: Schematic representation of zeta potential [12]

6 | P a g e
In between these two layers, there exists a hydrodynamic slipping plane. The ceramic
particle behaves as a single unit till this place. The potential at this slipping plane is known as the
zeta potential. Zeta potential has a very important role to play in deciding the stability of the
dispersions. Dispersion is said to be stable if the absolute value of zeta potential is greater than
30 mV [11].
Zeta potential is dependent on the pH of a suspension [11]. This dependency can be explained in
the following manner:-
Consider a particle present in a suspension having negative zeta potential
1) The particle develops a tendency for acquiring more negative charge if more alkali gets
added to the suspension.
2) The charge on the particle gets neutralized on addition of acid.
3) The particle develops positive charge on further addition of acid.
4) If a graph is plotted between zeta potential and pH then, zeta potential will have a
positive value at low pH and a negative value at high pH.
5) The pH at which zeta potential is zero is known as IEP (Isoelectric point). The dispersion
is least stable at this pH.

7 | P a g e
CHAPTER 2
LITERATURE REVIEW
8 | P a g e
2.1 SYNTHESIS OF BaSnO3 NANOPOWDERS
J.Cerda et al. successfully synthesized BaSnO3 using a sol-gel route. They started with
stoichiometric amounts of K2SnO3.3H2O and Ba(OH)2. The solution was stirred vigorously for
30 minutes and the pH was maintained at 11. The sol thus obtained was dried at a temperature of
80oC to get a xerogel. The xerogel was then calcined at temperatures of 1000oC and 1400oC for 8
hours. Macro Raman spectrum of the powder Calcined at 1000oC showed the presence of a
BaCO3 peak. However, this peak disappeared when the powder was calcined at 1400oC.
Nanoparticles with a mean size of 200 nm were obtained through this route. Electrical
characterization of BaSnO3 thick films was also done as a function of temperature and gas
concentration. In presence of O2, CO and NO2, resistance variations were measured. O2 was
found to show a maximum sensitivity at a temperature of 700oC. A maximum sensitivity at a
temperature of 600oC was reported for CO and NO2 [2].
Young Jung Song et al. successfully synthesized fine BaSnO3 powders by oxalate co-
precipitation route by using stoichiometric amounts of BaCl2 and SnCl4. Oxalic acid in non-
stoichiometric amounts was used as the precipitating agent. The precipitates were filtered,
washed by ethanol and dried at 110oC for 24 hours. Calcination was done at a temperature of
1050oC for 3 hours. The calcined powders had a cubic crystal structure with a lattice parameter
of 4.119 Å. Grain size of the powder was 200 nm [4].
A.S. Deepa et al. investigated the synthesis of nanocrystalline BaSnO3 through an auto
ignited combustion technique. The synthesized BaSnO3 had a cubic crystal structure with a
lattice parameter of 4.109 Å and a crystallite size of 25 nm. They proposed that BaSnO3
undergoes transition to an ideal cubic structure from a distorted one. They established the fact
9 | P a g e
that BaSnO3 is a photo luminescent material. They also determined the band gap to be 2.887 ev
with the aid of UV-vis spectrum [5].
J. Cuervo Farfan et al. synthesized BaSnO3 through solid state synthesis. They used
BaCO3 and SnO2 in stoichiometric amounts. The mixture was made into pellets followed by
calcination at 1090oC for 12 hours. The Calcined powder however had Ba2SnO4 as the major
phase. It is possible to get BaSnO3 only after sintering. Sintering was carried out in two steps-
heat treatment at 1200oC for 20 hours followed by heating at 1400oC for 24 hours [6]. Azad et
al. Proposed that if Ba(NO3)2 is used instead of BaCO3, then the calcination temperature can be
lowered. BaSnO3 could thus be formed at a temperature of 1000oC [15].
Wensheng Lu et al. investigated the synthesis of BaSnO3 nanopowders under
lyothermal conditions using tin oxide hydrate and Ba(OH)2 as the precursors. The tin hydroxide
gel was in turn precipitated from an aqueous solution of SnCl4 and NH4OH. They made a
detailed analysis of the effect of various solvents namely methanol, isopropanol, ethanol and
acetone on the development of crystallinity, BET surface area, density and average particle size
of the BaSnO3 powders. Isopropanol showed better results. They established that agglomeration
can be avoided by the addition of Genapol-X080 along with isopropanol. The surface area
increased 10-fold on addition of the former. The as-synthesized powder contains BaSn(OH)6
which transformed to BaSnO3 at a temperature of 330oC through an intermediate amorphous
phase. FTIR studies indicate the presence of an intense peak of Sn-O in the calcined powders [8].
10 | P a g e
Wensheng Lu et al investigated the hydrothermal synthesis of nanocrystalline BaSnO3.
Treatment under hydrothermal conditions (250oC for 6 hours) was done for a mixture of tin
oxide hydrate sol and Ba(OH)2. They also studied the pH dependence on the properties of tin
oxide hydrate sol. They found out that peptization took lesser time when the pH was maintained
between 8.3 and 9.8. The particle diameter distribution was also found to depend on pH. The
distribution changed from (0.5-1.5) µm at pH (6.8-7.2) to less than 20 nm at pH (8.3-9.8).
Calcination was done at 330oC. The Nanopowders synthesized by this method had very high
specific surface area [9].
Wensheng Lu et al investigated the synthesis of BaSnO3 through metal alkoxide route.
BaSnO3 was prepared by crystallization of an amorphous precursor (BaSn(OR)6) . They
proposed that BaSnO3 nucleates at 350oC just after the decomposition of residual organic matter.
Calcination was completed at 760oC and the powders obtained had a very small average grain
size [10].
2.2 DISPERSION OF BaSnO3 NANOPOWDERS
Wensheng Lu studied the dispersion of BaSnO3 nanopowders. He used four different
surfactants namely TMAH, PEI-SC (poly ethylimine with short chains), PEI-LC (poly ethyl
imine with long chains) and TEA (tri-ethyl amine) for stabilizing the dispersions. He obtained
best results with TEA and therefore proceeded with the addition of 2.5 wt% TEA for stabilizing
the suspension at pH 10 [3].
11 | P a g e
CHAPTER 3
EXPERIMENTAL
PROCEDURE
12 | P a g e
3.1 Synthesis of Barium Stannate Nanopowders
3.1.1 Chemicals used:
• Stannic chloride pentahydrate ( SnCl4.5H2O )
• Barium chloride dihydrate ( BaCl2.2H2O )
• Sodium hydroxide pellets ( NaOH)
3.1.2 Reaction involved:
BaCl2.2H2O + SnCl4.5H2O + 6 NaOH BaSnO3 + 6 NaCl + 10 H2O
3.1.3 Procedure:
Stoichiometric amounts of BaCl2.2H2O and SnCl4.5H2O were taken. NaOH was used as a
buffer, so excess of NaOH was taken.
Aqueous solutions of the above mentioned reagents were prepared. BaCl2.2H2O solution
was taken in a conical flask. Simultaneous heating and stirring was carried out till the
temperature reached 75oC. . This was followed by drop wise addition of NaOH. Addition of
NaOH was continued till pH of the solution increased up to 11. Once the required pH was
established, SnCl4.5H2O solution was added slowly. White precipitates were formed
immediately after addition of SnCl4.5H2O. Simultaneous heating and stirring was done till the
temperature reached 95oC. The solution was allowed to remain at 95oC for 1 hour. The solution
was aged overnight for precipitation.

13 | P a g e
Decantation
The precipitate was washed repeatedly with distilled water till all the chlorine gets
removed. The absence of chlorine was confirmed through AgNO3 test.
NaCl + AgNO3 AgCl + NaNO3
When milky white precipitates of AgNO3 stopped forming, decantation was discontinued.
Filtration:
The solution was filtered using Whatman(41) series filter paper.
Drying:
The filtrate was taken in a petridish and dried in an oven at 100oC for 24 hours.
Calcination:
The dried sample was calcined at 1100oC with a soaking period of 2 hours with a heating
rate of 3oC/min.
Another batch was made by taking the same amounts of SnCl4.5H2O and BaCl2.2H2O but this
time NaOH addition was continued till the pH was 13. Rest of the steps remained the same.
14 | P a g e
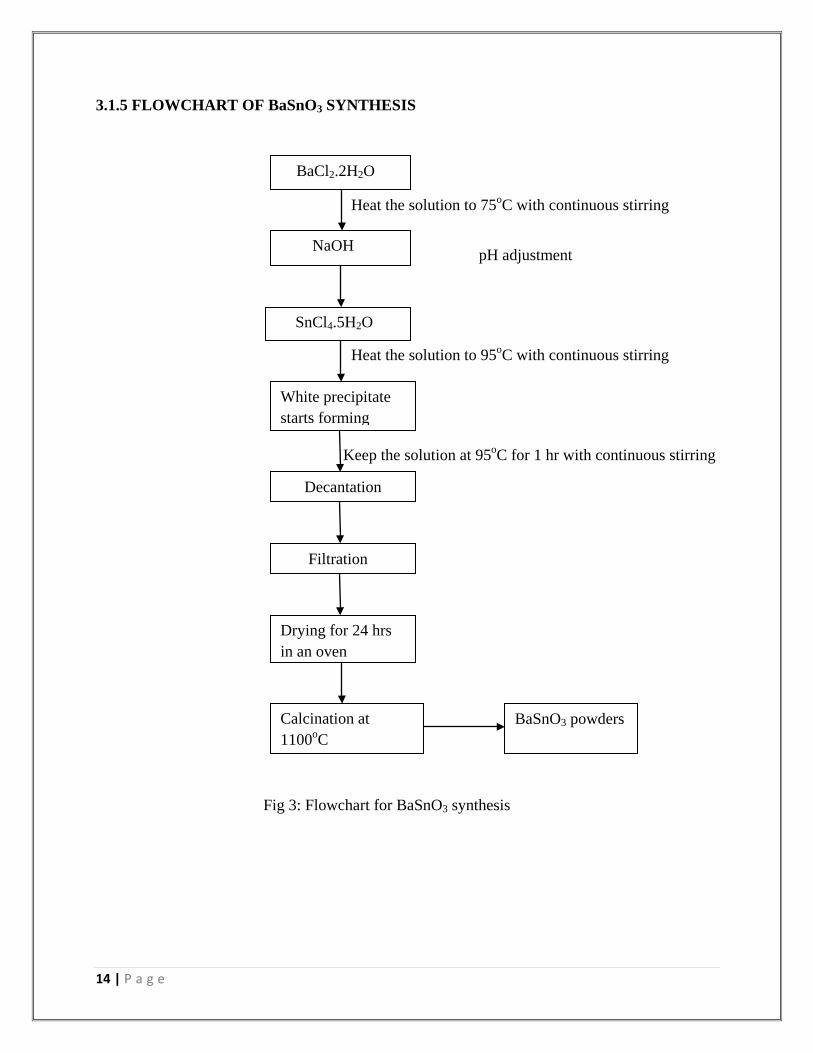
3.1.5 FLOWCHART OF BaSnO3 SYNTHESIS
Heat the solution to 75oC with continuous stirring
pH adjustment
Heat the solution to 95oC with continuous stirring
Keep the solution at 95oC for 1 hr with continuous stirring
Fig 3: Flowchart for BaSnO3 synthesis
BaCl2.2H2O
NaOH
SnCl4.5H2O
White precipitate starts forming
Decantation
Filtration
Drying for 24 hrs in an oven
Calcination at 1100oC
BaSnO3 powders
15 | P a g e
3.2 CHARACTERIZATION
3.2.1 DSC/TG
DSC/TG was done by heating the sample at a rate of 10oC/min (Mettler-Toledo 821)
3.2.2 X-ray diffraction
Identification of the phases, determination of lattice parameter and crystallite size of
BaSnO3 was done by Philips X-Ray Diffractometer( PW 1730,Netherlands). The radiation used
was nickel filtered Cu Kα radiation with a wavelength of 1.5406 Å. The voltage was maintained
at 40 kV and the current at 30 mA. The scan range was (15-80)o with a scanning rate of
0.04o/sec.
From the most intense peak of XRD plot, lattice parameter and crystallite size of BaSnO3
powders was determined
Lattice parameter: a=d√ (h2+k2+l2)
‘a’- lattice parameter ; d- d spacing;
‘h,k,l’- indices of the most intense plane
Crystallite size = 0.9 λ/ β cos θ
‘λ’- Cu Kα radiation(1.5406 Å) ;
‘β’- FWHM of the most intense peak; θ – Bragg’s angle.
3.2.3 Specific surface area by BET method
The specific surface area was measured by BET surface area analyzer (Quantachrome,
USA). The amount of nitrogen adsorbed at normal atmospheric pressure and at a temperature
same as that of the boiling point of liquid nitrogen vs. the partial pressure of nitrogen gives the
specific surface area.
16 | P a g e
Average particle size can be calculated using the formula: 6/ ρS
ρ - Density of pure BaSnO3 sample (7.24 gm/cm3)
S is the measured specific surface area. (m2/gm)
3.2.4 FTIR analysis
Determination of the structure of molecules was made through FTIR analysis. The
Calcined powders and KBr were mixed in the ratio of 1:30 by mass. KBr was chosen as it is
transparent to IR radiation. The mixture was then pressed into pellets. The machine used was the
FTIR instrument of PERKIN-ELMER. The range was set in the mid IR region i.e. 4000 cm-1 to
400 cm-1.
3.3 DISPERSION OF BaSnO3 NANOPOWDERS
3.3.1 Determination of IEP
150 ml of distilled water was taken in a beaker and 0.05 grams of BaSnO3 was added to
it. The solution was then ultrasonicated for 10 minutes to disperse the powders. After sonication,
the dispersion was maintained at pH 2 by drop wise addition of 1:5 HNO3. Similarly dispersions
at pH 4 and 6 were prepared. Dispersions at pH 8 and 10 were made by drop wise addition of 1:1
NH4OH. Zeta potential of all these dispersions was then measured.
3.3.2 Determination of optimum electrolyte concentration for stabilization
To determine the dispersing agent and its concentration, two electrolytes were used.
These are PEG-400 and DARVAN C.
17 | P a g e
3.3.2.1 Preparation of PEG-400 and DARVAN C solutions
0.14 grams of PEG-400 was dissolved in 500 ml of distilled water and the solution was
stirred for 15 minutes. Similarly 0.1 grams of DARVAN C was dissolved in 500 ml of distilled
water followed by stirring for 15 minutes.
3.3.2.2 Dispersion of BaSnO3 powders
150 ml of distilled water was taken in a beaker and 0.05 grams of BaSnO3 was added to
it. 0.1 weight % of either PEG-400 or DARVAN C was added to the solution. The solution was
then dispersed using the ultrasonic vibrato meter for 10 minutes. After sonication, the dispersion
was maintained at pH 9 by drop wise addition of 1:1 NH4OH
The weight percentage of both PEG-400 and DARVAN C was varied from 0.1 to 1.
Dispersions were made at these weight percentages. Zeta potential of all these dispersions was
then measured.
3.3.3 Measurement of zeta potential
The zeta potential of the dispersions was measured by Zetasizer Nano Series, Nano ZS of
MALVERN.

18 | P a g e
CHAPTER 4
RESULTS AND DISCUSSIONS
19 | P a g e
This section deals with the thermal analysis, phase analysis, FTIR analysis and BET
surface area of the powder. The IEP and variation of zeta potential with weight percentage of
dispersants has also been studied.
4.1 THERMAL ANALYSIS OF THE AS-SYNTHESIZED POWDER
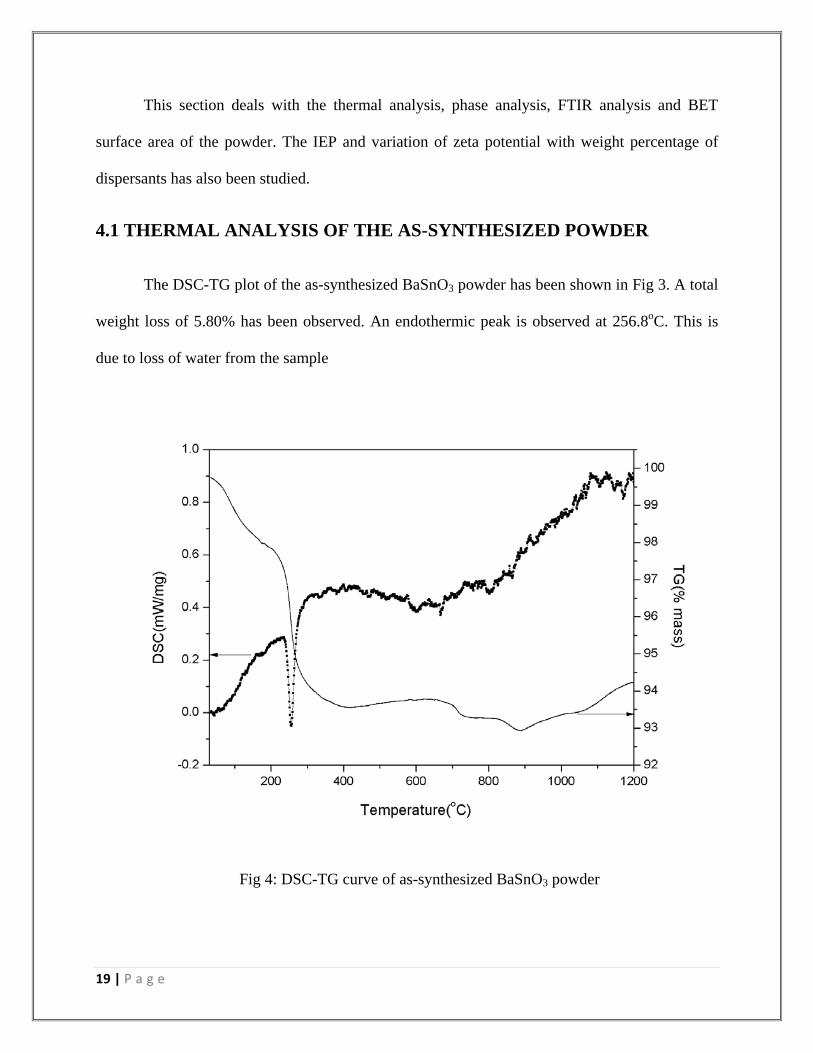
The DSC-TG plot of the as-synthesized BaSnO3 powder has been shown in Fig 3. A total
weight loss of 5.80% has been observed. An endothermic peak is observed at 256.8oC. This is
due to loss of water from the sample
Fig 4: DSC-TG curve of as-synthesized BaSnO3 powder
20 | P a g e
. 4.2 PHASE ANALYSIS OF THE CALCINED POWDERS
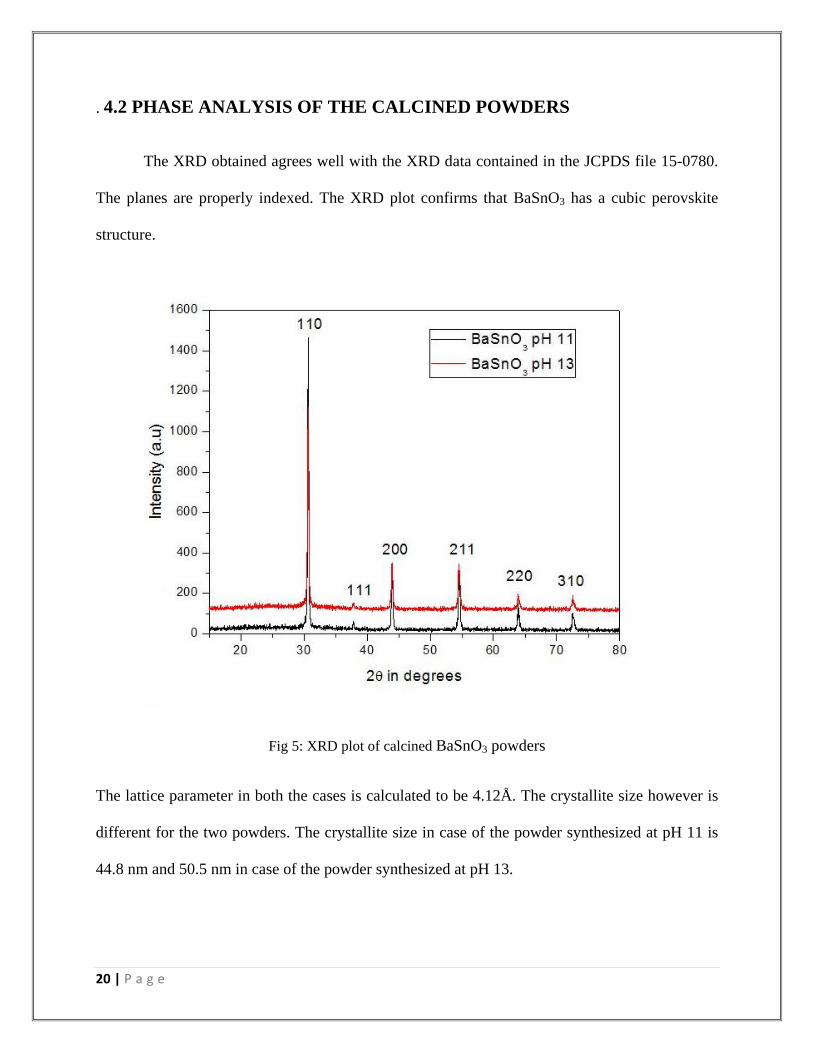
The XRD obtained agrees well with the XRD data contained in the JCPDS file 15-0780.
The planes are properly indexed. The XRD plot confirms that BaSnO3 has a cubic perovskite
structure.
Fig 5: XRD plot of calcined BaSnO3 powders
The lattice parameter in both the cases is calculated to be 4.12Å. The crystallite size however is
different for the two powders. The crystallite size in case of the powder synthesized at pH 11 is
44.8 nm and 50.5 nm in case of the powder synthesized at pH 13.

21 | P a g e
4.3 SPECIFIC SURFACE AREA BY BET
Table 1: Specific surface area and particle size of the powders synthesized at different pH
POWDER TYPE SPECIFIC SURFACE
AREA
PARTICLE SIZE
Synthesized at pH 11 1.556 m2/gm 532 nm
Synthesized at pH 13 3.254 m2/gm 254 nm
4.4 FTIR ANALYSIS OF THE SYNTHESIZED POWDERS
FTIR analysis of the calcined sample indicates the structure of the molecules. The bonds
corresponding to the labeled peaks have been identified and explained.
Fig 6: FTIR plot of the synthesized BaSnO3 powders.
22 | P a g e
At 666 cm-1 an intense peak is observed for the powder synthesized at pH 13. This corresponds
to Sn-O asymmetric stretching mode of the bond. This shifts to 628.15 cm-1 in case of the
powder synthesized at pH 11.
Now E=hc/λ = hcv where E is the infrared energy required to set the bond to vibration, c is the
velocity of light and v=1/λ (inverse of wavelength i.e. wave number). Thus the energy
requirement for stretching is more in case of the powder synthesized at pH 13. So a stronger Sn-
O bond is formed at pH 13.
At 857.98 cm-1, 1013.62 cm-1 and 1452.45 cm-1 three peaks are observed for the powder
synthesized at pH 13. These correspond to stretching modes of CO32-. The presence of three
peaks at different wave numbers can be attributed to the coupling motion of the C-O and C=O
bonds. Carbonates, basically BaCO3 may form due to absorption of CO2 from atmosphere during
FTIR analysis. However, the carbonate peaks are redundant in case of the powder synthesized at
pH 11.
At 1602.62 cm-1 and 3734.13 cm-1, two peaks are observed for the powder synthesized at pH 13.
These correspond to OH-. The presence of two peaks at different wavenumbers can be attributed
to the coupling motion of O-H bond. Water may be present due to adsorption by KBr pellets or
by BaSnO3 powders. At 3732.62 cm-1 a peak corresponding to O-H bond can be seen in the
powders synthesized at pH 11.
At 2354.49 cm-1 a peak is absorbed in both the powders. This corresponds to CO2 which has
simply been adsorbed onto the surface but doesn’t react to form carbonates.

23 | P a g e
4.5 ISOELECTRIC POINT
Figure 6 shows the dependence of zeta potential of BaSnO3 powders on pH. The
isoelectric point is found to be at a pH of 4.96.
Fig 7: Dependence of zeta potential of BaSnO3 powders on pH
Dispersion is said to be stable if the absolute value of zeta potential is greater than 30
mV. As seen in Fig 7, the value of zeta potential approaches to -30 mV in the pH ranges 8-10. So
the dispersion of BaSnO3 nanopowders can be stabilized by maintaining the pH in the range 8-
10. In the present case, dispersions were made by maintaining the pH at 9 with the help of
NH4OH.
24 | P a g e
4.6 VARIATION OF ZETA POTENTIAL WITH WEIGHT % OF
DISPERSANTS
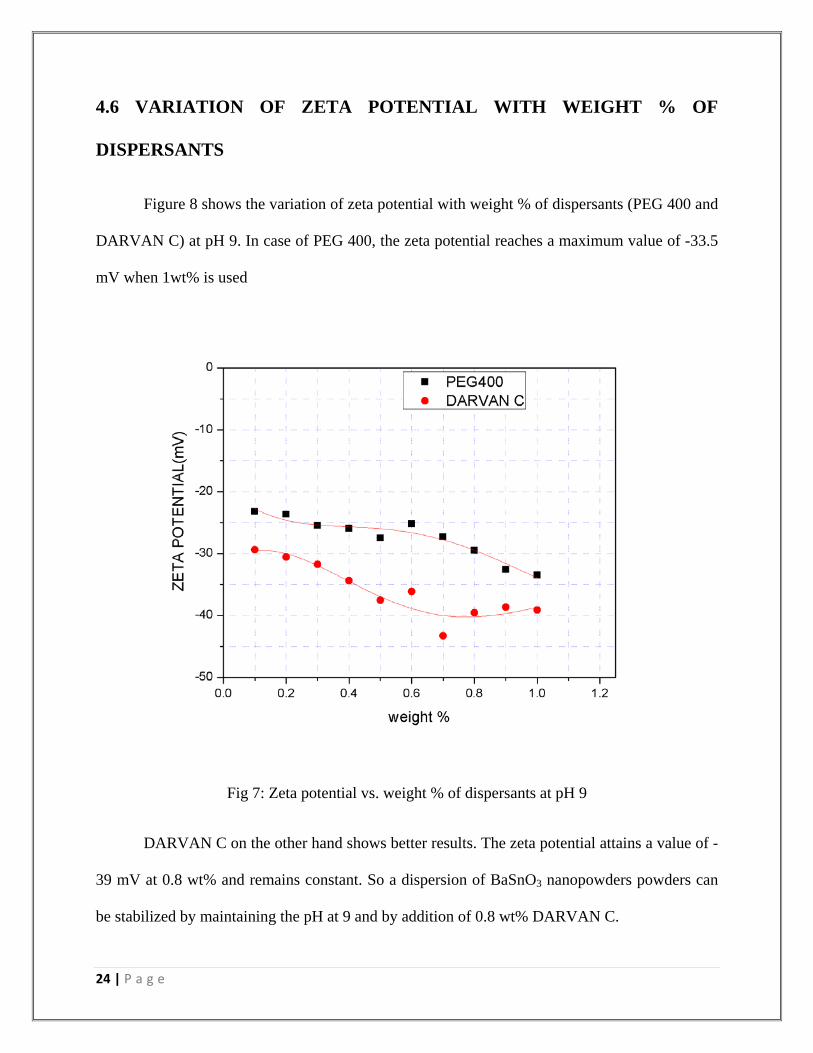
Figure 8 shows the variation of zeta potential with weight % of dispersants (PEG 400 and
DARVAN C) at pH 9. In case of PEG 400, the zeta potential reaches a maximum value of -33.5
mV when 1wt% is used
Fig 7: Zeta potential vs. weight % of dispersants at pH 9
DARVAN C on the other hand shows better results. The zeta potential attains a value of -
39 mV at 0.8 wt% and remains constant. So a dispersion of BaSnO3 nanopowders powders can
be stabilized by maintaining the pH at 9 and by addition of 0.8 wt% DARVAN C.

25 | P a g e
CHAPTER 5
CONCLUSION
26 | P a g e
BaSnO3 powders were prepared by a co-precipitation route by using stoichiometric amounts of
SnCl4.5H2O and BaCl2.2H2O. NaOH was used as a precipitating agent. During the course of
synthesis the pH was maintained at two different values – 11 and 13. The powder was calcined at
1100oC for 2 hours.
The following conclusions were drawn:-
1) The XRD studies have shown that the nanopowder is crystalline, single phase and has a
cubic perovskite structure with a lattice constant a = 4.12 Å.
2) The powder synthesized at pH 13 has a higher specific surface area.
3) Effect of pH on the dispersion of BaSnO3 was studied. The IEP was found to be at pH
4.96
4) A comparison of Darvan C and PEG-400 as a dispersant was done and Darvan C was
found to give better results.

27 | P a g e
REFERENCES
1) M.Wilson, K. Kannangara, G. Smith, M. Simmons, B.Raguse NANOTECHNOLOGY
emerging technologies, Chapman & Hall/CRC (2002).
2) J. Cerda, J. Arbiol, R. Diaz, G. Dezanneau, J.R. Morante, Synthesis of perovskite-type
BaSnO3 particles obtained by a new simple wet chemical route based on a sol–gel
process, Materials Letters 56 (2002);131– 136
3) Wenshung Lu, Synthesis of nanosized BaSnO3 powders, Ph.D Thesis, INM
Germany,(2002)
4) Y.J. Song, S.Kim, preparation of fine BaSnO3 powders by oxalate co-precipitation
method J.Ind.Eng.Chem, vol 7,No 3(2001); 183-185
5) A.S. Deepa, S. Vidya, P.C. Manu, A. John, J.K. Thomas, structural and optical
characterization of BaSnO3 nanopowder synthesized through a novel combustion
technique, Journal of Alloys and Compounds 509(2011); 1830-1835
6) J. CuervoFarfa`n, J. ArbeyRodrı`guez, F. Fajardo , E. VeraLo`pez, D.A. Landı`nez Te`lle,
J. Roa-Rojas, Structural properties, electric response and electronic feature of BaSnO3
perovskite, Physica B 404 (2009); 2720–2722
7) C.P. Udawatte, M. Yoshimura, Preparation of well-crystallized BaSnO3 powders under
hydrothermal conditions, Materials Letters 47 (2001); 7–10
8) W. Lu, H. Schmidt, Lyothermal synthesis of nanocrystalline BaSnO3 powders, Ceramics
International 34 (2008); 645–649
9) W. Lu, H. Schmidt, Preparation and characterization of BaSnO3 powders by
hydrothermal synthesis from tin oxide hydrate gel, Journal of Materials Science 42 (2007);
10007-10013
28 | P a g e
10) W. Lu, H. Schmidt, Synthesis of nanosized BaSnO3 powders from metal isopropoxides, J
Sol-Gel Sci Techn 42 (2007);55–64
, 11) Shaw, D.J. (1992) Introduction to Colloid And Surface Chemistry Butterworth
Heinemann, UK.
12) http://www.horiba.com/us/en/scientific/products/particle
characterization/applications/colloids/ ( Double Layer Diagram taken from this site)
13) Wagner, G. and Binder, H., Z. Anorg. Allgem. Chem., 297 (1958) 328 – 346
14) Dietzel, A., Poch, W., Radex Rumdschau. (1960) 52-61
15) Azad, A. M., Hon, N. C., J. Alloys Comp., 270 (1998) 95-106
![Index [ftp.feq.ufu.br]ftp.feq.ufu.br/Luis_Claudio/Segurança/Safety/Double/fire_handbook... · Backdraft Explosion 174 Barium 216 Barium Carbonate 300 Barium Chlorate 300 Barium Nitrate](https://img.pdfslide.us/doc/110x75/5ea2585052451660ed3ed304/index-ftpfequfubrftpfequfubrluisclaudioseguranasafetydoublefirehandbook.jpg)