Embed Size (px)
Citation preview

Journal of Ceramic Processing Research. Vol. 16, No. 5, pp. 572~577 (2015)
572
J O U R N A L O F
CeramicProcessing Research
Synthesis and characterization of porous PZT-PCN ceramics
F.F. Abdullah, A. Nemati* and R. Bagheri
Department of Materials Science and Engineering, Sharif University of Technology, Tehran, Iran
Porous PZT-PCN ceramics were fabricated with this formula, “0.8 Pb(Zr1/2Ti1/2)O3-0.2 Pb(Co1/3Nb2/3)O3”, abbreviated as“PZTPCN” by introducing Polyvinyl chloride(PVC) and stearic acid (SA) as pore forming agents (PFA) with variedpercentages (5, 10 and 15 wt%). The optimum sintering procedure was designed according to the thermogravimetric analysisof pore formers. XRD and FESEM were applied to study the formed phase and the microstructure of the system. ElectricalCharacterization was conducted using Piezo meter. A decrease in density reduced longitudinal piezoelectric coefficient (d33)and relative dielectric constant (ε) and enhanced hydrostatic figure of merit (dhgh) of PZTPCN ceramics. The hydrostatic figureof merit (dhgh) of 36% porous PZTPCN ceramics was four times more than that of dense ceramic.
Key words: Porous PZT-PCN, piezoelectric properties, Hydrostatic figure of merits, SEM and XRD.
Introduction
Lead zirconate titanate (PZT) ceramics have attracted
great interest because of their excellent dielectric,
piezoelectric, and electrostrictive properties, which are
useful in sensors, actuators besides under water and
ultrasonic transducers [1-5]. The hydrostatic figure of
merit, dhgh, is defined to evaluate the sensitivity of a
pizeoceramic used as underwater transducer [6, 7].
Nowadays;porous PZT ceramics have been paid huge
attentions with respect to dense materials, mainly for
the following several reasons. First, since piezoelectric
coefficients d33 and d31 are opposite in sign, hydrostatic
piezoelectric strain coefficient of dense PZT, dh (= d33
+ 2d31), has a small value [8] butprevious research
[9, 10] has demonstrated that porous PZT is considered
as a good substitute for dense PZT where increasing
porosity can result in moderate decline in d33 but rapid
reduction in d31, contributing to the value of dh. Second,
inclusion of air phase reduces dielectric constant (ε) of
the bodies considerably, leading to increase in
hydrostatic piezoelectric voltage coefficient gh, which
can be calculated by dh/ε. Third, porous piezoelectric
ceramics are cheaper to produce than other piezoelectric
composites Finally, porous piezoelectric ceramics are
very light and are thus more portable than other
piezoelectric composites [11-13].
The porous PZT ceramic materials can be developed
using various processing techniques such as the replica
technique, direct foaming and mixing of burnable
plastic spheres (BURPS). The BURPS process offers
advantages such as the ability to control porosity and
pore size along with ease to manufacture at larger scale
[13-16].
In the present work, porous PZT-PCN ceramics were
prepared. Stearic acid (SA) and polyvinyl chloride
(PVC) were used as additives for BURPS process. By
varying the weight percentage of pore-forming agents,
the properties of material can be monitored to meet the
necessities of various applications.
Experimental Procedure
The raw materials were the reagent grade oxides
PbO, CoO, Nb2O5, ZrO2, and TiO2 oxides 99% purity
were purchased from Sigma-Aldrich.Polyvinyl chloride
(PVC) (CHIMEI chemical industries, Ltd., Taiwan)
and Stearic acid (SA)(C18H36O2 with purity > 97%,
Merck Co., Ltd., Germany) were used as the pore
forming agents (PFAs).The size of PVC was controlled
between 40 nm and 60 nm (D50 =5 0 nm) and the size
of SA was in the range of 160-260 nm (D50 = 210 nm)
as shown in figures 1 and 2. Polyvinyl alcohol (PVA)
solution was also used as a binder in the dry pressing
process.All the materials described above were used
directly without any further modification or treatment.
*Corresponding author: Tel : +009821-66165223Fax: +009821-66012983E-mail: [email protected]
Fig. 1. Particle size distribution of poly vinyl chloride (PVC)powders.
Synthesis and characterization of porous PZT–PCN ceramics 573
PZT-PCN ceramic were fabricated according to the
formula “0.8 Pb (Zr0.5Ti0.5) O3-0.2 Pb (Co0.33Nb0.67) O3”
by a solid-state mixed oxide technique with columbite
CoNb2O6 and wolframiteZrTiO4 precursors.More details
of the synthesis of PCN–PZT powders can be found in
Refs. [17-20]. Porous 0.8PZT-0.2PCN ceramics were
prepared by mixing 0.8PZT-0.2PCN ceramic powder
with pore formers. The particle size of ceramic powder
prepared was approximately between 300 nm and
400 nm (D50 = 350 nm) as shown in Fig.3. The designed
compositions of mixed powders were 0.8Pb(Zr0.52Ti0.48)
O30.2 Pb(Co0.33Nb0.67)O3 + αPCand0.8 Pb(Zr0.52Ti0.48)O3
0.2 Pb(Co0.33Nb0.67)O3 + βStearic acid (SA), respectively,
where α and β were in the range of 0, 5, 10, and
15 wt.%. After an appropriate amount of 7 wt% PVA
aqueous solution was added, the powder was milled to
ensure a homogeneous blending. Thereafter, the mixture
was pressed at about 100 MPa to Ø20 mm disks.
Appropriate sintering procedure is of great
importance because the samples are easy to crack in
the sintering process, due to high porosity and other
possible defects. The optimum sintering procedure
depends on the thermogravimetric analysis of PFA.
From the thermogravimetric analysis of PVC shown in
figure 4, the optimum heating procedure was decided
to begin with an initial heating rate of 120 oC/h up to
250 oC followed by 30 oC/h up to 500 oC. And then again
120 oC/h up to1200 oC with heat preservation at 500 oC
for 1h to assure the complete burn out of the PVC. A
typical sintering procedure is illustrated in Fig. 5.
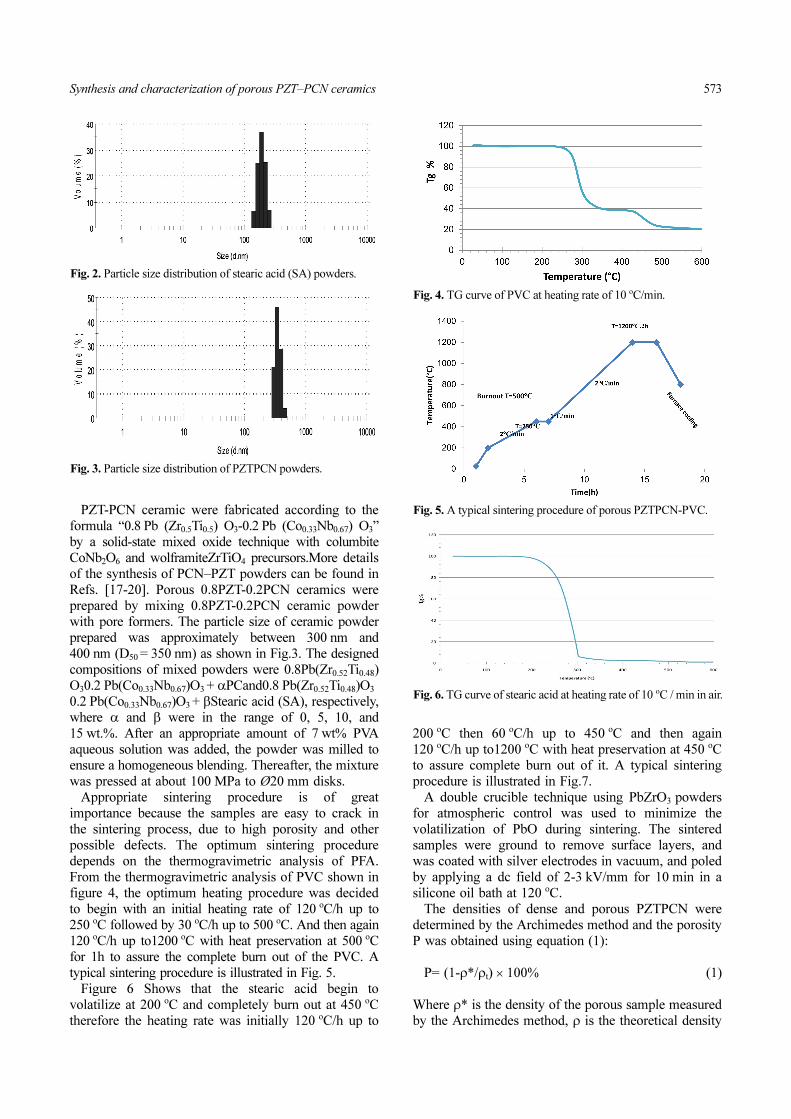
Figure 6 Shows that the stearic acid begin to
volatilize at 200 oC and completely burn out at 450 oC
therefore the heating rate was initially 120 oC/h up to
200 oC then 60 oC/h up to 450 oC and then again
120 oC/h up to1200 oC with heat preservation at 450 oC
to assure complete burn out of it. A typical sintering
procedure is illustrated in Fig.7.
A double crucible technique using PbZrO3 powders
for atmospheric control was used to minimize the
volatilization of PbO during sintering. The sintered
samples were ground to remove surface layers, and
was coated with silver electrodes in vacuum, and poled
by applying a dc field of 2-3 kV/mm for 10 min in a
silicone oil bath at 120 oC.
The densities of dense and porous PZTPCN were
determined by the Archimedes method and the porosity
P was obtained using equation (1):
P= (1-ρ*/ρt) × 100% (1)
Where ρ* is the density of the porous sample measured
by the Archimedes method, ρ is the theoretical density
Fig. 2. Particle size distribution of stearic acid (SA) powders.
Fig. 3. Particle size distribution of PZTPCN powders.
Fig. 4. TG curve of PVC at heating rate of 10 oC/min.
Fig. 5. A typical sintering procedure of porous PZTPCN-PVC.
Fig. 6. TG curve of stearic acid at heating rate of 10 oC / min in air.

574 F.F. Abdullah, A. Nemati and R. Bagheri
(ρt = 8.12 gm/cm3).
The sintered samples were analyzed by X-ray
diffraction (STOE, Model STADI P,Germany) using Cu
kα radiation at step scan of 0.015 o from 5 o to 120 o 2θ.
The piezoelectric coefficients, d33 and d31, were
measured by a direct method based on quasi-static d33/
d31 meters (Model ZJ-6B, Institute of Acoustics,
Chinese Academy of Science) and the parameters of
dh, gh and dh gh were calculated.
The dielectric constant (εr) was calculated from a
parallel-plate capacitor equation, using equation (2)
εr = Cd/εoA (2)
where C is the capacitance of the specimens was
measured with a HP4284A LCR meter, d and A are,
respectively, the thickness and the area of the electrode
and εo is the dielectric permittivity of vacuum
(8.854 × 10¹² Fm1).
Gold was deposited on discs by disc sputter coater (DSC)
(nano structural coating Co.), then the microstructure of
dense and porous PZT-PCN ceramics were observed by
Field Emission Scanning Electron Microscopy (FESEM;
Model MIRA, TESCAN, IRQST).
Results and Discussion
Figure.8 shows porosity yield as a function of PVC
and SA addition, the porosity yield by the PVC was
lower than SA because of the particle size of PVC is
smaller than SA therefore the SA-derived porous
PZTPCN ceramics had higher porosity resulting from
pore interconnection than PVC-derived ones. Relative
density of samples with addition of 5,10,15 wt % of
PVC and SA after sintering at 1200 oC for 2 h are shown
in figure 9. In a relative comparison, the relative density
of PZTPCN sintered at the same condition, with addition
of 15 wt% of pore formers, was reduced about 18.93%
for PVC and 24.43% for SA, respectively.
The relative density changes with PVC and SA
content are easy to understand. During sintering, PVC or
SA burnt off, leaving pores in the PZTPCN matrix.The
more the added Pore forming agents, the more the
porosity in the material microstructure. Many previous
works have reported a similar behavior [16-18].
The phase formation behavior of the sintered
ceramics is revealed by an XRD method. The XRD
patterns are presented in figure 10. It is prominent that
single perovskite structure was observed for both dense
Fig. 7. A typical sintering procedure of porous0.8 PZT-0.2-PCN-SA.Fig. 8. Variations of porosity of porous PZTPCNwith PVC and SAaddition.
Fig. 9. Variations of relative density of porous PZTPCNwith PVCand SA addition.
Fig. 10. XRD of the PZTPCN ceramics with different pore formers.

Synthesis and characterization of porous PZT–PCN ceramics 575
and porous PZTPCN and no secondary phase was
detected. This demonstrated that the PVC and SA as
pore forming agents did not influence the phase of
PZTPCN ceramics.
Figure 11 shows FESEM images of samples
fabricated by the BURPS process with different PVC
and SA additions. The cross sections were made by
fracture of the samples. The resultant pores are mostly
macropores and with the increase of PFA addition, the
porosity increased and the pores became densely
distributed. The observations were consistent with
those of earlier research [14-17]
Figure 12 Shows that the PVC- derived pores were
irregularly but the SA-derived pores were approximately
oval-like. The difference in pore morphology arises
mainly from the different characteristics of PVC and SA
as the PFA, which in turn influences the porosity
obtained.This porosity discrepancy could be related to
the difference in particle size between the PVC and SA.
As stated above, the SA and PVC used as PFAs have
resulted in different pore morphologies and porosities,
and the difference in the porous microstructures could
in turn lead to different properties for porous PZT-PCN
Fig. 11. Fracture surfaces of porous PZTPCN ceramics: (a–d)ceramics fabricated with 0, 5, 10, and 15 wt% PVC additions, (e-g)ceramics fabricated with 5, 10, and 15. wt% SA addition respectively.
Fig.12. FESEM micrographs of the cross section of PZTPCNceramics fabricated with (a) 0% PFA, (b) 10% PVC (C) 10%SAaddition respectively.
Table1. Summary of the samples prepared in this study.
SamplePVC
content (wt %)
Sintered density(gm/cm
3)Porosity%
Relative density (%)
εd33
(pC/N)dh
gh
(10−3Vm/N)
Figure of meritdh gh
(10−15 m2/N
A 0 7.10 12.56 87 1137 356 74 6.5 481
B 5 6.98 14.04 85.96 346 231 46 13.30 612
C 10 6.27 22.70 77.22 340 226 55 16.20 891
D 15 5.94 26.85 73.15 311 213 57 18.33 1045
SA content (wt %)
E 5 6.54 19.46 80.54 336 230 64 19.00 1216
F 10 6.01 25.98 74.01 264 206 66 25.00 1650
G 15 5.19 36.08 69.92 256 185 74 28.89 2138

576 F.F. Abdullah, A. Nemati and R. Bagheri
ceramics.
The results obtained for all samples are summarized
in Table 1.
Longitudinal piezoelectric coefficient (d33) and
dielectric constant (εr) of porous PZT-PCN ceramics as
a function of density are shown in figures 13 and 14,
respectively. Both d33 andårof PZTPCN ceramics
decreased with the decreasing density, as would be
expected. The (d33) of PZTPCN ceramics decreased
with decreased density as for the observation from
Carroll and Holt [18], the enhanced stress near the
pores leads to an increase in microscopic stress and
strain,which can not only inhibit the movement of
domain walls but also prevent grain growth and
decrease grain size. According to the space-charge
theory from Okazaki and Nagata [19], there is a
specific amount of space-charge sites such as lattice
vacancies or impurity atoms bounding inside grain
boundaries as well as domain walls and forming the
space-charge fields which inhibit the movement of
domain walls. As the grain size decreases, the surface
area of the space-charge layer will decrease, so the
space-charge field will decrease simultaneously [20-
22], thus the piezoelectric coefficient decreases.
The decrease in the εr values with decreasing density
and/or increasing porosity which is due to the
dominating effect of passive phase (porous) over the
active phase (PZTPCN) of the material. These results
agree with earlier reports [23, 24]
Hydrostatic piezoelectric voltage coefficient (gh) and
hydrostatic figure of merit (dhgh) of porous PZTPCN
ceramics as a function of density are shown in figures
15 and 16, respectively. Both gh and dhgh of porous
PZT-PCN ceramics were increased sharply with
decreasing density. But dh and gh values are relatively
low in the case of the porous specimen made from PVC
where is high in the case of SA. This clearly shows that,
order of porosity in case of PVC specimens was lower
than SA. The hydrostatic figure of merit(dhgh)of porous
PZTPCN ceramics made from 15 wt% SA and with
porosity of about 36% reached 2138 × 10−15 m2/N
approximately four times more than that of dense
ceramic.
Conclusions
Porous PZTPCN piezoelectric ceramics was synthesized
by adding different pore formers (PVC and SA) and
sintered at 1200 oC for 2 h.
The results indicated that the density was decreased
with an increase in the content of pore formers, the
decreased density and /or increased porosity led to a
decrease in d33 and εr, for all the porous PZTPCN
ceramics which can be explained by the space-charge
theory from Okazaki.
A decrease in density caused an increase in
hydrostatic figure of merit (dhgh) and porous PZTPCN
Fig. 13. Variation of d33 and εr as a function of density of porousPZTPCN ceramics with PVC as PFA.
Fig. 14. Variation of d33 and εr as a function of density of porousPZTPCN ceramics with SA as PFA.
Fig. 15. Variation of gh and dhgh as a function of density of porousPZTPCN ceramics with PVC as PFA.
Fig. 16. Variation of gh and dhgh as a function of density of porousPZTPCN ceramics with SA as PFA.

Synthesis and characterization of porous PZT–PCN ceramics 577
ceramics made with porosity of about 36% reached
2138 × 10−15 m2/N approximately four times more than
that of dense PZTPCN ceramic.
References
1. J. FRADEN, “Handbook of modern sensors”, (Springerthird edition, Press2004) p.43.
2. T.L. Jordan and Z. Ounaies, ICASE Report No. 2001-28(2001) 1-22.
3. A.J. Bell, J. Mat. Sci. 41 (2006) 13-25.4. G.H. Haertling, J. Am. Ceram. Soc. 82 [4] (1999) 797-8185. F. Levassort, J. Holc, E. Ringgaard, T. Bove, M. Kosec and
M. Lethiecq, J. Electroceram19 (2007) 125-137.6. D. Piazza, C. Galassi, A. Barzegar and D. Damjanovic, J
Elec. 24 (2010) 170-176.7. B. Pravveenkumar, H. H. Kumar and D. K. Kharat, Bull.
Mater. Sci. 28, (2005) 453-455. 8. T. Zeng, X. L. Dong, H. Chen and Y. L. Wang, Mate. Sci
and Eng. B 131 (2006) 181-185.9. S.H. Lee, S.H. Jun and H. Kim, J. Am. Ceram. Soc., 90 [9]
(2007) 2807-2813.10. C.R. Bowen, A. Perry, A.C.F. Lewis and H. Kara, J. Euro.
Ceram Soc. 24 (2004) 541-545.11. K. Boumcheddaa, M. Hamadia and G. Fantozzi, 27 (2007)
4169-4171.
12. T. Zeng, X. Dong, S. Chen and H. Yang, Ceram. Int. 33(2007) 395-399.
13. B. P. Kumar, H. H. Kumar and D. K. Kharat, J. Mat Sci.Mat. In electronics 16 (2005) 681-686.
14. B. P. Kumar, H.H. Kumar and D.K. Kharat,Mat Sci. andEngineering 127, (2006) 130-133.
15. K. Ina, T. Mano, S. Omura, and K. Nagata, JPN. J. Appl.Phys. 33 (1994) 5381-5384.
16. B. Praveenkumar, H. H. Kumar and D. K. Kharat, J. Mater.Sci. Mater Electron, 17, 515-518 (2006).
17. J.F. Li, K ,Takagi, M .Ono, W. Pan and R .Watanabe, J.Am. Ceram. Soc. 86 [7] (2003) 1094-1098.
18. T. Zeng, X. Dong, C. Mao, Z. Zhou and H. Yang, J. Eur.Ceram. Soc. 27, (2007) 2025-2029.
19. M.M. Carroll, A.C. Holt, J. Appl. Phys. 43 (4) (1972)1626-1635.
20. K. Okazaki, K. Nagata, J. Am. Ceram. Soc. 56 [2] (1973)82-86.
21. H.T. Martirena and J.C. Burfoot, J. Phys. C: Solid StatePhys. 7 (1974) 3182-3192.
22. B.A. Tuttle, P. Yang, J.H. Gieske, J.A. Voigt, T.W.Scofield, D.H. Zeuch and W.R. Olson, J. Am. Ceram. Soc.[84] (6) (2001) 1260-1264.
23. R. Lewis, A. Dent, R. Stevens and C. R. Bowen, SmartMater. Struct. 20 (2011) 085002 (6pp).
24. H. Kara, R. Ramesh, R. Stevens and Chris R. Bowen,Transactions of ultrasonic, ferroelectrics and frequencycontrol. 50 (2003) 289-296.


![PZT 압전재료.ppt [호환 모드]](https://img.pdfslide.us/doc/110x75/61b3808861533b67b44eb4fc/pzt-ppt-.jpg)