Embed Size (px)
Citation preview
Synthesis and characterization of new injectable and
degradable dextran-based hydrogels
Joao Maiaa,*, Lino Ferreirab, Rui Carvalhoc, Manuel A. Ramosd, Maria H. Gila
aDepartamento de Engenharia Quımica, Universidade de Coimbra, Pinhal de Marrocos, 3030 Coimbra, PortugalbINEB-Instituto de Engenharia Biomedica, Laboratorio de Biomateriais, Rua do Campo Alegre 823, 4150-180 Porto, Portugal
cDepartamento de Bioquımica, Universidade de Coimbra, Apartado 3126, 3000 Coimbra, PortugaldInstituto Superior de Engenharia, Inst. Politecnico de Coimbra, 3000 Coimbra, Portugal
Received 19 March 2005; received in revised form 21 July 2005; accepted 27 July 2005
Available online 19 August 2005
Abstract
Injectable and degradable hydrogels are very interesting networks for drug delivery and cell transplantation applications since they can be
administered in the human body in a minimally invasive way. In most cases, the crosslinking reaction occurs by photopolymerisation or free
radical polymerisation; however, the use of chemical initiators may promote cell death. In the current work, injectable and degradable
dextran-based hydrogels were prepared without the use of initiators. Dextran, a natural glucose-containing polysaccharide, was oxidized with
sodium periodate (dexOx) and the derivatives characterized by NMR and FTIR spectroscopy’s as well as by colorimetric techniques. The
oxidized derivatives were crosslinked with adipic acid dihydrazide (AAD), forming a gel within 2–4 min. The obtained hydrogels were
characterized by their mechanical properties, swelling and degradation behavior under physiologic conditions. In addition, the hydrogel
interior morphology as well as porous structure was evaluated by scanning electron microscopy (SEM) and mercury intrusion porosimetry
(MIP). MIP analysis showed that dexOx hydrogels crosslinked with 10% of AAD were macroporous with pore sizes ranging from 0.32 to
0.08 mm. As expected, the average pore size increased during hydrogel degradation as confirmed by SEM and MIP studies.
q 2005 Elsevier Ltd. All rights reserved.
Keywords: Hydrogels; Degradation; Pore size
1. Introduction
The hydrophilicity of polysaccharides, along with the
ease in which they can be formed into hydrogels, makes
these materials ideal for many biomedical applications
including systems for peptide and protein delivery and
scaffolds for tissue engineering applications [1–5]. The
variety of saccharide monomers (ca. 200) and the variety of
possible O-glycoside linkages result in a diversity of
polysaccharide structures, which is important in the design
of hydrogels with different physicochemical properties [6].
Because polysaccharides are natural products, they are
usually biocompatible and some of them are biodegradable
in the human body.
0032-3861/$ - see front matter q 2005 Elsevier Ltd. All rights reserved.
doi:10.1016/j.polymer.2005.07.089
* Corresponding author. Tel.: C351 239798743; fax: C351 239798703.
E-mail address: [email protected] (J. Maia).
From the polysaccharides found in nature, dextran has
particular relevance in the biomedical field. For several
years, dextran has been used as a macromolecular pro-drug
and as a plasma expander [7]. These glucose-based
polymers are available in a wide range of molecular weights
and contain a high density of hydroxyl groups that make the
polymers highly hydrophilic and capable of being further
functionalized chemically. Dextran is also biocompatible
[3] and can be degraded through the action of dextranases in
various organs in the human body, including liver, spleen,
kidney, and colon [7].
A common way of making hydrogels with polysacchar-
ides involves the derivatization of the natural polymer with
vinyl compounds followed by either radical [1,2] or UV [8]
polymerisation of the polymer derivatives. However, this
approach has some limitations since it requires the use of
chemicals or photo initiators, which may promote cell death
[3,9,10]. This is an important issue when these networks are
used as subcutaneous drug delivery systems and scaffolds for
tissue engineering. Recently, a novel methodology has been
Polymer 46 (2005) 9604–9614
www.elsevier.com/locate/polymer
J. Maia et al. / Polymer 46 (2005) 9604–9614 9605
proposed elsewhere [11], which do not require the use of
initiators. In that case, the guluronate content of alginates was
isolated and partially oxidized and subsequently cross-linked
with AAD. Additionally, it was shown that the hydrogels
were able to support the adhesion and growth of primary rat
calvarial osteoblast cells [12]. However, this methodology
requires several steps to isolate the guluronate (which is
eliminated in the human body in opposition to alginate [13]),
which may reduce its general application in the biomedical
field. Furthermore, no insights were given about the porous
structure before and during hydrogel degradation at
physiologic conditions and this is of crucial importance for
the use of these networks in biomedical field. This parameter
is a critical factor to control swelling [14], drug release
behavior [15], biological interaction inside the body [16], as
well as the diffusion of nutrients to nourish cells, when
encapsulated inside of the hydrogel network [17].
In this work, we describe a methodology to prepare
injectable and degradable hydrogels from oxidized dextran
(dexOx) and adipic acid dihydrazide (AAD) without the use
of any chemical initiator. DexOx macromonomers form
almost instantaneously hydrogels in the presence of AAD, a
non-toxic and non-mutagenic [18] covalent crosslinking
molecule. The networks were evaluated regarding their
swelling and rheological properties, as well their degra-
dation at physiologic pH. In this last case, MIP and SEM
were used to evaluate the porous structure of the networks.
The results show that it is feasible to obtain dextran-based
hydrogels with different degradation profiles, which may
have particular relevance in the design of new drug delivery
systems and scaffolds for tissue engineering.
2. Materials and methods
2.1. Materials
Dextran (from Leuconostoc mesenteroides; MwZ73,
200 Da, according to the manufacturer’s specification),
adipic acid dihydrazide (AAD), trinitrobenzenosulfonic
acid (TNBS), phosphate buffered saline (PBS), and sodium
m-periodate were purchased from Sigma (Sintra, Portugal).
Diethyleneglycol and tert-butylcarbazate (tBC) were
obtained from Aldrich (Sintra, Portugal). Trichloroacetic
acid was obtained from Merck (Darmstadt, Germany).
Dialysis tubes with a MWCO of 12–14,000 Da were
purchased from Medicell International Ltd (London, UK).
All the other chemicals and solvents used in this work were
of the highest purity commercially available.
2.2. Nuclear magnetic resonance (NMR), Fourier transform
infrared (FTIR) and size exclusion chromatography (SEC)
analysis
1H and 13C NMR spectra were acquired on a Varian
Unity 500 NMR spectrometer (Palo Alto, CA) using a 5 mm
broadband NMR probe. 1H NMR spectra were recorded in
D2O (60–100 mg in 0.7 mL; pD of ca. 5.0) using a 908 pulse
and a relaxation delay of 30 s. The water signal, used as
reference line, was set at d 4.75 ppm and was partially
suppressed by irradiation during the relaxation delay. A
total of 16 scans were added for each 1H NMR spectra. Bi-
dimensional 1H–13C heteronuclear multiple quantum
coherence spectra (HMQC) were collected as a 1024!512 matrix covering sweep widths of 2500 and 11,500 Hz in
the first and second dimensions, respectively, and using 64
scans/increments. Before Fourier transformation, the matrix
was zero-filled to 2048!2048 and standard Gaussian
weighting functions were applied in both dimensions.
FTIR spectra were recorded with a Nicolet Magna-IR
550 spectrometer (Madison, WI, USA). The dry samples
were powdered, mixed with KBr, and pressed into pellets
manually. The FTIR spectra were obtained by recording 128
scans between 4000 and 400 cmK1 with a resolution of
4 cmK1.
Size exclusion chromatography was performed in a
Agilent Technologies 1100 series HPLC system, equipped
with a column (TSK G4000PWxl Tosoh Bioscience) and a
refraction index detector (Optilab rEX) from Wyatt
Technology Corporation. The injection and column system
were kept at room temperature. The eluent was mili-Q water
with 0.1 M NaNO3 at a flow rate of 0.2 mL/min. The SEC
chromatograms were obtained from samples dissolved in
the eluent with a concentration of 0.5% (w/v). Calibration
was made with dextran standards (Fluka Chemie AG,
Switzerland) in the molecular range of 12–80 kDa.
2.3. Synthesis of oxidized dextrans
An aqueous solution of dextran (1 g; 0.125%, w/v) was
oxidized with 2 mL of sodium periodate solution with
concentrations ranging from 0.15 to 3.1 M (to yield
theoretical oxidations from 5 to 100%), at room tempera-
ture. An equimolar amount of diethyleneglycol was added
after 20 h to stop the oxidation reaction. The resulting
solution was dialysed for 3 days against water, using a
dialysis tube with a MWCO 12–14,000 Da, and then
lyophilised (Labconco Corp., Kansas City, MO, USA).
The isolated yields were ca. 75%. The scale-up of the
reaction was done using the same procedure albeit using
30 g of dextran and a calculated amount of periodate to yield
a theoretical oxidation of 25%.
2.4. Determination of degree of oxidation (DO)
The DO of dexOx is defined as the number of oxidized
residues per 100 glucose residues (DO refers to the
experimental value unless otherwise stated) and quantified
by using tBC [11,19]. The carbazates react with aldehyde
groups to form carbazones in the same way hydrazones are
formed in the presence of hydrazides. After reacting an
excess amount of tBC with the dexOx, the unreacted tBC
J. Maia et al. / Polymer 46 (2005) 9604–96149606
was quantified by adding TNBS and measuring spectro-
photometrically the resulting complex (trinitrophenyl
derivative) at 334 nm. Typically, solutions of dexOx
(0.5 mL, 0.001% w/v) and tBC (0.5 mL, 0.03 M) in aqueous
trichloroacetic acid (1%) were mixed, and allowed to react
for 24 h at room temperature. A volume of 200 mL was
transferred to a vial containing aqueous TNBS solution
(1 mL, 85.5 mM in phosphate buffer 0.2 M pH 8.0). The
mixture was allowed to react for 60 min at room
temperature, diluted with aqueous hydrochloric acid
(0.5 M) (the acidification results in stabilization of the
coloured TNBS derivatives [20]), and the absorbance of the
solution was measured at 334 nm. Aqueous tBC solutions
were used as standards to obtain a calibration curve for
determining the unreacted carbazates in experimental
samples. The blank used contained 1:1 double-distilled
water and aqueous trichloroacetic acid (1%, w/v).
2.5. Formic acid titration
In the end of the oxidation reaction (ca. 20 h of reaction,
before the addition of diethyleneglycol), 5 mL of the
reaction mixture were taken and transferred to a scintillation
vial. The formic acid in the sample was titrated with 0.01 M
NaOH using phenolphthalein solution as indicator.
The oxidation reaction was also followed by 1H NMR.
The formic acid released was estimated from the ratio
between the area of the peaks at d 8.2 ppm (formic acid) and
d 1.2 ppm (CH3 from ethanol). The ethanol was added to the
NMR tube in the beginning of the experiment.
2.6. Preparation of dexOx hydrogels
DexOx was dissolved to a final concentration of 28.6%
(w/v), in 0.2 M phosphate buffer pH 8.0, for 16 h, at 37 8C.
Afterwards, 700 mL of this solution was transferred to a 24
well tissue-culture plate and mixed with 300 mL of AAD
solution (dissolved in the same phosphate buffer) at different
concentrations (5, 10 and 20% in molar base taking into
account the number of glucose residues in the original
dextran) with the pipette tip. The crosslinking reaction was
allowed to proceed overnight at room temperature.
2.7. Dynamic swelling experiments
DexOx gels after being prepared, and accurately
weighted (Wi) were immersed in different pH buffers
solutions (ca. 10 mL) in sealed containers, at 37 8C. The
buffer solutions used were 0.05 M HCl/KCl for pH 1.0;
0.2 M citrate–phosphate for pH 3.0–5.0; 0.01 M PBS pH 7.4
and 0.05 M Tris–HCl for pH 9.0. At regular intervals, they
were removed from the aqueous solution, blotted with filter
paper to remove surface water, weighed (Wt) and returned to
the same container (the buffer solution was replaced at each
measurement). The swelling index was calculated from the
ratio between Wt and Wi. In some cases, at different times,
the hydrogels were lyophilized on a freeze-drier for 72 h and
weighted (Wd). After Wd determination, either swelling ratio
(SRZ(WtKWd)/Wd) or mass remaining [(Wd/Wi)!100]
was calculated. The gel-fraction of hydrogels was calculated
from the ratio of the dry weight of hydrogel after swelling in
citrate buffer pH 5.0 for 2 days and the initial dry weight
immediately after the polymerization reaction.
2.8. Rheological analysis
Hydrogels were equilibrated in 0.2 M citrate buffer
solution pH 5.0 for 2 days, at room temperature, before
being tested. Rheological experiments were carried out
using the parallel plate geometry (20 mm diameter, steel) of
a Haake Rheostress RS 1. Sandpaper was glued onto each
plate surface in order to avoid slippage of samples.
Equilibrium swelling conditions have been maintained
during rheological measurements by adding water at pH
5.0 in the lower plate of the geometry until the entire free
lateral surface of hydrogels was completely wetted by the
liquid. Gap setting optimizations have been undertaken
according to the procedure described elsewhere [21].
Hydrogels were subjected to stress sweep experiments
(frequency of 1 Hz) in order to optimize the applied stress
used in the frequency-oscillation experiments. These last
experiments were recorded over a frequency range from 0.1
to 10 Hz. For the calculation of gelation period, both
solutions were mixed on the bottom plate, and the upper
plate was positioned at a gap of 1.1 mm. This procedure
took around 20 s and then the experiment was started at low
frequency (0.5 Hz) and stress (0.1 Pa).
2.9. Scanning electron microscopy (SEM) analysis
Swollen dexOx gels were quickly frozen in a glass
container using liquid nitrogen and freeze-dried for 72 h.
Fractured pieces of 0.6–0.9 cm in length, corresponding to
half-diameter of each hydrogel, were mounted into an
aluminum stud and gold coated by plasma vapor deposition.
The surface and cross-section of hydrogels were recorded
by a field emission scanning electron microscope (JEOL
model JSM-5310), at 15.0–20.0 kV.
Analyses of the digitized images were performed using
the public domain ImageJ 1.31v program (http://rsb.info.
nih.gov/ij/), according to a methodology described by others
[14,22]. Briefly, a threshold procedure was applied to the
SEM images and the validity of the threshold level was
confirmed by comparing the image before and after the
procedure. In case of irregularities, they were corrected
manually by comparison to the original photograph. After
calibrating with a known scale, the pores were measured and
labeled one by one. The diameter of a pore was obtained by
averaging the major and the minor axes of the pore.
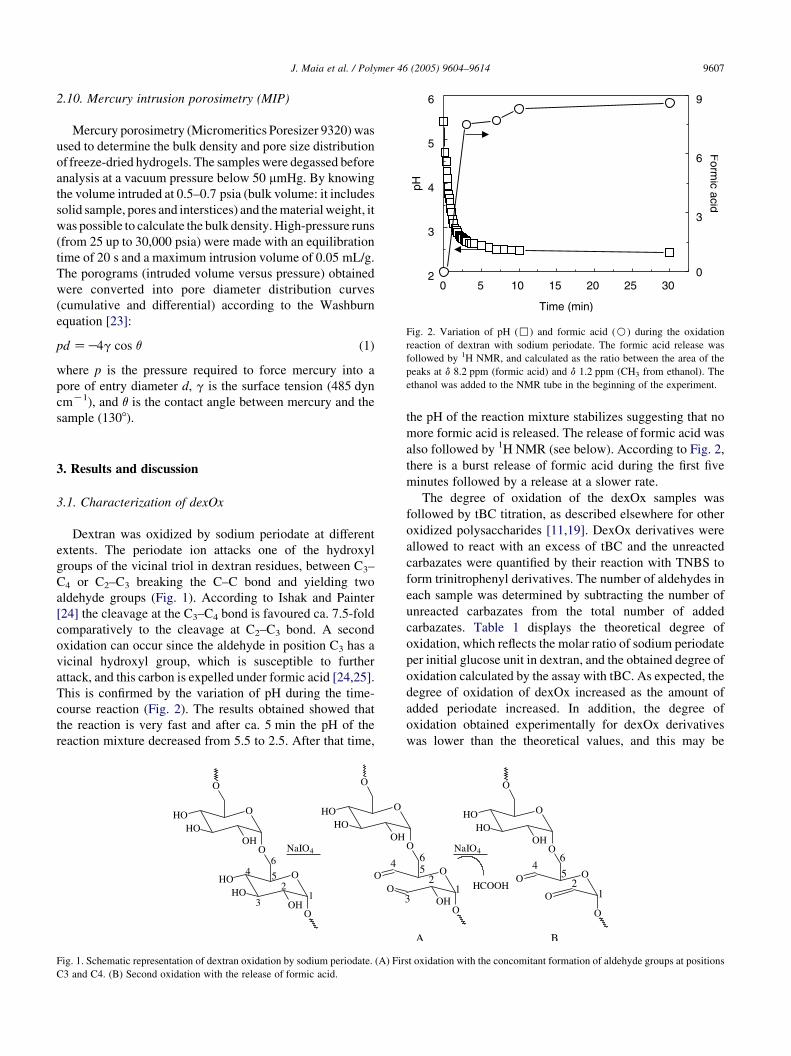
Fig. 2. Variation of pH (,) and formic acid (B) during the oxidation
reaction of dextran with sodium periodate. The formic acid release was
followed by 1H NMR, and calculated as the ratio between the area of the
peaks at d 8.2 ppm (formic acid) and d 1.2 ppm (CH3 from ethanol). The
ethanol was added to the NMR tube in the beginning of the experiment.
J. Maia et al. / Polymer 46 (2005) 9604–9614 9607
2.10. Mercury intrusion porosimetry (MIP)
Mercury porosimetry (Micromeritics Poresizer 9320) was
used to determine the bulk density and pore size distribution
of freeze-dried hydrogels. The samples were degassed before
analysis at a vacuum pressure below 50 mmHg. By knowing
the volume intruded at 0.5–0.7 psia (bulk volume: it includes
solid sample, pores and interstices) and the material weight, it
was possible to calculate the bulk density. High-pressure runs
(from 25 up to 30,000 psia) were made with an equilibration
time of 20 s and a maximum intrusion volume of 0.05 mL/g.
The porograms (intruded volume versus pressure) obtained
were converted into pore diameter distribution curves
(cumulative and differential) according to the Washburn
equation [23]:
pd ZK4g cos q (1)
where p is the pressure required to force mercury into a
pore of entry diameter d, g is the surface tension (485 dyn
cmK1), and q is the contact angle between mercury and the
sample (1308).
3. Results and discussion
3.1. Characterization of dexOx
Dextran was oxidized by sodium periodate at different
extents. The periodate ion attacks one of the hydroxyl
groups of the vicinal triol in dextran residues, between C3–
C4 or C2–C3 breaking the C–C bond and yielding two
aldehyde groups (Fig. 1). According to Ishak and Painter
[24] the cleavage at the C3–C4 bond is favoured ca. 7.5-fold
comparatively to the cleavage at C2–C3 bond. A second
oxidation can occur since the aldehyde in position C3 has a
vicinal hydroxyl group, which is susceptible to further
attack, and this carbon is expelled under formic acid [24,25].
This is confirmed by the variation of pH during the time-
course reaction (Fig. 2). The results obtained showed that
the reaction is very fast and after ca. 5 min the pH of the
reaction mixture decreased from 5.5 to 2.5. After that time,
Fig. 1. Schematic representation of dextran oxidation by sodium periodate. (A) Fir
C3 and C4. (B) Second oxidation with the release of formic acid.
the pH of the reaction mixture stabilizes suggesting that no
more formic acid is released. The release of formic acid was
also followed by 1H NMR (see below). According to Fig. 2,
there is a burst release of formic acid during the first five
minutes followed by a release at a slower rate.
The degree of oxidation of the dexOx samples was
followed by tBC titration, as described elsewhere for other
oxidized polysaccharides [11,19]. DexOx derivatives were
allowed to react with an excess of tBC and the unreacted
carbazates were quantified by their reaction with TNBS to
form trinitrophenyl derivatives. The number of aldehydes in
each sample was determined by subtracting the number of
unreacted carbazates from the total number of added
carbazates. Table 1 displays the theoretical degree of
oxidation, which reflects the molar ratio of sodium periodate
per initial glucose unit in dextran, and the obtained degree of
oxidation calculated by the assay with tBC. As expected, the
degree of oxidation of dexOx increased as the amount of
added periodate increased. In addition, the degree of
oxidation obtained experimentally for dexOx derivatives
was lower than the theoretical values, and this may be
st oxidation with the concomitant formation of aldehyde groups at positions
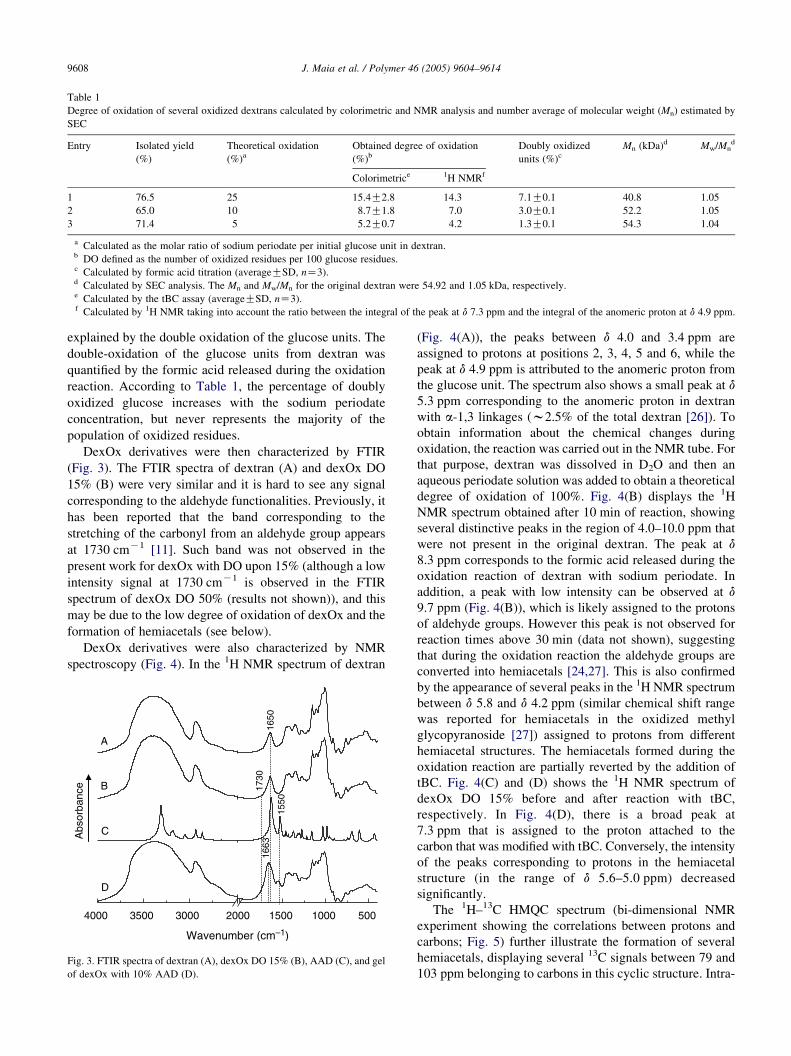
Table 1
Degree of oxidation of several oxidized dextrans calculated by colorimetric and NMR analysis and number average of molecular weight (Mn) estimated by
SEC
Entry Isolated yield
(%)
Theoretical oxidation
(%)a
Obtained degree of oxidation
(%)b
Doubly oxidized
units (%)c
Mn (kDa)d Mw/Mnd
Colorimetrice 1H NMRf
1 76.5 25 15.4G2.8 14.3 7.1G0.1 40.8 1.05
2 65.0 10 8.7G1.8 7.0 3.0G0.1 52.2 1.05
3 71.4 5 5.2G0.7 4.2 1.3G0.1 54.3 1.04
a Calculated as the molar ratio of sodium periodate per initial glucose unit in dextran.b DO defined as the number of oxidized residues per 100 glucose residues.c Calculated by formic acid titration (averageGSD, nZ3).d Calculated by SEC analysis. The Mn and Mw/Mn for the original dextran were 54.92 and 1.05 kDa, respectively.e Calculated by the tBC assay (averageGSD, nZ3).f Calculated by 1H NMR taking into account the ratio between the integral of the peak at d 7.3 ppm and the integral of the anomeric proton at d 4.9 ppm.
J. Maia et al. / Polymer 46 (2005) 9604–96149608
explained by the double oxidation of the glucose units. The
double-oxidation of the glucose units from dextran was
quantified by the formic acid released during the oxidation
reaction. According to Table 1, the percentage of doubly
oxidized glucose increases with the sodium periodate
concentration, but never represents the majority of the
population of oxidized residues.
DexOx derivatives were then characterized by FTIR
(Fig. 3). The FTIR spectra of dextran (A) and dexOx DO
15% (B) were very similar and it is hard to see any signal
corresponding to the aldehyde functionalities. Previously, it
has been reported that the band corresponding to the
stretching of the carbonyl from an aldehyde group appears
at 1730 cmK1 [11]. Such band was not observed in the
present work for dexOx with DO upon 15% (although a low
intensity signal at 1730 cmK1 is observed in the FTIR
spectrum of dexOx DO 50% (results not shown)), and this
may be due to the low degree of oxidation of dexOx and the
formation of hemiacetals (see below).
DexOx derivatives were also characterized by NMR
spectroscopy (Fig. 4). In the 1H NMR spectrum of dextran
Fig. 3. FTIR spectra of dextran (A), dexOx DO 15% (B), AAD (C), and gel
of dexOx with 10% AAD (D).
(Fig. 4(A)), the peaks between d 4.0 and 3.4 ppm are
assigned to protons at positions 2, 3, 4, 5 and 6, while the
peak at d 4.9 ppm is attributed to the anomeric proton from
the glucose unit. The spectrum also shows a small peak at d
5.3 ppm corresponding to the anomeric proton in dextran
with a-1,3 linkages (w2.5% of the total dextran [26]). To
obtain information about the chemical changes during
oxidation, the reaction was carried out in the NMR tube. For
that purpose, dextran was dissolved in D2O and then an
aqueous periodate solution was added to obtain a theoretical
degree of oxidation of 100%. Fig. 4(B) displays the 1H
NMR spectrum obtained after 10 min of reaction, showing
several distinctive peaks in the region of 4.0–10.0 ppm that
were not present in the original dextran. The peak at d
8.3 ppm corresponds to the formic acid released during the
oxidation reaction of dextran with sodium periodate. In
addition, a peak with low intensity can be observed at d
9.7 ppm (Fig. 4(B)), which is likely assigned to the protons
of aldehyde groups. However this peak is not observed for
reaction times above 30 min (data not shown), suggesting
that during the oxidation reaction the aldehyde groups are
converted into hemiacetals [24,27]. This is also confirmed
by the appearance of several peaks in the 1H NMR spectrum
between d 5.8 and d 4.2 ppm (similar chemical shift range
was reported for hemiacetals in the oxidized methyl
glycopyranoside [27]) assigned to protons from different
hemiacetal structures. The hemiacetals formed during the
oxidation reaction are partially reverted by the addition of
tBC. Fig. 4(C) and (D) shows the 1H NMR spectrum of
dexOx DO 15% before and after reaction with tBC,
respectively. In Fig. 4(D), there is a broad peak at
7.3 ppm that is assigned to the proton attached to the
carbon that was modified with tBC. Conversely, the intensity
of the peaks corresponding to protons in the hemiacetal
structure (in the range of d 5.6–5.0 ppm) decreased
significantly.
The 1H–13C HMQC spectrum (bi-dimensional NMR
experiment showing the correlations between protons and
carbons; Fig. 5) further illustrate the formation of several
hemiacetals, displaying several 13C signals between 79 and
103 ppm belonging to carbons in this cyclic structure. Intra-
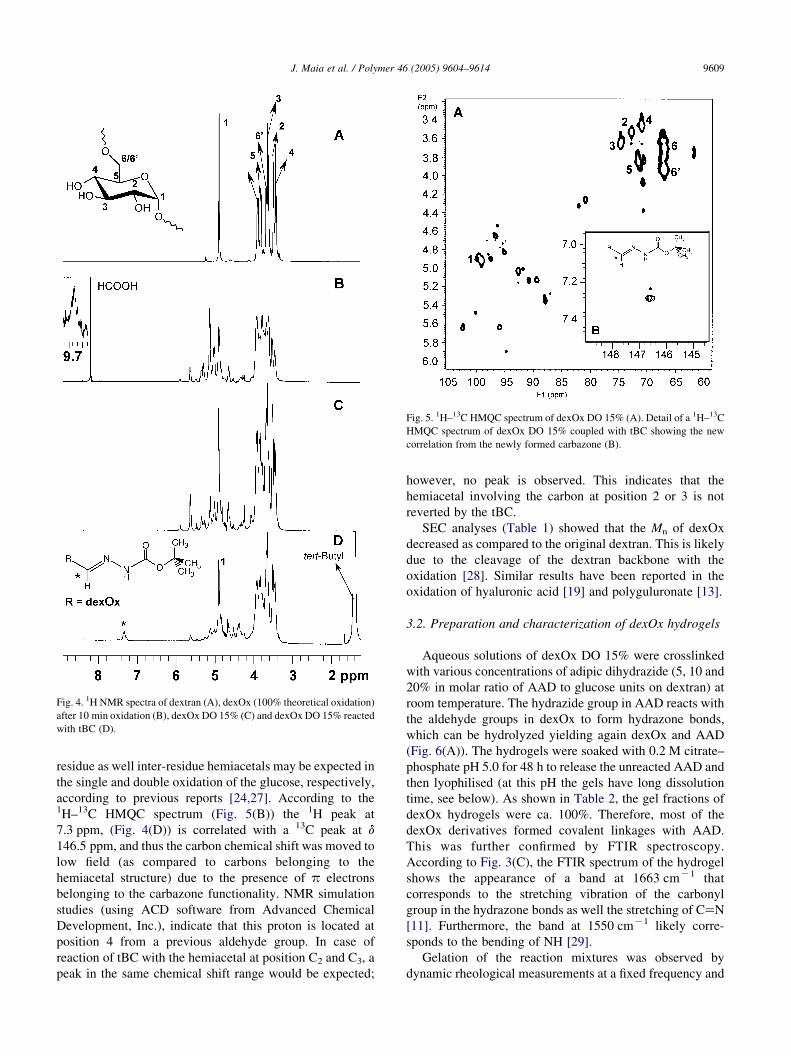
Fig. 4. 1H NMR spectra of dextran (A), dexOx (100% theoretical oxidation)
after 10 min oxidation (B), dexOx DO 15% (C) and dexOx DO 15% reacted
with tBC (D).
Fig. 5. 1H–13C HMQC spectrum of dexOx DO 15% (A). Detail of a 1H–13C
HMQC spectrum of dexOx DO 15% coupled with tBC showing the new
correlation from the newly formed carbazone (B).
J. Maia et al. / Polymer 46 (2005) 9604–9614 9609
residue as well inter-residue hemiacetals may be expected in
the single and double oxidation of the glucose, respectively,
according to previous reports [24,27]. According to the1H–13C HMQC spectrum (Fig. 5(B)) the 1H peak at
7.3 ppm, (Fig. 4(D)) is correlated with a 13C peak at d
146.5 ppm, and thus the carbon chemical shift was moved to
low field (as compared to carbons belonging to the
hemiacetal structure) due to the presence of p electrons
belonging to the carbazone functionality. NMR simulation
studies (using ACD software from Advanced Chemical
Development, Inc.), indicate that this proton is located at
position 4 from a previous aldehyde group. In case of
reaction of tBC with the hemiacetal at position C2 and C3, a
peak in the same chemical shift range would be expected;
however, no peak is observed. This indicates that the
hemiacetal involving the carbon at position 2 or 3 is not
reverted by the tBC.
SEC analyses (Table 1) showed that the Mn of dexOx
decreased as compared to the original dextran. This is likely
due to the cleavage of the dextran backbone with the
oxidation [28]. Similar results have been reported in the
oxidation of hyaluronic acid [19] and polyguluronate [13].
3.2. Preparation and characterization of dexOx hydrogels
Aqueous solutions of dexOx DO 15% were crosslinked
with various concentrations of adipic dihydrazide (5, 10 and
20% in molar ratio of AAD to glucose units on dextran) at
room temperature. The hydrazide group in AAD reacts with
the aldehyde groups in dexOx to form hydrazone bonds,
which can be hydrolyzed yielding again dexOx and AAD
(Fig. 6(A)). The hydrogels were soaked with 0.2 M citrate–
phosphate pH 5.0 for 48 h to release the unreacted AAD and
then lyophilised (at this pH the gels have long dissolution
time, see below). As shown in Table 2, the gel fractions of
dexOx hydrogels were ca. 100%. Therefore, most of the
dexOx derivatives formed covalent linkages with AAD.
This was further confirmed by FTIR spectroscopy.
According to Fig. 3(C), the FTIR spectrum of the hydrogel
shows the appearance of a band at 1663 cmK1 that
corresponds to the stretching vibration of the carbonyl
group in the hydrazone bonds as well the stretching of CaN
[11]. Furthermore, the band at 1550 cmK1 likely corre-
sponds to the bending of NH [29].
Gelation of the reaction mixtures was observed by
dynamic rheological measurements at a fixed frequency and
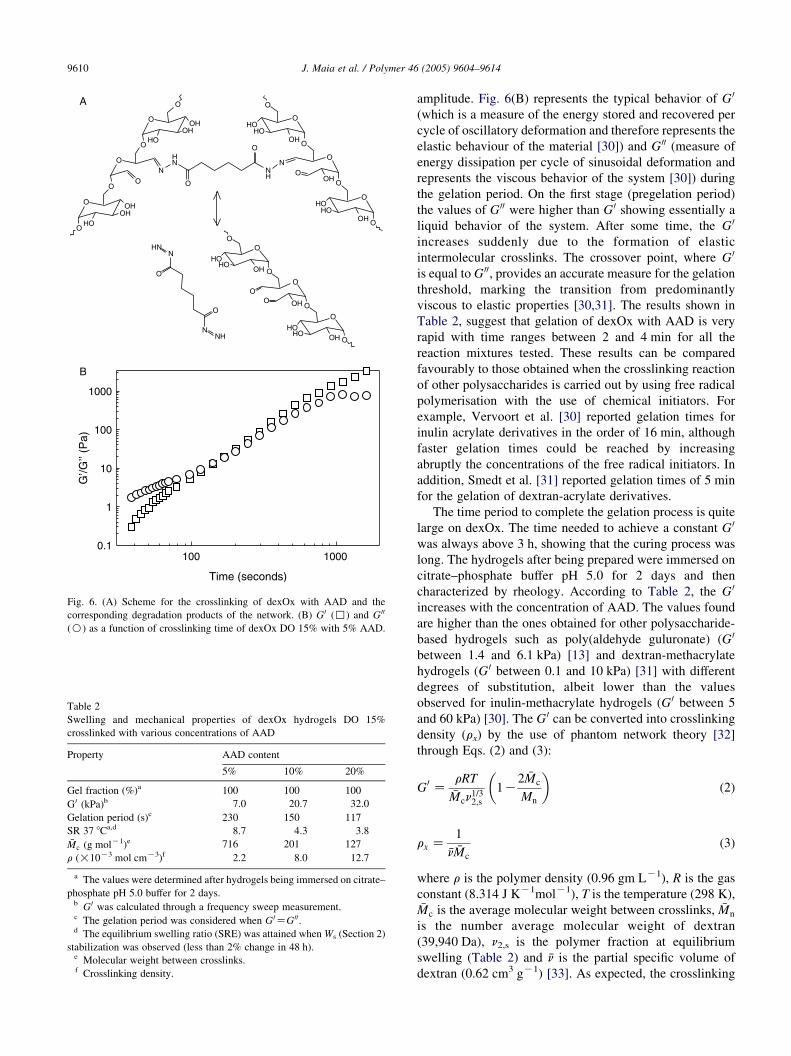
Fig. 6. (A) Scheme for the crosslinking of dexOx with AAD and the
corresponding degradation products of the network. (B) G0 (,) and G 00
(B) as a function of crosslinking time of dexOx DO 15% with 5% AAD.
Table 2
Swelling and mechanical properties of dexOx hydrogels DO 15%
crosslinked with various concentrations of AAD
Property AAD content
5% 10% 20%
Gel fraction (%)a 100 100 100
G 0 (kPa)b 7.0 20.7 32.0
Gelation period (s)c 230 150 117
SR 37 8Ca,d 8.7 4.3 3.8�Mc (g molK1)e 716 201 127
r (!10K3 mol cmK3)f 2.2 8.0 12.7
a The values were determined after hydrogels being immersed on citrate–
phosphate pH 5.0 buffer for 2 days.b G 0 was calculated through a frequency sweep measurement.c The gelation period was considered when G 0ZG 00.d The equilibrium swelling ratio (SRE) was attained when Ws (Section 2)
stabilization was observed (less than 2% change in 48 h).e Molecular weight between crosslinks.f Crosslinking density.
J. Maia et al. / Polymer 46 (2005) 9604–96149610
amplitude. Fig. 6(B) represents the typical behavior of G 0
(which is a measure of the energy stored and recovered per
cycle of oscillatory deformation and therefore represents the
elastic behaviour of the material [30]) and G 00 (measure of
energy dissipation per cycle of sinusoidal deformation and
represents the viscous behavior of the system [30]) during
the gelation period. On the first stage (pregelation period)
the values of G 00 were higher than G 0 showing essentially a
liquid behavior of the system. After some time, the G 0
increases suddenly due to the formation of elastic
intermolecular crosslinks. The crossover point, where G 0
is equal to G 00, provides an accurate measure for the gelation
threshold, marking the transition from predominantly
viscous to elastic properties [30,31]. The results shown in
Table 2, suggest that gelation of dexOx with AAD is very
rapid with time ranges between 2 and 4 min for all the
reaction mixtures tested. These results can be compared
favourably to those obtained when the crosslinking reaction
of other polysaccharides is carried out by using free radical
polymerisation with the use of chemical initiators. For
example, Vervoort et al. [30] reported gelation times for
inulin acrylate derivatives in the order of 16 min, although
faster gelation times could be reached by increasing
abruptly the concentrations of the free radical initiators. In
addition, Smedt et al. [31] reported gelation times of 5 min
for the gelation of dextran-acrylate derivatives.
The time period to complete the gelation process is quite
large on dexOx. The time needed to achieve a constant G 0
was always above 3 h, showing that the curing process was
long. The hydrogels after being prepared were immersed on
citrate–phosphate buffer pH 5.0 for 2 days and then
characterized by rheology. According to Table 2, the G 0
increases with the concentration of AAD. The values found
are higher than the ones obtained for other polysaccharide-
based hydrogels such as poly(aldehyde guluronate) (G 0
between 1.4 and 6.1 kPa) [13] and dextran-methacrylate
hydrogels (G 0 between 0.1 and 10 kPa) [31] with different
degrees of substitution, albeit lower than the values
observed for inulin-methacrylate hydrogels (G 0 between 5
and 60 kPa) [30]. The G 0 can be converted into crosslinking
density (rx) by the use of phantom network theory [32]
through Eqs. (2) and (3):
G0 ZrRT
�Mcn1=32;s
1K2 �Mc
Mn
� �(2)
rx Z1
�n �Mc
(3)
where r is the polymer density (0.96 gm LK1), R is the gas
constant (8.314 J KK1molK1), T is the temperature (298 K),�Mc is the average molecular weight between crosslinks, �Mn
is the number average molecular weight of dextran
(39,940 Da), n2,s is the polymer fraction at equilibrium
swelling (Table 2) and �n is the partial specific volume of
dextran (0.62 cm3 gK1) [33]. As expected, the crosslinking
J. Maia et al. / Polymer 46 (2005) 9604–9614 9611
density increases with the increasing concentration of AAD
in the hydrogel formulation. The values obtained are lower
than the ones obtained for oxidized polyguluronate [13] and
oxidized chondroitin gelatin hydrogels [34] but in these
cases the degree of oxidation of the initial polymer was
much higher (66.5% for polyguluronate and 40–60% for
chondroitin gelatin hydrogels).
The swelling of a hydrogel is of utmost importance in
biomedical and pharmaceutical applications since it
influences the solute diffusion coefficient through the
network, the surface properties and surface mobility and
the mechanical properties [35]. The swelling pattern of
dexOx DO 15% hydrogels crosslinked with 10% AAD was
characterized at different pH values. At pH 1.0, the
hydrogels undergo degradation in less than 2 h due to
hydrolysis of a-1,6 glucosidic linkages [33]. At pH 9.0, the
hydrogels are completely degraded in ca. 24 h, due to
hydrolysis of the hydrazone bonds. However, the degra-
dation at pH’s 3 and 5 was much slower, being the networks
completely solubilized after 40 and 50 days, respectively
(results not shown). At pH 5.0, the swelling ratio (SR) of
hydrogels decreases with the increase of AAD content
(Table 2). The swelling values at this pH are close to the
ones observed in dextran-acrylate hydrogels (SR between
8.6 and 3.7) [2], but lower than the values observed for
poly(aldehyde guluronate) hydrogels (SR between 12.6 and
15.3) [13] and networks obtained from oxidized hyaluronic
acid (SR between 25 and 65) [19].
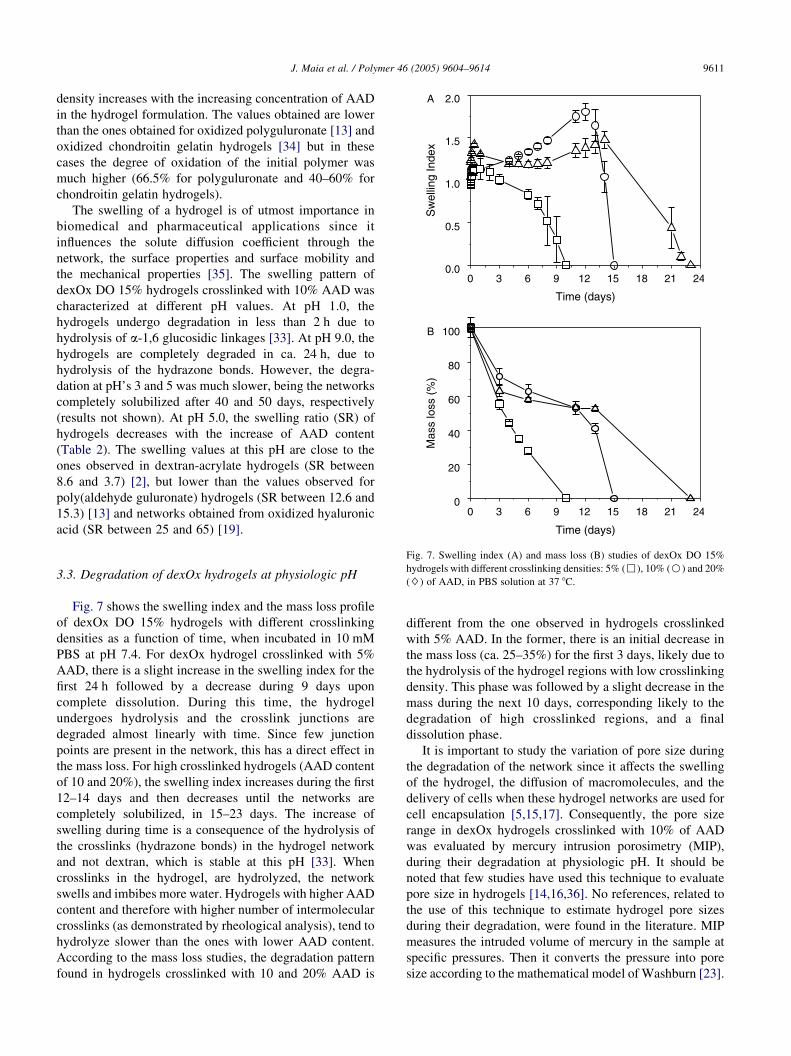
Fig. 7. Swelling index (A) and mass loss (B) studies of dexOx DO 15%
hydrogels with different crosslinking densities: 5% (,), 10% (B) and 20%
($) of AAD, in PBS solution at 37 8C.
3.3. Degradation of dexOx hydrogels at physiologic pHFig. 7 shows the swelling index and the mass loss profile
of dexOx DO 15% hydrogels with different crosslinking
densities as a function of time, when incubated in 10 mM
PBS at pH 7.4. For dexOx hydrogel crosslinked with 5%
AAD, there is a slight increase in the swelling index for the
first 24 h followed by a decrease during 9 days upon
complete dissolution. During this time, the hydrogel
undergoes hydrolysis and the crosslink junctions are
degraded almost linearly with time. Since few junction
points are present in the network, this has a direct effect in
the mass loss. For high crosslinked hydrogels (AAD content
of 10 and 20%), the swelling index increases during the first
12–14 days and then decreases until the networks are
completely solubilized, in 15–23 days. The increase of
swelling during time is a consequence of the hydrolysis of
the crosslinks (hydrazone bonds) in the hydrogel network
and not dextran, which is stable at this pH [33]. When
crosslinks in the hydrogel, are hydrolyzed, the network
swells and imbibes more water. Hydrogels with higher AAD
content and therefore with higher number of intermolecular
crosslinks (as demonstrated by rheological analysis), tend to
hydrolyze slower than the ones with lower AAD content.
According to the mass loss studies, the degradation pattern
found in hydrogels crosslinked with 10 and 20% AAD is
different from the one observed in hydrogels crosslinked
with 5% AAD. In the former, there is an initial decrease in
the mass loss (ca. 25–35%) for the first 3 days, likely due to
the hydrolysis of the hydrogel regions with low crosslinking
density. This phase was followed by a slight decrease in the
mass during the next 10 days, corresponding likely to the
degradation of high crosslinked regions, and a final
dissolution phase.
It is important to study the variation of pore size during
the degradation of the network since it affects the swelling
of the hydrogel, the diffusion of macromolecules, and the
delivery of cells when these hydrogel networks are used for
cell encapsulation [5,15,17]. Consequently, the pore size
range in dexOx hydrogels crosslinked with 10% of AAD
was evaluated by mercury intrusion porosimetry (MIP),
during their degradation at physiologic pH. It should be
noted that few studies have used this technique to evaluate
pore size in hydrogels [14,16,36]. No references, related to
the use of this technique to estimate hydrogel pore sizes
during their degradation, were found in the literature. MIP
measures the intruded volume of mercury in the sample at
specific pressures. Then it converts the pressure into pore
size according to the mathematical model of Washburn [23].
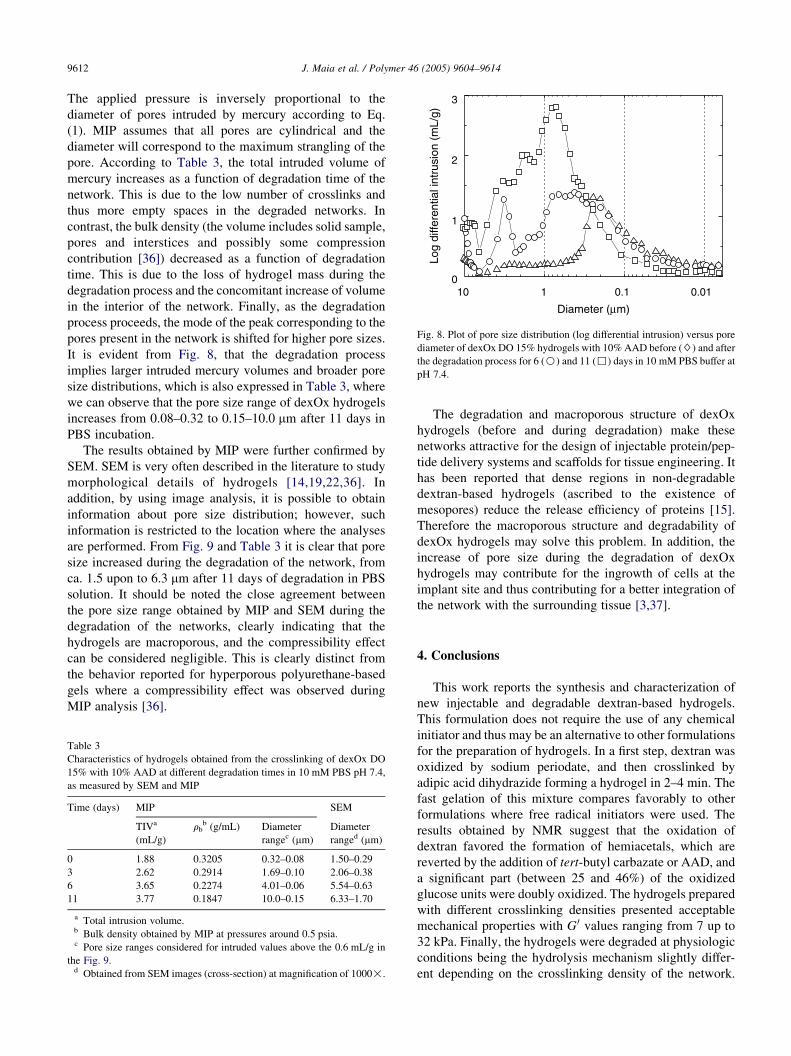
Fig. 8. Plot of pore size distribution (log differential intrusion) versus pore
diameter of dexOx DO 15% hydrogels with 10% AAD before ($) and after
the degradation process for 6 (B) and 11 (,) days in 10 mM PBS buffer at
pH 7.4.
J. Maia et al. / Polymer 46 (2005) 9604–96149612
The applied pressure is inversely proportional to the
diameter of pores intruded by mercury according to Eq.
(1). MIP assumes that all pores are cylindrical and the
diameter will correspond to the maximum strangling of the
pore. According to Table 3, the total intruded volume of
mercury increases as a function of degradation time of the
network. This is due to the low number of crosslinks and
thus more empty spaces in the degraded networks. In
contrast, the bulk density (the volume includes solid sample,
pores and interstices and possibly some compression
contribution [36]) decreased as a function of degradation
time. This is due to the loss of hydrogel mass during the
degradation process and the concomitant increase of volume
in the interior of the network. Finally, as the degradation
process proceeds, the mode of the peak corresponding to the
pores present in the network is shifted for higher pore sizes.
It is evident from Fig. 8, that the degradation process
implies larger intruded mercury volumes and broader pore
size distributions, which is also expressed in Table 3, where
we can observe that the pore size range of dexOx hydrogels
increases from 0.08–0.32 to 0.15–10.0 mm after 11 days in
PBS incubation.
The results obtained by MIP were further confirmed by
SEM. SEM is very often described in the literature to study
morphological details of hydrogels [14,19,22,36]. In
addition, by using image analysis, it is possible to obtain
information about pore size distribution; however, such
information is restricted to the location where the analyses
are performed. From Fig. 9 and Table 3 it is clear that pore
size increased during the degradation of the network, from
ca. 1.5 upon to 6.3 mm after 11 days of degradation in PBS
solution. It should be noted the close agreement between
the pore size range obtained by MIP and SEM during the
degradation of the networks, clearly indicating that the
hydrogels are macroporous, and the compressibility effect
can be considered negligible. This is clearly distinct from
the behavior reported for hyperporous polyurethane-based
gels where a compressibility effect was observed during
MIP analysis [36].
Table 3
Characteristics of hydrogels obtained from the crosslinking of dexOx DO
15% with 10% AAD at different degradation times in 10 mM PBS pH 7.4,
as measured by SEM and MIP
Time (days) MIP SEM
TIVa
(mL/g)
rbb (g/mL) Diameter
rangec (mm)
Diameter
ranged (mm)
0 1.88 0.3205 0.32–0.08 1.50–0.29
3 2.62 0.2914 1.69–0.10 2.06–0.38
6 3.65 0.2274 4.01–0.06 5.54–0.63
11 3.77 0.1847 10.0–0.15 6.33–1.70
a Total intrusion volume.b Bulk density obtained by MIP at pressures around 0.5 psia.c Pore size ranges considered for intruded values above the 0.6 mL/g in
the Fig. 9.d Obtained from SEM images (cross-section) at magnification of 1000!.
The degradation and macroporous structure of dexOx
hydrogels (before and during degradation) make these
networks attractive for the design of injectable protein/pep-
tide delivery systems and scaffolds for tissue engineering. It
has been reported that dense regions in non-degradable
dextran-based hydrogels (ascribed to the existence of
mesopores) reduce the release efficiency of proteins [15].
Therefore the macroporous structure and degradability of
dexOx hydrogels may solve this problem. In addition, the
increase of pore size during the degradation of dexOx
hydrogels may contribute for the ingrowth of cells at the
implant site and thus contributing for a better integration of
the network with the surrounding tissue [3,37].
4. Conclusions
This work reports the synthesis and characterization of
new injectable and degradable dextran-based hydrogels.
This formulation does not require the use of any chemical
initiator and thus may be an alternative to other formulations
for the preparation of hydrogels. In a first step, dextran was
oxidized by sodium periodate, and then crosslinked by
adipic acid dihydrazide forming a hydrogel in 2–4 min. The
fast gelation of this mixture compares favorably to other
formulations where free radical initiators were used. The
results obtained by NMR suggest that the oxidation of
dextran favored the formation of hemiacetals, which are
reverted by the addition of tert-butyl carbazate or AAD, and
a significant part (between 25 and 46%) of the oxidized
glucose units were doubly oxidized. The hydrogels prepared
with different crosslinking densities presented acceptable
mechanical properties with G 0 values ranging from 7 up to
32 kPa. Finally, the hydrogels were degraded at physiologic
conditions being the hydrolysis mechanism slightly differ-
ent depending on the crosslinking density of the network.
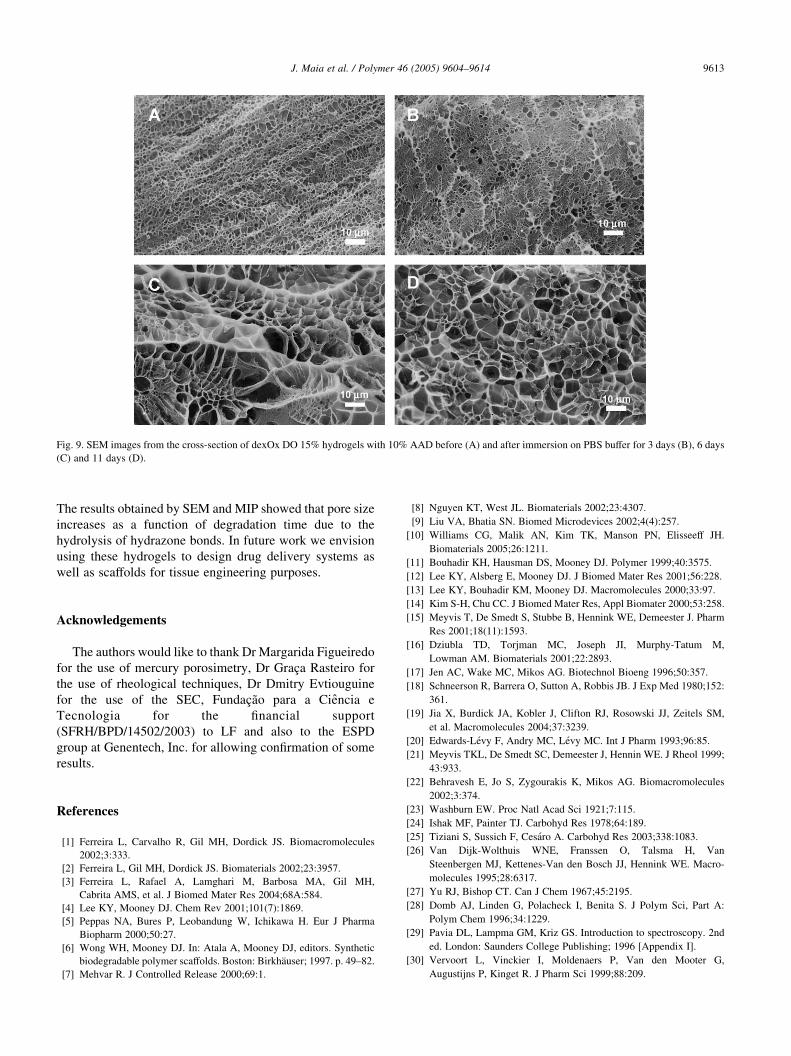
Fig. 9. SEM images from the cross-section of dexOx DO 15% hydrogels with 10% AAD before (A) and after immersion on PBS buffer for 3 days (B), 6 days
(C) and 11 days (D).
J. Maia et al. / Polymer 46 (2005) 9604–9614 9613
The results obtained by SEM and MIP showed that pore size
increases as a function of degradation time due to the
hydrolysis of hydrazone bonds. In future work we envision
using these hydrogels to design drug delivery systems as
well as scaffolds for tissue engineering purposes.
Acknowledgements
The authors would like to thank Dr Margarida Figueiredo
for the use of mercury porosimetry, Dr Graca Rasteiro for
the use of rheological techniques, Dr Dmitry Evtiouguine
for the use of the SEC, Fundacao para a Ciencia e
Tecnologia for the financial support
(SFRH/BPD/14502/2003) to LF and also to the ESPD
group at Genentech, Inc. for allowing confirmation of some
results.
References
[1] Ferreira L, Carvalho R, Gil MH, Dordick JS. Biomacromolecules
2002;3:333.
[2] Ferreira L, Gil MH, Dordick JS. Biomaterials 2002;23:3957.
[3] Ferreira L, Rafael A, Lamghari M, Barbosa MA, Gil MH,
Cabrita AMS, et al. J Biomed Mater Res 2004;68A:584.
[4] Lee KY, Mooney DJ. Chem Rev 2001;101(7):1869.
[5] Peppas NA, Bures P, Leobandung W, Ichikawa H. Eur J Pharma
Biopharm 2000;50:27.
[6] Wong WH, Mooney DJ. In: Atala A, Mooney DJ, editors. Synthetic
biodegradable polymer scaffolds. Boston: Birkhauser; 1997. p. 49–82.
[7] Mehvar R. J Controlled Release 2000;69:1.
[8] Nguyen KT, West JL. Biomaterials 2002;23:4307.
[9] Liu VA, Bhatia SN. Biomed Microdevices 2002;4(4):257.
[10] Williams CG, Malik AN, Kim TK, Manson PN, Elisseeff JH.
Biomaterials 2005;26:1211.
[11] Bouhadir KH, Hausman DS, Mooney DJ. Polymer 1999;40:3575.
[12] Lee KY, Alsberg E, Mooney DJ. J Biomed Mater Res 2001;56:228.
[13] Lee KY, Bouhadir KM, Mooney DJ. Macromolecules 2000;33:97.
[14] Kim S-H, Chu CC. J Biomed Mater Res, Appl Biomater 2000;53:258.
[15] Meyvis T, De Smedt S, Stubbe B, Hennink WE, Demeester J. Pharm
Res 2001;18(11):1593.
[16] Dziubla TD, Torjman MC, Joseph JI, Murphy-Tatum M,
Lowman AM. Biomaterials 2001;22:2893.
[17] Jen AC, Wake MC, Mikos AG. Biotechnol Bioeng 1996;50:357.
[18] Schneerson R, Barrera O, Sutton A, Robbis JB. J Exp Med 1980;152:
361.
[19] Jia X, Burdick JA, Kobler J, Clifton RJ, Rosowski JJ, Zeitels SM,
et al. Macromolecules 2004;37:3239.
[20] Edwards-Levy F, Andry MC, Levy MC. Int J Pharm 1993;96:85.
[21] Meyvis TKL, De Smedt SC, Demeester J, Hennin WE. J Rheol 1999;
43:933.
[22] Behravesh E, Jo S, Zygourakis K, Mikos AG. Biomacromolecules
2002;3:374.
[23] Washburn EW. Proc Natl Acad Sci 1921;7:115.
[24] Ishak MF, Painter TJ. Carbohyd Res 1978;64:189.
[25] Tiziani S, Sussich F, Cesaro A. Carbohyd Res 2003;338:1083.
[26] Van Dijk-Wolthuis WNE, Franssen O, Talsma H, Van
Steenbergen MJ, Kettenes-Van den Bosch JJ, Hennink WE. Macro-
molecules 1995;28:6317.
[27] Yu RJ, Bishop CT. Can J Chem 1967;45:2195.
[28] Domb AJ, Linden G, Polacheck I, Benita S. J Polym Sci, Part A:
Polym Chem 1996;34:1229.
[29] Pavia DL, Lampma GM, Kriz GS. Introduction to spectroscopy. 2nd
ed. London: Saunders College Publishing; 1996 [Appendix I].
[30] Vervoort L, Vinckier I, Moldenaers P, Van den Mooter G,
Augustijns P, Kinget R. J Pharm Sci 1999;88:209.
J. Maia et al. / Polymer 46 (2005) 9604–96149614
[31] Smedt SCD, Lauwers A, Demeester J, Van Steenbergen MJ,
Hennink WE, Roefs SPFM. Macromolecules 1995;28:5082.
[32] Bell CL, Peppas NA. Adv Polym Sci 1995;122:125.
[33] Van Dijk-Wolthuis WNE, Hoogeboom JAM, Van Steenbergen MJ,
Tsang SKY, Hennink WE. Macromolecules 1997;30:4639.
[34] Dawlee S, Sugandhi A, Balakrishnan B, Labarre D, Jayakrishnan A.
Biomacromolecules 2005;6:2040.
[35] Peppas NA. Hydrogels. In: Ratner BD, Hoffman AS, Schoen FJ,
Lemons JE, editors. Biomaterials science: An introduction to
materials in medicine. London: Academic Press; 1996. p. 60.
[36] Pirard R, Rigacci A, Marechal JC, Quenard D, Chevalier B, Achard P,
et al. Polymer 2003;44:4881.
[37] Ferreira L, Gil MH, Cabrita AMS, Dordick JS. Biomaterials 2005;26:
4707.