Embed Size (px)
Citation preview
Paolo Verderio N°: 744966
PhD thesis
Synthesis and Biofunctionalization of Novel
Composite Nanocarriers for Targeted Detection and
Treatment of Malignant Cells
Submitted for the degree of Doctor of Philosophy
at the University of Milano-Bicocca
School of Doctorate in Chemical Sciences
XXVI Course
University of Milano-Bicocca
Years 2011−2013
Synthesis and Biofunctionalization of Novel Composite
Nanocarriers for Targeted Detection and Treatment of
Malignant Cells
PhD thesis by Paolo Verderio
University of Milano-Bicocca
Dept. of Biotechnology and Bioscience U3, building P. za. Della Scienza, 2, 20126, Milano (Mi), Italy
Approved by:
Prof. Giorgio Moro University of Milano-Bicocca, 20126 Milano (Italy) (School Coordinator)
International Reviewers: Prof. Wolfgang Parak Philipps Universität of Marburg, Biegenstraße 10, D-35032 Marburg (Germany)
Prof. Victor Franco Puntes Institut Català de Nanociència, Universitat Autònoma de Barcelona, 08193 Bellaterra (Spain)
Advisory Committee Prof. Francesco Nicotra University of Milano-Bicocca, 20126 Milano (Italy)
Dr. Francesca Baldelli Bombelli University of East Anglia, Norwich Research Park, NR4 7TJ Norwich (United Kingdom)
Dr. Ivano Eberini University of Milan, Dipartimento di Scienze Farmacologiche, 20133 Milano (Italy)
Dr. Giorgio Colombo ICRM, Instituto di Chimica del Riconoscimento Molecolare, 20131 Milano (Italy)
Dr. Carlo Morasso Fondazione ONLUS Carlo Don Gnocchi, 20121 Milano (Italy)
Date of PhD Thesis submission: January 2014

“The Nature investigation resembles loads of unraveled intricate threads, where a key combination is important
almost as well as the skill and the sharpness of observation. The work of the scientist is exciting as it is for the hunter to chase a unknown game in accidental circumstances”
Ernst Walfried Josef Wenzel Mach (1838−1916)

List of abbreviations
7AAD 7-aminoactinomycin D ADCC Antibody-dependent cellular cytotoxicity A549 Adenocarcinomic human alveolar basal epithelial cells APTMS 3-aminopropyl trimethoxy silane APTES 3-aminopropyl triethoxy silane ATF Amino terminal fragment B2O3 Boric oxide BCA Bicinchoninic acid BSA Bovine serum albumin CH3COOH Acetic acid CHCl3 Chloroform CH2Cl2 Methylene Chloride CLSM Confocal Laser scanning microscopy CMC Critical micelle concentration CTAB Cetyl trimethylammonium bromide DAPI 4′,6-diamidino-2-phenylindole DCS Differential centrifuge sedimentation DiD Oil Red O Staining (confocal staining for membranes) DLS Dynamic light scattering DMF Dimethyl formamide DMSO Dimethyl sulfoxide DMEM Dulbecco’s Modified Eagle’s medium (cell cultures) DNA Deoxyribonucleic acid DOX Doxorubicin DTT Dithiothreitol DTNB 5,5'-Dithio-bis-(2-nitrobenzoic acid) EDBE (2,2-(ethylenedioxy)bisethylamine EDC 1-Ethyl-3-(3-dimethylaminopropyl)carbodiimide EDTA Ethylenediaminetetraacetic acid EE (%) Encapsulation efficiency in percentage EGFR Epidermal growth factor receptor EPR Enhanced permeation and retention effect EtOH Ethanol EO Ethylene oxide monomers ER Estrogen receptor ErbB The epidermal growth factor receptor (EGFR) is the founding member of the ErbB family Et2O Diethyl ether FACS Fluorescence Activated Cell Sorting (in this) Fc The fragment crystallizable region (Fc region) is the tail region of an antibody FDA Food and drug Administration FBS Fetal bovine serum Fe3O4 Magnetite γ-Fe2O3 Maghemite FITC Fluorescein isothiocyanate FRET Förster resonance energy transfer FT-IR Fourier Transform Infra-Red spectra G1 Growth 1 phase of the cell cycle G2/M Gap2 and mitosis cell cycle phase g Grams GFD Growth factor domain GST Glutathione S-transferase HALO Haloalkane dehalogenase protein designed to covalently bind to synthetic ligands Hc Coercive field HCl Hydrochloridic acid HER2 Human Epidermal growth factor receptor 2 HepG2 Liver hepatocellular carcinoma cells His_Tag Oligohistidine affinity tag

HRP Enzyme horseradish peroxidase HSA Human serum albumin K Kelvin (unit for temperature) Ku Anisotropy constant IEP Isoelectric point IPTES 3-isocyanatepropyl triethoxy silane ICAM1 Intercellular adhesion molecule 1 mAb Monoclonal antibody mg Milligrams μg Micrograms M Molar concentration mM Millimolar concentration μM Micromolar concentration MAPK Mitogen-activated protein kinase MCF7 Michigan Cancer Foundation-7; HER2 positive breast cancer cell line MDA-MB231 Mammary gland/breast; derived from metastatic site: pleural effusion; HER2 negative MDA-MB468 Mammary gland/breast adenocarcinoma; HER2 negative MeOH Methanol MMPs Matrix-metalloproteinase MNPs Magnetic iron oxide nanoparticles MRI Magnetic resonance imaging MS−PEG4 Methyl-PEG4-NHS Ester MTT 3-(4,5-dimethylthiazol-2-yl)-2,5-diphenyltetrazolium bromide Ms Saturation magnetization MR Remanent magnetization Mz Magnetization Mwco Medium weight cut off NaOH Sodium hydroxide NCBI National Center for Biotechnology Information NHS N-hydroxysuccinimide NMR Nuclear magnetic resonance NaH Sodium hydride NPs Nanoparticles NTA Nitrilotriacetic acid PBS Phosphate buffer solution PDI Polydispersity index PTX Paclitaxel PEG Poly ethylene glycol PLGA Polylactide-co-glycolide acid PCNPs Polymeric curcumin nanoparticles PMA Poly(isobutylene-alt-maleic anhydride) PR Progesterone receptor PVA Polyvinyl alcohol PVP Polyvinyl pyrrolidone PVC Polyvinyl chloride PNIPAM poly(N-isopropylacrylamide-methacrylate) RNA Ribonucleic acid RES Reticulo endothelial system ROS Reactive oxygen species rSP Superparamagnetic radius RPMI Cell culture medium used for the culture of human normal and neoplastic leukocytes RT Room temperature SBB Sodium borate buffer scFV Portion of the whole antibody SDS-PAGE Sodium Dodecyl Sulphate - PolyAcrylamide Gel Electrophoresis SEM Scanning electron microscopy SiNPs Silica nanoparticles siRNA short interfering RNA SM−PEG8 NHS ester-PEG8-Maleimide SPDP 3-(2-pyridyldithio)propionate SPM Superparamagnetic material TCEP tris(2- carboxyethyl)phosphine
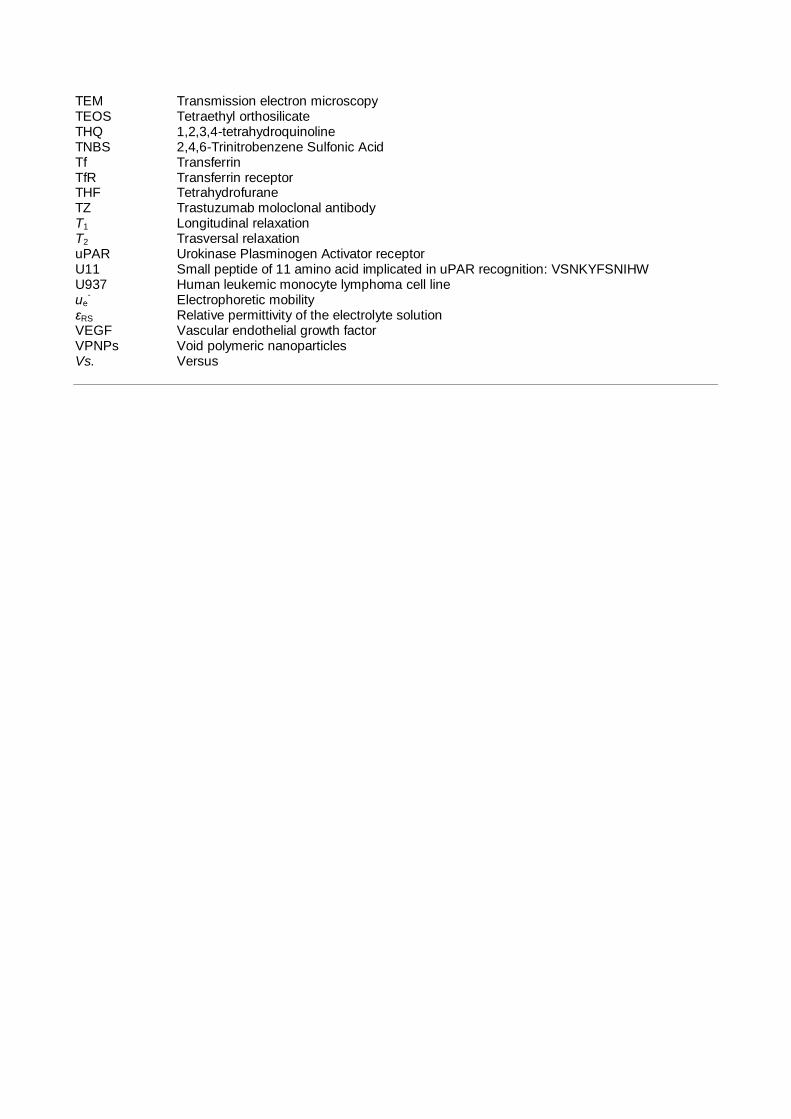
TEM Transmission electron microscopy TEOS Tetraethyl orthosilicate THQ 1,2,3,4-tetrahydroquinoline TNBS 2,4,6-Trinitrobenzene Sulfonic Acid Tf Transferrin TfR Transferrin receptor THF Tetrahydrofurane TZ Trastuzumab moloclonal antibody T1 Longitudinal relaxation T2 Trasversal relaxation uPAR Urokinase Plasminogen Activator receptor U11 Small peptide of 11 amino acid implicated in uPAR recognition: VSNKYFSNIHW U937 Human leukemic monocyte lymphoma cell line ue
- Electrophoretic mobility
εRS Relative permittivity of the electrolyte solution VEGF Vascular endothelial growth factor VPNPs Void polymeric nanoparticles Vs. Versus

Summary
i
SUMMARY
Summary
ii
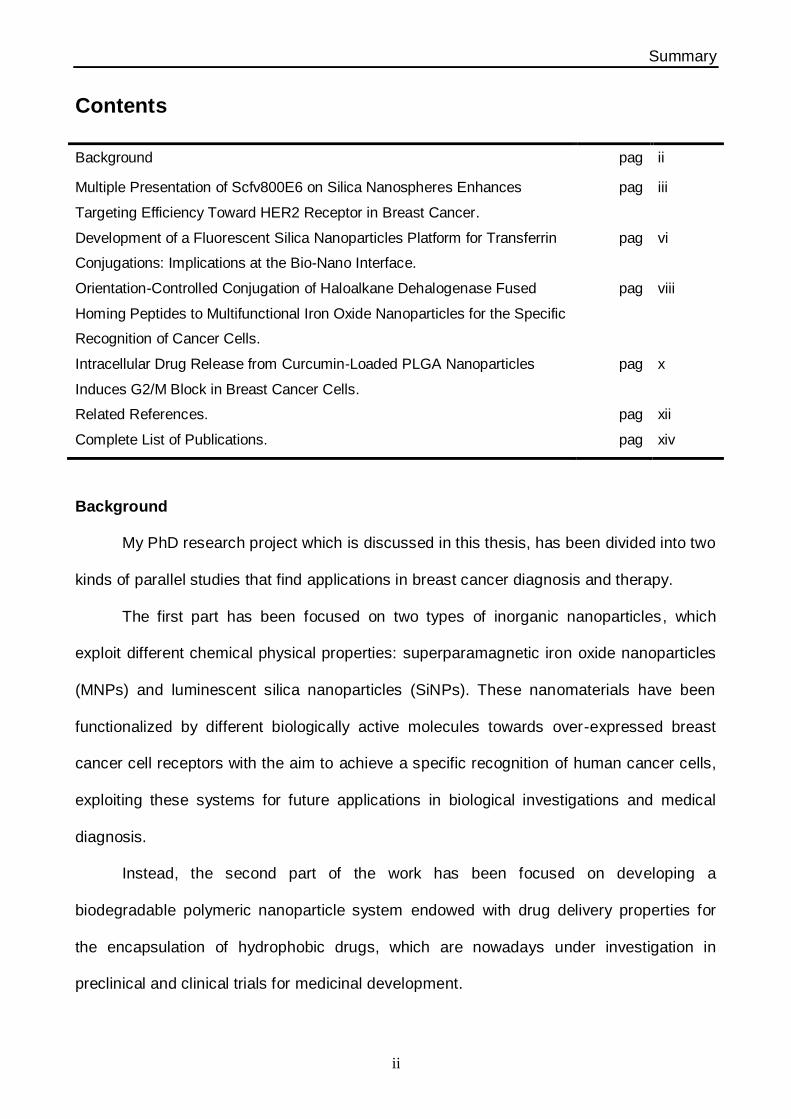
Contents
Background pag ii
Multiple Presentation of Scfv800E6 on Silica Nanospheres Enhances
Targeting Efficiency Toward HER2 Receptor in Breast Cancer.
pag iii
Development of a Fluorescent Silica Nanoparticles Platform for Transferrin
Conjugations: Implications at the Bio-Nano Interface.
pag vi
Orientation-Controlled Conjugation of Haloalkane Dehalogenase Fused
Homing Peptides to Multifunctional Iron Oxide Nanoparticles for the Specific
Recognition of Cancer Cells.
pag viii
Intracellular Drug Release from Curcumin-Loaded PLGA Nanoparticles
Induces G2/M Block in Breast Cancer Cells.
pag x
Related References. pag xii
Complete List of Publications. pag xiv
Background
My PhD research project which is discussed in this thesis, has been divided into two
kinds of parallel studies that find applications in breast cancer diagnosis and therapy.
The first part has been focused on two types of inorganic nanoparticles, which
exploit different chemical physical properties: superparamagnetic iron oxide nanoparticles
(MNPs) and luminescent silica nanoparticles (SiNPs). These nanomaterials have been
functionalized by different biologically active molecules towards over-expressed breast
cancer cell receptors with the aim to achieve a specific recognition of human cancer cells,
exploiting these systems for future applications in biological investigations and medical
diagnosis.
Instead, the second part of the work has been focused on developing a
biodegradable polymeric nanoparticle system endowed with drug delivery properties for
the encapsulation of hydrophobic drugs, which are nowadays under investigation in
preclinical and clinical trials for medicinal development.
Summary
iii
For both subsets, chemical characterizations and biological studies on cells have
been the framework to understand nanoparticles behavior towards their diagnostic or
therapeutic goals. These studies have been accomplished in collaboration with my
Biologist coworkers at the NanoBioLab in the research group of Dr. Davide Prosperi,
Department of Biotechnology and Bioscience (University of Milano-Bicocca, Italy) and the
Department of Biomedical and Clinic Science, Hospital “Luigi Sacco” (University of Milan,
Italy). Part of this thesis has been carried out during the second year of the PhD school as
a visitor at the CBNI, Center for Bio-Nano Interactions, Department of Chemical Biology
(University College of Dublin, Ireland) under the supervision of Prof. Kenneth A. Dawson.
Briefly, in this summary, the reader could find an overlook within aims and how the
research has been developed to run forward these goals. I hope the reader will find in my
thesis elements that could elicit interest and curiosity; I will be very pleased if he/she will
accurately inspected all fields in a critical point of view to take the cue for a scientific
discussion about proposed results.
Multiple Presentation of Scfv800E6 on Silica Nanospheres Enhances Targeting
Efficiency Toward HER2 Receptor in Breast Cancer
Nanomedicine, or Nanobiotechnology, defined as the biomedical application of
materials at the nanometer scale, is a rapidly developing area of nanotechnology, which
involves the creation and then use of materials and devices at the level of atoms and
molecules. Nanomaterials within the range of 1–200 nm possess a great potential for
biomedical application through the complementary combination of chemical/physical and
size-dependent properties, which are not observed at the molecular level or in bulk phase
but modulate significant interactions with biological molecular systems. The fabrication of
high quality hybrid inorganic nanoparticles endowed with distinguished inherent magnetic
and/or optical properties represents a promising new advance for the development of a
Summary
iv
novel generation of diagnostic agents for biosensing, preclinical investigations and clinical
use, in turn leading to a new discipline of nano-oncology [1].
At present, mammary carcinoma is the second most common type of malignant
tumor in adult women after lung cancer, as more than one million women are diagnosed
with breast cancer every year. Despite many advances in diagnosis and treatment [2−4],
which have resulted in a decrease in mortality in recent decades, this pathology remains a
major public health problem. One of the most significant unresolved clinical and scientific
problems is the occurrence of resistance to clinical treatments and their toxicity (and how
to predict, prevent and overcome them). Unfortunately, the heterogeneity of human breast
cancer in terms of genetic features, molecular profiles and clinical behaviour represents a
great hurdle obstructing the discovery of a resolved solution to the disease. It is currently
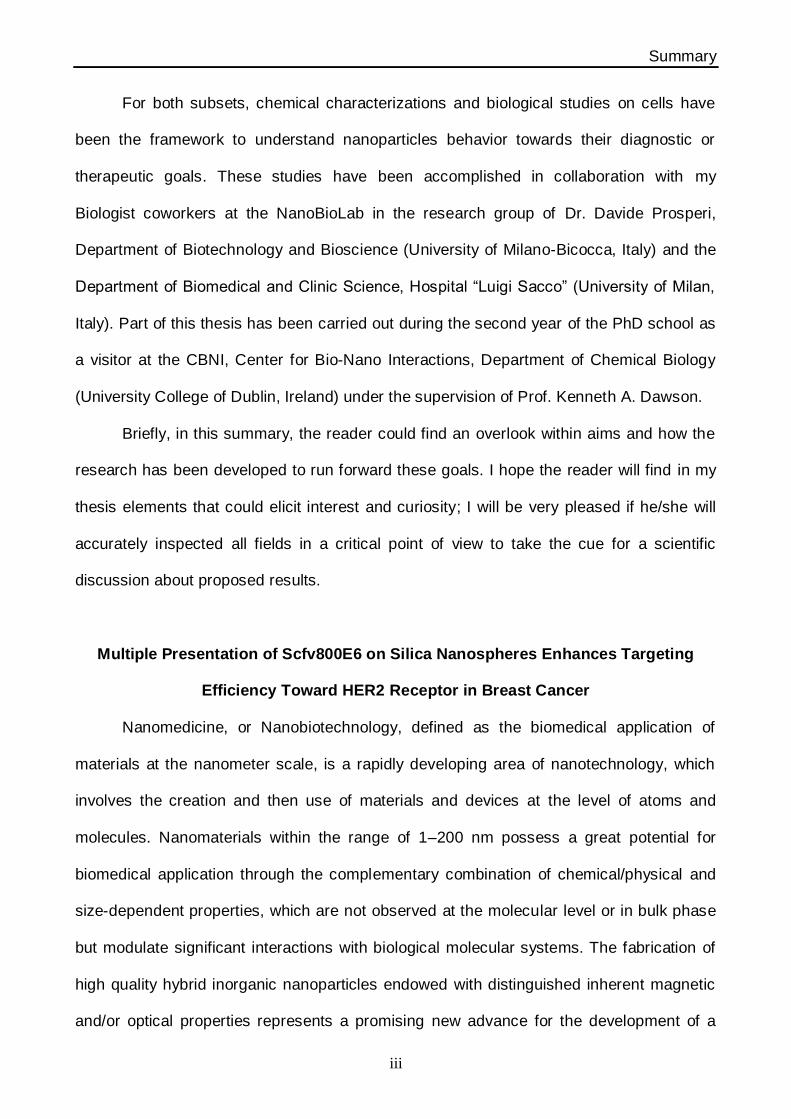
considered that chances of success of therapies may increase if the tumor cells are
selectively removed before they can evolve to their mature stages up to metastases
production [5] (Figure.
1).
Therefore, novel and
more sensitive
diagnostic tools are
being developed, with
the aim of improving the
early and not-invasive
detection of rising
malignancies and the
accuracy of tumor tissue
localization. In parallel,
Figure 1: Gompertzian growth curve of a solid tumor and its relationship to cancer detection.
Number of malignant cells (ordinate) as a function of time (abscissa). The transition from first lag to log phase of growth, associated with the transition from diffusion-
limited nutrition to neurovascularization, is labelled “angiogenic switch”. Remission is shown as the uncertainly of cell number ranging from zero to the current clinical treshold for cancer detection (approximately 10
9 cells growing as a single mass)
Summary
v
there is an emerging use of targeted therapies in oncology, depending on the expression
of specific proteins or genes recovered in tumor cells. Among the molecular targets
considered for the treatment of breast cancer cells so far, our group chose to focus on
examples involving over-expression and/or gene amplification of “Human Epidermal
growth factor Receptor 2” (HER2) protein [6,7]. In current studies, various types of
nanoparticles conjugated with the anti-HER2 monoclonal antibody, the so-called
“trastuzumab”, are under investigation extensively due to promising results in biological
and preclinical applications aimed at improving the treatment of breast cancer [8−11]. In
this part of my PhD research I will present the preparation and development of small silica
nanoparticles (SiNPs ≈ 60 nm) functionalized with a portion of the whole antibody
Trastuzumab, named scFv800E6, preliminary engineered and produced in yeast Pichia
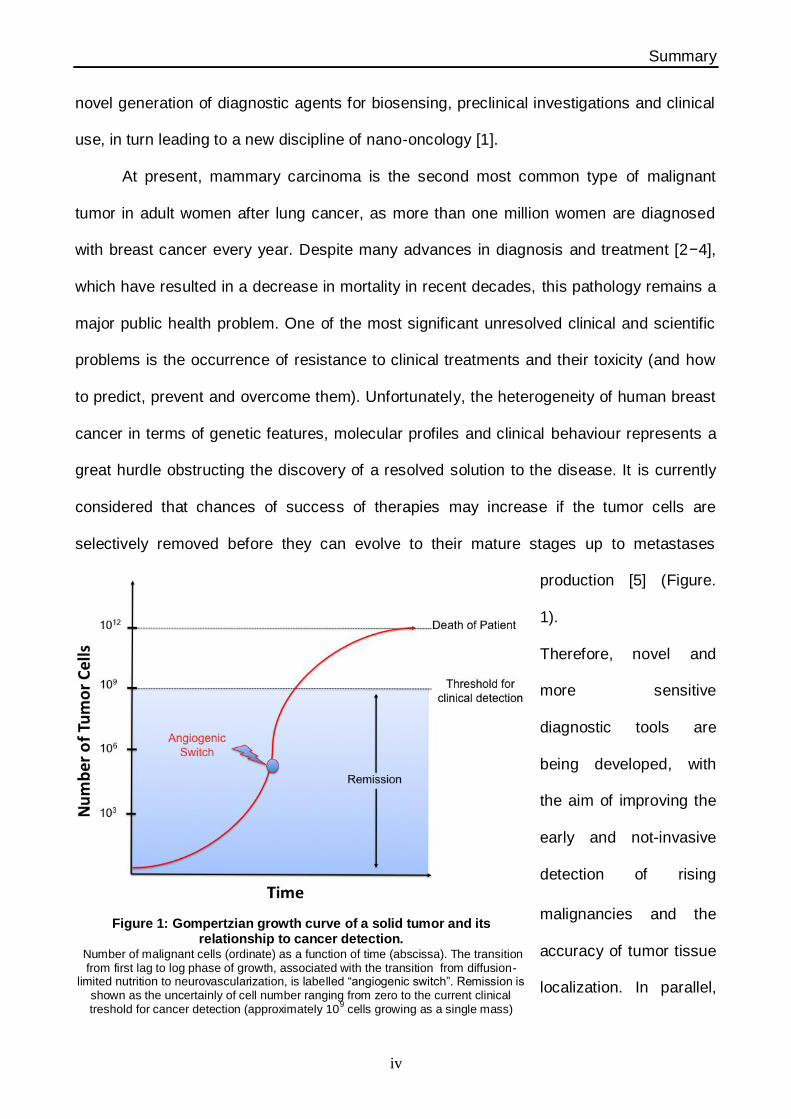
pastoris [12], that recognizes the breast cancer membrane marker HER2. The chemistry of
functionalization resulted by both localized histidine-tag recognition, leading to an oriented
protein ligation, and glutaraldehyde cross-linking, exploiting a statistical reactivity of lysine
amine groups in the primary sequence of the molecule (Figure. 2).
Figure 2: SiNPs synthesized and functionalized with anti-HER-2 scFv800E6 antibody The chemical functionalization has been performed by both histidine-tag recognition (scFv oriented ligation) and
glutaraldehyde cross-linking (unoriented ligation).
Summary
vi
For instance, I would like to present a strategy to enhance scFvs target binding
efficacy that makes use of silica nanoparticles as a multimerization scaffold. The aim of
this work, was to correlate the chemical functionalization of SiNPs with their targeting
capability; particular emphasis has been placed on the diagnostic potential of this
generation of hybrid nanoparticles, exploiting the multifaceted mechanisms of action of
small fragments of trastuzumab, in comparison with free scFv and the whole antibody,
against malignant cells. In this way, the targeting efficiency of nanocomplexes has been
evaluated using a HER2 antigen-positive MCF7 breast cancer cell line, exhibiting a 4-fold
increase in scFv binding efficacy, close to the affinity of intact anti-HER2 monoclonal
antibody, which suggests the effectiveness of presenting multiple scFv molecules on
nanoparticles thus improving antigen recognition.
Development of a Fluorescent Silica Nanoparticles Platform for Transferrin
Conjugations: Implications at the Bio-Nano Interface
The metabolism of iron by cancer cells often may lead to over-expression of
transferrin receptor (TfR) [13], making transferrin (Tf), a 79 kDa glycoprotein that binds TfR
at extracellular pH, [14] a potential targeting molecule. Previous investigations with
Transferrin-targeted nanoparticles have sometimes given inconsistent results, and
problems such as linker stability and protein flexibility have been identified [15,16]; in this
way some nanoparticle types fail to target the relevant pathway, even though they enter
cells efficiently.
The detailed (in situ) structure of the nanoparticle interface with the full biological
environment (both target and biological milieu) is critical in determining this outcome. Prof.
Kenneth Dawson’s group, where this part of my work took place as a visiting student, has
recently validated a method to discriminate this bio-nano interface, which could strongly
influence the active targeting of TfrR. Using 50 nm transferrin-conjugated core-shell

Summary
vii
fluorescent SiNPs, they found that proteins in the media can shield transferrin from binding
to both its targeted receptors on cells and soluble transferrin receptors. In this way, the
formation of a “protein corona” can be an example to “screen” the targeting molecules on
the surface of nanoparticles and evaluate the loss of specificity in receptor targeting [17].
My work has been focused on the synthetic optimization of spherical 20−30 nm
core−shell fluorescent SiNPs, prepared by the Stöber hydrolysis and co-condensation of
tetraethyl orthosilicate with N-1-(3-trimethoxysilylpropyl)-N′-fluoresceyl thiourea (APTMS-
FITC) followed by the growing of second silica shell (5 nm thickness) in order to further
protect dye photo−bleaching. After NPs synthesis, the surface has been modified with a
great amount of amino groups an external functionality. The reactive amount of amine with
has been reduced gradually prior to SM-PEG8 coupling by reaction with a short inert PEG
composed by 4 units (called MS-PEG4); the organic moiety has been attached with the
usual peptide coupling while the opposite part of the linker exploited an inhert methoxyl
group. Later on, a heterobifunctional PEG composed by 8 units (called SM-PEG8)
exploiting an N-hydroxysuccinimide (NHS) and a maleimide (MaL) ring, has been attached
and used for the following protein conjugation. Human Tf modified with a thiol–PEG linker
was conjugated to the PEGylated particle to give fluorescent bioconjugates. Cellular study
of TfR binding revealed a correlation between the number of amino groups and the active
targeting of the receptor. In this study, RNA interference was used in parallel to silence the
expression of TfR in human A549 lung epithelial cells in order to determine the effect of
TfR on nanoparticle uptake. I emphasize that the absolute uptake level does not give
information on the specificity of these interactions. However, the difference in particle
uptake in silenced and non-silenced cells is indicative of the relative contribution made by
that pathway. I would like to point out that this subproject is ongoing and all my final
considerations about the experimental details will need to be completed with further and
more accurate results. Unfortunately, the lack of time did not allow me to complete the

Summary
viii
whole experimental part during my visiting PhD collaboration at the CBNI and thus is now
ongoing.
Orientation-Controlled Conjugation of Haloalkane Dehalogenase Fused Homing
Peptides to Multifunctional Iron Oxide Nanoparticles for the Specific Recognition of
Cancer Cells
Hybrid multifunctional iron oxide nanoparticles, which combine unique
superparamagnetic properties and fluorescence emission, have been investigated as
promising bimodal tracers for non-invasive diagnosis of cancer both in vitro and in vivo
[18−21]. The design of ideal targeted iron oxide nanoparticles needs careful optimization
of fundamental features including uniform size and shape [22], surface charge [23], optical
and magnetic properties [24,25], and efficient functionalization with suitable homing
ligands [26–28] to improve the signal amplification and target selectivity toward malignant
cells. When the ligands are complex molecules, such as proteins, their proper orientation
on the surface of nanoparticles becomes a crucial factor for maximizing the affinity for their
molecular counterparts. According to this purpose, recently several different approaches
have been explored to check ligand positioning, including oriented immobilization on
MNPs driven by recombinant protein linkers [29,30]; conjugation mediated by affinity tags
inserted into the protein primary sequence [31,32] and site-specific chemo-selective
ligation [33,34].
A new modern approach, called Halo Tag technology, is being widely applied for
cellular imaging, protein quantification and interaction analysis. It is designed for rapid,
side-specific labeling of proteins in living cells; basically it is based on the efficient
formation of a covalent bond between the Halo Tag protein and synthetic ligands [35]. The
Halo-Tag protein is a catalytically inactive, genetically modified derivative of a hydrolase
protein; this protein is used to generate N- or C-terminal fusions that can be efficiently
Summary
ix
expressed in a variety of cell types. The Halo Tag ligands are small chemical tags,
containing two crucial components: a common Halo Tag reactive linker that initiates
formation of the covalent bond (chlorine) and functional reporter such as a thiol or amino-
group for a fast and selective conjugation on the surface of a nanomaterial. The rate of the
ligand-protein binding is remarkably fast and the covalent bond formed is highly specific
and irreversible.
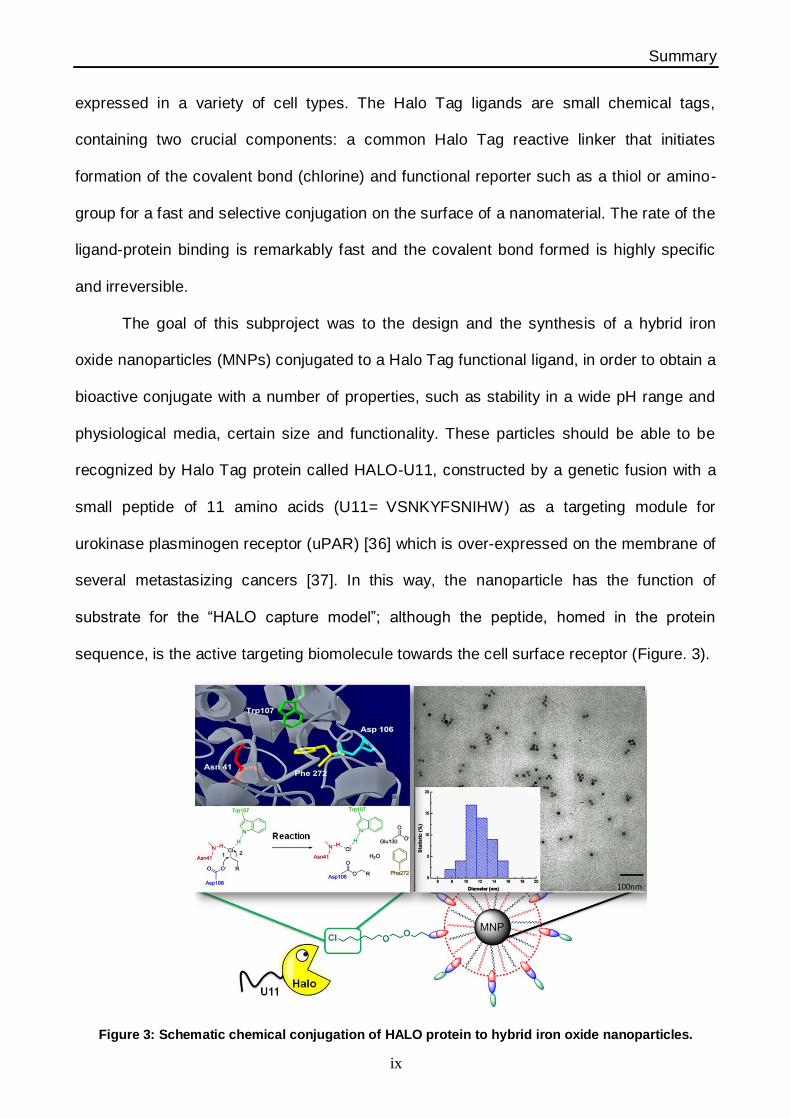
The goal of this subproject was to the design and the synthesis of a hybrid iron
oxide nanoparticles (MNPs) conjugated to a Halo Tag functional ligand, in order to obtain a
bioactive conjugate with a number of properties, such as stability in a wide pH range and
physiological media, certain size and functionality. These particles should be able to be
recognized by Halo Tag protein called HALO-U11, constructed by a genetic fusion with a
small peptide of 11 amino acids (U11= VSNKYFSNIHW) as a targeting module for
urokinase plasminogen receptor (uPAR) [36] which is over-expressed on the membrane of
several metastasizing cancers [37]. In this way, the nanoparticle has the function of
substrate for the “HALO capture model”; although the peptide, homed in the protein
sequence, is the active targeting biomolecule towards the cell surface receptor (Figure. 3).
Figure 3: Schematic chemical conjugation of HALO protein to hybrid iron oxide nanoparticles.
Summary
x
A green fluorescent label has been chemically incorporated inside the nanoparticle
polymer layer to check the affinity for cellular receptors by fluorescence intensity with flow
cytometry. For this reason U937 cell lines were selected as the cellular model to assess
the targeting efficiency of MNP-U11 conjugated. These cancer cell line is available both as
uPAR-positive (U937_13) and as uPAR-negative (U937_10). The only difference between
them was the membrane expression of a U11-specific receptor. Finally, cellular toxicity
experiments has been evacuate on the same cell line after 24 h of exposure within MNPs
which suggested that this system was nontoxic within a broad range of concentrations,
making this nanoconstruct promising for future in vitro and in vivo applications
Intracellular Drug Release from Curcumin-Loaded PLGA Nanoparticles Induces
G2/M Block in Breast Cancer Cells
Biodegradable organic polymers such as polylactide-co-glycolide acid (PLGA) have
been used as carriers for drugs, peptides, proteins, vaccines, and nucleotides [38].
Nanoparticles formed by self assembly of polymer chains can protect drug moieties from
degradation and provide sustained drug release in a time dependent way. For instance,
PLGA nanoparticles are sometimes effective in facilitating intracellular delivery of bioactive
materials and, according to this capability, they have been approved by Food and Drug
administration (FDA) for parenteral administration of different molecules for applications in
vaccination, cancer therapy, and the treatment of cerebral disorders [39]. In particular,
these nanoparticles have been widely investigated for use in cancer therapy for two
reasons: first of all, PLGA nanoparticles, if given intravenously, can extravasate into and
accumulate within tumor tissues that have defective blood vessels and impaired lymphatic
drainage [40]. This effect, called enhanced permeability and retention (EPR) effect, helps
the internalization of nanoparticles in tumor sites [41]. Secondly, most of the
chemotherapeutic molecules adopted for cancer therapy suffer from different hurdles such

Summary
xi
as high toxicity rate, undesirable administration side effects, poor solubility in physiological
media and difficult tumor accumulation. For these reason modern medicine needs efficient
drug delivery systems which may effort sustainable medicinal tissue localization ad
efficiency.
As a model of hydrophobic anticancer drug that can overcome these problems, I
turned my attention to a natural chemical compound, 1,7-bis (4-hydroxy-3-
methoxyphenyl)-1,6-hepadiene-3,5-dione, which is commonly referred to as curcumin.
This compound has been shown to possess a wide range of pharmacological activities,
including anticancer effects [42−44].
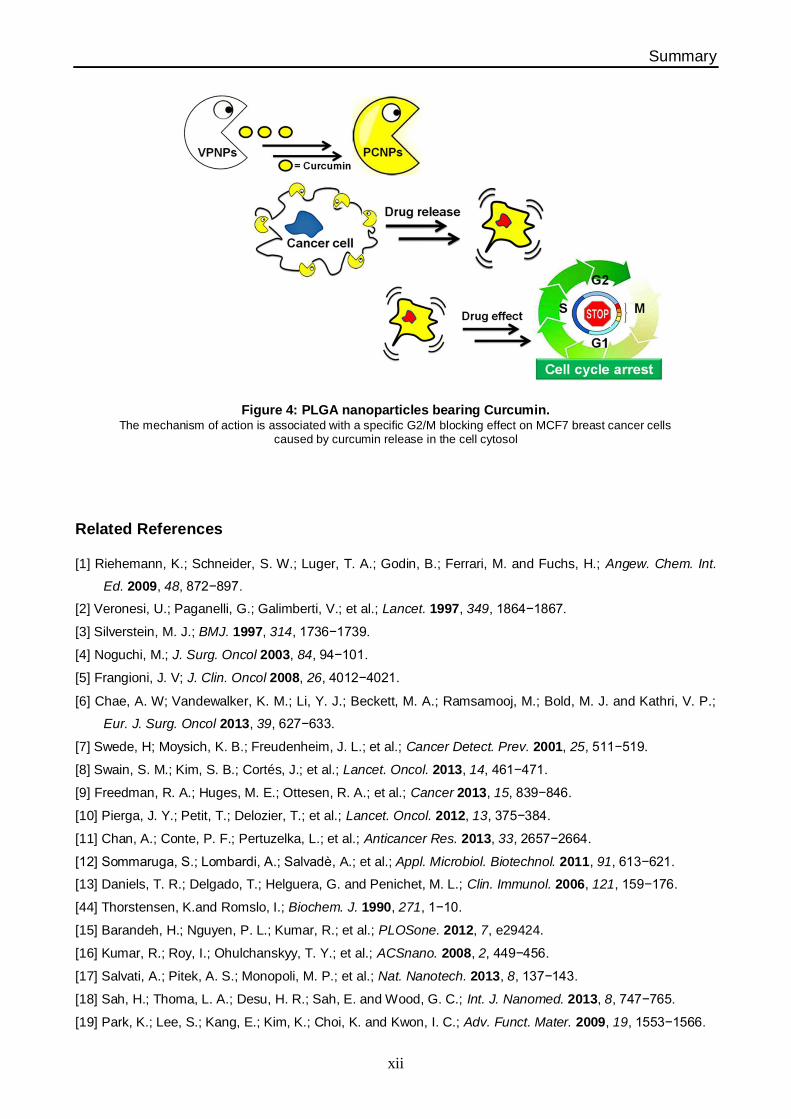
This part of the thesis, has been focused on developing uniform curcumin-bearing
PLGA nanoparticles, synthesized by the single emulsion technique (about 120 nm), which
exhibit a prolonged curcumin release over time. The loading ratio of encapsulated drug
has been evaluated by UV-vis spectroscopy and it has been also provided an efficient
protection of curcumin from environment by the polymer shell, as determined by
fluorescence emission and Raman experiments. Within the following in vitro experiments,
the intracellular degradation of nanoparticles associated with a specific G2/M blocking
effect on MCF7 breast cancer cells caused by curcumin release in the cytoplasm, has
provided direct evidence on the mechanism of action of this nanovector (Figure 4).
This study has been carried out using apoptosis cell-death analysis and an
assessment of cellular proliferation. PLGA nanoparticles uptake has been assessed by
flow cytometry and confocal laser scanning microscopy thanks to the fluorescence
emission properties of the molecule. The pure PLGA nanoparticles (without drug) proved a
safety profile, suggesting a potential utilization of this nanoconstruct to improve the
intrinsically poor bioavailability of curcumin for malignant breast cancer therapy.
Summary
xii
Figure 4: PLGA nanoparticles bearing Curcumin. The mechanism of action is associated with a specific G2/M blocking effect on MCF7 breast cancer cells
caused by curcumin release in the cell cytosol
Related References
[1] Riehemann, K.; Schneider, S. W.; Luger, T. A.; Godin, B.; Ferrari, M. and Fuchs, H.; Angew. Chem. Int.
Ed. 2009, 48, 872−897.
[2] Veronesi, U.; Paganelli, G.; Galimberti, V.; et al.; Lancet. 1997, 349, 1864−1867.
[3] Silverstein, M. J.; BMJ. 1997, 314, 1736−1739.
[4] Noguchi, M.; J. Surg. Oncol 2003, 84, 94−101.
[5] Frangioni, J. V; J. Clin. Oncol 2008, 26, 4012−4021.
[6] Chae, A. W; Vandewalker, K. M.; Li, Y. J.; Beckett, M. A.; Ramsamooj, M.; Bold, M. J. and Kathri, V. P.;
Eur. J. Surg. Oncol 2013, 39, 627−633.
[7] Swede, H; Moysich, K. B.; Freudenheim, J. L.; et al.; Cancer Detect. Prev. 2001, 25, 511−519.
[8] Swain, S. M.; Kim, S. B.; Cortés, J.; et al.; Lancet. Oncol. 2013, 14, 461−471.
[9] Freedman, R. A.; Huges, M. E.; Ottesen, R. A.; et al.; Cancer 2013, 15, 839−846.
[10] Pierga, J. Y.; Petit, T.; Delozier, T.; et al.; Lancet. Oncol. 2012, 13, 375−384.
[11] Chan, A.; Conte, P. F.; Pertuzelka, L.; et al.; Anticancer Res. 2013, 33, 2657−2664.
[12] Sommaruga, S.; Lombardi, A.; Salvad , A.; et al.; Appl. Microbiol. Biotechnol. 2011, 91, 613−621.
[13] Daniels, T. R.; Delgado, T.; Helguera, G. and Penichet, M. L.; Clin. Immunol. 2006, 121, 159−176.
[44] Thorstensen, K.and Romslo, I.; Biochem. J. 1990, 271, 1−10.
[15] Barandeh, H.; Nguyen, P. L.; Kumar, R.; et al.; PLOSone. 2012, 7, e29424.
[16] Kumar, R.; Roy, I.; Ohulchanskyy, T. Y.; et al.; ACSnano. 2008, 2, 449−456.
[17] Salvati, A.; Pitek, A. S.; Monopoli, M. P.; et al.; Nat. Nanotech. 2013, 8, 137−143.
[18] Sah, H.; Thoma, L. A.; Desu, H. R.; Sah, E. and Wood, G. C.; Int. J. Nanomed. 2013, 8, 747−765.
[19] Park, K.; Lee, S.; Kang, E.; Kim, K.; Choi, K. and Kwon, I. C.; Adv. Funct. Mater. 2009, 19, 1553−1566.
Summary
xiii
[20] Lee, J. H.; Huh, Y. M.; Jun Y. W.; et al.; Nat. Med. 2007, 13, 95−99.
[21] Kim, K.; Park, S.; Lee, J. E.; et al.; Angew. Chem. Int. Ed. 2006, 45, 7754−7758.
[22] Corsi, F.; Fiandra, L.; De Palma, C.; et al.; ACSnano. 2011, 5, 6383−6393.
[23] Park, J.; An, K.; Hwang, Y.; et al.; Nat. Mater. 2004, 3, 801−805.
[24] Corsi, F.; De Palma, C.; Colombo, M.; et al.; Small. 2009, 5, 2555−2564.
[25] Yang, J.; Lim, E. K.; Lee, H. J.; et al.; Biomaterials. 2008, 29, 2548−2555.
[26] Chen, S.; Reynolds, F.; Yu, L.; Weissleder, R. and Josephson, L.; J. Mater. Chem. 2009, 19,
6387−6392.
[27] Lewin, M.; Carlesso, N.; Tung, C. H.; et al.; Nat.Biotechnol 2000, 18, 410−414.
[28] Simberg, D.; Duza, T.; Park, J. H.; et al.; Proc. Am. Chem. Soc. 2007, 16, 932−936.
[29] Thanh, N. T. K. and Green, L. A. W. Nanotoday. 2010, 5, 213−230.
[30] Mazzucchelli, S.; Colombo, M.; De Palma, C.; et al.; ACSnano. 2010, 4, 5693−5702.
[31] Garcia, I.; Gallo, J.; Genicio, N.; Padro, D. and Penadés, S. Bioconjugate Chem. 2011, 22, 264−273.
[32] Xu, C.; Xu, K.; Gu, H.; et al.; J. Am. Chem. Soc. 2004, 126, 3392−3393.
[33] Long, J. C. L.; Pan, Y.; Lin, H. C.; Hedstrom, L. and Xu, B. J. Am. Chem. Soc. 2011, 133, 10006−10009.
[34] Yu, C. C.; Lin, P. C. and Lin, C. C. Chem. Commun. 2008, 1, 1308−1310.
[35] Colombo, M.; Sommaruga, S.; Mazzucchelli, S.; et al.; Angew. Chem. Int. Ed 2012, 51, 496−499.
[36] Los, G. V.; Encell, L. P.; McDougall, M. G.; et al.; ACS Chem. Biol. 2008, 3, 373−382.
[37] Wang, M.; Löwik, D. W. P. M.; Miller, A. D. and Thanou, M.; Bioconjugate Chem. 2009, 20, 32−40.
[38] Blasi, F.and Sidenius, N.; FEBS Lett. 2010, 584, 1923−1930.
[39] Danhier, F.; Ansorena, E.; Silva, J. M.; Coco, R.; Le Breton, A. and Préat, V.; J. Control. Release. 2012,
161, 505−522.
[40] De Jong, W. A. and Borm, P. J. A.; Int. J. Nanomed. 2008, 3, 133−149.
[41] Acharya, S. and Sahoo, S. K.; Adv Drug Deliv. Rev. 2011, 63, 170−183.
[42] Sa, G. and Das, T.; Cell. Division. 2008, 3, 1−14.
[43] Bhattacharyya, S.; Mandal, D.; Sen, G. S.; et al.; Cancer Res. 2007, 67, 362−370.
[44] Lai, C. S.; Wu, J. C.; Yu, S. F.; et al.; Mol. Nutr. Food. Res. 2011, 55, 1819−1828.
[45] Yamashita, S.; Lai, K. P.; Chuang, K. L.; et al.; Neoplasia. 2012, 14, 74−83.
[46] Lai, K. P.; Huang, C. K.; Chang, Y. J.; et al.; Am. J. Pathology. 2013, 182, 460−473.

Summary
xiv
Complete List of Publications:
Prencipe, G.; Maiorana, S.; Verderio, P.; Colombo, M.; Fermo, P.; Caneva, E.; Prosperi, D. and
Licandro, E.; “Magnetic Peptide Nucleic Acid for DNA Targeting”; Chem. Commun. 2009, 40,
6017−6019.
Colombo, M.; Corsi, F.; Foschi, D.; Mazzantini, E.; Mazzuchelli, S.; Morasso, C.; Occhipinti, E.; Polito,
L.; Prosperi, D.; Ronchi, R. and Verderio, P.; “HER2 targeting as a two sided strategy for breast cancer
diagnosis and treatment: outlook and recent implications in nanomedical approaches”; Pharmacol. Res.
2010, 62, 150−165.
Mazzucchelli, S.; Colombo, M.; De Palma, C.; Salvad , A.; Verderio, P.; Coghi, M. D.; Clementi, E.;
Tortora, P.; Corsi, F. and Prosperi, D.; “Synthesis of single-domain Protein A-engineered magnetic
nanoparticles: a step towards a universal strategy to site- specific labeling of antibodies for targeted
detection of tumor cells”; ACS Nano. 2010, 4, 5693-5702.
Verderio, P.; Occhipinti, E.;* Natalello, A.; albiati, E.; Colombo, M.; Mazzucchelli, S.; Salvad , A.;
Tortora, P.; Doglia, S. M. and Prosperi. D.; “Investigating the Structural Biofunctionality of Antibodies
Conjugated to Magnetic Nanoparticles”; Nanoscale. 2011, 3, 387−390.
Corsi, F.; Fiandra, L.; De Palma, C.; Colombo, M.; Mazzucchelli, S.; Verderio, P.; Allevi, R.; Tosoni, A.;
Nebuloni, M.; Clementi, E. and Prosperi, D.; “HER2 Expression in Breast Cancer is downregulated upon
active targeting by antibody-engineered multifunctional nanoparticles in mice”; ACS Nano. 2011, 5,
6383−6393.
Morasso, C.; Verderio, P.; Colombo, M. and Prosperi, D.; Book Chapter: Chapter 5: “Strategies for the
characterization of the saccharidic moiety in composite nanoparticle”. In “Petite and Sweet: lyco-
Nanotechnology as a Bridge to New Medicines”; Huang, X., et al.; Publication Date (Web): December
13, 2011. ACS Symposium Series; © 2011American Chemical Society: Washington, DC, 2011.
Verderio, P.; Mazzucchelli, S.;* Sommaruga, S.; Colombo, M.; Salvad , A.; Tortora, P.; Corsi, F. and
Prosperi, D.; “Multiple presentation of scFv800E6 on silica nanospheres enhances targeting efficiency
toward HER2 receptor in breast cancer cells”; Bioconjugate Chem. 2011, 22, 2296−2303.
Colombo, M.; Sommaruga, S.; Mazzucchelli, S.; Polito, L.; Verderio, P.; Galeffi, P.; Corsi, F.; Tortora,
P. and Prosperi, D.; “Site-specific conjugation of scFvs to nanoparticles by bioorthogonal strain-
promoted alkyne-nitrone cycloaddiction”; Angew. Chem. Int. Ed. 2012, 51, 496−499.

Summary
xv
Avvakumova, S.; Verderio, P.; Speranza, G. and Porta, F.; “ old nanoparticles modified with guanine:
study of conformational changes”; J. Phys. Chem. C. 2013, 117, 3002−3010.
Mazzucchelli, S.; Colombo, M.; Verderio, P.; Rozek, E.; Andreata, F.; Galbiati, E.; Tortora, P.; Corsi, F.
and Prosperi, D.; “Orientation-controlled conjugation of HALO-fused homing peptides to multifunctional
nanoparticles for specific recognition of cancer cells”; Angew. Chem. Int. Ed. 2013, 52, 3121−3125.
Verderio, P.; Bonetti, P.;* Colombo, M.; Pandolfi, L. and Prosperi, D.; “Intracellular drug release from
curcumin-loaded PL A nanoparticles induces 2/M block in breast cancer cells”; Biomacromolecules.
2013, 14, 672−682.
Verderio, P.; Avvakumova, S.;* Alessio, G.; Belllini, M.; Colombo, M.; Galbiati, E.; Mazzucchelli, S.;
Avila, J. P.; Santini, B. and Prosperi, D.; “Delivering colloidal nanoparticles to mammalian cells: a
Nano−Bio interface perspective”; Adv. Heathcare Mater. 2014, DOI: 10.1002/adhm.201300602..
(*) contributes equally

First Section
First Section
Chapter I
2
Chapter I
Inorganic Nanoparticles

Chapter I
3
Contents
1.1 Introduction pag 3
1.2 Iron oxide nanoparticles: general aspects pag 6
1.3 Properties of iron oxide nanoparticles pag 8
1.4 Large-scale chemical synthesis of iron oxide nanoparticles pag 12
1.4.1 Coprecipitation
1.4.2 Aerosol-vapor technology
1.4.3 Solvothermal decomposition from organo-metallic precursors
1.5 Applications of Iron Oxide Nanoparticles in Biomedical Research pag 16
1.5.1 Magnetic Resonance Imaging (MRI): T2 and T1 contrast agent
1.5.2 Drug delivery
1.5.3 Nanosensors
1.5.4 Hyperthermia
1.6 Silica Nanoparticles: general aspects pag 22
1.7 Controlled syntheses and properties of silica nanoparticles pag 23
1.7.1 Syntheses with size control
1.7.2 Syntheses with shape control
1.7.3 Syntheses with surface properties control
1.8 Applications of silica nanoparticles in biomedical research pag 27
1.8.1 Labeling and tracking cell surface receptors
1.8.2 Intracellular sensing
1.8.3 Small-molecule drug delivery and controlled release
Related references. pag 33
1.1. Introduction
A considerable attention towards nanotechnology has raised, nowadays, as a
growing impact to modern life; nanoparticle research has been exploited to the use of
inorganic nanoparticles in different technological fields [1]; particularly, a significant
factor is the development of a great number potential biological applications in
biomedical science of nanoparticles, ranging from imaging [2] to biochemical sensing
[3,4], targeting [5,6] and drug delivery [7,8]. The main advantage of inorganic
Chapter I
4
nanoparticles is attributed to their intrinsic physical properties including size-
dependent optical, magnetic, electronic, and catalytic properties as well as some
biological activities (e.g. anti-bacteria or specific interactions) [9]. In addition, a
possible construction between inorganic nanoparticle, as physical supports, and
biochemical building blocks lead to a broad selection of novel hybrid systems with
interestingly properties. In this framework, new synthetic chemistry approaches
continue to uncover more elaborate structures, which is expected to expand further
the range of biomedical applications of inorganic nanomaterials [10]. The main
challenge of these chemical approaches is the controlled synthesis of nanostructures
such that they are uniform in size, shape, chemical composition, they are produced in
high yields, and they are stable in biological environments. Many functional groups
provide a wide range of potential interactions of organic moieties and biomolecules
with nanoparticle surface, which can be easily used to compose a bio-nano structure
with a specific biological function.
The modification of peptides, proteins and other complex molecules with
specific anchoring groups facilitates the binding to nanoparticles via a site-specific
linkage, introducing chemical functionalities that can provide recognition or affinity
interactions between the biomolecules and antibodies or cell receptors. This
approach has been widely used to design nanoparticle conjugates to be used in
different applications [10]. Nowadays there is a huge part of research exploring these
interactions, which may affects the structures at the molecular level thus affecting the
biological function. For this reason, the challenge to use of bio-nano systems
requires the joint efforts of interdisciplinary research groups to be adequately faced;
one of the main issues to be considered concerns the design and optimization of
effective functionalization strategies. At the same level, it is needed a detailed
Chapter I
5
understanding profile of biomolecule-nanoparticle interactions at their interface and
with biological systems such as cells and tissues [11].
The present chapter focuses on some interesting inorganic nanoparticles,
which enclose fascinating properties and promising applications for the
biotechnological field. Different synthetic approaches of these inorganic nanoparticles
will also be mentioned as well as their surface modifications with organic and active
biomolecules; in addition are described some interesting applications for mammalian
cancer diagnostics and therapy. These inorganic particles include iron oxides and
silica nanoparticles, which have been also the starting materials of the applied
research of this PhD thesis work.
Chapter I
6
1.2. Iron oxide nanoparticles: general aspects
The nanoscale, defined by the US National Nanotechnology Initiative, is a
range from 1 to 1000 nm, including particles which are naturally occurring, such as
particles in smoke, volcanic ash, sea spray, and from anthropogenic sources. In
terms of biology, the nanoscale is the size range of important cellular components,
such as double-stranded DNA (about 2.5 nm in diameter), proteins (hemoglobin is
about 5 nm in diameter), cell walls, cell membranes, and compartments [12]. The SI
prefix “nano” means a billionth (10−9) part of a meter, or about one hundred
thousandth the thickness of a sheet of paper.
Metal nanoparticles have a long history in terms of preparation,
characterization, and application. Understanding the properties of iron based
nanoparticles and exploring their potential applications are major driving forces
behind the synthesis of a large variety of functional nanomaterials. Many properties
of these nanoparticles arise from their large surface-area-to-volume ratio and the
spatial confinement of electrons, phonons, and electric fields in and around the
particles. These may cause deviations from the usual bulk atomic arrangements,
such as higher reactivity; different elastic, tensile, and magnetic properties; increased
conductivity; or increased tendency to reflect and refract light.
Iron is one of the most abundant metallic elements in living organisms, and is
essential for various biological processes, such as oxygen transport by hemoglobin
and cellular respiration by redox enzymes. Iron oxide nanoparticles (MNPs), which
are usually magnetic susceptible, are one of the few nanomaterials that can be
injected into the body and incorporated into natural metabolic pathways of human
body; for these reasons, compared with many other nanoparticles, iron oxide
nanoparticles are less toxic and more biologically tolerated in a broad range of
Chapter I
7
concentrations. The most common nanomaterials are pure iron magnetic oxides,
such as Maghemite (γ-Fe2O3) and magnetite (Fe3O4). MNPs doped with magnetically
susceptible elements (e.g. MnFe2O4 and CoFe2O4) and metal alloys nanoparticles
(e.g. FeCo and FePt) are also available, but they are much less employed in
biomedical applications because of their potential toxicity and rapid oxidation, even
though the magnetism of these ferrites and metal alloys is stronger than that of the
corresponding pure iron oxide. The metabolism, and pharmacokinetics of
intravenously injected MNPs have been well studied [13] and, in addition to their
superior biocompatibility, magnetic MNPs offer many important skills for biomedical
applications, such as magnetic resonance imaging (MRI), drug delivery, cell tracking
and hyperthermia [14] Currently, there are some iron oxide nanoparticle-based MR
contrast agents that have already been used in clinical trials, or are undergoing
clinical trials [15].
Most of these commercially available MNPs are covered by a specific organic
and/or inorganic layer; this appropriate coating depends on the type of nanoparticle
core and the proposed applications. Differently coated iron oxide nanoparticles will
have different effects on cells and different fates in the body, depending on their size,
the crystallinity of their core and the chemical composition of their coating layers.
Hence, the suitable chemical design of both the core and shell of the nanoparticle is
extremely important for future projected clinical practice [16].
Chapter I
8
1.3. Properties of Iron oxide nanoparticles
Magnetic materials are characterized by the presence of magnetic dipoles
generated by the spinning of some of their electrons. Each of these polarized
electrons can be aligned in a parallel or anti-parallel fashion with respect to the
neighboring ones in the crystal lattice and this type of interaction is what gives rise to
the macroscopic magnetic effect that we can measure. Depending on the magnetic
response observed, it is possible to classify magnetic materials as paramagnets,
ferromagnets, ferrimagnets or anti-ferromagnets. However, such behaviors are
strongly size-dependent and consequently it is better to keep in mind that, at a
particular temperature, the magnetic behavior of any material can be altered by
tuning its size [17].
A material in a paramagnetic phase is characterized by uncouple (randomly
oriented) magnetic dipoles, which can be aligned only in the presence of an external
magnetic field and along its direction. This type of material has no coercivity nor
remanence, which means that when the external magnetic field is switched off, the
internal magnetic dipoles randomize again, no extra energy is required to
demagnetize the material and hence the initial zero net magnetic moment is
spontaneously recovered. A nanoparticle with such magnetic behavior is
superparamagnetic (SPM) (Figure. 1.1).
Otherwise, single magnetic dipoles in a crystal may align parallel one to the
other, hence exhibiting an enhanced collective response even in the absence of an
external magnetic field; this phenomenon is known as ferromagnetism. In this case
three main parameters can describe the strength and magnetization of the material:
(a) the Coercive Field (HC) which is the external field of opposite sign required to
Chapter I
9
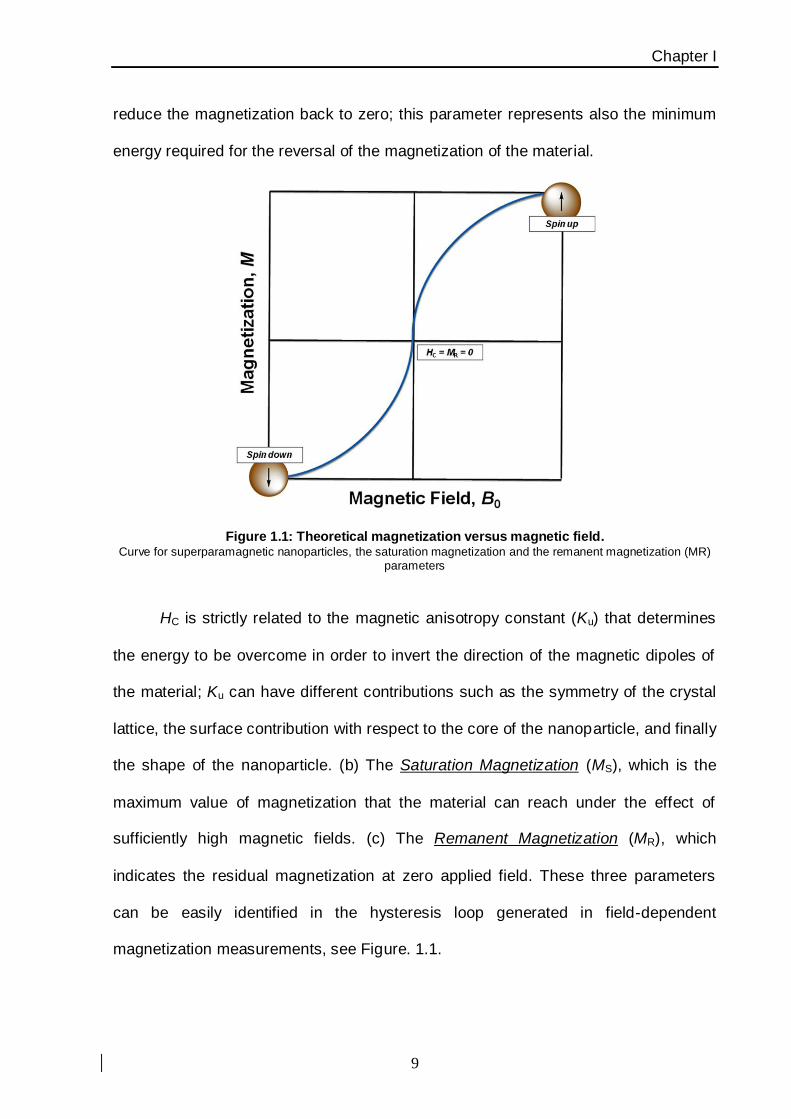
reduce the magnetization back to zero; this parameter represents also the minimum
energy required for the reversal of the magnetization of the material.
Figure 1.1: Theoretical magnetization versus magnetic field. Curve for superparamagnetic nanoparticles, the saturation magnetization and the remanent magnetization (MR)
parameters
HC is strictly related to the magnetic anisotropy constant (Ku) that determines
the energy to be overcome in order to invert the direction of the magnetic dipoles of
the material; Ku can have different contributions such as the symmetry of the crystal
lattice, the surface contribution with respect to the core of the nanoparticle, and finally
the shape of the nanoparticle. (b) The Saturation Magnetization (MS), which is the
maximum value of magnetization that the material can reach under the effect of
sufficiently high magnetic fields. (c) The Remanent Magnetization (MR), which
indicates the residual magnetization at zero applied field. These three parameters
can be easily identified in the hysteresis loop generated in field-dependent
magnetization measurements, see Figure. 1.1.
Chapter I
10
Bulk metals such as iron as well as some of its alloys (FePt, FeCo) are
ferromagnetic materials. Differently to the ferromagnetic situation, neighboring
magnetic dipoles can align anti-parallel in the lattice, which means that they will
repulse each other. This type of magnetic exchange can lead to two different
situations, namely anti-ferromagnetism, occurring when the magnetic dipoles or
interacting spins have the same value and hence the material shows a net zero
magnetization, and ferrimagnetism when the two coupled spins show different
values; in this case a net magnetic dipole different than zero will still magnetize the
material, even in the absence of an external magnetic field. The former case lacks of
interest for biomedical applications due to the zero net magnetic moment arising in
such materials. The latter instead is much more interesting and actually MNPs (both
bulk magnetite and maghemite) belongs to the ferrimagnetic class of materials.
The size reduction of magnetic materials shows enhancing advantages that
make them more suitable for therapeutic and diagnostic techniques compared to
their bulk counterparts; for example magnetic parameters such as the HC of particles
can be tuned by decreasing their size and, consequently, the biomedical
performance of the sample can be optimized to the practical requirements. Moreover,
a further reduction of the size below a certain value of the radius (called
superparamagnetic radius, rSP), induces a magnetic transition in particles where both
ferro- and ferri-magnetic nanoparticles become superparamagnetic.
Superparamagetism is strictly associated to nanoformed magnetic materials and
arises when the thermal energy is sufficiently high to overcome the magnetic
stabilization energy of the particle [18] (Figure 1.2).
This last property translates into a considerable advantage, especially for in
vivo experiments: the absence of HC (the zero net magnetic moment) of the

Chapter I
11
nanoparticles after concluding the diagnostic measurement will prevent the potential
aggregation of MNPs that could easily cause the formation of embolisms in the blood
vessels.
Figure 1.2: Size-dependent behavior. Variation of the coercivity (HC) of magnetic nanoparticles with size.
Chapter I
12
1.4. Large-scale chemical synthesis of iron oxide
nanoparticles
Up to now, a great number of physical and chemical methods have been
applied to synthesize MNPs [19]. Physical methods [20] have advantages in that they
can be adapted to mass production and high-purity nanomaterials can be obtained,
but it is difficult to control the size and shape of the nanoparticles. To overcome these
drawbacks, various chemical methods based on solution-phase colloidal chemistry
have been investigated for the synthesis of high quality nanoparticles. These
chemical methods include metal salt reduction, sol-gel process, reverse micelle
technique, and thermal decomposition of iron organic precursors [21]. Nevertheless,
to prepare iron oxide nanoparticles suitable for the intended medical applications, the
use of “green chemistry” is highly recommended, which avoids the use of toxic
chemicals. It is also desirable to have a synthetic process that is scalable to industrial
applications, and should be reproducible from batch to batch. In this section, instead
of compiling a list of all the chemical approaches to iron oxide nanoparticle synthesis,
I briefly introduce typical and representative methods for the scalable synthesis of
iron oxide nanoparticles for medical use.
1.4.1- Coprecipitation
Magnetite is prepared by reacting Fe(II) and Fe(III) salts in alkaline aqueous
media in a molar ratio of 1:2; MNPs made by this method are commonly used for
biomedical applications for two main reasons: 1) easy and large-scale production; 2)
direct dispersion in water without further treatment. Massart first performed the
coprecipitation process for the preparation of iron oxide particles by alkaline
precipitation of FeCl3 and FeCl2 [22]. However, the synthesized magnetite particles
from this process were highly polydisperse and unstable. To further improve the

Chapter I
13
stability, iron oxide nanoparticles prepared with the Massart method were coated in
situ using various capping ligands such as hydroxamate, dimercaptosuccinic acid,
phosphorylcholine, and citric acid [23,24]. However, the crystallinity of the
synthesized iron oxide nanoparticles is very poor, which reduces their magnetic
susceptibility; furthermore, the nanoparticles are generally quite polydisperse, and a
size selection process is required to get uniform-sized nanoparticles.
1.4.2- Aerosol-vapor technology
The aerosol/vapor technology (e.g. flame-spray, laser pyrolysis) is another
way to synthesize MNPs on a large scale. These technologies produce a wide range
of iron oxide nanoparticles such as magnetite, maghemite, and wustite (FeO), which
can be controlled by varying the fuel-to-air ratio during combustion, as well as by
controlling the valence state of the iron precursors. In flame-spray pyrolysis, ferric salt
and reducing agent, mixed together in an organic solvent, are sprayed into a series
of reactors to condense the aerosol solute, followed by evaporating the solvent [25].
In laser pyrolysis, a laser is used to heat a gaseous mixture of an iron precursor and
a flowing mixture of gases in order to produce well-dispersed fine nanoparticles [26].
The size of the nanoparticles can be tuned in the range from 2 to 7 nm by adjusting
the pyrolysis conditions. Unfortunately, because of the difficulty of obtaining a uniform
size for the initial droplets or gaseous mixture, the final nanoparticles made by this
process have a very broad size distribution.
1.4.3- Solvothermal decomposition from organo-metallic precursors
Uniform-sized nanoparticles are preferred because they are easier to
characterize both in vitro and in vivo, and thus they are more likely to get Food and
Drug Administration (FDA) approval. The methods described previously have several
intrinsic drawbacks, including the difficulty of producing highly uniform iron oxide

Chapter I
14
nanoparticles and low crystallinity. Highly uniform-disperse MNPs can be synthesized
on a large scale by solvothermal decomposition of organometallic iron precursor
such as iron pentacarbonyl [27], iron cupferron [28], iron oleate [29], or iron
acetylacetonate [30,31] in a hot surfactant solution. Nanoparticles synthesized by
solvothermal decomposition have high crystallinity and uniform size distribution;
unfortunately, this synthetic procedure cannot readily be applied to large-scale and
economic production because and expensive toxic reagents and complicated
synthetic steps are employed in this process. Nanoparticles produced via this
procedure often have particle size distributions with polidispersity (σ) ≈ 10%. A size-
selection process is needed to narrow the size distributions to σ < 5%. Hyeon et al.
reported the fabrication of highly uniform iron oxide nanoparticles by the thermal
decomposition of iron oleate complex, which was prepared by the reaction of iron
pentacarbonly with oleic acid [27]. Monodisperse iron oxide nanoparticles were
obtained by mixing iron pentacarbonly precursor with oleic acid solution at low
temperature and heating up the reaction mixture to high temperature. The initially
produced iron nanoparticles were further oxidized to iron oxide nanoparticles by
using trimethylamine N-oxide as a mild oxident. The size of the nanoparticles was
controlled by adjusting the molar ratio of iron pentacarbonyl to oleic acid. Because
the resulting iron oxide nanoparticles were highly monodisperse, a laborious and
tedious size-selection process was not required to obtain uniform nanoparticles. The
same author few years later reported a synthetic method of obtaining mono-disperse
MNPs using an inexpensive and nontoxic iron chloride (FeCl3) rather than toxic and
expensive iron pentacarbonyl [32]; according to this purpose, this process has been
also adopted to synthesize MNPs for my thesis work (Figure. 1.3).
Chapter I
15
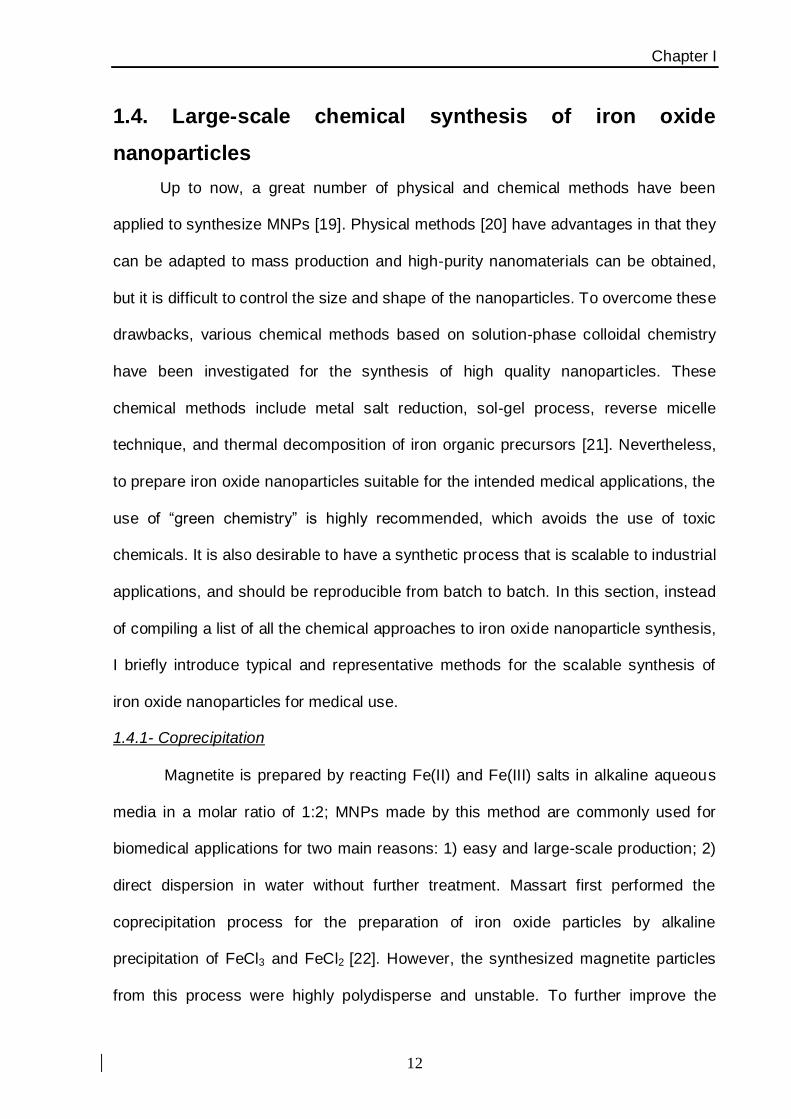
Figure 1.3: Scheme for the ultra-large-scale synthesis of monodisperse nanocrystals. Metal–oleate precursors were prepared from the reaction of metal chlorides and sodium oleate. The thermal decomposition of the metal–oleate precursors in high boiling solvent produced monodisperse nanocrystals.
A dispersion containing the iron-oleate complex, generated from the reaction
between FeCl3 and sodium-oleate, is soaked in an high boiling solvent (1-
octadecene); the mixture is slowly heated to the boiling point of the solvent to
produce the mono-disperse nanoparticles. Because of the simplicity of the reaction
and the stability of the iron–oleate complex, this method can readily be scaled up for
mass production to yield grams of uniform iron oxide nanoparticles in a single
reaction and, essentially, without the need for a size-selection process. The size of
the iron oxide nanoparticles may be modulated by changing the aging temperature.
When 1-hexadecene [boiling point (bp): 274 °C], octyl ether (bp: 287 °C), 1-
octadecene (bp: 317 °C), 1-eicosene (bp: 330 °C), and trioctylamine (bp: 365 °C)
were used as the solvent, 5-nm, 9-nm, 12-nm, 16-nm, and 22-nm iron oxide
nanoparticles have been produced, respectively [33−35]. Very recently, uniform and
extremely small iron oxide nanoparticles of less than 4 nm have been synthesized via
the thermal decomposition of an iron–oleate complex in the presence of oleyl alcohol
[36]. The use of oleyl alcohol reduced the reaction temperature by reducing the iron–
oleate complex, resulting in the production of extremely small MNPs. This size could
be finely controlled from 1.5 nm to 3.7 nm by changing the ratio of oleyl alcohol to
oleic acid or by changing the aging temperature.

Chapter I
16
1.5. Applications of Iron Oxide Nanoparticles in Biomedical
Research
The increasing applications of MNPs, has given rise to many concerns among
public, scientific and regulatory authorities regarding their toxicological properties and
long-term impact on human health. Hence, the in vivo behaviors and toxicology of
iron oxide nanoparticles have been intensively studied for the safe design in the past
decades. In this section will be discussed most of the applications of MNPs in
biomedicine and their involvement into biological processes.
1.5.1- Magnetic Resonance Imaging (MRI): T2 and T1 contrast agent
‘Contrast’ refers to the signal differences between adjacent regions, which
could be ‘tissue and tissue’, ‘tissue and vessel’, and ‘tissue and bone’. Contrast
agents for X-ray show contrasting effects according to the electron-density
difference, and they produce direct contrast effects on their positions. However, the
contrast mechanism is more complicated for MRI, where the contrast enhancement
occurs as a result of the interaction between the contrast agents and neighbouring
water protons, which can be affected by many intrinsic and extrinsic factors such as
proton density and MRI pulse sequences. The basic principle of MRI is based on
nuclear magnetic resonance (NMR) together with the relaxation of proton spins in a
magnetic field [37]. When the nuclei of protons are exposed to a strong magnetic
field, their spins align either parallel or anti-parallel to the magnetic field applied.
(Figure. 1.4).
Chapter I
17
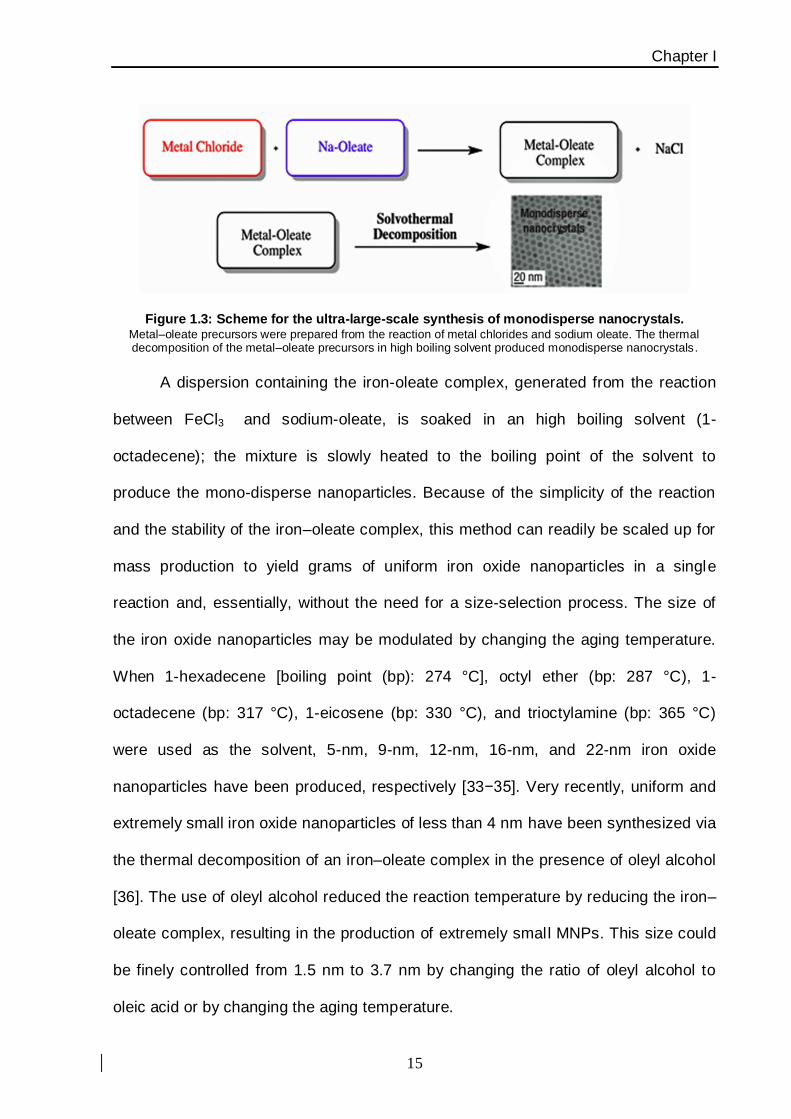
Figure 1.4: Principle of magnetic resonance imaging. a) Spins align parallel or antiparallel to the magnetic field and precess under Larmor frequency (ω0); b) After
induction of RF pulse, magnetization of spins changes; c) Excited spins take relaxation process of T1 relaxation and d) T2 relaxation.
During their alignment, the spins precess under a specified frequency, known
as the Larmor frequency (ω0, Figure. 1.4a). When a ‘resonance’ frequency in the
radio-frequency (RF) range is introduced to the nuclei, the protons absorb energy
and are excited to the anti-parallel state. After the disappearance of the RF pulse, the
excited nuclei relax to their initial, lower-energy state (Figure. 1.4b). There are two
different relaxation pathways: the first, called longitudinal or T1 relaxation, involves
the decreased net magnetization (Mz) recovering to the initial state (Figure. 1.4c).
The second, called transverse or T2 relaxation, involves the induced magnetization
on the perpendicular plane (Mxy) disappearing by the dephasing of the spins (Figure.
1.4d). Based on their relaxation processes, the contrast agents are classified as T1
and T2 contrast agents.
Chapter I
18
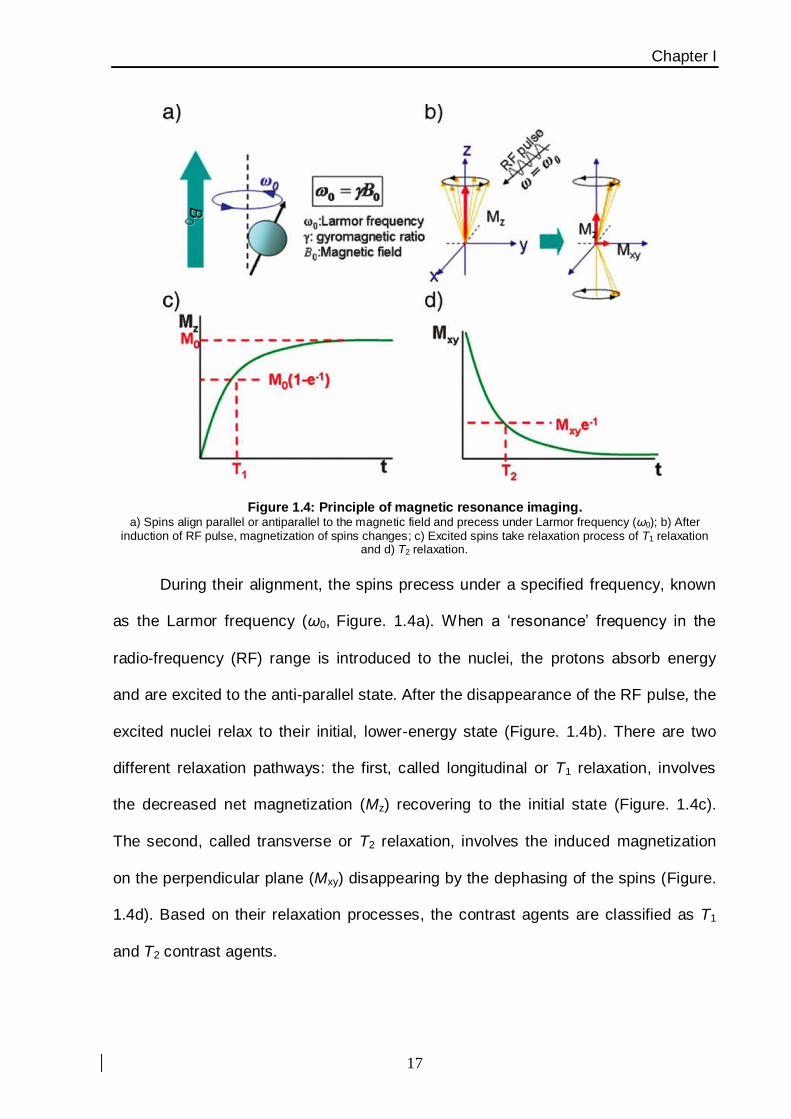
Commercially available T1 contrast agents are usually paramagnetic
complexes, while T2 contrast agents are based on MNPs, which are the most
representative nanoparticulate agents; therefore, it is reported in Table .1 some
examples of T2 contrast agents based on MNPs, commonly exploited in biomedical
MRI.
Name Core NPs Surface Diam (nm) Magnetization
[emu g-1
] r2 [mM
-1 s
-1] B0 applied [T] [Refs]
Feridex Fe3O4 Dextran 4.96 45 120 1.5 [38]
Resovist Fe3O4 Carboxydextran 4 60 186 1.5 [39]
Combidex Fe3O4 Dextran 5.85 61 65 1.5 [40]
CLIO-Tat Fe3O4 Dextran 5 60 62 1.5 [41]
MEIO Fe3O4 DMSA 4 25 78 1.5 [42]
Table. 1: Commercially available T2 contrast agent based on iron oxide nanoparticles.
1.5.2- Drug delivery
Magnetic iron oxide nanoparticle-based nanovectors have been intensively
studied also as drug delivery vehicles [43−45]; this immediately upgrades the MRI
imaging probes to theranostic agents that combine both diagnostic and therapeutic
elements. One trick is to load MNPs, along with therapeutic agent, into polymer-
based matrices [46] and, thus, various formulations employing iron oxide
nanoparticles have been developed for theranostic applications. Recently, for
instance, Nasongkla et al. [47] developed iron oxide nanoparticle-based theranostics,
named SPIO-doxorubicin (Dox)-cRGD micelles for synchronous cancer imaging and
traceable drug delivery. This approach showed the therapeutic modality of
Doxorubicin and the diagnostic features of the cluster of MNPs which has been co-
loaded into the cores of PEG-PLA micelles, while the targeting ligand, a cRGD
peptide, has been attached onto the micelle surface for targeting the integrin αvβ3
overexpressed on tumor endothelial cells.
Chapter I
19
Aside from co-capsulation and/or chemical covalent coupling of drugs [48],
therapeutics can also be loaded into hollow iron oxide nanoparticles via physical
absorption. For instance, the Sun group developed porous iron oxide nanoparticles
with a sizable cavity by controlled oxidation and acid etching of Fe particles [49]. In
this work the authors loaded cisplatin, a powerful therapeutic agent against
numerous solid tumors, into the cavities of the nanoparticles, and coupled
Trastuzumab, a monoclonal antibody that interferes with the HER2/neu receptor,
onto the nanoparticle surfaces to confer targeting specificity; in this way the
functionalized iron oxide nanoparticles showed a selective affinity to HER2 receptors,
overexpressed on breast cancer cells, and a sustained toxicity attributable to the
release of cisplatin from the nanoparticles.
1.5.3- Nanosensors
MNPs offer desirable and unmatched characteristics for biomarker detection
such as unique magnetic properties and significant surface area to volume ratio.
Generally, the controlled clustering or aggregation of a few superparamagnetic iron
oxide nanoparticles can greatly shorten T2 relaxation time compared to single
nanoparticles at the same iron concentration; thus, when magnetic nanosensors
aggregate through affinity ligands to the biomarkers, a decrease in the T2 relaxation
time is observed, allowing the sensitive and accurate detection of biomarkers with
excellent temporal and spatial resolution [50,51]. For instance, Colombo et al. [52]
reported the accurate and reliable detection of anti-HSA (human serum albumin)
antibodies by protein-functionalized magnetic nano-spherical probes due to the
reversible alteration of their micro aggregation state induced by protein antibody
specific interaction, sensed as changes in the T2 relaxation time of surrounding water
molecules.

Chapter I
20
El-Boubbou et al. [53] developed a magnetic nanosensor bearing
carbohydrates to screen the carbohydrate-binding characteristics of cancer cells by
MRI. The system consists of microcoils for radio-frequency excitation and signal
detection, an on-board NMR spectrometer, a portable magnet, and micro-fluidic
networks. Magnetic iron oxide nanoparticles were conjugated with antibodies to each
biomarker, followed by incubation with samples of cancer cells. Significant dif-
ferences in T2 relaxation time could be observed for a variety of cancer cells using
this system; in this way, this strategy with high sensitivity, specificity and high-
throughput shows great potential for early cancer diagnosis in the clinic.
1.5.4- Hyperthermia
The cancer treatment by magnetic fluid hyperthermia has been explored
extensively with iron oxide nanoparticles playing the key role as the local heaters. In
the magnetic fluid thermo-therapy, magnetic fluids containing MNPs are delivered to
the cancer and then heated by external alternating magnetic field, resulting
hyperthermia of cancer tissue [54]. The underlying mechanism is that MNPs can act
as antennae in an external alternating magnetic field to convert electromagnetic
energy into heat; this feature holds promise in cancer therapy for cancer cells that
are more susceptible to elevated temperature than normal cells.
Using MNPs and alternating magnetic fields, Zhao and co-workers [55] have
found that head and neck cancerous tumor cells in mice can be killed in half an hour
without harming normal cells; they basically injected a MNPs solution directly into the
tumor site, with the mouse relaxed under anesthesia; they quickly placed the animal
in a plastic tube wrapped with a wire coil that generated magnetic fields that
alternated directions 100.000 times each second. The magnetic fields produced by
the wire coil heated only the concentrated MNPs within the cancerous tumor and left
Chapter I
21
the surrounding healthy cells and tissue unharmed. In an analogue study amino
silane coated MNPs have been injected into a subcutaneous tumor model in rats,
which have been exposed to an alternating magnetic field [56]. The alternating
magnetic field in conjugation with nanoparticles raised the temperature of tumor
above 43 °C and caused tumor regression.
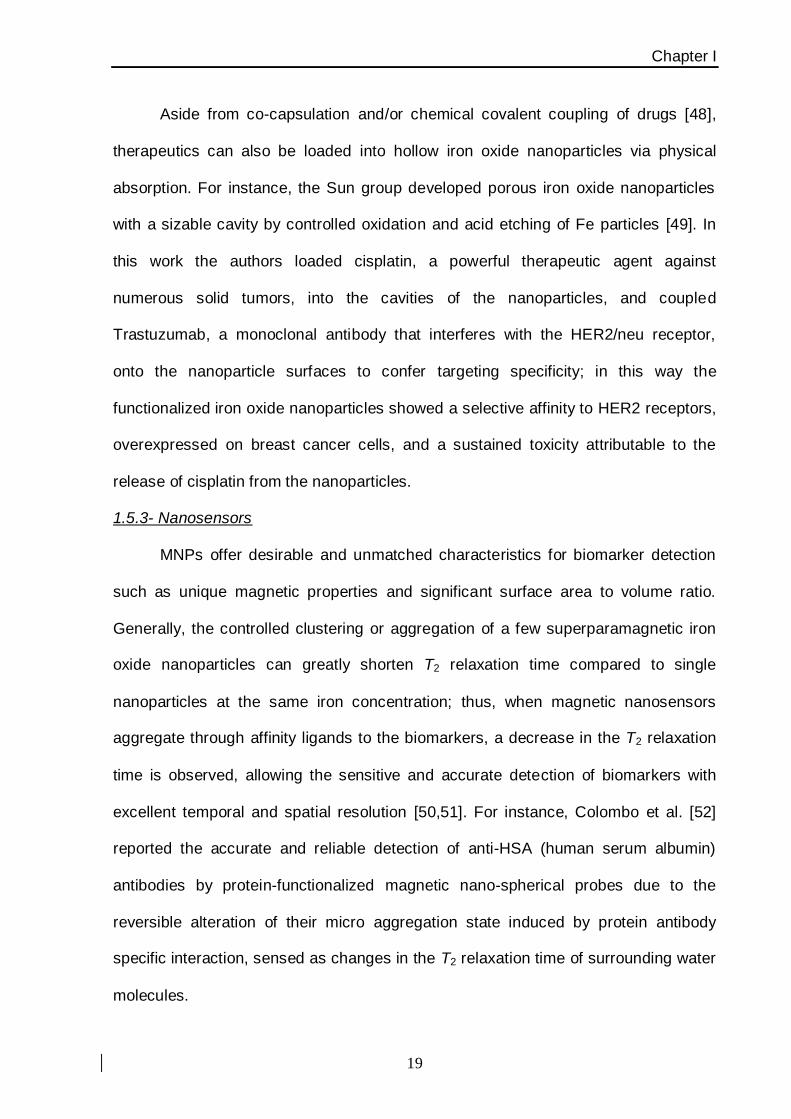
Nowadays, with the aim to engineer MNPs so as to enhance the stability and
the tumor target capability, fragments of antigen-specific antibodies has been
chemically anchored onto nanoparticle surfaces [57]; when MNPs have been
administrated systemically into tumor-bearing mice; this novel nanoparticles platform
should improve higher tumor uptake,
presumably due to an antibody-antigen
interaction, and they should induce better tumor
hyperthermia when exposed to an alternating
magnetic field (Figure. 1.5).
Figure 1.5: Monitoring MNPs uptake in vivo by MRI and Epifluorescence Camera. (Upper inset) The axial T2-weighted MR images have been obtained from MCF7 tumor-bearing mice (Left) before
and (Right) 24 h after the injection of nanocrystals. The images, obtained by a T2-mapping sequence, were acquired at 32.2 ms echo time.
(Lower Panels) CCD camera images of mice bearing MCF7 xenografts at 5 h, 24 h, and 1 week post-injection of fluorescent MNPs. Epifluorescence intensity images are reported on the left [57].

Chapter I
22
1.6. Silica based nanoparticles: general aspects
Proper silica nanoparticles (SiNPs) design and functionalization yields
particularly stable colloids, even in physiological conditions, and provides them with
multiple functions. A suitable choice of dyes could be coupled with SiNPs trough
different synthetic strategies yielding a very bright and stable nanoconstruct. This
subchapter discusses silica-based with a multi-component nanostructure involved in
specific cellular applications, on which highly valued functions like light harvesting
and signal amplification are needed.
In comparison to other NPs, SiNPs may appear mundane at first sight;
however, from the practical viewpoint, this does not appear to be the case. In
nanotechnologies, silica-based NPs have a dominant role because of their
fundamental characteristics, such as size (generally from 5 to 1000 nm), unique
optical properties, low density, adsorption capacity, capacity for encapsulation and
low toxicity [58]. Consequently, intensive research has been performed to use SiNPs
in diverse biomedical applications for diagnosing and controlling diseases, identifying
and correcting genetic disorders and, most importantly, increasing longevity. Thus
SiNPs offer considerable advantages and have opened new avenues of biomedical
research in numerous leading edge applications, such as biosensors [59], controlled
drug release and cellular uptake [60].
All these features are very appealing for analytical and quantitative
applications in broad range of fields of great social and economical impact [61]. In
this context, luminescent nanoparticles are particularly versatile components that
have already been used in many fields thanks in part to their extreme brightness.
Chapter I
23
1.7. Controlled syntheses and properties of silica
nanoparticles
Silica has attracted significant interest because its unique properties amenable for in
vivo applications, such as hydrophilic surface favouring protracted circulation,
versatile chemistry for surface functionalization and ease of large-scale synthesis
with low cost production. In this context, in 2011 an Investigational New Drug
Application for exploring an small nonporous silica NP for targeted molecular imaging
of cancer was approved by the US Food and Drug Administration (FDA) for a first in
human clinical trial [62], highlighting the great potential of clinical translation of SiNPs
drug delivery platform.
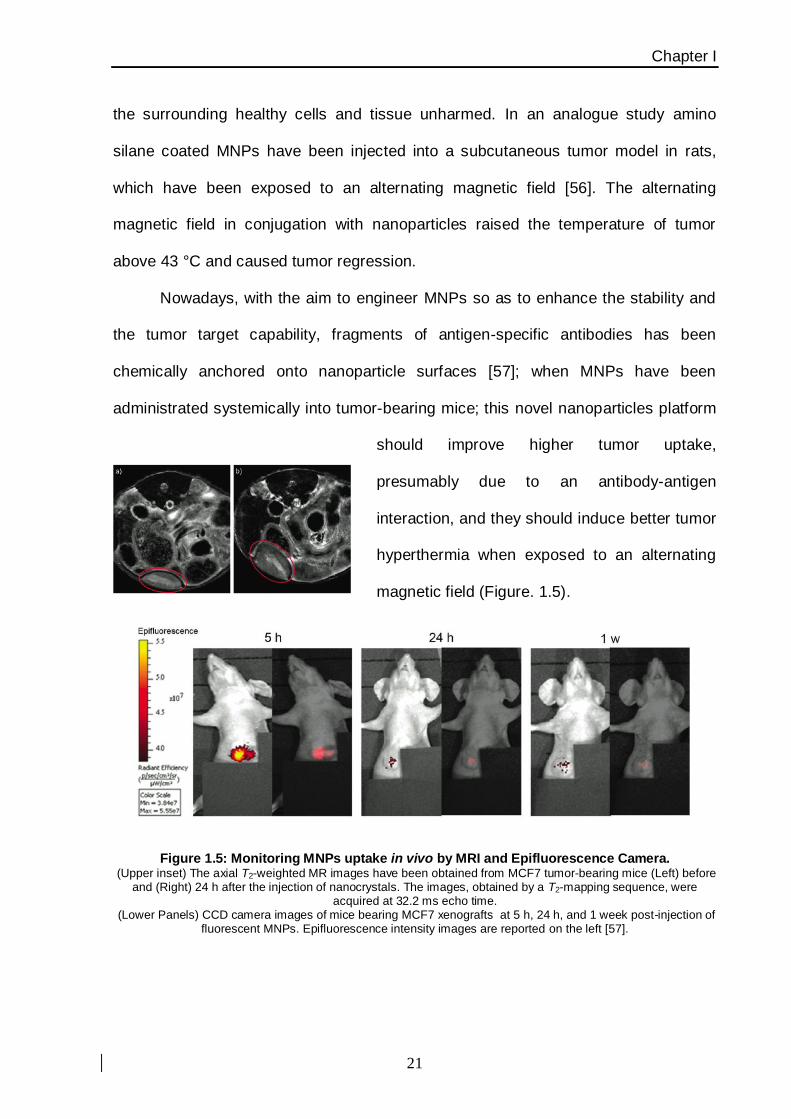
1.7.1- Syntheses with size control
Figure 1.6: Strategies for the synthesis of silica nanoparticles.
(Upper Scheme) Stöber-van Blaaderen method; (Lower scheme) reverse microemulsion or water-in-oil method.
The first synthesis of size-controlled SiNPs has been reported by Stöber [63]
in which monodisperse silica spheres with diameters ranging from 50 nm to 200 nm
have been successfully prepared in a mixture of water, alcoholic solvent, ammonia,
and tetra-alkoxysilane (Figure 1.6, upper scheme). The reaction parameters and

Chapter I
24
mechanism has been subsequently investigated [64,65], demonstrating that the
growth proceeds through a surface reaction-limited condensation of hydrolyzed
monomers or small oligomers. The particle nucleation proceeds through an
aggregation process of siloxane substructures that is influenced strongly by the
surface potential of particles and the ionic strength of the solvent. In this way, the
rates of hydrolysis and condensation as a function of the mixture play the most
important role in determining the final silica NP sizes [65]. The smallest
homogeneous NPs that can be prepared by the Stöber method without aggregation
have diameters of 20 nm and are more polydisperse (<10−20% St. Dev.) than 200
nm NPs (<3% St. Dev.).
Recently, in an important breakthrough 12 nm monodisperse SiNPs have
been prepared in a heterogeneous reaction supplemented with L-lysine or L-arginine
instead of ammonia (as a basic catalyst) in the aqueous phase and tetraethoxysilane
in the organic layer [66].
In another modification organic modified SiNPs have been synthesized in an
aqueous microemulsion supplemented with surfactants [67]; in this process the
formulation of 20−300 nm silica NPs in a water-based emulsion has been
accomplished with sodium dodecylbenzene sulfonate as surfactant. An alternative
method for the production of uniform silica spheres involves the use of reverse
microemulsions (Figure 1.6 lower scheme), in which particles form in inverse micelles
compartmentalized by a suitable surfactant in a non−polar organic solvent. This
synthetic approach works particularly well for SiNPs smaller than 100 nm in diameter
[68] and permits eventually the encapsulation of active molecules in the reverse
micelles during particle nucleation [69]. This methodology has also been widely used
for coating other functional NPs with silica to produce core−shell structures [70].
Chapter I
25
1.7.2- Syntheses with shape control
The shape of SiNPs considerably affects their circulation into the bloodstream
and tumor penetration behavior [71]; for example, it is noticeable that nanorods
penetrate tumor tissues more rapidly than nanospheres likely because of improved
transport through tumor vasculature pores [71]. These results suggest the
importance of controlling the shape of SiNPs designed for nanomedicine to
ameliorates their circulation and tissue penetration properties. Although there are
many methods for the size-controlled preparation of silica nanospheres, only a
handful of methods have been reported for the preparing of one-dimensional silica
nanorods/nanotubes and other nanostructures [72−74]. The methods for shape
control of silica NPs are mainly using templates and/or through polymer adsorption
[72,74]. This facile shape control of SiNPs is important for essential studies of
understanding the shape effect of nanomedicine in biological system and for
optimizing these geometrical structures for improved diagnosis and therapy.
1.7.3- Syntheses with surface properties control
The surface properties of nanomaterials are known to play an important role in
determining the interactions between particles and biological systems (e.g. cellular
internalization and trafficking, biodistribution) [75]. Therefore, to achieve efficient
disease targeting and improved therapy, it is fundamental to adjust the surface
properties of desired nanomedicines. SiNPs have the advantage of easy surface
modification via physical adsorption or covalent conjugation using siloxane chemistry;
depending on the specific application, the surface property of silica NP might be
easily tuned. For example the surface charge of SiNPs can be easily controlled with
the addition of aminosiloxanes (3-aminopropyltriethoxysilane, 3-(trihydroxysilyl)-
propylmethylphosphonate) or zwitterionic silanes, after the basic formulation of
Chapter I
26
SiNPs [76]. As a result, SiNPs with positive, negative, or both (zwitterionic surface)
could be prepared [77]; in addition, many other different functional groups could be
grafted to these surfaces using similar techniques because a large number of these
siloxane compounds are commercially available [78,79].
SiNPs surface have been also functionalized with polymers either chemically,
through covalent bonds, or physically, by physical adsorption [80]; the former is
preferential due to stable covalent bonds between the two counterparts. For
example, polyethylene glycol (PEG) has been conjugated to SiNPs surface via a
‘‘grafting-to’’ method [81] or, on the other hand, with a ‘‘grafting-from’’ [82].
The surface of silica NPs can also be functionalized with various targeting
ligands for example, antibodies or aptamers; but detailed information will be
discussed in following sections of this thesis according to the aims of my research
study.
Chapter I
27
1.8. Applications of Silica Nanoparticles in Biomedical
Research
Going into the concept of living cells and the whole body is very important to
achieve a better understanding of the mechanism of NPs interacion and requires
specialized imaging techniques. Functionalized silica nanoconstructs have the
potential to match such needs through real-time and non-invasive visualization of
biological events in vivo; in literature are present different studies talking about SiNPs
as a platform for nanomedicine applications [83,84]. In addition, the possibility to
incorporate SiNPs doped with fluorescent dyes appears to be an ideal and flexible
program for developing fluorescence imaging techniques applied in living cells and
the whole body [85]. It is possible to select and incorporate different dyes inside the
silica matrix either noncovalently or covalently. All these techniques form the
functionalized hybrid SiNPs, which support multiplex labeling and ratiometric sensing
in living systems; since that the silica matrix protects its content from the external
environment and degradation factors, this system enhances the photostability and
biocompatibility of SiNPs as fluorescent probes.
1.8.1- Labeling and tracking cell surface receptors
In situ labeling and tracking cell surface receptors with high sensitivity and
selectivity holds great potential for the diagnosis of early stage diseases and the
monitoring of some life processes. By utilizing the enhanced properties of dye-doped
SiNPs, researchers have been developed an immunofluorescence labeling and
tracking technique platform for cell surface receptors involved in several diseases.
Based on the specificity associated with the ligand-receptor recognition process,
fluorescent SiNPs has been covalently conjugated with different ligands and then

Chapter I
28
applied to label antigens or receptors in several cell lines, such as HepG liver cancer
cells [86], MDA-MB231, and MCF7 breast cancer cells [87].
Similarly, some cellular processes have also been monitored by tracking cell
membrane surface receptors using biofunctionalized SiNPs [88]; for example, the
externalization of phosphatidylserine, from the inner to the outer membrane, has
been used to detect early stage apoptosis since that it is a major event in the
apoptotic process. In this work [88], a novel fluorescent silica bioprobe based on
Rhodamine-doped SiNPs modified with Annexin V has been explored, which, in
addition of specifically labeling early stage apoptotic cells, it could but also track the
physiological change process of phosphatidylserine. With the extension of culture
time with paclitaxel (a mitotic inhibitor used in cancer chemotherapy), the number of
the apoptotic cells labeled by SiNPs increased ever more. Meanwhile, red
fluorescence of the SiNPs on the outer membrane of the recognized apoptotic cells
changed from weak to strong, from partially to completely surrounding the cell
membrane (Figure 1.7), which revealed a gradual translocation process of
phosphatidylserine in the early stage apoptotic cell membrane.
Figure 1.7: Dye doped SiNPs for cellular labeling and tracking. Confocal microscopy images of (A) Early-stage apoptotic MCF-7 cells induced with paclitaxel and (B) MCF-7
cells untreated with paclitaxel, incubated with dye-SiNPs conjugated to Annexin V and then stained with Hoechst33258. Subpanels: a) optical image; b), c) are fluorescence images of Hoechst33258 and dye-SiNPs,
respectively; d) is the merged images of b and c. [88]
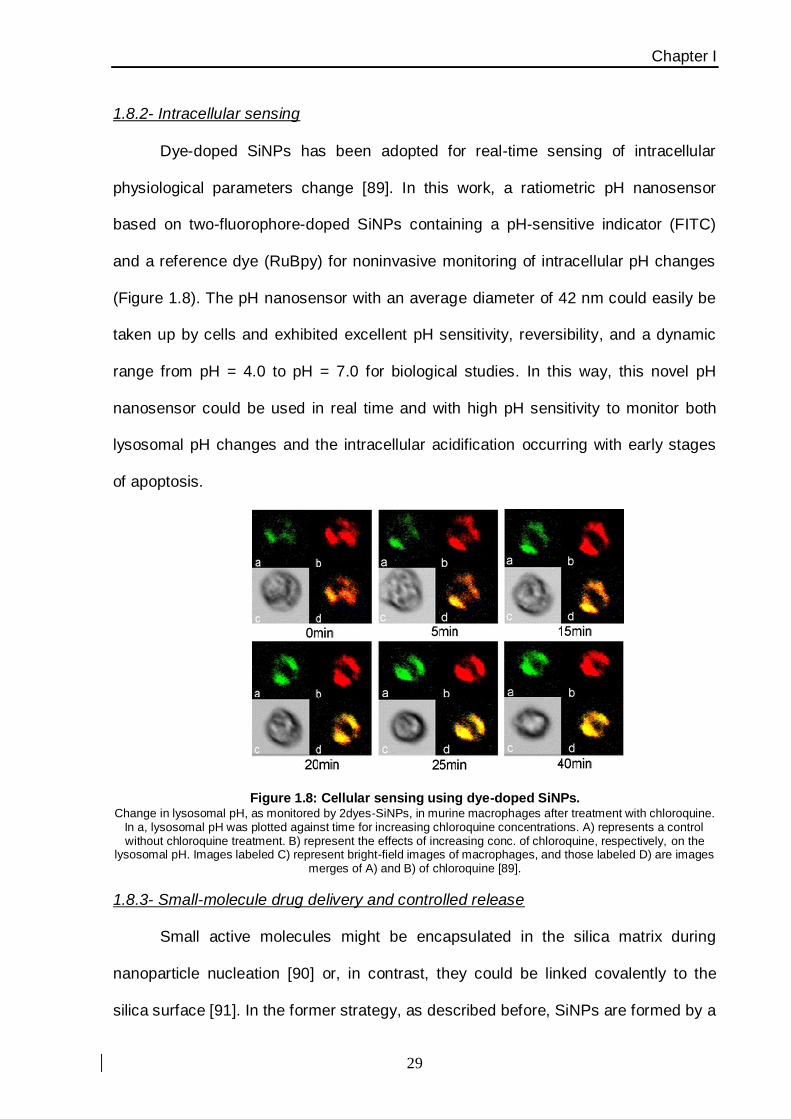
Chapter I
29
1.8.2- Intracellular sensing
Dye-doped SiNPs has been adopted for real-time sensing of intracellular
physiological parameters change [89]. In this work, a ratiometric pH nanosensor
based on two-fluorophore-doped SiNPs containing a pH-sensitive indicator (FITC)
and a reference dye (RuBpy) for noninvasive monitoring of intracellular pH changes
(Figure 1.8). The pH nanosensor with an average diameter of 42 nm could easily be
taken up by cells and exhibited excellent pH sensitivity, reversibility, and a dynamic
range from pH = 4.0 to pH = 7.0 for biological studies. In this way, this novel pH
nanosensor could be used in real time and with high pH sensitivity to monitor both
lysosomal pH changes and the intracellular acidification occurring with early stages
of apoptosis.
Figure 1.8: Cellular sensing using dye-doped SiNPs. Change in lysosomal pH, as monitored by 2dyes-SiNPs, in murine macrophages after treatment with chloroquine.
In a, lysosomal pH was plotted against time for increasing chloroquine concentrations. A) represents a control without chloroquine treatment. B) represent the effects of increasing conc. of chloroquine, respectively, on the
lysosomal pH. Images labeled C) represent bright-field images of macrophages, and those labeled D) are images merges of A) and B) of chloroquine [89].
1.8.3- Small-molecule drug delivery and controlled release
Small active molecules might be encapsulated in the silica matrix during
nanoparticle nucleation [90] or, in contrast, they could be linked covalently to the
silica surface [91]. In the former strategy, as described before, SiNPs are formed by a
Chapter I
30
two-step inorganic poly-condensation reaction consisting of hydrolysis and
condensation; at this stage, adding bioactive molecules during oxidative backbone
formation facilitates their encapsulation within the oxide matrix, leading to the
production of a composite nanomaterial with the active ingredients trapped inside the
silica matrix; in this way, the release occurs by a combination of diffusion of the
encapsulated molecules and dissolution of the silica matrix. According to this, there
are many studies in literature describing the silica degradation over time under
physiological conditions [92].
In order to increase the drug load amount, another kind of SiNPs, synthesized
with large mesoporous, has been selected to fabricate stimuli-responsive intracellular
release systems [93]. Recently have been constructed several controlled release
systems that could be triggered by a range of stimuli, such as light, pH, and redox.
As a title of example example, in the work cited above [93] by grafting a duplex DNA
with a C−Ag+−C structure as a smart molecule-gated switch, the authors have
designed a mesoporous silica thiol-responsive system and they investigated its
intracellular release behavior. In this way they demonstrated that the carriers could
be internalized remarkably into the cells by endocytosis in a couple of hours and
distributed predominantly into lysosomes; later on, the entrapped cargo molecule
could be released from the pores, triggered by intracellular thiol-containing
molecules, such as reduced L-Glutathione and L-Cystine.
For the latter strategy, various covalent conjugation strategies for coupling
drugs on SiNPs have been explored [94,95]. Recently, Cheng and co-workers have
developed a potentially clinically applicable drug-silica nanoconjugate with excellent
control over particle size and drug loading and release profile [96]. The
multialkoxysilane-coupled with different drugs have been synthesized with a

Chapter I
31
degradable ester linker between drug and trialkoxysilane group and then condensed
with tetraalkoxysilane to allow the drug molecules to be incorporated into the
resulting silica NPs; in this way, drugs can be released through the cleavage of the
ester linker. In this paper several anticancer drugs (e. g. camptothecin, paclitaxel,
and docetaxel) and fluorescence dyes (e.g. rhodamine, IR783) conjugated silica NPs
with precisely controlled sizes can be prepared similarly (Figure 1.9).
Figure 1.9: Drug loaded dye-doped SiNPs. Size controlled drug−silica nanoconjugates for cancer therapy: schematic view showing the preparation of
drug/dye−silica nanoparticles accomplished with anticancer drugs (camptothecin, paclitaxel) or fluorescence dyes (rhodamine, IR783); all nanoconjugates have been prepared and PEGylated in situ [96].

Chapter I
32
In conclusion, Silica offers a promising alternative to organic drug delivery
systems and exhibit many unique properties, such as highly controllable size and
shape. Nonporous silica NPs have found numerous biomedical applications for the
delivery of drugs, proteins, and genes and for molecular imaging. However, before
SiNPs can be used routinely in clinic, some major challenges must be overcome,
including the need for improved drug incorporation efficiency, spatial and temporal
control of drug release, highly efficient targeting of disease sites, scalable
manufacturing, long-term stability, and well-understood biocompatibility and potential
toxicity. Organo-silica hybrid NPs are expected to have both unique properties of
SiNPs due to their functionalities. Furthermore, the possibility of directing SiNPs
specifically to disease sites by means of targeting ligands, such as antibodies and
aptamers, also needs to be further explored within a complete understanding of the
toxicity profile and potential environmental impact of SiNPs. This hurdle will need to
be a prerequisite for future clinical applications and safety when using these
nancomplexes.

Chapter I
33
Related References
[1] Ladj, R.; Bittar, A.; Eissa, M.; et al.; J. Mater. Chem. B. 2013, 1, 1381–1396.
[2] Swierczewaska, M.; Lee, S. and Chen, X.; Mol. Imaging. 2011, 10, 3–16.
[3] Peng, G.; Tisch, U.; Adams, O.; et al.; Nat. Nanotech. 2009, 4, 669–673.
[4] Yeom, S. H.; Kang, B. H.; Kim, K. J. and Kang, S. W.; Front. Biosci. (Landmark Ed). 2011, 16, 997–
1023.
[5] Nam, J.; Won, N.; Bang, J.; et al.; Adv. Drug Deliv. Rev. 2013, 65, 662–648.
[6] Hyon, B. N.; Song, I. C. and Hyeon, T.; Adv. Mater. 2009, 21, 2133–2148.
[7] Tan, S.; Li, X.; Guo, Y. and Zhang, Z.; Nanoscale. 2013, 5, 860–872.
[8] Kim, C. S.; Tonga, G. Y.; Solfiell, D. and Rotello, V. M.; Adv. Drug Deliv. Rev. 2013, 65, 93–99.
[9] Huang, H. C.; Barua, S.; Sharma, G.; Dey, S. K. and Rege, K.; J. Control Release. 2011, 155, 344–
357.
[10] Sapsford, K. E.; Algar, W. R.; Berti, L.; et al.; Chem. Rev. 2013, 113, 1904–2074.
[11] Albanese, A.; Tang, P. S. and Chan, W. C. W.; Annu. Rev. Biomed. Eng. 2012, 14, 1–16.
[12] Sperling, R. A.; Gil, P. R.; Zhang, F.; Zanella, M. and Parak, W. J.; Chem. Soc. Rev. 2008, 37,
1896–1908.
[13] Bourinnet, P.; Bengele, H. H.; Bonnemain, B.; et al.; Invest. Radiol. 2006, 41, 313–324.
[14] Hao, R.; Xing, R.; Xu, R.; Hou, Y.; Gao, S. and Sun, S.; Adv. Mater. 2010, 22, 2729–2742.
[15] Jang, J.; Nah, H.; Lee, J. H.; Moon, S. H.; Kim, M. G. and Cheon, J.; Angew. Chem. Int. Ed. 2009,
48, 1234–1238.
[16] Figueroa, A.; Di Corato, R.; Manna, L. and Pellegrino, T.; Pharm. Res. 2010, 62, 126–143.
[17] O'Handley, R.C.; “Modern Magnetic Materials: Principles and Applications” 2000, Publisher Wiley
& Co. ©, New York (USA).
[18] Figueroa, A.; Di Corato, R.; Manna, L. and Pellegrino, T.; Pharm. Res. 2010, 62, 126–143.
[19] Huber, D. L.; Small. 2005, 1, 482–501.
[20] Skorvanek, I. and O’Handley, R. C.; J. Magn. Magn. Mater. 1995, 140, 467–469.
[21] Ling, D. and Hyeon, T.; Small. 2013, 9, 1450–1466.
[22] Massart, E.; IEEE Trans. Magn. 1981, 17, 1247–1248.
[23] Jolivet, J. P.; Tronc, E. and Chaneac, C.; C. R. Chim. 2002, 5, 659–664.
[24] Smolensky, E. D.; Park, H. E.; Berquò T. S. and Pierre, V. C.; Contrast Media Mol. Imaging. 2011,
6, 189–199.
[25] Kumpfer, B. M.; Shinoda, K.; Jeyadevan B. and Kennedy, I. M.; J. Aerosol Sci. 2010, 41, 257–
265.
[26] De Castro, V.; Benito, G.; Hurst, S.; Serna, C. J.; Morales, M. P. and Veintemillas-Vergaguer, S.;
J. Nanosci. Nanotechnol. 2008, 8, 2458–2462.
[27] Hyeon, T.; Lee, S. S.; Park, J.; Chung, Y. and Na, H. B.; J. Am. Chem. Soc. 2001, 123, 12798–
12801.
[28] Thimmaiha, S.; Rajamanthi, M.; Singh, M.; et al.; J. Mater. Chem. 2001, 11, 3215–3221.
[29] Bronstein, L. M.; Huang, X.; Retrum, J.; Schmucker, A.; et al.; Chem. Mater. 2007, 19, 3624–
3632.

Chapter I
34
[30] Gage, S. H.; Stein, B. D.; Nikoshvili, L. Z.; et al.; Langmuir. 2013, 29, 466–473.
[31] Luigjes, B.; Woudenberg, S. M. C.; de Groot, R.; et al.; J. Phys. Chem. C. 2011, 115, 14598–
14605.
[32] Park, J.; An, K.; Hwang, Y.; Park, J. G.; Noh, H. J.; Kim, J. Y.; Park, J. H.; Hwang, N. and Hyeon,
T.; Nat. Mater. 2004, 3, 891–895.
[33] Teng, X. and Yang, H.; J. Mater. Chem. 2004, 14, 774–779.
[34] Jana, N, R.; Chen, Y.; and Peng, X.; Chem. Mater. 2004, 16, 3931–3935.
[35] Huang, J. H.; Parab, H. J.; Liu, R. S.; et al.; J. Phys. Chem. C. 2008, 112, 15684–15690.
[36] Kim, B. H.; Lee, N.; Kim, H.; et al.; J. Am. Chem. Soc. 2011, 133, 12624–12631.
[37] Brown, M. A. and Senelka, R. C. “MRI: Basic Principles and Applications” 2010, Publisher Wiley-
Blackwell & Co. ©, New York (USA).
[38] Jung, C. W. and Jacobs, P.; Magn. Reson. Imaging. 1995, 13, 661–674.
[39] Wang, Y. X.; Hussain, S. M. and Krestin, G. P.; Eur. Radiol. 2001, 11, 2319–2331.
[40] Wunderbaldinger, P.; Josephson, L. and Weissleder, R.; Acad. Radiol. 2002, 9, S304–S306.
[41] Josephson, L.; Tung, C. H.; Moore, A. and Weissleder, R.; Bioconjugate Chem. 1999, 10, 186–
191.
[42] Park, J.; Lee, E.; Hwang, N. M.; et al.; Angew. Chem. Int. Ed. 2005, 44, 2872–2877.
[43] Ho, D.; Sun, X. and Sun, S.; Acc. Chem. Res. 2011, 44, 875–882.
[44] Yoo, D.; Lee, J. H.; Shin, T. H. and Cheon, J.; Acc. Chem. Res. 2011, 44, 863–874.
[45] Huang, H. C.; Barua, S.; Sharma, G.; Dey, S. K. and Rege, K.; J. Control Release. 2011, 155,
344–357.
[46] Dilnawaz, F.; Singh, A.; Mohanty, C. and Sahoo, S. K.; Biomaterials. 2010, 31, 3694–3706.
[47] Nasongkla, N.; Bey, E.; Rey, J.; et al.; Nano Lett. 2006, 6, 2427–2430.
[48] Hwu, J. R; Lin, Y. S.; Josephrajan, T.; et al.; J. Am. Chem. Soc. 2009, 131, 66–68.
[49] Cheng, K.; Peng, S.; Xu, C. and Sun, S.; J. Am. Chem. Soc. 2009, 131, 10637–10644.
[50] Perez, J. M.; Grimm, J.; Josephson, L. and Weissleder, R.; Neoplasia. 2008, 10, 1066–1072.
[51] Grimm, J.; Perez, J. M.; Jospehson, L. and Weissleder, R.; Cancer Res. 2004, 64, 639–643.
[52] Colombo, M.; Ronchi, S.; Monti, M.; Corsi, F.; Trabucchi, E. and Prosperi, D.; Anal. Biochem.
2009, 392, 96–102.
[53] El-Boubbou, M.; Zhu, D. C.; Vasileiou, C.; Borhan, B.; Prosperi, D. and Huang, X.; J. Am. Chem.
Soc. 2010, 132, 4490–4499.
[54] Lee, J. H.; Jang, J. T.; Choi, J. S.; et al.; Nat. Nanotech. 2011, 6, 418–422.
[55] Zhao, Q.; Wang, L.; Cheng, R.; et al.; Theranostic. 2012, 2, 113–121.
[56] Jordan, A.; Scholtz, R.; Maier-Hauss, K.; et al.; J. Neuro. Oncol. 2006, 78, 7–14.
[57] Corsi, F.; Fiandra, L.; De Palma, C.; et al.; ACS Nano. 2011, 5, 6383–6393.
[58] Halas, N. J.; ACS Nano. 2008, 2, 179–183.
[59] Tallury, P.; Payton, K. and Santra, S.; Nanomedicine. 2008, 3, 579–592.
[60] Chu, Z.; Huang, Y.; Tao, Q. and Li, Q; Nanoscale. 2011, 3, 3291–3299.
[61] Prodi, L.; New. J. Chem. 2005, 29, 20–31.
[62] Benezra, M.; Penate-Medina, O.; Zanzonico, P. B.; et al.; J. Clin. Invest. 2011, 121, 2768–2780.
Chapter I
35
[63] Stöber, W.; Fink, A.; Bohn, E; J. Colloid. Interface. Sci. 1968, 26, 62–69.
[64] Bogush, G. H.; Tracy, M. A.; Zukoski, C. F.; J. Non-Cryst. Sol. 1988, 104, 95–106.
[65] Van Blaaderen, A.; Van-Geest, J. and Vrij, A.; J. Colloid. Interface Sci. 1992, 154, 481–501.
[66] Yokoi, T.; Wakabayashi, J.; Otsuka, Y.; et al.; Chem. Mater. 2009, 21, 3719–3729.
[67] Bharali, D. J.; Klejbor, I.; Stachowiak, E. K.; et al.; Proc. Natl. Acad. Sci. 2005, 102, 11539–11544.
[68] Finnie, K. S.; Bartlett, J. R.; Barbè, C. J. A. and Kong, L.; Langmuir. 2007, 23, 3017–3024.
[69] Tang, L.; Fan, T. M.; Borst, L. B. and Cheng, J.; ACS Nano. 2012, 6, 3954–3966.
[70] Guerrero-Martinez, A.; Perez-Juste, J. and Liz-Maran, L. M.; Adv. Mater. 2010, 22, 1182–1195.
[71] Chauan, V. P.; Popovic, Z.; Chen, O.; Cui, J.; Fukumura, D.; Bawendi, M. G. and Jain, R. K.;
Angew. Chem. Int. Ed. 2011, 50, 11417–11420.
[72] Kuijk, A.; van Blaarderen, A. and Imhof, A.; J. Am. Chem. Soc. 2011, 133, 2346–2349.
[73] Gao, C.; Lu, Z. and Yin, Y.; Langmuir. 2011, 27, 12201–12208.
[74] Liu, H. Y.; Chen, D.; Li, L. L.; Liu, T. L.; Tan, L. F. and Tang, F. Q.; Angew. Chem. Int. Ed. 2011,
50, 891–895.
[75] Kim, B.; Han, G.; Toley, B. J.; Kim, C. K.; Rotello, V. M. and Forbes, N. S.; Nat. Nanotechnol.
2010, 5, 465–472.
[76] Graf, C.; Gao, Q.; Schütz, I.; et al.; Langmuir. 2012, 28, 7598–7613.
[77] Rosen, J. E. and Gu, F. X.; Langmuir. 2011, 27, 10507–10513.
[78] Estephan, Z. G.; Jaber, J. A. and Schlenoff, J. B.; Langmuir. 2010, 26, 16884–16889.
[79] He, X. X.; Nie, H. L.; Wang, K. M.; Tan, W. H.; Wu, X.; and Zhang, P. F.; Anal. Chem. 2008, 80,
9597–9603.
[80] Karakoti, A. S.; Das, S.; Thevulthasan, S.; and Seal, S.; Angew. Chem. Int. Ed. 2011, 50, 1980–
1994.
[81] Rio-Echevarria, I. M.; Selvestrel, F.; Segat, D.; et al.; J. Mater. Chem. 2010, 20, 2780–2787.
[82] Ohno, K.; Akashi, T.; Tsujii, Y.; Yamamoto, M. and Tabata, Y.; Biomacromolecules. 2012, 13,
927–936.
[83] Bitar, A.; Ahmad, N. M.; Fessi, H. and Elassari, A.; Drug Discov. Today 2012, 17, 1147–1154.
[84] Tang, L. and Cheng, J.; Nano Today 2013, 8, 290–312.
[85] Wang, K.; He, X.; Yang, X. and Shi, H.; Acc. Chem. Res. 2013, 7, 1367–1376.
[86] Bonacchi, S.; Genovese, D.; Juris, R.; Montalti, M.; Prodi, L.; Rampazzo, E. and Zaccheroni, N.;
Angew. Chem. Int. Ed. 2011, 50, 4056–4066.
[87] He, X.; Duan, J.; Wang, K.; Tan, W.; Lin, X. and He, C.; J. Nanosci. Nanotechnol. 2004, 4, 585–
589.
[88] Shi, H.; He, X.; Wang, K.; et al.; Nanomed: Nanotechnol., Biol., Med. 2007, 3, 266–262.
[89] Peng, J.; He, X.; Wang, K.; Tan, Wl.; Wang, Y. and Liu, Y.; Anal. Bioanal. Chem. 2007, 388, 645–
654.
[90] He, X. X.; Hai, L.; Su, J.; Wang, K. M. and Wu, X.; Nanoscale. 2011, 3, 2936–2842.
[91] Stevens, E. V.; Carpenter, A. W.; Shin, J. H.; Liu, J. S.; Der, C. J.; and Schoenfisch, M. H.; Mol.
Pharm. 2010, 7, 755–785.
[92] Mahon, E.; Hristov, D. R. and Dawson, K. A.; Chem. Commun. 2008, 8, 2483–2487.

Chapter I
36
[93] He, D.; He, X.; Wang, K.; Chen, M.; Cao, J. and Zhao, Y.; J. Mater. Chem. 2012, 22, 14715–
14721.
[94] Georgelin, T.; Bombard, S.; Siaugue, J. M. and Cabuil, V.; Angew. Chem. Int. Ed. 2010, 49,
8897–8901.
[95] Della Rocca, J.; Huxford, R. C.; Costock-Duggan, E. and Lin, W.; Angew. Chem. Int. Ed. 2011,
50, 10330–10334.
[96] Tang, L.; Fan, F. M.; Borst, L. B. and Cheng, J.; ACS Nano. 2012, 6, 3954–3966.
Chapter II
37
Chapter II
Organic Nanoparticles
Chapter II
38
Contents
2.1 Introduction pag 38
2.2 Polymeric nanoparticles: “playing” with chemistry pag 40
2.2.1 Ligands and antibodies
2.2.2 Stimuli−responsive nanocarriers
2.3 PLGA nanoparticles in therapeutics pag 44
2.3.1 Formulations of PLGA nanoparticles
2.3.2 Advantages and drawbacks of PLGA fomulations
2.4 Cancer treatments with PLGA-based nanoparticles pag 48
2.4.1 Passive and active tumor targeting
2.4.2 Cancer chemotherapy
2.4.3 Cancer theragnostic
Related references. pag 51
2.1. Introduction
Nanotechnology has the potential to transform the pharmaceutical field by
offering the ability to encapsulate and strategically deliver drugs, proteins, nucleic
acids, or vaccines thus improving their therapeutic index. Encapsulating
pharmaceuticals in nano- and micro-particles offers a solution to multiple problems in
medicine underscored by the relatively new boom in interests from chemist and
biologists. NPs can be made from various materials including lipids [1]; inorganic
materials such as gold, carbon, and iron oxide [2]; proteins [3]; and polymeric
systems [4]. Lipids, which are widely used and well characterized in carrier systems,
are especially advantageous for targeting, because their dynamic nature allows
clustering of peptides or other ligands, enhancing the affinity of the interaction with
target cells; nevertheless, this same dynamic nature also makes them less stable
than other carriers. Inorganic materials provide the advantage of stability; but again,
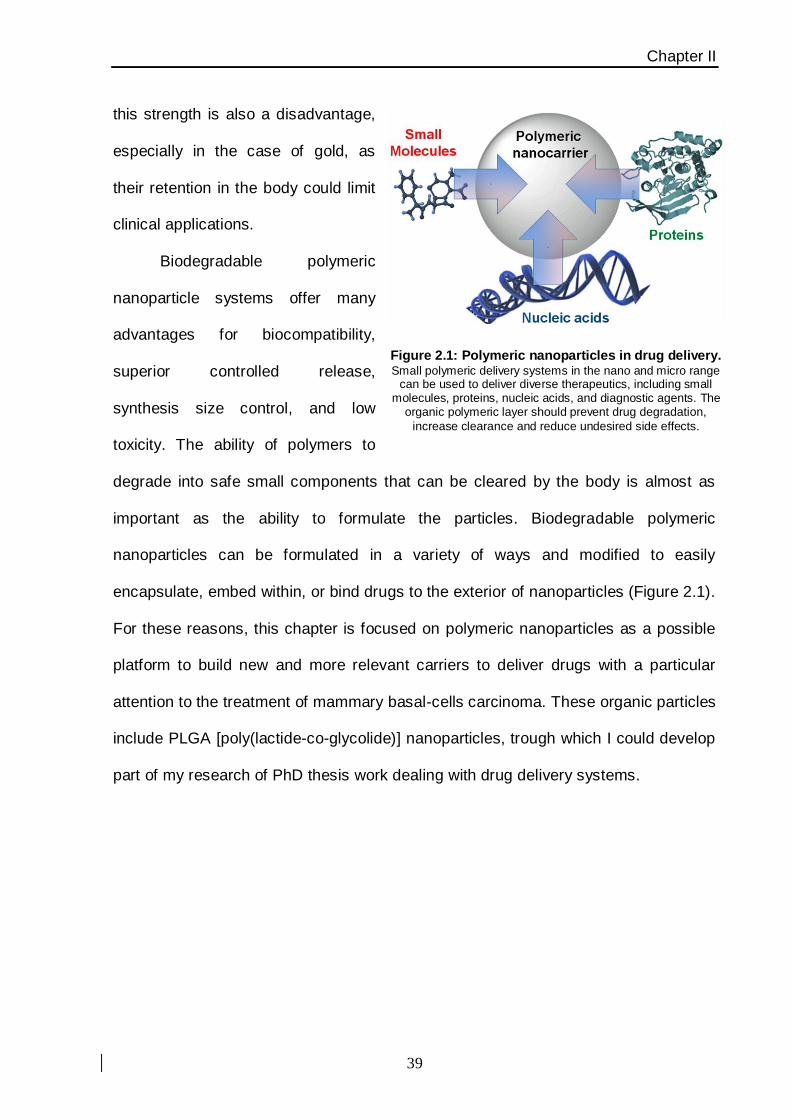
Chapter II
39
this strength is also a disadvantage,
especially in the case of gold, as
their retention in the body could limit
clinical applications.
Biodegradable polymeric
nanoparticle systems offer many
advantages for biocompatibility,
superior controlled release,
synthesis size control, and low
toxicity. The ability of polymers to
degrade into safe small components that can be cleared by the body is almost as
important as the ability to formulate the particles. Biodegradable polymeric
nanoparticles can be formulated in a variety of ways and modified to easily
encapsulate, embed within, or bind drugs to the exterior of nanoparticles (Figure 2.1).
For these reasons, this chapter is focused on polymeric nanoparticles as a possible
platform to build new and more relevant carriers to deliver drugs with a particular
attention to the treatment of mammary basal-cells carcinoma. These organic particles
include PLGA [poly(lactide-co-glycolide)] nanoparticles, trough which I could develop
part of my research of PhD thesis work dealing with drug delivery systems.
Figure 2.1: Polymeric nanoparticles in drug delivery. Small polymeric delivery systems in the nano and micro range
can be used to deliver diverse therapeutics, including small molecules, proteins, nucleic acids, and diagnostic agents. The
organic polymeric layer should prevent drug degradation,
increase clearance and reduce undesired side effects.
Chapter II
40
2.2. Polymeric nanoparticles: “playing” with chemistry
2.2.1 Ligands and antibodies
Nanotechnology field is starting to evolve and take advantage of biological,
chemical, and physical properties. In this framework the chemical targeting of NPs
involves multiple advanced strategies that may include materials that are cellular
environment responsive. These multiple strategies can be applied independently or
combined to improve therapeutic delivery.
Nanoparticle targeting with antibodies or ligands has been greatly applied in
cancer and immunological diseases. For instance, several strategies take advantage
of popular cell surface targets that are overexpressed by cancer cells. The most
common targets include the epidermal growth factor receptor (EGFR), vascular
endothelial growth factor, folate receptor, the transferrin receptor, and several
glycoproteins, among others. EGFR, a receptor highly expressed in breast cancer,
has been used with PLGA nanoparticles containing rapamycin that were surface-
conjugated with an EGFR antibody [5]. Although in vitro results usually do not reflect
what happens in vivo, current proof-of-concept experiments support the notion that
targeting will help improve therapeutic delivery. Antibody-conjugated nanoparticles
can also be used for the targeted delivery of nucleic acids. The use of siRNA as a
therapeutic has shown a lot of promise, but the main obstacle is preventing it from
degrading upon delivery and improved targeting. CALAA-01, a nanoparticle
formulation to deliver siRNA in tumor cells, is the first nanoparticle of its type to enter
human clinical trials [6] The nanoparticle consists of a cyclodextrin engulfed into a
polymer and surrounded by PEG chains. Developments resulting from CALAA-01
clinical trials will help pave the way when considering the design, safety, and ef ficacy
of targeted siRNA delivery systems
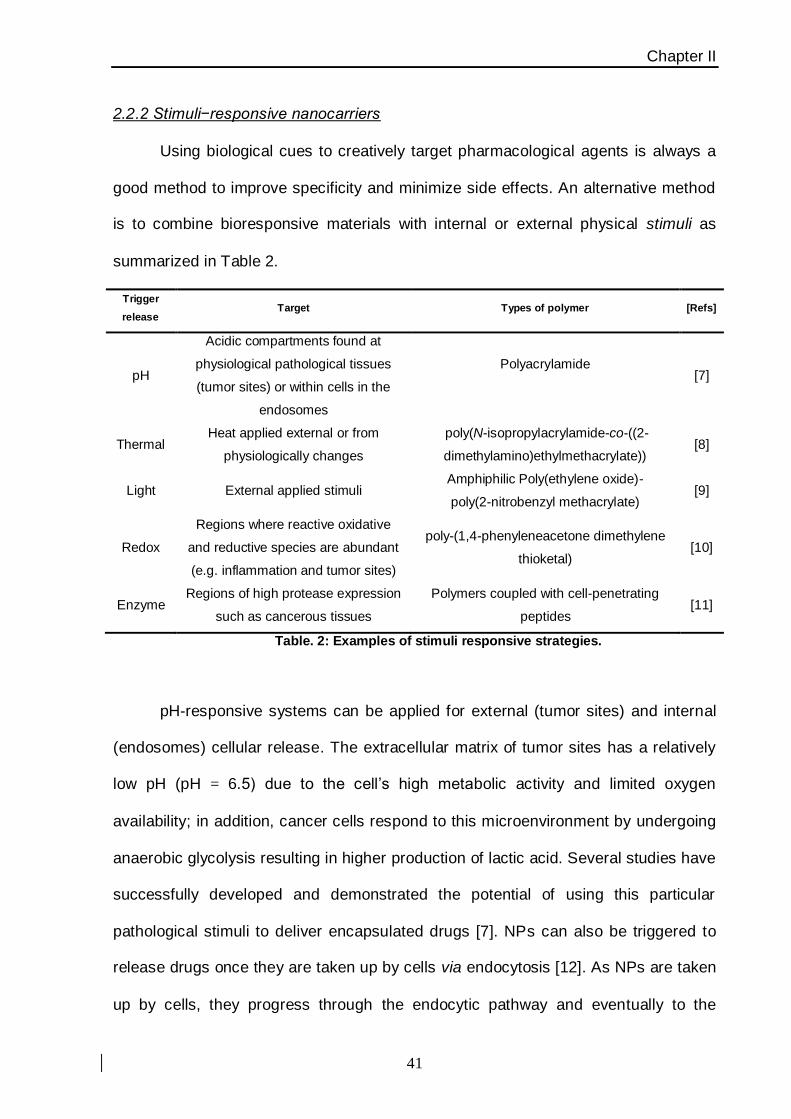
Chapter II
41
2.2.2 Stimuli−responsive nanocarriers
Using biological cues to creatively target pharmacological agents is always a
good method to improve specificity and minimize side effects. An alternative method
is to combine bioresponsive materials with internal or external physical stimuli as
summarized in Table 2.
Trigger
release Target Types of polymer [Refs]
pH
Acidic compartments found at
physiological pathological tissues
(tumor sites) or within cells in the
endosomes
Polyacrylamide
[7]
Thermal Heat applied external or from
physiologically changes
poly(N-isopropylacrylamide-co-((2-
dimethylamino)ethylmethacrylate)) [8]
Light External applied stimuli Amphiphilic Poly(ethylene oxide)-
poly(2-nitrobenzyl methacrylate) [9]
Redox
Regions where reactive oxidative
and reductive species are abundant
(e.g. inflammation and tumor sites)
poly-(1,4-phenyleneacetone dimethylene
thioketal) [10]
Enzyme Regions of high protease expression
such as cancerous tissues
Polymers coupled with cell-penetrating
peptides [11]
Table. 2: Examples of stimuli responsive strategies.
pH-responsive systems can be applied for external (tumor sites) and internal
(endosomes) cellular release. The extracellular matrix of tumor sites has a relatively
low pH (pH = 6.5) due to the cell’s high metabolic activity and limited oxygen
availability; in addition, cancer cells respond to this microenvironment by undergoing
anaerobic glycolysis resulting in higher production of lactic acid. Several studies have
successfully developed and demonstrated the potential of using this particular
pathological stimuli to deliver encapsulated drugs [7]. NPs can also be triggered to
release drugs once they are taken up by cells via endocytosis [12]. As NPs are taken
up by cells, they progress through the endocytic pathway and eventually to the

Chapter II
42
lysosome; the early endosome begins to acidify within minutes and progressively
becomes more acidic as it moves toward the lysosomes where the pH can be as low
as 4. The pH difference within endosomes is an attractive system because particles
can be maintained in stable conditions until they enter the targeted cells. In addition,
changes in ionic strength causes a
proton “sponge” effect in certain
cationic buffering polymers that
can allow the endosome to release
the encapsulated molecule (Figure
2.2).
Thermally responsive
polymeric nanoparticles can be
used to take advantage of local
temperature differences or via
external heat application. NPs that
contain temperature-sensitive
polymers can shrink or expand
when triggered by heat; indeed the balance between the hydrophobic and hydrophilic
segments determines the sensitivity of heat. Recent in vivo studies are also
beginning to show some promising results to treat cancer using thermosensitive
nanoparticles based on PNIPAM, poly(N-isopropylacrylamide-methacrylate)
copolymers [8].
Light-activated particles are created using optically active substances such as
functional dyes, metals, and light-sensitive polymers that are capable of degrading or
releasing their cargo [9]; these systems can incorporate a chromophore that can
Figure 2.2: pH triggered release. Polymeric pH-sensitive systems allow efficient entry into cells followed by cargo release in response to acid conditions of the endosome. Thus the drug is release and can accumulate into
the cytoplasm of the cell exploiting its effect.

Chapter II
43
absorb light, which is then dissipated locally as heat, ultimately altering the swelling
of the particle. There are limitations, however, because most visible light cannot
penetrate deep into tissue and the conversion of light into thermal energy is usually
slow.
Furthermore, in cancer therapeutics tumor expansion followed by metastasis
requires a breakdown of extracellular matrix by proteases. Matrix metalloproteases 2
and 9 are highly expressed in the tumor microenvironment and promote
angiogenesis for the tumor. These proteases usually cleave a conserved peptide
sequence and, for this reason, many polymeric nanocarriers have been developed to
take advantage of this specific protease activity and implement a short cleavable
sequence to target release of cargo or activate an additional targeting module such
as a cell-penetrating peptide [11] Unfortunately, the tumor protease targeting activity
revealed that metalloproteinase targeting is not as efficient is most likely due to
cleavage in the vascular compartment rather than one’s in tumor site; this is why it is
so important enhanced this targeting within cell-penetrating peptides [11].
Finally, since redox changes associated with tumor cytoplasmatic
compartment have been identified as a viable biomarker for tumor progression and
cancer drug resistance, reductive species over-expressed in tumor
microenvironments, such as glutathione, provide another way for selective tumor
targeting. Hence, bioreductive polymers based for example on trimethyl-locked
benzoquinone can be chemically transformed into lactone triggered by two-electron
reduction [13]. From this rationale, prodrugs and bio-imaging molecules have been
based on the bioreductive cleavage of the polymer by reductive molecules and
suggested for solid tumor-selective drug delivery and imaging triggered by redox
changes occurring in tumor hypoxia.
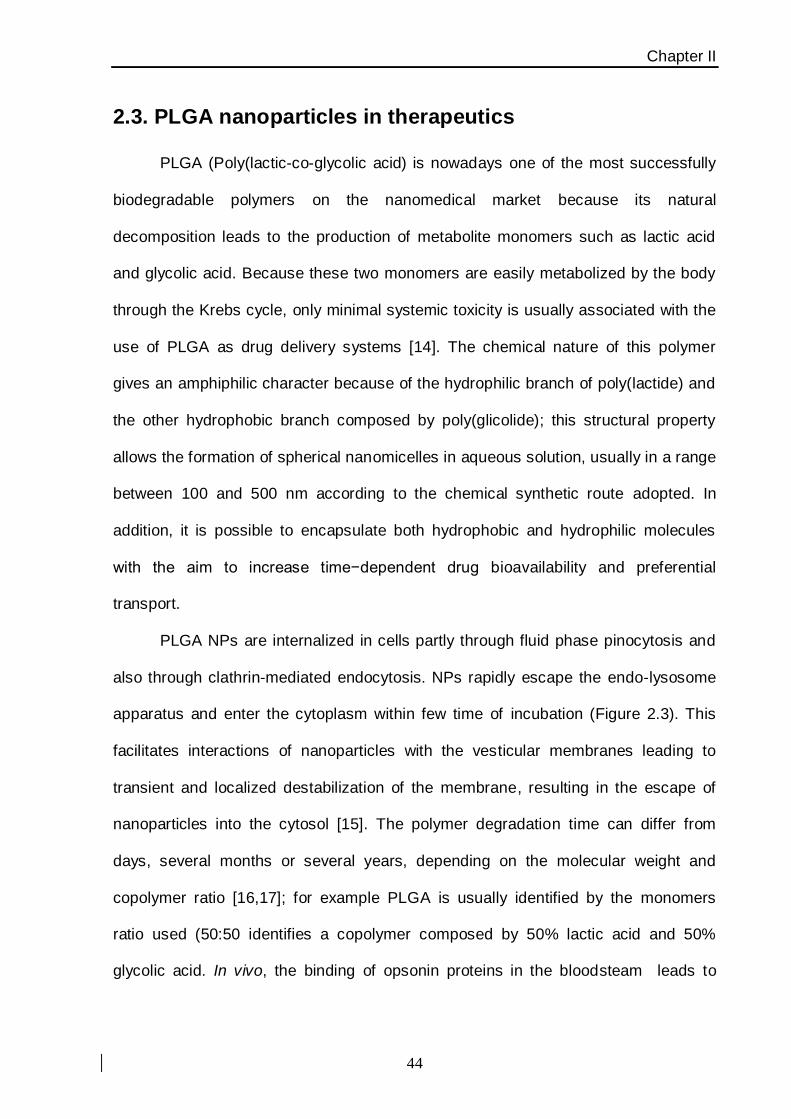
Chapter II
44
2.3. PLGA nanoparticles in therapeutics
PLGA (Poly(lactic-co-glycolic acid) is nowadays one of the most successfully
biodegradable polymers on the nanomedical market because its natural
decomposition leads to the production of metabolite monomers such as lactic acid
and glycolic acid. Because these two monomers are easily metabolized by the body
through the Krebs cycle, only minimal systemic toxicity is usually associated with the
use of PLGA as drug delivery systems [14]. The chemical nature of this polymer
gives an amphiphilic character because of the hydrophilic branch of poly(lactide) and
the other hydrophobic branch composed by poly(glicolide); this structural property
allows the formation of spherical nanomicelles in aqueous solution, usually in a range
between 100 and 500 nm according to the chemical synthetic route adopted. In
addition, it is possible to encapsulate both hydrophobic and hydrophilic molecules
with the aim to increase time−dependent drug bioavailability and preferential
transport.
PLGA NPs are internalized in cells partly through fluid phase pinocytosis and
also through clathrin-mediated endocytosis. NPs rapidly escape the endo-lysosome
apparatus and enter the cytoplasm within few time of incubation (Figure 2.3). This
facilitates interactions of nanoparticles with the vesticular membranes leading to
transient and localized destabilization of the membrane, resulting in the escape of
nanoparticles into the cytosol [15]. The polymer degradation time can differ from
days, several months or several years, depending on the molecular weight and
copolymer ratio [16,17]; for example PLGA is usually identified by the monomers
ratio used (50:50 identifies a copolymer composed by 50% lactic acid and 50%
glycolic acid. In vivo, the binding of opsonin proteins in the bloodsteam leads to
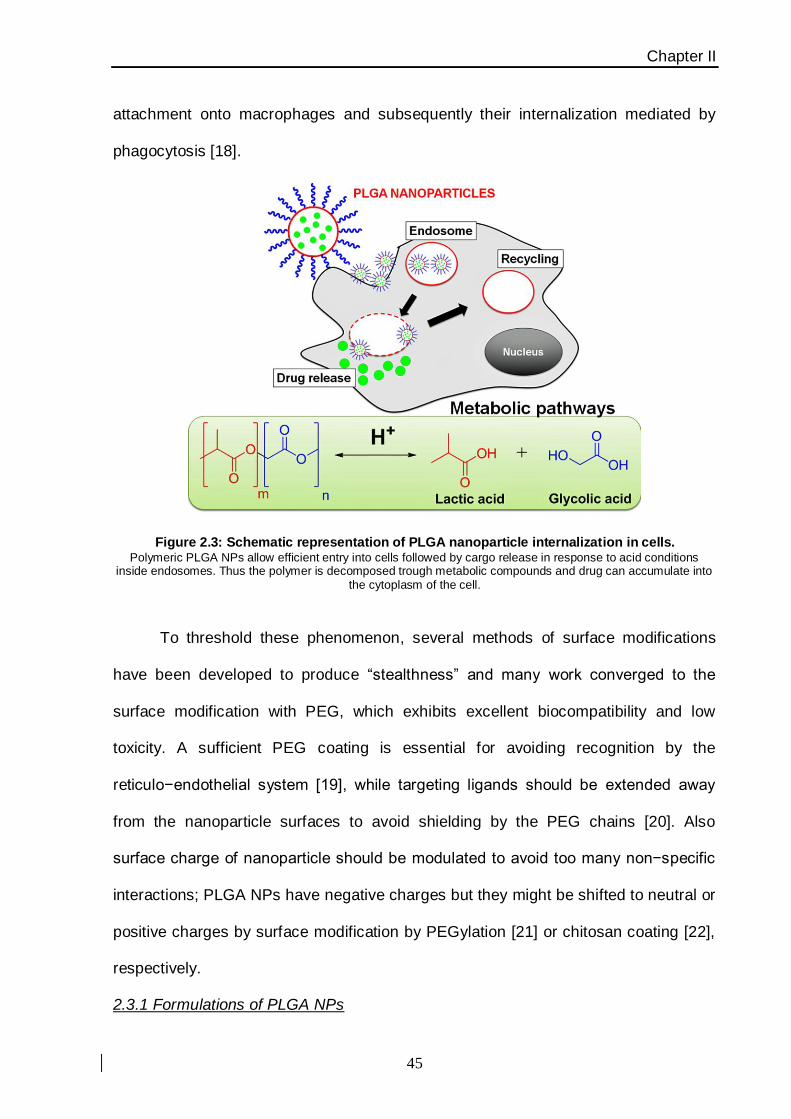
Chapter II
45
attachment onto macrophages and subsequently their internalization mediated by
phagocytosis [18].
Figure 2.3: Schematic representation of PLGA nanoparticle internalization in cells. Polymeric PLGA NPs allow efficient entry into cells followed by cargo release in response to acid conditions
inside endosomes. Thus the polymer is decomposed trough metabolic compounds and drug can accumulate into the cytoplasm of the cell.
To threshold these phenomenon, several methods of surface modifications
have been developed to produce “stealthness” and many work converged to the
surface modification with PEG, which exhibits excellent biocompatibility and low
toxicity. A sufficient PEG coating is essential for avoiding recognition by the
reticulo−endothelial system [19], while targeting ligands should be extended away
from the nanoparticle surfaces to avoid shielding by the PEG chains [20]. Also
surface charge of nanoparticle should be modulated to avoid too many non−specific
interactions; PLGA NPs have negative charges but they might be shifted to neutral or
positive charges by surface modification by PEGylation [21] or chitosan coating [22],
respectively.
2.3.1 Formulations of PLGA NPs

Chapter II
46
The drug is entrapped inside the core of a “nanocapsule” as well as adsorbed
on the surface of a matrix “nanosphere”. The nanosized droplets are induced by
sonication or homogenization and, later, the solvent is evaporated or extracted and
the nanoparticles collected after centrifugation [23]. Another method, called
water/oil/water double emulsion synthesis is instead used to encapsulate hydrophilic
drugs, such as peptides, proteins and nucleic acids [24]. PLGA NPs can also be
formulated by the nanoprecipitation method [25]: the drug and the polymer are
soaked into an organic solvent (such as acetone or ethanol) and added dropwise to
water; the organic solvent is then allowed to evaporate and NPs are collected by
centrifugation. Unluckily, even if this technique is the easiest to reproduce, it doesn’t
allow to obtain a monodisperse suspension of NPs and also drug encapsulation yield
is not very high.
2.3.2 Advantages and drawbacks of PLGA formulations
Formulations need to have a high percentage of loaded drug but a precise
determination of the drug content is not easy since that NPs are colloidal systems.
One of the major pitfalls of PLGA-based carriers relates to the poor loading; indeed,
while PLGA-based nanoparticles often present high encapsulation efficiency, the final
drug loading is generally poor (≈ 1 wt.% which means that NPs content 1 mg active
ingredient each 100 mg of polymers). A second important drawback consists in the
high burst release of drug from the polymer matrix and this phenomenon is common
for most of PLGA-based construct. Consequently, the drug might not be able to
reach the target tissue or cells, leading to a loss of efficacy. Considering the
application of NPs in sustained drug delivery, drug release mechanisms are also very
important to understand. Kumari and colleagues [14] describes five mechanisms of
drug release: (i) desorption of drug bound to the surface, (ii) diffusion through the
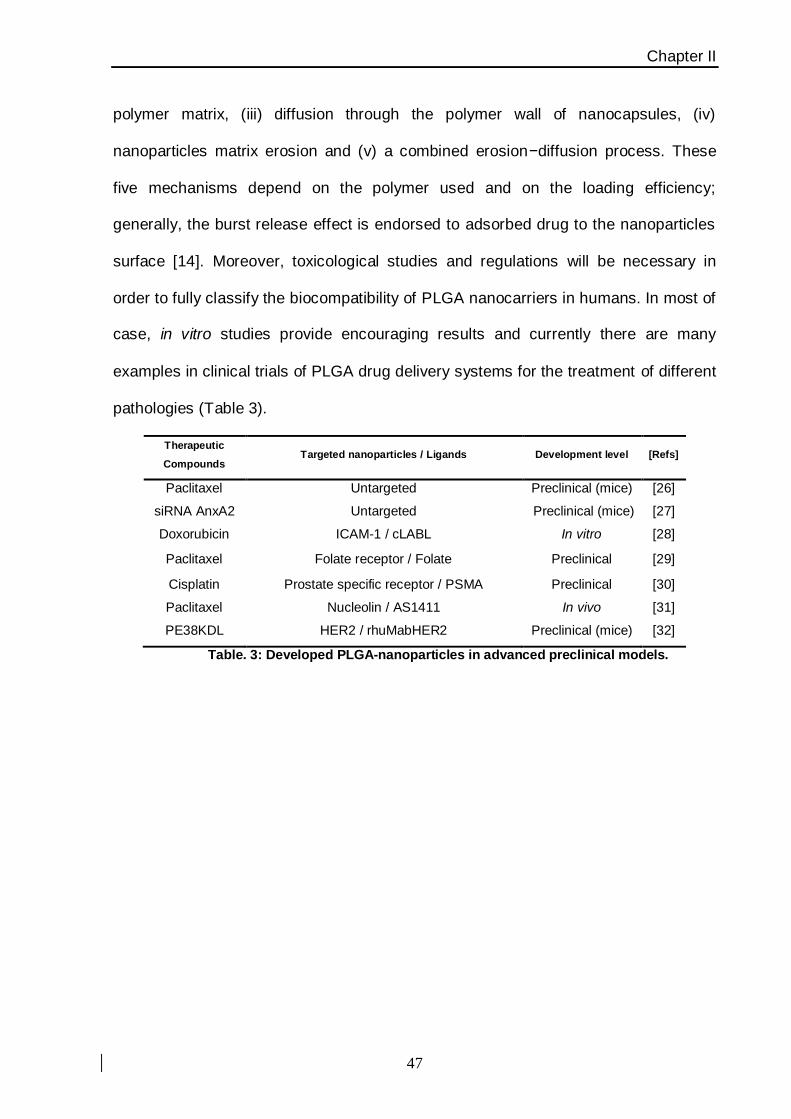
Chapter II
47
polymer matrix, (iii) diffusion through the polymer wall of nanocapsules, (iv)
nanoparticles matrix erosion and (v) a combined erosion−diffusion process. These
five mechanisms depend on the polymer used and on the loading efficiency;
generally, the burst release effect is endorsed to adsorbed drug to the nanoparticles
surface [14]. Moreover, toxicological studies and regulations will be necessary in
order to fully classify the biocompatibility of PLGA nanocarriers in humans. In most of
case, in vitro studies provide encouraging results and currently there are many
examples in clinical trials of PLGA drug delivery systems for the treatment of different
pathologies (Table 3).
Therapeutic
Compounds Targeted nanoparticles / Ligands Development level [Refs]
Paclitaxel Untargeted Preclinical (mice) [26]
siRNA AnxA2 Untargeted Preclinical (mice) [27]
Doxorubicin ICAM-1 / cLABL In vitro [28]
Paclitaxel Folate receptor / Folate Preclinical [29]
Cisplatin Prostate specific receptor / PSMA Preclinical [30]
Paclitaxel Nucleolin / AS1411 In vivo [31]
PE38KDL HER2 / rhuMabHER2 Preclinical (mice) [32]
Table. 3: Developed PLGA-nanoparticles in advanced preclinical models.

Chapter II
48
2.4. Cancer treatments with PLGA-based nanoparticles
2.4.1 Passive and active tumor targeting
Chemotherapeutic agents
damage healthy tissues, leading
to systemic toxicity and adverse
effects that greatly limit the
maximum tolerated dose of
anticancer drugs and thus restricts
their therapeutic efficacy. In
general, nanoparticles can
achieve tumors via an active or
passive targeting. The Passive targeting (Figure 2.4) takes advantage of the size of
nanoparticles and exploits the unique anatomical and pathological abnormalities of
the tumor vasculature. NPs can extravasate and accumulate inside the interstitial
space: this contributes to an “enhanced permeability”. Moreover, lymphatic vessels
are absent or ineffective in tumors, leading to inefficient drainage of the tumor tissue:
this contributes to an “enhanced retention”. Taken together these two phenomena
constitute the “Enhanced Permeability and Retention” (EPR) effect [33].
In Active targeting (Figure 2.4), targeting ligands are grafted at the
nanoparticles surface [21]. The ligand is chosen to bind specific receptors
over−expressed by tumor cells or tumor vasculature and not−expressed by normal
cells. Another important factor in the choice of targeting ligands is the homogeneity of
the expression of the receptor on all targeted cells. Nevertheless, this information is
often deficient. Two cellular targets can be distinguished: (i) cancer cells and (ii)
tumoral endothelial cells. To target cancer cells, several over−expressed receptors
Figure 2.4: Passive and active cancer targeting. Nanocarriers can reach tumors selectively through the leaky
vasculature surrounding the tumors. Ligands grafted on their surface bind to receptors expressed by cancer cells (green) or angiogenic
endothelial cells (pink).
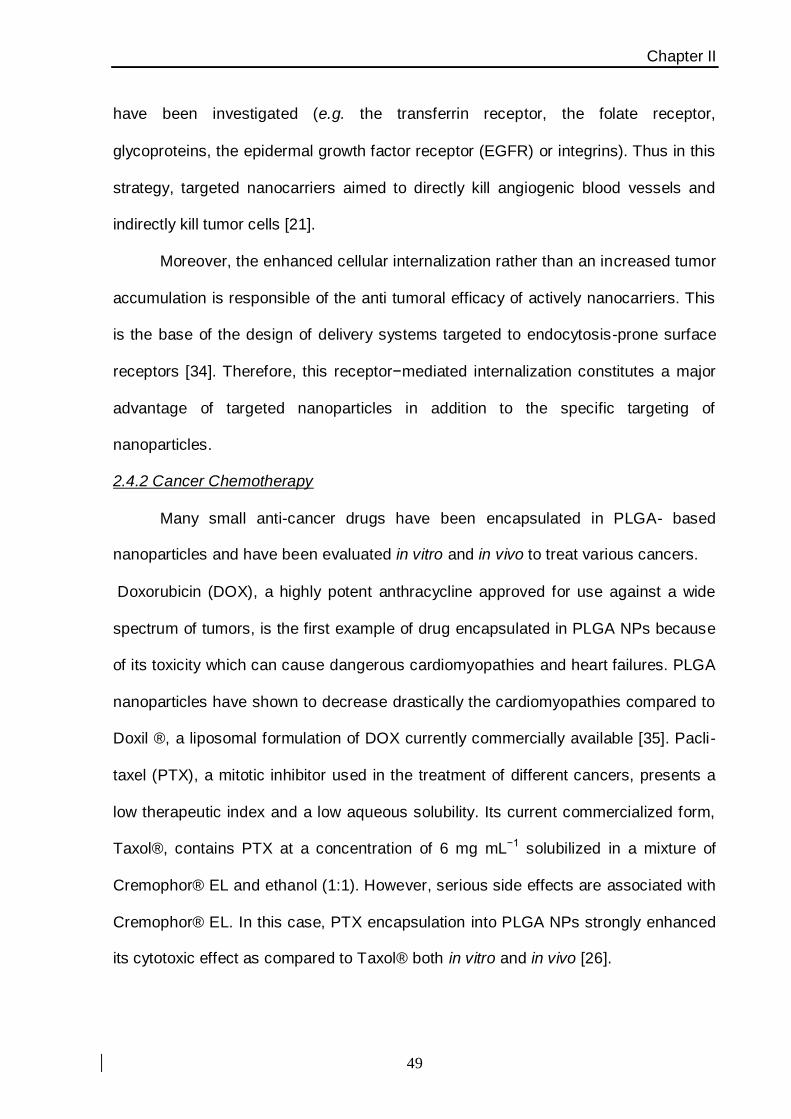
Chapter II
49
have been investigated (e.g. the transferrin receptor, the folate receptor,
glycoproteins, the epidermal growth factor receptor (EGFR) or integrins). Thus in this
strategy, targeted nanocarriers aimed to directly kill angiogenic blood vessels and
indirectly kill tumor cells [21].
Moreover, the enhanced cellular internalization rather than an increased tumor
accumulation is responsible of the anti tumoral efficacy of actively nanocarriers. This
is the base of the design of delivery systems targeted to endocytosis-prone surface
receptors [34]. Therefore, this receptor−mediated internalization constitutes a major
advantage of targeted nanoparticles in addition to the specific targeting of
nanoparticles.
2.4.2 Cancer Chemotherapy
Many small anti-cancer drugs have been encapsulated in PLGA- based
nanoparticles and have been evaluated in vitro and in vivo to treat various cancers.
Doxorubicin (DOX), a highly potent anthracycline approved for use against a wide
spectrum of tumors, is the first example of drug encapsulated in PLGA NPs because
of its toxicity which can cause dangerous cardiomyopathies and heart failures. PLGA
nanoparticles have shown to decrease drastically the cardiomyopathies compared to
Doxil ®, a liposomal formulation of DOX currently commercially available [35]. Pacli-
taxel (PTX), a mitotic inhibitor used in the treatment of different cancers, presents a
low therapeutic index and a low aqueous solubility. Its current commercialized form,
Taxol®, contains PTX at a concentration of 6 mg mL−1 solubilized in a mixture of
Cremophor® EL and ethanol (1:1). However, serious side effects are associated with
Cremophor® EL. In this case, PTX encapsulation into PLGA NPs strongly enhanced
its cytotoxic effect as compared to Taxol® both in vitro and in vivo [26].
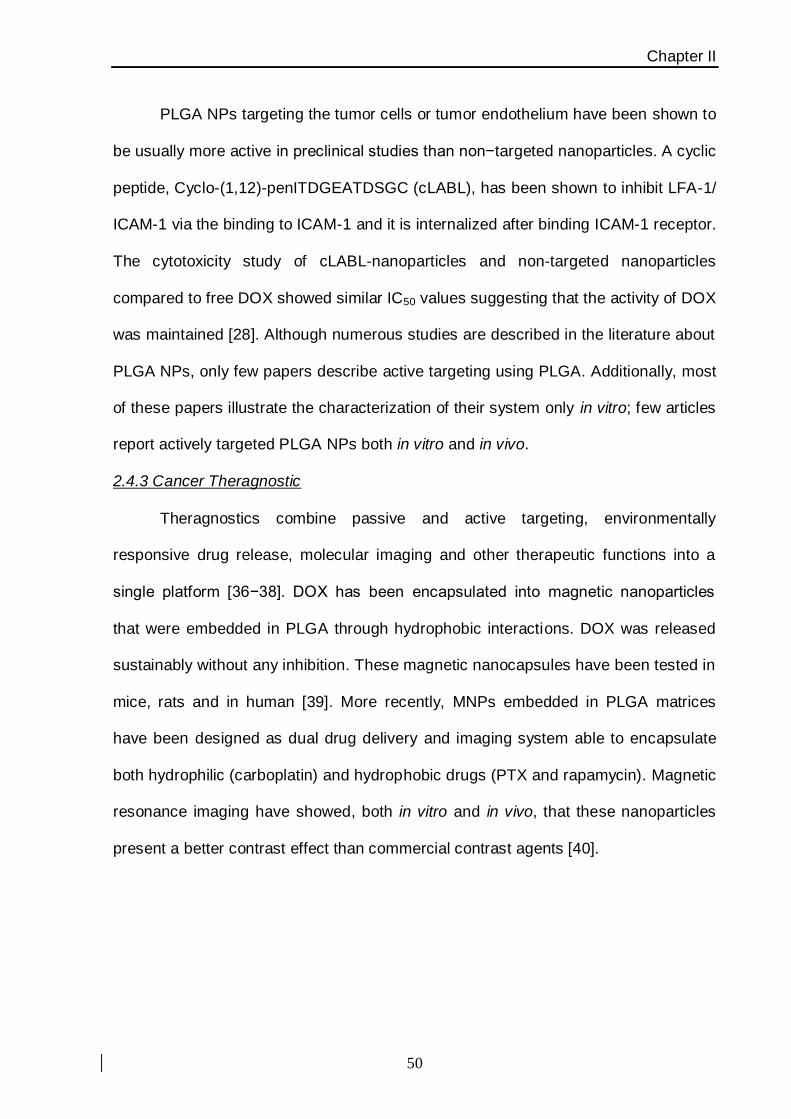
Chapter II
50
PLGA NPs targeting the tumor cells or tumor endothelium have been shown to
be usually more active in preclinical studies than non−targeted nanoparticles. A cyclic
peptide, Cyclo-(1,12)-penITDGEATDSGC (cLABL), has been shown to inhibit LFA-1/
ICAM-1 via the binding to ICAM-1 and it is internalized after binding ICAM-1 receptor.
The cytotoxicity study of cLABL-nanoparticles and non-targeted nanoparticles
compared to free DOX showed similar IC50 values suggesting that the activity of DOX
was maintained [28]. Although numerous studies are described in the literature about
PLGA NPs, only few papers describe active targeting using PLGA. Additionally, most
of these papers illustrate the characterization of their system only in vitro; few articles
report actively targeted PLGA NPs both in vitro and in vivo.
2.4.3 Cancer Theragnostic
Theragnostics combine passive and active targeting, environmentally
responsive drug release, molecular imaging and other therapeutic functions into a
single platform [36−38]. DOX has been encapsulated into magnetic nanoparticles
that were embedded in PLGA through hydrophobic interactions. DOX was released
sustainably without any inhibition. These magnetic nanocapsules have been tested in
mice, rats and in human [39]. More recently, MNPs embedded in PLGA matrices
have been designed as dual drug delivery and imaging system able to encapsulate
both hydrophilic (carboplatin) and hydrophobic drugs (PTX and rapamycin). Magnetic
resonance imaging have showed, both in vitro and in vivo, that these nanoparticles
present a better contrast effect than commercial contrast agents [40].
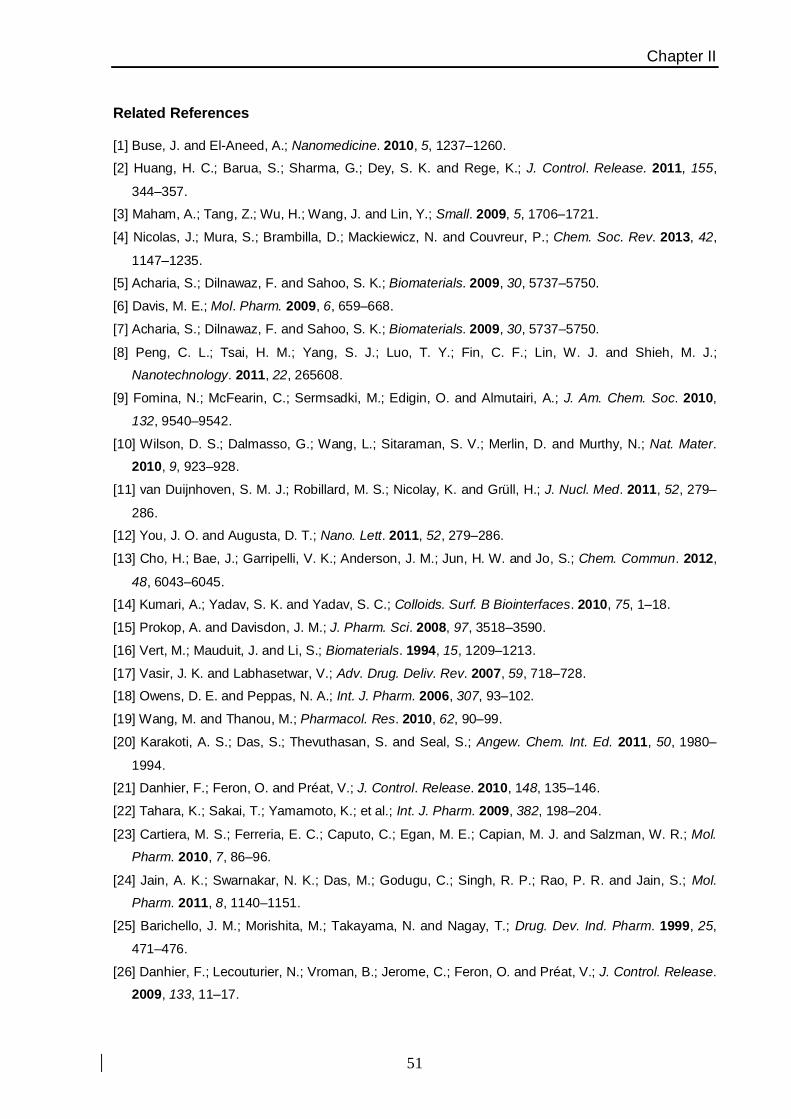
Chapter II
51
Related References
[1] Buse, J. and El-Aneed, A.; Nanomedicine. 2010, 5, 1237–1260.
[2] Huang, H. C.; Barua, S.; Sharma, G.; Dey, S. K. and Rege, K.; J. Control. Release. 2011, 155,
344–357.
[3] Maham, A.; Tang, Z.; Wu, H.; Wang, J. and Lin, Y.; Small. 2009, 5, 1706–1721.
[4] Nicolas, J.; Mura, S.; Brambilla, D.; Mackiewicz, N. and Couvreur, P.; Chem. Soc. Rev. 2013, 42,
1147–1235.
[5] Acharia, S.; Dilnawaz, F. and Sahoo, S. K.; Biomaterials. 2009, 30, 5737–5750.
[6] Davis, M. E.; Mol. Pharm. 2009, 6, 659–668.
[7] Acharia, S.; Dilnawaz, F. and Sahoo, S. K.; Biomaterials. 2009, 30, 5737–5750.
[8] Peng, C. L.; Tsai, H. M.; Yang, S. J.; Luo, T. Y.; Fin, C. F.; Lin, W. J. and Shieh, M. J.;
Nanotechnology. 2011, 22, 265608.
[9] Fomina, N.; McFearin, C.; Sermsadki, M.; Edigin, O. and Almutairi, A.; J. Am. Chem. Soc. 2010,
132, 9540–9542.
[10] Wilson, D. S.; Dalmasso, G.; Wang, L.; Sitaraman, S. V.; Merlin, D. and Murthy, N.; Nat. Mater.
2010, 9, 923–928.
[11] van Duijnhoven, S. M. J.; Robillard, M. S.; Nicolay, K. and Grüll, H.; J. Nucl. Med. 2011, 52, 279–
286.
[12] You, J. O. and Augusta, D. T.; Nano. Lett. 2011, 52, 279–286.
[13] Cho, H.; Bae, J.; Garripelli, V. K.; Anderson, J. M.; Jun, H. W. and Jo, S.; Chem. Commun. 2012,
48, 6043–6045.
[14] Kumari, A.; Yadav, S. K. and Yadav, S. C.; Colloids. Surf. B Biointerfaces. 2010, 75, 1–18.
[15] Prokop, A. and Davisdon, J. M.; J. Pharm. Sci. 2008, 97, 3518–3590.
[16] Vert, M.; Mauduit, J. and Li, S.; Biomaterials. 1994, 15, 1209–1213.
[17] Vasir, J. K. and Labhasetwar, V.; Adv. Drug. Deliv. Rev. 2007, 59, 718–728.
[18] Owens, D. E. and Peppas, N. A.; Int. J. Pharm. 2006, 307, 93–102.
[19] Wang, M. and Thanou, M.; Pharmacol. Res. 2010, 62, 90–99.
[20] Karakoti, A. S.; Das, S.; Thevuthasan, S. and Seal, S.; Angew. Chem. Int. Ed. 2011, 50, 1980–
1994.
[21] Danhier, F.; Feron, O. and Préat, V.; J. Control. Release. 2010, 148, 135–146.
[22] Tahara, K.; Sakai, T.; Yamamoto, K.; et al.; Int. J. Pharm. 2009, 382, 198–204.
[23] Cartiera, M. S.; Ferreria, E. C.; Caputo, C.; Egan, M. E.; Capian, M. J. and Salzman, W. R.; Mol.
Pharm. 2010, 7, 86–96.
[24] Jain, A. K.; Swarnakar, N. K.; Das, M.; Godugu, C.; Singh, R. P.; Rao, P. R. and Jain, S.; Mol.
Pharm. 2011, 8, 1140–1151.
[25] Barichello, J. M.; Morishita, M.; Takayama, N. and Nagay, T.; Drug. Dev. Ind. Pharm. 1999, 25,
471–476.
[26] Danhier, F.; Lecouturier, N.; Vroman, B.; Jerome, C.; Feron, O. and Préat, V.; J. Control. Release.
2009, 133, 11–17.
Chapter II
52
[27] Braden, A. R.; Kafka, M. T.; Cunningham, L.; Jones, H. and Vishwanatha, J. K.; J. Nanosci.
Nanotechnol. 2009, 9, 2856–2865.
[28] Chittasupho, C.; Xie, S. X.; Baoum, A.; Yakovleva, T.; Siahaan, T. J. and Berkland, C. J.; Eur. J.
Pharm. Sci. 2009, 37, 141–150.
[29] Liang, C.; Yang, Y.; Ling, Y.; Huang, Y. and Li, X.; Bioorg. Med. Chem. 2011, 19, 4057–4066.
[30] Dhar, S.; Gu, F. X.; Langer, R.; Farokhzad, O. C. and Lippard, S. J.; Proc. Natl. Acad. Sci. 2008,
105, 17356–17361.
[31] Guo, J.; Gao, X.; Su, L.; et al.; Biomaterials. 2011, 31, 8010–8020.
[32] Chen, H.; Gao, J.; Lu, Y.; et al.; J. Control. Release. 2008, 128, 209–216.
[33] Matsumura, Y. and Maeda, H.; Cancer Res. 1986, 46, 6387–6392.
[34] Kirpotin, D. B.; Drummond, D. C.; Shao, Y.; et al.; Cancer Res. 2006, 66, 6732–6740.
[35] Park, J.; Fong, F. M.; Lu, J.; et al.; Nanomedicine. 2009, 5, 410–418.
[36] Danhier, F.; Ansorena, E.; Silva, J. M.; Coco, R.; Le Breton, A. and Préat, V.; J. Control. Release.
2012, 161, 505–532.
[37] Martin−Banderas, L.; Lobato, M.; Rubio, I.; et al.; Rev. Med. Chem. 2013, 13, 58–69.
[38] Morachis, J. M; Mahmoud, E. A. and Almutairi, A.; Pharmacol. Rev. 2012, 64, 505–519.
[39] Janib, S. M; Moses, A. S. and Mackay, J. A.; Adv. Drug. Deliv. Rev. 2010, 62, 1052–1063.
[40] Singh, A.; Dilnawaz, F.; Mewar, S.; Sharma, U.; Jagannathan, N. R. and Sahoo, S. K.; ACS Appl.
Mater. Interfaces. 2011, 3, 842–856.

Second Section
Second Section

Chapter III
54
Chapter III
Materials and Methods
Chapter III
55
Contents
3.1 Characterization challenges pag 56
3.2 Nanoparticle core size, shape and properties pag 58
3.2.1 Transmission and scanning electron microscopy (TEM / SEM)
3.2.2 Dynamic light scattering (DLS)
3.2.3 Sight distribution spectra
3.2.4 ζ-potential measurements (Zeta-potential)
3.2.5 Differential Centrifuge Sedimentation (DCS)
3.2.6 UV-vis spectroscopy
3.2.7 Fluorescence spectroscopy
3.2.8 Magnetization studies: T2 relaxation times evaluation
3.3 Nanoparticle ligand characterizations pag 64
3.3.1 Picrylsulfonic acid (TNBS) assay: quantification of amino
groups onto SiNPs
3.3.2 Ninhydrin assay: quantification of amino groups onto SiNPs
3.3.3 Elmman’s reagent: quantification of sulphydryl groups reactivity
3.3.4 MicroBCA assay Protein assay Kit
3.4 Organic molecules characterization pag 68
3.4.1 1H-NMR spectroscopy
3.4.2 Critical micelle concentration (CMC) of polymeric PLGA
nanoparticles
3.4.3 Drug content and encapsulation efficiency (E.E.%)
3.4.4 Encapsulated drug: fluorescence stability analysis
3.4.5 Raman spectroscopy analysis
3.4.6 In vitro drug release profiles
3.5 Cell cultures pag 72
3.5.1 Flow cytometry (FACS)
3.5.2 Confocal laser scanning microscopy (CLSM)
3.5.3 Cellular toxicity evaluation
3.5.4 Cell death analysis: apoptosis measurement
3.5.5 Determination of drug release by FACS analysis
3.5.6 Cell cycle analysis
Related references. pag 76
Chapter III
56
3.1 Characterization challenges
A rational characterization strategy for bioconstructed NPs contains three
elements: physicochemical characterization, in vitro assays, and finally in vivo
studies. Physicochemical characterization plays a key role in the interpretation of in
vitro or in vivo biological data; while testing in vitro might give an initial estimate of
formulation efficacy and, eventually, toxicity. These approaches traditionally used for
small molecules to ascertain their physicochemical properties, can be perfectly
applied for nanoconjugates: for instance, techniques like nuclear magnetic resonance
(NMR), fluorescence spectroscopy, UV-vis spectroscopy, infrared spectroscopy (IR)
can be run in a high-throughput fashion to analyze the molecule-nanoparticle
interactions. The nanoconjugates properties can influence biological activity, and
may depend on parameters such as particle size, size distribution, surface area,
surface charge, surface functionality, shape, and aggregation state. Additionally,
since many nanoparticle concepts are multifunctional (with targeting, imaging, and
therapeutic components), the stability and distribution of these components can have
dramatic effects on nanoparticle biological activity as well.
Furthermore, another important and challenging area of nanoparticle
characterization is measurement under physiological conditions that resembles or
mimics the physical state in vivo. Many NPs properties are environment dependent;
for example, the particle’s hydrodynamic size at physiological pH and ionic strength
may differ from the size in water. Surface charge may also depend on the pH and
ionic strength of the suspending solution. While in vitro characterization is performed
to elucidate mechanisms and biocompatibility of nanomaterials, making use of
numerous immortalized cell lines.

Chapter III
57
3.2 Nanoparticle core size, shape and properties
All reagents and solvents have been purchased from Sigma-Aldrich (St. Louis,
MO, USA), Fluka (St. Gallen, Switzerland) and Riedel-de Haën (Seelze, Germany)
and used as received without further purification. Whole antibodies (mAb) (Roche
Products Ltd.,UK) have been received as a powder lyophilized for intravenous
administration; before reactions they have been purified from additives by dialysis
membrane (MWCO 12-14000 Da) in 20 mM phosphate buffer solution (PBS), pH =
7.4, 150 mM NaCl, 5 mM EDTA. Water has been deionized and ultrafiltered by a
MilliQ apparatus (Millipore Corporation, Billerica, MA). Ultrasounds have been
generated by S15H Elmasonic Apparatus (Elma, Singen, Germany).
3.2.1- Transmission and Scanning electron microscopy
In present work, TEM micrographs of MNPs, SiNPs and PLGA NPs have been
obtained using an TEM (Zeiss EM-109 microscope, Oberkhochen, Germany)
operating at 80 kV, available at the “Centro di Microscopia Elettronica per le
Nanotecnologie applicate alla medicina” (CMENA, University of Milan). The samples
have been prepared by evaporating a drop of NPs suspension (5 µg mL−1, either in
water or organic solvent) onto carbon-coated copper grid and allowing it to dry on the
air. The histograms of the particle size distribution and the average particle diameter
have been obtained by measuring about 100 particles by using Image−J software
analysis (Mircosoft).
3.2.2- Dynamic light scattering (DLS)
Dynamic Light Scattering is one of few techniques capable of determining the
size of nanoparticles in solution, providing an accurate measure of nanoparticle
hydrodynamic size. In DLS, the nanoparticle solution is illuminated by a
monochromatic laser and its scattering intensity is recorded with a photon detector at
Chapter III
58
a fixed or variable scattering angle with time. Generally, nanoparticle samples
contain a distribution of sizes as a result of imperfections in synthesis and due to
natural conformational variations in the large number of atoms involved. A metric for
size variability is the polydispersity index (PDI) equivalent to the relative variance of
the distribution.
In the present work DLS measurements have been performed, using a 90 Plus
Particle Size Analyzer from Brookhaven Instrument Corporation (Holtsville, NY)
operating at 15 mW of a solid-state laser (λ = 661 nm), using a scattering angle of
90°. Plastic (or eventually glass) disposable cuvettes with 1 cm optical path length
have been used for the measurements. Viscosity and refractive index of water have
been used to characterize the solvent. All materials have been previously cleaned
with Milli-Q water and EtOH 40 vol.% in deionized water and then allowed to dry with
a nitrogen flow. Samples have been prepared by dilution with the solvent or 1.0 mM
NaCl water solution in a final concentration range typically close to 20 µg mL−1. Each
sample has been allowed to equilibrate for 2 min prior to the measurement and five
independent measurements of 1 min duration have been performed at 25°C. The
calculations of hydrodynamic diameter have been performed using Mie theory,
considering absolute a PDI index accepted below 0.350.
3.2.3- Sight distribution spectra
Sight distribution spectra have been collected by NanoSight LM10 from
NanoSight Limited (Amesbury, UK) and analyzed with Nanoparticle Tracking
Analysis (NTA) software, version 2.2 Build 0363; samples have been in a range of
concentration around 10.0x10⁸ NP mL–1 working at 23 °C. All measurements have
been performed in triplicate and the average values have been taken.
3.2.4- ζ-potential measurements (Zeta-potential)

Chapter III
59
In an ionic solution, NPs with a
net charge have two surrounding
layers: a layer of ions of opposite
charge strongly bound to their surface,
and a diffuse outer layer of loosely
associated ions. These two layers are
collectively called the electrical double
layer. As the particle moves, a
distinction is created between ions in
the diffuse layer that move with the nanoparticle and ions that remain with the bulk
dispersant. The electrostatic potential at this “slipping plane” boundary is called the
zeta potential and is related to the surface charge of the nanoparticle (Figure 3.1). In
zeta potential measurements, an electrical field is applied across the sample and the
electrophoretic mobility of nanoparticles is measured by laser doppler velocimetry [1].
Nanoparticles with a zeta potential between −10 and +10 mV are considered
approximately neutral, while nanoparticles with zeta potentials greater than +30 mV
or less than −30 mV are considered strongly cationic and anionic, respectively [2]. In
this thesis ζ-potential has been determined at 25°C using a 90 Plus Particle Size
Analyzer from Brookhaven Instrument Corporation (Holtsville, NY) equipped with an
AQ-809 electrode, operating at applied voltage of 120 V. The samples for
measurements have been prepared by dilution of NPs in 1.0 mM NaCl aqueous
solution pH = 7.25 up to 20 µg mL−1. A minimum of three runs (for ten measures)
have been acquired to establish measurement reproducibility. The Zeta-potential has
been automatically calculated from electrophoretic mobility based on the Helmholtz-
Figure 3.1: ζ-potential theory. Electrical double layer of a negatively surface charged
nanomaterial
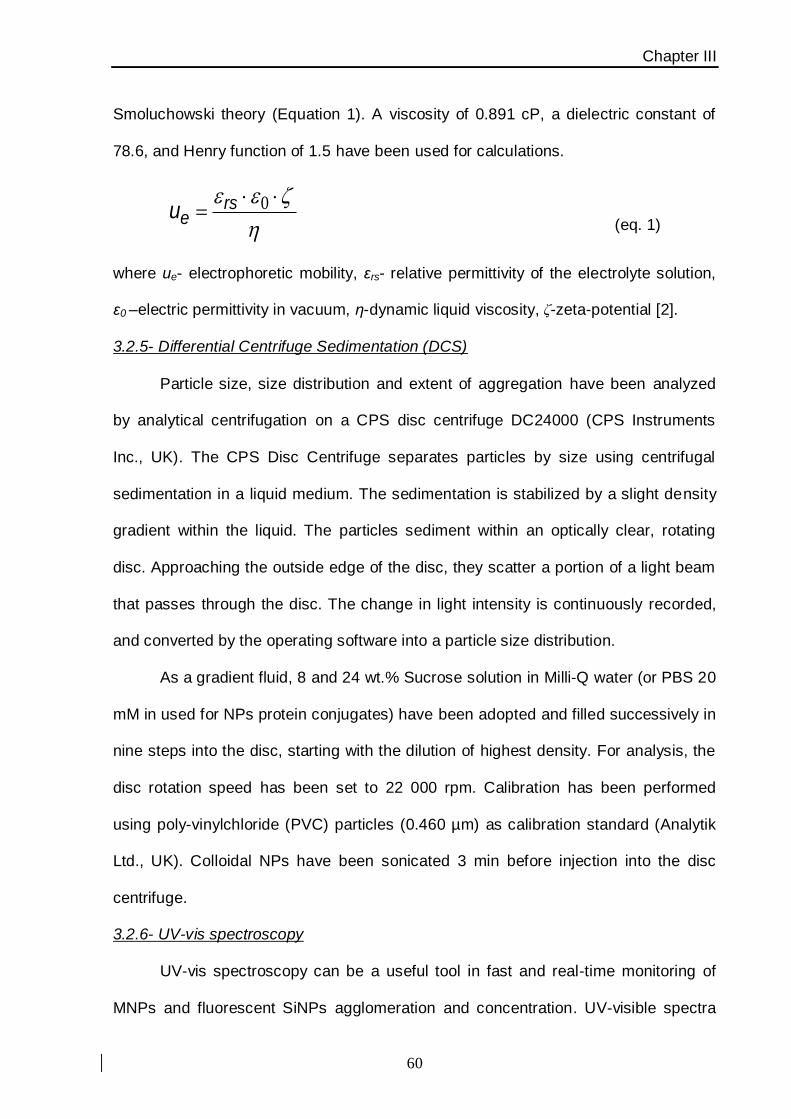
Chapter III
60
Smoluchowski theory (Equation 1). A viscosity of 0.891 cP, a dielectric constant of
78.6, and Henry function of 1.5 have been used for calculations.
0rs
eu (eq. 1)
where ue- electrophoretic mobility, εrs- relative permittivity of the electrolyte solution,
ε0 –electric permittivity in vacuum, η-dynamic liquid viscosity, ζ-zeta-potential [2].
3.2.5- Differential Centrifuge Sedimentation (DCS)
Particle size, size distribution and extent of aggregation have been analyzed
by analytical centrifugation on a CPS disc centrifuge DC24000 (CPS Instruments
Inc., UK). The CPS Disc Centrifuge separates particles by size using centrifugal
sedimentation in a liquid medium. The sedimentation is stabilized by a slight density
gradient within the liquid. The particles sediment within an optically clear, rotating
disc. Approaching the outside edge of the disc, they scatter a portion of a light beam
that passes through the disc. The change in light intensity is continuously recorded,
and converted by the operating software into a particle size distribution.
As a gradient fluid, 8 and 24 wt.% Sucrose solution in Milli-Q water (or PBS 20
mM in used for NPs protein conjugates) have been adopted and filled successively in
nine steps into the disc, starting with the dilution of highest density. For analysis, the
disc rotation speed has been set to 22 000 rpm. Calibration has been performed
using poly-vinylchloride (PVC) particles (0.460 µm) as calibration standard (Analytik
Ltd., UK). Colloidal NPs have been sonicated 3 min before injection into the disc
centrifuge.
3.2.6- UV-vis spectroscopy
UV-vis spectroscopy can be a useful tool in fast and real-time monitoring of
MNPs and fluorescent SiNPs agglomeration and concentration. UV-visible spectra
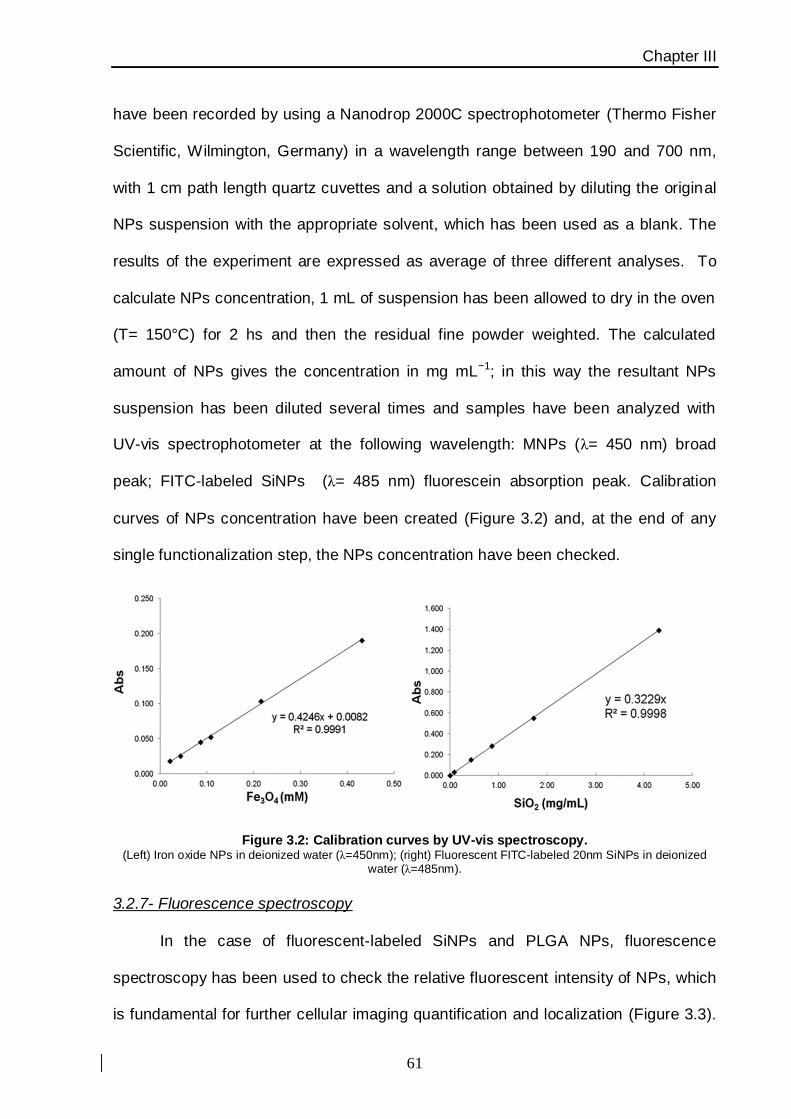
Chapter III
61
have been recorded by using a Nanodrop 2000C spectrophotometer (Thermo Fisher
Scientific, Wilmington, Germany) in a wavelength range between 190 and 700 nm,
with 1 cm path length quartz cuvettes and a solution obtained by diluting the original
NPs suspension with the appropriate solvent, which has been used as a blank. The
results of the experiment are expressed as average of three different analyses. To
calculate NPs concentration, 1 mL of suspension has been allowed to dry in the oven
(T= 150°C) for 2 hs and then the residual fine powder weighted. The calculated
amount of NPs gives the concentration in mg mL−1; in this way the resultant NPs
suspension has been diluted several times and samples have been analyzed with
UV-vis spectrophotometer at the following wavelength: MNPs (λ= 450 nm) broad
peak; FITC-labeled SiNPs (λ= 485 nm) fluorescein absorption peak. Calibration
curves of NPs concentration have been created (Figure 3.2) and, at the end of any
single functionalization step, the NPs concentration have been checked.
Figure 3.2: Calibration curves by UV-vis spectroscopy. (Left) Iron oxide NPs in deionized water (λ=450nm); (right) Fluorescent FITC-labeled 20nm SiNPs in deionized
water (λ=485nm).
3.2.7- Fluorescence spectroscopy
In the case of fluorescent-labeled SiNPs and PLGA NPs, fluorescence
spectroscopy has been used to check the relative fluorescent intensity of NPs, which
is fundamental for further cellular imaging quantification and localization (Figure 3.3).

Chapter III
62
Fluorescence spectra have been recorded by using Fluoromax-4P
spectrofluorometer from Horiba Scientific (New Jersey,USA). Samples have been
excited at a fixed wavelength (FITC λex = 480 nm; Curcumin λex = 450 nm) and
spectra have been collected in a wavelength range between 480 and 700 nm. The
fluorescence emission of FITC and Curcumin have been detected at 520 nm and 500
nm respectively; slit widths (for controlling magnitude and resolution of transmitted
light) have been standardized at 3 and 3 nm for excitation and emission wavelength.
The results of the experiment are expressed as average of three different analyses.
Figure 3.3: Fluorescence spectra analyses. (Left) Core-shell SiNPs-fluorescein labeled; 100 µg mL
−1 (red curve), 50 µg mL
−1 (blue curve), 25 µg mL
−1 (green
curve); (rigt) Fluorescence excitation and emission spectra of Curcumin [5 µM] in EtOH.
3.2.8- Magnetization studies: T2 relaxation times evaluation
As anticipated in the introduction, MNPs have strong magnetic properties and
might be adopted as contrast agents for in vivo MRI. Indeed Relaxometric
measurements to determine the T2 enhancing capability of magnetite synthesized
nanocrystals have been evaluated and compared to commercially available T2 MRI
contrast agent. T2 relaxation times have been monitored at temperature of 313 K
using a Bruker Minispec mq20 system (Ettlingen, Gerrmany) working with 1H at 20
MHz magnetic field (1.47 T) with the following parameters: Carr-Purcell-Meiboom-Gill
pulse sequence, 1000 echoes with a 20 ms echo times and 2 s repetition time.
Chapter III
63
Samples of MNPs suspension in water have been introduced using a 10 mm NMR
spectroscopy tubes. Before T2 measurements, the tubes have been pre-warmed at
40°C for 10 min in order to obtain thermal equilibration and T2 values have been
acquired on the samples at this stage. Relaxivity has been determined as the slope
of a T2−1 plot as function of iron concentration, expressed in mM. This value has been
compared with the one’s of commercially available T2 contrast agents based on
polymer-coated iron oxides, such as Endorem ® (Guerbet), Ferumoxytol ® (Adv.
Magnetics) and Resovist ® (Schering).

Chapter III
64
3.3 Nanoparticle ligand characterizations
3.3.1- Picrylsulfonic acid (TNBS) assay: quantification of amino groups onto SiNPs
Figure 3.4: TNBS assay. Amino functionalyzed SiNPs react with picrylsulfonic acid; the stable intermediate is finally broken by hydrolysis.
The yellow picric acid released can be estimated by UV-vis spectroscopy.
Following a method described in the literature [3] (Figure 3.4), an aqueous
mixture containing 1 M TNBS (10.0 μL) and 0.05 M Na2B4O7 (1.5 mL) has been
added to a sample of aminated SiNPs (6.0 mg). The suspension has been sonicated
for 1 min and then heated at 70 °C for 10 min. At the end of reaction, the mixture has
been cooled to RT; SiNPs have been then separated from the supernatant by
centrifugation (11200 rcf) and washed with deionized water (1.0 mL), 50% acetone in
water (1.0 mL), 100% acetone (1.0 mL) and water (twice 1.0 mL). SiNPs have been
then suspended in 1 M NaOH (5.0 mL) and heated to 70 °C under vigorous stirring
for 10 min. The suspension has been cooled to RT and SiNPs separated by
centrifugation. An aliquot of particle-free supernatant (1.0 mL) has been withdrawn
and its absorbance read with UV-vis spectrophotometer at 410 nm. Each particle
contained silica (d = 2.2 × 10⁶ g m−3) with an average radius of 40 nm = 4.0 × 10⁻⁸ m.
The average volume and mass of SiO2 nanoparticles is 2.68 × 10⁻²² m3 and 5.90 ×
10−16 g, respectively. Hence, 1 mg of SiO2 contained 1.02 × 10¹⁴ particles. By
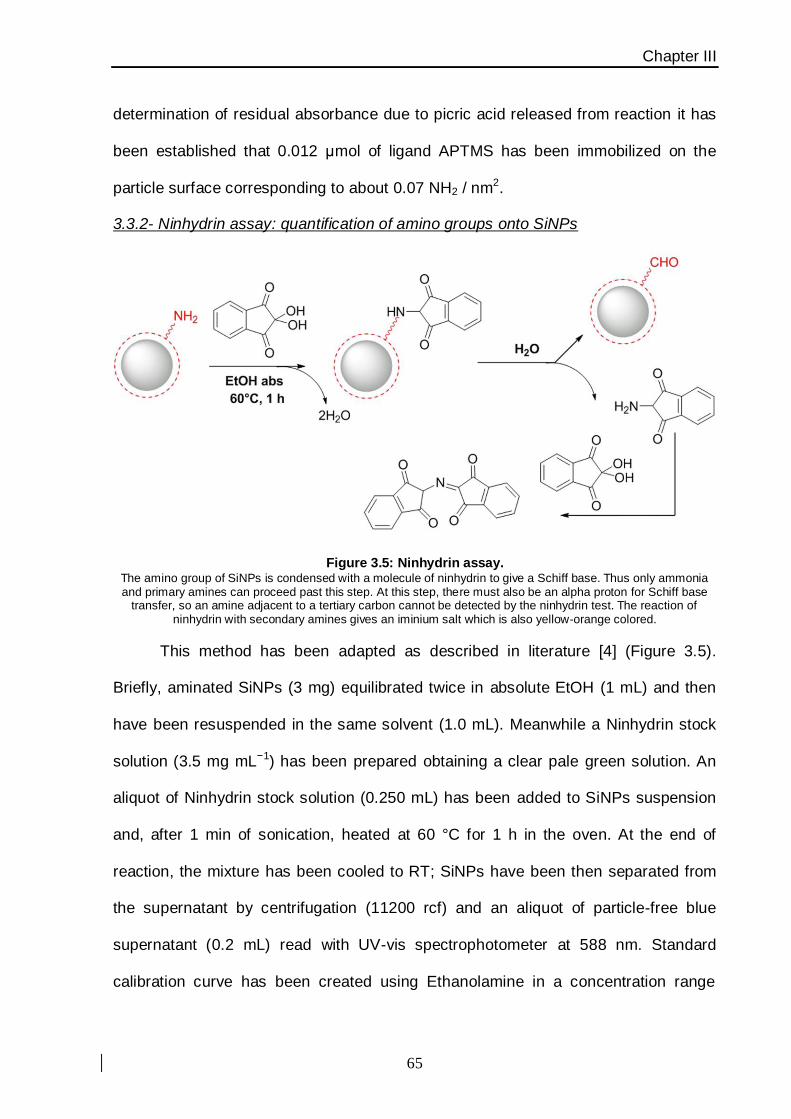
Chapter III
65
determination of residual absorbance due to picric acid released from reaction it has
been established that 0.012 μmol of ligand APTMS has been immobilized on the
particle surface corresponding to about 0.07 NH2 / nm2.
3.3.2- Ninhydrin assay: quantification of amino groups onto SiNPs
Figure 3.5: Ninhydrin assay. The amino group of SiNPs is condensed with a molecule of ninhydrin to give a Schiff base. Thus only ammonia and primary amines can proceed past this step. At this step, there must also be an alpha proton for Schiff base
transfer, so an amine adjacent to a tertiary carbon cannot be detected by the ninhydrin test. The reaction of ninhydrin with secondary amines gives an iminium salt which is also yellow-orange colored.
This method has been adapted as described in literature [4] (Figure 3.5).
Briefly, aminated SiNPs (3 mg) equilibrated twice in absolute EtOH (1 mL) and then
have been resuspended in the same solvent (1.0 mL). Meanwhile a Ninhydrin stock
solution (3.5 mg mL−1) has been prepared obtaining a clear pale green solution. An
aliquot of Ninhydrin stock solution (0.250 mL) has been added to SiNPs suspension
and, after 1 min of sonication, heated at 60 °C for 1 h in the oven. At the end of
reaction, the mixture has been cooled to RT; SiNPs have been then separated from
the supernatant by centrifugation (11200 rcf) and an aliquot of particle-free blue
supernatant (0.2 mL) read with UV-vis spectrophotometer at 588 nm. Standard
calibration curve has been created using Ethanolamine in a concentration range
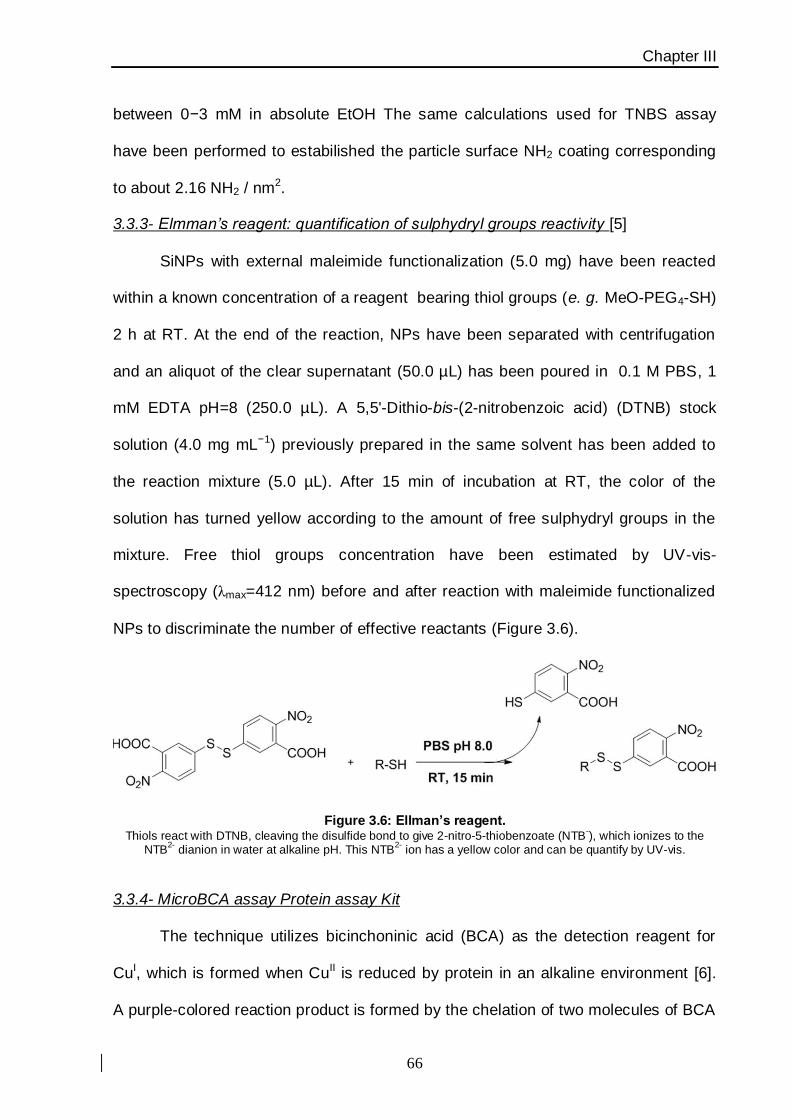
Chapter III
66
between 0−3 mM in absolute EtOH The same calculations used for TNBS assay
have been performed to estabilished the particle surface NH2 coating corresponding
to about 2.16 NH2 / nm2.
3.3.3- Elmman’s reagent: quantification of sulphydryl groups reactivity [5]
SiNPs with external maleimide functionalization (5.0 mg) have been reacted
within a known concentration of a reagent bearing thiol groups (e. g. MeO-PEG4-SH)
2 h at RT. At the end of the reaction, NPs have been separated with centrifugation
and an aliquot of the clear supernatant (50.0 µL) has been poured in 0.1 M PBS, 1
mM EDTA pH=8 (250.0 µL). A 5,5'-Dithio-bis-(2-nitrobenzoic acid) (DTNB) stock
solution (4.0 mg mL−1) previously prepared in the same solvent has been added to
the reaction mixture (5.0 µL). After 15 min of incubation at RT, the color of the
solution has turned yellow according to the amount of free sulphydryl groups in the
mixture. Free thiol groups concentration have been estimated by UV-vis-
spectroscopy (λmax=412 nm) before and after reaction with maleimide functionalized
NPs to discriminate the number of effective reactants (Figure 3.6).
Figure 3.6: Ellman’s reagent. Thiols react with DTNB, cleaving the disulfide bond to give 2-nitro-5-thiobenzoate (NTB
-), which ionizes to the
NTB2-
dianion in water at alkaline pH. This NTB2-
ion has a yellow color and can be quantify by UV-vis.
3.3.4- MicroBCA assay Protein assay Kit
The technique utilizes bicinchoninic acid (BCA) as the detection reagent for
CuI, which is formed when CuII is reduced by protein in an alkaline environment [6].
A purple-colored reaction product is formed by the chelation of two molecules of BCA
Chapter III
67
with one cuprous ion (CuI). This water-soluble complex exhibits a strong absorbance
at 562 nm that is linear with increasing protein concentrations in a range between
2−40 µg mL−1. This procedure has been adapted from the company general schedule
(Pierce Biotechnology, Rockford, IL, USA)
Kit contents: Reagent A (MA)
Reagent B (MB)
Reagent C (MC)
A solution of reagents (5 mL) has been prepared mixing MA : MB : MC in these
proportions 50 : 48 : 2. In a 96-multiwell plate reader an aliquot of previous mixture
(100.0 μL) and an aliquot of Transferrin-conjugated SiNPs (100.0 µL, corresponding
to 100.0 μg of NPs) have been added to each well and mixed thoroughly on a plate
shaker for 30 seconds. Samples have been incubated in the oven at 60°C for 1 h and
then cooled at RT. The absorbance of samples and protein BSA calibration
standards in a range of concentrations between 0-40 µg mL−1. Purple colored
solutions have been read at 562 nm with a plate reader and the protein loading onto
silica surface has been reported as µg / mgNP and protein / NP.
Chapter III
68
3.4 Organic molecules characterization
3.4.1- 1H−NMR spectroscopy
1H-NMR experiments have been carried out on a Bruker BioSpin FT-NMR
Avance 400 MHz equipped with a 11.7 T superconducting ultrashield magnet.
Samples (5 mg) have been dissolved in suitable NMR solvents such as CDCl3 or
DMSOd and analyzed. All measures have been recorded at temperature of 300 K
and spectra processed with Mnova NMR software (MestreLab research, S.L., Spain).
3.4.2- Critical micelle concentration (CMC) of polymeric PLGA nanoparticles
CMC of PLGA NPs has been estimated by fluorescence spectroscopy using
pyrene as a fluorescence probe [7]. A solution of pyrene (6.0 mM) in acetone has
been prepared and added to deionized water to reach a pyrene concentration of 12.0
μM; later, the organic solvent has been evaporated (acetone-free pyrene solution) in
the air. Solutions of PLGA NPs (1.0 mL) in a concentration range between 5.0 × 10⁻⁵
to 1.0 mg mL−1 have been prepared and mixed together with acetone-free pyrene
solution (1 mL) in order to gain a final concentration of pyrene in each sample
solution of 6.0 μM. Fluorescence spectra of pyrene have been recorded monitoring
the excitation fluorescence behavior at 334 and 338 nm. The CMC has been
estimated and plotted following the cross-point when extrapolating the intensity ratio
I338 / I334 at low and high concentration regions.
3.4.3- Drug content and encapsulation efficiency (E.E.%)
Both UV−vis and fluorescence spectroscopies have been used to determine
the amount of drug encapsulated in PLGA NPs. A known amount of dry NPs (250.0
μg) has been dispersed in deionized water and chloroform has been added to the
water phase. After 3 h under stirring, residual curcumin released from nanoparticles
has been determined by both UV−vis and fluorescence emission. Empty PLGA NPs
Chapter III
69
and polyvinyl alcohol (PVA) don’t interfere with the analysis of curcumin. The
encapsulation efficiency has been calculated (Equation 2) as:
1001
1
)(
)(.(%).
NPs
NPs
mggdrug
mggdrugEE
druginitial
drugloaded
(eq. 2)
UV−vis quantification has been detected at λmax = 420 nm and fluorescence
emission spectra have been recorded in a wavelength range between 480 and 700
nm, exciting all samples at fixed wavelength (λex = 450 nm). The fluorescence
emission of curcumin has been detected at 500 nm; the slit widths (for controlling
magnitude and resolution of transmitted light) have been standardized at 3 and 3 nm
for both excitation and emission wavelength. The results of the experiment are
expressed as average of three different analyses.
3.4.4- Encapsulated drug: fluorescence stability analysis
Fluorescence emission of curcumin in different biological milieu has been
analyzed to show the efficacy of nanoparticle protection of the drug from external
biological environment and degradation. Acetate buffer, 20 mM (pH = 4.75),
phosphate buffer, 20 mM (pH = 7.40), ammonium buffer, 20 mM (pH = 9.25), and cell
culture Dulbecco’s Modified Eagle’s medium (DMEM; pH = 7.40) have been
prepared. Free curcumin (10 mM in DMSO) has been diluted in all buffers above
described (5.0 μM); however, drug-loaded PLGA have been dispersed directly in the
medium (25 μg mL−1, drug content 5.0 μM) and the empty PLGA at the same
concentration as a reference. Fluorescence emission spectra have been recorded
using with the same instrument described above in a wavelength range from 490 to
700 nm (λex = 480 nm).
3.4.5- Raman Spectroscopy analysis
Chapter III
70
Raman spectra have been recorded using an Aramis Horiba Jobin-Yvon
micro-Raman spectrometer equipped with solid state lasers operating at 532 nm, 633
nm and 785 nm and with a DuoScan mapping mode configuration.
The analysis of Curcumin as free compound or encapsulated in PLGA has been
recorded on dry powder using a 633 nm laser line (12.5 mW of power) and a 50X
objective.
3.4.6- In vitro drug release profiles
In vitro drug release of curcumin from PCNPs has been evaluated by the
dissolution technique [7,8]. Release studies have been performed at 37 °C in either
acetate buffer, 20 mM (pH = 4.75), phosphate buffer, 20 mM (pH = 7.40) and
ammonium buffer, 20 mM (pH = 9.25); each buffer has been supplemented with 2
wt.% albumin bovine serum to mimic a biological environment and enhance drug
dissolution. A nanoparticulate dispersion of drug-loaded PLGA NPs (1 mg mL−1) has
been solubilized in all buffers at 37 °C in a closed glass tube, to prevent evaporation
of the solvent, under mild stirring. Samples have been withdrawn (1.0 mL) at regular
time intervals and, after nanoparticle centrifugation, solubilized curcumin in each
sample analyzed. Subsequently, NPs have been inserted again in the reactor with
fresh medium (1.0 mL) to create a sink condition; the medium has been completely
replaced with fresh medium every 24 h. Samples have been spectrophotometrically
quantified at 420 nm; all measurements have been performed in triplicate and the
average values taken. The kinetic analysis of the release data has been processed
using Peppas−Korsmeyer’s model (Equation 3) [8]:
][log)log(loglog
][
btnkf
btkf
t
tn
(eq. 3)
Chapter III
71
where ft is the fractional amount of drug release, k is the release constant, n is the
release exponent, t is the time of release and b is coefficient of drug “burst effect
release”; this last parameter must be inserted in all calculations because the release
kinetic from PLGA NPs is critically affected by the burst effect in particular during the
first 8 h of incubation.
Chapter III
72
3.5 Cell cultures
Breast cancer MCF7 (HER2+) and MDA-MB468 (HER2−) and lung cancer A549
(TfR+) have been used respectively. Cells have been cultured in 50 vol.% Dulbecco’s
Modified Eagle’s Medium (DMEM) and 50 vol.% F12, supplemented with 10 wt.%
fetal bovine serum, L-glutamine (2 mM), penicillin (50 UI mL−1), and streptomycin (50
mg mL−1) at 37 °C and 5% CO2 in a humidified atmosphere and subcultured prior to
confluence using trypsin/EDTA.
Promonocitic U937−13 cell clones and U937−10 have been used as uPAR positive
and uPAR negative targets, respectively [9]. Cells have been cultured at 2 × 10⁵ cells
mL−1 in RPMI 1640 medium supplemented with 10 wt.% fetal bovine serum, L-
glutamine (2 mM), penicillin (50 UI mL–1) and streptomycin (50 mg mL–1) at 37 °C and
5% CO2 in a humidified atmosphere.
3.5.1- Flow cytometry (FACS)
To assess the efficiency of targeted delivery of NPs bearing antibodies,
proteins and peptides, the binding toward cancer cells receptors (HER2, TfR and
uPAR) has been evaluated by flow cytometry [10,11]. Cells have been cultured on a
12-multiwell plate until subconfluence (80%). Then, equal aliquots have been
incubated 15 min at 37 °C in the presence of one of the following: (i) positive control
dye-labeled free targeting ligand (5.0 μg mL−1); (ii) dye-labeled fully PEGylated NPs
without targeting ligand, (around 100 μg mL−1 NPs); (iii) dye-labeled active
bioconjugated NPs, (around 100 μg mL−1 NPs). After different incubation times, cells
have been washed once with culture medium (1.0 mL), twice with PBS (1.0 mL) and
then, treated with typsin for 5 min at 37°C. Digestion with trypsin has been stopped
with culture medium and cells have been transferred in FACS tubes and fixed with
paraformaldehyde solution 4 wt.% in PBS (0.5 mL) for 20 min in the dark at RT.

Chapter III
73
Later, cells have been washed once with PBS (1.0 mL) and finally resuspended in
PBS (0.5 mL) for FACS analyses.
On the contrary, when NPS haven’t been dye labeled, cells have been
incubated for 30 min at 4 °C in a blocking solution (PBS, 2 wt.% with Bovine Serum
Albumin) and immunodecorated with FITC-conjugated antibody (1.0 μL) to whole
murine IgG (MP Biomedicals) for 30 min at 4 °C. The excess of secondary antibody
has been removed by washes six times with PBS (1.0 mL). Labeled cells have been
resuspended with PBS (0.5 mL) and analyzed on a FACS Calibur flow cytometer
(Becton Dickinson). Twenty thousand events have been acquired for each analysis,
after gating on viable cells, and isotype-control antibodies have been used to set the
appropriate gates.
3.5.2- Confocal laser scanning microscopy (CSLM)
Cells have been cultured on collagen (Sigma Aldrich, Germany) precoated
coverglass slides until subconfluence.(80%). Then, cells have been incubated at
fixed time points at 37 °C with free dye-labeled free targeting ligands (5.0 μg mL−1)
and with equal amounts targeting ligand immobilized onto NPs. Later on, cells have
been washed with PBS (1.0 mL), fixed for 20 min with 4 wt.% paraformaldehyde
solution in PBS and treated for 10 min with 0.1 M glycine in PBS. A blocking step has
been performed for 1 h at RT with a PBS solution supplemented with 2.0 wt.% bovine
serum albumin and 2.0 wt.% goat serum. Nuclei have been stained with DAPI (4′,6-
diamidino-2-phenylindole) diluted in PBS (200 ng mL−1) supplemented with 0.1 wt.%
Saponin for 20 min at RT. Membranes have been stained with DiD oil at a 1:300
dilution in PBS by incubating 30 min at 37 °C. Microscopy analyses have been
performed with a Leica SP2 AOBs microscope confocal system; images have been

Chapter III
74
recorded with 63× magnification oil immersion lenses at 1024 × 1024 pixel resolution;
picture’s scale bar has been set at 10 µm.
3.5.3- Cellular toxicity evaluation
To test NPs toxicity, MTT assay was performed. Cells (1.5 × 10³) have been
seeded in 96-multiwell plate and, 24 h after plating, incubated with different NPs
concentrations (e. g., 50 and 100 μg mL−1); the culture media has been removed and
the toxicity has been monitored after until to 72 h of NPs exposure. According to the
manufacturer’s instructions (CellTiter 96 Non-Radioactive Cell Proliferation Assay,
Promega), at the end of each exposure time, the tetrazolium salt has been added
and the formazan product has been detected after 4 h incubation, by means of a
plate reader at fixed wavelength (λ= 595 nm). Results are normalized with untreated
control and expressed as the mean absorbance of ± SEM of three independent
biological replicates.
3.5.4- Cell death analysis: Apoptosis measurement
Cells have been incubated 24 h at 37 °C in the presence of different NPs
concentrations (e.g., 20 µg mL–1 or 100 µg mL–1). After the incubation time, cells
have been washed twice with PBS (1.0 mL) and treated for FACS analysis according
to PE Annexin V Apoptosis Detection Kit I manufacturer’s protocol (Becton Dickinson
Biosciences). Briefly, cells have been resuspended in 20 mM Binding Buffer and
incubated 15 min in presence of Annexin-PE (5.0 µL) and 7-aminoactinomycin D (5.0
µL). Furthermore, cells have been washed with PBS (1.0 mL) and subsequently
analyzed at the flow cytometer. Twenty thousand events have been recorded for
each analysis, after gating on viable cells and analyzed with CellQuest Pro Software
(BD). Therefore, we consider cell death as the populations positive for Annexin V and
Chapter III
75
for 7AAD staining alone and together. The results are expressed as means ±
standard deviation of the mean of 3 individual experiments.
3.5.5- Determination of drug release by FACS analysis
MCF7 cells have been seeded in 6-multiwell plates (1.0 × 10⁵ cells each well)
and, 24 h after plating, cells have been incubated with curcumin-PLGA NPs (100 μg
mL−1, corresponding to 20 μM drug), free curcumin (20 μM) or left untreated as
negative control. After 24 h incubation, cell culture medium containing NPs or free
curcumin has been removed and cells have been washed three times with PBS (1.0
mL); freshly culture medium without either NPs or curcumin has been added. Total
cell fluorescence has been monitored sampling cells at 24, 48, or 72 h after
incubation by FACS analysis. Cells have been washed with PBS (1.0 mL),
trypsinized, and collected in FACS tubes in PBS (0.5 mL). Sample acquisition has
been performed and analyzed with CellQuest Pro Software (BD), recording at least
twenty thousand events. The results are expressed as means of 3 individual
experiments.
3.5.6- Cell cycle analysis
MCF7 cells have been cultured in 6-multiwell plates and incubated with drug-
loaded PLGA NPs (100 μg mL−1, corresponding to 20 μM drug), empty PLGA NPs
(100 μg mL−1) and free curcumin at 20 μM for 24, 48, and 72 h. Later, cells have
been collected and fixed in 70 vol.% ethanol in PBS (2.0 mL). For DNA staining, after
ethanol removal, cells have been incubated overnight at 4 °C with propidium iodide
10 (μg mL−1) and RNAse-A (18 μg mL−1). Sample acquisition has been performed
using the flow cytometer equipped with doublet-discriminator module (FACS Calibur;
Becton Dickinson, San Jose, USA), and the DNA content has been analyzed by
Flowjo software (TreeStar Inc. OR, USA).
Chapter III
76
Related References
[1] Scott, E.; “Characterization of nanoparticles intended for drug delivery”; McNeil, © Humana Press.
New York (NY, USA), 2011.
[2] Delgado, A. V.; Gonzales-Caballero, F.; Hunter, R. J.; Koopal, L. K. and Lyklema, J.; J. Colloid.
Interf. Sci. 2007, 309, 194–224.
[3] Halling, P. L. and Dunhill, P.; Biotechnol. Bioeng. 1979, 21, 393–416.
[4] Soto-Kantu, E.; Cueto, R.; Koch, J. and Russo, P. S.; Langmuir. 2012, 28, 5562–5569.
[5] Riddles, P. V.; Blakeley, L. R.; and Zerner, B.; Anal.Biochem. 1979, 94, 75–91.
[6] Wiechelman, K. J.; Braun, R. D. and Fitzpatrick, J. D.; Anal. Biochem. 1988, 175, 231–237.
[7] D’Souza, S. S. and DeLuca, P. P. Pharm. Res. 2006, 23, 460–474.
[8] Costa, P. and Sousa Lobo, J. M.; Eur. J. Pharm. Sci. 2001, 13, 123–133.
[9] Laemmli, U. K.; Nature. 1970, 227, 680–685.
[10] Mazzucchelli, S.; Colombo, M.; De Palma, C.; et al.; ACS Nano. 2010, 4, 5693–5702.
[11] Salvati, A.; Pitek, A. S.; Monopoli, M. P.; Nat. Nanotech. 2013, 8, 137–143.

Third Section
Third Section
Chapter IV
78
Chapter IV
Multiple Presentation of
ScFv800E6 on Silica
Nanospheres Enhances
Targeting Efficiency Toward
HER2 Receptor in
Breast Cancer Cells

Chapter IV
79
Contents
4.1 The Human Epidermal Growth Factor Receptor HER2: Action and
Signaling Inhibition pag 79
4.2 Efficient Production of anti-HER2 scFv Antibody Variant for Targeting
Breast Cancer Cells
pag 83
4.3 Multimodal synthesis: different functionalization of silica nanospheres pag 86
4.4 ScFv600E6 bioconjugations: assessing targeting efficiency towards
HER2 receptor
pag 92
4.5 Conclusions and outlooks pag 96
4.6 Nanomaterials experimental section pag 97
4.6.1 Synthesis of Silica Nanospheres (SNP)
4.6.2 Synthesis of Fully PEG-coated Silica (SPEG)
4.6.3 Synthetic route to Nα,Nα-Bis[cerboxymethyl]-L-Lysine (NTA)
4.6.4 Synthesis of Silica-NTA conjugate (SNP1)
4.6.5 Synthesis of Silica-aminated conjugate (SNP2)
4.6.6 Determination of amino groups on SNP2
4.6.7 Oriented ligation of His-Tag scFv800E6 (SNP−HT)
4.6.8 Ligation of scFv800E6 through reductive amination (SNP−UT)
4.6.9 Stability assay of scFv conjugation on SNP−HT
Related references. pag 103
4.1 The Human Epidermal Growth Factor Receptor HER2:
Action and Signaling Inhibition
Some breast cancers produce protein biomarkers (e.g. estrogen receptor,
progesterone receptor, and HER2), on which therapeutic decisions are made. The
use of NPs is expected to allow for the simultaneous detection and quantification of
several proteins in small tumor samples, which will ultimately enable the tailoring of
specific anticancer treatment to an individual patient’s specific tumor protein profile,
potentially leading to a personalized medicine [1]. To design a diagnostic approach to
breast carcinoma using nanoagents in humans, it is necessary to fulfill several

Chapter IV
80
criteria for their utilization. These include high resolution and the accuracy and
sensitivity of detection, which might be provided by using NPs coated with specific
monoclonal antibodies against protein biomarkers overexpressed by breast cancer
cells, such as HER2 receptor. The human epidermal growth factor receptor 2 (HER2)
is a transmembrane tyrosine kinase receptor overexpressed in 25−30% of human
breast cancers. HER2 includes an extracellular domain at which ligand binding
occurs, an α-helical transmembrane segment and an intracellular protein tyrosine
kinase domain [2]. An essential requirement for its function and signaling activity is
the receptor dimerization (pairing) [2,3]. Indeed, after ligand binding to the
extracellular domain, a conformational rearrangement occurs, exposing the
dimerization domain that forms the core of the dimer interface with another receptor
(Figure 4.1-A). The receptor dimerization is responsible for the transactivation of the
tyrosine kinase portion of the dimer moiety as each receptor activates its partner by
phosphorylation.
In many tumor cells, HER2 is overexpressed or constitutively activates and
stimulates many intracellular signaling proteins and physiological pathways, such as
the mitogen-activated protein kinase (MAPK), phosphoinositide 3 kinase/Ak
transforming factor (PI3K/Akt), mammalian target of rapamycin (mTOR), Src kinase,
and STAT transcription factors (signal transducers and activators of transcription)
[5,6]. However, pathology arises here whereas the usual negative regulatory loops
that function in normal cells are impaired [7]. Two key signaling pathways activated
by the ErbB family dimers are the MAPK pathway, which stimulates proliferation, and
the PI3K/Akt pathway, which promotes tumor cell survival. The activation of the
MAPK pathway leads to the transcription of genes that drive cellular proliferation,
migration, differentiation and angiogenesis [2,3].

Chapter IV
81
Figure 4.1. Signal transduction by the HER2 family and mechanism of action of Trastuzumab. Panel A) The four members of the ErbB family: HER1, HER2, HER3, HER4. Panel B−F) The most well-
documented potential mechanisms of action of Trastuzumab-®. [4]

Chapter IV
82
Signaling through the PI3K/Akt pathway leads to the activation, through
phosphorylation, of many other proteins that initiate processes to enable cell survival,
suppression of apoptosis and cell cycle control.
Extracellular domain of HER2 has been the target of several monoclonal
antibodies created in order to inhibit the proliferation of human cancer cells. The most
popular Trastuzumab-® (Genetech-Roche) is a humanized monoclonal antibody
consisting of two antigen-specific sites that bind to the juxtamembrane portion of the
extracellular domain of the HER2 receptor preventing the activation of its intracellular
tyrosine kinase [8] (Figure 4.1-B−F). There are several possible mechanisms through
which trastuzumab may decrease HER2 signaling. Some works showed that
trastuzumab mediates the activation of antibody-dependent cellular cytotoxicity
(ADCC). The presence of ADCC is mainly due to the activation of natural killer (NK)
cells, expressing the Fc gamma receptor, which can be bound by the Fc domain of
trastuzumab [9,10]. However, Molina and coworkers demonstrated that, in HER2
overexpressing breast cancer cell lines, trastuzumab may follow an alternative
mechanism of action involving blockage of the proteolytic cleavage of HER2
extracellular domain and p95 serum-release by inhibiting metalloproteinase activity
[11]. A diminished signaling mechanism may result from trastuzumab-mediated
internalization and degradation of the HER2 receptor [12]. Finally, trastuzumab
treatment provokes cell cycle arrest during the G1 phase, with a concomitant
reduction of proliferation. This event is accompanied by the reduced expression of
proteins involved in the sequestration of the cyclin-dependent kinase inhibitor
p27kip1, including cyclin D1. This results in the release of p27kip1 including cyclin D1.
This results in the release of p27kip1, allowing it to bind and inhibit cyclin E/cdk2
complexes [13].
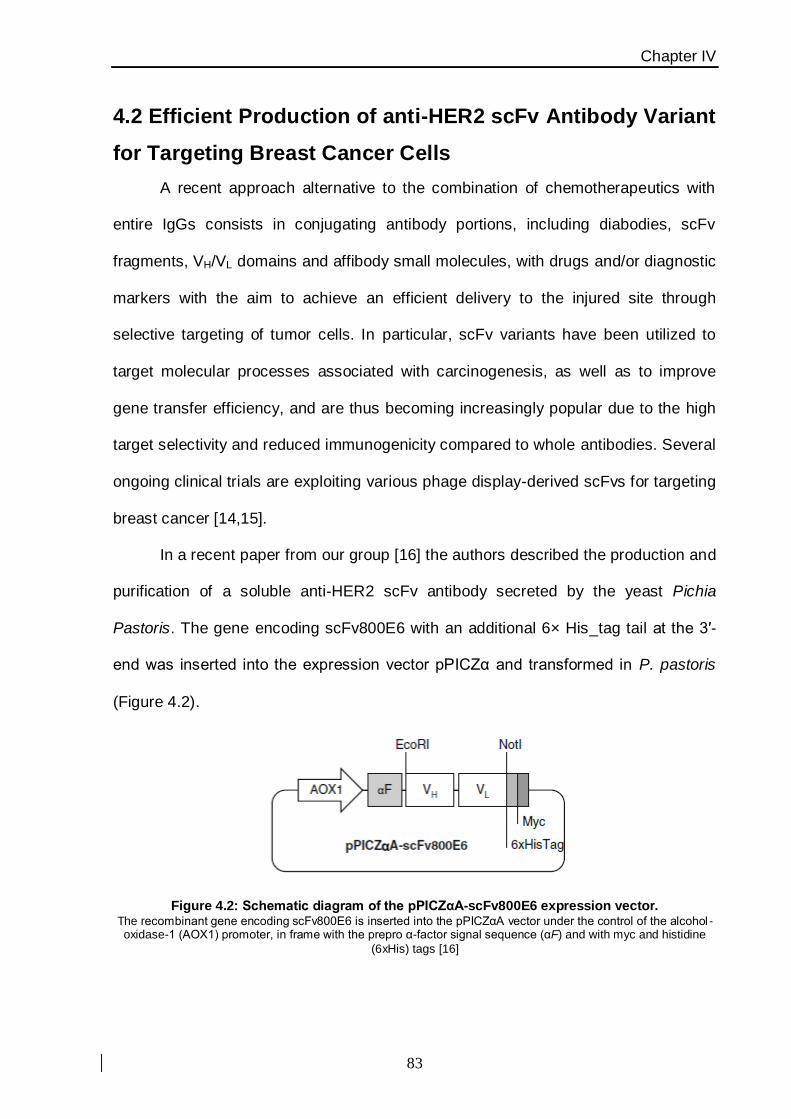
Chapter IV
83
4.2 Efficient Production of anti-HER2 scFv Antibody Variant
for Targeting Breast Cancer Cells
A recent approach alternative to the combination of chemotherapeutics with
entire IgGs consists in conjugating antibody portions, including diabodies, scFv
fragments, VH/VL domains and affibody small molecules, with drugs and/or diagnostic
markers with the aim to achieve an efficient delivery to the injured site through
selective targeting of tumor cells. In particular, scFv variants have been utilized to
target molecular processes associated with carcinogenesis, as well as to improve
gene transfer efficiency, and are thus becoming increasingly popular due to the high
target selectivity and reduced immunogenicity compared to whole antibodies. Several
ongoing clinical trials are exploiting various phage display-derived scFvs for targeting
breast cancer [14,15].
In a recent paper from our group [16] the authors described the production and
purification of a soluble anti-HER2 scFv antibody secreted by the yeast Pichia
Pastoris. The gene encoding scFv800E6 with an additional 6× His_tag tail at the 3′-
end was inserted into the expression vector pPICZα and transformed in P. pastoris
(Figure 4.2).
Figure 4.2: Schematic diagram of the pPICZαA-scFv800E6 expression vector. The recombinant gene encoding scFv800E6 is inserted into the pPICZαA vector under the control of the alcohol -oxidase-1 (AOX1) promoter, in frame with the prepro α-factor signal sequence (αF) and with myc and histidine
(6xHis) tags [16]
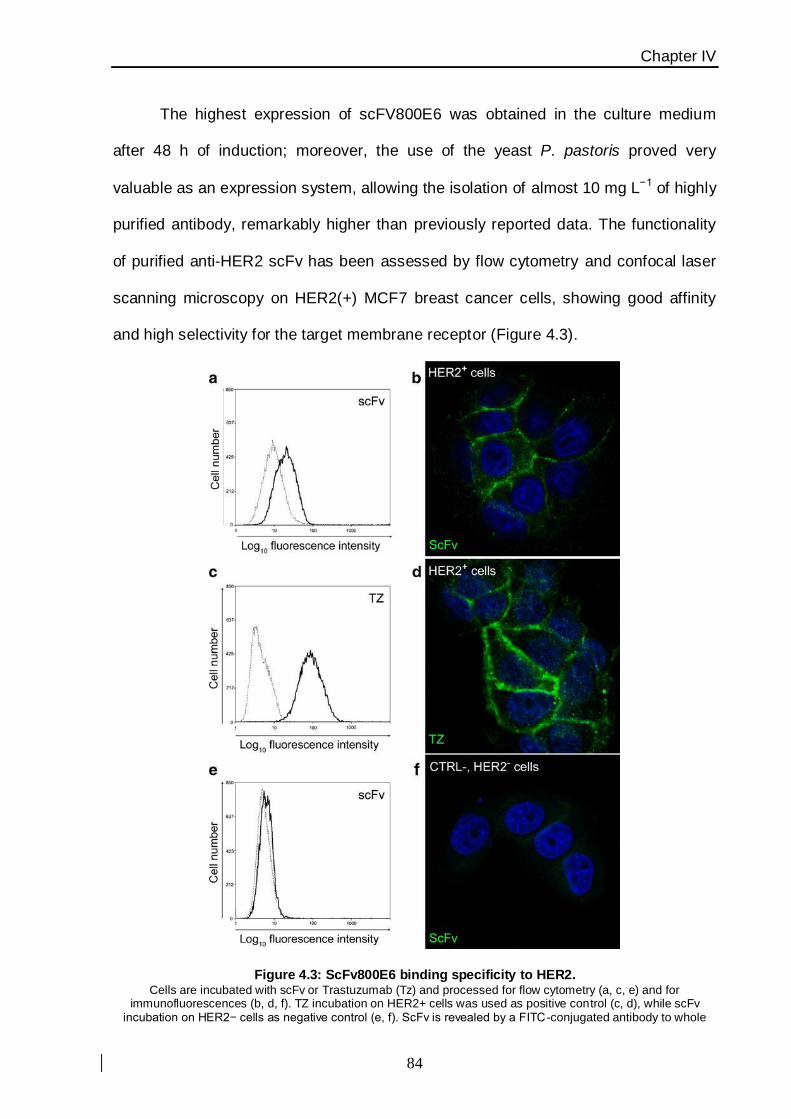
Chapter IV
84
The highest expression of scFV800E6 was obtained in the culture medium
after 48 h of induction; moreover, the use of the yeast P. pastoris proved very
valuable as an expression system, allowing the isolation of almost 10 mg L−1 of highly
purified antibody, remarkably higher than previously reported data. The functionality
of purified anti-HER2 scFv has been assessed by flow cytometry and confocal laser
scanning microscopy on HER2(+) MCF7 breast cancer cells, showing good affinity
and high selectivity for the target membrane receptor (Figure 4.3).
Figure 4.3: ScFv800E6 binding specificity to HER2. Cells are incubated with scFv or Trastuzumab (Tz) and processed for flow cytometry (a, c, e) and for
immunofluorescences (b, d, f). TZ incubation on HER2+ cells was used as positive control (c, d), while scFv incubation on HER2− cells as negative control (e, f). ScFv is revealed by a FITC -conjugated antibody to whole
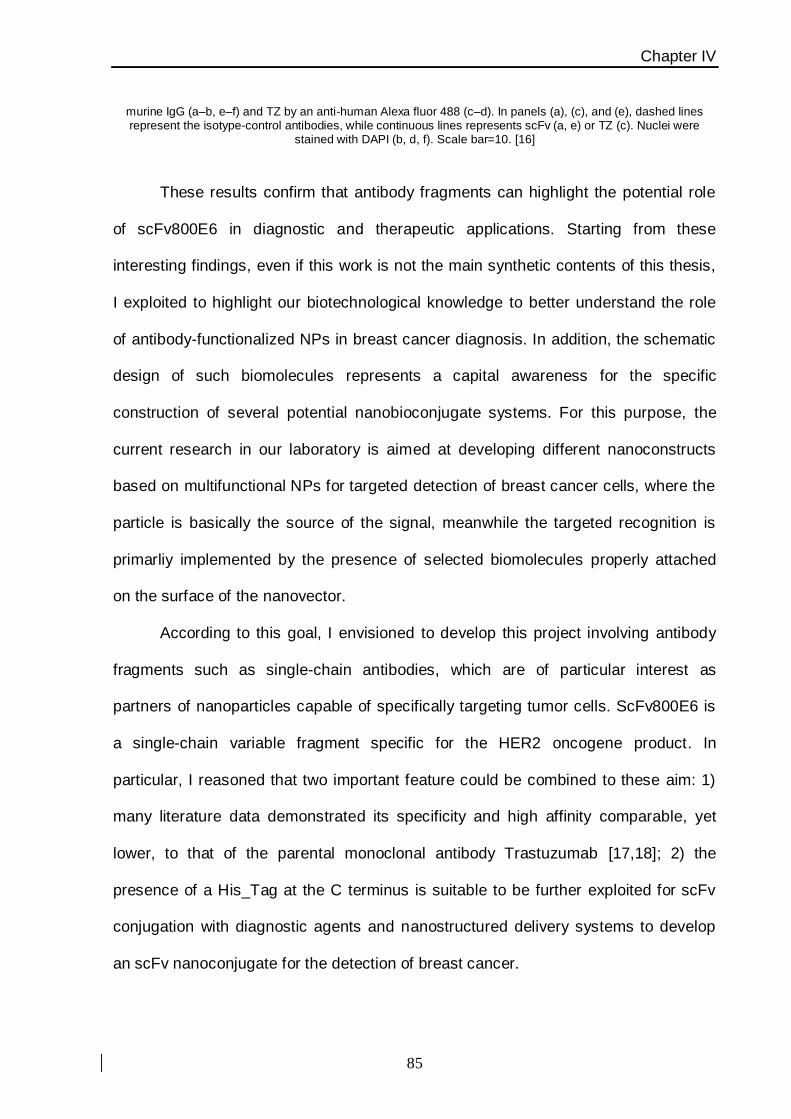
Chapter IV
85
murine IgG (a–b, e–f) and TZ by an anti-human Alexa fluor 488 (c–d). In panels (a), (c), and (e), dashed lines represent the isotype-control antibodies, while continuous lines represents scFv (a, e) or TZ (c). Nuclei were
stained with DAPI (b, d, f). Scale bar=10. [16]
These results confirm that antibody fragments can highlight the potential role
of scFv800E6 in diagnostic and therapeutic applications. Starting from these
interesting findings, even if this work is not the main synthetic contents of this thesis,
I exploited to highlight our biotechnological knowledge to better understand the role
of antibody-functionalized NPs in breast cancer diagnosis. In addition, the schematic
design of such biomolecules represents a capital awareness for the specific
construction of several potential nanobioconjugate systems. For this purpose, the
current research in our laboratory is aimed at developing different nanoconstructs
based on multifunctional NPs for targeted detection of breast cancer cells, where the
particle is basically the source of the signal, meanwhile the targeted recognition is
primarliy implemented by the presence of selected biomolecules properly attached
on the surface of the nanovector.
According to this goal, I envisioned to develop this project involving antibody
fragments such as single-chain antibodies, which are of particular interest as
partners of nanoparticles capable of specifically targeting tumor cells. ScFv800E6 is
a single-chain variable fragment specific for the HER2 oncogene product. In
particular, I reasoned that two important feature could be combined to these aim: 1)
many literature data demonstrated its specificity and high affinity comparable, yet
lower, to that of the parental monoclonal antibody Trastuzumab [17,18]; 2) the
presence of a His_Tag at the C terminus is suitable to be further exploited for scFv
conjugation with diagnostic agents and nanostructured delivery systems to develop
an scFv nanoconjugate for the detection of breast cancer.
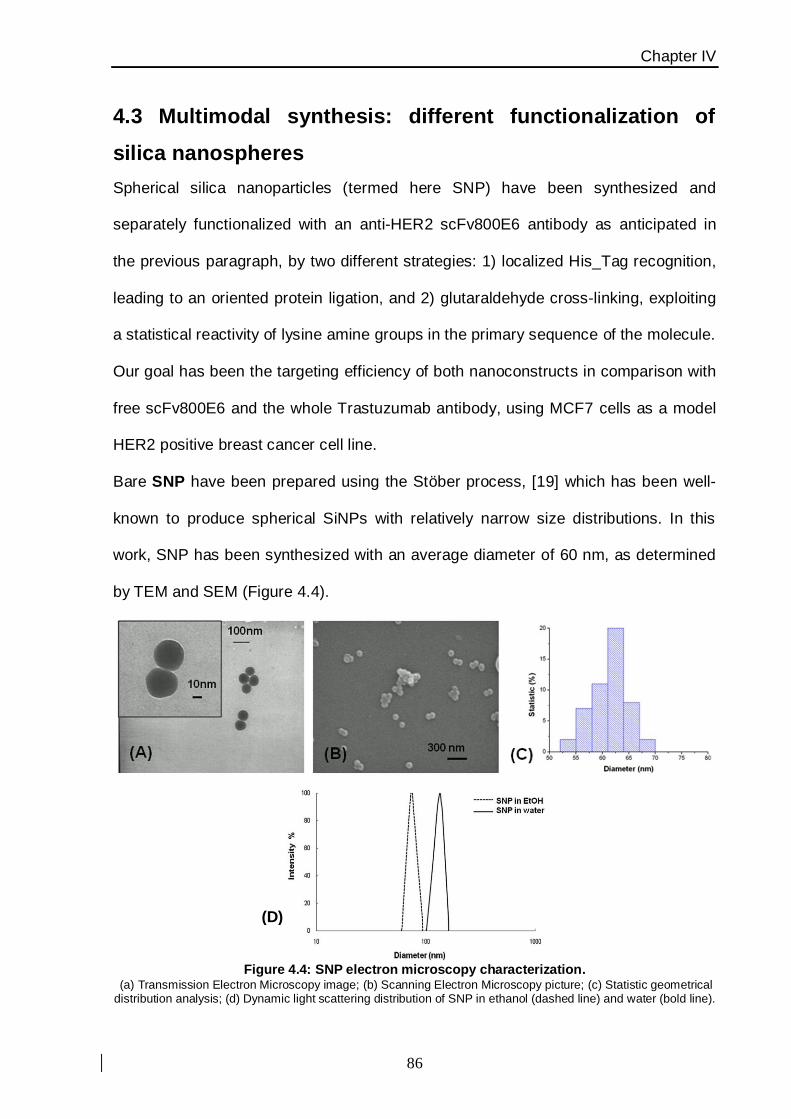
Chapter IV
86
4.3 Multimodal synthesis: different functionalization of
silica nanospheres
Spherical silica nanoparticles (termed here SNP) have been synthesized and
separately functionalized with an anti-HER2 scFv800E6 antibody as anticipated in
the previous paragraph, by two different strategies: 1) localized His_Tag recognition,
leading to an oriented protein ligation, and 2) glutaraldehyde cross-linking, exploiting
a statistical reactivity of lysine amine groups in the primary sequence of the molecule.
Our goal has been the targeting efficiency of both nanoconstructs in comparison with
free scFv800E6 and the whole Trastuzumab antibody, using MCF7 cells as a model
HER2 positive breast cancer cell line.
Bare SNP have been prepared using the Stöber process, [19] which has been well-
known to produce spherical SiNPs with relatively narrow size distributions. In this
work, SNP has been synthesized with an average diameter of 60 nm, as determined
by TEM and SEM (Figure 4.4).
Figure 4.4: SNP electron microscopy characterization.
(a) Transmission Electron Microscopy image; (b) Scanning Electron Microscopy picture; (c) Statistic geometrical distribution analysis; (d) Dynamic light scattering distribution of SNP in ethanol (dashed line) and water (bold line).
(D)

Chapter IV
87
Hydrodynamic diameter of SNP after the synthesis has been evaluated both in
ethanol (78.3 ± 2.2 nm; PDI 0.132) and in deionized water (133.8 ± 20.9 nm; PDI
0.232) respectively; the NPs resuspension in water causes a little bit of NPs
aggregation since that NPs have been dried after from the ethanol phase, as
reported in several experimental papers (see exp. part). Unfortunately, by our
experience completely SNP dryness influences negatively about the colloidal
stability, thus inducing the formation of some NPs aggregates (which have been
removed by a quick centrifugation at low speed before any SNP functionalization),
The surface charge is strongly negative since that at physiological pH (ζ −35.85 ±
0.64 mV in 1 mM aqueous NaCl, pH 7.25) surface acidic silanols, exposed to the
solvent, are completely deprotonated. This condition allows for a long term stability of
this suspension in water due to an electrostatic repulsion.
The surface functional groups of SNP, e.g. silanol (Si−OH) and ethoxy silanol
(Si−OEt), have been converted to different functionalities with the same silane
chemisty of catalytic hydrolysis and condensation. A selection of ligands have been
chosen to achieve first a fully inhert pegylated surface (SPEG), secondly a surface
exploiting a specific coordination ligand for an oriented conjugation of His_Tagged
proteins (SNP1) and finally an aminated surface for an unoriented conjugation of
proteins (SNP2). To this purpose, at first several organic linkers have been
synthesized as carefully described in the experimental section at the end of this
chapter.
In the first method (Figure 4.5), a solution of APTS-PEG2000 complex has
been prepared and reacted in a molar ratio 1:1 with a second heterobifunctional
linker namely APTS-NTA under alkaline condition. According to literature data [20],
PEG increases the particle solubility in buffered media and, at the same time,
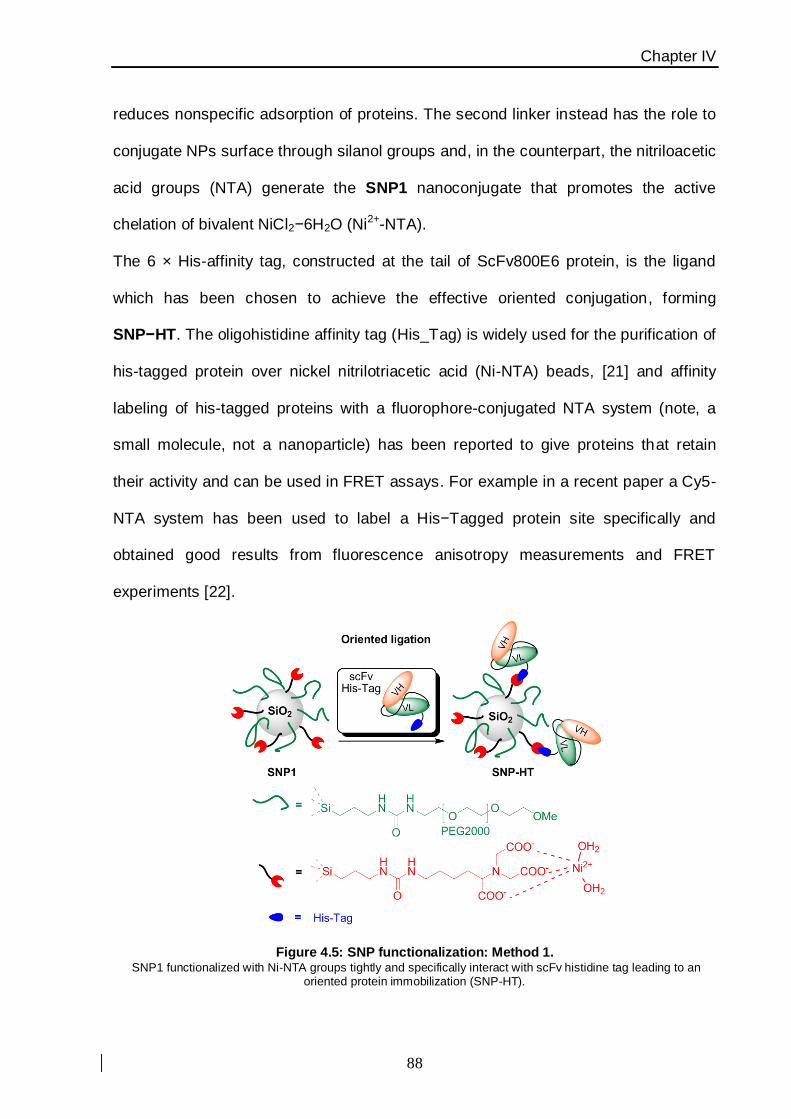
Chapter IV
88
reduces nonspecific adsorption of proteins. The second linker instead has the role to
conjugate NPs surface through silanol groups and, in the counterpart, the nitriloacetic
acid groups (NTA) generate the SNP1 nanoconjugate that promotes the active
chelation of bivalent NiCl2−6H2O (Ni2+-NTA).
The 6 × His-affinity tag, constructed at the tail of ScFv800E6 protein, is the ligand
which has been chosen to achieve the effective oriented conjugation, forming
SNP−HT. The oligohistidine affinity tag (His_Tag) is widely used for the purification of
his-tagged protein over nickel nitrilotriacetic acid (Ni-NTA) beads, [21] and affinity
labeling of his-tagged proteins with a fluorophore-conjugated NTA system (note, a
small molecule, not a nanoparticle) has been reported to give proteins that retain
their activity and can be used in FRET assays. For example in a recent paper a Cy5-
NTA system has been used to label a His−Tagged protein site specifically and
obtained good results from fluorescence anisotropy measurements and FRET
experiments [22].
Figure 4.5: SNP functionalization: Method 1. SNP1 functionalized with Ni-NTA groups tightly and specifically interact with scFv histidine tag leading to an
oriented protein immobilization (SNP-HT).
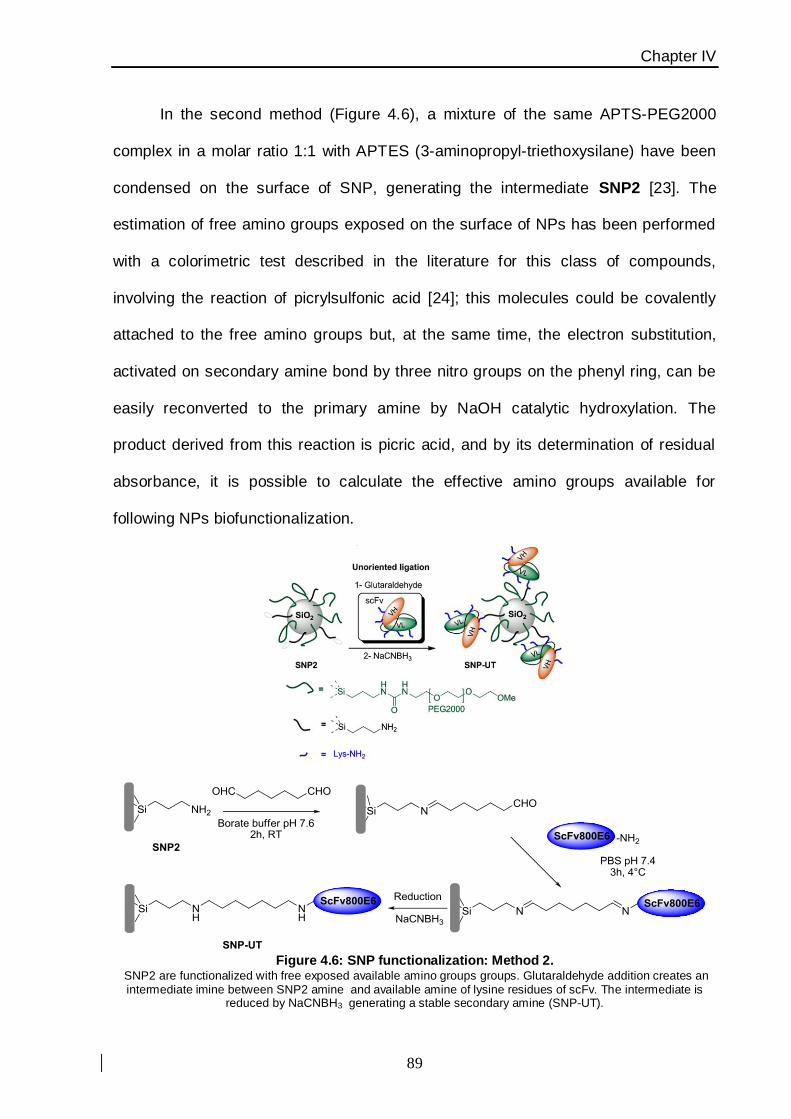
Chapter IV
89
In the second method (Figure 4.6), a mixture of the same APTS-PEG2000
complex in a molar ratio 1:1 with APTES (3-aminopropyl-triethoxysilane) have been
condensed on the surface of SNP, generating the intermediate SNP2 [23]. The
estimation of free amino groups exposed on the surface of NPs has been performed
with a colorimetric test described in the literature for this class of compounds,
involving the reaction of picrylsulfonic acid [24]; this molecules could be covalently
attached to the free amino groups but, at the same time, the electron substitution,
activated on secondary amine bond by three nitro groups on the phenyl ring, can be
easily reconverted to the primary amine by NaOH catalytic hydroxylation. The
product derived from this reaction is picric acid, and by its determination of residual
absorbance, it is possible to calculate the effective amino groups available for
following NPs biofunctionalization.
Figure 4.6: SNP functionalization: Method 2.
SNP2 are functionalized with free exposed available amino groups groups. Glutaraldehyde addition creates an intermediate imine between SNP2 amine and available amine of lysine residues of scFv. The intermediate is
reduced by NaCNBH3 generating a stable secondary amine (SNP-UT).
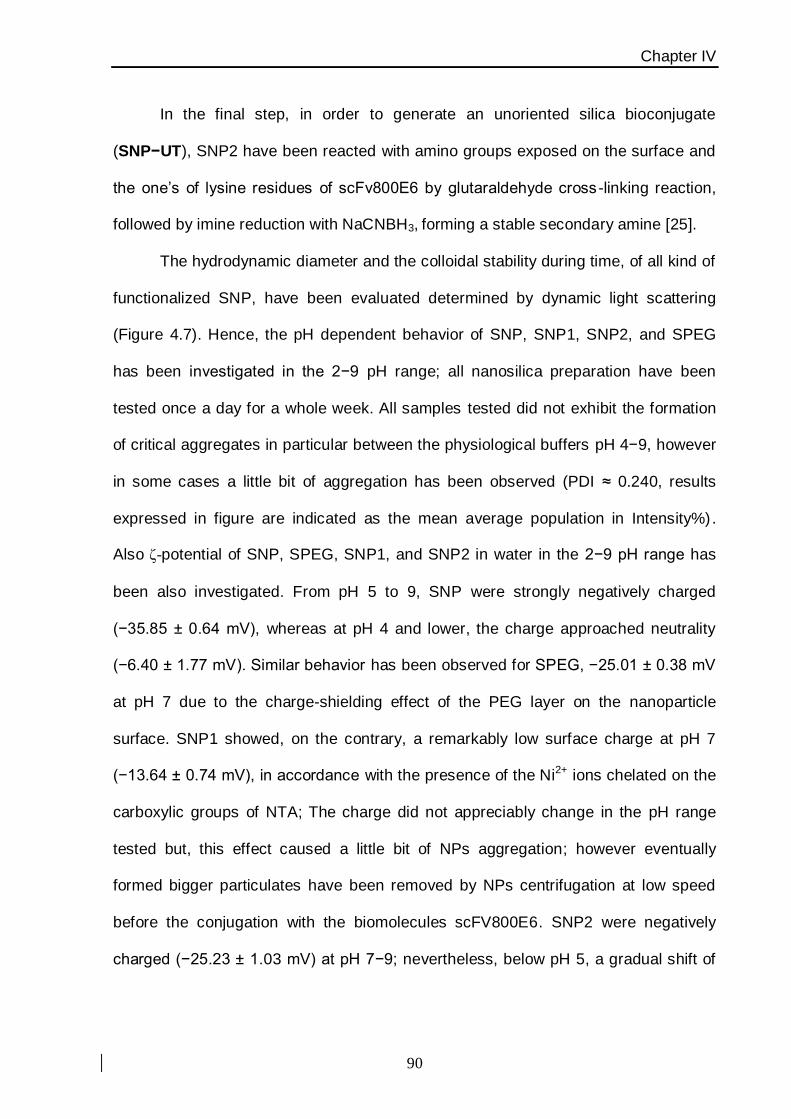
Chapter IV
90
In the final step, in order to generate an unoriented silica bioconjugate
(SNP−UT), SNP2 have been reacted with amino groups exposed on the surface and
the one’s of lysine residues of scFv800E6 by glutaraldehyde cross -linking reaction,
followed by imine reduction with NaCNBH3, forming a stable secondary amine [25].
The hydrodynamic diameter and the colloidal stability during time, of all kind of
functionalized SNP, have been evaluated determined by dynamic light scattering
(Figure 4.7). Hence, the pH dependent behavior of SNP, SNP1, SNP2, and SPEG
has been investigated in the 2−9 pH range; all nanosilica preparation have been
tested once a day for a whole week. All samples tested did not exhibit the formation
of critical aggregates in particular between the physiological buffers pH 4−9, however
in some cases a little bit of aggregation has been observed (PDI ≈ 0.240, results
expressed in figure are indicated as the mean average population in Intensity%).
Also ζ-potential of SNP, SPEG, SNP1, and SNP2 in water in the 2−9 pH range has
been also investigated. From pH 5 to 9, SNP were strongly negatively charged
(−35.85 ± 0.64 mV), whereas at pH 4 and lower, the charge approached neutrality
(−6.40 ± 1.77 mV). Similar behavior has been observed for SPEG, −25.01 ± 0.38 mV
at pH 7 due to the charge-shielding effect of the PEG layer on the nanoparticle
surface. SNP1 showed, on the contrary, a remarkably low surface charge at pH 7
(−13.64 ± 0.74 mV), in accordance with the presence of the Ni2+ ions chelated on the
carboxylic groups of NTA; The charge did not appreciably change in the pH range
tested but, this effect caused a little bit of NPs aggregation; however eventually
formed bigger particulates have been removed by NPs centrifugation at low speed
before the conjugation with the biomolecules scFV800E6. SNP2 were negatively
charged (−25.23 ± 1.03 mV) at pH 7−9; nevertheless, below pH 5, a gradual shift of

Chapter IV
91
the charge to positive values has been observed, in line with the presence of
protonated amino groups of APTES in acidic conditions.
Figure 4.7: Colloidal suspension behavior. DLS (left )and ζ-potential measurements (right) of SNP, SPEG, SNP1, and SNP2 as a function of pH in aqueous
solution.

Chapter IV
92
4.4 ScFv600E6 bioconjugations: assessing targeting
efficiency towards HER2 receptor
After bioconjugations, the amount of scFv800E6 has been evaluated by
protein assay of supernatants at 280 nm, by using a calculated ε at 280 nm of 55 600
M−1. With this assay it has been estimated that 26 μg mgNP−1 for SNP−HT (6
molecules per nanoparticle) and 43 μg mgNP−1 for SNP−UT (10 molecules per
nanoparticle). The immobilization of scFv on SNP−HT has been also confirmed by
dot-blot assay (Figure 4.8) where different amount of scFv and SNP−HT have been
immobilized onto a membrane and then probed with anti-Myc-HRP antibody.
Intensities of immunoreactive spots of SNP−HT and 0.1 μg of free scFv could be
compared; this result reasonably fits with the amount of bound scFv estimated by the
protein assay in solution. Moreover, to exclude the release of chelated scFv from
SNP−HT thus assessing the stability of this synthetic method, the previous
immunostaining have been performed incubating SNP−HT from 1 to 48 h at 37 °C.
Nanoparticle-free supernatants have been filtered onto the membrane and probed
with an anti-Myc-HRP antibody. The negative result of this experiment confirmed that
His_Tag scFv conjugation on SNP−HT is stable within 48 h of incubation at 37 °C.
The same test has been performed with SNP−UT exploiting the same result.
Figure 4.8: Dot-Blot assay of SNP-HT complex. (Left panel) Different amounts of scFv800E6 (0.5, 0.2, 0.1, and 0.05 μg) and an aliquot of SNP-HT have been
filtered onto a PVDF membrane; then probed with anti- Myc-HRP antibody and revealed with an ECL substrate. (Right panel) The same assay has been tested for on SNP-HT and particle-free supernatant until to 48 hs of
incubation at 37°C.
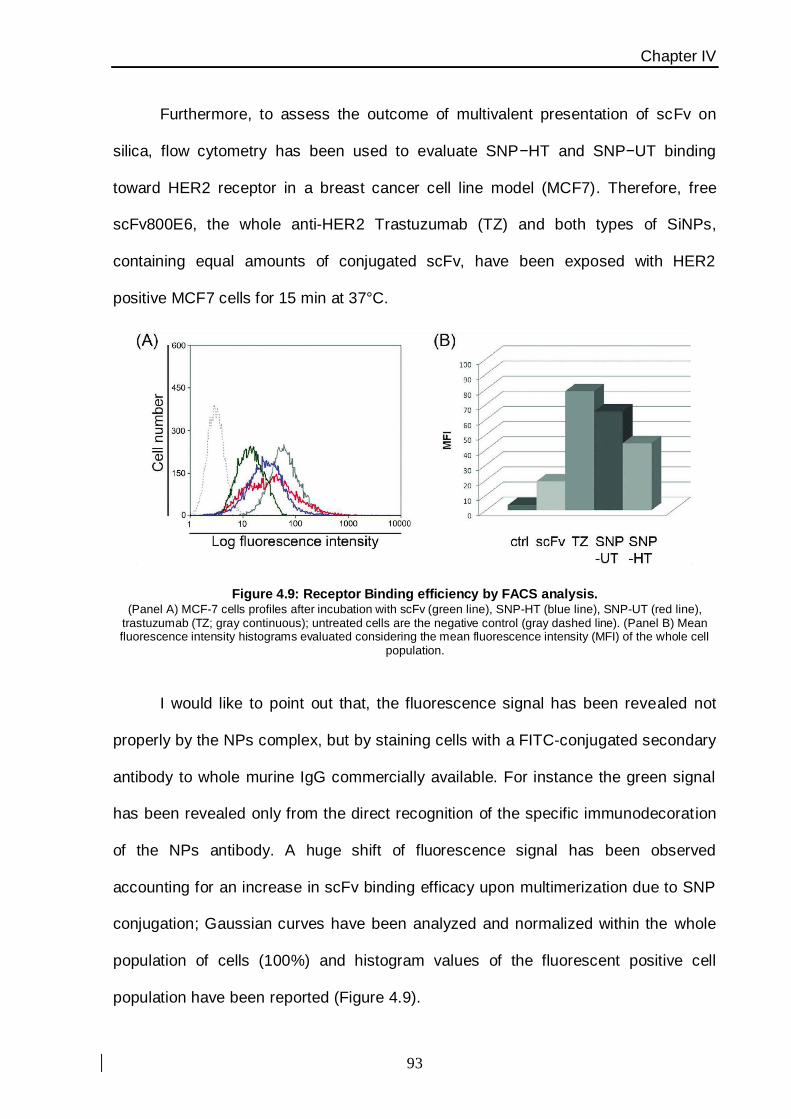
Chapter IV
93
Furthermore, to assess the outcome of multivalent presentation of scFv on
silica, flow cytometry has been used to evaluate SNP−HT and SNP−UT binding
toward HER2 receptor in a breast cancer cell line model (MCF7). Therefore, free
scFv800E6, the whole anti-HER2 Trastuzumab (TZ) and both types of SiNPs,
containing equal amounts of conjugated scFv, have been exposed with HER2
positive MCF7 cells for 15 min at 37°C.
Figure 4.9: Receptor Binding efficiency by FACS analysis. (Panel A) MCF-7 cells profiles after incubation with scFv (green line), SNP-HT (blue line), SNP-UT (red line),
trastuzumab (TZ; gray continuous); untreated cells are the negative control (gray dashed line). (Panel B) Mean fluorescence intensity histograms evaluated considering the mean fluorescence intensity (MFI) of the whole cell
population.
I would like to point out that, the fluorescence signal has been revealed not
properly by the NPs complex, but by staining cells with a FITC-conjugated secondary
antibody to whole murine IgG commercially available. For instance the green signal
has been revealed only from the direct recognition of the specific immunodecoration
of the NPs antibody. A huge shift of fluorescence signal has been observed
accounting for an increase in scFv binding efficacy upon multimerization due to SNP
conjugation; Gaussian curves have been analyzed and normalized within the whole
population of cells (100%) and histogram values of the fluorescent positive cell
population have been reported (Figure 4.9).
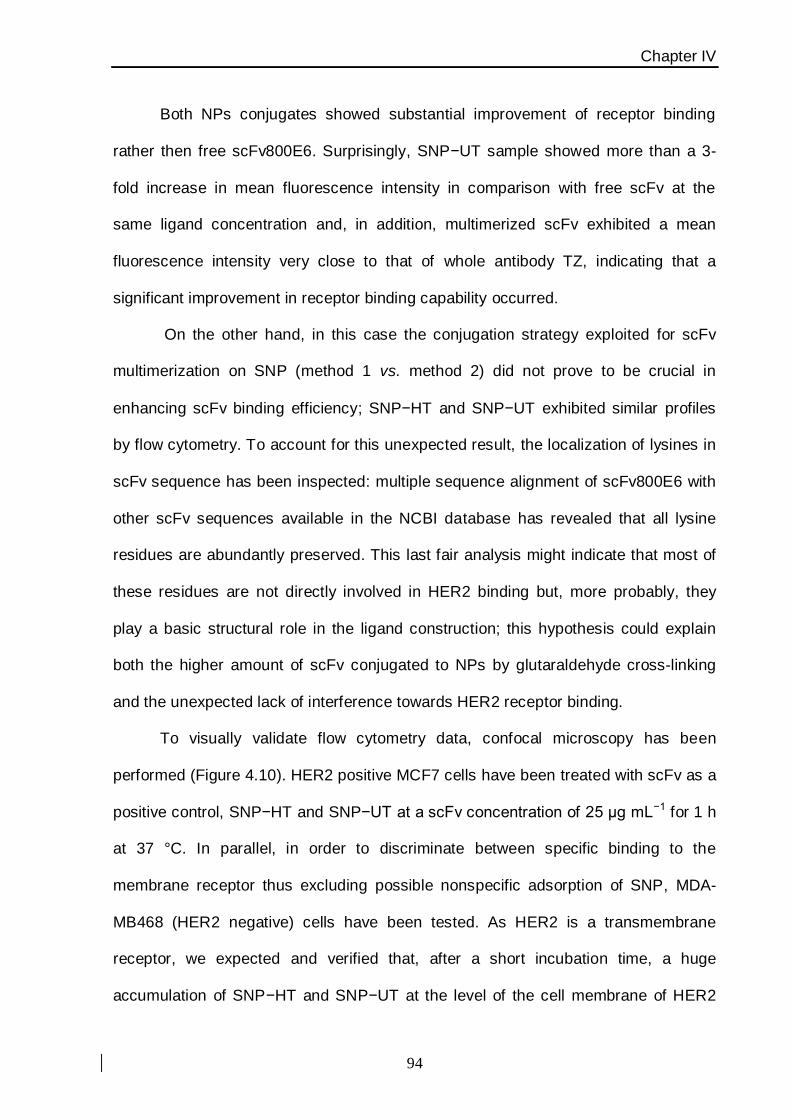
Chapter IV
94
Both NPs conjugates showed substantial improvement of receptor binding
rather then free scFv800E6. Surprisingly, SNP−UT sample showed more than a 3-
fold increase in mean fluorescence intensity in comparison with free scFv at the
same ligand concentration and, in addition, multimerized scFv exhibited a mean
fluorescence intensity very close to that of whole antibody TZ, indicating that a
significant improvement in receptor binding capability occurred.
On the other hand, in this case the conjugation strategy exploited for scFv
multimerization on SNP (method 1 vs. method 2) did not prove to be crucial in
enhancing scFv binding efficiency; SNP−HT and SNP−UT exhibited similar profiles
by flow cytometry. To account for this unexpected result, the localization of lysines in
scFv sequence has been inspected: multiple sequence alignment of scFv800E6 with
other scFv sequences available in the NCBI database has revealed that all lysine
residues are abundantly preserved. This last fair analysis might indicate that most of
these residues are not directly involved in HER2 binding but, more probably, they
play a basic structural role in the ligand construction; this hypothesis could explain
both the higher amount of scFv conjugated to NPs by glutaraldehyde cross-linking
and the unexpected lack of interference towards HER2 receptor binding.
To visually validate flow cytometry data, confocal microscopy has been
performed (Figure 4.10). HER2 positive MCF7 cells have been treated with scFv as a
positive control, SNP−HT and SNP−UT at a scFv concentration of 25 μg mL−1 for 1 h
at 37 °C. In parallel, in order to discriminate between specific binding to the
membrane receptor thus excluding possible nonspecific adsorption of SNP, MDA-
MB468 (HER2 negative) cells have been tested. As HER2 is a transmembrane
receptor, we expected and verified that, after a short incubation time, a huge
accumulation of SNP−HT and SNP−UT at the level of the cell membrane of HER2
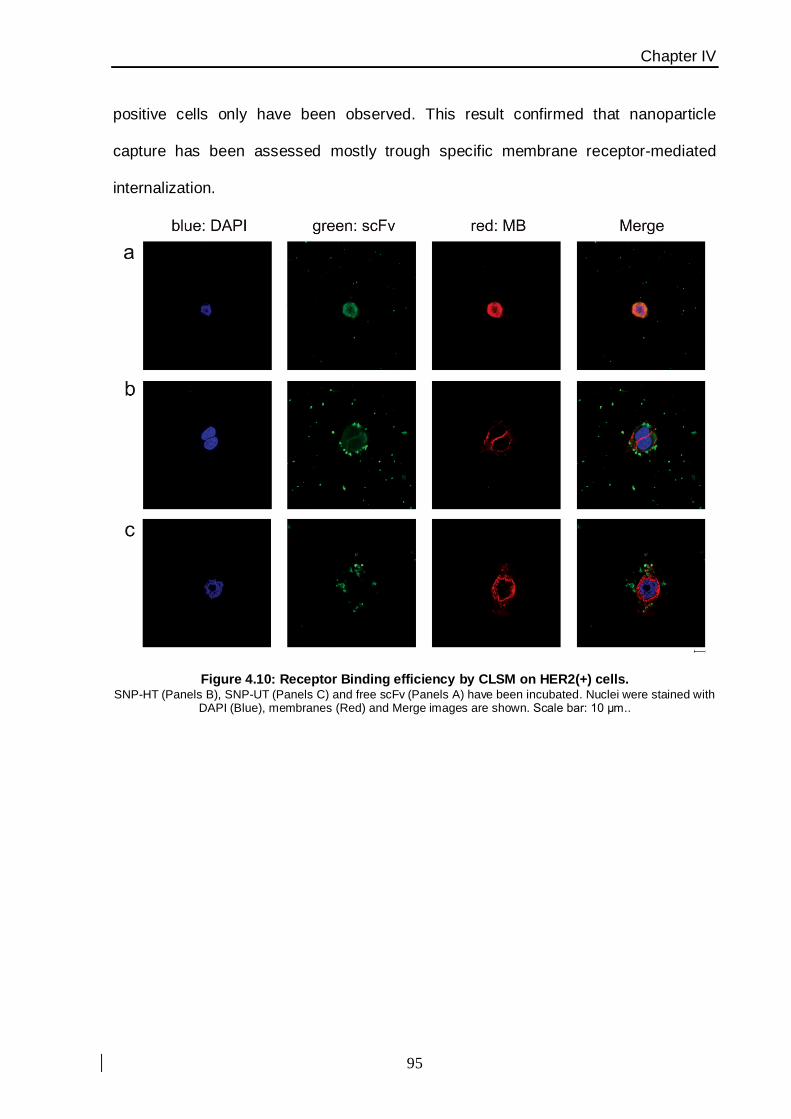
Chapter IV
95
positive cells only have been observed. This result confirmed that nanoparticle
capture has been assessed mostly trough specific membrane receptor-mediated
internalization.
Figure 4.10: Receptor Binding efficiency by CLSM on HER2(+) cells. SNP-HT (Panels B), SNP-UT (Panels C) and free scFv (Panels A) have been incubated. Nuclei were stained with
DAPI (Blue), membranes (Red) and Merge images are shown. Scale bar: 10 μm..
Chapter IV
96
4.5 Conclusions and outlooks
In this chapter a nanoparticle-based multimerization strategy has been
presented, with the aim of enhancing the specific binding affinity of engineered scFvs
toward cancer cell receptors. So far, a substantial increase in binding efficiency of an
antibody fragment has been primarily obtained by either covalently linking the
individual scFv unit or by the construction of a multivalent variant by connecting
antibody fragment with oligomerization domains. Our strategy has proved of capital
interest for the easy and reliable development of a multifunctional hybrid
nanoparticles, allowing for multiple presentation of scFv molecules on their spherical
surface. Such multifunctional nanoconstruct has been demonstrated very selective in
binding a specific transmembrane receptor overexpressed in living cells, namely
HER2. These results suggest that the use of controlled inorganic nanoparticles as a
multimerization scaffold is capable of enhancing the targeting efficiency to high
levels, which could run together with monoclonal antibodies currently adapted in
clinical diagnostic practice.
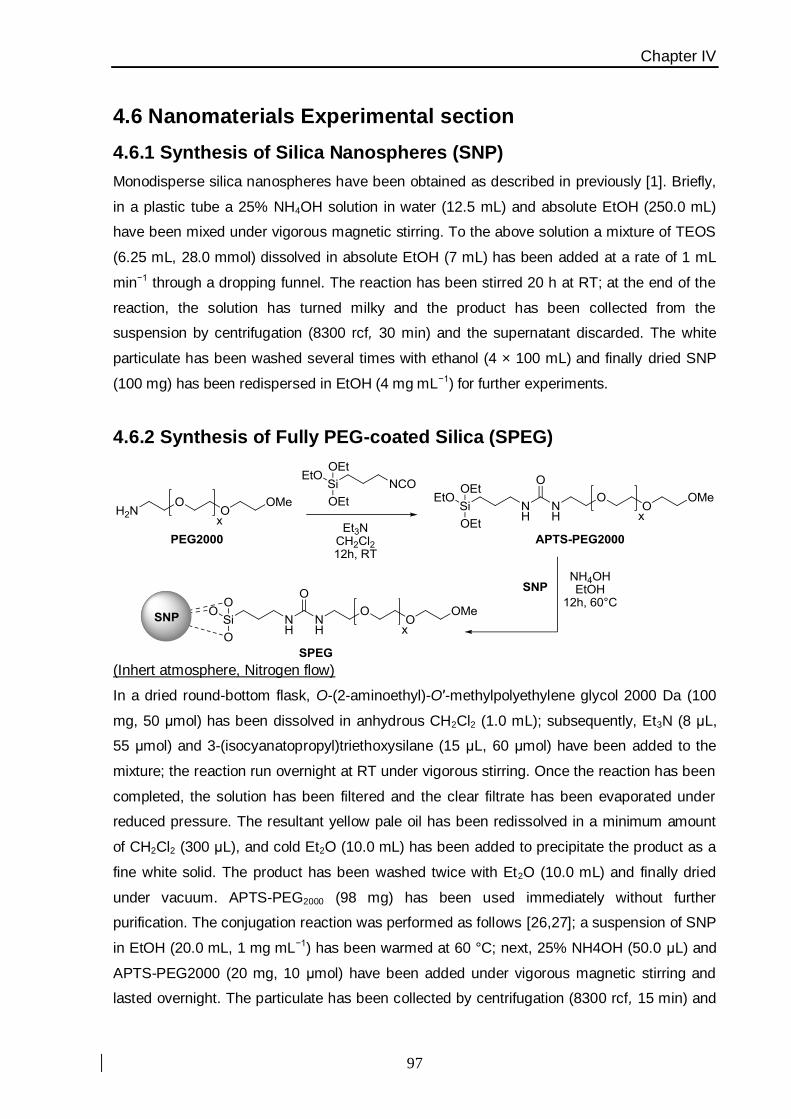
Chapter IV
97
4.6 Nanomaterials Experimental section
4.6.1 Synthesis of Silica Nanospheres (SNP)
Monodisperse silica nanospheres have been obtained as described in previously [1]. Briefly,
in a plastic tube a 25% NH4OH solution in water (12.5 mL) and absolute EtOH (250.0 mL)
have been mixed under vigorous magnetic stirring. To the above solution a mixture of TEOS
(6.25 mL, 28.0 mmol) dissolved in absolute EtOH (7 mL) has been added at a rate of 1 mL
min−1 through a dropping funnel. The reaction has been stirred 20 h at RT; at the end of the
reaction, the solution has turned milky and the product has been collected from the
suspension by centrifugation (8300 rcf, 30 min) and the supernatant discarded. The white
particulate has been washed several times with ethanol (4 × 100 mL) and finally dried SNP
(100 mg) has been redispersed in EtOH (4 mg mL−1) for further experiments.
4.6.2 Synthesis of Fully PEG-coated Silica (SPEG)
(Inhert atmosphere, Nitrogen flow)
In a dried round-bottom flask, O-(2-aminoethyl)-O′-methylpolyethylene glycol 2000 Da (100
mg, 50 μmol) has been dissolved in anhydrous CH2Cl2 (1.0 mL); subsequently, Et3N (8 μL,
55 μmol) and 3-(isocyanatopropyl)triethoxysilane (15 μL, 60 μmol) have been added to the
mixture; the reaction run overnight at RT under vigorous stirring. Once the reaction has been
completed, the solution has been filtered and the clear filtrate has been evaporated under
reduced pressure. The resultant yellow pale oil has been redissolved in a minimum amount
of CH2Cl2 (300 μL), and cold Et2O (10.0 mL) has been added to precipitate the product as a
fine white solid. The product has been washed twice with Et2O (10.0 mL) and finally dried
under vacuum. APTS-PEG2000 (98 mg) has been used immediately without further
purification. The conjugation reaction was performed as follows [26,27]; a suspension of SNP
in EtOH (20.0 mL, 1 mg mL−1) has been warmed at 60 °C; next, 25% NH4OH (50.0 μL) and
APTS-PEG2000 (20 mg, 10 μmol) have been added under vigorous magnetic stirring and
lasted overnight. The particulate has been collected by centrifugation (8300 rcf, 15 min) and
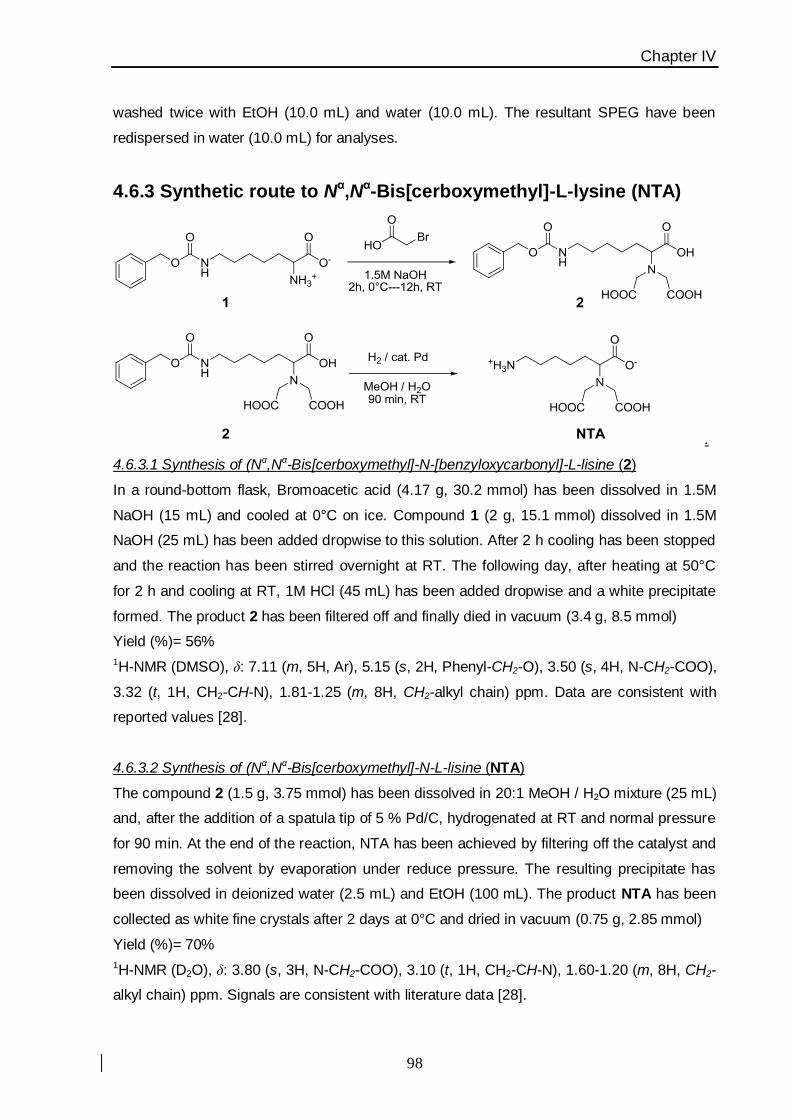
Chapter IV
98
washed twice with EtOH (10.0 mL) and water (10.0 mL). The resultant SPEG have been
redispersed in water (10.0 mL) for analyses.
4.6.3 Synthetic route to Nα,Nα-Bis[cerboxymethyl]-L-lysine (NTA)
.
4.6.3.1 Synthesis of (Nα,Nα-Bis[cerboxymethyl]-N-[benzyloxycarbonyl]-L-lisine (2)
In a round-bottom flask, Bromoacetic acid (4.17 g, 30.2 mmol) has been dissolved in 1.5M
NaOH (15 mL) and cooled at 0°C on ice. Compound 1 (2 g, 15.1 mmol) dissolved in 1.5M
NaOH (25 mL) has been added dropwise to this solution. After 2 h cooling has been stopped
and the reaction has been stirred overnight at RT. The following day, after heating at 50°C
for 2 h and cooling at RT, 1M HCl (45 mL) has been added dropwise and a white precipitate
formed. The product 2 has been filtered off and finally died in vacuum (3.4 g, 8.5 mmol)
Yield (%)= 56%
1H-NMR (DMSO), δ: 7.11 (m, 5H, Ar), 5.15 (s, 2H, Phenyl-CH2-O), 3.50 (s, 4H, N-CH2-COO),
3.32 (t, 1H, CH2-CH-N), 1.81-1.25 (m, 8H, CH2-alkyl chain) ppm. Data are consistent with
reported values [28].
4.6.3.2 Synthesis of (Nα,Nα-Bis[cerboxymethyl]-N-L-lisine (NTA)
The compound 2 (1.5 g, 3.75 mmol) has been dissolved in 20:1 MeOH / H2O mixture (25 mL)
and, after the addition of a spatula tip of 5 % Pd/C, hydrogenated at RT and normal pressure
for 90 min. At the end of the reaction, NTA has been achieved by filtering off the catalyst and
removing the solvent by evaporation under reduce pressure. The resulting precipitate has
been dissolved in deionized water (2.5 mL) and EtOH (100 mL). The product NTA has been
collected as white fine crystals after 2 days at 0°C and dried in vacuum (0.75 g, 2.85 mmol)
Yield (%)= 70%
1H-NMR (D2O), δ: 3.80 (s, 3H, N-CH2-COO), 3.10 (t, 1H, CH2-CH-N), 1.60-1.20 (m, 8H, CH2-
alkyl chain) ppm. Signals are consistent with literature data [28].
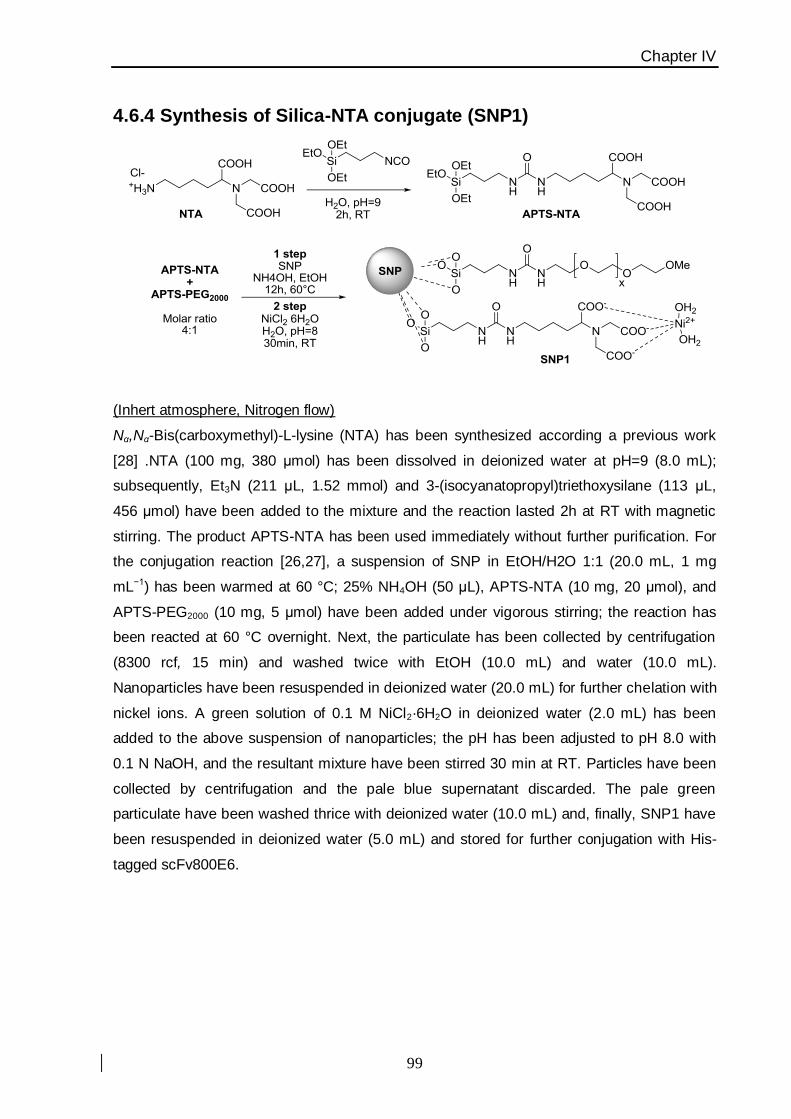
Chapter IV
99
4.6.4 Synthesis of Silica-NTA conjugate (SNP1)
(Inhert atmosphere, Nitrogen flow)
Nα,Nα-Bis(carboxymethyl)-L-lysine (NTA) has been synthesized according a previous work
[28] .NTA (100 mg, 380 μmol) has been dissolved in deionized water at pH=9 (8.0 mL);
subsequently, Et3N (211 μL, 1.52 mmol) and 3-(isocyanatopropyl)triethoxysilane (113 μL,
456 μmol) have been added to the mixture and the reaction lasted 2h at RT with magnetic
stirring. The product APTS-NTA has been used immediately without further purification. For
the conjugation reaction [26,27], a suspension of SNP in EtOH/H2O 1:1 (20.0 mL, 1 mg
mL−1) has been warmed at 60 °C; 25% NH4OH (50 μL), APTS-NTA (10 mg, 20 μmol), and
APTS-PEG2000 (10 mg, 5 μmol) have been added under vigorous stirring; the reaction has
been reacted at 60 °C overnight. Next, the particulate has been collected by centrifugation
(8300 rcf, 15 min) and washed twice with EtOH (10.0 mL) and water (10.0 mL).
Nanoparticles have been resuspended in deionized water (20.0 mL) for further chelation with
nickel ions. A green solution of 0.1 M NiCl2·6H2O in deionized water (2.0 mL) has been
added to the above suspension of nanoparticles; the pH has been adjusted to pH 8.0 with
0.1 N NaOH, and the resultant mixture have been stirred 30 min at RT. Particles have been
collected by centrifugation and the pale blue supernatant discarded. The pale green
particulate have been washed thrice with deionized water (10.0 mL) and, finally, SNP1 have
been resuspended in deionized water (5.0 mL) and stored for further conjugation with His-
tagged scFv800E6.
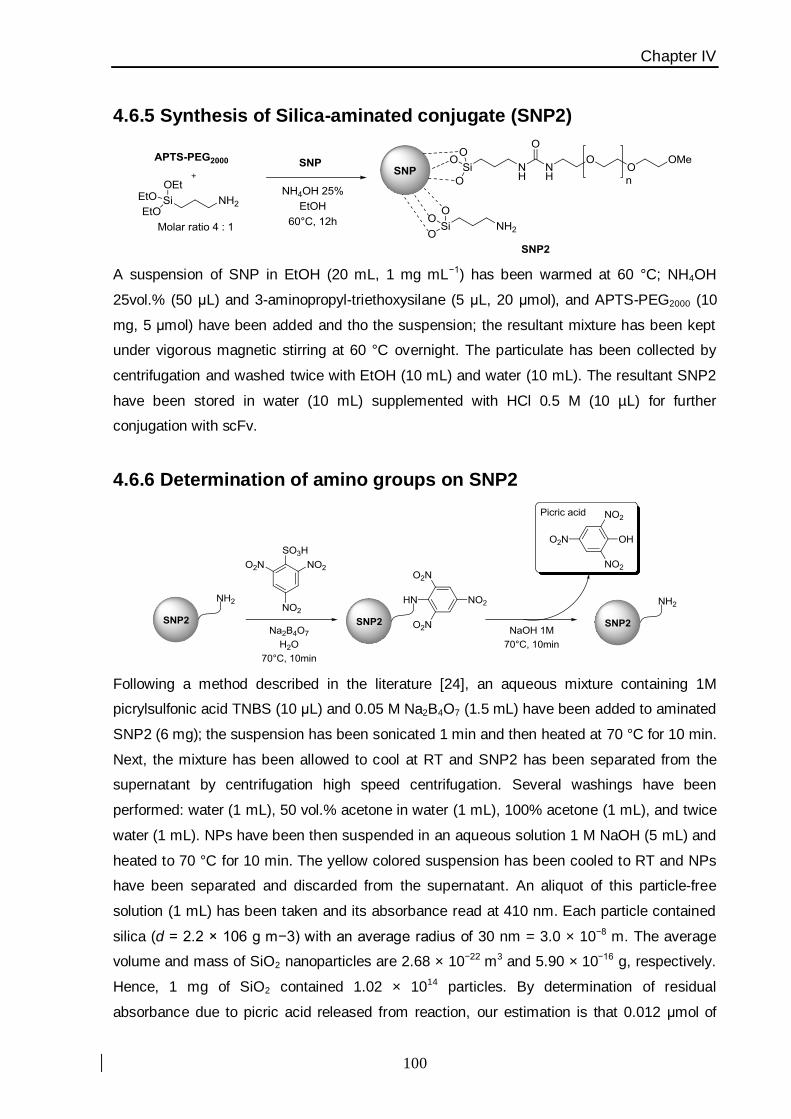
Chapter IV
100
4.6.5 Synthesis of Silica-aminated conjugate (SNP2)
A suspension of SNP in EtOH (20 mL, 1 mg mL−1) has been warmed at 60 °C; NH4OH
25vol.% (50 μL) and 3-aminopropyl-triethoxysilane (5 μL, 20 μmol), and APTS-PEG2000 (10
mg, 5 μmol) have been added and tho the suspension; the resultant mixture has been kept
under vigorous magnetic stirring at 60 °C overnight. The particulate has been collected by
centrifugation and washed twice with EtOH (10 mL) and water (10 mL). The resultant SNP2
have been stored in water (10 mL) supplemented with HCl 0.5 M (10 µL) for further
conjugation with scFv.
4.6.6 Determination of amino groups on SNP2
Following a method described in the literature [24], an aqueous mixture containing 1M
picrylsulfonic acid TNBS (10 μL) and 0.05 M Na2B4O7 (1.5 mL) have been added to aminated
SNP2 (6 mg); the suspension has been sonicated 1 min and then heated at 70 °C for 10 min.
Next, the mixture has been allowed to cool at RT and SNP2 has been separated from the
supernatant by centrifugation high speed centrifugation. Several washings have been
performed: water (1 mL), 50 vol.% acetone in water (1 mL), 100% acetone (1 mL), and twice
water (1 mL). NPs have been then suspended in an aqueous solution 1 M NaOH (5 mL) and
heated to 70 °C for 10 min. The yellow colored suspension has been cooled to RT and NPs
have been separated and discarded from the supernatant. An aliquot of this particle-free
solution (1 mL) has been taken and its absorbance read at 410 nm. Each particle contained
silica (d = 2.2 × 10⁶ g m−3) with an average radius of 30 nm = 3.0 × 10⁻⁸ m. The average
volume and mass of SiO2 nanoparticles are 2.68 × 10⁻²² m3 and 5.90 × 10⁻¹⁶ g, respectively.
Hence, 1 mg of SiO2 contained 1.02 × 10¹⁴ particles. By determination of residual
absorbance due to picric acid released from reaction, our estimation is that 0.012 μmol of

Chapter IV
101
ligand APTS were immobilized on the particle surface corresponding to about 708 NH2
groups/particle (Figure 4.11).
Figure 4.11. Calibration curve of Picric acid in aqueous NaOH 1 M (λmax = 410 nm).
4.6.7 Oriented ligation of His-Tag scFv800E6 (SNP−HT)
In a plastic sterile tube, SNP1 (1 mg) have been mixed with purified scFv800E6 (50 μg, 2
nmol) in 20 mM PBS pH 7.2 (final volume of 1 mL) and the mixture has been stirred on the
orbital shaker 10 min at RT. SNP-HT have been isolated from unreacted scFv800E6 by three
centrifugation cycles and washes with fresh PBS (500 μL). The final product have been
finally stored in PBS at 4 °C for further experiments. By measuring the absorbance at 280
nm, the amount of scFv800E6 immobilized on nanoparticles has been evaluated of 26 μg
mg−1 of SNP-HT, corresponding about 6 molecules NP−1.
4.6.8 Ligation of scFv800E6 through reductive amination (SNP−UT)

Chapter IV
102
Particle-glutaraldehyde cross-linking, [29] followed by imine reduction [30] with NaCNBH3
have been performed as follows. In a sterile plastic tube, amino SNP2 (1 mg) have been
dispersed in borate buffer pH 7.6 (600 μL). A 5 mM glutaraldehyde solution in the same
buffer (400 μL, 20 μmol) has been added under stirring at RT and after 2 h of reaction,
aldehyde-conjugated NPs have been isolated by centrifugation and washed once with borate
buffer pH 7.6 (1 mL) and twice with PBS pH 7.4 (1 mL). NPs have been then resuspended (1
mg mL−1) in the same buffer (1 mL) and the suspension cooled at 4 °C with an ice bath;
scFv800E6 (50 μg, 2 nmol) in PBS was added to the suspension and the resultant mixture
has been stirred on the orbital shaker for 3 h at 4 °C. ScFv-functionalized nanoparticles have
been recovered after centrifugation and washed twice with PBS pH 7.2 (1 mL).
Subsequently, a NaCNBH3 solution (10 μL, 1 mg mL−1) in PBS pH 7.2 has been added to the
previous mixture and incubated for 3 h at 4 °C. After centrifuging, SNP-UT have been
washed three times with PBS (1 mL) and finally stored in the same buffer at 4 °C for further
experiments. By measuring the absorbance at 280 nm, we determined an amount of
scFv800E6 43 μg mg−1 of SNP-HT, corresponding about 10 molecules NP−1.
4.6.9 Stability assay of scFv conjugation on SNP−HT
Immobilized-scFv on SNP-HT (5 µg estimated) have been incubated at 37 °C with 0.1 mL of
cell culture medium. After incubation time, SNP-HT have been centrifuged 15 min at high
speed at 4 °C and subsequently supernatants (S1, S4, S24, and S48) have been filtered
onto a PVDF membrane utilizing a Manifold I dot blot apparatus (GE Healthcare). The
membrane has been incubated in a blocking solution composed by 5 vol.% skim milk in PBS
and Tween 0.05 vol.%, for 1 h at RT; the membrane has been then probed 1 h at RT in the
blocking solution using rabbit anti-Myc-HRP antibody (Invitrogen) at a 1:5000 dilution. The
Membrane has been rinsed thrice in 0.05 vol.% Tween in PBS for 10 min. Immunoreactive
spots have been revealed using ECL Western blotting reagent (GE Healthcare). Five
micrograms of scFv immobilized on SNP-HT and 0.1 mL of culture medium were used,
respectively, as positive and negative control.
Chapter IV
103
Related References
[1] Jain, K.; Expert Opin. Pharmacother. 2005, 6, 1463–1476.
[2] Olayioye, M. A..; Neve, M. R.; Lane, H. A. and Hynes, M. E.; EMBO J. 2000, 19, 3159–3167.
[3] Ferguson, K. M.; Berger, M. B.; Mendroia, J. M.; et al.; Mol. Cell. 2003, 11, 507–517.
[4] Colombo, M.; Corsi, F.; Foschi, D.; et al.; Pharmacol. Res. 2010, 62, 150–165.
[5] Sharma, S. V. and Setteleman, J.; Exp. Cell. Res. 2009, 315, 557–571.
[6] Wieduwilt, M. J. and Moasser, M. M.; Cell Mol. Life Sci. 2008, 65, 1566–1584.
[7] Amit, I.; Wides, R. and Yarden, Y.; Mol. Syst. Biol. 2007, 3, 151.
[8] Faltus, T.; Yuan, J.; Zimmer, B.; et al.; Neoplasia. 2004, 6, 786–795.
[9] Cooley, S.; Burns, L. J.; Repka, T. and Miller, J. S.; Exp. Hematol. 1999, 27, 1533–1541.
[10] Lewis, G. D.; Figari, I.; Fendly, B.; et al.; Cancer Immunol. Immunother. 1993, 37, 255–263.
[11] Molina, M. A.; Codony-Servat, J.; Albanell, J.; Royo, F.; Arribas, J. and Baselga, J.; Cancer Res.
2001, 61, 4744–4749.
[12] Sarup, J. C.; Johnson, R. M.; King, K. L.; et al.; Growth Regul. 1991, 1, 72–82.
[13] Lane, H. A.; Matoyama, A. B.; Beuvink, I. and Hynes, N. E.; Ann. Oncol. 2001, 12, S21–S22.
[14] Marlind, J.; Kaspar, M.; Trachsel, E.; et al.; Clin. Cancer Res. 2008, 14, 6515–6524.
[15] Zhang, G.; Liu, Y. and Hu, H.; Eur. J. Inflamm. 2010, 8, 75–82.
[16] Sommaruga, S.; Lombardi, A.; Salvadé, A.; et al.; Appl. Microbiol. Biotechnol. 2011, 91, 613–621.
[17] Galeffi, P.; Lombardi, A.; Donato, M. D.; et al.; Vaccine. 2005, 23, 1823–1827.
[18] Lombardi, A.; Sperandei, M.; Cantale, C.; Giacomini, P. and Galeffi, P.; Protein Expr. Purif. 2005,
44, 10–15.
[19] Stöber, W.; Fink, A. and Bohn, E.; J. Colloid. Interface. Sci. 1968, 26, 62–65.
[20] Lin, W.; Garnett, M. C.; Schacht, E.; Davis, S. S. and Illum, L.; Int. J. Pharm. 1999, 189, 161–170.
[21] Kim, S. H.; Jeyakumar, M. and Katzenellenbogen, J. A.; J. Am. Chem. Soc. 2007, 129, 13254–
13264.
[22] Kapanidis, A. N.; Ebright, Y. W. and Ebright, R. H.; J. Am. Chem. Soc. 2001, 123, 12123–12125.
[23] Cantu, E. S.; Cueto, R.; Koch, J. and Russo, P. S.; Langmuir. 2012, 28, 5562–5569.
[24] Halling, P. J. and Dunnill, P.; Biotechnol. Bioeng. 1979, 21, 393–416.
[25] Hu, F.; Wei, L. Zhou, Z.; Ran, Y.; Li, Z. and Gao, M.; Adv. Mater. 2006, 18, 2553–2556.
[26] Wu, T.; Zhang, Y.; Wang, X. and Liu, S.; Chem. Mater. 2008, 20, 101–109.
[27] Kim, S. H.; Jeyakumar, M.; and Katznellenbogen, J. A.; J. Am. Chem. Soc. 2007, 129, 13254–
13264.
[28] Schmitt, L.; Dietrich, C. and Tampè, R.; J. Am. Chem. Soc. 1994, 116, 8485–8491.
[29] Corsi, F.; De Palma, C.; Colombo, M.; et al.; Small. 2009, 5, 2555–2564.
[30] Han, H. J.; Kannan, R. M.; Wang, S.; Mao, G. and Romero, R.; Adv. Funct. Mater. 2010, 20, 409–
412.
Chapter V
104
Chapter V
Development of a Fluorescent
Silica Nanoparticles Platform for
Transferrin Conjugation:
Implications at the Bio-Nano
Interface

Chapter V
105
Contents
5.1 The role of transferrin receptor in human cancers pag 105
5.2 The bio−nano interface outlines the biological identity pag 109
5.3 Development of a Fluorescent-based Silica nanoparticles platform pag 112
5.4 Silica functionalizations pag 115
5.5 Transferrin bioconjugation pag 118
5.6 Nanocomplex activities towards TfR pag 121
5.7 Perspectives pag 124
5.8 Nanomaterials experimental section pag 125
5.8.1 Synthesis of Core-Fluorescent Silica Nanospheres (FSNP)
5.8.2 Synthesis of Core-shell fluorescent silica nanoparticles (SFSNP)
5.8.3 Amination of Core-shell fluorescent silica nanoparticles (HA-SNP)
5.8.4 Determination of amino groups on HA-SNP: Ninhydrin assay
5.8.5 First inhert pegylation (PEG1-SNP)
5.8.6 Transferrin bioconjugation onto silica nanoparticles (Tf-SNP)
5.8.7 Cell silencing and flow cytometry
5.8.8 Protein separation by 1D-SDS-PAGE
Related references. pag 132
5.1. The role of Transferrin receptor in human cancers
Transferrin (Tf) is considered the essential iron transport system in vertebrates and
invertebrates [1]. Most of the transferrins and mainly human serum transferrin
consist of a single polypeptide chain of roughly 700 amino acids organized in two
lobes (C and N). Each lobe contains an iron binding cleft in which iron is coordinated
to four protein ligands and a synergistic carbonate anion [2]. In mammals, soluble Tf
solubilizes Fe3+ in neutral biological media. When it becomes iron-loaded on the C-
site only or on both sites (holo-soluble Tf), it is recognized by transferrin receptor 1
(TfR1) and to a much lesser extent by TfR2 [1]. The iron-loaded Tf-TfR adduct that is
formed is then internalized in the cytoplasm by receptor-mediated endocytosis. Later
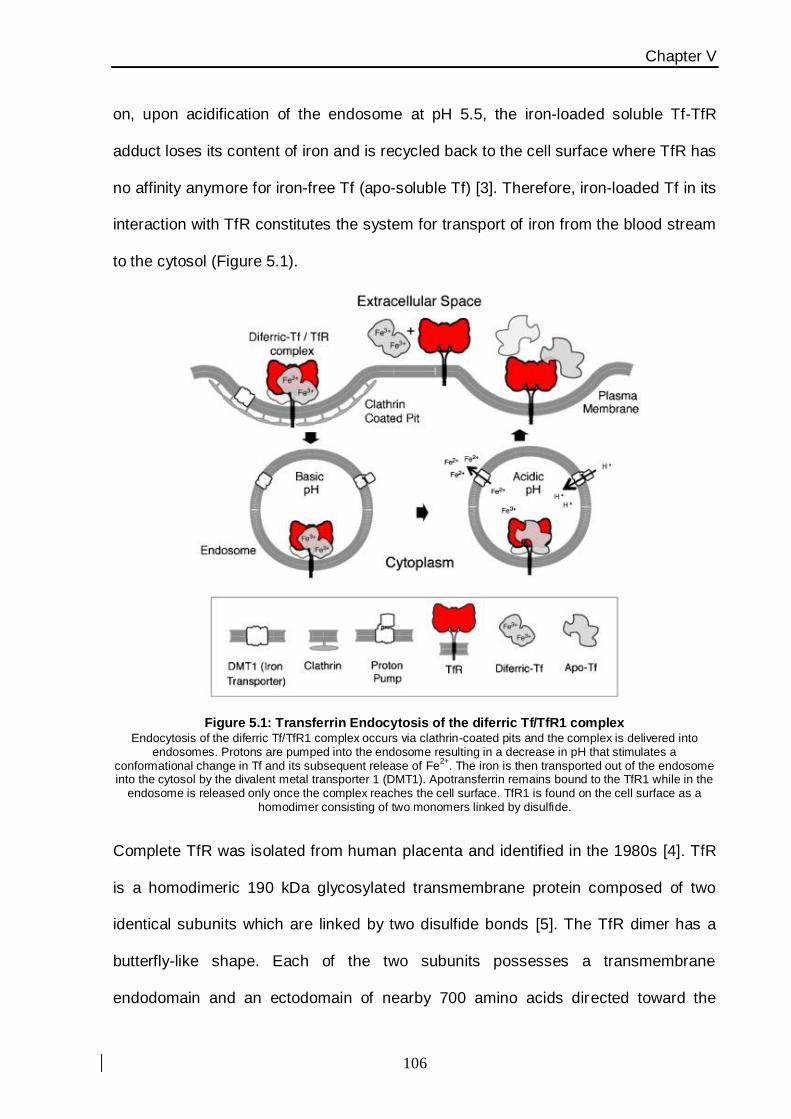
Chapter V
106
on, upon acidification of the endosome at pH 5.5, the iron-loaded soluble Tf-TfR
adduct loses its content of iron and is recycled back to the cell surface where TfR has
no affinity anymore for iron-free Tf (apo-soluble Tf) [3]. Therefore, iron-loaded Tf in its
interaction with TfR constitutes the system for transport of iron from the blood stream
to the cytosol (Figure 5.1).
Figure 5.1: Transferrin Endocytosis of the diferric Tf/TfR1 complex Endocytosis of the diferric Tf/TfR1 complex occurs via clathrin-coated pits and the complex is delivered into
endosomes. Protons are pumped into the endosome resulting in a decrease in pH that stimulates a conformational change in Tf and its subsequent release of Fe
2+. The iron is then transported out of the endosome
into the cytosol by the divalent metal transporter 1 (DMT1). Apotransferrin remains bound to the TfR1 while in the endosome is released only once the complex reaches the cell surface. TfR1 is found on the cell surface as a
homodimer consisting of two monomers linked by disulfide.
Complete TfR was isolated from human placenta and identified in the 1980s [4]. TfR
is a homodimeric 190 kDa glycosylated transmembrane protein composed of two
identical subunits which are linked by two disulfide bonds [5]. The TfR dimer has a
butterfly-like shape. Each of the two subunits possesses a transmembrane
endodomain and an ectodomain of nearby 700 amino acids directed toward the
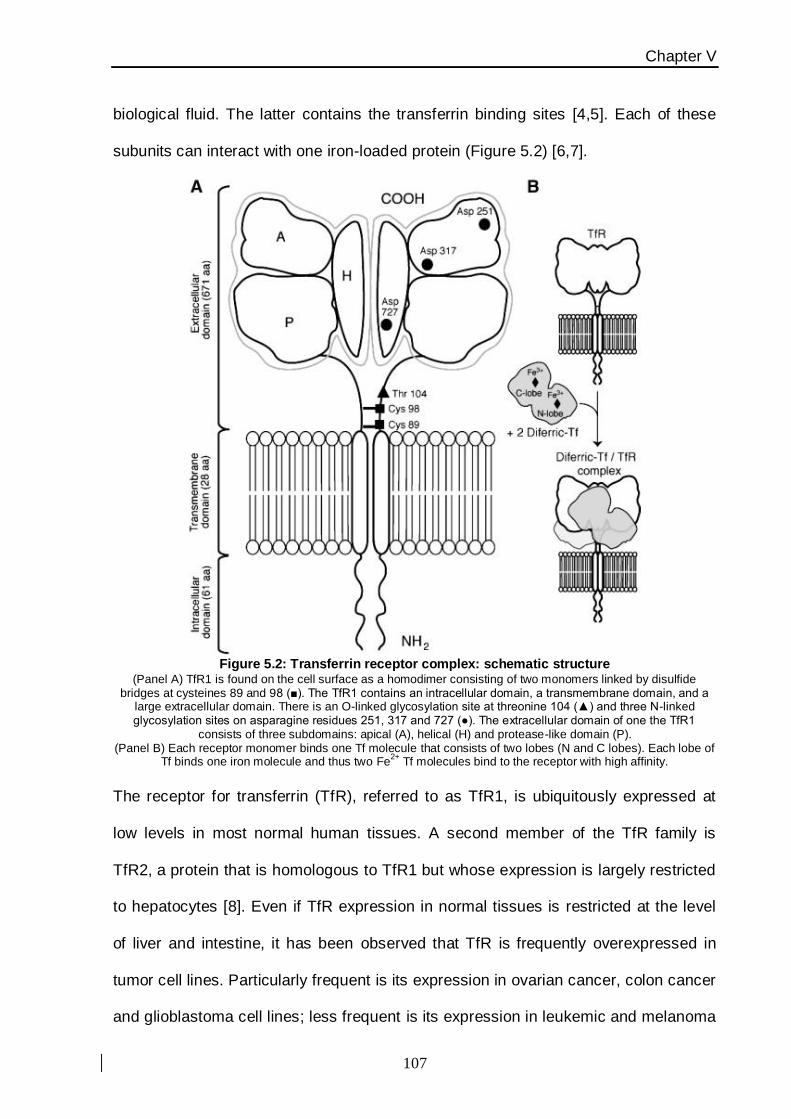
Chapter V
107
biological fluid. The latter contains the transferrin binding sites [4,5]. Each of these
subunits can interact with one iron-loaded protein (Figure 5.2) [6,7].
Figure 5.2: Transferrin receptor complex: schematic structure
(Panel A) TfR1 is found on the cell surface as a homodimer consisting of two monomers linked by disulfide bridges at cysteines 89 and 98 (■). The TfR1 contains an intracellular domain, a transmembrane domain, and a
large extracellular domain. There is an O-linked glycosylation site at threonine 104 (▲) and three N-linked glycosylation sites on asparagine residues 251, 317 and 727 (●). The extracellular domain of one the TfR1
consists of three subdomains: apical (A), helical (H) and protease-like domain (P). (Panel B) Each receptor monomer binds one Tf molecule that consists of two lobes (N and C lobes). Each lobe of
Tf binds one iron molecule and thus two Fe2+
Tf molecules bind to the receptor with high affinity.
The receptor for transferrin (TfR), referred to as TfR1, is ubiquitously expressed at
low levels in most normal human tissues. A second member of the TfR family is
TfR2, a protein that is homologous to TfR1 but whose expression is largely restricted
to hepatocytes [8]. Even if TfR expression in normal tissues is restricted at the level
of liver and intestine, it has been observed that TfR is frequently overexpressed in
tumor cell lines. Particularly frequent is its expression in ovarian cancer, colon cancer
and glioblastoma cell lines; less frequent is its expression in leukemic and melanoma
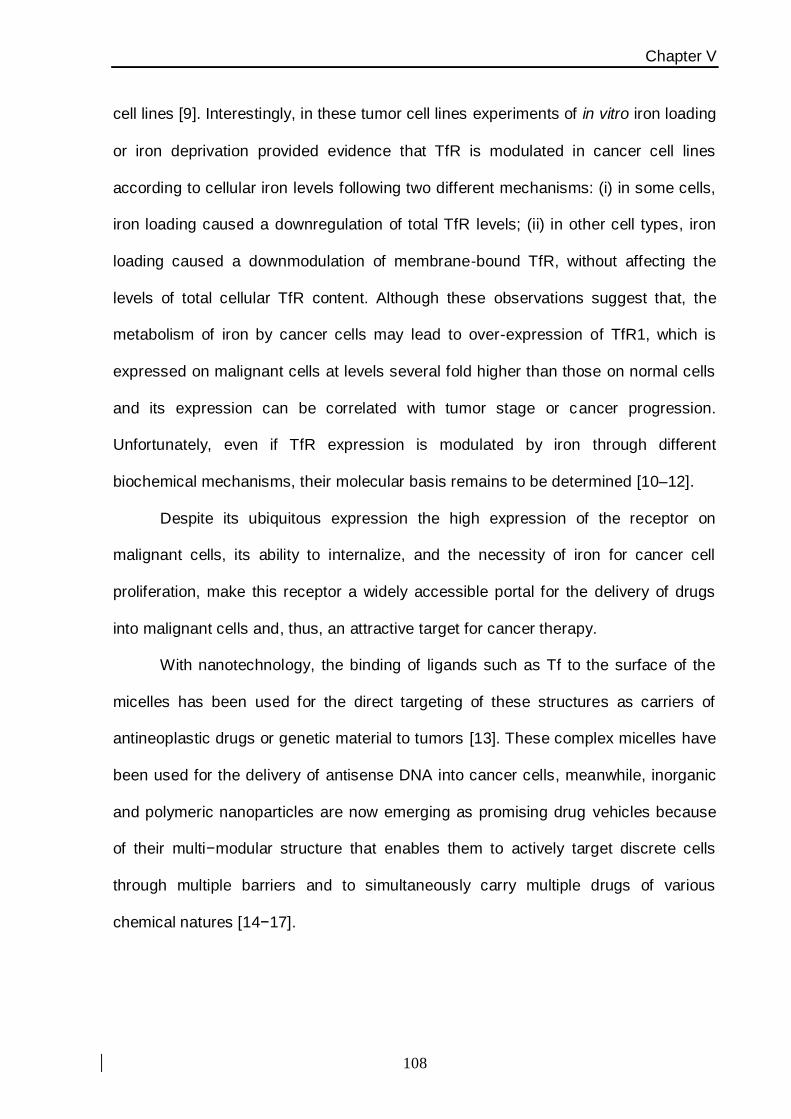
Chapter V
108
cell lines [9]. Interestingly, in these tumor cell lines experiments of in vitro iron loading
or iron deprivation provided evidence that TfR is modulated in cancer cell lines
according to cellular iron levels following two different mechanisms: (i) in some cells,
iron loading caused a downregulation of total TfR levels; (ii) in other cell types, iron
loading caused a downmodulation of membrane-bound TfR, without affecting the
levels of total cellular TfR content. Although these observations suggest that, the
metabolism of iron by cancer cells may lead to over-expression of TfR1, which is
expressed on malignant cells at levels several fold higher than those on normal cells
and its expression can be correlated with tumor stage or cancer progression.
Unfortunately, even if TfR expression is modulated by iron through different
biochemical mechanisms, their molecular basis remains to be determined [10–12].
Despite its ubiquitous expression the high expression of the receptor on
malignant cells, its ability to internalize, and the necessity of iron for cancer cell
proliferation, make this receptor a widely accessible portal for the delivery of drugs
into malignant cells and, thus, an attractive target for cancer therapy.
With nanotechnology, the binding of ligands such as Tf to the surface of the
micelles has been used for the direct targeting of these structures as carriers of
antineoplastic drugs or genetic material to tumors [13]. These complex micelles have
been used for the delivery of antisense DNA into cancer cells, meanwhile, inorganic
and polymeric nanoparticles are now emerging as promising drug vehicles because
of their multi−modular structure that enables them to actively target discrete cells
through multiple barriers and to simultaneously carry multiple drugs of various
chemical natures [14−17].
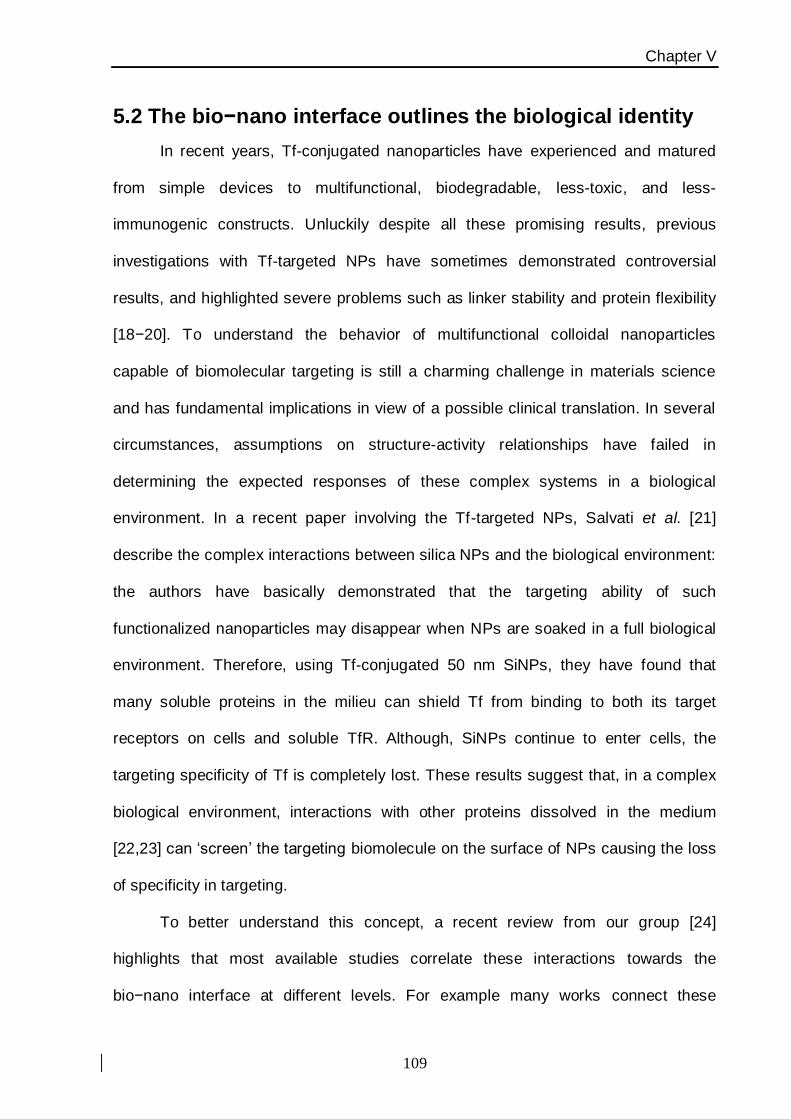
Chapter V
109
5.2 The bio−nano interface outlines the biological identity
In recent years, Tf-conjugated nanoparticles have experienced and matured
from simple devices to multifunctional, biodegradable, less-toxic, and less-
immunogenic constructs. Unluckily despite all these promising results, previous
investigations with Tf-targeted NPs have sometimes demonstrated controversial
results, and highlighted severe problems such as linker stability and protein flexibility
[18−20]. To understand the behavior of multifunctional colloidal nanoparticles
capable of biomolecular targeting is still a charming challenge in materials science
and has fundamental implications in view of a possible clinical translation. In several
circumstances, assumptions on structure-activity relationships have failed in
determining the expected responses of these complex systems in a biological
environment. In a recent paper involving the Tf-targeted NPs, Salvati et al. [21]
describe the complex interactions between silica NPs and the biological environment:
the authors have basically demonstrated that the targeting ability of such
functionalized nanoparticles may disappear when NPs are soaked in a full biological
environment. Therefore, using Tf-conjugated 50 nm SiNPs, they have found that
many soluble proteins in the milieu can shield Tf from binding to both its target
receptors on cells and soluble TfR. Although, SiNPs continue to enter cells, the
targeting specificity of Tf is completely lost. These results suggest that, in a complex
biological environment, interactions with other proteins dissolved in the medium
[22,23] can ‘screen’ the targeting biomolecule on the surface of NPs causing the loss
of specificity in targeting.
To better understand this concept, a recent review from our group [24]
highlights that most available studies correlate these interactions towards the
bio−nano interface at different levels. For example many works connect these
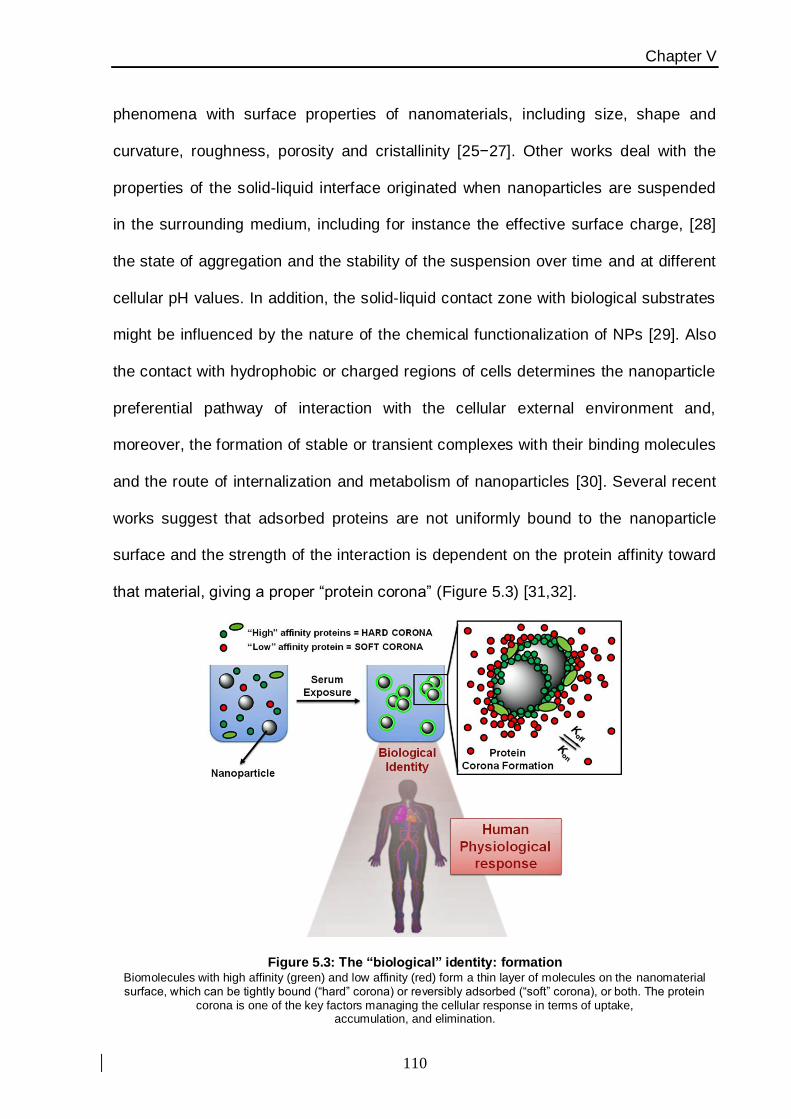
Chapter V
110
phenomena with surface properties of nanomaterials, including size, shape and
curvature, roughness, porosity and cristallinity [25−27]. Other works deal with the
properties of the solid-liquid interface originated when nanoparticles are suspended
in the surrounding medium, including for instance the effective surface charge, [28]
the state of aggregation and the stability of the suspension over time and at different
cellular pH values. In addition, the solid-liquid contact zone with biological substrates
might be influenced by the nature of the chemical functionalization of NPs [29]. Also
the contact with hydrophobic or charged regions of cells determines the nanoparticle
preferential pathway of interaction with the cellular external environment and,
moreover, the formation of stable or transient complexes with their binding molecules
and the route of internalization and metabolism of nanoparticles [30]. Several recent
works suggest that adsorbed proteins are not uniformly bound to the nanoparticle
surface and the strength of the interaction is dependent on the protein affinity toward
that material, giving a proper “protein corona” (Figure 5.3) [31,32].
Figure 5.3: The “biological” identity: formation Biomolecules with high affinity (green) and low affinity (red) form a thin layer of molecules on the nanomaterial surface, which can be tightly bound (“hard” corona) or reversibly adsorbed (“soft” corona), or both. The protein
corona is one of the key factors managing the cellular response in terms of uptake, accumulation, and elimination.
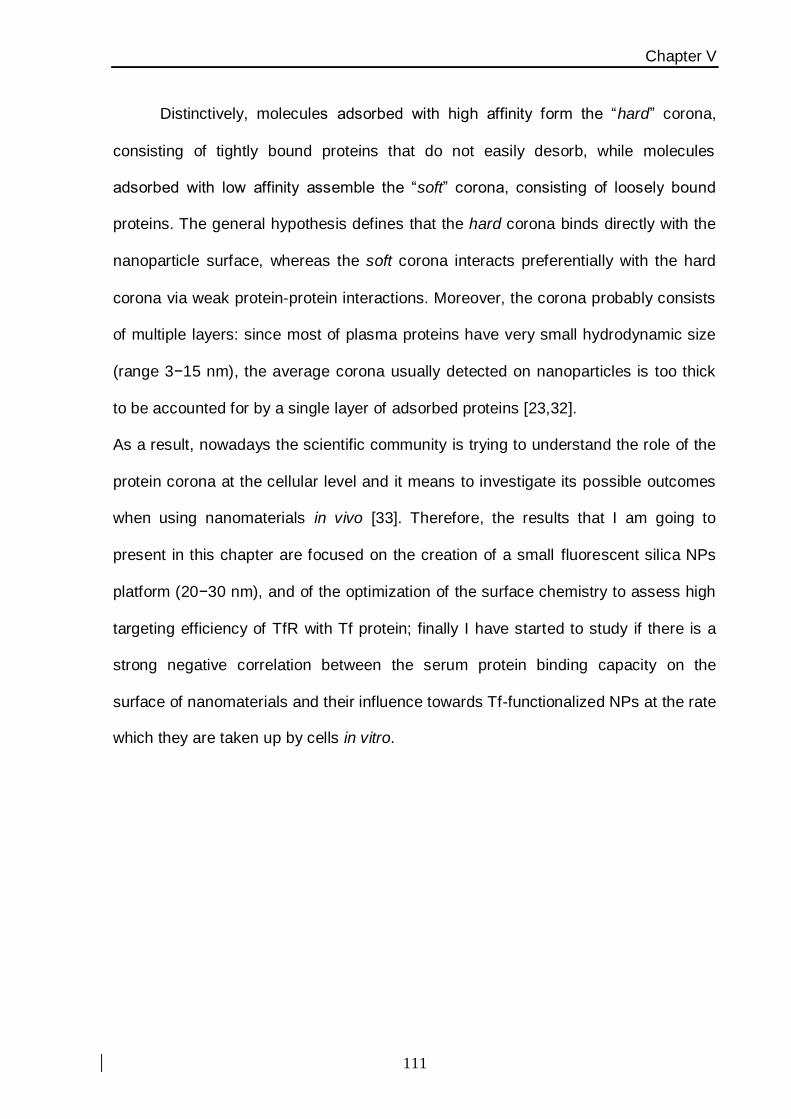
Chapter V
111
Distinctively, molecules adsorbed with high affinity form the “hard” corona,
consisting of tightly bound proteins that do not easily desorb, while molecules
adsorbed with low affinity assemble the “soft” corona, consisting of loosely bound
proteins. The general hypothesis defines that the hard corona binds directly with the
nanoparticle surface, whereas the soft corona interacts preferentially with the hard
corona via weak protein-protein interactions. Moreover, the corona probably consists
of multiple layers: since most of plasma proteins have very small hydrodynamic size
(range 3−15 nm), the average corona usually detected on nanoparticles is too thick
to be accounted for by a single layer of adsorbed proteins [23,32].
As a result, nowadays the scientific community is trying to understand the role of the
protein corona at the cellular level and it means to investigate its possible outcomes
when using nanomaterials in vivo [33]. Therefore, the results that I am going to
present in this chapter are focused on the creation of a small fluorescent silica NPs
platform (20−30 nm), and of the optimization of the surface chemistry to assess high
targeting efficiency of TfR with Tf protein; finally I have started to study if there is a
strong negative correlation between the serum protein binding capacity on the
surface of nanomaterials and their influence towards Tf-functionalized NPs at the rate
which they are taken up by cells in vitro.

Chapter V
112
5.3 Development of a fluorescent-based silica
nanoparticles platform
It has been finely described in the second chapter that fluorescent SiNPs have
numerous applications in science ranging from protective layers for quantum dots to
drug delivery platforms, and for technology in the electronics, paints and many other
industries. They are also potentially useful as biological targeting platforms,
practicable for a wide range of internal labeling techniques and surface modifications.
I have started to investigate approaches to covalently (internally) dye label silica
nanoparticles with fluorescein isothiocyanate (FITC) as fluorescent probe, using a
fluorescent dye–alkoxysilane conjugate. In this chemical synthesis, the dye is
covalently attached to an alkoxysilane, which can be hydrolyzed and condensed
together with TEOS, in alkaline ethanol with the classical Stöber synthesis, as
described in the previous chapter. To test the efficiency of this chemical approach,
three spherical but size-different fluorescent silica nanoparticle (FSNP) have been
synthesized, by tuning the temperature and the concentration of reactants [34],
corresponding to 20 nm FSNP, 40 nm FSNP and 90 nm FSNP (see Table 7 in the
experimental section). It is interesting to note the role played by the temperature,
which is inversely proportional with the size, meanwhile increasing the concentration
of NH4OH, gives bigger FSNP.
As observed by electron microscopy (Figure 5.4), the dye-labeled Stöber synthesis
has proved very efficient in producing monodisperse FSNP with high yield (more than
300 mg of FSNP from a single reactor). Previous reports have shown that, even if the
overall particle size is unchanged, shape and morphological changes, including the
selective etching of the core of silica nanoparticles, can occur at physiological
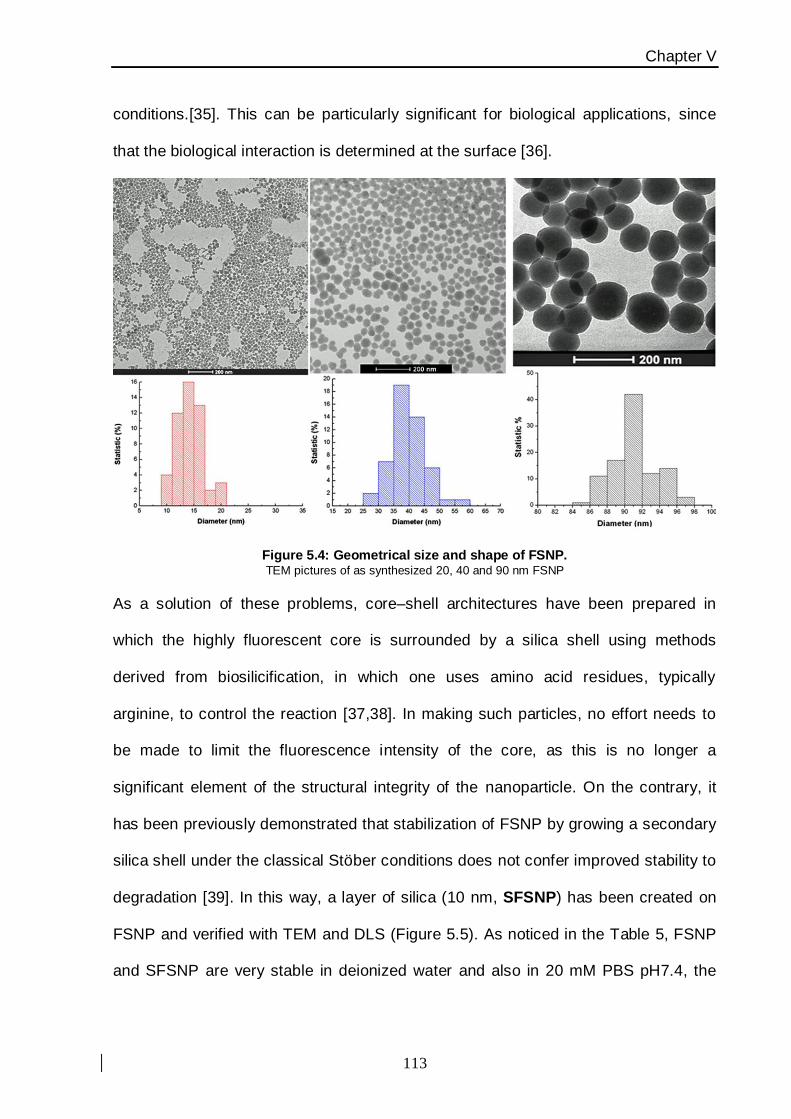
Chapter V
113
conditions.[35]. This can be particularly significant for biological applications, since
that the biological interaction is determined at the surface [36].
Figure 5.4: Geometrical size and shape of FSNP. TEM pictures of as synthesized 20, 40 and 90 nm FSNP
As a solution of these problems, core–shell architectures have been prepared in
which the highly fluorescent core is surrounded by a silica shell using methods
derived from biosilicification, in which one uses amino acid residues, typically
arginine, to control the reaction [37,38]. In making such particles, no effort needs to
be made to limit the fluorescence intensity of the core, as this is no longer a
significant element of the structural integrity of the nanoparticle. On the contrary, it
has been previously demonstrated that stabilization of FSNP by growing a secondary
silica shell under the classical Stöber conditions does not confer improved stability to
degradation [39]. In this way, a layer of silica (10 nm, SFSNP) has been created on
FSNP and verified with TEM and DLS (Figure 5.5). As noticed in the Table 5, FSNP
and SFSNP are very stable in deionized water and also in 20 mM PBS pH7.4, the
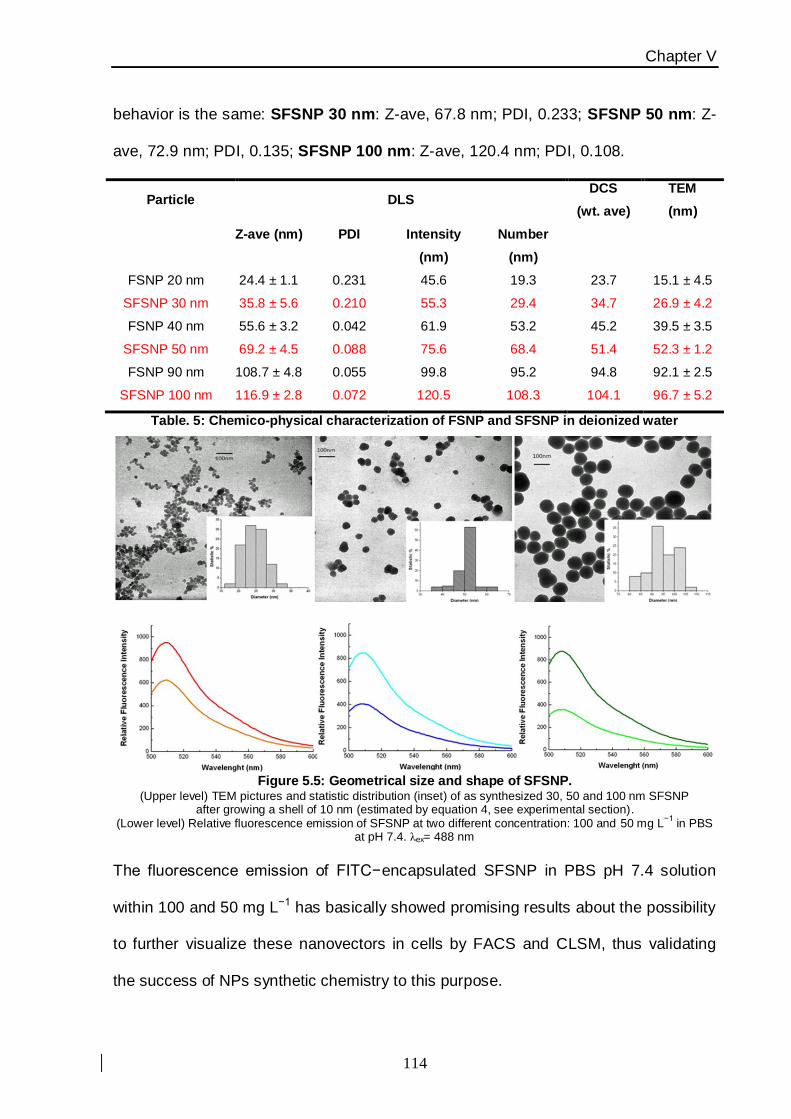
Chapter V
114
behavior is the same: SFSNP 30 nm: Z-ave, 67.8 nm; PDI, 0.233; SFSNP 50 nm: Z-
ave, 72.9 nm; PDI, 0.135; SFSNP 100 nm: Z-ave, 120.4 nm; PDI, 0.108.
Particle DLS DCS
(wt. ave)
TEM
(nm)
Z-ave (nm) PDI Intensity
(nm)
Number
(nm)
FSNP 20 nm 24.4 ± 1.1 0.231 45.6 19.3 23.7 15.1 ± 4.5
SFSNP 30 nm 35.8 ± 5.6 0.210 55.3 29.4 34.7 26.9 ± 4.2
FSNP 40 nm 55.6 ± 3.2 0.042 61.9 53.2 45.2 39.5 ± 3.5
SFSNP 50 nm 69.2 ± 4.5 0.088 75.6 68.4 51.4 52.3 ± 1.2
FSNP 90 nm 108.7 ± 4.8 0.055 99.8 95.2 94.8 92.1 ± 2.5
SFSNP 100 nm 116.9 ± 2.8 0.072 120.5 108.3 104.1 96.7 ± 5.2
Table. 5: Chemico-physical characterization of FSNP and SFSNP in deionized water
Figure 5.5: Geometrical size and shape of SFSNP.
(Upper level) TEM pictures and statistic distribution (inset) of as synthesized 30, 50 and 100 nm SFSNP after growing a shell of 10 nm (estimated by equation 4, see experimental section).
(Lower level) Relative fluorescence emission of SFSNP at two different concentration: 100 and 50 mg L−1
in PBS at pH 7.4. λex= 488 nm
The fluorescence emission of FITC−encapsulated SFSNP in PBS pH 7.4 solution
within 100 and 50 mg L−1 has basically showed promising results about the possibility
to further visualize these nanovectors in cells by FACS and CLSM, thus validating
the success of NPs synthetic chemistry to this purpose.
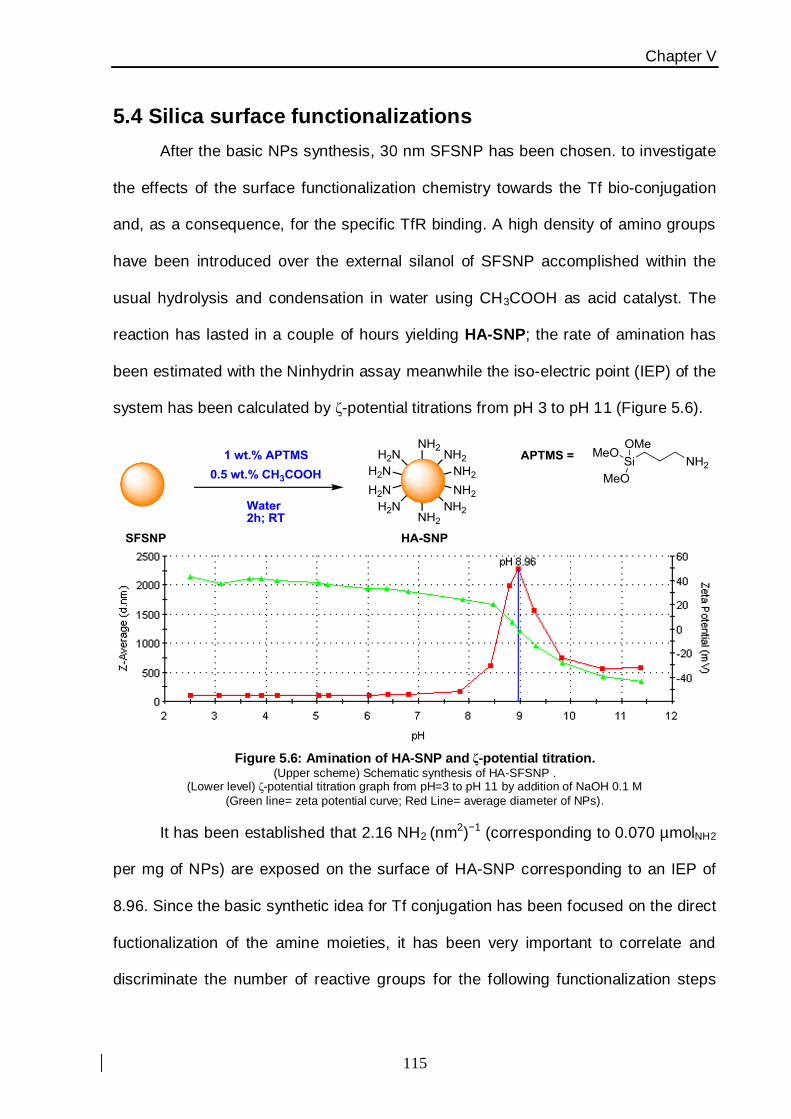
Chapter V
115
5.4 Silica surface functionalizations
After the basic NPs synthesis, 30 nm SFSNP has been chosen. to investigate
the effects of the surface functionalization chemistry towards the Tf bio-conjugation
and, as a consequence, for the specific TfR binding. A high density of amino groups
have been introduced over the external silanol of SFSNP accomplished within the
usual hydrolysis and condensation in water using CH3COOH as acid catalyst. The
reaction has lasted in a couple of hours yielding HA-SNP; the rate of amination has
been estimated with the Ninhydrin assay meanwhile the iso-electric point (IEP) of the
system has been calculated by ζ-potential titrations from pH 3 to pH 11 (Figure 5.6).
Figure 5.6: Amination of HA-SNP and ζ-potential titration. (Upper scheme) Schematic synthesis of HA-SFSNP .
(Lower level) ζ-potential titration graph from pH=3 to pH 11 by addition of NaOH 0.1 M
(Green line= zeta potential curve; Red Line= average diameter of NPs).
It has been established that 2.16 NH2 (nm2)−1 (corresponding to 0.070 µmolNH2
per mg of NPs) are exposed on the surface of HA-SNP corresponding to an IEP of
8.96. Since the basic synthetic idea for Tf conjugation has been focused on the direct
fuctionalization of the amine moieties, it has been very important to correlate and
discriminate the number of reactive groups for the following functionalization steps
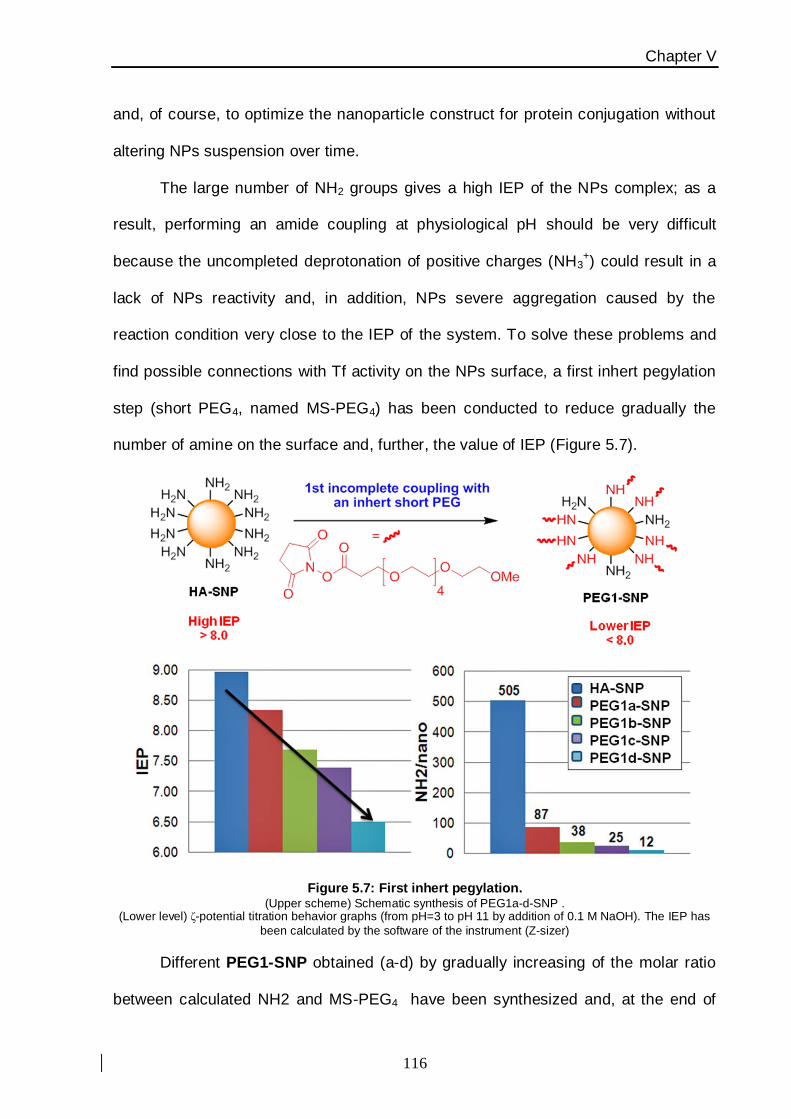
Chapter V
116
and, of course, to optimize the nanoparticle construct for protein conjugation without
altering NPs suspension over time.
The large number of NH2 groups gives a high IEP of the NPs complex; as a
result, performing an amide coupling at physiological pH should be very difficult
because the uncompleted deprotonation of positive charges (NH3+) could result in a
lack of NPs reactivity and, in addition, NPs severe aggregation caused by the
reaction condition very close to the IEP of the system. To solve these problems and
find possible connections with Tf activity on the NPs surface, a first inhert pegylation
step (short PEG4, named MS-PEG4) has been conducted to reduce gradually the
number of amine on the surface and, further, the value of IEP (Figure 5.7).
Figure 5.7: First inhert pegylation. (Upper scheme) Schematic synthesis of PEG1a-d-SNP .
(Lower level) ζ-potential titration behavior graphs (from pH=3 to pH 11 by addition of 0.1 M NaOH). The IEP has
been calculated by the software of the instrument (Z-sizer)
Different PEG1-SNP obtained (a-d) by gradually increasing of the molar ratio
between calculated NH2 and MS-PEG4 have been synthesized and, at the end of
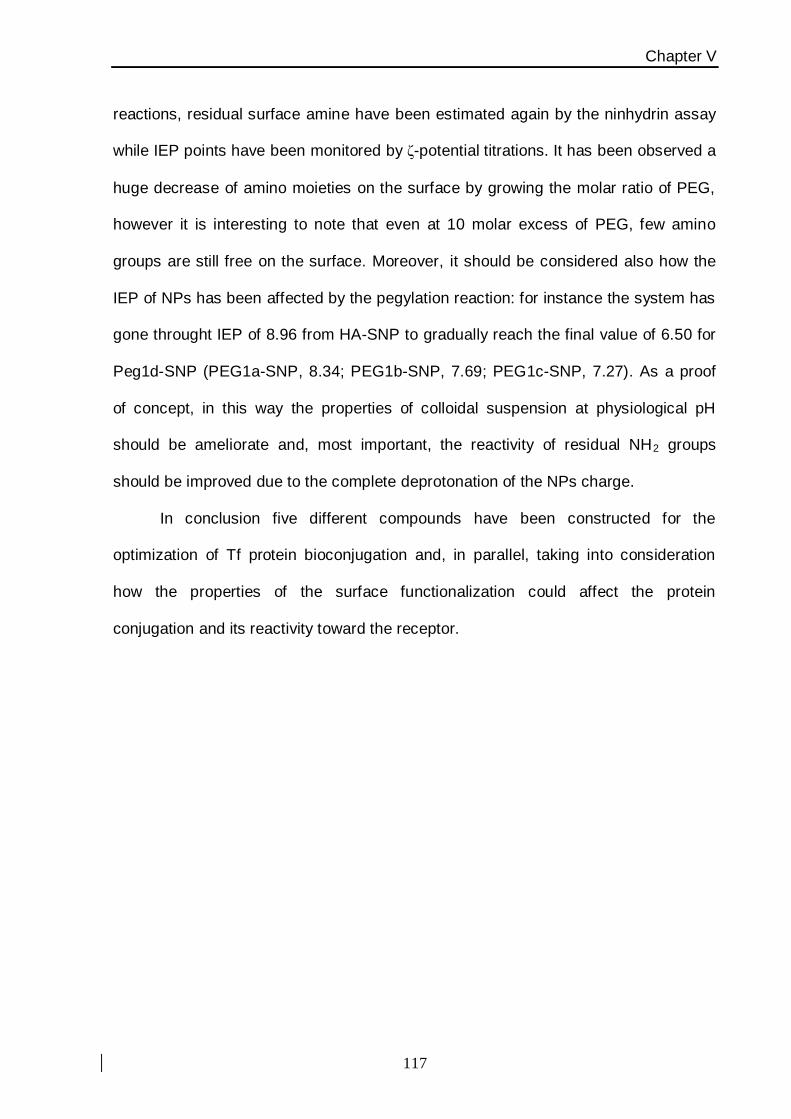
Chapter V
117
reactions, residual surface amine have been estimated again by the ninhydrin assay
while IEP points have been monitored by ζ-potential titrations. It has been observed a
huge decrease of amino moieties on the surface by growing the molar ratio of PEG,
however it is interesting to note that even at 10 molar excess of PEG, few amino
groups are still free on the surface. Moreover, it should be considered also how the
IEP of NPs has been affected by the pegylation reaction: for instance the system has
gone throught IEP of 8.96 from HA-SNP to gradually reach the final value of 6.50 for
Peg1d-SNP (PEG1a-SNP, 8.34; PEG1b-SNP, 7.69; PEG1c-SNP, 7.27). As a proof
of concept, in this way the properties of colloidal suspension at physiological pH
should be ameliorate and, most important, the reactivity of residual NH2 groups
should be improved due to the complete deprotonation of the NPs charge.
In conclusion five different compounds have been constructed for the
optimization of Tf protein bioconjugation and, in parallel, taking into consideration
how the properties of the surface functionalization could affect the protein
conjugation and its reactivity toward the receptor.
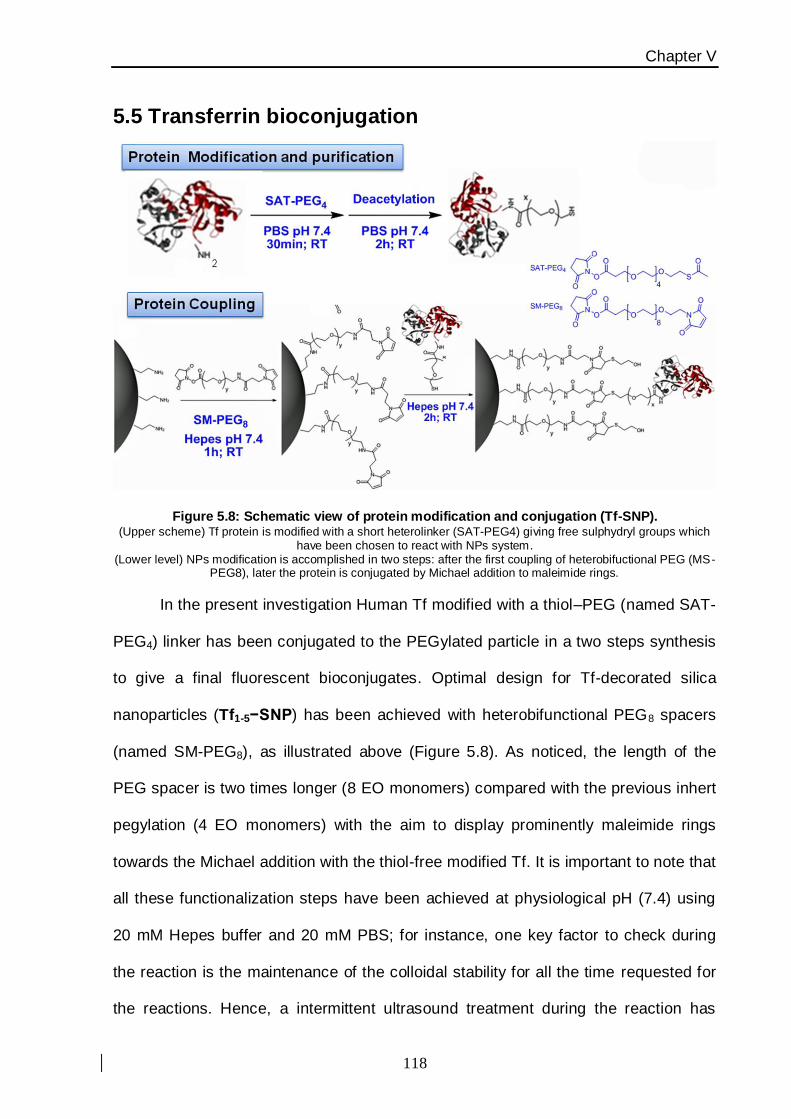
Chapter V
118
5.5 Transferrin bioconjugation
Figure 5.8: Schematic view of protein modification and conjugation (Tf-SNP). (Upper scheme) Tf protein is modified with a short heterolinker (SAT-PEG4) giving free sulphydryl groups which
have been chosen to react with NPs system. (Lower level) NPs modification is accomplished in two steps: after the first coupling of heterobifuctional PEG (MS-
PEG8), later the protein is conjugated by Michael addition to maleimide rings.
In the present investigation Human Tf modified with a thiol–PEG (named SAT-
PEG4) linker has been conjugated to the PEGylated particle in a two steps synthesis
to give a final fluorescent bioconjugates. Optimal design for Tf-decorated silica
nanoparticles (Tf1-5−SNP) has been achieved with heterobifunctional PEG8 spacers
(named SM-PEG8), as illustrated above (Figure 5.8). As noticed, the length of the
PEG spacer is two times longer (8 EO monomers) compared with the previous inhert
pegylation (4 EO monomers) with the aim to display prominently maleimide rings
towards the Michael addition with the thiol-free modified Tf. It is important to note that
all these functionalization steps have been achieved at physiological pH (7.4) using
20 mM Hepes buffer and 20 mM PBS; for instance, one key factor to check during
the reaction is the maintenance of the colloidal stability for all the time requested for
the reactions. Hence, a intermittent ultrasound treatment during the reaction has
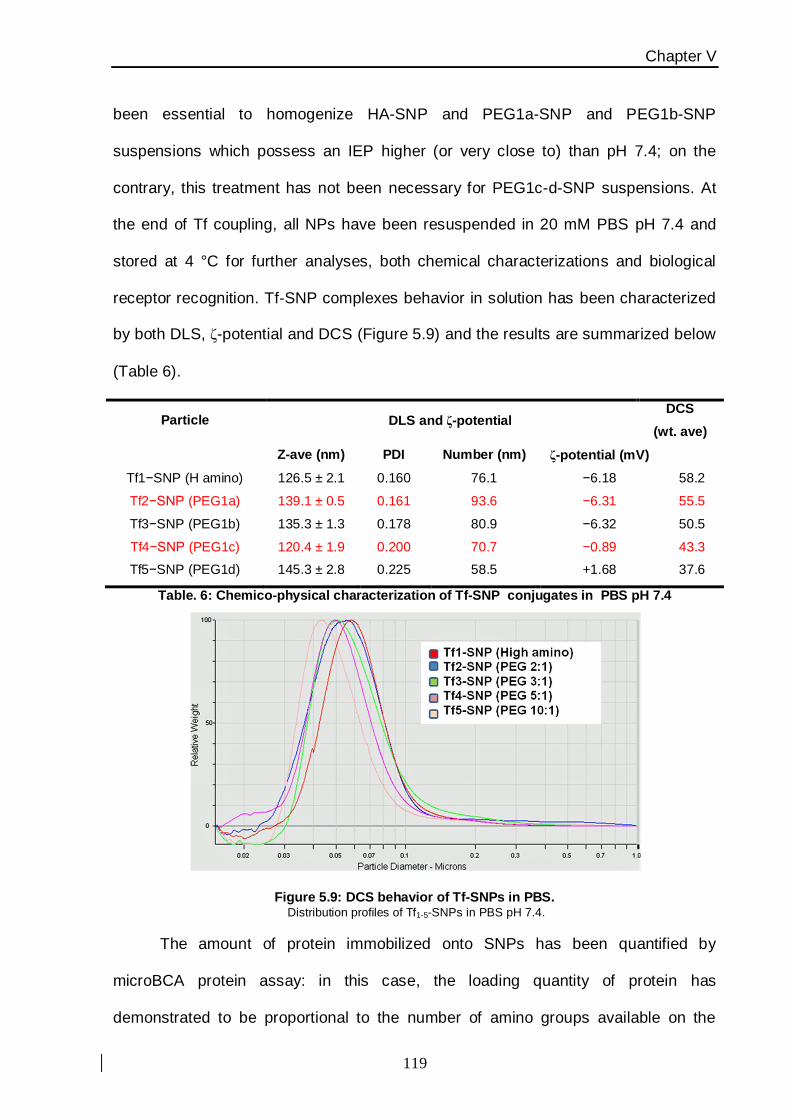
Chapter V
119
been essential to homogenize HA-SNP and PEG1a-SNP and PEG1b-SNP
suspensions which possess an IEP higher (or very close to) than pH 7.4; on the
contrary, this treatment has not been necessary for PEG1c-d-SNP suspensions. At
the end of Tf coupling, all NPs have been resuspended in 20 mM PBS pH 7.4 and
stored at 4 °C for further analyses, both chemical characterizations and biological
receptor recognition. Tf-SNP complexes behavior in solution has been characterized
by both DLS, ζ-potential and DCS (Figure 5.9) and the results are summarized below
(Table 6).
Particle DLS and ζ-potential DCS
(wt. ave)
Z-ave (nm) PDI Number (nm) ζ-potential (mV)
Tf1−SNP (H amino) 126.5 ± 2.1 0.160 76.1 −6.18 58.2
Tf2−SNP (PEG1a) 139.1 ± 0.5 0.161 93.6 −6.31 55.5
Tf3−SNP (PEG1b) 135.3 ± 1.3 0.178 80.9 −6.32 50.5
Tf4−SNP (PEG1c) 120.4 ± 1.9 0.200 70.7 −0.89 43.3
Tf5−SNP (PEG1d) 145.3 ± 2.8 0.225 58.5 +1.68 37.6
Table. 6: Chemico-physical characterization of Tf-SNP conjugates in PBS pH 7.4
Figure 5.9: DCS behavior of Tf-SNPs in PBS. Distribution profiles of Tf1-5-SNPs in PBS pH 7.4.
The amount of protein immobilized onto SNPs has been quantified by
microBCA protein assay: in this case, the loading quantity of protein has
demonstrated to be proportional to the number of amino groups available on the
Chapter V
120
surface, even if I hypothesized that for HA-SNP most of the protein is passively
adsorbed on the particle surface caused by the initial positively charges of the
system (at pH 7.4), taking into consideration that the IEP of Human transferrin is in
the range of pH 5.2 and 5.9 [40]. It has been found that 12 molecules of Tf have been
conjugated to Tf1-SNP per nanoparticle (89 µg mgNP−1) instead after for samples
treated with the first inhert MS-PEG4 on SNP, the quantity of protein has slowly
decreased; Tf2-SNP, (69.8 µg mgNP−1) 9 molecules per NP; Tf3-SNP, (62.6 µg
mgNP−1) 8 molecules per NP; Tf4-SNP, (49.1 µg mgNP
−1) 6 molecules per NP; Tf5-
SNP, (36.7 µg mgNP−1) 5 molecules per NP.

Chapter V
121
5.6 Nanocomplex activities towards TfR
RNA interference has been used to silence the expression of TfR in A549 lung
cancer epithelial cells in order to determine the effect of TfR on NPs uptake. I would
like to emphasize that the absolute uptake level does not give information on the
specificity of these interactions. However, the difference in particle uptake in silenced
and non-silenced cells is clearly indicative of the relative contribution made by TfR
mediated pathway. This silenced cell model has been then used to determine the
contribution of Tf in the uptake of different NPs; I used to test the capacity of different
Tf-conjugated nanoparticles to be recognized by TfR in simple buffer or serum-free
medium to exclude the contribution of other proteins dissolved in the medium.
Analyses have been performed by FACS, within cell-fluorescence intensity profiles
exploited by time-increasing internalization of SNP (Figure 5.10).
Figure 5.10: TfR recognition by FACS analysis. (Graph) Histogram profiles of Tf1-5-SNPs and Tf-Alexa488 (as positive control) after 4 h incubation at 37°C in
serum-free conditions. (Lower graphs) Examples of FACS profiles of as synthesized NPs.

Chapter V
122
As showed by the graph, Tf-SNPs have different activities towards TfR-
mediated uptake and there is a strong impact of the first PEGylation step; an high
amination of SNP gives a superior protein loading amount but a very high non-
specific uptake, while the first PEGylation within 3 and 5 molar excess of MS-PEG4
guarantees the maximum targeting specificity (50%) beside a lower amount of
protein conjugated; however, too much inhert PEG maybe has revealed negative
effect as well, because few amine are free to react with the protein and maybe Tf-
conjugated is not enough to be highly specific towards TfR (See Tf5-SNP).
The kinetic uptake experiment has been repeated in the completed cell culture
medium (cMEM) supplemented with 10 wt.% FBS (tot proteins 4 mg mL−1).
Figure 5.11: TfR recognition by FACS analysis and evaluation of “protein corona”. (Upper level) Uptake kinetic profiles of Tf4-SNP and Tf5-SNP after incubation at 37°C in cMEM.
(Lower level) Protein separation by 1D-SDS-PAGE in PBS, in cMEM 10wt.% FBS, in human serum 90 wt.%: .
Chapter V
123
This kinetic uptake experiment has revealed that all proteins dissolved in
biological milieu play a critical role in the formation of the protein corona, thus
masking completely the activity of Tf in the recognition of its receptor (Figure 5.11).
This is why NPs that have worked perfectly in serum free conditions, lose completely
their targeting capabilities when a biomolecule corona adsorbs on the surface. This
result has found validations within the protein separation by SDS-page after
incubation of NPs in different media 1 h at 37 °C. For instance, the single line
corresponding to Tf in the first gel (left) is gradually associated to other proteins
included in the corresponding milieu (center and right gels). However, only by this
experiment; I cannot assess great differences between Tf-SNP protein coronas.
Unfortunately, my restricted time of my visiting work did not allow me to conclude this
project; hence this final consideration needs to be carefully validated with more
complex assays.
Chapter V
124
5.7 Perspectives
Using transferrin-conjugated nanoparticles, first I have found that studying and tuning
finely the chemistry of surface functionalization is a basic element to achieve a good
targeting module protein-NP mediated. Secondly, I have observed that protein in the
media can shield Tf from binding its targeted receptors on cells. My results suggest
that when nanoparticles are placed in a complex biological environment, interactions
with other proteins at the bio-nano interface strongly influenced NPs activity in
targeting efficiency.
Nevertheless, these studies focus only on a single receptor (TfR) so that all
mechanisms involved are of a general nature and suggest future deep investigation
of the ligand targeting machinery towards the TfR and its relationship to specific
biological outcomes [41]. Anyway, all the approaches outlined here may be of
general value; in this way this study could be consider an example that could be
readily extended to evaluate and screen different nanocomplexes as to their targeting
recognition efficiency.

Chapter V
125
5.8 Nanomaterials Experimental section
5.8.1 Synthesis of Core-Fluorescent Silica Nanospheres (FSNP)
(Inhert atmosphere, Dry solvents)
5.8.1.1 Synthesis of N-1-(3-trimethoxysilylpropyl)-N‘-fluoresceyl thiourea (FITC-APTMS)
Monodisperse silica nanospheres have been obtained as described in literature [34]. First of
all the conjugate solution has been prepared by dissolving FITC (2 mg. 5.0 µmol) in
anhydrous ethanol (2.0 mL). 3-Aminopropyl)trimethoxysilane (APTMS,10.0 µL, 55.0 µmol)
has then added immediately to this solution with the mixture and then shaken at RT in
darkness for 4 hr. This reaction has been monitored by 1H-NMR (CD3OD) where a shift in the
signal from the proton adjacent to the amine group (Si(OCH3)3CH2CH2CH2NH2) δ: 3.80 (t,
2H) upon coupling FITC has reached an integration value constant and equal to the aromatic
FITC signal δ: 7.15 (d, 2H). The reaction deemed complete after 4 h.
5.8.1.2 Synthesis of Fluorescent core silica nanoparticles (FSNP)
20nm FSNP has been prepared as soon as the dye-complex has been arranged, according
with the Stöber synthesis. In a propylene plastic tube, to aqueous NH4OH 28 wt.% (728 mg,
0.46 M) has been added dry EtOH to a total volume of 50 mL and the mixture has been
rapidly stirred. FITC-APTMS (1 mL of the conjugate solution) has been then added to this
mixture followed 1 minute later by TEOS (1.4 mL, 0.17 M). The reaction has been sealed and
stirred at 55˚C overnight. The solvent has been then evaporated under reduce pressure by
half of its volume (25 mL) and deionized water has been added (40 mL). The remaining
organic solvent has been removed completely under reduce pressure in order to gain a
FSNP aqueous suspension; at the end of this step, FSNP have been filtered on a cotton filter
to remove only large aggregates. Instead, FSNP have been then washed by the excess of
dye with high speed centrifugation (20000 rcf, 30 min) and resuspension in deionized water
(40 mL) three times. Following final resuspension in water (35-40 mL), the final volume has
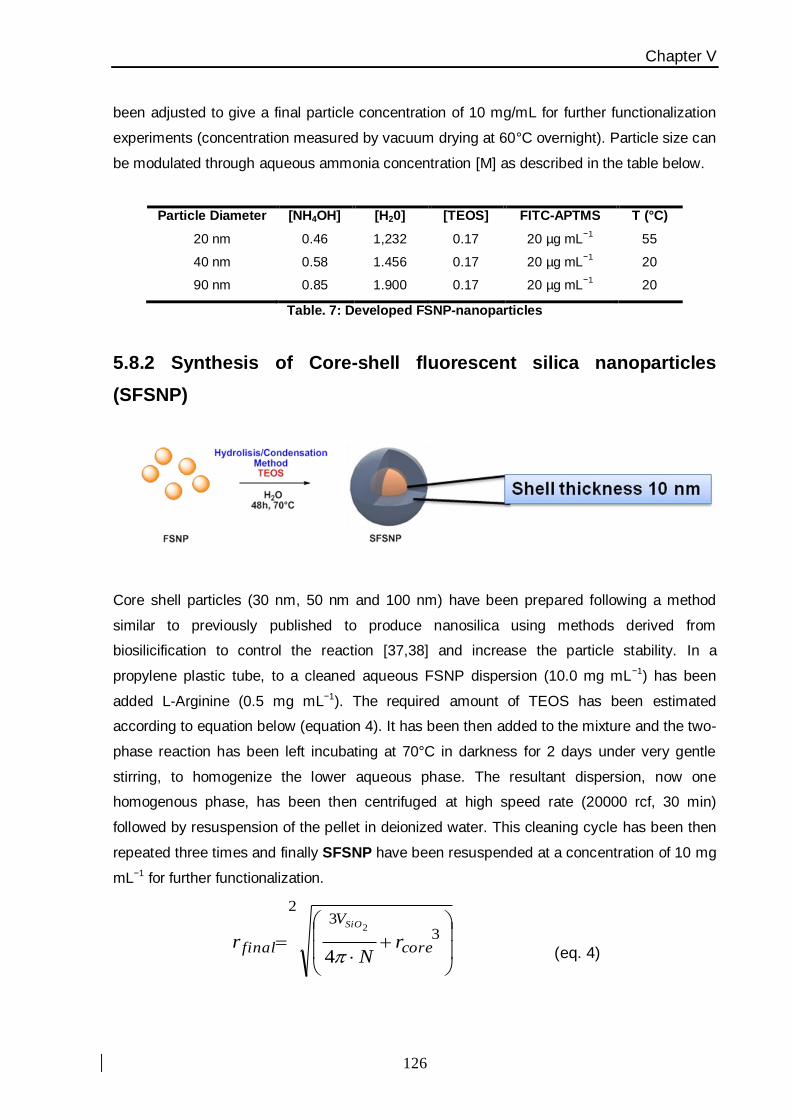
Chapter V
126
been adjusted to give a final particle concentration of 10 mg/mL for further functionalization
experiments (concentration measured by vacuum drying at 60°C overnight). Particle size can
be modulated through aqueous ammonia concentration [M] as described in the table below.
Particle Diameter [NH4OH] [H20] [TEOS] FITC-APTMS T (°C)
20 nm 0.46 1,232 0.17 20 µg mL−1
55
40 nm 0.58 1.456 0.17 20 µg mL−1
20
90 nm 0.85 1.900 0.17 20 µg mL−1
20
Table. 7: Developed FSNP-nanoparticles
5.8.2 Synthesis of Core-shell fluorescent silica nanoparticles
(SFSNP)
Core shell particles (30 nm, 50 nm and 100 nm) have been prepared following a method
similar to previously published to produce nanosilica using methods derived from
biosilicification to control the reaction [37,38] and increase the particle stability. In a
propylene plastic tube, to a cleaned aqueous FSNP dispersion (10.0 mg mL−1) has been
added L-Arginine (0.5 mg mL−1). The required amount of TEOS has been estimated
according to equation below (equation 4). It has been then added to the mixture and the two-
phase reaction has been left incubating at 70°C in darkness for 2 days under very gentle
stirring, to homogenize the lower aqueous phase. The resultant dispersion, now one
homogenous phase, has been then centrifuged at high speed rate (20000 rcf, 30 min)
followed by resuspension of the pellet in deionized water. This cleaning cycle has been then
repeated three times and finally SFSNP have been resuspended at a concentration of 10 mg
mL−1 for further functionalization.
33
2
4
2
core
V
final rN
rSiO
(eq. 4)
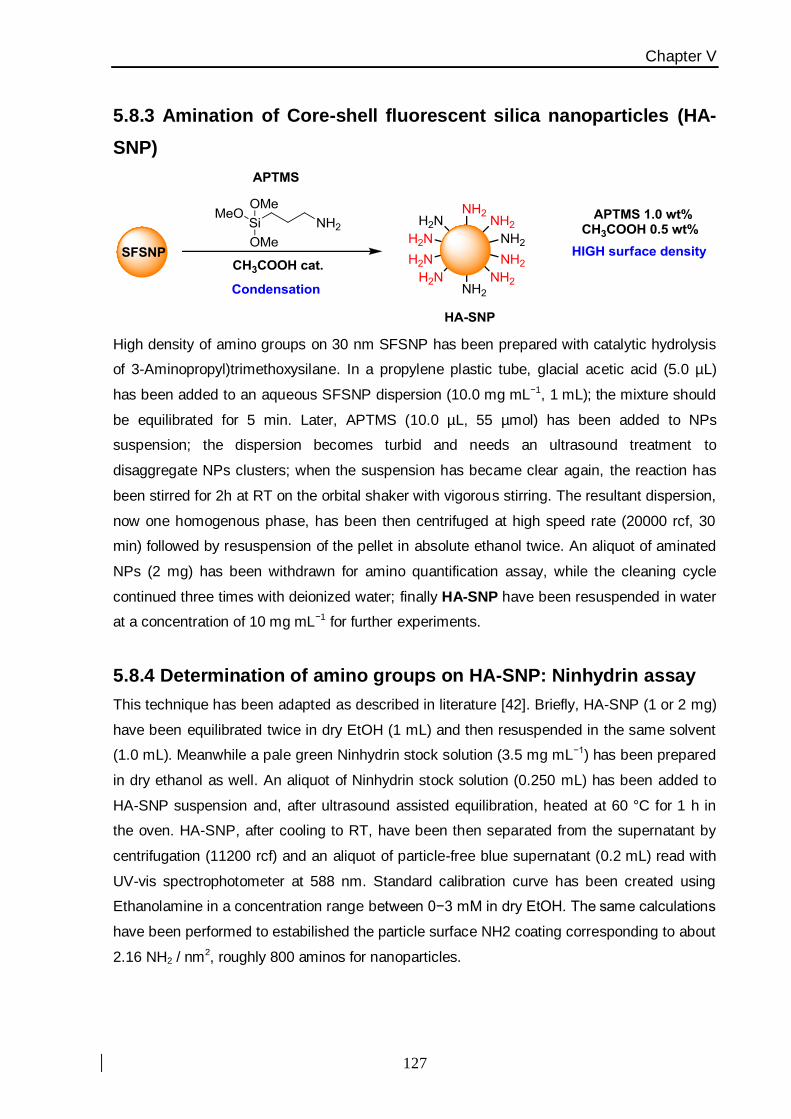
Chapter V
127
5.8.3 Amination of Core-shell fluorescent silica nanoparticles (HA-
SNP)
High density of amino groups on 30 nm SFSNP has been prepared with catalytic hydrolysis
of 3-Aminopropyl)trimethoxysilane. In a propylene plastic tube, glacial acetic acid (5.0 µL)
has been added to an aqueous SFSNP dispersion (10.0 mg mL−1, 1 mL); the mixture should
be equilibrated for 5 min. Later, APTMS (10.0 µL, 55 µmol) has been added to NPs
suspension; the dispersion becomes turbid and needs an ultrasound treatment to
disaggregate NPs clusters; when the suspension has became clear again, the reaction has
been stirred for 2h at RT on the orbital shaker with vigorous stirring. The resultant dispersion,
now one homogenous phase, has been then centrifuged at high speed rate (20000 rcf, 30
min) followed by resuspension of the pellet in absolute ethanol twice. An aliquot of aminated
NPs (2 mg) has been withdrawn for amino quantification assay, while the cleaning cycle
continued three times with deionized water; finally HA-SNP have been resuspended in water
at a concentration of 10 mg mL−1 for further experiments.
5.8.4 Determination of amino groups on HA-SNP: Ninhydrin assay
This technique has been adapted as described in literature [42]. Briefly, HA-SNP (1 or 2 mg)
have been equilibrated twice in dry EtOH (1 mL) and then resuspended in the same solvent
(1.0 mL). Meanwhile a pale green Ninhydrin stock solution (3.5 mg mL−1) has been prepared
in dry ethanol as well. An aliquot of Ninhydrin stock solution (0.250 mL) has been added to
HA-SNP suspension and, after ultrasound assisted equilibration, heated at 60 °C for 1 h in
the oven. HA-SNP, after cooling to RT, have been then separated from the supernatant by
centrifugation (11200 rcf) and an aliquot of particle-free blue supernatant (0.2 mL) read with
UV-vis spectrophotometer at 588 nm. Standard calibration curve has been created using
Ethanolamine in a concentration range between 0−3 mM in dry EtOH. The same calculations
have been performed to estabilished the particle surface NH2 coating corresponding to about
2.16 NH2 / nm2, roughly 800 aminos for nanoparticles.
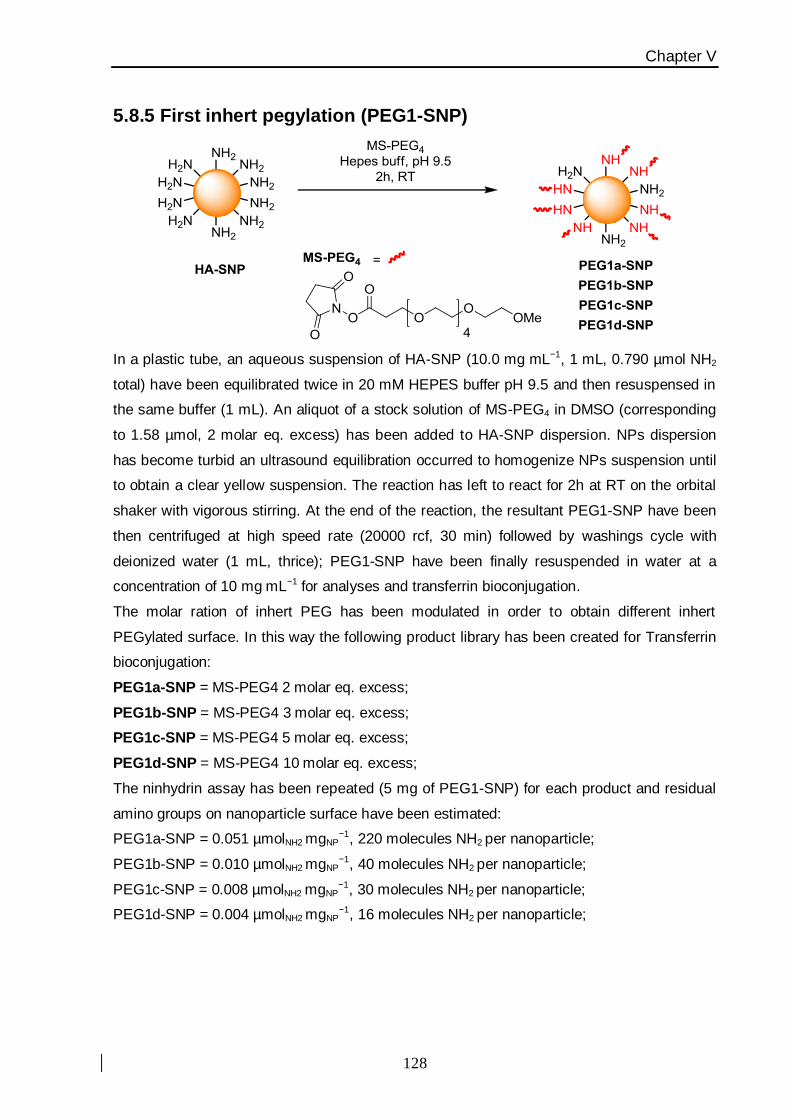
Chapter V
128
5.8.5 First inhert pegylation (PEG1-SNP)
In a plastic tube, an aqueous suspension of HA-SNP (10.0 mg mL−1, 1 mL, 0.790 µmol NH2
total) have been equilibrated twice in 20 mM HEPES buffer pH 9.5 and then resuspensed in
the same buffer (1 mL). An aliquot of a stock solution of MS-PEG4 in DMSO (corresponding
to 1.58 µmol, 2 molar eq. excess) has been added to HA-SNP dispersion. NPs dispersion
has become turbid an ultrasound equilibration occurred to homogenize NPs suspension until
to obtain a clear yellow suspension. The reaction has left to react for 2h at RT on the orbital
shaker with vigorous stirring. At the end of the reaction, the resultant PEG1-SNP have been
then centrifuged at high speed rate (20000 rcf, 30 min) followed by washings cycle with
deionized water (1 mL, thrice); PEG1-SNP have been finally resuspended in water at a
concentration of 10 mg mL−1 for analyses and transferrin bioconjugation.
The molar ration of inhert PEG has been modulated in order to obtain different inhert
PEGylated surface. In this way the following product library has been created for Transferrin
bioconjugation:
PEG1a-SNP = MS-PEG4 2 molar eq. excess;
PEG1b-SNP = MS-PEG4 3 molar eq. excess;
PEG1c-SNP = MS-PEG4 5 molar eq. excess;
PEG1d-SNP = MS-PEG4 10 molar eq. excess;
The ninhydrin assay has been repeated (5 mg of PEG1-SNP) for each product and residual
amino groups on nanoparticle surface have been estimated:
PEG1a-SNP = 0.051 µmolNH2 mgNP−1, 220 molecules NH2 per nanoparticle;
PEG1b-SNP = 0.010 µmolNH2 mgNP−1, 40 molecules NH2 per nanoparticle;
PEG1c-SNP = 0.008 µmolNH2 mgNP−1, 30 molecules NH2 per nanoparticle;
PEG1d-SNP = 0.004 µmolNH2 mgNP−1, 16 molecules NH2 per nanoparticle;

Chapter V
129
5.8.6 Transferrin bioconjugation onto silica nanoparticles (Tf-SNP)
5.8.6.1 Suphydril modified Transferrin (SAT-PEG4): 1st Step
This protocol has been modified from a previous work [21] and is suitable for 5 mg of HA-
SNP and PEG1-SNP. Transferrin, Tf (2.5 mg, 0.0312 μmol) has been dissolved in degassed
20mM PBS pH 7.4 (1 mL). To this solution has been added SAT-PEG4 dissolved in DMSO
(10 μg, 0.023 μmol). At this time, particle modification (2nd step) has been started at this time.
After 30 minutes of gentle shaking at room temperature, deacetylation buffer (0.5M
Hydroxylamine, 25mM ethylenediaminetetraacetic acid (EDTA) in 20 mM PBS, pH 7.4), (50
μL) has been added. The reaction has been allowed to continue for 2 hours without shaking,
followed by addition with 1 mM tris(2- carboxyethyl)phosphine (TCEP) (0.023 µmol) just 1
min before cleaning on a Sephadex G25 spin column exchanging in deoxygenated HEPES
buffer (pH 7.4). Column loading: 2.5 mL of reaction buffer, collecting Tf-modified fractions
following the red band which elutes from the column.
5.8.6.2 protein coupling onto silica-modified nanoparticles (SM-PEG8): 2nd Step
Chapter V
130
The HA-SNP and PEG1(a−d)-SNP (5 mg each batch) have been equilibrated twice with 20
mM HEPES buffer pH 7.4 (500 µL), before resuspension in the same buffer at a
concentration of 10 mg mL−1. To this suspension has been added an equal volume solution
(500 µL) of SM-PEG8 in 20 mM HEPES buffer pH 7.4 (which corresponds to 5 molar excess
of calculated amino groups) with mixing. With high rate amination samples (not with PEG1c-
SNP and PEG1d-SNP), the initially clouding reaction has been shaken 2 h with intermittent
bath sonication (twice 30 sec) resulting in a clear suspension. At the end of the reaction
nanoparticles have been then centrifuged down (14000 rcf, 30min) followed by two washes
with deionized water (1 mL) and then finally resuspended in deoxygenated 20 mM HEPES
buffer pH 7.4 (500 µL, final concentration of 10 mg mL−1).
5.8.6.3 Silica second hetero bifunctioonal pegylation (Tf-SNP): 3rd Step
The work has been timed so that the modified protein solution and modified particle
dispersion would be ready simultaneously and have been then combined (2.0 mg protein
each 5 mg nanoparticles. The resultant mixture has been shaken gently 2 h at RT. 1 mM 2-
Mercaptoethanol (5 µg, 0.023 µmol) has been then added to saturate all unreacted malemide
rings; later on, after 5 min, the Tf1−5-SNP has been then cleaned of unreacted proteins and
excess mercaptoethanol by centrifugation and resuspension three times in filtered 20 mM
PBS pH 7.4 (1 mL). Finally all products have been resuspended in the same buffer and
stored at 4°C for cellular experiments and analyses (500 µL, 5 mg mL−1).
5.8.7 Cell silencing and flow cytometry
Cell silencing and flow cytometry have been adapted from literaure data [21]. A total of
20000 cells have been seeded in 12-well plates, and incubated for 24 h before silencing of
the gene coding for transferrin receptor (TfR). Cells have been then transfected with a
Silencer Select siRNA (30 pmol) using Oligofectamine (Invitrogen) according to the
manufacturer’s instructions; an the contrary, Neg1 silencer was used as a negative control.
Cells have been transfected with siRNAs for 72 h in all experiments before exposure to
nanoparticles or labelled transferrin. After 72 h silencing, cells have been washed twice 10
min serum-free cell cuture medium (MEM, 1 mL). The buffer has been then replaced by the
Tf1−4-SNP dispersions in serum free medium (100 µg mL−1, 500 µL), freshly prepared by
diluting the nanoparticle stock in serum-free MEM (or cMEM, supplemented with 10% FBS,
depending on the experiment). Similar experiments have been performed by exposing cells
to Alexa 488-labelled human transferrin (5 µg mL−1, from Molecular Probes) in serum-free
MEM.

Chapter V
131
For flow cytometry analysis, cells have been washed thrice with PBS (1 mL) and harvested
with trypsin (400 µL). Cell pellets were then fixed at room temperature with 4% formalin (400
µL) for 20 min in the dark and then resuspended in PBS (500 µL) before cell-associated
fluorescence (10000−15000 cells acquired each sample) has been measured using an
Accuri C6 reader (BD Accuri Cytometers). Results are reported as the median of the
distribution of cell fluorescence intensity, averaged over two to three independent replicates.
Error bars represent the standard deviation between replicates. Each experiment has been
performed at least two times.
5.8.8 Protein separation by 1D-SDS-PAGE
The nanoparticle-protein complexes have been separated and denatured by boiling for 5
minutes in loading buffer (62.5 mM Tris-HCl, pH 6.8 at 25 °C; 2 wt.% sodium dodecyl sulfate
(SDS); 10 wt.% glycerol; 0.01 wt.% bromophenol blue; 40 mM dithiothreitol (DTT). Samples
have been then separated by size in the moiety of porous 10% polyacrylamide gel (1D SDS
polyacrylamide gel electrophoresis), in an electric field using a Mini-PROTEAN Tetra
electrophoresis system from Bio-Rad. The electrophoresis has been run under constant
voltage (130 V, 45 minutes). Gels have been silver stained using 2D Silver Stain Kit II
(Cosmo Bio Co., Ltd) and scanned using Bio-Rad GS-800 Calibrated Densitometer.

Chapter V
132
Related References
[1] Aisen, P.; Enns, C. and Wessling-Resnick, M.; Int. Biochem. Cell Biol. 2001, 10, 940–959.
[2] Moore, S. A.; Anderson, B. F.; Groom, C. R.; Haridas, M. and Baker, E. N.; J. Mol. Biol. 1997, 274,
222–236.
[3] Lebron, J.A.; Bennett, M.J.; Vaughn, D.E.; et al.; Cell. 1998, 93, 111–123.
[4] Turkewitz, A. P.; Amatruda, J. F.; Borhani, D.; Harrison, S. C. and Schwartz, A. L.; J. Biol.
Chem.1988, 263, 8318−8325.
[5] Enns, C. A. and Sussman, H. H.; J. Biol. Chem.1981, 256, 9820−9823.
[6] Lawrence, C. M.; Ray, S.; Babyonyshev, M.; Galluster, R.; Brhani, B. W.; and Harrison, S. C.;
Science 1999, 286, 779−782.
[7] Cheng, Y.; Zak, O.; Aisen, P.; Harrison, S. C. and Walz, T.; Cell 2004, 116, 565−576.
[8] Daniels, T. R.; Delgado, T.; Rodriguez, J. A.; Helguera, G. and Penichet, M. L.; Clin. Immunol.
2006, 121, 144–158.
[9] Calzolari, A.; Oliviero, I.; Deaglio, S.; et al.; Blood. Cel.Mol. Disease 2007, 39, 82–91.
[10] Daniels, T. R.; Bernabeu, E.; Rodriguez, J. A.; et al.; Biochim. Biophys. Acta 2012, 1820, 291–
317.
[11] Hemadi, M.; Kahn, P. H.; Miquel, G. and El Hage Chahine, J. M.; Biochemistry 2004, 43, 1736–
1745.
[12] Yang, D. C.; Wang, F.; Elliott, R. L.; Head Daniels, J. F.; Bernabeu, T. R. and Rodriguez, E.;
Anticancer Res. 2001, 21, 521–549.
[13] Gaucher, G.; Dufresne, M. H.; Sant, V. P.; Kang, N.; Maysinger, D. and Leroux, J. C.; J. Control.
Release. 2005, 109, 169–188.
[14] Guo, W.; Zheng, W.; Luo, Q.; et al.; Inorg. Chem. 2005, 109, 169–188.
[15] Yang, P. H.; Sun, X.; Chiu, J. F.; Sun, H. and He, Q. Y.; Bioconjugate Chem. 2005, 16, 494–496.
[16] Yhee, J. Y.; Lee, S. J.; Lee, S.; et al.; Bioconjugate Chem. 2013, 24, 1850–1860.
[17] Sahoo, S. K.; Ma, W. and Labhasetwar, V.; Int. J. Cancer. 2004, 112, 335–340.
[18] Ferrari, M.; Trends Biotechnol. 2010, 28, 181–188.
[19] Kumar, R.; Roy, I.; Ohulchanskyy, T. Y.; et al; ACS Nano. 2008, 2, 449–456.
[20] Hogemann, D.; Bos, E.; Blondet, C.; et al.; Neoplasia. 2003, 5, 495–506.
[21] Salvati, A.; Pitek, A. S.; Monopoli, M. P,; et al.; Nat. Nanotech. 2013, 8, 137–143.
[22] Shapero, K.; Fenaroli, F.; Lynch, Y.; Cottell, D. C.; Salvati, A. and Dawson, K. A.; Mol. BioSyst.
2011, 7, 371–378.
[23] Del Pino, P.; Pelaz, B.; Zhang, Q.; Maffre, P.; Nienhaus, G. U. and Parak, W. J.; Mater. Oriz.
2014, DOI: 10.1039/C3MH00106G.
[24] Verderio, P.; Avvakumova, S.; Bellini, M.; et al.; Adv. Heathcare Mater. 2013,
adhm.201300602R1.
[25] Albanese, A.; Tang, P.S. and Chan, W. C. W.; Annu. Rev. Biomed. Eng. 2012, 14, 1−15.
[26] Oh, W. K.; Kim, S.; Kwon, O. and Jang, J.; J. Nanosci. Nanotechnol. 2011, 11, 4254−4259.
[27] Florez, L.; Herrmann, C.; Cramer, J. M.; et al.; Small 2012, 8, 2222−2225.
[28] Hünh, D.; Kantner, K.; Geidel, C.; et al.; ACS Nano 2013, 7, 3253−3258.
Chapter V
133
[29] Sapsford, K. E.; Algar, W. R.; Berti, L.; et al.; Chem. Rev. 2013, 113, 1904−2074.
[30] Liu, W.; Rose, J.; Plantevin, S.; Auffan, M.; Bottero, J. and Vidaud, C.; Nanoscale. 2013, 5,
1658−1669.
[31] Dell’Orco, D.; Lundqvist, M.; Oslakovic, C.; Cedervall, T. and Linse, S.; PlosONE. 2010, 5,
e10949.
[32] Monopoli, M. P.; Walczyk, D.; Campbell, A.; Elia, G.; Lynch, I.; Baldelli Bombelli, F.; Dawson, K.
A. J. Am. Chem. Soc.2011, 133, 2525−2530.
[33] Pilar, G. L.; De Aberasturi, D. J.; Wulf, V.; et al.; Acc. Chem. Soc. 2013, 6, 743−749.
[34] Mahon, E.; Hristov, D. R. and Dawson, K. A.;Chem. Commun. 2012, 48, 7970–7972.
[35] Wong, Y. J.; Zhu, L. F.; Teo, W. S.; et al.;J. Am. Chem. Soc. 2011, 133, 11422–11425.
[36] Monopoli, M. P.; Baldelli Bombelli, F. and Dawson, K. A.;Nat. Nanotech. 2011, 6, 11–12.
[37] Hartlen, K. D.; Athanasopoulos, A. P. T. and Kitaev, V.; Langmuir. 2008, 24, 1714–1719.
[38] Yokoi, T.; Sakamoto, Y.; Terasaki, O.; Kubota, Y. and Tatsumi, T.; J. Am. Chem. Soc.2006, 128,
13664–13666.
[39] Larson, D. R.; Ow, H.; Vishwasrao, H. D.; et al.; Chem. Mater. 2008, 20, 2677−2684.
[40] Moguilevsky, N.; Rategui, L. A.and Masson, P. L.; Biochem. J. 1985, 229, 353−359.
[41] Casals, E. and Puntes, V. F.; Nanomedicine. 2012, 7, 1917–1930.
[42] Cantu, E.; Cueto, R.; Koch, J. and Russo, P. S.; Langmuir. 2012, 28, 5562–5569.
Chapter VI
134
Chapter VI
Orientation-Controlled
Conjugation of Haloalkane
Dehalogenase Fused Homing
Peptides to Multifunctional Iron
Oxide Nanoparticles for the
Specific Recognition
of Cancer Cells
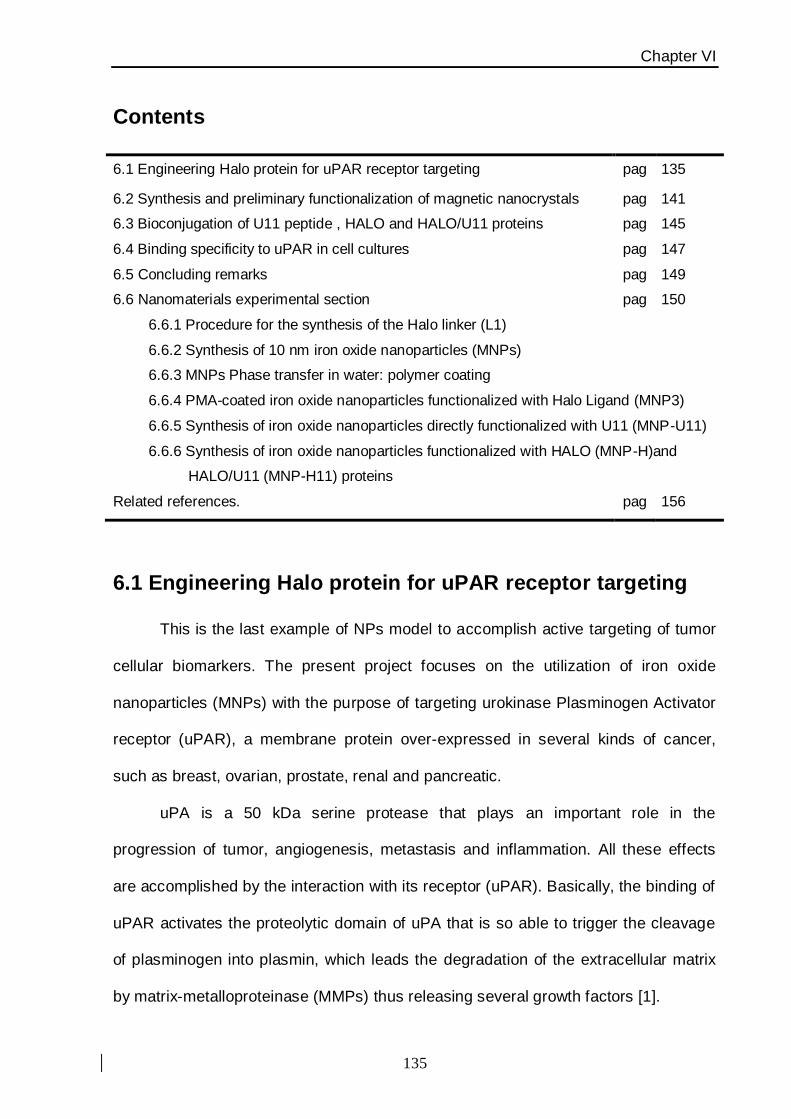
Chapter VI
135
Contents
6.1 Engineering Halo protein for uPAR receptor targeting pag 135
6.2 Synthesis and preliminary functionalization of magnetic nanocrystals pag 141
6.3 Bioconjugation of U11 peptide , HALO and HALO/U11 proteins pag 145
6.4 Binding specificity to uPAR in cell cultures pag 147
6.5 Concluding remarks pag 149
6.6 Nanomaterials experimental section pag 150
6.6.1 Procedure for the synthesis of the Halo linker (L1)
6.6.2 Synthesis of 10 nm iron oxide nanoparticles (MNPs)
6.6.3 MNPs Phase transfer in water: polymer coating
6.6.4 PMA-coated iron oxide nanoparticles functionalized with Halo Ligand (MNP3)
6.6.5 Synthesis of iron oxide nanoparticles directly functionalized with U11 (MNP-U11)
6.6.6 Synthesis of iron oxide nanoparticles functionalized with HALO (MNP-H)and
HALO/U11 (MNP-H11) proteins
Related references. pag 156
6.1 Engineering Halo protein for uPAR receptor targeting
This is the last example of NPs model to accomplish active targeting of tumor
cellular biomarkers. The present project focuses on the utilization of iron oxide
nanoparticles (MNPs) with the purpose of targeting urokinase Plasminogen Activator
receptor (uPAR), a membrane protein over-expressed in several kinds of cancer,
such as breast, ovarian, prostate, renal and pancreatic.
uPA is a 50 kDa serine protease that plays an important role in the
progression of tumor, angiogenesis, metastasis and inflammation. All these effects
are accomplished by the interaction with its receptor (uPAR). Basically, the binding of
uPAR activates the proteolytic domain of uPA that is so able to trigger the cleavage
of plasminogen into plasmin, which leads the degradation of the extracellular matrix
by matrix-metalloproteinase (MMPs) thus releasing several growth factors [1].
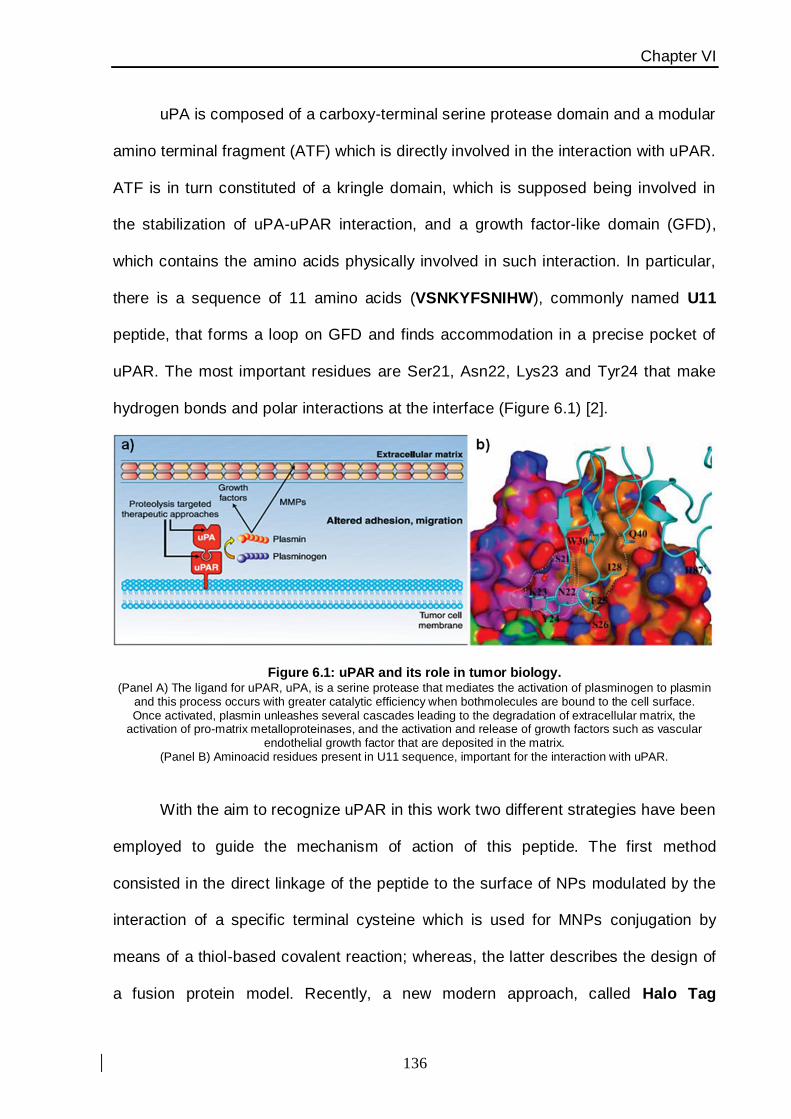
Chapter VI
136
uPA is composed of a carboxy-terminal serine protease domain and a modular
amino terminal fragment (ATF) which is directly involved in the interaction with uPAR.
ATF is in turn constituted of a kringle domain, which is supposed being involved in
the stabilization of uPA-uPAR interaction, and a growth factor-like domain (GFD),
which contains the amino acids physically involved in such interaction. In particular,
there is a sequence of 11 amino acids (VSNKYFSNIHW), commonly named U11
peptide, that forms a loop on GFD and finds accommodation in a precise pocket of
uPAR. The most important residues are Ser21, Asn22, Lys23 and Tyr24 that make
hydrogen bonds and polar interactions at the interface (Figure 6.1) [2].
Figure 6.1: uPAR and its role in tumor biology. (Panel A) The ligand for uPAR, uPA, is a serine protease that mediates the activation of plasminogen to plasmin
and this process occurs with greater catalytic efficiency when bothmolecules are bound to the cell surface. Once activated, plasmin unleashes several cascades leading to the degradation of extracellular matrix, the
activation of pro-matrix metalloproteinases, and the activation and release of growth factors such as vascular endothelial growth factor that are deposited in the matrix.
(Panel B) Aminoacid residues present in U11 sequence, important for the interaction with uPAR.
With the aim to recognize uPAR in this work two different strategies have been
employed to guide the mechanism of action of this peptide. The first method
consisted in the direct linkage of the peptide to the surface of NPs modulated by the
interaction of a specific terminal cysteine which is used for MNPs conjugation by
means of a thiol-based covalent reaction; whereas, the latter describes the design of
a fusion protein model. Recently, a new modern approach, called Halo Tag
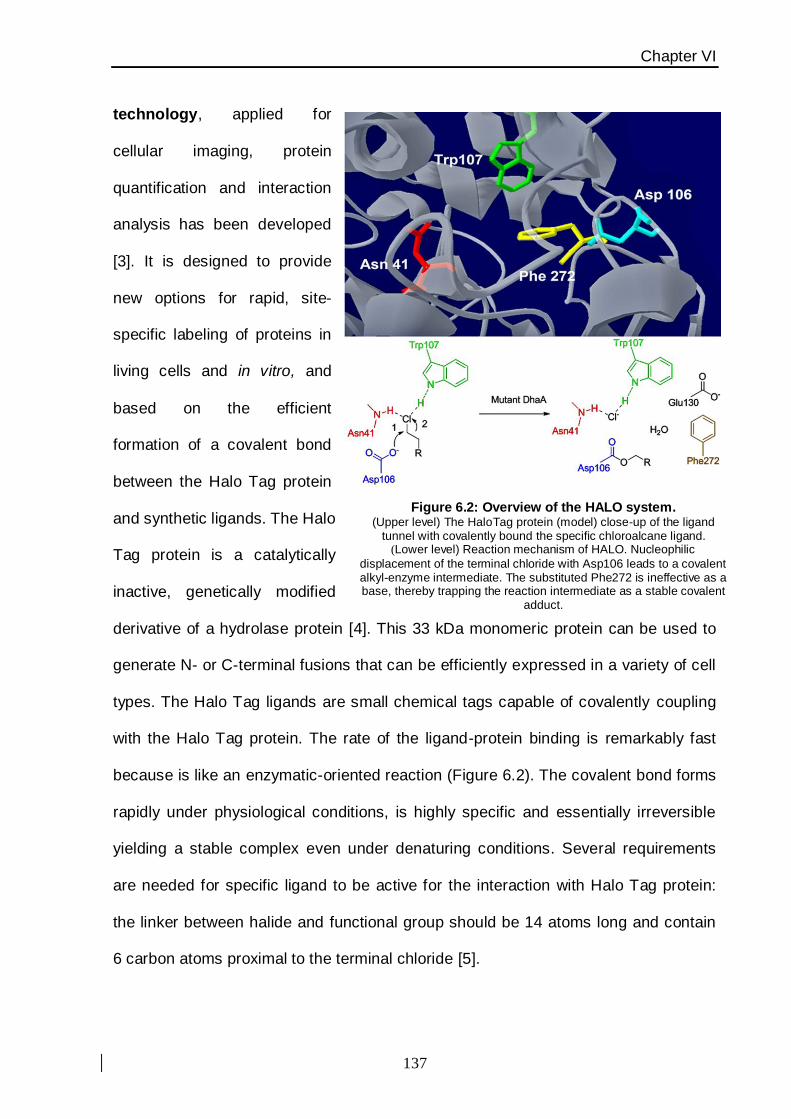
Chapter VI
137
technology, applied for
cellular imaging, protein
quantification and interaction
analysis has been developed
[3]. It is designed to provide
new options for rapid, site-
specific labeling of proteins in
living cells and in vitro, and
based on the efficient
formation of a covalent bond
between the Halo Tag protein
and synthetic ligands. The Halo
Tag protein is a catalytically
inactive, genetically modified
derivative of a hydrolase protein [4]. This 33 kDa monomeric protein can be used to
generate N- or C-terminal fusions that can be efficiently expressed in a variety of cell
types. The Halo Tag ligands are small chemical tags capable of covalently coupling
with the Halo Tag protein. The rate of the ligand-protein binding is remarkably fast
because is like an enzymatic-oriented reaction (Figure 6.2). The covalent bond forms
rapidly under physiological conditions, is highly specific and essentially irreversible
yielding a stable complex even under denaturing conditions. Several requirements
are needed for specific ligand to be active for the interaction with Halo Tag protein:
the linker between halide and functional group should be 14 atoms long and contain
6 carbon atoms proximal to the terminal chloride [5].
Figure 6.2: Overview of the HALO system. (Upper level) The HaloTag protein (model) close-up of the ligand
tunnel with covalently bound the specific chloroalcane ligand. (Lower level) Reaction mechanism of HALO. Nucleophilic
displacement of the terminal chloride with Asp106 leads to a covalent alkyl-enzyme intermediate. The substituted Phe272 is ineffective as a base, thereby trapping the reaction intermediate as a stable covalent
adduct.

Chapter VI
138
In general, the structure of a nanoparticle bioconjugate affects its function, and
the controlled display of biomolecules on NPs is critical in order to obtain conjugates
with well-defined and reproducible properties [6]. Hybrid multifunctional MNPs, which
combine unique superparamagnetic properties and fluorescence emission, have
been envisaged as promising bimodal tracers for noninvasive diagnosis of cancer
both in vitro and in vivo [7,8]. The design of ideal targeted NPs needs careful
optimization of fundamental features including uniform size and shape, surface
charge, optical and magnetic properties [9,10] and efficient functionalization with
suitable homing ligands [11,12] to improve the signal amplification and target
selectivity toward malignant cells. When the ligands are complex molecules, such as
proteins, their proper orientation on the surface of nanoparticles becomes a crucial
factor for maximizing the affinity for their molecular counterparts [13]. Recently, our
group have proposed a novel approach that relies on engineered proteins consisting
of a receptor-targeting domain genetically fused with a nanoparticle-capture domain,
in which the capture module should be an enzyme capable of irreversibly reacting
with a suicide inhibitor covalently anchored on MNPs [14]. In principle, this bimodular
orthogonal bioreaction could present two important advantages when the homing
ligand is a short peptide (e.g. 5–30 amino acids): i) the peptide is separated from the
nanoparticle surface by a protein spacer; ii) the introduction of globular proteins
enhances the solubility of the nanoconstruct.
This is the explanation of creating the HALO capture module for oriented-
specific conjugation with MNPs, moreover, the addition of the U11 peptide sequence
guarantees at the same time the targeting module for uPAR. Within this context, the
peptide sequence take the lead of a double advantage: at first, the HALO covalent
enzyme-catalyzed immobilization furnishes very high reaction specificity in few times;
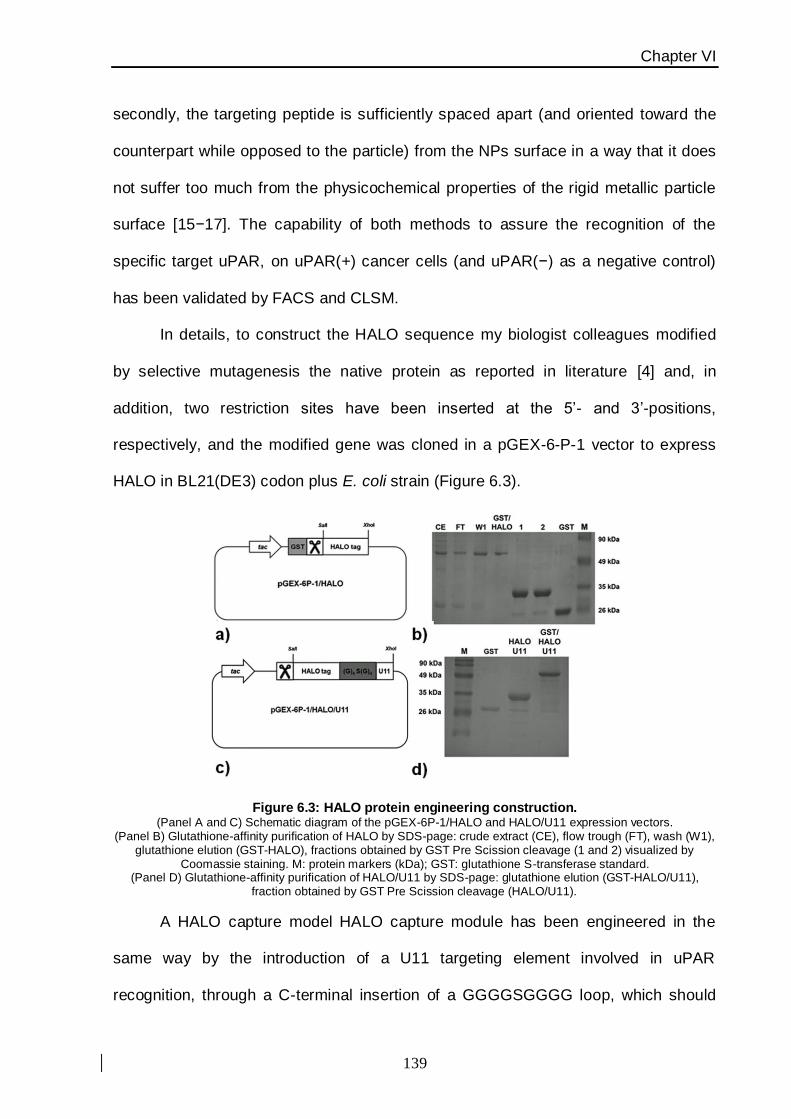
Chapter VI
139
secondly, the targeting peptide is sufficiently spaced apart (and oriented toward the
counterpart while opposed to the particle) from the NPs surface in a way that it does
not suffer too much from the physicochemical properties of the rigid metallic particle
surface [15−17]. The capability of both methods to assure the recognition of the
specific target uPAR, on uPAR(+) cancer cells (and uPAR(−) as a negative control)
has been validated by FACS and CLSM.
In details, to construct the HALO sequence my biologist colleagues modified
by selective mutagenesis the native protein as reported in literature [4] and, in
addition, two restriction sites have been inserted at the 5’- and 3’-positions,
respectively, and the modified gene was cloned in a pGEX-6-P-1 vector to express
HALO in BL21(DE3) codon plus E. coli strain (Figure 6.3).
Figure 6.3: HALO protein engineering construction. (Panel A and C) Schematic diagram of the pGEX-6P-1/HALO and HALO/U11 expression vectors.
(Panel B) Glutathione-affinity purification of HALO by SDS-page: crude extract (CE), flow trough (FT), wash (W1), glutathione elution (GST-HALO), fractions obtained by GST Pre Scission cleavage (1 and 2) visualized by
Coomassie staining. M: protein markers (kDa); GST: glutathione S-transferase standard. (Panel D) Glutathione-affinity purification of HALO/U11 by SDS-page: glutathione elution (GST-HALO/U11),
fraction obtained by GST Pre Scission cleavage (HALO/U11).
A HALO capture model HALO capture module has been engineered in the
same way by the introduction of a U11 targeting element involved in uPAR
recognition, through a C-terminal insertion of a GGGGSGGGG loop, which should

Chapter VI
140
provide sufficient freedom to the peptide. Both Conjugates have been isolated from
the crude extract by using a glutathione–sepharose column showing an excellent
degree of purity.
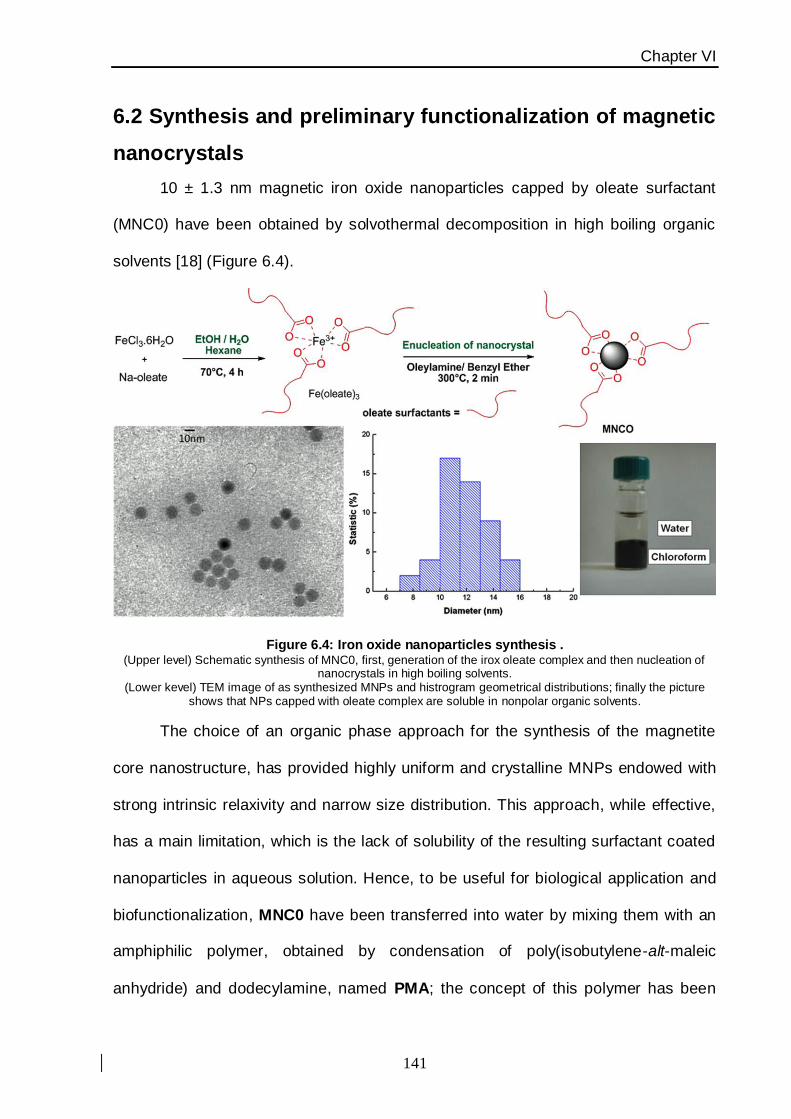
Chapter VI
141
6.2 Synthesis and preliminary functionalization of magnetic
nanocrystals
10 ± 1.3 nm magnetic iron oxide nanoparticles capped by oleate surfactant
(MNC0) have been obtained by solvothermal decomposition in high boiling organic
solvents [18] (Figure 6.4).
Figure 6.4: Iron oxide nanoparticles synthesis . (Upper level) Schematic synthesis of MNC0, first, generation of the irox oleate complex and then nucleation of
nanocrystals in high boiling solvents. (Lower kevel) TEM image of as synthesized MNPs and histrogram geometrical distributions; finally the picture
shows that NPs capped with oleate complex are soluble in nonpolar organic solvents.
The choice of an organic phase approach for the synthesis of the magnetite
core nanostructure, has provided highly uniform and crystalline MNPs endowed with
strong intrinsic relaxivity and narrow size distribution. This approach, while effective,
has a main limitation, which is the lack of solubility of the resulting surfactant coated
nanoparticles in aqueous solution. Hence, to be useful for biological application and
biofunctionalization, MNC0 have been transferred into water by mixing them with an
amphiphilic polymer, obtained by condensation of poly(isobutylene-alt-maleic
anhydride) and dodecylamine, named PMA; the concept of this polymer has been

Chapter VI
142
successfully demonstrated in several work of Parak’s group [19,20] (Figure 6.5):
maleic anhydrides of the polymer are functionalized at 75% with dodecylamine,
whereas 25% are left unreacted for following NPs functionalization. The long chains
of dodecyamine can intercalate the first hydrophobic surfactant layer with their
hydrophobic portion while water solubility of the nanocrystals is allowed by their
hydrophilic groups. The nanocomplex results in the highly stable and dispersible
(also fluorescent in the case of PMA-FITC used for cellular experiments) MNP1.
Figure 6.5: The concept of the phase transfer . (Upper level) Schematic view of the PMA polymer functionalization.
(Lower level) The polymer is associated in organic phase within hydrophobic-coated NPs; the long alkyl chains intercalate together with the oleate chains forming a compact organic layer; instead; meanwhile the external
hydrophilic groups is deprotonated in alkaline aqueous buffers thus maintaining NPs solubility [20].
Briefly, the polymer solution and MNPs suspension in chloroform (100 polymer
units per nm2 of NPs surface) are sonicated together and later the organic solvent is
completely evaporated; the black solid is then resuspended in a diluted 20 mM
sodium borate buffer, SBB (pH 12). After 5 min of sonication, the water soluble
MNP1 dissolves completely and the clear suspension is filtered onto an Amicon filter
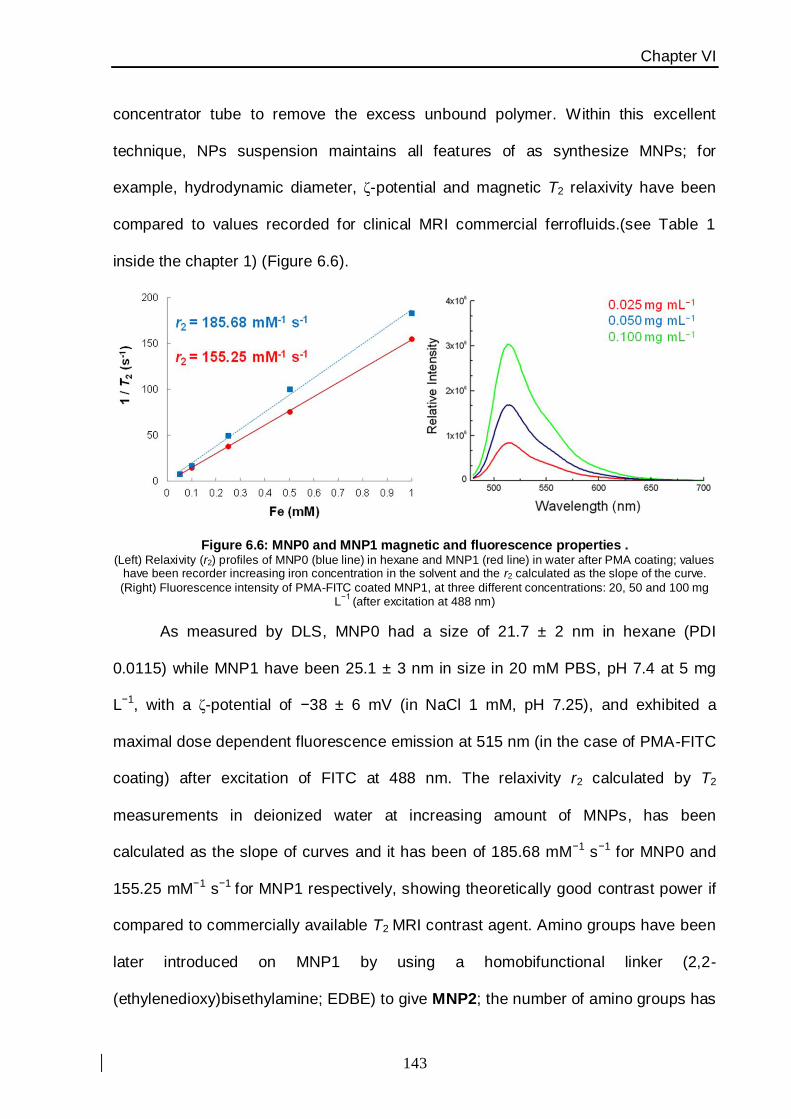
Chapter VI
143
concentrator tube to remove the excess unbound polymer. Within this excellent
technique, NPs suspension maintains all features of as synthesize MNPs; for
example, hydrodynamic diameter, ζ-potential and magnetic T2 relaxivity have been
compared to values recorded for clinical MRI commercial ferrofluids.(see Table 1
inside the chapter 1) (Figure 6.6).
Figure 6.6: MNP0 and MNP1 magnetic and fluorescence properties . (Left) Relaxivity (r2) profiles of MNP0 (blue line) in hexane and MNP1 (red line) in water after PMA coating; values
have been recorder increasing iron concentration in the solvent and the r2 calculated as the slope of the curve.
(Right) Fluorescence intensity of PMA-FITC coated MNP1, at three different concentrations: 20, 50 and 100 mg L
−1 (after excitation at 488 nm)
As measured by DLS, MNP0 had a size of 21.7 ± 2 nm in hexane (PDI
0.0115) while MNP1 have been 25.1 ± 3 nm in size in 20 mM PBS, pH 7.4 at 5 mg
L−1, with a ζ-potential of −38 ± 6 mV (in NaCl 1 mM, pH 7.25), and exhibited a
maximal dose dependent fluorescence emission at 515 nm (in the case of PMA-FITC
coating) after excitation of FITC at 488 nm. The relaxivity r2 calculated by T2
measurements in deionized water at increasing amount of MNPs, has been
calculated as the slope of curves and it has been of 185.68 mM−1 s−1 for MNP0 and
155.25 mM−1 s−1 for MNP1 respectively, showing theoretically good contrast power if
compared to commercially available T2 MRI contrast agent. Amino groups have been
later introduced on MNP1 by using a homobifunctional linker (2,2-
(ethylenedioxy)bisethylamine; EDBE) to give MNP2; the number of amino groups has
Chapter VI
144
been optimized in order to gain a sufficient number of NH2 without altering the
colloidal stability of MNP2: for instance, by ninhydrin assay 20 NH2 for nanoparticle
have been calculated, which turns in a ζ-potential of −15.7 ± 3.4 mV and a size of
35.3 ± 3.4 nm (PDI, 0.174) by DLS in NaCl 1 mM, pH 7.25.
The HALO ligand L1 has been synthesized according to the procedure
reported in a previous paper [4] in three steps: at first the alkoxylated salt generated
from 2,2-aminoethoxy ethanol has been reacted in a Wittig reaction accomplished by
1-chloro-6-iodohexane obtaining the compound 1 (see experimental section for
details). In a second step p-nitrophenyl chloroformate has been coupled to
triethylenglycol with the aim to achieve the di-substituted p-nitrophenyl carbonate
product, named compound 2. The former amino-chloroalkane 1 and the latter NPs
spacer 2 have been matched together by formation of amide coupling. In this way,
the generated organic HALO linker (L1) has been linked to the primary amino groups
on the polymer through nucleophilic addition to the second p-nitrophenyl carbonate
group by incubation overnight at 4 °C.
The MNP3 nanocomplex has been characterized by DLS and exhibited a
mean hydrodynamic size of 40.1 ± 2.7 nm in PBS pH 7.4 and a zeta potential of
−28.5 ± 3.0 mV (in 1 mM NaCl, pH 7.2). It should be mentioned that MNP3 are very
stable in PBS buffer and formed a dark transparent solution; compound MNP3 has
been stored at 4 °C until further bioconjugation with the HALO and HALO/U11
proteins.
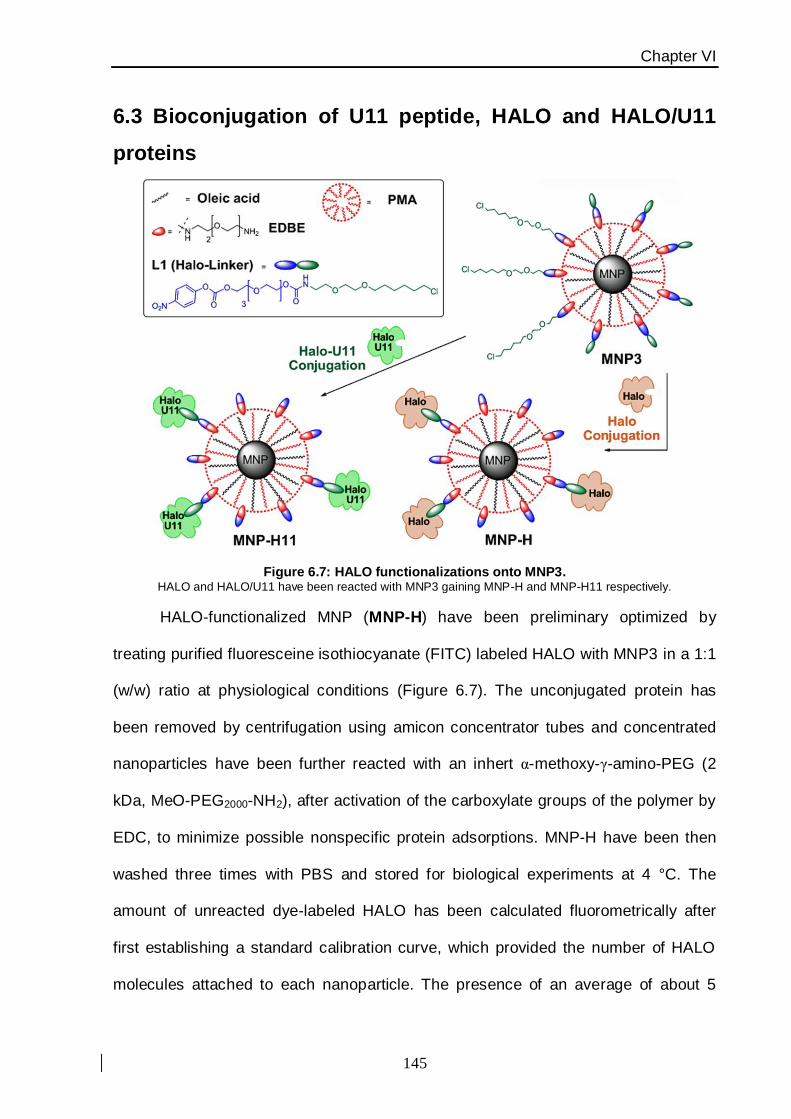
Chapter VI
145
6.3 Bioconjugation of U11 peptide, HALO and HALO/U11
proteins
Figure 6.7: HALO functionalizations onto MNP3. HALO and HALO/U11 have been reacted with MNP3 gaining MNP-H and MNP-H11 respectively.
HALO-functionalized MNP (MNP-H) have been preliminary optimized by
treating purified fluoresceine isothiocyanate (FITC) labeled HALO with MNP3 in a 1:1
(w/w) ratio at physiological conditions (Figure 6.7). The unconjugated protein has
been removed by centrifugation using amicon concentrator tubes and concentrated
nanoparticles have been further reacted with an inhert α-methoxy-γ-amino-PEG (2
kDa, MeO-PEG2000-NH2), after activation of the carboxylate groups of the polymer by
EDC, to minimize possible nonspecific protein adsorptions. MNP-H have been then
washed three times with PBS and stored for biological experiments at 4 °C. The
amount of unreacted dye-labeled HALO has been calculated fluorometrically after
first establishing a standard calibration curve, which provided the number of HALO
molecules attached to each nanoparticle. The presence of an average of about 5
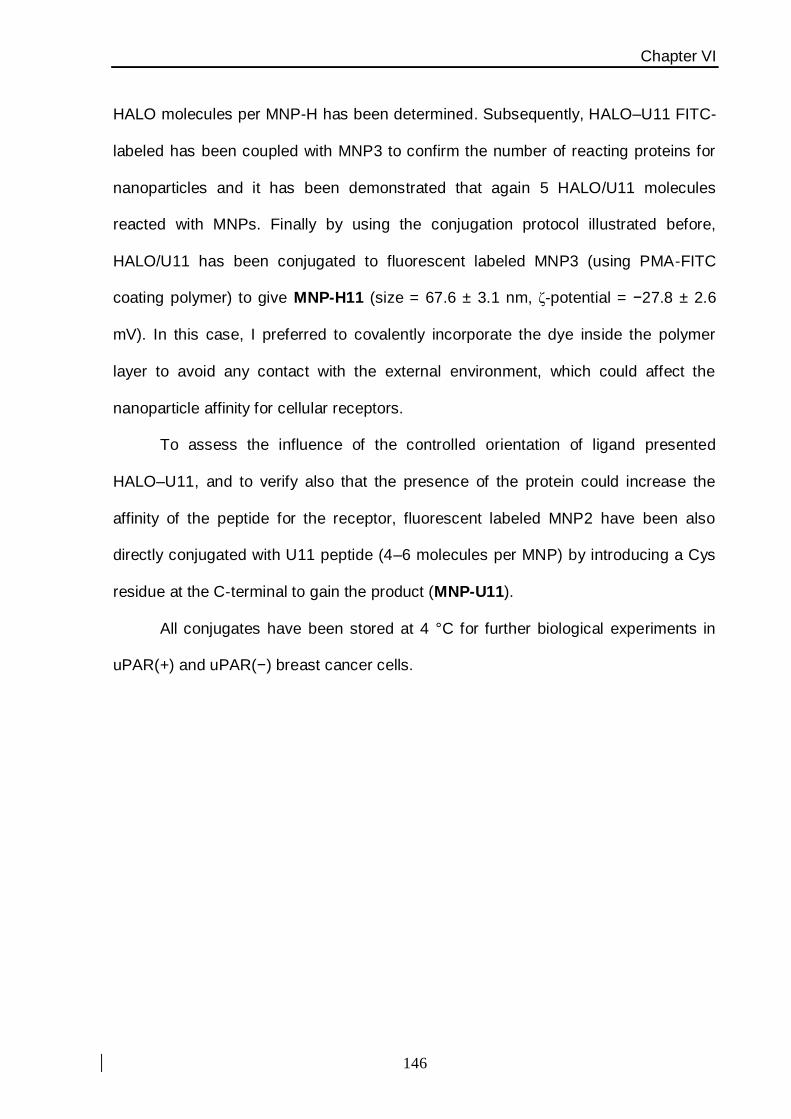
Chapter VI
146
HALO molecules per MNP-H has been determined. Subsequently, HALO–U11 FITC-
labeled has been coupled with MNP3 to confirm the number of reacting proteins for
nanoparticles and it has been demonstrated that again 5 HALO/U11 molecules
reacted with MNPs. Finally by using the conjugation protocol illustrated before,
HALO/U11 has been conjugated to fluorescent labeled MNP3 (using PMA-FITC
coating polymer) to give MNP-H11 (size = 67.6 ± 3.1 nm, ζ-potential = −27.8 ± 2.6
mV). In this case, I preferred to covalently incorporate the dye inside the polymer
layer to avoid any contact with the external environment, which could affect the
nanoparticle affinity for cellular receptors.
To assess the influence of the controlled orientation of ligand presented
HALO–U11, and to verify also that the presence of the protein could increase the
affinity of the peptide for the receptor, fluorescent labeled MNP2 have been also
directly conjugated with U11 peptide (4–6 molecules per MNP) by introducing a Cys
residue at the C-terminal to gain the product (MNP-U11).
All conjugates have been stored at 4 °C for further biological experiments in
uPAR(+) and uPAR(−) breast cancer cells.
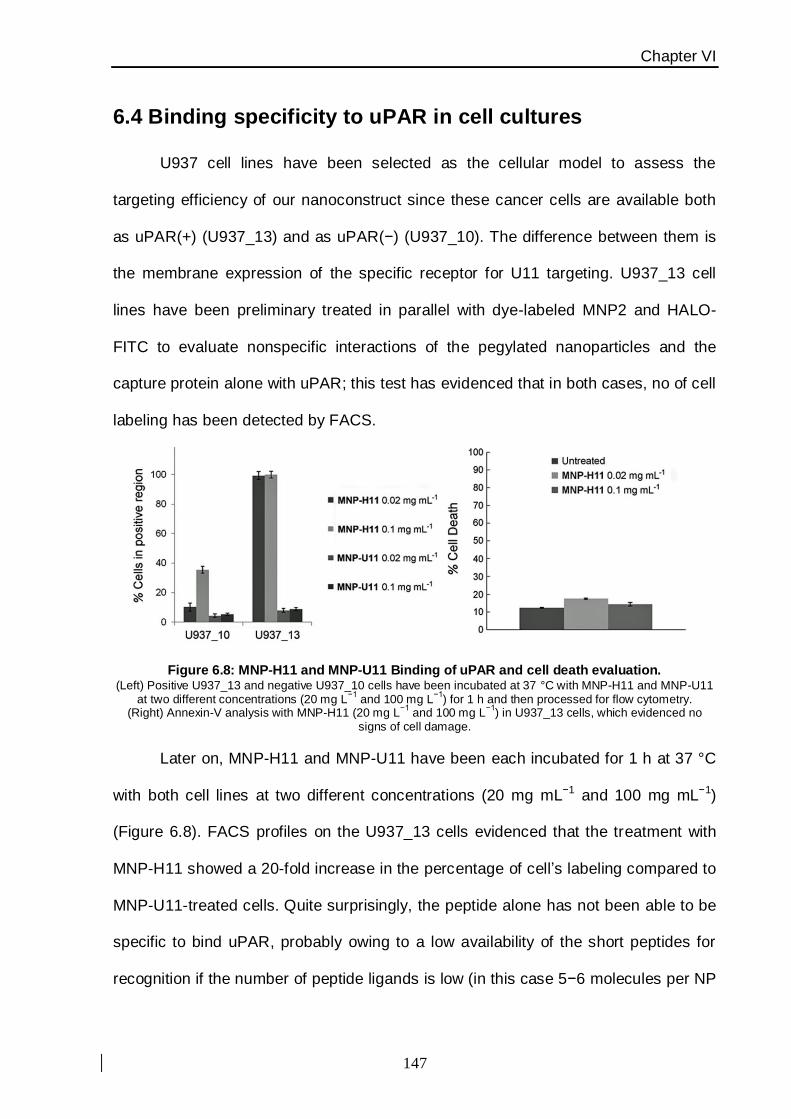
Chapter VI
147
6.4 Binding specificity to uPAR in cell cultures
U937 cell lines have been selected as the cellular model to assess the
targeting efficiency of our nanoconstruct since these cancer cells are available both
as uPAR(+) (U937_13) and as uPAR(−) (U937_10). The difference between them is
the membrane expression of the specific receptor for U11 targeting. U937_13 cell
lines have been preliminary treated in parallel with dye-labeled MNP2 and HALO-
FITC to evaluate nonspecific interactions of the pegylated nanoparticles and the
capture protein alone with uPAR; this test has evidenced that in both cases, no of cell
labeling has been detected by FACS.
Figure 6.8: MNP-H11 and MNP-U11 Binding of uPAR and cell death evaluation. (Left) Positive U937_13 and negative U937_10 cells have been incubated at 37 °C with MNP-H11 and MNP-U11
at two different concentrations (20 mg L−1
and 100 mg L−1
) for 1 h and then processed for flow cytometry. (Right) Annexin-V analysis with MNP-H11 (20 mg L
−1 and 100 mg L
−1) in U937_13 cells, which evidenced no
signs of cell damage.
Later on, MNP-H11 and MNP-U11 have been each incubated for 1 h at 37 °C
with both cell lines at two different concentrations (20 mg mL−1 and 100 mg mL−1)
(Figure 6.8). FACS profiles on the U937_13 cells evidenced that the treatment with
MNP-H11 showed a 20-fold increase in the percentage of cell’s labeling compared to
MNP-U11-treated cells. Quite surprisingly, the peptide alone has not been able to be
specific to bind uPAR, probably owing to a low availability of the short peptides for
recognition if the number of peptide ligands is low (in this case 5−6 molecules per NP
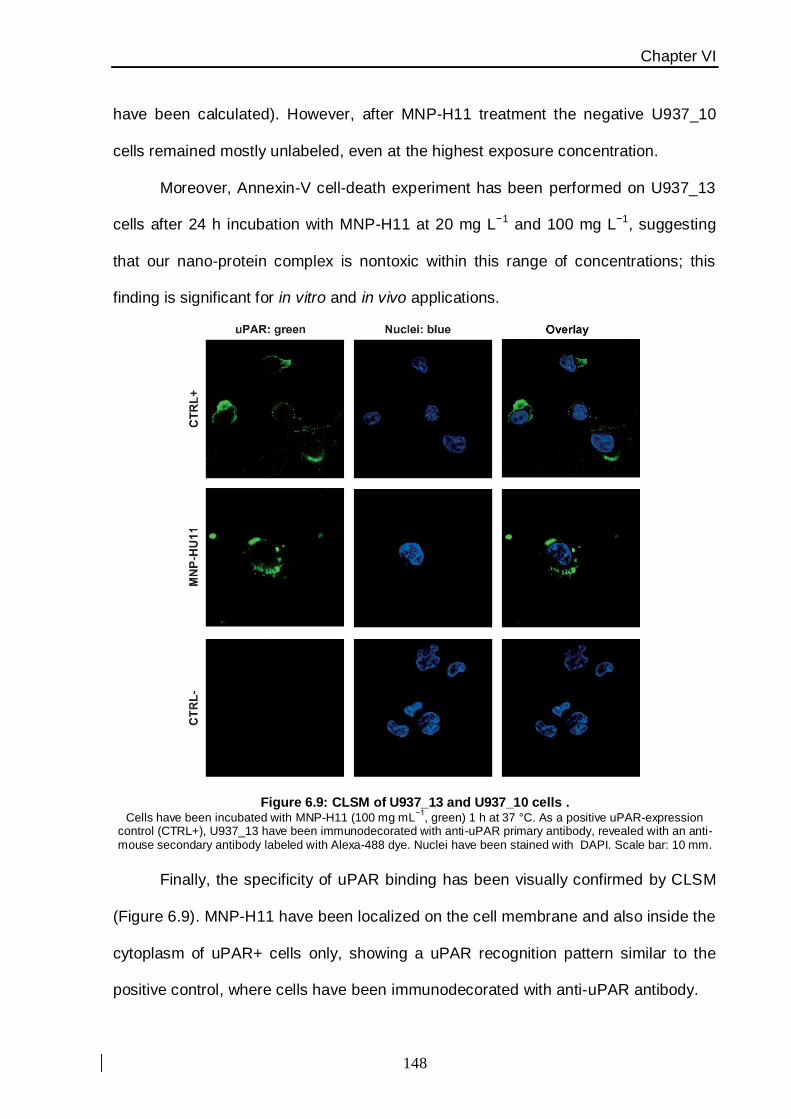
Chapter VI
148
have been calculated). However, after MNP-H11 treatment the negative U937_10
cells remained mostly unlabeled, even at the highest exposure concentration.
Moreover, Annexin-V cell-death experiment has been performed on U937_13
cells after 24 h incubation with MNP-H11 at 20 mg L−1 and 100 mg L−1, suggesting
that our nano-protein complex is nontoxic within this range of concentrations; this
finding is significant for in vitro and in vivo applications.
Figure 6.9: CLSM of U937_13 and U937_10 cells . Cells have been incubated with MNP-H11 (100 mg mL
−1, green) 1 h at 37 °C. As a positive uPAR-expression
control (CTRL+), U937_13 have been immunodecorated with anti-uPAR primary antibody, revealed with an anti-mouse secondary antibody labeled with Alexa-488 dye. Nuclei have been stained with DAPI. Scale bar: 10 mm.
Finally, the specificity of uPAR binding has been visually confirmed by CLSM
(Figure 6.9). MNP-H11 have been localized on the cell membrane and also inside the
cytoplasm of uPAR+ cells only, showing a uPAR recognition pattern similar to the
positive control, where cells have been immunodecorated with anti-uPAR antibody.
Chapter VI
149
6.5 Concluding remarks
In summary, we have demonstrated that oriented-controlled ligation of a HALO
protein homing U11 peptide allows for a rapid and ultra effective recognition of breast
cancer cell receptor within a uPAR in vitro model. The concept to create different
multifunctional nanoparticles, combining, for example, optical and magnetic
properties, leads to improved effectiveness of these diagnostic tools for selectively
malignant receptor targeting in living cells. Moreover, at the same time, the finely
construction of long−term highly water-stable, bioengineered, targeted nanoparticles
exhibited a complete conservation of protein functionality.
As the structural motif of short peptides involved in tumoral biomarker
targeting is highly conserved, other kinds of nanoparticles might be modified
identically with the same polymer used herein [19,20], therefore, this approach is
expected to be of general utility and may become a universal strategy for the
development of a new generation of targeted nanoparticles.

Chapter VI
150
6.6 Nanomaterials Experimental section
6.6.1 Procedure for the synthesis of the Halo linker (L1)
(Inhert atmosphere, Dry solvents)
6.6.1.1 Synthesis of 2,2-[2-(6-chloro-hexyloxy)-ethoxy]-ethylammonium hydrochloride (1)
In a centrifuge tube, a dispersion of NaH 60 wt.% in mineral oil (240 mg, 6 mmol) has been
suspended and vortexed in freshly distilled dry hexane (3 mL). After centrifugation, the
solvent has been removed and the white residue washed in the same way thrice and finally
dried under vacuum. The dry NaH has been then suspended in dry dimethylformamide
(DMF, 4 mL) and the suspension has been transferred with a metallic double-needle tube
into a round bottom flask. Later on, the suspension has been cooled to 0 °C 2,2-aminoethoxy
ethanol (520 µL, 5 mmol) has been added dropwise. The reaction mixture has been stirred
45 min to create the sodium alkoxylated intermediate . Furthermore, 1-chloro-6-iodohexane
(835 µL, 5.5 mmol) dissolved in dry DMF (4 mL) and cooled at 0 °C, has been transferred
dropwise by use of a wide bore cannula into the reaction and left under stirring at 0 °C for 4
h. Later on, the suspension has been filtered through celite and the solvent quickly removed
under vacuum. The yellow residue has been dissolved in CH2Cl2 (10 mL) and washed with
aqueous saturated NaHCO3, followed by two washes with water. The organic layer has been
dried with Na2SO4, filtered, and the solvent distilled under vacuum. The crude product has
been cooled down to –78 °C and dried under high vacuum for 2 h. Subsequently, the yellow
oil obtained has been dissolved in CH2Cl2 (2 ml) at 0 °C and 2 M HCl gas in Et2O (4.5 mL)
has been added to the mixture and stirred for 1 h. After solvent removal, the orange residue
has been purified by silica flash column chromatography. The compound 1, a sticky yellow
oil, was collected. Yield: 45% overall.
1H NMR (CDCl3): δ= 8.04 (bs, 3H exchangeable, NH3+), 3.55−3.42 (m, 8H,-CH2-O), 3.33 (t,
2H, CH2-Cl), 2.29 (t, 2H, -CH2-N), 1.78 (q, 2H, -CH2-), 1.42 (q, 2H, -CH2-), 1.28 (q, 4H, -CH2-)
ppm.
(Inhert atmosphere, Dry solvents)

Chapter VI
151
6.6.1.2 Synthesis of 2,2'-(ethane-1,2-diylbis(oxy))bis(ethane-2,1-diyl)bis(4-nitrophenyl)-
carbonate (2)
In a round bottom flask, 4-nitrophenyl chloroformate (4.4 g, 22 mmol) has been dissolved in
dry CH2Cl2 (40 mL) and cooled at 0 °C with an ice bath. Triethylene glycol (1.33 mL, 10
mmol) dissolved as well in CH2Cl2 (20 mL) has been added dropwise by a funnel.
Triethylamine (3.4 mL) and a catalytic amount of dimethylaminopyridine (63 mg, 0.52 mmol)
have been added subsequently. The reaction has been stirred at 0 °C for 1 h and then
allowed to warm to RT overnight. The mixture has been diluted with CH2Cl2 (50 mL) and
washed twice with H2O (50 mL). The organic layer has been dried and the solvent
concentrated to the minimum volume by evaporation under reduced pressure. The yellow oil
has been purified using flash chromatography using a gradient from 25 vol.% to 100 vol.%
ethyl acetate in hexane. The product 2 has been collected as colorless oil. Yield: 55%.
1H NMR (CDCl3): δ = 8.20 (d, 4H, Ar), 7.40 (d, 4H, Ar), 4.43−4.32 (t, 4H), 3.82−3.56 (t, 4H),
3.34 (s, 4H) ppm.
(Inhert atmosphere, Dry solvents)
6.6.1.3 Synthesis of 2-(2-(2-((4-nitrophenoxy)carbonyloxy)ethoxy)ethoxy)ethyl 2-(2-(6-
chlorohexyloxy) ethoxy) ethylcarbamate (L1)
In a round bottom flask, the compound 2 (540 mg, 2.4 mmol) has been dissolved in dry DMF
(10 mL) and the resultant solution has been carefully added to a solution of 3 (1.56 g, 3.25
mmol) in dry DMF (25 mL) under gentle stirring at room temperature. The mixture turned
yellowish quickly due to the nucleophilic substitution and to the following release of p-
nitrophenol. In this way, the reaction has been allowed to proceed to completion at room
temperature for 4 h. After removal of DMF by evaporation under reduce pressure, the crude
product has been purified by flash chromatography using a gradient from 40 vol.% to 100
vol.% ethyl acetate in hexane. Pale yellowish oil has been collected. Yield: 350 mg, 26%.
1H-NMR (CDCl3), δ= 8.24−8.22 (d, 2H, Ar), 7.36−7.34 (d, 2H, Ar), 5.29 (bs exchangeable,
1H, NH), 4.41−4.39 (t, 2H, CH2-O-C(O)), 4.20−4.17 (t, 2H, CH2-C(O)-O), 3.66 (m, 2H, CH2-
O), 3.56−3.47 (m, 14H, CH2-O), 3.43−3.40 (t, 2H, CH2-Cl), 3.33−3.31 (d-d, 2H, CH2-N),
1.76−1.69 (q, 2H, -CH2-), 1.59−1.52 (q, 2H, -CH2-), 1.43−1.32 (m, 4H, -CH2-) ppm.
Chapter VI
152
6.6.2 Synthesis of 10 nm iron oxide nanoparticles (MNPs)
(Inhert atmosphere, Dry solvents)
The metal–oleate complex has been prepared by reacting metal chlorides and sodium
oleate. In a typical synthesis, of iron chloride FeCl3·6H2O (1.8 g, 4 mmol) and of sodium
oleate (3.65 g, 12 mmol) has been dissolved in a mixture solvent composed of ethanol (8
mL), distilled water (6 mL) and hexane (14 ml). The resulting solution has been heated to 70
°C and kept at that temperature 4 hours. At the end of the reaction, the upper organic layer
containing the iron–oleate complex has been washed thrice with deionized water (5 mL) in a
separatory funnel. After washing, hexane has been evaporated off, resulting in iron–oleate
complex in a waxy dark red solid form (2.6 g).
The Synthesis of surfactant-coated (oleate surfactants) Fe3O4 nanoparticles has been
performed by solvothermal decomposition of iron-organometallic precursors in high boiling
apolar organic solvents as reported in literature [18]. Briefly, Fe(oleate)3 (3.6 g, 4 mmol) has
been dissolved in a mixture of oleylamine (2 mL) and dibenzyl ether (2 mL). The mixture has
been heated at 110 °C for 1 h under argon, then refluxed at 300 °C for 2 h, and finallly cooled
to room temperature. Ethanol (100 mL) has been added to precipitate the black MNPs by
centrifugation. The supernatant has been discarded and the product has been washed
several times with ethanol to remove the unbound surfactant. The resulting 10 nm
oleylamine-coated magnetite nanocrystals (MNP0) have been finally dispersed in chloroform
at a concentration of 10 mg mL−1 and stored at RT until further functionalization. MNP0
concentration has been gained by UV-vis calibration curve (in chloroform) diluting the mother
solution and reading sample’s relative absorbance at λ=450 nm
6.6.3 MNPs Phase transfer in water: polymer coating
(Inhert atmosphere, Dry solvents)
6.6.3.1 Synthesis of fluorescent dye-grafted co-polymer: (24% Anhydride-75% C12COOH-1%
Dye]
The maleic anhydride groups of the poly(isobutylene-alt-maleic anhydride), named PMA
backbone have been assumed to be 100% reactive to primary amino-ligands through
spontaneous amide linkage, which converts one maleic anhydride group into one
corresponding amide and one free carboxylic acid group. For this synthesis, as reported in
literature [19] is defined as a polymer of which 75% of its maleic anhydride rings have been
reacted with dodecylamine and of which 1% of its maleic anhydride rings have been reacted
with fluorescein-amine, leaving 24% of the anhydrides unreacted and available for further
MNPs functionalizations.
Chapter VI
153
Briefly, of fluorescein-amine (2.78 mg, 8 µmol) have been dissolved in anhydrous THF (1
mL) to obtain a 8 mM fluorescein-amine stock solution. This solution has been further diluted
10 times with anhydrous THF before modification. of 0.8 M monomer units of 25%
Anhydride-75% C12COOH (50 µL) have been mixed vigorously with of 0.8 mM fluorescein-
amine (500 µL); the mixture have been reacted overnight under stirring at room temperature.
The solvent have been then evaporated under reduce pressure and the crude yellow powder
has been dissolved in of anhydrous chloroform (1 mL), to yield a final monomer
concentration of 40 mM fluorescein-polymer (FITC-PMA).
6.6.3.2 Polymer coating: MNPs phase transfer into aqueous environment
Synthesis of PMA-FITC-coated fluorescent iron oxide nanoparticles has been performed
following a procedure described in literature [19,20]. An aliquot of PMA-FITC solution (63 μL)
was added to MNP0 (4.6 mg in CHCl3); the mixture has been homogenized with an
ultrasound bath and later the solvent has been completely evaporated under reduced
pressure. Sodium borate buffer (SBB, pH 12, 10 mL) has been added obtaining a black
aqueous nanoparticle dispersion (MNP1), which have been concentrated in Amicon tubes
(filter cutoff 100 kDa) by centrifugation at 3500 rpm for 1 h. MNP1 have been washed several
times diluting with SBB in the same way and concentrated (each centrifuge cycle was 20 min
at 3500 rpm) to a final volume of 500 μL.
[The protocol used to obtain MNP1 without a fluorescent polymer coating has been
performed in the same way apart the polymer PMA of which composition has been
maintained 25% Anhydride-75% C12COOH].
6.6.4 PMA-coated iron oxide nanoparticles functionalized with Halo
Ligand (MNP3)
MNP1 (4.6 mg) in deionized water (500 μL), have been reacted with 0.1 M EDC in water (18
μL) for 2 min and then aqueous 0.05 M 2,2-(ethylenedioxy)bis(ethylamine) (EDBE) (9 μL)
has been added to the mixture and stirred for 2 h. Next, the MNP2 dispersion have been
concentrated in Amicon tubes (100 kDa filter cutoff) by centrifugation at 3500 rpm for 1 h.
MNP2 have been washed twice with water (10 mL) in the same way to remove the excess of
reagent and NPs have been finally concentrated at the final volume of 1 mL.
MNP2 (amino terminated) dispersion has been shaken overnight at 4 °C in the presence of
L1 (460 µL, 10 mg mL–1 stock solution in DMSO), concentrated and washed twice with water
as described above (MNP3).
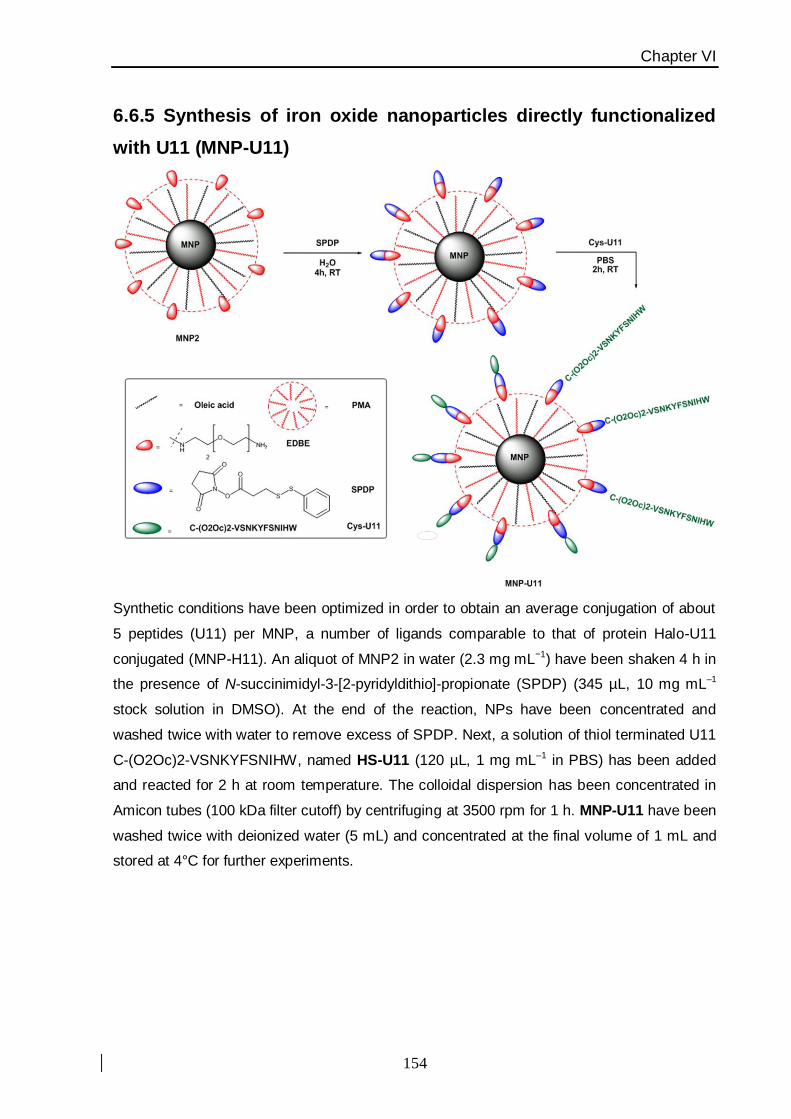
Chapter VI
154
6.6.5 Synthesis of iron oxide nanoparticles directly functionalized
with U11 (MNP-U11)
Synthetic conditions have been optimized in order to obtain an average conjugation of about
5 peptides (U11) per MNP, a number of ligands comparable to that of protein Halo-U11
conjugated (MNP-H11). An aliquot of MNP2 in water (2.3 mg mL−1) have been shaken 4 h in
the presence of N-succinimidyl-3-[2-pyridyldithio]-propionate (SPDP) (345 µL, 10 mg mL–1
stock solution in DMSO). At the end of the reaction, NPs have been concentrated and
washed twice with water to remove excess of SPDP. Next, a solution of thiol terminated U11
C-(O2Oc)2-VSNKYFSNIHW, named HS-U11 (120 µL, 1 mg mL–1 in PBS) has been added
and reacted for 2 h at room temperature. The colloidal dispersion has been concentrated in
Amicon tubes (100 kDa filter cutoff) by centrifuging at 3500 rpm for 1 h. MNP-U11 have been
washed twice with deionized water (5 mL) and concentrated at the final volume of 1 mL and
stored at 4°C for further experiments.
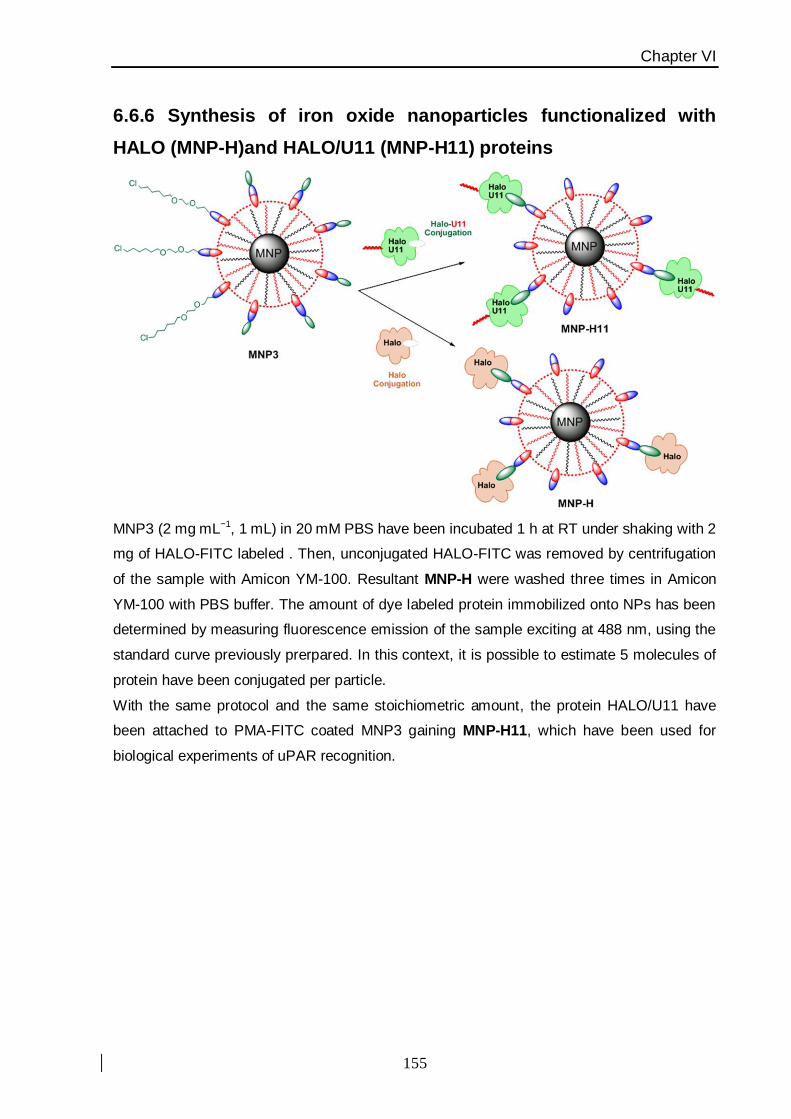
Chapter VI
155
6.6.6 Synthesis of iron oxide nanoparticles functionalized with
HALO (MNP-H)and HALO/U11 (MNP-H11) proteins
MNP3 (2 mg mL−1, 1 mL) in 20 mM PBS have been incubated 1 h at RT under shaking with 2
mg of HALO-FITC labeled . Then, unconjugated HALO-FITC was removed by centrifugation
of the sample with Amicon YM-100. Resultant MNP-H were washed three times in Amicon
YM-100 with PBS buffer. The amount of dye labeled protein immobilized onto NPs has been
determined by measuring fluorescence emission of the sample exciting at 488 nm, using the
standard curve previously prerpared. In this context, it is possible to estimate 5 molecules of
protein have been conjugated per particle.
With the same protocol and the same stoichiometric amount, the protein HALO/U11 have
been attached to PMA-FITC coated MNP3 gaining MNP-H11, which have been used for
biological experiments of uPAR recognition.
Chapter VI
156
Related References
[1] Reuning, U.; Sperl, S.; Kopitz, C.; et al.; Curr. Pharm. Des. 2003, 9, 1529–1543.
[2] Wang, M.; Lowik, D. W.; Miller, A. D. and Thanou, M.; Bioconjugate Chem. 2009, 20, 32–40.
[3] Janssen, D. B.; Curr Opin. Chem. Biol. 2004, 8, 150–159.
[4] Los, G. V.; Encell, L. P.; McDougall, D. D.; et al.; ACS Chem. Biol. 2008, 3, 373–382.
[5] Pries, F.; Kingma, G. H.; Jeronimus-Stratingh, C. M.; Bruins, A. P. and Janssen, D. B.; J Biol.
Chem. 1995, 270, 10405–10411.
[6] Algar, W. R.; Prasuhn, D. E.; Steward, M. H.; Jennings, T. L.; Blanco-Canosa, J. B.; Dawson, P. E.
and Medinz, I. L.; Bioconjugate Chem. 2011, 22, 825–858.
[7] Park, K.; Lee, S.; Kang, E.; Kim, K.; Choi, K. and Kwon, I. C.; Adv. Funct. Mater. 2009, 19, 1553–
1566.
[8] Kim, J.; Park, S.; Kang, K.; et al.; Angew Chem.Int. Ed. 2006, 45, 7754–7758.
[9] Yang, J.; Kim, E. K.; Lee, H. J.; et al.; Biomaterials 2008, 29, 2548–2555.
[10] Chen, S.; Reynolds, S.; Yu, L.; Weissleder, R. and Josephson, L.; J. Mater. Chem. 2009, 19,
6387–6392.
[11] Lewin, M.; Carlesso, N.; Tung, C. H.; Tang, X. W.; Scadden, D. T. and Weissleder, R.; Nat.
Biotechnol. 2000, 18, 410–414.
[12] Thanh, N. T. K. and Green, L. A. W.; Nano Today. 2010, 5, 213–230.
[13] Casals, E.;Pfaller, T.; Duschl, A.; Oostingh, G. J. and Puntes, V. F.; Small. 2011, 7, 3479–3486.
[14] Colombo, M.; Mazzucchelli, S.; Montenegro, J. M.; Galbiati, E.; Corsi, F.; Parak, W. J. and
Prosperi, D.; Small, 2012, 8. 1492–1497.
[15] Rivera-Gil, P.; Jimenez de Aberasturi, D.; Wulf, V.; et al.; Acc. Chem. Res. 2013, 46, 743–749.
[16] Avvakumova, S.; Colombo, M.; Tortora, P. and Prosperi, D.; Trands. Biotechnol. 2013, DOI:
10.1016/j.tibtech.2013.09.006.
[17] Herd, H.; Daum, N.; Jones, A. T.; Huwer, H.; Ghandehari, H. and Lehr, C. M.; ACS Nano. 2013, 7,
1961–1973.
[18] Park, J.; An, K.; Hwang, Y.; et al.; Nat. Mater 2004, 3, 891–896.
[19] Lin, C. J.; Sperling, R. A.; Li, J. K.; et al.; Small. 2008, 4, 334–341.
[20] Pellegrino, T.; Manna, L.; Kudera, S.; et al.; Nanolett. 2004, 4, 703–707.
Chapter VII
157
Chapter VII
Intracellular Drug Release
From Curcumin-Loaded PLGA
Nanoparticles Induces G2/M
Block in Breast Cancer Cells
Chapter VII
158
Contents
7.1 Curcumin: a drug model for breast cancer therapy pag 158
7.2 New medicinal frontiers Curcumin nanoformulations pag 162
7.3 Synthesis and characterization of curcumin-loaded PLGA nanoparticles pag 166
7.4 In vitro drug release kinetics pag 174
7.5 Toxicity evaluation: Cancer Cell cycle arrest induced by curcumin-PLGA
nanocarrier
pag 177
7.6 Conclusions and outlooks pag 182
7.7 Nanomaterials experimental section pag 183
7.7.1 Procedure for the total synthesis of Curcumin
7.7.2 Synthesis of Curcumin-Loaded PLGA NPs (PCNPs)
Related references. pag 185
7.1 Curcumin: a drug model for Breast Cancer Therapy
Breast cancer is a heterogeneous disease that shows remarkably different
biological characteristics and clinical behaviors [1]. Classification of these subtypes of
breast cancer is generally based upon the presence or absence of three receptors:
estrogen (ER) and progesterone (PR) receptors and HER2 [2]. More than 80% of
breast cancers are positive for at least one of these three receptors [3] In Chapter IV,
I have pointed out that the HER2/neu gene is generally over-expressed in 25−30% of
breast cancer [4] and its amplification of the HER2/neu leads to activation of the
cellular signaling pathways correlated to cell growth, invasion and metastasis leading
to an aggressive breast cancer phenotype (see Chapter IV). Nowadays, the standard
treatment options for early stage breast cancer therapy include surgery, radiation,
and/or treatments with several anticancer drugs. Breast cancer has high metastatic
disposition; for example, axillary or supraclavicular lymph nodes are often the most
common sites for breast cancer metastasis [5,6] [Figure 7.1].

Chapter VII
159
Figure 7.1: The biological process of metastasis in primary tumors. The biological process of metastasis is a complex cascade with multiple steps in which suppressor activity may prevent clinically apparent metastasis. Given the prevalence and mortality of human breast cancer, it is focused
here on this tissue type, although these principles apply to most solid malignancies. In the primary tumour, deregulation of oncogenes and tumour suppressor genes mediates the conversion of normal cells to a neoplastic
phenotype. By definition, metastasis suppressor genes do not prevent these steps, but must function subsequently in the cascade as shown [6].
Distant sites of metastasis from breast cancer include the brain, bones, lungs,
and the liver. Hormone receptor−positive breast cancers are usually treated with
inhibitors of estrogen synthesis or modulators of estrogen receptor [7], however
hormone receptor negative breast cancers are treated with cytotoxic chemotherapy
[8]. Despite relatively large numbers of active agents available for the treatment of
breast cancer, systemic therapy for metastatic disease still remains a serious
concern. This raises the importance of identifying novel agents that can modulate
resistance of breast cancer to cytotoxic agents.
Turmeric (Curcuma longa L.), the principal ingredient of curry powder, belongs
to a member of the ginger family (Zingiberaceae). These plants are native to India
and Indonesia and have been used for centuries as part of Indian Ayurvedic [9] and
Chinese medicine [10]. Curcumin is the active ingredient of turmeric and is believed
to be responsible for its therapeutic activity; indeed, this compound has been shown
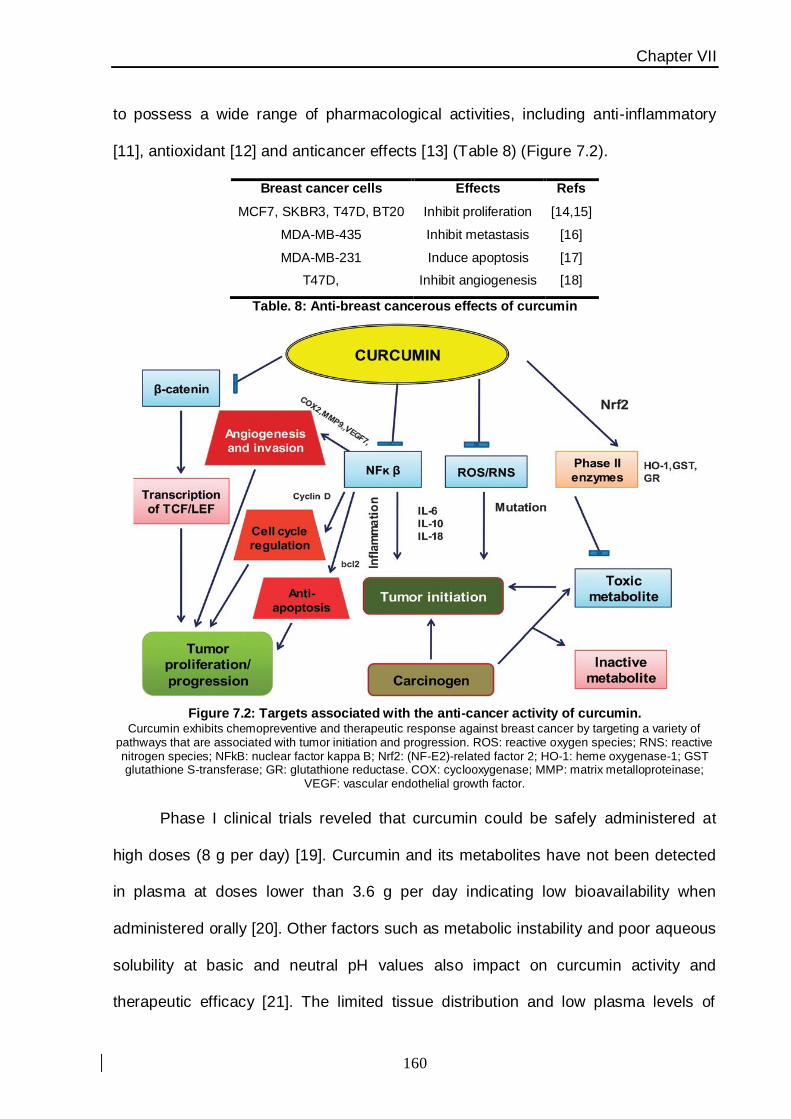
Chapter VII
160
to possess a wide range of pharmacological activities, including anti-inflammatory
[11], antioxidant [12] and anticancer effects [13] (Table 8) (Figure 7.2).
Breast cancer cells Effects Refs
MCF7, SKBR3, T47D, BT20 Inhibit proliferation [14,15]
MDA-MB-435 Inhibit metastasis [16]
MDA-MB-231 Induce apoptosis [17]
T47D, Inhibit angiogenesis [18]
Table. 8: Anti-breast cancerous effects of curcumin
Figure 7.2: Targets associated with the anti-cancer activity of curcumin. Curcumin exhibits chemopreventive and therapeutic response against breast cancer by targeting a variety of
pathways that are associated with tumor initiation and progression. ROS: reactive oxygen species; RNS: reactive nitrogen species; NFkB: nuclear factor kappa B; Nrf2: (NF-E2)-related factor 2; HO-1: heme oxygenase-1; GST glutathione S-transferase; GR: glutathione reductase. COX: cyclooxygenase; MMP: matrix metalloproteinase;
VEGF: vascular endothelial growth factor.
Phase I clinical trials reveled that curcumin could be safely administered at
high doses (8 g per day) [19]. Curcumin and its metabolites have not been detected
in plasma at doses lower than 3.6 g per day indicating low bioavailability when
administered orally [20]. Other factors such as metabolic instability and poor aqueous
solubility at basic and neutral pH values also impact on curcumin activity and
therapeutic efficacy [21]. The limited tissue distribution and low plasma levels of
Chapter VII
161
curcumin are attributed to its poor absorption and metabolism in the gastrointestinal
tract and its rapid and extensive metabolism through reduction oxidation, sulfation,
and glucuronidation, leading to less active metabolites. Several strategies were
tested to overcome the pharmacokinetic limitations of curcumin. These approaches
include testing piperine (like adjuvant) that interferes with glucuronidation, liposomal
curcumin, curcumin nanoparticles, curcumin phospholipid complex, and structural
analogues of curcumin [22,23]. Curcumin through its multiple cellular effects on
apoptosis and its excellent safety profile may be an effective agent to combine with
current available therapies. Curcumin may find application as a novel drug in the
near future to control various diseases, especially breast cancer. The multiple
molecular pathways modulated by curcumin may add to its therapeutic value in the
treatment and prevention of breast cancer. Research on the nanotechnology-based
formulations and delivery system of curcumin for breast cancer is in progress [24,25].
Different nanotechnologies are being applied to develop diverse or novel curcumin
formulations that have improved pharmacokinetic profiles. These strategies include
curcumin encapsulation with nanoparticles or curcumin conjugated to a ligand or
antibody that specifically targets the cancer cell receptor or epitopes; moreover the
inclusion of curcumin in polymeric micelles or liposomes/lipidic micelles [24,25].
Therefore, the use of these novel chemical analogs and nanotechnology-based
formulations of curcumin may represent a potential alternative strategy for
overcoming the principal factors limiting curcumin therapeutic effects when
administrated orally.
Chapter VII
162
7.2 New medicinal frontiers: Curcumin nanoformulations
Various types of NPs, such as polymer NPs, polymeric micelles,
liposome/phospholipid, nano-/microemulsions, nanogels, solid lipid NPs, polymer
conjugates, self-assemblies, and so on, are suitable for the delivery of an active form
of curcumin to tumors [26]. Nano drug-crystals have a greater dissolution rate owing
to a larger specific surface area; the development of successful nanocrystal
formulation by any of these bottom-up approaches depends on the stabilization
process. Curcumin crystal formation is a time-dependant process: after 90 min in a
solution of alcohol and water [27] curcumin crystals start to aggregate and form a
precipitate; the co-aggregation of surfactant molecules, including SDS, CTAB, Tween
80, Triton X-100 and pluronic polymers, form micelles at a CMC which can provide
the required influence to stabilize curcumin molecules [28]. However, cationic
micelles provide greater stability to curcumin even at elevated pH and are preferred
for their medicinal implications; similarly, also plasma proteins have been
documented as carriers for curcumin because of their ability to stabilize curcumin
molecules [29].
Polymer–drug conjugates are considered to be alternative therapeutics from
the nanoscale family. Two phenolic rings and active methylene groups are potential
sites to conjugate any biomacromolecules onto curcumin. For example Kumar et al.
designed nucleoside–curcumin bioconjugates to obtain high levels of glucuronide
and sulfate curcumin conjugates in healthy human volunteers [30]. Novel
polyethylene glycosylated (PEGylated) curcumin analogs have been also proposed
to improve curcumin solubility. PEGylated curcumin conjugates sowed also a key role
in growth inhibitory effects on a panel of human cancer cell lines [31]. In recent years,
emerging products consisting of polymer–curcumin nanoconjugates have proved

Chapter VII
163
useful for obtaining a higher cytotoxicity in cancer cells. The synergist activity is
dependent on the type of terminal functionality and molecular weight of the linker
chain. For example, a cationic poly(vinyl pyrrolidone)–curcumin (PVP–CUR)
conjugate formulation with stable particle size and ζ-potential with a pH range of 3–9
has been shown by MTT assay to be more potent in L929 fibroblast cells in
comparisons with free curcumin [32].
Microemulsions are isotropic nanostructural, stable solutions comprising
surfactants, oil and water. Curcumin-based microemulsions are expected to improve
curcumin delivery via local and transdermal routes for scleroderma, psoriasis and
skin cancer. Eucalyptol-based curcumin microemulsions have very high permeability
and flux with moderate solubility of curcumin compared with many oleic acid- and
esteem oil-based microemulsions [33]. The enhanced penetration capacity of this
applied curcumin microemulsion formulation, as well as its effect on the cellular
structure of skin, has been observed.
Liposomes comprise artificial phospholipid vesicles, considered to be
biologically safe, biocompatible and protect drugs from external stimuli. It has been
known that an extended absorption capacity of curcumin can be attained by
dissolving, mixing or complexing it with different types of phospholipids [34]. A recent
pharmacokinetic study of solid lipid curcumin NPs in patients with osteosarcoma
reported up to 31.42–41.15 ng mL−1 of curcumin within 4 h of 2000–4000 mg oral
dose treatment [35]. More importantly, the patients did not experience any adverse
effects.
Curcumin loaded into polymeric NPs has been an alternative choice to
enhance the bioavailability of the drug exploiting the controlled release of such
polymer matrix. For example different PLGA nanoformulations has been a
Chapter VII
164
widespread choice in the production of a variety of biomedical devices owing to its
biodegradability and biocompatibility. In an effort to create a safe carrier, several
different types of PLGA NP for curcumin encapsulation have been explored by
simple solid–oil–water solvent evaporation method [36,37], in which the particle size
can be controlled by the surfactant concentration and sonication time. In vivo mice
studies using this type of formulation resulted in a ten-fold increase in the
concentration of curcumin blood, lungs and brain compared with curcumin dissolved
in PEG400 formulation [38]. In a recent work, Tsai et al. [39] designed curcumin-
loaded PLGA and demonstrated the half-life of curcumin in the cerebral cortex and
hippocampus to be significantly increased from 2.32 to 19.9; additionally, retention
time values of the cerebral cortex and the hippocampus have been increased
approximately 2.0- and 1.8-fold, respectively. The curcumin plasma levels have been
slightly higher with this nanoformulation compared to the normal administration
vehicles.
The characteristics of these curcumin nanoformulations can be tailored
according to the specific requirement for inducing cellular death by various
mechanisms. Overall, our understanding from the available literature is that the use
of curcumin nanoconstructs as drug for cancer treatment is a facile modality that
improves existing curcumin therapies by targeting tumors and by reducing the dose
required. Safe toxicological profiles of the various curcumin nanoformulations and
their efficacy in the cell-line models highlight their potential for evaluation in in vivo
models. Human trials need to be conducted to establish their effectiveness in clinical
applications as an improved therapeutic modality. Therefore, future studies that
combine curcumin delivery with other first-line anticancer chemotherapeutic agents or
imaging, contrast, antibody or peptide-targeted delivery are going to achieve better-
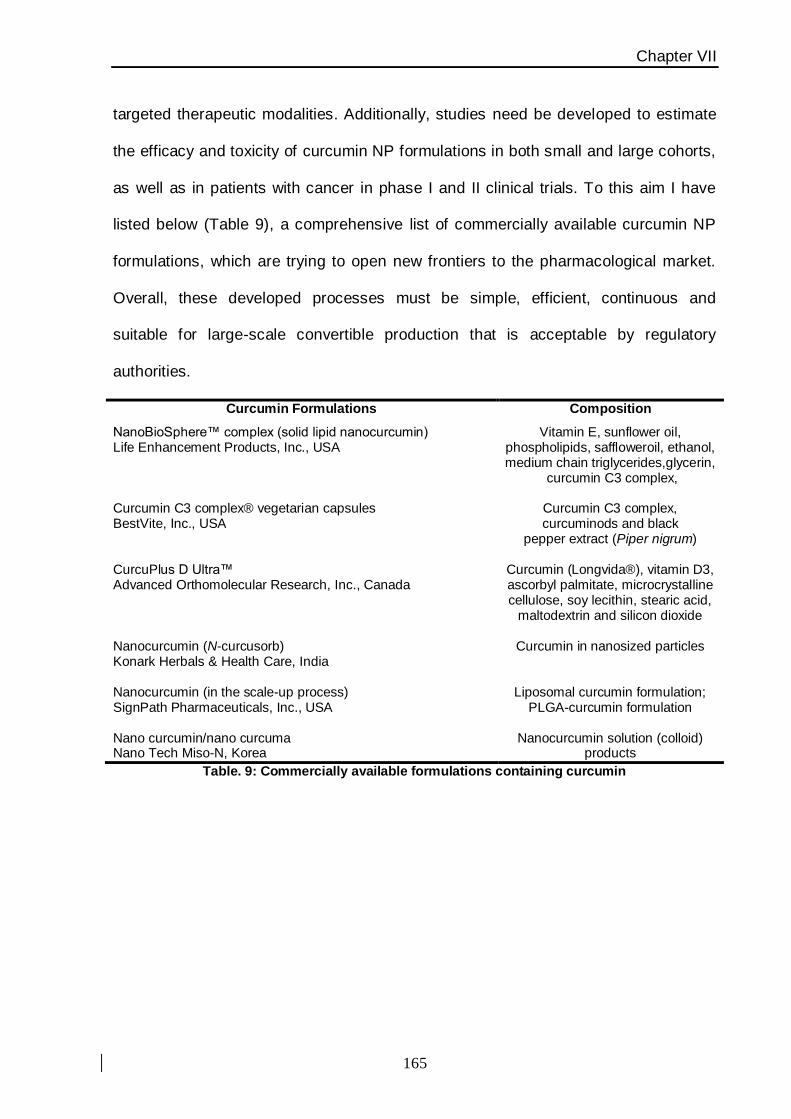
Chapter VII
165
targeted therapeutic modalities. Additionally, studies need be developed to estimate
the efficacy and toxicity of curcumin NP formulations in both small and large cohorts,
as well as in patients with cancer in phase I and II clinical trials. To this aim I have
listed below (Table 9), a comprehensive list of commercially available curcumin NP
formulations, which are trying to open new frontiers to the pharmacological market.
Overall, these developed processes must be simple, efficient, continuous and
suitable for large-scale convertible production that is acceptable by regulatory
authorities.
Curcumin Formulations Composition
NanoBioSphere™ complex (solid lipid nanocurcumin) Life Enhancement Products, Inc., USA
Vitamin E, sunflower oil, phospholipids, saffloweroil, ethanol, medium chain triglycerides,glycerin,
curcumin C3 complex,
Curcumin C3 complex® vegetarian capsules BestVite, Inc., USA
Curcumin C3 complex, curcuminods and black
pepper extract (Piper nigrum)
CurcuPlus D Ultra™ Advanced Orthomolecular Research, Inc., Canada
Curcumin (Longvida®), vitamin D3, ascorbyl palmitate, microcrystalline cellulose, soy lecithin, stearic acid,
maltodextrin and silicon dioxide
Nanocurcumin (N-curcusorb) Konark Herbals & Health Care, India
Curcumin in nanosized particles
Nanocurcumin (in the scale-up process) SignPath Pharmaceuticals, Inc., USA
Liposomal curcumin formulation; PLGA-curcumin formulation
Nano curcumin/nano curcuma Nano Tech Miso-N, Korea
Nanocurcumin solution (colloid) products
Table. 9: Commercially available formulations containing curcumin
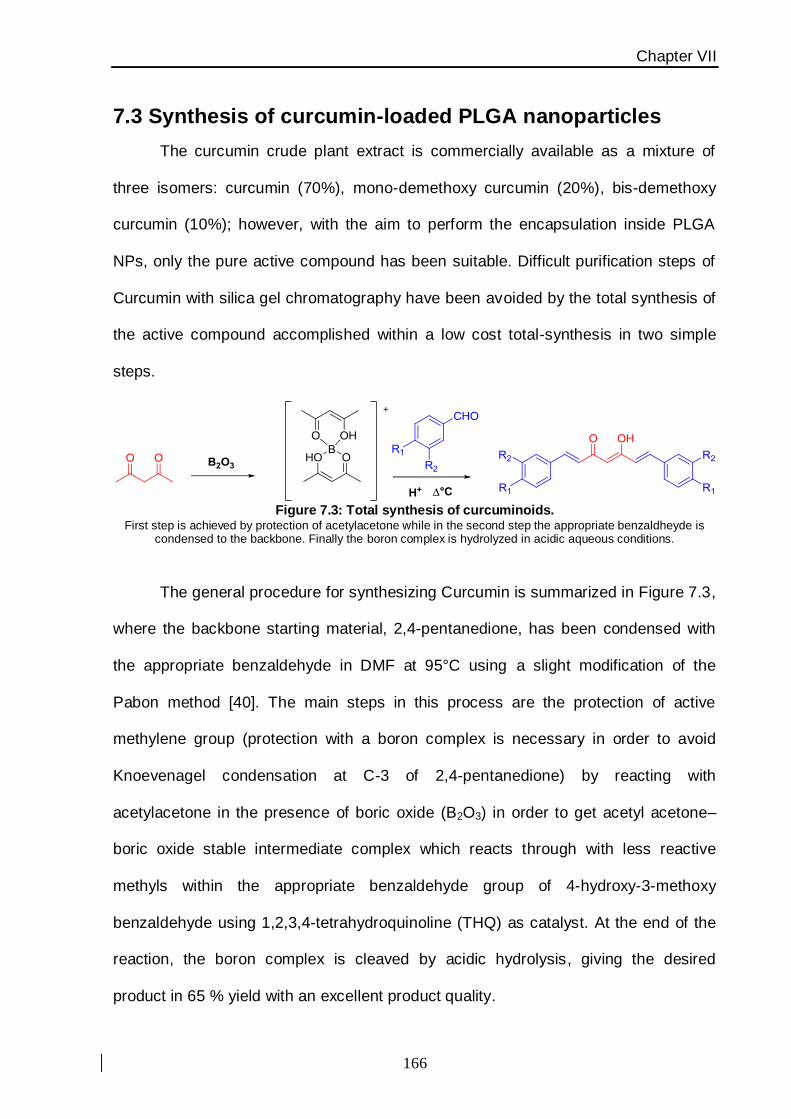
Chapter VII
166
7.3 Synthesis of curcumin-loaded PLGA nanoparticles
The curcumin crude plant extract is commercially available as a mixture of
three isomers: curcumin (70%), mono-demethoxy curcumin (20%), bis-demethoxy
curcumin (10%); however, with the aim to perform the encapsulation inside PLGA
NPs, only the pure active compound has been suitable. Difficult purification steps of
Curcumin with silica gel chromatography have been avoided by the total synthesis of
the active compound accomplished within a low cost total-synthesis in two simple
steps.
Figure 7.3: Total synthesis of curcuminoids. First step is achieved by protection of acetylacetone while in the second step the appropriate benzaldheyde is
condensed to the backbone. Finally the boron complex is hydrolyzed in acidic aqueous conditions.
The general procedure for synthesizing Curcumin is summarized in Figure 7.3,
where the backbone starting material, 2,4-pentanedione, has been condensed with
the appropriate benzaldehyde in DMF at 95°C using a slight modification of the
Pabon method [40]. The main steps in this process are the protection of active
methylene group (protection with a boron complex is necessary in order to avoid
Knoevenagel condensation at C-3 of 2,4-pentanedione) by reacting with
acetylacetone in the presence of boric oxide (B2O3) in order to get acetyl acetone–
boric oxide stable intermediate complex which reacts through with less reactive
methyls within the appropriate benzaldehyde group of 4-hydroxy-3-methoxy
benzaldehyde using 1,2,3,4-tetrahydroquinoline (THQ) as catalyst. At the end of the
reaction, the boron complex is cleaved by acidic hydrolysis, giving the desired
product in 65 % yield with an excellent product quality.
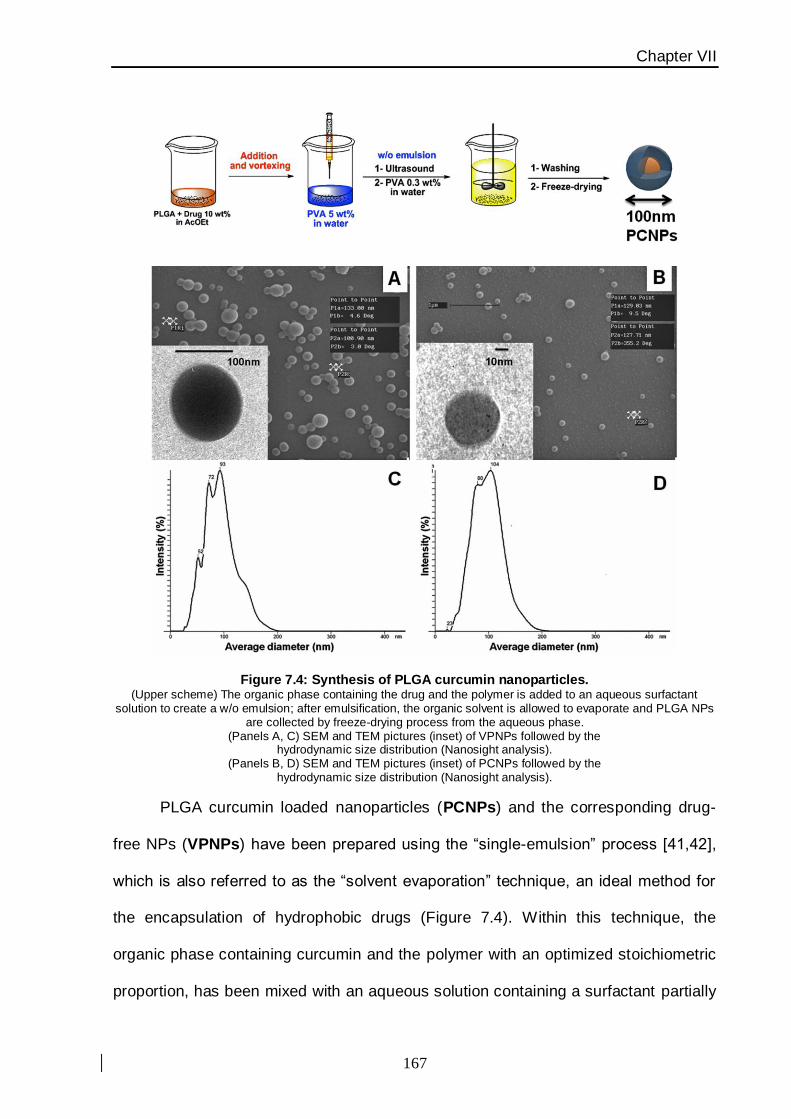
Chapter VII
167
Figure 7.4: Synthesis of PLGA curcumin nanoparticles. (Upper scheme) The organic phase containing the drug and the polymer is added to an aqueous surfactant
solution to create a w/o emulsion; after emulsification, the organic solvent is allowed to evaporate and PLGA NPs are collected by freeze-drying process from the aqueous phase.
(Panels A, C) SEM and TEM pictures (inset) of VPNPs followed by the hydrodynamic size distribution (Nanosight analysis).
(Panels B, D) SEM and TEM pictures (inset) of PCNPs followed by the hydrodynamic size distribution (Nanosight analysis).
PLGA curcumin loaded nanoparticles (PCNPs) and the corresponding drug-
free NPs (VPNPs) have been prepared using the “single-emulsion” process [41,42],
which is also referred to as the “solvent evaporation” technique, an ideal method for
the encapsulation of hydrophobic drugs (Figure 7.4). Within this technique, the
organic phase containing curcumin and the polymer with an optimized stoichiometric
proportion, has been mixed with an aqueous solution containing a surfactant partially
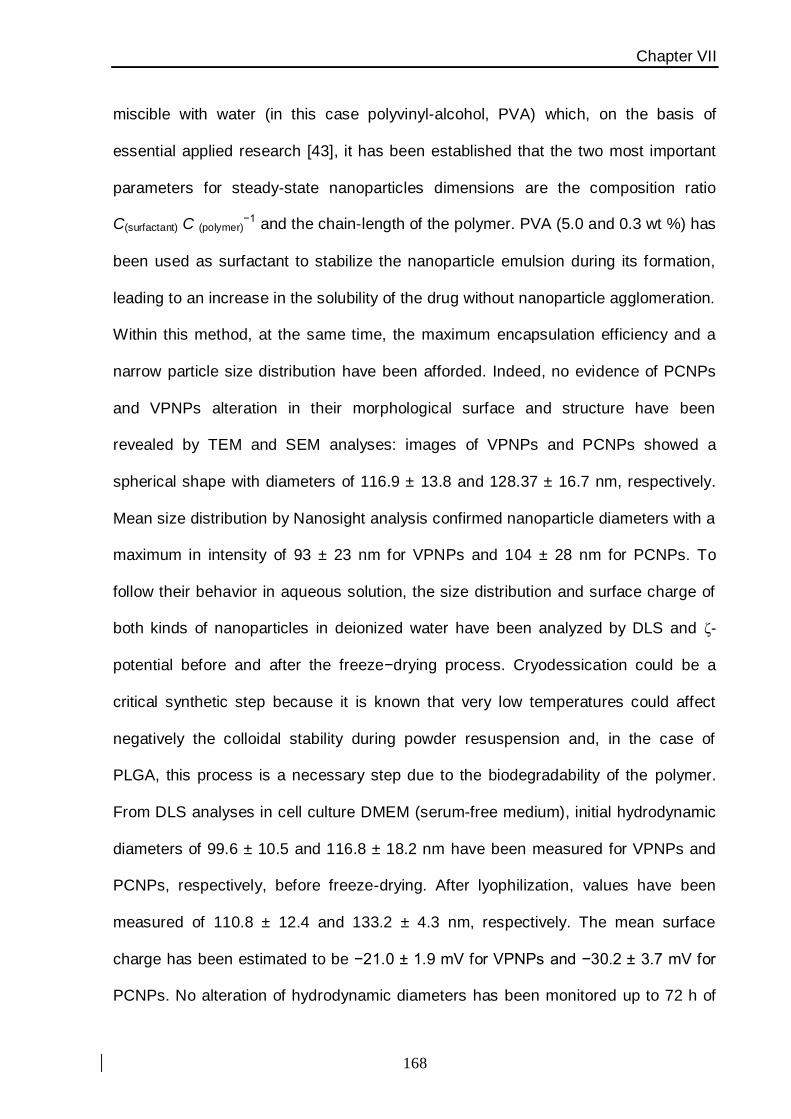
Chapter VII
168
miscible with water (in this case polyvinyl-alcohol, PVA) which, on the basis of
essential applied research [43], it has been established that the two most important
parameters for steady-state nanoparticles dimensions are the composition ratio
C(surfactant) C (polymer)−1 and the chain-length of the polymer. PVA (5.0 and 0.3 wt %) has
been used as surfactant to stabilize the nanoparticle emulsion during its formation,
leading to an increase in the solubility of the drug without nanoparticle agglomeration.
Within this method, at the same time, the maximum encapsulation efficiency and a
narrow particle size distribution have been afforded. Indeed, no evidence of PCNPs
and VPNPs alteration in their morphological surface and structure have been
revealed by TEM and SEM analyses: images of VPNPs and PCNPs showed a
spherical shape with diameters of 116.9 ± 13.8 and 128.37 ± 16.7 nm, respectively.
Mean size distribution by Nanosight analysis confirmed nanoparticle diameters with a
maximum in intensity of 93 ± 23 nm for VPNPs and 104 ± 28 nm for PCNPs. To
follow their behavior in aqueous solution, the size distribution and surface charge of
both kinds of nanoparticles in deionized water have been analyzed by DLS and ζ-
potential before and after the freeze−drying process. Cryodessication could be a
critical synthetic step because it is known that very low temperatures could affect
negatively the colloidal stability during powder resuspension and, in the case of
PLGA, this process is a necessary step due to the biodegradability of the polymer.
From DLS analyses in cell culture DMEM (serum-free medium), initial hydrodynamic
diameters of 99.6 ± 10.5 and 116.8 ± 18.2 nm have been measured for VPNPs and
PCNPs, respectively, before freeze-drying. After lyophilization, values have been
measured of 110.8 ± 12.4 and 133.2 ± 4.3 nm, respectively. The mean surface
charge has been estimated to be −21.0 ± 1.9 mV for VPNPs and −30.2 ± 3.7 mV for
PCNPs. No alteration of hydrodynamic diameters has been monitored up to 72 h of

Chapter VII
169
incubation for both nanoparticle formulations following the freeze−drying step (Figure
7.5).
Figure 7.5: Aggregation kinetic of PLGA NPs in DMEM before and after lyophilization. (Panel A) VPNPs (dark grey histogram) and PCNPs (red histogram).
(Panel B) VPNPs, 50 μg mL−1
(light grey histogram) and, 100 μg mL−1
(dark grey histogram); PCNPs, 50 μg mL−1
, (orange histogram) and 100 μg mL
−1 (red histogram).
To find out the optimal
concentration of nanoparticles and their
potential use as drug delivery system,
the critical micelle concentration (CMC)
has been evaluated of VPNPs using
pyrene as a fluorescent probe (Figure
7.6). This technique enables the
opportunity to calculate the lower
concentration limit of nanoparticles in
aqueous solution. From the
fluorescence graph, the mean intensity
ratios (I338 / I334) of pyrene excitation
spectra increased by increasing polymer
concentration. Since the increment in the
Figure 7.6: CMC evaluation of PLGA NPs. (Upper level) Fluorescence excitation spectra using
increasing amount of VPNPs in a range between 5.0 x 10
−5 g L
−1 and 1.0 g L
−1.
(Lower level) Interpolation curve of the data.
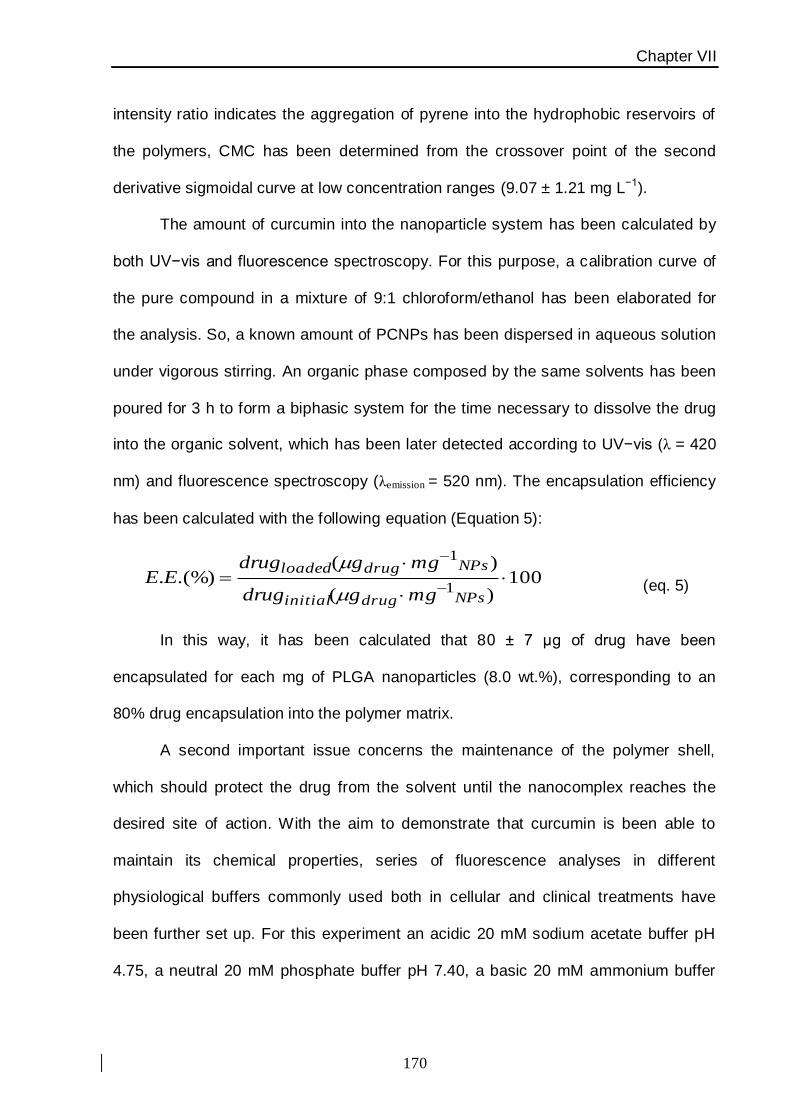
Chapter VII
170
intensity ratio indicates the aggregation of pyrene into the hydrophobic reservoirs of
the polymers, CMC has been determined from the crossover point of the second
derivative sigmoidal curve at low concentration ranges (9.07 ± 1.21 mg L−1).
The amount of curcumin into the nanoparticle system has been calculated by
both UV−vis and fluorescence spectroscopy. For this purpose, a calibration curve of
the pure compound in a mixture of 9:1 chloroform/ethanol has been elaborated for
the analysis. So, a known amount of PCNPs has been dispersed in aqueous solution
under vigorous stirring. An organic phase composed by the same solvents has been
poured for 3 h to form a biphasic system for the time necessary to dissolve the drug
into the organic solvent, which has been later detected according to UV−vis (λ = 420
nm) and fluorescence spectroscopy (λemission = 520 nm). The encapsulation efficiency
has been calculated with the following equation (Equation 5):
100)(
)(.(%).
1
1
NPsdruginitial
NPsdrugloaded
mggdrug
mggdrugEE
(eq. 5)
In this way, it has been calculated that 80 ± 7 μg of drug have been
encapsulated for each mg of PLGA nanoparticles (8.0 wt.%), corresponding to an
80% drug encapsulation into the polymer matrix.
A second important issue concerns the maintenance of the polymer shell,
which should protect the drug from the solvent until the nanocomplex reaches the
desired site of action. With the aim to demonstrate that curcumin is been able to
maintain its chemical properties, series of fluorescence analyses in different
physiological buffers commonly used both in cellular and clinical treatments have
been further set up. For this experiment an acidic 20 mM sodium acetate buffer pH
4.75, a neutral 20 mM phosphate buffer pH 7.40, a basic 20 mM ammonium buffer
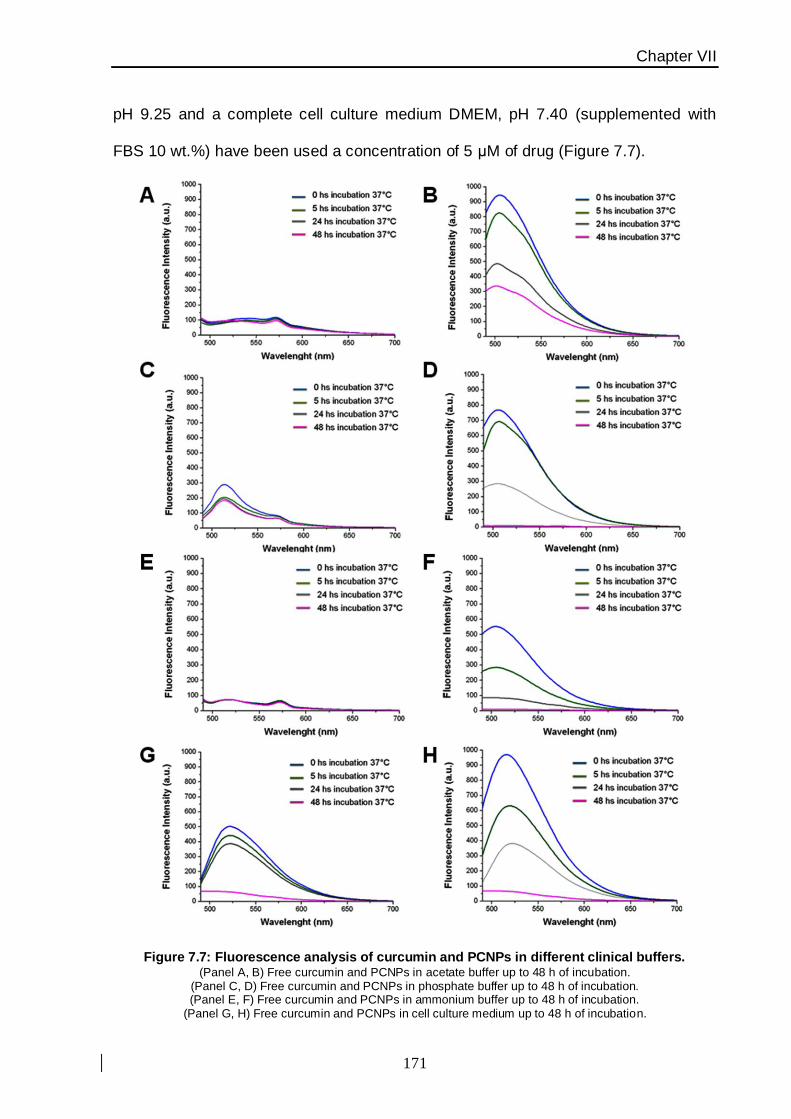
Chapter VII
171
pH 9.25 and a complete cell culture medium DMEM, pH 7.40 (supplemented with
FBS 10 wt.%) have been used a concentration of 5 μM of drug (Figure 7.7).
Figure 7.7: Fluorescence analysis of curcumin and PCNPs in different clinical buffers. (Panel A, B) Free curcumin and PCNPs in acetate buffer up to 48 h of incubation.
(Panel C, D) Free curcumin and PCNPs in phosphate buffer up to 48 h of incubation. (Panel E, F) Free curcumin and PCNPs in ammonium buffer up to 48 h of incubation.
(Panel G, H) Free curcumin and PCNPs in cell culture medium up to 48 h of incubation.
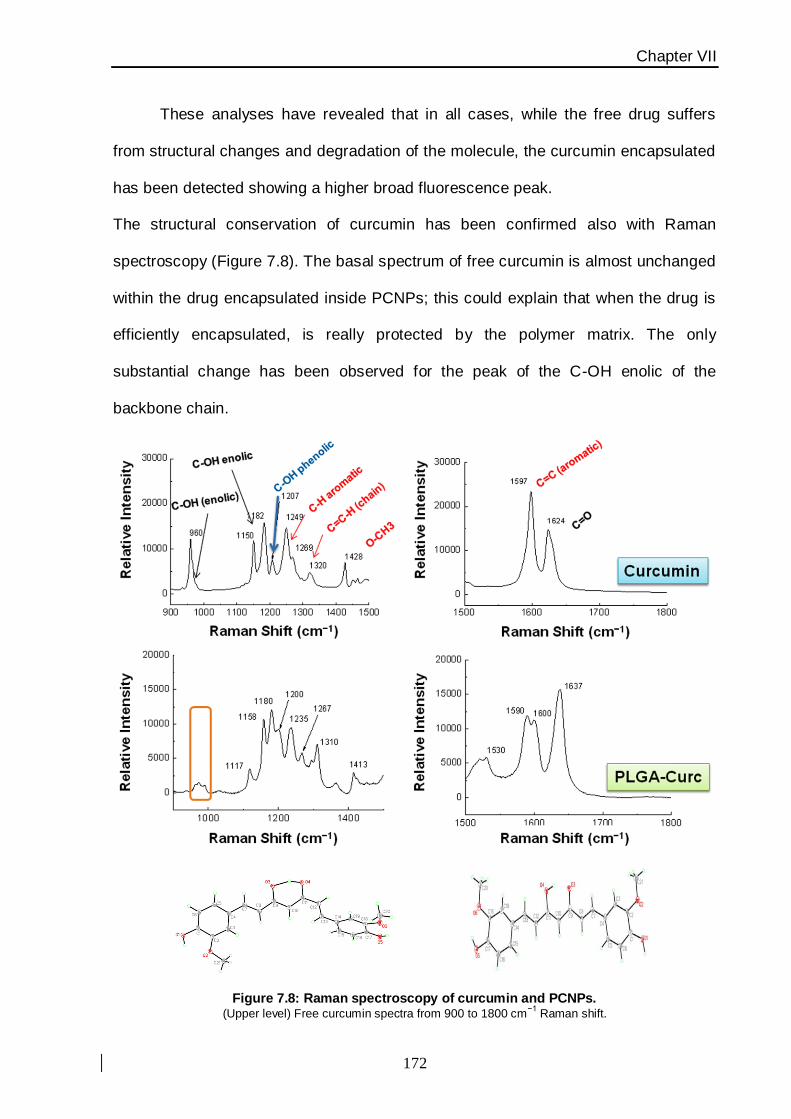
Chapter VII
172
These analyses have revealed that in all cases, while the free drug suffers
from structural changes and degradation of the molecule, the curcumin encapsulated
has been detected showing a higher broad fluorescence peak.
The structural conservation of curcumin has been confirmed also with Raman
spectroscopy (Figure 7.8). The basal spectrum of free curcumin is almost unchanged
within the drug encapsulated inside PCNPs; this could explain that when the drug is
efficiently encapsulated, is really protected by the polymer matrix. The only
substantial change has been observed for the peak of the C-OH enolic of the
backbone chain.
Figure 7.8: Raman spectroscopy of curcumin and PCNPs. (Upper level) Free curcumin spectra from 900 to 1800 cm
−1 Raman shift.
Chapter VII
173
(Lower level) PCNPs spectra from 900 to 1800 cm−1
Raman shift. (3D pictures) on the left the crystal structure of free curcumin and on the right a possible explanation of the
conformational change occurred within the encapsulation of the drug inside PLGA NPs
Since it is explained in literature [44] that the enolic form of curcumin is
predominant despite the diketonic structure because the former is enthalpy−favored
due to the role of its hydrogen bond which leads to the formation of a pseudo six-
membered ring in that specific position. The molecular nature of this flexible structure
obliges the second aromatic ring to turn into a different plane with respect to the first
aromatic ring. Instead, when curcumin is really encapsulated into PLGA, the structure
of its enolic form turns into a more rigid and fully conjugated structure. For this
reason, also the two aromatic rings are seized in the same plane. This circumstances
can also strengthen the concept of the observed higher fluorescence intensity of
drugs when they are protected by the polymer matrix.
Chapter VII
174
7.4 In vitro drug release kinetics
Over recent years, drug release/dissolution from pharmaceutical dosage
nanovectors has been the subject of intense and profitable scientific developments.
Whenever a new solid dosage form is produced, it is necessary to ensure that drug
dissolution occurs in an appropriate way; for this purpose the pharmaceutical industry
and the registration authorities are focusing, nowadays, on the quantitative analysis
of the values obtained in drug dissolution/release kinetics. In some cases, these
mathematic models are derived from the theoretical analysis of the occurring
process, but in most cases the theoretical concept is not applicable and some
empirical equations have proved to be more appropriate (see for examples, drug
dissolution profiles from Hixson-Crowell, Weibull, Higuchi, Baker-Lonsdale,
Korsmeyer-Peppas and Hopfenberg) [45]. The kinetic of drug release has been
described by these models in which the dissolved amount of drug (Q) is a function of
the test time, t or Q = f(t) where it represents the amount of drug dissolved in time t.
Generally, for a water-soluble drug incorporated in a matrix, the active agent is
mainly released by dissolution drug dissolution while for a low water-soluble drug, the
self-erosion of the matrix is the principal release mechanism. To accomplish these
studies, the cumulative profiles of the dissolved drug are more commonly used in
opposition to their differential profiles. To compare dissolution profiles between two
drug products model dependent (curve fitting) and statistical analysis can be used
[46].
Based on these general considerations, our in vitro release kinetics has been
performed to have access to fundamental implications about the porosity of our
nanoformulation on a molecular level, possible interactions between drug and the
external environment or the polymer matrix and their influence on the mechanism

Chapter VII
175
and rate of drug release. The release study has been performed with the dissolution
technique (see also “sample and separate methods”) as described in literature [46].
This is the most widely used technique; briefly, PCNPs have been introduced into a
vessel containing media and release has been monitored over time. Media selection
is based on drug solubility and stability over the duration of the release study and the
container selection has been chosen on the basis of the volume of dissolution media
necessary to maintain sink conditions without compromising the sensitivity of the
assay in 150 mM PBS pH 7.4 supplemented with BSA 2.0 wt.% with the aim to
enhance curcumin dissolution and mimic a biological environment. PCNPs
suspension has been maintained at 37 °C with gentle stirring and small amounts of
sample have been withdrawn at fixed times, NPs has been separated from
supernatant and resuspended in the same volume of fresh medium to mimic a
physiological sink condition. All samples have been analyzed by Uv-vis (λ = 420nm)
and quantified according the calibration curve constructed previously with the same
buffer. As expected, it has been observed an initial “burst effect” in drug release in
the first 24 h of incubation (50.3 ± 6.5%); these values increased up to 73.3 ± 8.0%
within the following 72 h (overall 4 days). Next, the release of residual cargo became
very slow and the curve slope decreased to reach a plateau corresponding to a
maximum after 10 days (81.3 ± 2.3%) (Figure 7.9). Thus, it was clear that the
incorporation of curcumin in PLGA nanoparticles could significantly sustain its
continuous and prolonged release. The data obtained from kinetic studies was fitted
according to the Korsmeyer−Peppas model (Equation 6)
btnkf
tkf
t
nt
)log(loglog (eq. 6)

Chapter VII
176
Where ft is the fractional drug release, k is the release constant, t is the time of
release and n is the release exponent, which determines the type of kinetics.
Figure 7.9: In vitro drug release kinetic. (Left) Drug diffusion profile of curcumin from PCNPs using the dissolution technique
Values represent mean ± SD of three batches (some error bars are too small to be shown). Below the Kinetic calculation of the drug release rate keeping into consideration the Peppas−Korsmeyes’s model.
(Right) The full equation used to build up the kinetic curve) and the data recorded to explain the Fickian Law diffusion model of our nanoformulation.
The regression coefficient of log ft vs. log t has been calculated to be 0.972,
with values of release exponent (n) and release constant (k) of 0.456 and 0.674,
respectively. By this calculation, it has been demonstrated that our release follows a
Fickian-law diffusion with a release exponent of 0.45, according to data recorded for
cylindrical polymer devices adapted for intravenous administration. For the
determination of the exponent (n), the linear portion of the kinetic curve until the
fractional release amount reached 60% has been investigated.

Chapter VII
177
7.5 Toxicity evaluation: Cancer Cell cycle arrest induced by
curcumin-PLGA nanocarrier
MCF7 breast cancer cells have
been chosen as a cellular model to study
the effects of PCNPs and VPNPs (control).
The cellular viability has been first
investigated by measuring the cell
proliferation by means of the MTT specific
assay (Figure 7.10), after long-time NPs
exposure on cells (72 h overall) at
concentrations of 50 and 100 μg mL−1
(corresponding to 10 μM and 20 μM,
respectively). Treatment with VPNPs has
been showed not to alter cell proliferation,
indicating that the PLGA vector is nontoxic
even after prolonged exposure time. On
the other hand, treatment with PCNPs
(compared with direct biological effect of
curcumin in these cells) has revealed a
huge decrease of cellular proliferation in a
dose- and time-dependent way. In contrast
to VPNPs, MTT assay revealed that, ready
after 24 h, the lower dosage of PCNPs
efficiently triggered the inhibition of tumor
proliferation and this value increased by
Figure 7.10: MTT assay of VPNPs, PCNPs and free curcumin
MCF7 breast cancer cells in the presence of: (Panel A) VPNPs (50 and 100 μg mL
−1)
(Panel B) PCNPs (50 and 100 μg mL−1)
(Panel C) free curcumin (20 and 40 μM)
Untreated cells were used as control 100% of the proliferation. Values are mean ± SD of three independent sets of experiments. Analyzed by
one-way ANOVA, samples show statistical difference at *p ≤ 0.05 and **p ≤ 0.01.
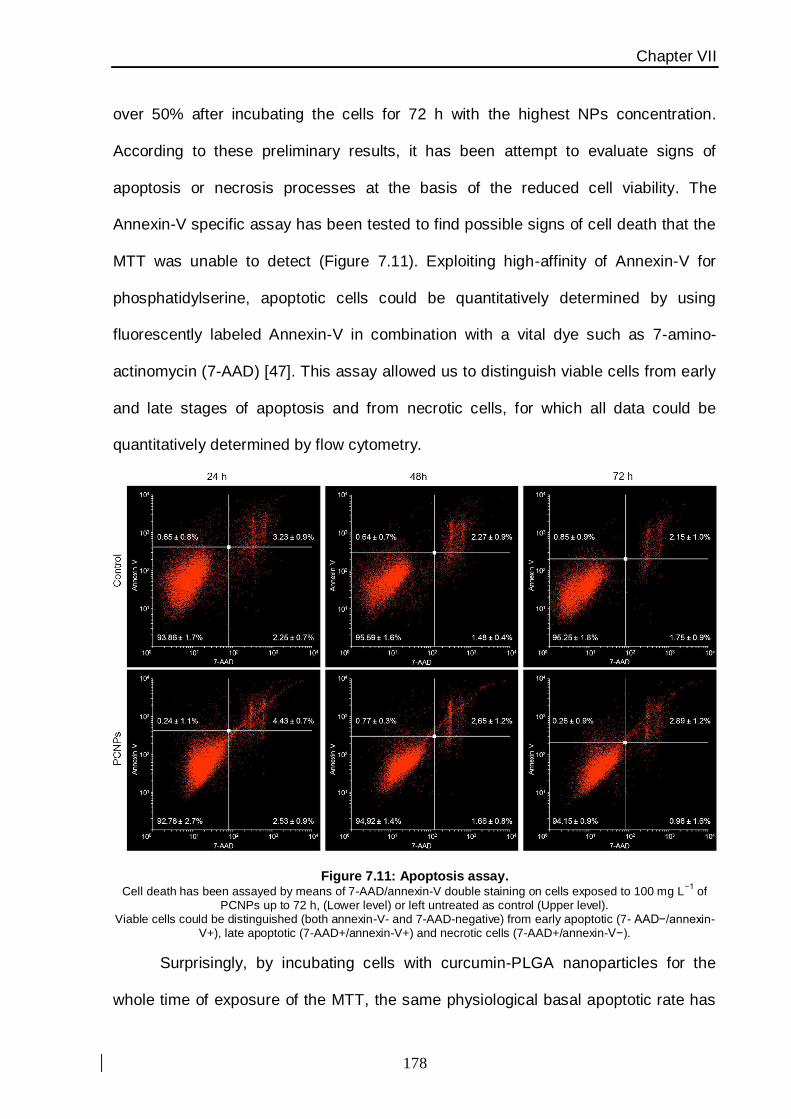
Chapter VII
178
over 50% after incubating the cells for 72 h with the highest NPs concentration.
According to these preliminary results, it has been attempt to evaluate signs of
apoptosis or necrosis processes at the basis of the reduced cell viability. The
Annexin-V specific assay has been tested to find possible signs of cell death that the
MTT was unable to detect (Figure 7.11). Exploiting high-affinity of Annexin-V for
phosphatidylserine, apoptotic cells could be quantitatively determined by using
fluorescently labeled Annexin-V in combination with a vital dye such as 7-amino-
actinomycin (7-AAD) [47]. This assay allowed us to distinguish viable cells from early
and late stages of apoptosis and from necrotic cells, for which all data could be
quantitatively determined by flow cytometry.
Figure 7.11: Apoptosis assay. Cell death has been assayed by means of 7-AAD/annexin-V double staining on cells exposed to 100 mg L
−1 of
PCNPs up to 72 h, (Lower level) or left untreated as control (Upper level). Viable cells could be distinguished (both annexin-V- and 7-AAD-negative) from early apoptotic (7- AAD−/annexin-
V+), late apoptotic (7-AAD+/annexin-V+) and necrotic cells (7-AAD+/annexin-V−).
Surprisingly, by incubating cells with curcumin-PLGA nanoparticles for the
whole time of exposure of the MTT, the same physiological basal apoptotic rate has
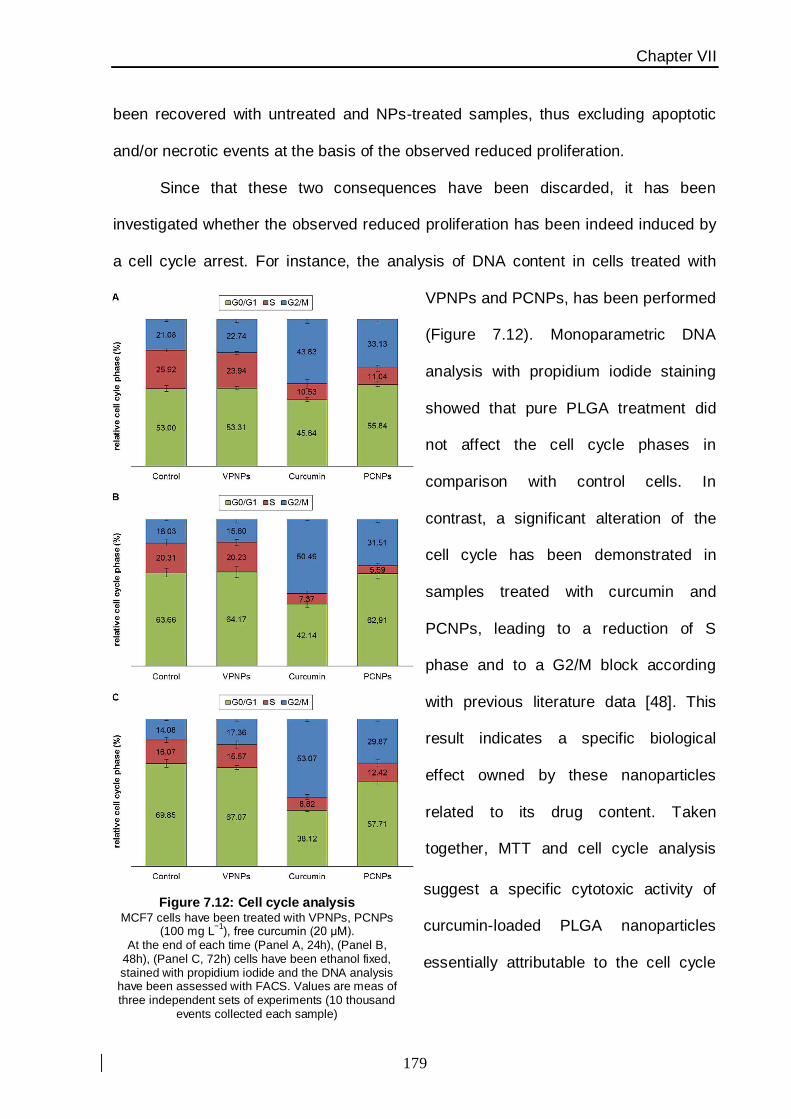
Chapter VII
179
been recovered with untreated and NPs-treated samples, thus excluding apoptotic
and/or necrotic events at the basis of the observed reduced proliferation.
Since that these two consequences have been discarded, it has been
investigated whether the observed reduced proliferation has been indeed induced by
a cell cycle arrest. For instance, the analysis of DNA content in cells treated with
VPNPs and PCNPs, has been performed
(Figure 7.12). Monoparametric DNA
analysis with propidium iodide staining
showed that pure PLGA treatment did
not affect the cell cycle phases in
comparison with control cells. In
contrast, a significant alteration of the
cell cycle has been demonstrated in
samples treated with curcumin and
PCNPs, leading to a reduction of S
phase and to a G2/M block according
with previous literature data [48]. This
result indicates a specific biological
effect owned by these nanoparticles
related to its drug content. Taken
together, MTT and cell cycle analysis
suggest a specific cytotoxic activity of
curcumin-loaded PLGA nanoparticles
essentially attributable to the cell cycle
Figure 7.12: Cell cycle analysis MCF7 cells have been treated with VPNPs, PCNPs
(100 mg L−1
), free curcumin (20 μM). At the end of each time (Panel A, 24h), (Panel B,
48h), (Panel C, 72h) cells have been ethanol fixed, stained with propidium iodide and the DNA analysis have been assessed with FACS. Values are meas of three independent sets of experiments (10 thousand
events collected each sample)
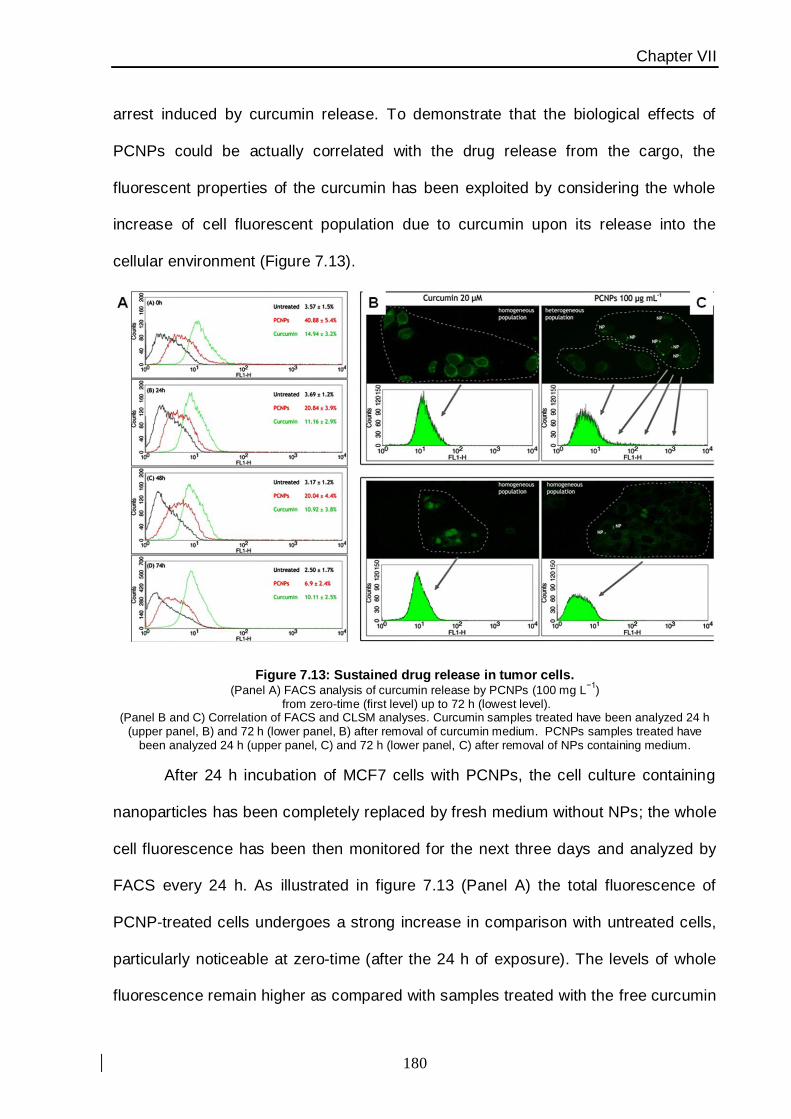
Chapter VII
180
arrest induced by curcumin release. To demonstrate that the biological effects of
PCNPs could be actually correlated with the drug release from the cargo, the
fluorescent properties of the curcumin has been exploited by considering the whole
increase of cell fluorescent population due to curcumin upon its release into the
cellular environment (Figure 7.13).
Figure 7.13: Sustained drug release in tumor cells. (Panel A) FACS analysis of curcumin release by PCNPs (100 mg L
−1)
from zero-time (first level) up to 72 h (lowest level). (Panel B and C) Correlation of FACS and CLSM analyses. Curcumin samples treated have been analyzed 24 h
(upper panel, B) and 72 h (lower panel, B) after removal of curcumin medium. PCNPs samples treated have been analyzed 24 h (upper panel, C) and 72 h (lower panel, C) after removal of NPs containing medium.
After 24 h incubation of MCF7 cells with PCNPs, the cell culture containing
nanoparticles has been completely replaced by fresh medium without NPs; the whole
cell fluorescence has been then monitored for the next three days and analyzed by
FACS every 24 h. As illustrated in figure 7.13 (Panel A) the total fluorescence of
PCNP-treated cells undergoes a strong increase in comparison with untreated cells,
particularly noticeable at zero-time (after the 24 h of exposure). The levels of whole
fluorescence remain higher as compared with samples treated with the free curcumin
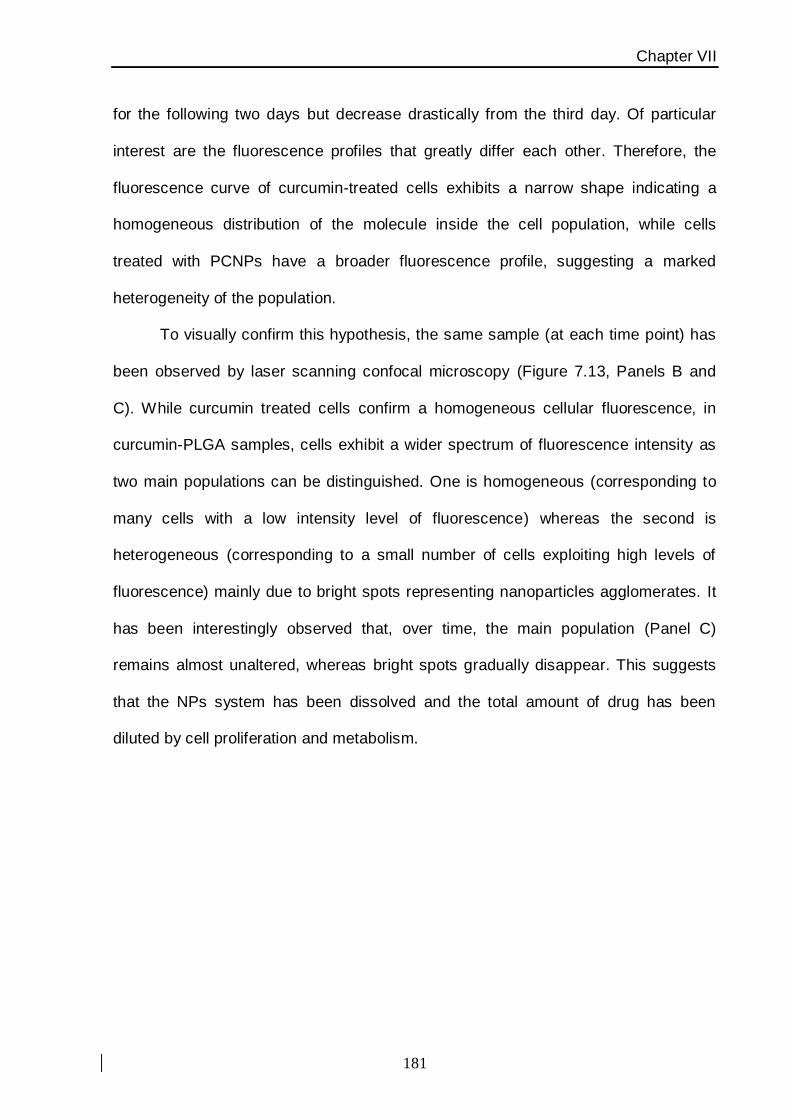
Chapter VII
181
for the following two days but decrease drastically from the third day. Of particular
interest are the fluorescence profiles that greatly differ each other. Therefore, the
fluorescence curve of curcumin-treated cells exhibits a narrow shape indicating a
homogeneous distribution of the molecule inside the cell population, while cells
treated with PCNPs have a broader fluorescence profile, suggesting a marked
heterogeneity of the population.
To visually confirm this hypothesis, the same sample (at each time point) has
been observed by laser scanning confocal microscopy (Figure 7.13, Panels B and
C). While curcumin treated cells confirm a homogeneous cellular fluorescence, in
curcumin-PLGA samples, cells exhibit a wider spectrum of fluorescence intensity as
two main populations can be distinguished. One is homogeneous (corresponding to
many cells with a low intensity level of fluorescence) whereas the second is
heterogeneous (corresponding to a small number of cells exploiting high levels of
fluorescence) mainly due to bright spots representing nanoparticles agglomerates. It
has been interestingly observed that, over time, the main population (Panel C)
remains almost unaltered, whereas bright spots gradually disappear. This suggests
that the NPs system has been dissolved and the total amount of drug has been
diluted by cell proliferation and metabolism.
Chapter VII
182
7.6 Conclusions and outlooks
Among the different biodegradable polymers developed to formulate polymeric
nanoparticles, PLGA has attracted nowadays considerable attention due to its
attractive properties: (i) biodegradability and biocompatibility; (ii) FDA and European
Medicine Agency approval in drug delivery systems for parenteral administration; (iii)
formulations and methods of production adapted to various types of drugs (e.g.
hydrophilic or hydrophobic small molecules or macromolecules); (iv) protection of
drug from degradation; (v) capability of sustained release; (vi) possibility to modify
surface properties to provide better interaction with biological materials and (vii)
possibility to target nanoparticles to specific organs or cells.
Within this project, PLGA bearing the naturally available nutraceutic agent
curcumin, have been synthesized and characterized. Their effects related to the drug
release have been investigated in vitro in MCF7 breast cancer cells. This study has
demonstrated that, while PLGA nanoparticles proved to be completely innocuous
toward cells in absence of drug, our drug-nanoformulation is able to release curcumin
intracellularly inducing time- and dose-dependent inhibition of proliferation as a
consequence of a G2/M block of the cell cycle.
This preclinical example clearly demonstrates that PLGA based nanoparticles
have proven potential for the treatment of breast cancer and our future perspective is
to modify the surface of the polymer with biomolecules in order to enhance specific
recognition of malignancies, making these polymeric devices a useful tools for
controlled and prolonged drug delivery system with the aim to help new generations
to prevent the widespread diffusion of severe tumor−associated diseases.
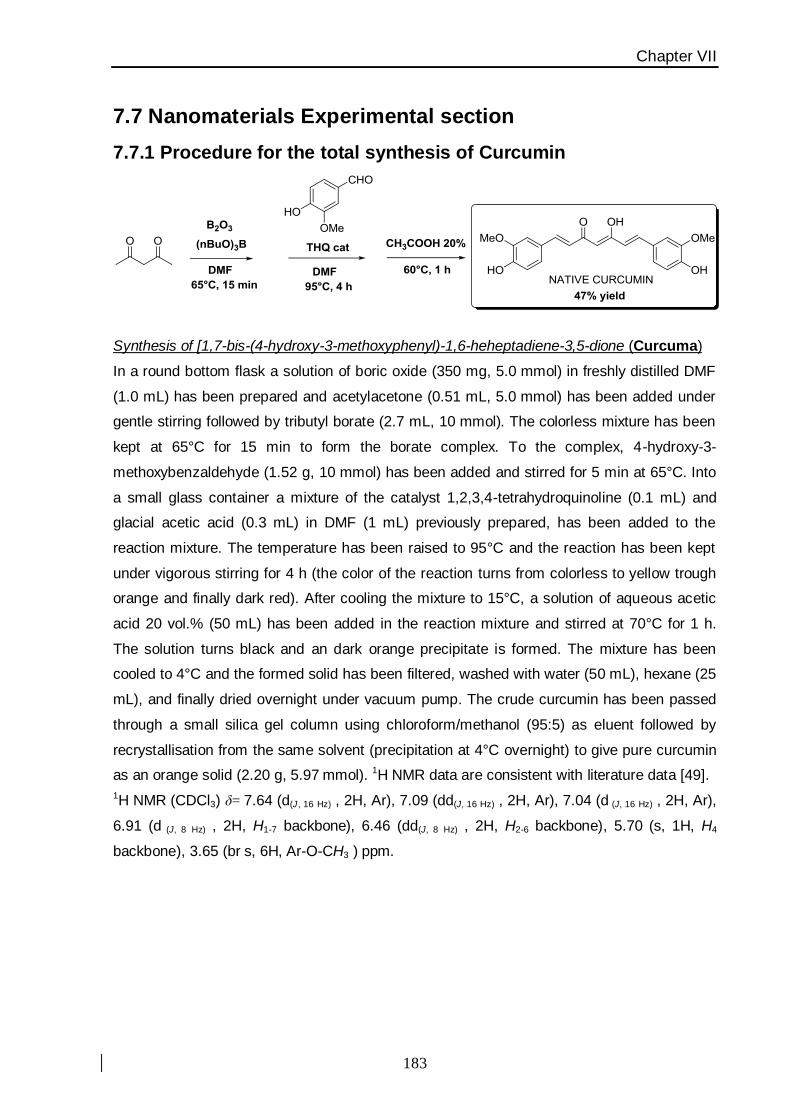
Chapter VII
183
7.7 Nanomaterials Experimental section
7.7.1 Procedure for the total synthesis of Curcumin
Synthesis of [1,7-bis-(4-hydroxy-3-methoxyphenyl)-1,6-heheptadiene-3,5-dione (Curcuma)
In a round bottom flask a solution of boric oxide (350 mg, 5.0 mmol) in freshly distilled DMF
(1.0 mL) has been prepared and acetylacetone (0.51 mL, 5.0 mmol) has been added under
gentle stirring followed by tributyl borate (2.7 mL, 10 mmol). The colorless mixture has been
kept at 65°C for 15 min to form the borate complex. To the complex, 4-hydroxy-3-
methoxybenzaldehyde (1.52 g, 10 mmol) has been added and stirred for 5 min at 65°C. Into
a small glass container a mixture of the catalyst 1,2,3,4-tetrahydroquinoline (0.1 mL) and
glacial acetic acid (0.3 mL) in DMF (1 mL) previously prepared, has been added to the
reaction mixture. The temperature has been raised to 95°C and the reaction has been kept
under vigorous stirring for 4 h (the color of the reaction turns from colorless to yellow trough
orange and finally dark red). After cooling the mixture to 15°C, a solution of aqueous acetic
acid 20 vol.% (50 mL) has been added in the reaction mixture and stirred at 70°C for 1 h.
The solution turns black and an dark orange precipitate is formed. The mixture has been
cooled to 4°C and the formed solid has been filtered, washed with water (50 mL), hexane (25
mL), and finally dried overnight under vacuum pump. The crude curcumin has been passed
through a small silica gel column using chloroform/methanol (95:5) as eluent followed by
recrystallisation from the same solvent (precipitation at 4°C overnight) to give pure curcumin
as an orange solid (2.20 g, 5.97 mmol). 1H NMR data are consistent with literature data [49].
1H NMR (CDCl3) δ= 7.64 (d(J, 16 Hz) , 2H, Ar), 7.09 (dd(J, 16 Hz) , 2H, Ar), 7.04 (d (J, 16 Hz) , 2H, Ar),
6.91 (d (J, 8 Hz) , 2H, H1-7 backbone), 6.46 (dd(J, 8 Hz) , 2H, H2-6 backbone), 5.70 (s, 1H, H4
backbone), 3.65 (br s, 6H, Ar-O-CH3 ) ppm.

Chapter VII
184
7.7.2 Synthesis of Curcumin-Loaded PLGA NPs (PCNPs)
In a glass vial a drug/polymer organic mixture has been prepared dissolving PLGA (50 mg,
1.5 μmol) and curcumin at 10 wt.% of the polymer (5 mg, 13.6 μmol) in ethyl acetate (500
μL). The mixture has been allowed to dissolve for 45 min with intermittent stirring and quick
sonication. Into another glass tube the aqueous surfactant solution composed of 5 wt.% PVA
solution (2 mL) has been prepared. The drug/polymer organic phase has been added
dropwise to the surfactant solution under vortexing and then it has been left under vigorous
stirring for additional 30 s. To create an oil-in-water emulsion, the formulation has been
treated with 3 cycles (30 s) of sonication and vortexing. Ultrasounds have been generated by
a tip-sonicator S15H Elmasonic Apparatus from Elma GmbH (Singen, Germany). At the end
of the cycles, the formed emulsion has been quickly poured into diluted aqueous surfactant
solution of 0.3 wt.% PVA (25 mL) under vigorous stirring for 3−4 h for NPs hardening and the
organic solvent evaporation. At the end of reaction, curcumin loaded nanoparticles (PCNPs)
have been collected by centrifugation at 8000 rcf for 15 min and washed three times with
deionized water (20 mL). The supernatant has been analyzed by DLS establish to exclude
PCNPs remained in solution. Nanoparticulate pellets have been resuspended in water (5 mL)
and finally dried by lyophilization using a Christ Alpha 1−2 D freeze-dryer. A fine yellow
powder has been obtained (38 mg).
Control drug-free nanoparticles (VPNPs) have been synthesized by the method described
with the exception of the drug molecule.
Chapter VII
185
Related References
[1] Hergueta-Redondo, M.; Palacios, J.; Cano, A. and Moreno-Buono, G.; Clin. Transl. Oncol. 2007,
10, 777–785.
[2] Dent, R.; Trudeau, M.; Pritchard, K. I.; Hanna, W. M.; Kahn, H. K. and Sawka, C. A.; Clin. Cancer.
Res. 2007, 13, 4429–4434.
[3] Sekine, C.; Shimizu, C.; Nishio, K.; Saijo, N. and Tamura, T.; J. Clin. Oncol. 2009, 14, 112–119.
[4] Pohlmann, P. R.; Mayer, I. A. and Mernaugh, R.; Clin. Cancer. Res. 2009, 15, 7429–7491.
[5] Volinia, S.; Galasso, M.; Sana, M. E.; et al.; Proc. Natl. Acad. Sci. 2012, 109, 3024–3029.
[6] Smith, S. C. and Theodorescu, D.; Nat. Rev. Cancer. 2009, 9, 253–264.
[7] DeCremoux, P.; Bull. Cancer. 2011, 98, 1311–1319.
[8] Lambrechts, S.; Decloedt, J. and Neven, O.; Acta. Clin. Belg. 2011, 66, 283–292.
[9] Aggarwal, B. B.; Banerjee, S.; Bharadwaj, U:; et al.; Biochem. Pharmacol. 2007, 73, 1024–1032.
[10] Itokawa, H.; Shi, Q.; Akiyama, T.; Morris-Natschke, S. L. and Lee, K. H.; Chin. Med. 2008, 3, 1–
13.
[11] Sandu, S. K.; Pandey, M. K.; Sung, B.; et al.; Carcinogenesis. 2007, 28, 1765–1773.
[12] Ak, T. and Gülcin, T.; Chem. Biol. Interact. 2008, 174, 22–37.
[13] Batthacharyya, B.; Mandal, D.; Sen, G. S.; et al.; Cancer Res. 2007, 67, 362–370.
[14] Maeshwari, R. K.; Singh, A. K.; Gaddipati, J. and Srimal, R. C.; Life Sci. 2006, 78, 2081–2087.
[15] Zhou, H.; Beevers, S. C. and Huang, S.; Curr. Drug Targets. 2011, 12, 332–347.
[16] Tamvakopoulos, C.; Dimas, K.; Sofianos, Z. D.; et al.; Clin. Cancer Res. 2007, 13, 1269–1277.
[17] Rowe, D. L.; Ozbay, T.; O’Reagan, R. M.; et al.; Breast Cancer. 2009, 3, 61–75.
[18] Kunnumakkara, A. B.; Anand, P.and Aggarwal, B. B.; Cancer Lett. 2008, 269, 199–225.
[19] Bayet-Robert, M.; Kwiatowski, F.;Leheurther, M.; et al.; Cancer Biol. Ther. 2010, 9, 8–14.
[20] Sharna, R. A.; Steward, W. P. and Gescher, A. J.; Adv. Exp. Med. Biol. 2007, 595, 453–470.
[21] Dhillon, N.; Aggarwal, B. B.; Newman, R. A.; et al.; Clin. Cancer Res. 2008, 14, 4491–4499.
[22] Anand, P.; Kunnumakkara, A. B.; Newman, R. A. and Aggarwal, B. B.; Mol. Pharrnaceutics. 2007,
4, 807–818.
[23] Mosley, C. A.; Liotta, D. C. and Snyder, J. P.; Adv. Exp. Med. Biol. 2007, 595, 77–103.
[24] Mohanty, C. and Sahoo S. K.; Biomaterials. 2010, 31, 6597–6611.
[25] Yallapu, M. M.; Jaggi, M. and Chauhan, S. C.; Drug. Discov. Today. 2012, 17, 71–80.
[26] Muqbil, I.; Masood, A.; Sarkar, F. K.; Mohammad, R. M. and Azmi, A. S.; Cancers.. 2011, 3, 428–
445.
[27] He, Y.; Huang, Y. and Cheng, Y.; Cryst. Growth. Des. 2010, 10, 1021–1024.
[28] Wang, Z.; Leung, M. H.; Kee, T. W. and English, D. S.; Langmuir. 2010, 26, 5520–5526.
[29] Mandy, H. M.; Leung, M. H. and Kee, T. W.; Langmuir. 2009, 25, 5773–5777.
[30] Vareed, S. K.; Kakarala, M.; Ruffin, M. T.; et al.; Cancer Epidemiol. Biomarkers Prev. 2008, 17,
1411–1417.
[31] Li, J.; Wang, Y.; Yang, C.; et al.; Mol Pharmacol. 2009, 76, 81–90.
[32] Manju, S. and Sreenivasan, K.; J Pharm. Sci. 2011, 100, 504–511.
[33] Lui, C. H. and Chang, F. Y.; Chem Pharm. Bull. 2011, 59, 172–178.

Chapter VII
186
[34] Sou, K.; Inenaga, S.; Takeoka, S. and Tsuchida, E.; Int. J. Pharm. 2008, 352, 287–293.
[35] Gota, V. S.; Maru, G. B.; Soni, T. G.; et al.; J Agric. Food. Chem. 2010, 58, 2095–2099.
[36] Yallapu, M. M.; Gupta, B. K.; Jaggi, M. and Chauhan S. C.; J. Colloid. Interface. Sci. 2010, 351,
19–29.
[37] Mukeriee, A. and Vishwanantha, J. K.; Anticancer Res. 2009, 29, 3867–3875.
[38] Shahani, K.; Swaminathan, S. K.; Freeman, D.; et al.; Cancer Res. 2010, 70, 4443–4452.
[39] Tsai, Y. M.; Chien, C. F.; Lin, L. C. and Tsai, T. H.; Int. J. Pharm. 2011, 416, 331–338.
[40] Pabon, H. Y. Y.; Recl. Trav. Chim. Pays-Bas. 1964, 83, 379−381.
[41] Mathew, A.; Fukuda, A.; Nagaoka, T.; et al.; PloS One. 2012, 7, e32616.
[42] Nava-Arzaluz, M. G.; Pinon-Segundo, E.; Ganem-Rondero, A. and Lechuga-Ballestros, D.;
Recent. Pat. Drug. Deliv. Formul. 2012, 6, 209−223.
[43] Filippov, S. K.; Panek, J. And Stepanek, P.; Chapter 10; in “Nanotechnology and
Nanomaterials,"Smart Nanoparticles Technology". DOI: 10.5772/33772, INTECH© publisher.
[44] Sanphui, P.; Goud, N. R.; Khandavilli, U. B. R.; Bhanoth, S. and Nangia, A.; Chem. Commmun.
2011, 47, 5013−5015.
[45] Costa, P. and Lobo, J. M. S.; Eur. J. Pharm. Sci. 2001, 13, 123−133.
[46] D’Souza, S. S. and DeLuca, P. P.; Pharm. Res. 2006, 23, 460−474.
[47] van Tilborg, G. A. F.; Mulder, W. J. M.; Chim, P. T. K.; et al.; Bioconjuate Chem. 2006, 17,
865−868.
[48] Sa, G. and Das, T.; Cell. Div. 2008, 3, 1−14.
[49] Venkateswarlu, S.; Ramachandra, M. S. and Subbaraju, G. V.; Bioorg. Med. Chem. 2005, 13,
6374–6380.
Acknowledgements
My first acknowledge is dedicated to my supervisor Dr. Davide Prosperi for giving me the
opportunity to develop the work of this thesis and to give me all directions to learn the
fundamental nanobiochemical knowledge in order to focus my research.
Another important person who I would like to acknowledge is Prof. Kenneth Dawson; he
allowed me to attend the Centre for Bionano Interactions (CBNI) in Dublin for more than
six months, in particular to introduce myself in his own ongoing projects
A special thanks to our financial supports: all subprojects have been supported by
Fondazione Regionale per la Ricerca Biomedica (FRRB), NanoMeDia Project (Hosp. “L.
Sacco” and Regione Lombardia) and finally the “Fondazione Romeo ed Enrica Invernizzi”
and CMENA “Centro di Microscopia Elettronica e Nanomedicina”.

![Review Stimuli-responsive nanocarriers for drug delivery ... · environment [45-47], such as CaCO 3 nanoparticles [39]. The ultrasound-responsive nanocarriers could be applied for](https://img.pdfslide.us/doc/110x75/5f3c0abafeae704f47101437/review-stimuli-responsive-nanocarriers-for-drug-delivery-environment-45-47.jpg)