Embed Size (px)
Citation preview
Synthese et caracterisation thermodynamique
d’hydrates de gaz contenant de l’hydrogene
Amir Abbas Karimi
To cite this version:
Amir Abbas Karimi. Synthese et caracterisation thermodynamique d’hydrates de gaz con-tenant de l’hydrogene. Chemical engineering. Ecole Polytechnique X, 2013. French. <pastel-00998311>
HAL Id: pastel-00998311
https://pastel.archives-ouvertes.fr/pastel-00998311
Submitted on 1 Jun 2014
HAL is a multi-disciplinary open accessarchive for the deposit and dissemination of sci-entific research documents, whether they are pub-lished or not. The documents may come fromteaching and research institutions in France orabroad, or from public or private research centers.
L’archive ouverte pluridisciplinaire HAL, estdestinee au depot et a la diffusion de documentsscientifiques de niveau recherche, publies ou non,emanant des etablissements d’enseignement et derecherche francais ou etrangers, des laboratoirespublics ou prives.
1
THÈSE Pour obtenir le grade de
Docteur de l’École Polytechnique
Présentée et soutenue publiquement par
Amir A. KARIMI
Le 22 novembre 2013
Synthèse et caractérisation thermodynamique d’hydrates de gaz contenant de l’hydrogène
----------------------------------------------------------------------------------------------------------------
« Synthesis and thermodynamic characterisation
of gas hydrates containing hydrogen »
Directeur de thèse : Didier DALMAZZONE
Jury :
Bertrand Chazallon Rapporteur Anthony Delahaye Rapporteur Danièle Clausse Examinateur Antonin Chapoy Examinateur Jean Philippe Torre Examinateur Didier Dalmazzone Examinateur

2

3
To my parents…

4
5
AAcckknnoowwlleeddggeemmeennttss
First and foremost I would like to thank my supervisor Didier Dalmazzone. It has been an
honour to be his Ph.D. student. He has taught me, both consciously and unconsciously, how
good experimental thermodynamics is. I appreciate all his contributions of time and ideas to
make my Ph.D. experience productive and stimulating. Thank you Didier, not only because of
what you have taught me, but also because of your kindness and your patience through these
past three years!
The joy and enthusiasm Didier has for his research was contagious and motivational for me,
even during tough times in the Ph.D. pursuit. I am also thankful for the excellent example he
has provided as a successful researcher and professor.
I would also like to thank the director of our laboratory Walter Fürst, for giving me the
opportunity to realize my research at the best possible condition under his direction.
Collective and individual acknowledgements are conveyed to my thesis reading committee
members. I am grateful to my thesis referees Dr. Antonin Chapoy and Dr. Antony Delahaye
for accepting this role and reading the thesis manuscript with great care, interest and patience.
It was an extreme honor for me to have them as well as other members of the jury, Dr.
Danièle Clausse, Dr. Bertrand Chazallon and Dr. Jean Philippe Torre as my thesis board of
examiners.
This thesis was funded by École Polytechnique de Paris, and I would like to thank both École
Polytechnique and ENSTA for their generous support. Both
schools have provided me a rich and fertile environment to study and explore new ideas. At
École Polytechnique I would like to thank all the members of Graduate School (EDX) and the
administration staff. At ENSTA, the members of the UCP (Unité de Chimie et Procédés) have
contributed immensely to my personal and professional time. The group has been a source of
friendships as well as good advice and collaboration. I am especially grateful to Alain
Gaunand, Patrice Paricaud, Laurent Catoire, Henri Planche and I would like to specially thank
Elise Provost and Johnny Deschamps for their help and technical support during my thesis.
I would like to acknowledge Oleksandr Doltko post-doc researcher who was here on the first
year of my PhD. We worked together on H2-TBPBH4 system, and I very much appreciated his
enthusiasm, willingness and support.

6
My time at ENSTA was made enjoyable in large part thanks to my many friends that became
a part of my life. I am grateful for time spent with my friends, for making one of the most
pleasant periods of my life, to Julien Glorian (Ju) my office mate and my French teacher at
the same time! (vocabulary & pronunciation) Mickael Matrat (Mickey) again my French
teacher focusing on grammar & writing, Aurélien Demenay (DéDé), Elodie Fazer, Kodjo
Coudoro (The last king of Togo), Jean-Baptiste May-Carle (JB), Karl Chatelain (Karlito) and
also to my Asian friends Zhewei Yu (JiJi), Ayako Fukumoto and Wei Lin.
I would like to express my gratitude to a group of my best friends outside UCP, starting with
Behzad Nazer who has always been like a brother for me, the very old friend Mohsen Laali,
fascinating Bora Erdamar (Boracim) who opened new horizons in my personal life and way
of thinking, my very kind friend and former neighbour Robert Somogyi, very supportive
Susan Memari for whom I wish all the best, and special thanks to Yassaman Sarabi a very
compassionate and everlasting friend of mine.
I gratefully acknowledge the unforgettable support of Nastaran Manoucheri specially in the
fi rst days and months of my arrival to France. I would like to thank Dr. Amir Mohammadi at
École des Mines de Paris and all the other Iranian friends of mine in France.
Last but not least, I would like to thank my family for all their love and encouragement. For
my parents who raised me with love and supported me in all my pursuits. For my sister who
has been my best friend all my life and I love her dearly and thank her for all her advice and
support. For the presence of my aunt and his kind husband in Paris, for all their loving and
encouraging support. Thank you.
7
TABLE OF CONTENTS
LLiisstt ooff aabbbbrreevviiaattiioonn aanndd ssyymmbboollss ................................................................................... 9
LLiisstt ooff FFiigguurreess:: ................................................................ Erreur ! Signet non défini.1
Contexte et Objectifs et L’étude .................................................................................. 15
Introduction ............................................................................................................. 17
CChhaapptteerr OOnnee:: IInnttrroodduuccttiioonn oonn hhyyddrrooggeenn ssttoorraaggee .......................................................... 19
1.1. Introduction ................................................................................................... 21
1.2. Chemical & physical properties ....................................................................... 23
1.3. Industrial applications of hydrogen .................................................................. 27
1.3.1. Hydrogen as a reactant ............................................................................. 27
1.3.2. Hydrogen as oxygen scavenger ................................................................. 28
1.3.3. Hydrogen as a fuel ................................................................................... 28
1.4. Hydrogen storage methods .............................................................................. 28
1.4.1. Gaseous storage (Compression) ................................................................ 29
1.4.2. Liquid storage (Liquefaction) .................................................................... 31
1.4.3 Physical adsorption of hydrogen in porous materials ................................... 33
1.4.4. Metal hydrides and complex hydrides (Chemisorption) ............................... 36
1.5. Clathrate hydrates .......................................................................................... 38
1.5.1. Introduction ............................................................................................ 38
1.5.2. Water and Ice (irregular) properties ........................................................... 39
1.5.3. Structures of different hydrate types .......................................................... 40
1.5.4. Hydrogen storage in inclusion compounds ................................................. 46
1.5.6. Conclusion.............................................................................................. 56
CChhaapptteerr ttwwoo:: EExxppeerriimmeennttaall mmeeaassuurreemmeennttss ................................................................... 57
2.1. Introduction ................................................................................................... 59
2.2. Differential Scanning Calorimeter (DSC) ......................................................... 59
2.2.1. Heat flux differential scanning calorimeters ............................................... 61
2.2.2. Power compensating differential scanning calorimeters ............................... 62
2.2.3. Calorimetric signals ................................................................................. 63
2.2.4. DSC principle ......................................................................................... 65
2.2.5. Measurement of phase transition temperature ............................................. 69
2.2.7. Experimental procedure ........................................................................... 72
8
2.3. Isochoric reactor ............................................................................................ 75
2.3.1. Description ............................................................................................. 75
2.3.2. Experimental procedure ........................................................................... 76
2.4. Gas phase composition analysis : Gas Chromatography ..................................... 79
2.5. Liquid phase analysis : Atomic Absorption Spectrometry ................................... 81
2.6. Materials ....................................................................................................... 81
CChhaapptteerr tthhrreeee:: RReessuullttss && DDiissccuussssiioonnss 11 ((SSeemmii--ccllaatthhrraattee ssyysstteemmss)) ................................... 85
3.1. Investigation of TBPBH4 semi-clathrate system ................................................ 87
3.1.1. Introduction ............................................................................................ 87
3.1.2. Investigations of the synthesized TBPBH4 salt ............................................ 88
3.1.3. Investigations of TBPBH4 – H2O system .................................................... 90
3.1.4. Investigation of the H2-TBPBH4 – H2O system ........................................... 93
3.1.5. Investigation of the N2 -TBPBH4 – H2O system .......................................... 97
3.2. Investigation of TBAOH semi-clathrate............................................................ 99
3.2.1. Introduction ............................................................................................ 99
3.2.2. Investigation of TBAOH – H2O system ..................................................... 99
3.2.3. Investigation of the H2 – TBAOH – H2O system ....................................... 103
3.2.4. p-V-T measurements and hydrogen storage capacity .................................. 106
CChhaapptteerr ffoouurr:: RReessuullttss && DDiissccuussssiioonnss 22 ((CCllaatthhrraattee ssyysstteemmss)) ......................................... 109
4.1. Propane + Hydrogen + Water ternary system .................................................. 111
4.1.1. Introduction .......................................................................................... 111
4.1.2. Pure Propane – H2O system .................................................................... 112
4.1.3. Hydrogen + Propane + Water system ....................................................... 121
4.2. Carbon dioxide – Hydrogen system ................................................................ 128
4.2.1. Introduction .......................................................................................... 128
4.2.2. A discussion on the phase diagram of H2-CO2-H2O ................................... 128
4.2.3. Investigation of H2-CO2-H2O phase equilibrium ....................................... 132
4.2.4. Composition analysis of CO2-H2O hydrate ............................................... 134
CCoonncclluussiioonnss aanndd ppeerrssppeeccttiivveess ................................................................................... 137
RReeffeerreenncceess .............................................................................................................. 141
9
LL II SSTT OOFF AABBBBRREEVVII AATTII OONN AANNDD SSYYMM BBOOLL SS
Abbreviations
C Molar concentration mol . m-3
CS Heat capacity of sample J . K-1 . kg-1
CR Heat capacity of reference J . K-1 . kg-1
CNG Compressed Natural Gas
DOE United states‟ Department Of Energy
DSC Differential Scanning Calorimeter
G Gas phase
GC Gas Chromatography
H Hydrate phase
h Molar enthalpy J . mol -1
hyd Hydrate structure
Ih Hexagonal ice
K Heat transfer coefficient
L/ Liq. Liquid phase
LNG Liquefied Natural Gas
M Molar mass kg . mol-1
MOF Metal Organic Framework
n Mole number mol
P Pressure Pa
q Molar heat flow J . mol -1
R Thermal Resistance
S Molar entropy J . K-1 . mol -1
T Temperature K
TBAB Tetra-butyl-ammonium bromide
TBABh Tetra-butyl-ammonium brohydride
TBACl Tetra-butyl-ammonium chloride
TBAF Tetra-butyl-ammonium fluoride
TBAOH Tetra-butyl-ammonium hydroxide
TBPBH4 Tetra-butyl-phosphonium brohydride
THF Tetrahydrofuran
TMA Trimethylamine
10
V Vapour phase
wis Isothermal work J . mol -1
Z Compressibility factor
Greek Letters
γ Thermal conductivity W . K -1 m -1
µjT Joule-Thompson coefficient K . Pa -1
ρ Density Kg . m -3
φ Heat flow rate J . mol-1 . s-1
Subscripts
0 Initial
A Aqueous phase
eq Equilibrium sate
F Furnace
H Hydrate phase
HC Hydrocarbon
L Liquid phase
R Reference
S Sample
V Vapour
W water
Constants
R Universal gas constant 8.134 J . mol-1 . K-1
11
LL II SSTT OOFF FFII GGUURREESS::
Figure 1 – Compressibility factor (Z) of hydrogen .......................................................... 24
Figure 2 – Phase diagram of Hydrogen[2] ...................................................................... 32
Figure 3 – Comparison of the gravimetric energy densities of pure stored hydrogen with other energy sources [2] ....................................................................................................... 33
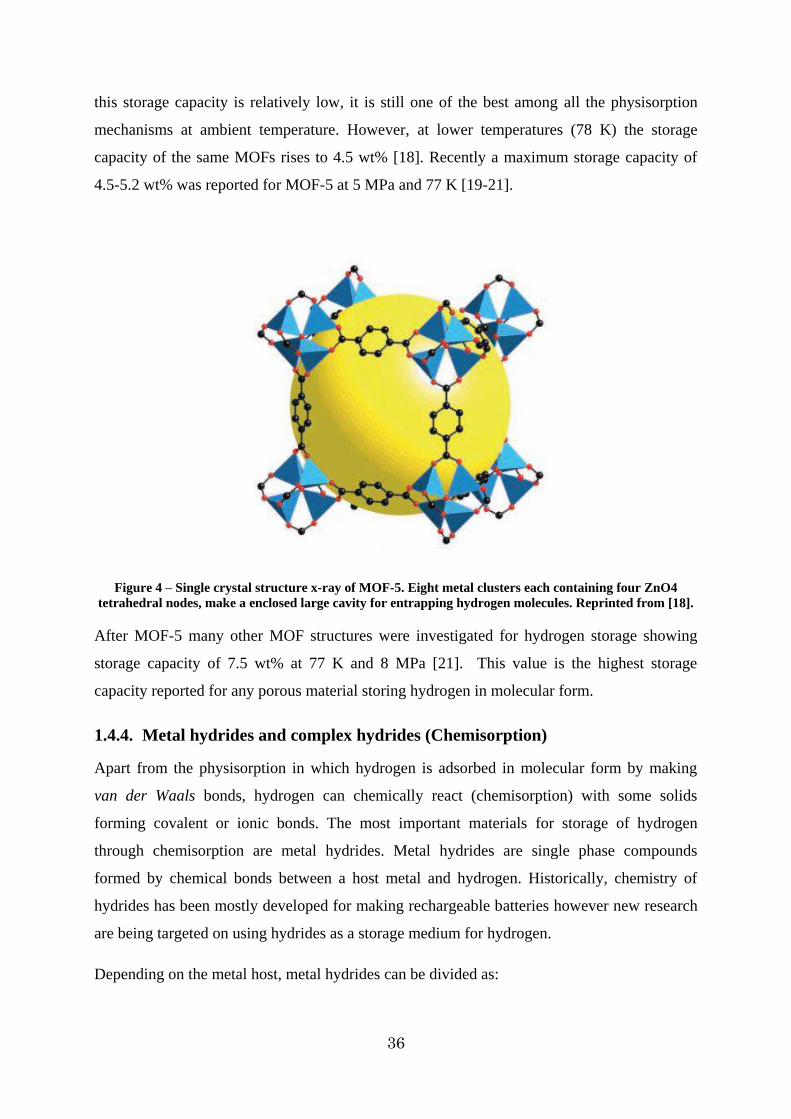
Figure 4 – Single crystal structure x-ray of MOF-5. Eight metal clusters each containing four ZnO4 tetrahedral nodes, make a enclosed large cavity for entrapping hydrogen molecules. Reprinted from [18]. .................................................................................................... 36
Figure 5 - Hydrogen bond in water molecule: a) between two molecules b) between four molecules [30] ............................................................................................................ 39
Figure 6 - Crystal structure of ice Ih [30] ....................................................................... 40
Figure 7 - Five different gas hydrate cavities rates: (a) pentagonal dodecahedron (512), (b) Tetrakaidecahedron (51262), (c) hexakaidecahedron (51264), (d) irregular dodecahedron (435663), and (e) icosahedron (51268) [30] ....................................................................... 41
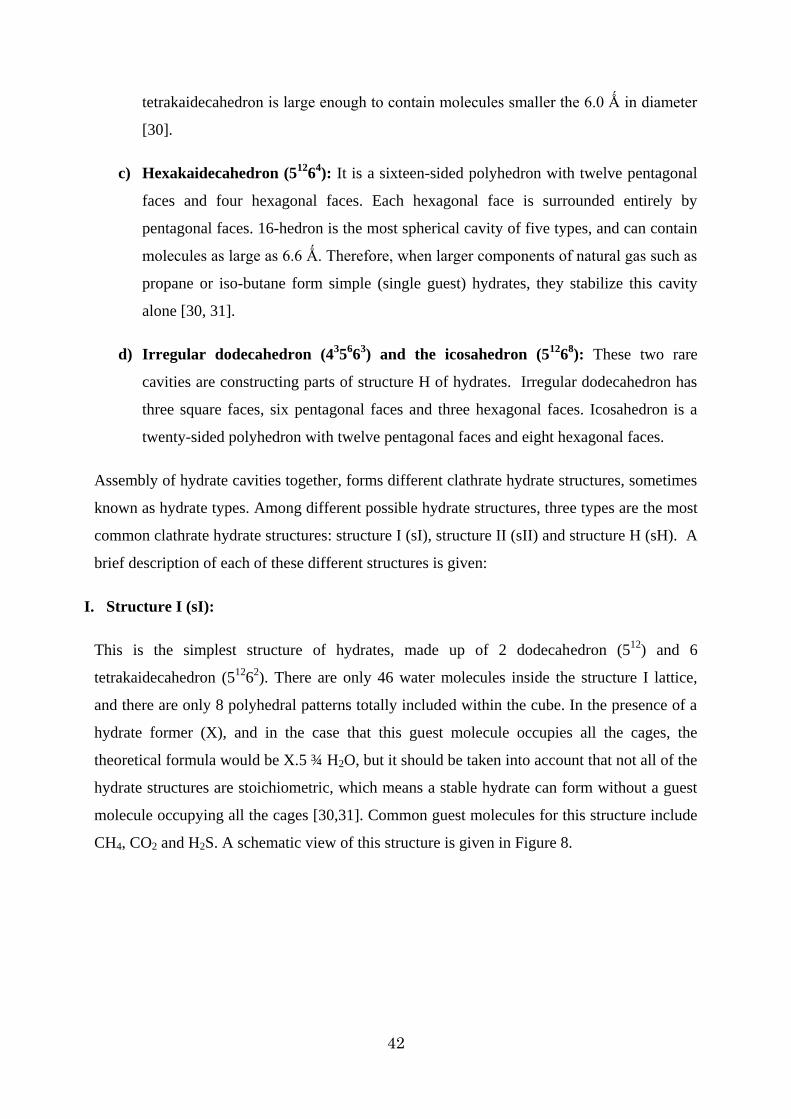
Figure 8 - View of structure I of hydrate clathrate. a) five 512 polyhedral are connected by two 51262 polyhedral b) two-dimensional view of sI [3] ......................................................... 43
Figure 9 - Schematic of hydrate structure II [30] ............................................................. 44
Figure 10 - Schematic presentation of hydrate structure H [30] ........................................ 44
Figure 11 - Guest size relationship with hydrate type [30] ............................................... 46
Figure 12 - The cage occupancy proposed by Mao al.[10] : A) 4 H2 molecules occupy hexakaidecahedron (51264) cavities B) 2 H2 molecules occupy pentagonal (512) cavities ..... 47
Figure 13 - Schematic structure of TBAB hydrate crystal [55] ......................................... 52
Figure 14 - TBAB semi-clathrate hydrate, type A and B [58] ........................................... 53
Figure 15 - The structure around the tetra-n-butylammonium cation, located at the centre of four cages [53] ............................................................................................................ 54
Figure 16 - Disk type DSC [66] .................................................................................... 61
Figure 17 - Cylinder type DSC [66] .............................................................................. 62
Figure 18 - Power compensating DSC [66] .................................................................... 63
Figure 19 - Schematic presentation of temperature evolution in a DSC [69] ...................... 64
Figure 20 – Schematic illustration of DSC cells, TR : reference temperature, CR : heat capacity of reference, TS : sample temperature, CS : heat capacity of sample, TF: furnace temperature [70] .......................................................................................................... 66
Figure 21 - Example of a heat-flux curve for calculation thermal resistance, R and the phase transition temperature .................................................................................................. 71
Figure 22 - A schematic presentation of HP-µ DSC VII (SETARAM) ............................. 73
Figure 23 - A schematic presentation of multi-cycle thermal program for hydrate formation ending with hydrate dissociation. .................................................................................. 74
Figure 24 - Thermal cycling for a CO2-H2-H2O system at 14 MPa (equimolar gas composition) ............................................................................................................... 75
Figure 25 - Schematic of hydrate cell (with courtesy of Ecole des Mines de Paris, CEP/TEP). DAU, data acquisition unit; DW; EC, equilibrium cell; G, gas cylinder; GC, gas
12
chromatograph; HPT, high pressure transducer; LB, liquid bath; LPT, low pressure transducer; .................................................................................................................. 76
Figure 26 - A schematic T-P diagram of hydrate ............................................................. 77
Figure 27 - The ROLSI sampler connected to the reactor ................................................. 80
Figure 28- The H1 NMR spectra of the TBPBH4 compound ............................................. 89
Figure 29 - DSC heat flux curve for the dissociation of 2.44 mol% of TBPBH4 ................. 90
Figure 30 - DSC heat flux curve for TBPBPH4 hydrates under ambient pressure in a salt concentration range of 0.36 to 4.75 mol% ...................................................................... 91
Figure 31 - The phase diagram of the TBPBH4 + H2O binary system in the region of crystallization of high water content semi-clathrate polyhydrate. (Dashed lines – equilibrium behaviours can vary. Solid line – data more clear). ......................................................... 93
Figure 32 - DSC heat flux curve of the 1.96 mol% solution of TBPBH4 under different hydrogen pressures ...................................................................................................... 94
Figure 33 – P-T data for additive + water + H2 systems. (The type of additive, its concentration and the source of data are presented on the diagram. Error bars represent the uncertainties on phase change temperatures, based on repeated determinations of melting points of gallium. Lines represent exponential fits of experimental points) ........................ 95
Figure 34 – Effect of pressure on TBPBH4 clathrate of different salt concentrations ........... 96
Figure 35 - P-T phase diagram of additive+water+N2 system ........................................... 98
Figure 36 - Comparison of hydrogen and nitrogen pressure on the phase diagram of TBPBH4 ................................................................................................................................. 98
Figure 37 - DSC heat flux curve of dissociation of 1.23 mol% solution of TBAOH .......... 100
Figure 38 –Heat flux curve of TBAOH hydrate in different salt concentration at ambient pressure .................................................................................................................... 101
Figure 39 - The phase diagram of TBAOH-H2O binary system ...................................... 102
Figure 40 - The heat flux curve of 1.23 mol% TBAOH hydrate at different hydrogen pressures .................................................................................................................. 103
Figure 41 - Effect of hydrogen pressure on dissociation temperature of the second hydrate structure of TBAOH-H2O system (hyd2) ..................................................................... 104
Figure 42 - Effect of hydrogen pressure on dissociation temperature of the first hydrate structure of TBAOH-H2O system (hyd1) ..................................................................... 105
Figure 43 – comaprison of P-T equilibrium data of various H2+semi-clathrate hydrates .... 106
Figure 44 - p-V-T measurement of a 1.41 mol% solution of TBAOH under 10 MPa hydrogen [The dot lines in this diagram are just extrapolating of the data and they do not present confirmed measurements] .......................................................................................... 107
Figure 45 – Comparison of specific energy of propane with different common fuels ........ 111
Figure 46- P-T diagrams for hydrocarbon+water systems with higher quadruple points [30] ............................................................................................................................... 113
Figure 47 - DSC heat flux curve of propane-water system at 0.6 MPa (30 cycles) ............ 115
Figure 48 - DSC heat flux curve of propane-water system at 0.3 MPa (3 cycles) .............. 116
Figure 49 - DSC heat flux curve of dissociation of propane hydrate at 0.51 MPa ............. 116
Figure 50 - DSC heat flow curve for propane system at 0.4 MPa .................................... 117
13
Figure 51 - P-T diagram of propane hydrate formation dissociation at 0.46 MPa obtained by p-V-T measurements ................................................................................................. 118
Figure 52 - The phase diagram of propane + water system ............................................. 121
Figure 53 - Hydrate formation conditions for hydrogen + propane hydrate [92] ............... 122
Figure 54 - Decomposition curve of propane + hydrogen propane double clathrate hydrates. h1: cubic structure II of pure propane hydrate, h2: propane hydrate with an unknown structure [91] ......................................................................................................................... 122
Figure 55 - Phase envelope of the system Hydrogen + Propane ...................................... 123
Figure 56 - Phase diagram of natural gas with a composition of methane: 70.85 mol%, ethane 11.34 mol%, propane: 6.99 mol%, isobutane 3.56 mol%, and n-butane: 4.39 mol% and carbon dioxide: 2.87 mol% [31] ............................................................................................ 124
Figure 57 - DSC heat flux curves of the 1 mol% fraction of propane in the propane + hydrogen - water system under pressure of 5 MPa ........................................................ 125
Figure 58 - P-T phase diagram of Propane + Hydrogen - Water system under different pressures for different component compositions ........................................................... 126
Figure 59 - Clapeyron equation presentation of Propane - Hydrogen hydrate dissociation . 127
Figure 60 - DSC heat flux curve for H2-CO2-H2O system at pressure of 4 MPa ................ 130
Figure 61 - Schematic presentation of P-T phase diagram of CO2-H2O system [30] .......... 131
Figure 62 - DSC heat flow curve of H2-CO2-H2O system under pressure of 7 MPa .......... 131
Figure 63 - Comparison of equilibrium data of CO2, H2 and H2-CO2 system .................... 133
Figure 64 - Comparison of equilibrium data of CO2, H2 and partial pressure of CO2 in the H2-CO2 system ............................................................................................................... 133
14
LL II SSTT OOFF TTAABBLL EESS::
Table 1 - The comparison of the heating values, and CO2 emission of common fuels with hydrogen _________________________________________________________________ 21 Table 2 - Comparative data on vapor and liquid densities of hydrogen, methane and gasoline _________________________________________________________________________ 25 Table 3 - Hydrogen Properties [2] ______________________________________________ 26 Table 4 - Characteristics of commercial hydrogen storage containers [2] _______________ 30 Table 5 - Comparative hydrogen storage data of most common complex hydrides ________ 38 Table 6 - Geometry of hydrate cages ___________________________________________ 45 Table 7 - Summarized table of hydrogen clathrates data ____________________________ 56 Table 8 - Thermal conductivity of common career gases ____________________________ 80 Table 9 - Polynomial parameters of calibration curves ______________________________ 81 Table 10 - Chemicals used in the measurements, with their purities and their suppliers ____ 82 Table 11 - Results of the gas volumetric analysis of the TBPBH4, synthesized at different conditions ________________________________________________________________ 89 Table 12 - Dissociation temperatures of TBPBH4 hydrates as a function of the salt concentration. _____________________________________________________________ 92 Table 13 - Temperatures of dissociation of the G + TBPBH4 semiclathrate hydrate at different gas pressures (G = H2 or N2) __________________________________________________ 94 Table 14 – Dissociation temperature of TBPBH4 semiclthrates under different hydrogen pressures _________________________________________________________________ 96 Table 15 - Dissociation temperature of TBPBH4 hydrates as a function of concentration in different pressures of N2 _____________________________________________________ 97 Table 16 - Properties of TBAOH hydrate structures ________________________________ 99 Table 17 - Temperatures of (Ice + hyd2) eutectic melting, TE, (hyd1 + hyd2) peritectic melting, TP, and hyd2 dissociation,Tdiss, in the system H2O + TBAOH at variable salt concentrations ____________________________________________________________ 101 Table 18 - Dissociation temperatures of H2-TBAOH-H2O semi-clathrates under different hydrogen pressures ________________________________________________________ 104 Table 19-Hydrogen storage capacity of common hydrates and their formation conditions _ 108 Table 20- Critical point of some hydrate forming gases with respect to the triple point of water ___________________________________________________________________ 113 Table 21- Second quadruple point (Q2) of Propane-water system ____________________ 114 Table 22 - Experimental data of dissociation temperature of propane hydrate___________ 119 Table 23 - The dissociation temperatures of propane + hydrogen hydrates as a function of gas composition and pressure ___________________________________________________ 126 Table 24 - Phase equilibrium data of pure carbon dioxide hydrate and pure hydrogen hydrate ________________________________________________________________________ 129 Table 25 - Phase Equilibruia data of H2-CO2-H2O system __________________________ 132 Table 26-Composition analysis pf vapor phase in a mixture of CO2 - H2- H2O __________ 135
15
Contexte et Objectifs et L’étude
Dans la perspective de la transition vers de nouvelles sources énergétiques, l’hydrogène apparaît comme un vecteur d’énergie prometteur. L’hydrogène est doté d’excellentes propriétés physico-chimiques qui en font un combustible d’avenir : il constitue une énergie propre, renouvelable, avec un pouvoir calorifique trois fois supérieur à celui de l’essence. Mais les difficultés liées au stockage et au transport de l’hydrogène restent des obstacles majeurs au développement d’une économie de l’hydrogène comme vecteur énergétique.
Dans ce contexte, la présente étude concerne la synthèse et la caractérisation d’hydrates d’hydrogène du type clathrate et semi-clathrates par analyse calorimétrique différentielle sous haute pression (40 MPa) et en réacteur isochorique pour les mesures volumétriques.
Dans un premier temps, une famille particulière de semi-clathrates qui se forment à partir d’eau et de gaz en présence de sels d’ammonium (TBAOH) ou de phosphonium quaternaires (TBPBH4) a été étudiée. Nous présentons dans cette partie une étude du comportement des systèmes TBAOH-H2-H2O, TBPBH4 -H2 -H2O etTBPBH4 - N2 -H2O, leurs diagrammes de phases isobares (x, T) et une étude volumétrique de la quantité de gaz stocké.
Dans un deuxième temps, le concept de Tuning a été développé dans un mélange de H2-C3H8 afin d’étudier son impact sur la stabilité de l’hydrate d’hydrogène. Enfin, la séparation de l’hydrogène dans un mélange équimolaire de CO2-H2 par cristallisation d’hydrate a été étudiée et l’analyse des compostions initiale et finale du mélange de gaz réalisée.
Mots clé: Hydrates de H2, hydrates semi-clathrates, équilibre de phase, analyse calorimétrique différentielle, mesure volumétrique

16
17
Introduction
The limited supply of fossil fuels and the environmental issues they provoke make shifting towards clean and renewable energy sources inevitable. In this perspective, hydrogen as a clean energy career is attracting more and more attention. Hydrogen is a clean fuel which its combustion does not produce any pollutant or any greenhouse gas. Moreover, its energetic density is around three times higher than those of conventional fuels [1]. In spite of its favourable chemical properties, storage and transport of hydrogen has always been a challenge for industry. In this regard, different technologies were proposed from hydrogen compression and liquefaction, to hydrogen adsorption in carbon nanotubes and metal organic frameworks.
Any proposed method for industrial storage of hydrogen must cover two criteria: Firstly, the mass density of the stored hydrogen must meet the economic/industrial requirements and secondly the energy consumption of the storage method itself must not exceed the energy content of stored hydrogen. Respecting these two criteria, clathrate hydrates have been studied as a potential storage medium for hydrogen.
Clathrate hydrates are inclusion compounds made up of water and a guest molecule. They are formed by insertion of gas molecules into cavities formed by water molecules arranged in polyhedral patterns, under low temperatures and relatively high gas pressures. Hydrate dissociation and formation conditions depend principally on the nature of the crystalline structure, size of the guest molecule, gas pressure and the molecular interaction between guest molecules and hydrate structure. In order to reduce the severe hydrate formation conditions, usually some additives are added. These additives are usually organic salts or constituents of natural gas.
This work comprises synthesis and characterization of hydrogen hydrates of different structures in presence of water soluble additives and gas promoters. At the first step, the phase equilibria of semi-clathrate systems made in presence of an ammonium quaternary salt (TBAOH) and a phosphonium quaternary salt (TBPBH4) were investigated. Using a differential scanning calorimeter (DSC) the equilibrium dissociation temperatures of these semi-calthrates were measured under different hydrogen pressures. Their phase diagrams were established and the effect of hydrogen pressure upon their stability was studied. Moreover, using an isochoric high pressure reactor the quantity of hydrogen stored in these semi-clathrates was investigated.
In the second part, effect of a promoter gas such as propane on the stability of hydrogen hydrate was investigated. These investigations were preceded by independent measurements of pure propane hydrate which were followed on the hydrogen + propane mixture of 1 mol%, 3 mol %, 5 mol% and 10 mol% of propane. The effect of the composition and total gas pressure was investigated using DSC.
The last system studied was the clathrate hydrates formed in the CO2-H2 gas mixture. The phase equilibrium of the system was studied and compared with the literature data of pure CO2 hydrate and pure H2 hydrate. The tendency of both components in occupying hydrate cavities was investigated by analyzing the initial (before hydrate formation) and final (after hydrate formation) gas composition.
The first chapter of this dissertation is a bibliographic review of hydrogen’s industrial applications and storage technologies. The second chapter describes the experimental techniques that were used

18
during the thesis. In the third and fourth chapters, the results obtained in the presence of saline and gas additives are presented and discussed, respectively.
19
CChhaapptteerr OOnnee::
II nnttrr oodduucctt iioonn oonn hhyyddrrooggeenn ssttoorr aaggee
This chapter comprises the physical and chemical properties of hydrogen as an energy source as well as different hydrogen production methods in industry and its application in different industrial sectors.
Respecting the main objective of this research on hydrogen storage, common known hydrogen storage methods are presented and are described here and finally, clathrates hydrates are introduced as a potential for gas storage. This chapter terminates by a literature review on the history of hydrates, their properties, structure, formation / dissociation conditions are given.

20
21
1.1. Introduction
Hydrogen as an environmentally clean and efficient energy carrier is attracting more and more
attention worldwide. Study of fuel evolution history demonstrates a general trend in the
increase of hydrogen content of fossil fuels from coal to petroleum oil and then to natural gas.
This trend of increase of hydrogen content may finally reach the consumption of pure
hydrogen; therefore it is not far from imagination if hydrogen is called the fuel of the future.
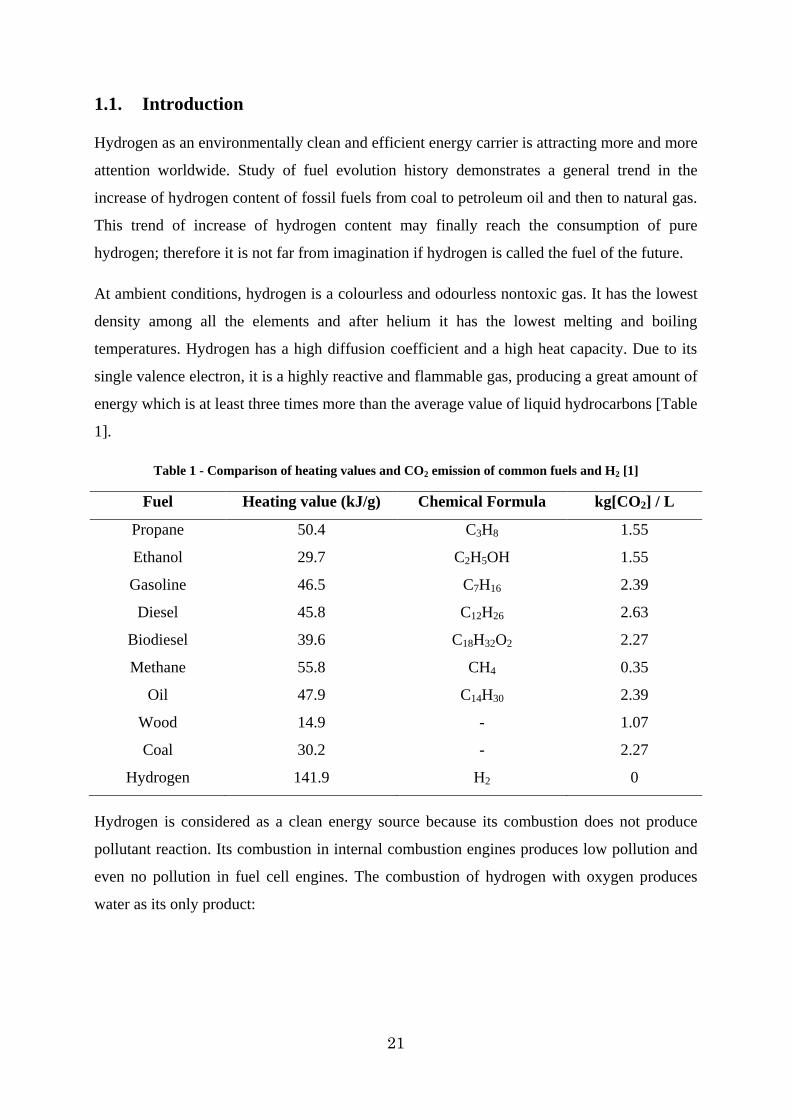
At ambient conditions, hydrogen is a colourless and odourless nontoxic gas. It has the lowest
density among all the elements and after helium it has the lowest melting and boiling
temperatures. Hydrogen has a high diffusion coefficient and a high heat capacity. Due to its
single valence electron, it is a highly reactive and flammable gas, producing a great amount of
energy which is at least three times more than the average value of liquid hydrocarbons [Table
1].
Table 1 - Comparison of heating values and CO2 emission of common fuels and H2 [1]
Fuel Heating value (kJ/g) Chemical Formula kg[CO2] / L
Propane 50.4 C3H8 1.55
Ethanol 29.7 C2H5OH 1.55
Gasoline 46.5 C7H16 2.39
Diesel 45.8 C12H26 2.63
Biodiesel 39.6 C18H32O2 2.27
Methane 55.8 CH4 0.35
Oil 47.9 C14H30 2.39
Wood 14.9 - 1.07
Coal 30.2 - 2.27
Hydrogen 141.9 H2 0
Hydrogen is considered as a clean energy source because its combustion does not produce
pollutant reaction. Its combustion in internal combustion engines produces low pollution and
even no pollution in fuel cell engines. The combustion of hydrogen with oxygen produces
water as its only product:
22
Equation (1)
The enthalpy of this reaction is ΔRH= -242 MJ·kmol-1. If the water condenses in this reaction,
the enthalpy of condensation will be added to the total enthalpy of reaction making ΔRH= -285
MJ·kmol-1 and giving a heating value (the gross calorific value) of Ho=142 MJ·kg-1 [2].
Due to the high temperature of hydrogen combustion some nitrogen molecules in the air may
react with the oxygen molecules and produce nitrogen oxides (NOX).
Equation (2)
In addition to the nitrogen oxides, some traces of carbon oxides may also be produced
originating from the oil used in the combustion chamber.
Source of hydrogen:
Although hydrogen is the most abundant element on the earth, only less than 1% of it exist in
the form of molecular hydrogen gas (H2) [3]. Hydrogen can form chemical compounds
(hydrides) with most of the elements. Due to its ability to combine with carbon to make long
chains, it plays an important role in organic life. The major source of hydrogen in nature is
water in which hydrogen molecules are chemically bond to oxygen molecules and can be
released either by electrolysis of water or thermal dissociation of H2O molecules. But from
about 5 . 1010 kg of the hydrogen consumed each year worldwide, hydrogen is to a large
extent produced from steam reforming of natural gas at high temperatures (973-1373K) [3].
This reaction can be summarized as:
Equation (3)
The product mixture is known as synthesis gas. Using the excess of water stream, through a
reaction called water shift reaction, CO molecules convert into CO2. This reaction is also the
industrial process for production of carbon dioxide:
Equation (4)
Production of hydrogen in this way bears a manufacture cost about three times higher than
petroleum products [3]. Therefore, any proposed method for storage of hydrogen must avoid
imposing considerable operational costs.
23
1.2. Chemical & physical properties
Producing, storing and consuming hydrogen is not possible without knowing its physical and
chemical properties. In this part a summary of important properties of hydrogen related to its
storage process is presented. A more detailed list of hydrogen‟s physical and chemical
properties are gathered and presented in Table 3.
Thermodynamic equation of state:
Hydrogen as well as all the other pure substances can exist under vapour, liquid and solid
phases. Like all the pure substances the thermodynamic state of hydrogen can be defined by
knowing two independent intensive state variables. At ambient pressure hydrogen is in the gas
form and obeys the ideal gas equation of state:
Equation (5)
In which:
v [m3·mol-1]: molar volume
R = 8.31472 [J·mol-1·K-1]: Universal gas constant
T [K]: Kelvin
P[Pa] : gas pressure
This equation is applicable for most of the gases at low pressures and sufficiently high
temperatures (i.e. above critical temperature). An improvement of this equation was
introduced by van der Waals. By considering the intermolecular forces of the gas, van der
Waals equation of state (equation 6) is qualitatively reasonable for low temperatures as well:
Equation (6)
In this equation „a’ and „b’ are the specific parameters of the pure component. For hydrogen
these parameters are:
a = 0.025 [m6·Pa·mol-2]
b = 2.66·10-5 [m3·mol-1]
As already mentioned, neither the ideal gas equation nor the van der Waals equations are
applicable at high pressure ranges. As an approach for accounting the effect of pressure on the
24
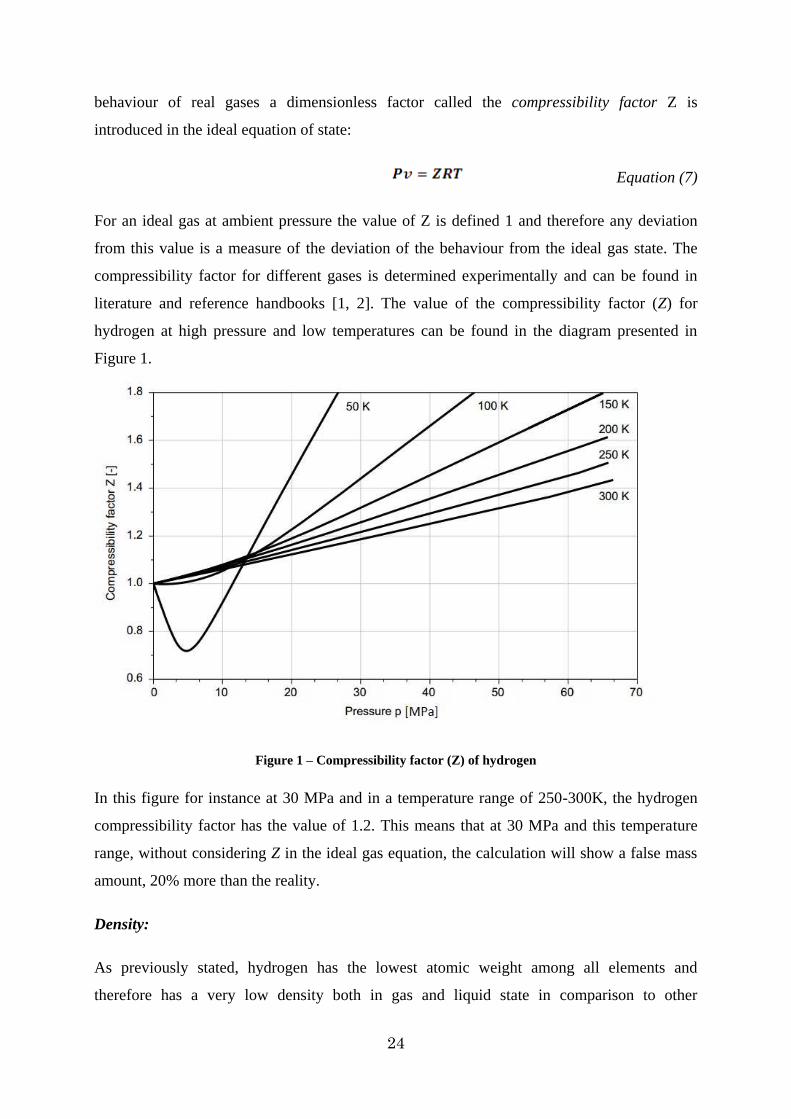
behaviour of real gases a dimensionless factor called the compressibility factor Z is
introduced in the ideal equation of state:
Equation (7)
For an ideal gas at ambient pressure the value of Z is defined 1 and therefore any deviation
from this value is a measure of the deviation of the behaviour from the ideal gas state. The
compressibility factor for different gases is determined experimentally and can be found in
literature and reference handbooks [1, 2]. The value of the compressibility factor (Z) for
hydrogen at high pressure and low temperatures can be found in the diagram presented in
Figure 1.
Figure 1 – Compressibility factor (Z) of hydrogen
In this figure for instance at 30 MPa and in a temperature range of 250-300K, the hydrogen
compressibility factor has the value of 1.2. This means that at 30 MPa and this temperature
range, without considering Z in the ideal gas equation, the calculation will show a false mass
amount, 20% more than the reality.
Density:
As previously stated, hydrogen has the lowest atomic weight among all elements and
therefore has a very low density both in gas and liquid state in comparison to other
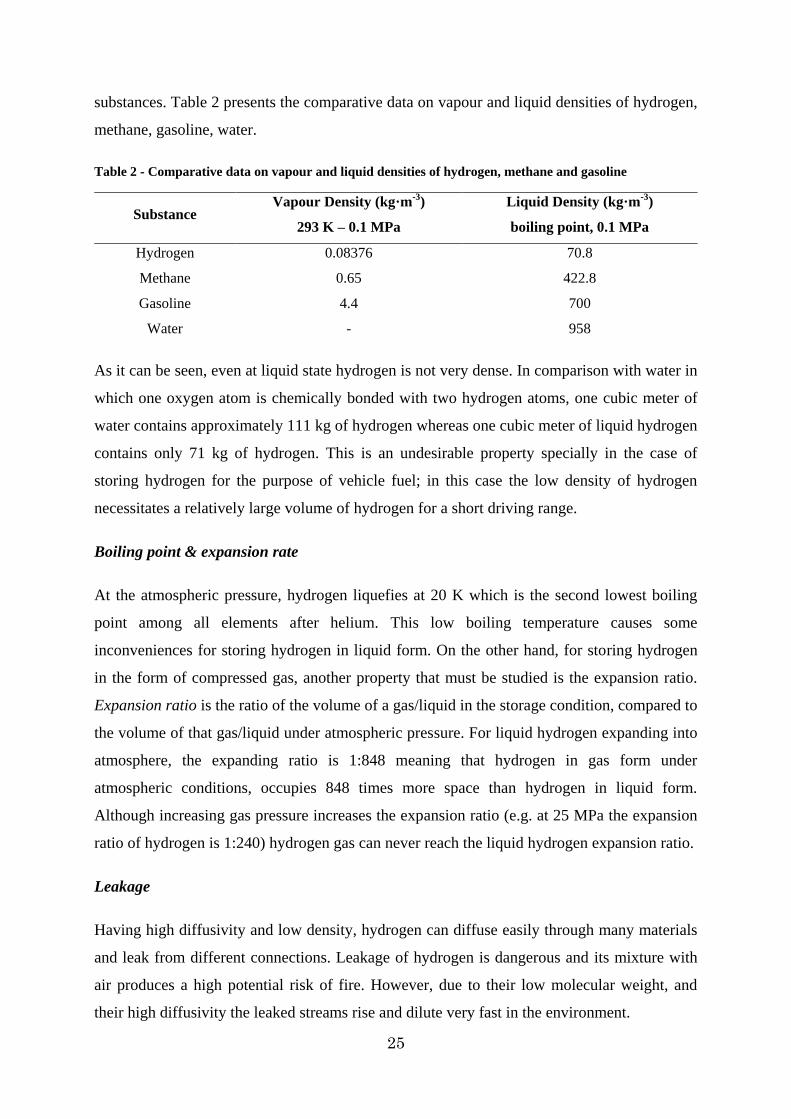
25
substances. Table 2 presents the comparative data on vapour and liquid densities of hydrogen,
methane, gasoline, water.
Table 2 - Comparative data on vapour and liquid densities of hydrogen, methane and gasoline
Substance Vapour Density (kg·m-3)
293 K – 0.1 MPa
Liquid Density (kg·m-3)
boiling point, 0.1 MPa
Hydrogen 0.08376 70.8
Methane 0.65 422.8
Gasoline 4.4 700
Water - 958
As it can be seen, even at liquid state hydrogen is not very dense. In comparison with water in
which one oxygen atom is chemically bonded with two hydrogen atoms, one cubic meter of
water contains approximately 111 kg of hydrogen whereas one cubic meter of liquid hydrogen
contains only 71 kg of hydrogen. This is an undesirable property specially in the case of
storing hydrogen for the purpose of vehicle fuel; in this case the low density of hydrogen
necessitates a relatively large volume of hydrogen for a short driving range.
Boiling point & expansion rate
At the atmospheric pressure, hydrogen liquefies at 20 K which is the second lowest boiling
point among all elements after helium. This low boiling temperature causes some
inconveniences for storing hydrogen in liquid form. On the other hand, for storing hydrogen
in the form of compressed gas, another property that must be studied is the expansion ratio.
Expansion ratio is the ratio of the volume of a gas/liquid in the storage condition, compared to
the volume of that gas/liquid under atmospheric pressure. For liquid hydrogen expanding into
atmosphere, the expanding ratio is 1:848 meaning that hydrogen in gas form under
atmospheric conditions, occupies 848 times more space than hydrogen in liquid form.
Although increasing gas pressure increases the expansion ratio (e.g. at 25 MPa the expansion
ratio of hydrogen is 1:240) hydrogen gas can never reach the liquid hydrogen expansion ratio.
Leakage
Having high diffusivity and low density, hydrogen can diffuse easily through many materials
and leak from different connections. Leakage of hydrogen is dangerous and its mixture with
air produces a high potential risk of fire. However, due to their low molecular weight, and
their high diffusivity the leaked streams rise and dilute very fast in the environment.
26
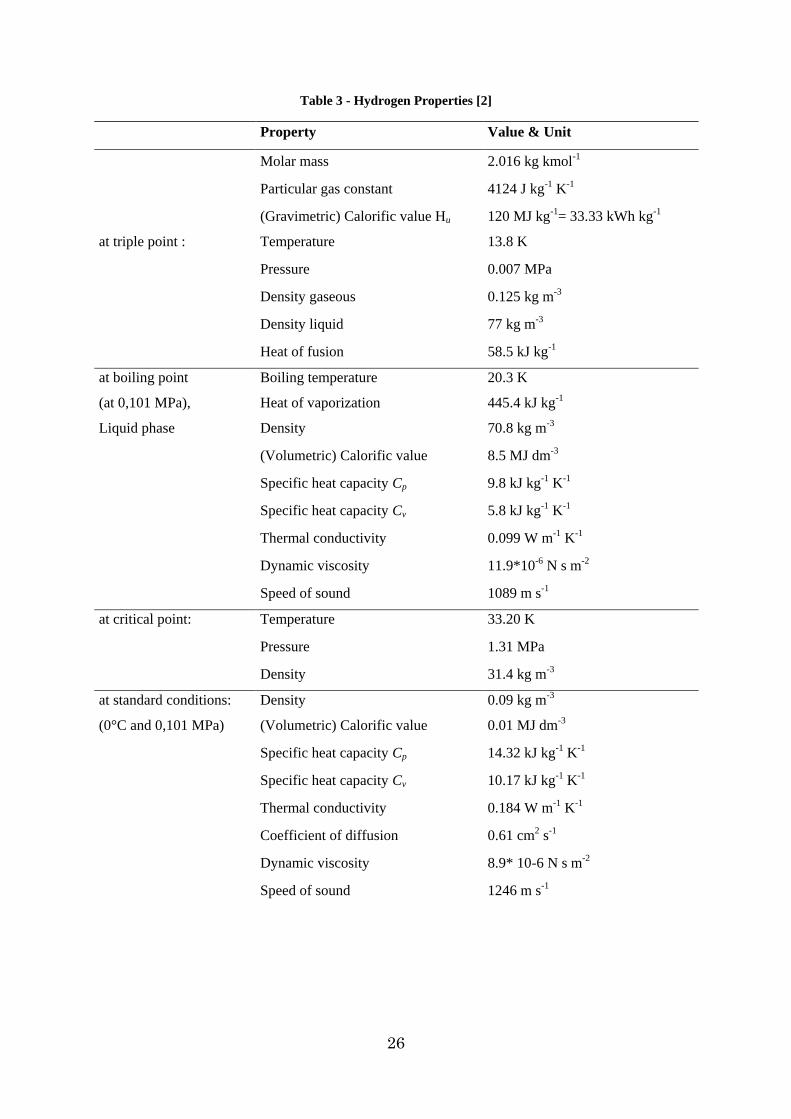
Table 3 - Hydrogen Properties [2]
Property Value & Unit
Molar mass 2.016 kg kmol-1
Particular gas constant 4124 J kg-1 K-1
(Gravimetric) Calorific value Hu 120 MJ kg-1= 33.33 kWh kg-1
at triple point : Temperature 13.8 K
Pressure 0.007 MPa
Density gaseous 0.125 kg m-3
Density liquid 77 kg m-3
Heat of fusion 58.5 kJ kg-1
at boiling point Boiling temperature 20.3 K
(at 0,101 MPa), Heat of vaporization 445.4 kJ kg-1
Liquid phase Density 70.8 kg m-3
(Volumetric) Calorific value 8.5 MJ dm-3
Specific heat capacity Cp 9.8 kJ kg-1 K-1
Specific heat capacity Cv 5.8 kJ kg-1 K-1
Thermal conductivity 0.099 W m-1 K-1
Dynamic viscosity 11.9*10-6 N s m-2
Speed of sound 1089 m s-1
at critical point: Temperature 33.20 K
Pressure 1.31 MPa
Density 31.4 kg m-3
at standard conditions: Density 0.09 kg m-3
(0°C and 0,101 MPa) (Volumetric) Calorific value 0.01 MJ dm-3
Specific heat capacity Cp 14.32 kJ kg-1 K-1
Specific heat capacity Cv 10.17 kJ kg-1 K-1
Thermal conductivity 0.184 W m-1 K-1
Coefficient of diffusion 0.61 cm2 s-1
Dynamic viscosity 8.9* 10-6 N s m-2
Speed of sound 1246 m s-1
27
1.3. Industrial applications of hydrogen
Hydrogen has an important role in many industries, from chemical and refining plants to
metallurgical, glass and electronic industry. Most of its applications are due to its high
reactivity which has caused a rapid increase in its demand especially in petrochemical
industry [4]. Generally speaking hydrogen‟s industrial application can be divided into 3 main
categories:
1. As a reactant to reduce the heterogonous atoms such as nitrogen and sulphur or in
petrochemical industry to saturate the unsaturated hydrocarbons.
2. As an oxygen scavenger in heating applications to prevent corrosion in the
equipments.
3. As a fuel.
1.3.1. Hydrogen as a reactant
More than 50% of the worldwide production of hydrogen is devoted to ammonia production
[4]. Ammonia is the main feedstock for the fertilizer industry and is produced by the reaction
of hydrogen and nitrogen in a process called Haber.
In petrochemical industry, hydrogen is mostly used to produce refined hydrocarbons with
bigger H/C ratios. Through a process called hydrocraking, hydrogen reacts catalytically with
heavy hydrocarbons to finally produce smaller hydrocarbon molecules. In petrochemical
plants, due to environmental regulations, pollutants such as sulphur must be removed in a
stable chemical form. One common process is hydroprocessing of nitrogen and sulphur
components using hydrogen in order to remove them in the form of H2S and NH3. These
products are toxic and are subsequently converted into sulphur (through Claus process) and
KNO3 (nitrogen fixation)
Apart from these applications, hydrogen is the main feedstock for production of many
petrochemicals such as methanol. Methanol is produced from the reaction of hydrogen and
carbon dioxide over a mixture of catalysts at a relatively high pressure (5-10 MPa) and high
temperature (~523 K) [4]. In additions, hydrogen streams are used to recover oxidized
catalysts such as nickel to the active metal form.
28
1.3.2. Hydrogen as oxygen scavenger
In metallurgy industry, hydrogen mixed with nitrogen is used to trap oxygen molecules and
remove it from the system. In this method hydrogen reacts with oxygen to form water. The
same method is used in boiling water reactors to reduce the risk of corrosion [4].
1.3.3. Hydrogen as a fuel
Hydrogen in liquid form is mainly used as a propellant in the aerospace industry. Its mixture
with liquid oxygen is known to have high energy content per mass which is a key factor for
spatial projects.
Regarding its high energy content and its environmentally clean nature hydrogen seems to be
an interesting fuel for automobiles; however the major concern for this purpose is its storage
difficulties. A conventional automobile with a combustion engine, consumes around 46 L
(0.03-0.04 m3) of diesel weighing 43 kg for a distance of 500 km, while a hydrogen car with a
fuel cell engine needs about 5 kg of hydrogen for the same distance to travel. The major
problem is that 5 kg of hydrogen at ambient conditions occupies around 56000 L (56 m3) of
space. One possible solution is to use pressurized hydrogen gas but as previously stated,
hydrogen gas is not dense and therefore to reach such energy content a large storage tank is
required. For the case of a fuel cell engine at 70 MPa a high pressure tank of 260 L (0.26 m3)
weighing 125 kg is needed for a driving distance of 500 km [2].
For this purpose, in January 2003 the US Department Of Energy (DOE) has established a
Hydrogen Fuel Initiative to perform research, development and demonstration for developing
hydrogen storage methods to replace gasoline engines with fuel cells by 2015.
1.4. Hydrogen storage methods
Storage is probably the main obstacle in the immediate use of hydrogen as a fuel. Traditional
storage methods based on compression and liquefaction are efficient but their safety concerns
and their energy consuming process are not negligible. On the other hand, innovative methods
for storing hydrogen through entrapping gas molecules in porous materials or metal solids
either do not have a favourable thermodynamic or do not have an acceptable gravimetric
hydrogen content.
It must be reminded that efficiency of a hydrogen storage system is not only a problem of
mass density of hydrogen, or fast kinetics and favourable thermodynamics but also a matter of
energy consumption of the storage method itself. In fact, in each storage method the energy
29
needed to transform hydrogen from ambient condition to the storage condition, the energy
required to keep hydrogen in the storage medium and finally the energy consumed for
recovering hydrogen is of great importance.
In this section, the most common hydrogen storage methods are described regarding mass
density of stored hydrogen, storage thermodynamic conditions and the energy consumption of
the process. It is clear that the purpose of this dissertation is not to present all the hydrogen
storage methods, but to gather the most common ones and then introducing clathrate hydrates
as an alternative and innovative potential medium for hydrogen storage.
1.4.1. Gaseous storage (Compression)
Storage of hydrogen in gas form in the pressure vessels is known to be the simplest and the
most traditional storage method. Compressed hydrogen is usually stored under pressures
between 20 MPa to 35 MPa in special containers [5]. As hydrogen has a tendency to diffuse
into materials and cause leakage, it is usually stored in vessels made up of austenitic stainless
steel and aluminium alloys to overcome this inconvenience. Recently new carbon fiber-
jacketed aluminium-alloy cylinders are made, which can bear pressures up to 70 MPa [6].
One of the major inconveniences of stainless steel vessels is their weight. While the
gravimetric energy density of hydrogen stored in conventional steel containers under 20-30
MPa is calculated to be around 0.4 kWh·kg-1, efforts have been made to reduce the weight of
container to increase the gravimetric energy density of the system. New composite materials
have been suggested to replace the steel containers to increase the gravimetric energy density
of the system up to 1.833 kWh·kg-1. The main characteristics of two types of gaseous
hydrogen containers are compared in Table 4. As it can be seen in this table, reduction in the
weight of hydrogen containers is in favour of gravimetric energy density and storage pressure.
The important point in this table is that the cost of these containers varies from 40 €/kWh of
stored hydrogen for conventional stainless steels containers to 150 €/kWh for new composite
one.
Apart from the cost of the storage equipments such as vessels, valves, pipelines and safety
systems, one must consider the cost of the compressing process of hydrogen. From
thermodynamics the minimum work required for a reversible gas compression is the
isothermal compression in which temperature remains constant during the process through
cooling:
30
Equation (8)
For a reversible process, the heat exchanged for keeping the temperature constant (qc) can be
calculated:
Equation (9)
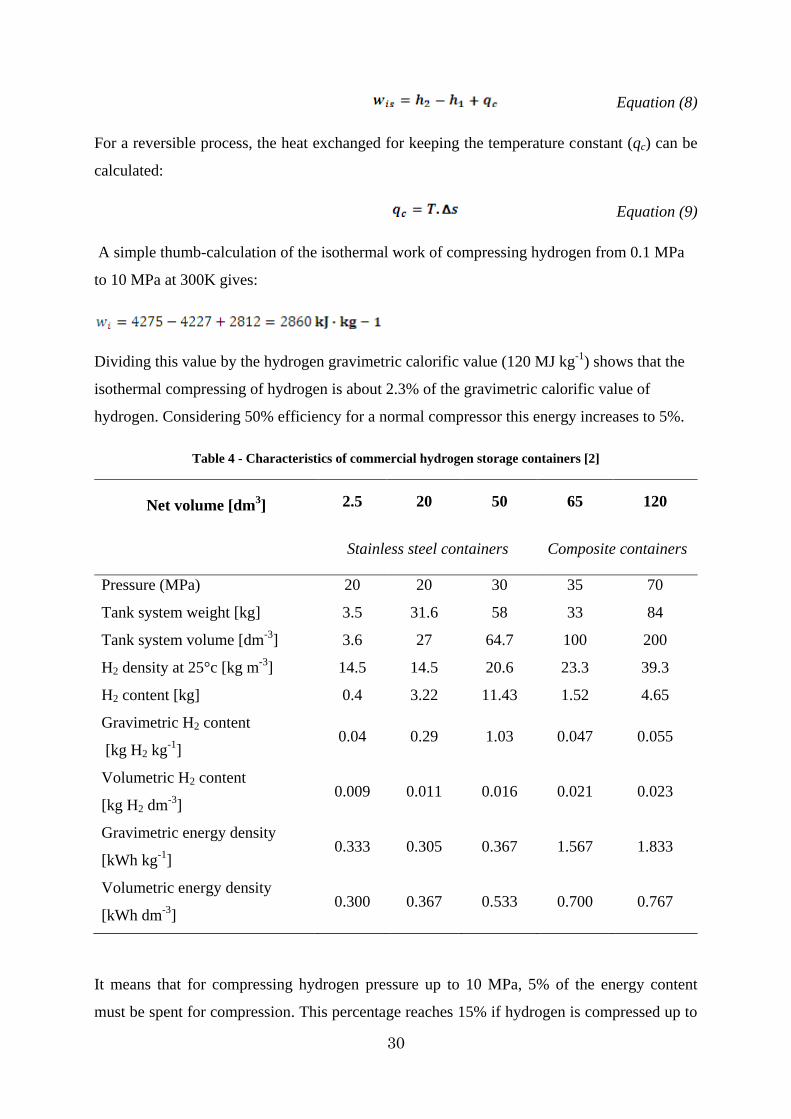
A simple thumb-calculation of the isothermal work of compressing hydrogen from 0.1 MPa
to 10 MPa at 300K gives:
Dividing this value by the hydrogen gravimetric calorific value (120 MJ kg-1) shows that the
isothermal compressing of hydrogen is about 2.3% of the gravimetric calorific value of
hydrogen. Considering 50% efficiency for a normal compressor this energy increases to 5%.
Table 4 - Characteristics of commercial hydrogen storage containers [2]
Net volume [dm3] 2.5 20 50 65 120
Stainless steel containers Composite containers
Pressure (MPa) 20 20 30 35 70
Tank system weight [kg] 3.5 31.6 58 33 84
Tank system volume [dm-3] 3.6 27 64.7 100 200
H2 density at 25°c [kg m-3] 14.5 14.5 20.6 23.3 39.3
H2 content [kg] 0.4 3.22 11.43 1.52 4.65
Gravimetric H2 content
[kg H2 kg-1] 0.04 0.29 1.03 0.047 0.055
Volumetric H2 content
[kg H2 dm-3] 0.009 0.011 0.016 0.021 0.023
Gravimetric energy density
[kWh kg-1] 0.333 0.305 0.367 1.567 1.833
Volumetric energy density
[kWh dm-3] 0.300 0.367 0.533 0.700 0.767
It means that for compressing hydrogen pressure up to 10 MPa, 5% of the energy content
must be spent for compression. This percentage reaches 15% if hydrogen is compressed up to
31
90 MPa. It must be insisted that the calculated work is the minimum work required to
compress hydrogen while in practice, hydrogen is compressed through an adiabatic process.
When a fluid flows through a restriction, such as a valve or a vessel, without any considerable
change in kinetic or potential energy, the primary result of the process is the pressure drop in
the fluid. This is called a throttling process in which no shaft work is produced. If this process
is done adiabatically i.e. in absence of heat exchange, the process occurs at constant enthalpy.
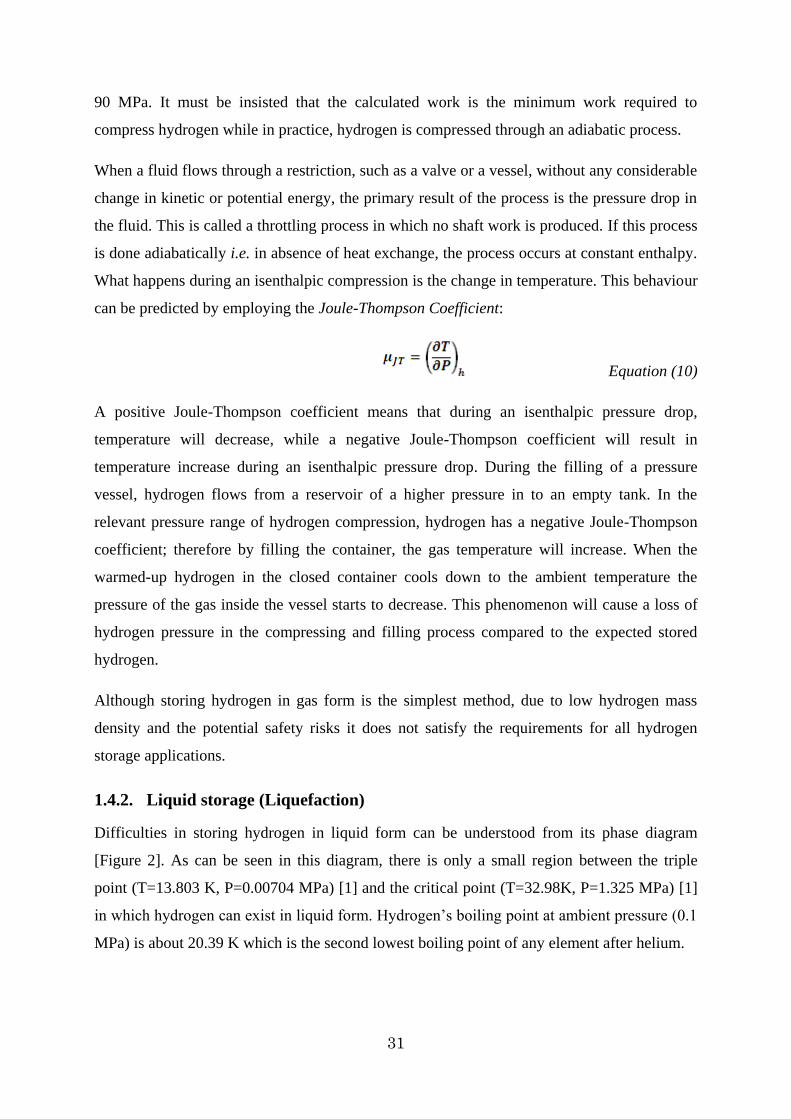
What happens during an isenthalpic compression is the change in temperature. This behaviour
can be predicted by employing the Joule-Thompson Coefficient:
Equation (10)
A positive Joule-Thompson coefficient means that during an isenthalpic pressure drop,
temperature will decrease, while a negative Joule-Thompson coefficient will result in
temperature increase during an isenthalpic pressure drop. During the filling of a pressure
vessel, hydrogen flows from a reservoir of a higher pressure in to an empty tank. In the
relevant pressure range of hydrogen compression, hydrogen has a negative Joule-Thompson
coefficient; therefore by filling the container, the gas temperature will increase. When the
warmed-up hydrogen in the closed container cools down to the ambient temperature the
pressure of the gas inside the vessel starts to decrease. This phenomenon will cause a loss of
hydrogen pressure in the compressing and filling process compared to the expected stored
hydrogen.
Although storing hydrogen in gas form is the simplest method, due to low hydrogen mass
density and the potential safety risks it does not satisfy the requirements for all hydrogen
storage applications.
1.4.2. Liquid storage (Liquefaction)
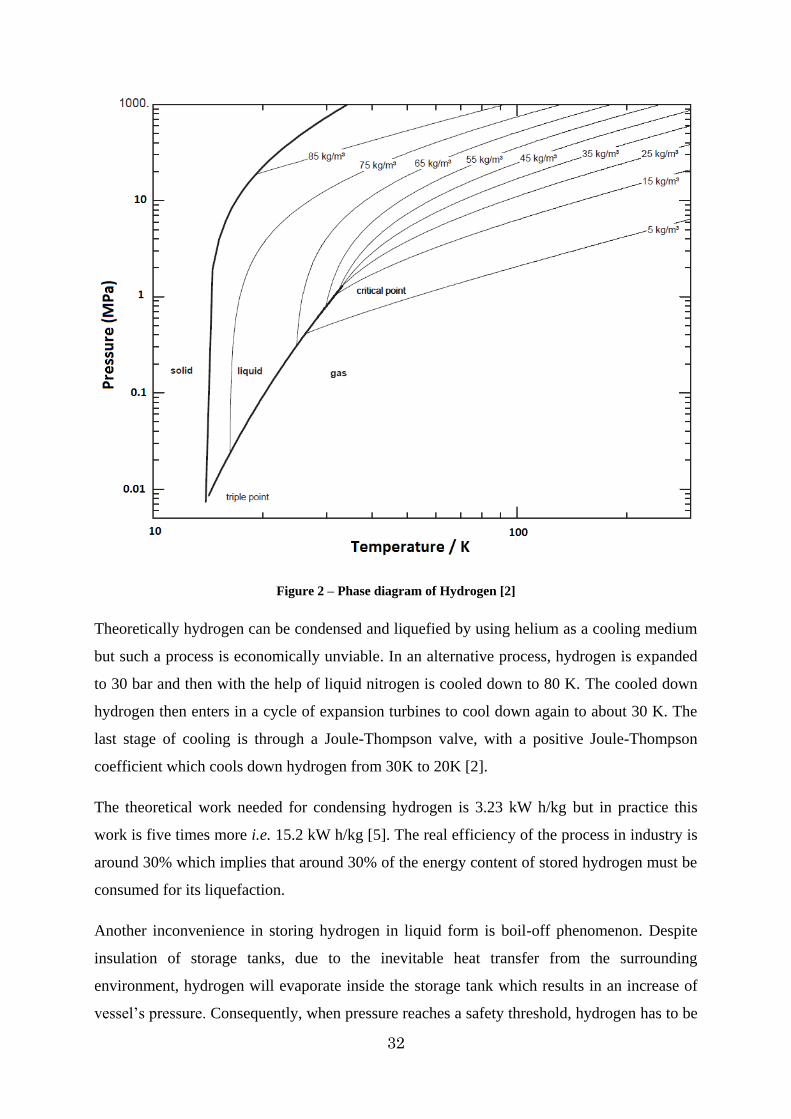
Difficulties in storing hydrogen in liquid form can be understood from its phase diagram
[Figure 2]. As can be seen in this diagram, there is only a small region between the triple
point (T=13.803 K, P=0.00704 MPa) [1] and the critical point (T=32.98K, P=1.325 MPa) [1]
in which hydrogen can exist in liquid form. Hydrogen‟s boiling point at ambient pressure (0.1
MPa) is about 20.39 K which is the second lowest boiling point of any element after helium.
32
Figure 2 – Phase diagram of Hydrogen [2]
Theoretically hydrogen can be condensed and liquefied by using helium as a cooling medium
but such a process is economically unviable. In an alternative process, hydrogen is expanded
to 30 bar and then with the help of liquid nitrogen is cooled down to 80 K. The cooled down
hydrogen then enters in a cycle of expansion turbines to cool down again to about 30 K. The
last stage of cooling is through a Joule-Thompson valve, with a positive Joule-Thompson
coefficient which cools down hydrogen from 30K to 20K [2].
The theoretical work needed for condensing hydrogen is 3.23 kW h/kg but in practice this
work is five times more i.e. 15.2 kW h/kg [5]. The real efficiency of the process in industry is
around 30% which implies that around 30% of the energy content of stored hydrogen must be
consumed for its liquefaction.
Another inconvenience in storing hydrogen in liquid form is boil-off phenomenon. Despite
insulation of storage tanks, due to the inevitable heat transfer from the surrounding
environment, hydrogen will evaporate inside the storage tank which results in an increase of
vessel‟s pressure. Consequently, when pressure reaches a safety threshold, hydrogen has to be
33
blown out to keep the tank pressure constant. This boil-off results in 1-2% loss of the mass of
stored hydrogen per day [6].
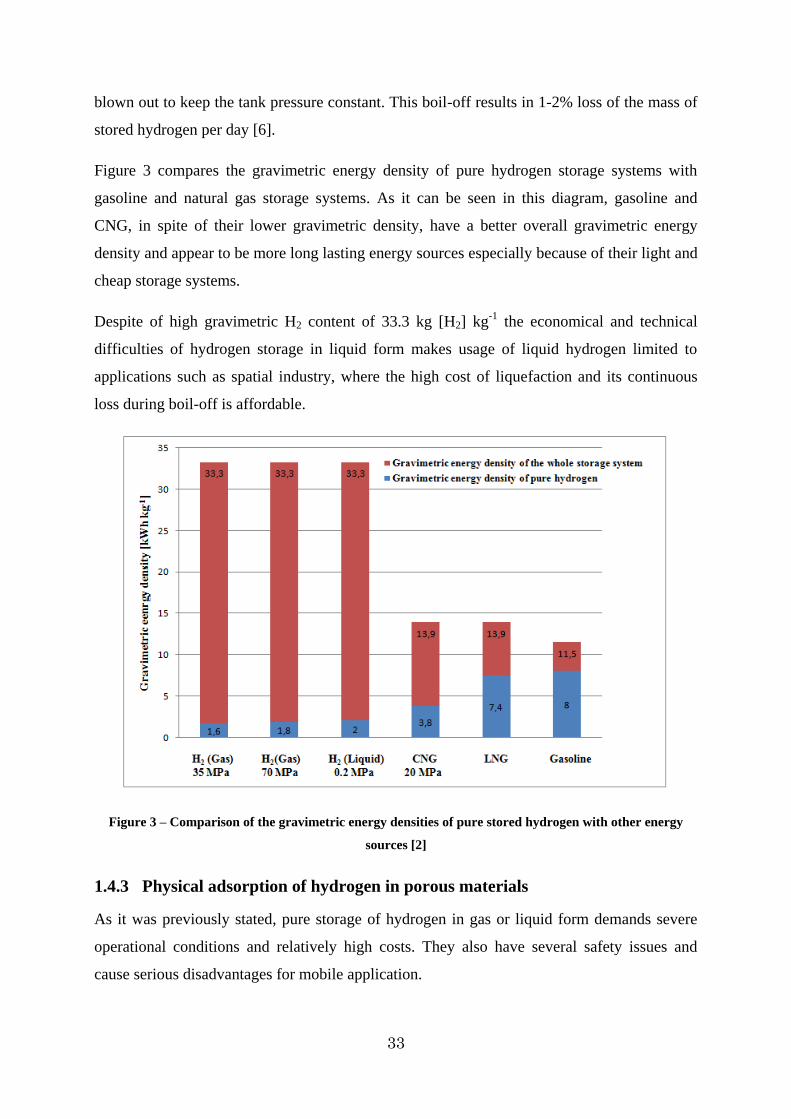
Figure 3 compares the gravimetric energy density of pure hydrogen storage systems with
gasoline and natural gas storage systems. As it can be seen in this diagram, gasoline and
CNG, in spite of their lower gravimetric density, have a better overall gravimetric energy
density and appear to be more long lasting energy sources especially because of their light and
cheap storage systems.
Despite of high gravimetric H2 content of 33.3 kg [H2] kg-1 the economical and technical
difficulties of hydrogen storage in liquid form makes usage of liquid hydrogen limited to
applications such as spatial industry, where the high cost of liquefaction and its continuous
loss during boil-off is affordable.
Figure 3 – Comparison of the gravimetric energy densities of pure stored hydrogen with other energy
sources [2]
1.4.3 Physical adsorption of hydrogen in porous materials
As it was previously stated, pure storage of hydrogen in gas or liquid form demands severe
operational conditions and relatively high costs. They also have several safety issues and
cause serious disadvantages for mobile application.
34
One alternative solution is to trap hydrogen molecules through an interaction with other
compounds by means of molecular or chemical bonds. Depending on the nature of interaction
between hydrogen and the supporting medium this phenomenon can be called physisorption
(physical adsorption) or chemisorptions (chemical adsorption).
In physical adsorption hydrogen is adsorbed in molecular form through van der Waals forces
with the molecules on the surface of adsorbent. Physical adsorption is an exothermic process
and because it occurs in molecular scale, without any dissociation of hydrogen molecule, the
heat released from this process is not considerable. This is an advantage for physical
adsorption compared to chemisorption methods, in which the excessive amount of heat
produced results in the increase of the temperature of hydrogen storage tank. However
because of the weak van der Waals interaction between hydrogen molecule and solid surface
the amount of stored hydrogen is low.
Another advantage of physisorption is that it is a reversible process which means hydrogen
can be easily adsorbed and desorbed several times without any loss. Moreover, desorption
process demands generally no activation energy which makes adsorption/desorption kinetics
favourable. This favourable fast and reversible kinetic is a key point in application of
physisorption for mobile storage of hydrogen.
One key parameter in efficiency of physisorption is the Surface Specific Area (SSA) which
controls hydrogen adsorption capacity of the adsorbent material [7]. The larger the specific
surface area is, the more hydrogen molecules will be adsorbed on the adsorbent surface. In
this sense, the most frequently used materials for hydrogen physisorption are activated
carbons, carbon nano structures (e.g. carbon nanotube), fullerenes, zeolites and metal organic
frame works (MOF) which are explained below:
Carbon materials
In the nature, carbon exists in two principal forms of diamond and graphite which none of
them are porous. However, a porous nano-structural form of carbon exists which is made up
of cyclohexane like carbon chains. This variety of carbons differs from each other by the way
these carbon hexagons are arranged. These porous carbon materials are generally divided into
two main groups: carbon nanotubes which are composed of long ordered chains of carbon
hexagons and active carbons which have irregular structures.
35
Activated carbons with a high surface area (up to 3300 m2·g-1) are reported to have a storage
capacity of about 6 wt% at 70 K and 4 MPa [7]. Reducing pressure to 2 MPa at the same
temperature (77 K) gives a storage capacity of 5 wt% [8]. The same activated carbon at the
same temperature and at ambient pressure is reported to have a storage capacity of 4.5 wt%
[9]. Comparatively, carbon nanotubes at liquid nitrogen temperature (77 K) and 4 MPa were
reported to adsorb up to 8 wt% of hydrogen [10].
Fullerenes
Contrary to carbon nanotubes and activated carbons, bulk fullerene C60 powder does not have
a high surface area. Nevertheless the solid C60 is capable of hosting some hydrogen
molecules. The hydrogen capacity of C60 is limited to 0.1-0.2 wt% of H2 [11-13] while by
increasing the pressure until 30 MPa it will reach the maximum capacity of 0.7 wt% [14].
Zeolites
Zeolites are crystalline compounds composed of aluminosilicate structure made between Si+4
and Al+3 ions with oxygen. Due to the ionic base of their structure and therefore presence of
electrostatic forces inside these pores, zeolites can produce adsorption sites for hosting
different molecules. Several investigations have been carried on the storage capacity of
zeolites for storing hydrogen recently. The very early results show a small capacity of 0.1
wt% at ambient conditions [15] while another research at 77 K shows a storage capacity of up
to 2.5 wt% at 1.5 MPa [16].
Metal-Organic Frame works (MOFs)
Among different materials for storing hydrogen by physisorption, Metal Organic Frame
works (MOFs) have attracted the most attentions. MOFs are crystalline coordination
polymers consisting of metal clusters connected together by organic linkers [Figure 4].
Combining different organic ligands and ion cluster make it possible to synthesize different
MOFs with different structure modified properly for hydrogen storage.
This possibility of modifying the structure makes MOFs the most interesting storage materials
among all the physical adsorption methods. Furthermore they have an extremely high surface
area (10400 m2/g for MOF-200 and MOF-210 [17]) which permits a high hydrogen
adsorption for this group of materials.
The first investigation on the MOFs storage capacity for hydrogen storage shows an
interesting value of 1 wt% at ambient temperature and 0.2 MPa for MOF-5 [18]. Although
36
this storage capacity is relatively low, it is still one of the best among all the physisorption
mechanisms at ambient temperature. However, at lower temperatures (78 K) the storage
capacity of the same MOFs rises to 4.5 wt% [18]. Recently a maximum storage capacity of
4.5-5.2 wt% was reported for MOF-5 at 5 MPa and 77 K [19-21].
Figure 4 – Single crystal structure x-ray of MOF-5. Eight metal clusters each containing four ZnO4 tetrahedral nodes, make a enclosed large cavity for entrapping hydrogen molecules. Reprinted from [18].
After MOF-5 many other MOF structures were investigated for hydrogen storage showing
storage capacity of 7.5 wt% at 77 K and 8 MPa [21]. This value is the highest storage
capacity reported for any porous material storing hydrogen in molecular form.
1.4.4. Metal hydrides and complex hydrides (Chemisorption)
Apart from the physisorption in which hydrogen is adsorbed in molecular form by making
van der Waals bonds, hydrogen can chemically react (chemisorption) with some solids
forming covalent or ionic bonds. The most important materials for storage of hydrogen
through chemisorption are metal hydrides. Metal hydrides are single phase compounds
formed by chemical bonds between a host metal and hydrogen. Historically, chemistry of
hydrides has been mostly developed for making rechargeable batteries however new research
are being targeted on using hydrides as a storage medium for hydrogen.
Depending on the metal host, metal hydrides can be divided as:
37
Ionic or Saline hydrides: which contain binary hydride of alkali metals such as calcium,
sodium, lithium, or barium. In these series of hydrides hydrogen is in the form of negative ion
(H-) and makes a ionic bond with solid metals. The most common ionic hybrids are NaH and
CaH2. MgH2 as the most studied hybrid of this group is not completely a real ionic hydride. In
MgH2 the chemical bond between hydrogen and metal is partly ionic and partly covalent,
however due to the nature of Mg it is categorized in this group [2]. The main reason of
attention to magnesium hydride is that between all the ionic hydrides MgH2 shows a high
hydrogen gravimetric capacity of 7.7 wt% with a good reversible behaviour [22]. However
the main inconvenience of MgH2 as well as the other metal hydrides is its slow and high
endothermic desorption process which results in an increase in the temperature of the released
hydrogen. For example, desorption of MgH2 releases hydrogen at 573 K and with a hydrogen
pressure of 0.1 MPa [23]. In additions, MgH2 is highly reactive with air.
Metallic hydrides are compounds of hydrogen and transition metals including rare earth
elements. Examples of these series of hydrides are, TiH2 or ThH2.
Complex hydrides in which hydrogen is directly bounded to the central atom through covalent
bonds. The general chemical formula of complex hydrides is AxMeyHz where A is usually an
element from the first group or the second group of the periodic table and Me is usually either
boron or aluminium [2]. The most well studied complex hybrid is LiBH4 which has proved to
have hydrogen gravimetric density of 18 wt% [24]. Table 5 presents a comparative hydrogen
gravity density of some well described complex hydrides.
As it is shown in Table [5], despite of their high hydrogen content, dehydrogenation
(decomposition) of these complex hydrides is highly endothermic and demands a lot of
energy. On the other hand those hydrides that adsorb and desorb hydrogen at ambient
temperature and pressure mainly consist of transition metals and therefore the gravimetric
hydrogen content is dramatically reduced (less than 3wt%). For instance, LaNi5H5 with a
volumetric density of 115 kg m-3 has a gravimetric hydrogen content of only 1.4 wt% [4].
To summarize hydrogen storage in hydrides, it must be emphasized that although metal
hydrides and complex hydrides have the advantage of containing high hydrogen contents, the
slow adsorption/desorption kinetics and heat release during their dehydrogenation process is a
big obstacle in their usage as a commercial hydrogen storage medium. On the other hand
those hydrides which possess a favourable adsorption/desorption kinetics have low
gravimetric hydrogen contents.
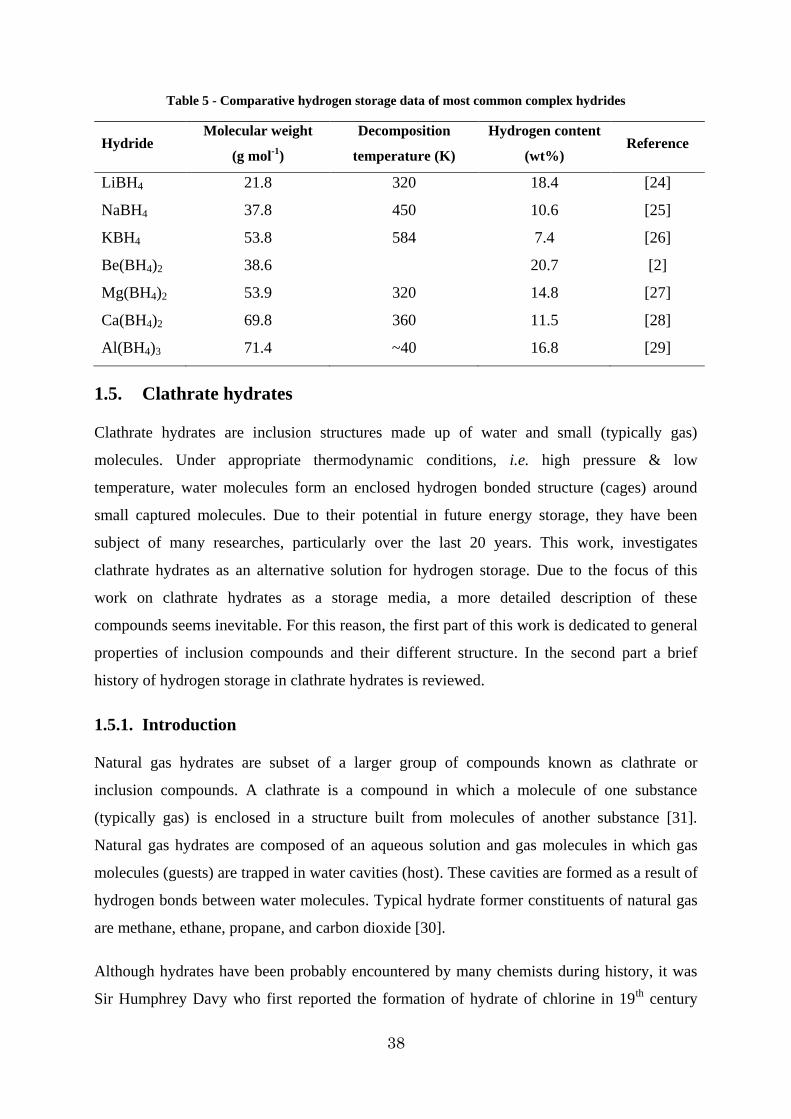
38
Table 5 - Comparative hydrogen storage data of most common complex hydrides
Hydride Molecular weight
(g mol-1)
Decomposition
temperature (K)
Hydrogen content
(wt%) Reference
LiBH4 21.8 320 18.4 [24]
NaBH4 37.8 450 10.6 [25]
KBH4 53.8 584 7.4 [26]
Be(BH4)2 38.6 20.7 [2]
Mg(BH4)2 53.9 320 14.8 [27]
Ca(BH4)2 69.8 360 11.5 [28]
Al(BH4)3 71.4 ~40 16.8 [29]
1.5. Clathrate hydrates
Clathrate hydrates are inclusion structures made up of water and small (typically gas)
molecules. Under appropriate thermodynamic conditions, i.e. high pressure & low
temperature, water molecules form an enclosed hydrogen bonded structure (cages) around
small captured molecules. Due to their potential in future energy storage, they have been
subject of many researches, particularly over the last 20 years. This work, investigates
clathrate hydrates as an alternative solution for hydrogen storage. Due to the focus of this
work on clathrate hydrates as a storage media, a more detailed description of these
compounds seems inevitable. For this reason, the first part of this work is dedicated to general
properties of inclusion compounds and their different structure. In the second part a brief
history of hydrogen storage in clathrate hydrates is reviewed.
1.5.1. Introduction
Natural gas hydrates are subset of a larger group of compounds known as clathrate or
inclusion compounds. A clathrate is a compound in which a molecule of one substance
(typically gas) is enclosed in a structure built from molecules of another substance [31].
Natural gas hydrates are composed of an aqueous solution and gas molecules in which gas
molecules (guests) are trapped in water cavities (host). These cavities are formed as a result of
hydrogen bonds between water molecules. Typical hydrate former constituents of natural gas
are methane, ethane, propane, and carbon dioxide [30].
Although hydrates have been probably encountered by many chemists during history, it was
Sir Humphrey Davy who first reported the formation of hydrate of chlorine in 19th century
39
[30, 31]. Michael Faraday continued Davy‟s work, by studying the composition of chlorine
hydrates, and in 1823 for the first time he measured the composition of hydrate. But it was not
until 20th century that the industrial importance of gas hydrates was discovered. During the
development of gas industry it was discovered that under relatively high pressure, pipelines
and processing equipments plug because of the formation of an ice like substance, which
conditions of formation was however different than ordinary ice.
1.5.2. Water and Ice (irregular) properties
For a better understanding of hydrates, one must first study water (and Ice) unusual properties
caused by hydrogen bonding. Water molecules possess four valance electrons from lone pair
orbital of two oxygen atoms. The shared electrons with the protons give the water molecule
two positive charges (hydrogen atoms) and the lone pair electrons give the molecule two
negative charges (oxygen atoms). The result is a molecule with four charges and a permanent
electric dipole.
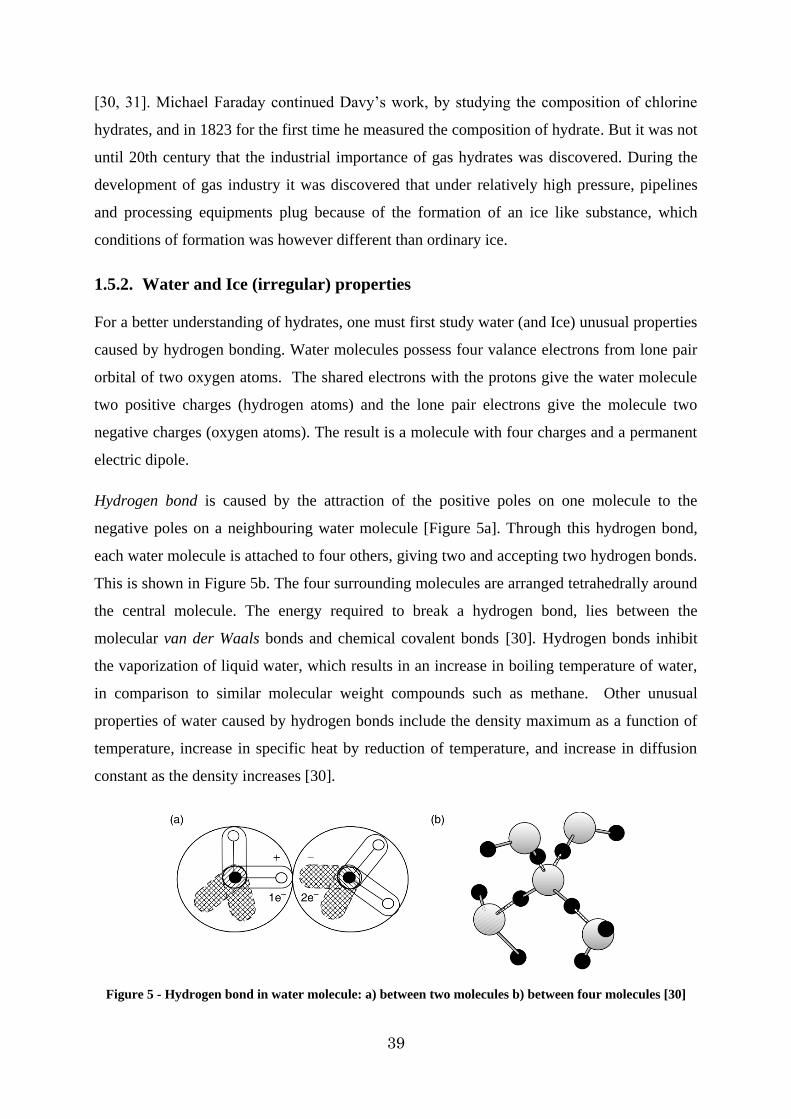
Hydrogen bond is caused by the attraction of the positive poles on one molecule to the
negative poles on a neighbouring water molecule [Figure 5a]. Through this hydrogen bond,
each water molecule is attached to four others, giving two and accepting two hydrogen bonds.
This is shown in Figure 5b. The four surrounding molecules are arranged tetrahedrally around
the central molecule. The energy required to break a hydrogen bond, lies between the
molecular van der Waals bonds and chemical covalent bonds [30]. Hydrogen bonds inhibit
the vaporization of liquid water, which results in an increase in boiling temperature of water,
in comparison to similar molecular weight compounds such as methane. Other unusual
properties of water caused by hydrogen bonds include the density maximum as a function of
temperature, increase in specific heat by reduction of temperature, and increase in diffusion
constant as the density increases [30].
Figure 5 - Hydrogen bond in water molecule: a) between two molecules b) between four molecules [30]
40
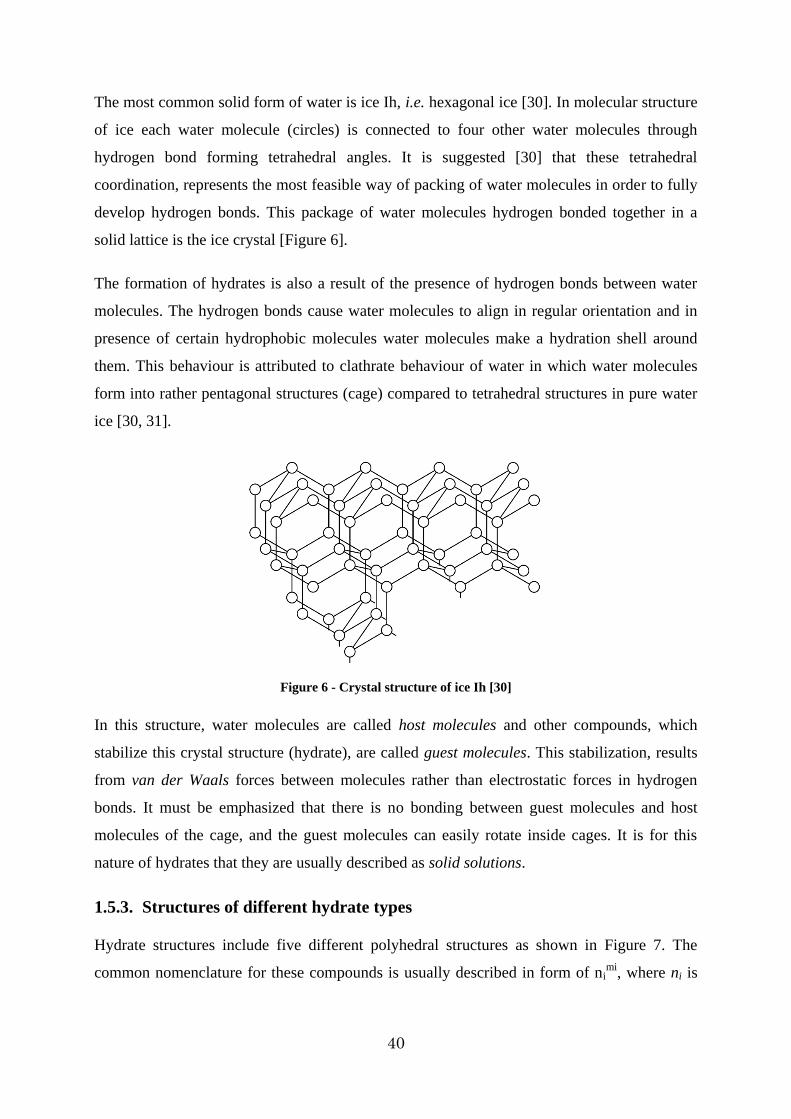
The most common solid form of water is ice Ih, i.e. hexagonal ice [30]. In molecular structure
of ice each water molecule (circles) is connected to four other water molecules through
hydrogen bond forming tetrahedral angles. It is suggested [30] that these tetrahedral
coordination, represents the most feasible way of packing of water molecules in order to fully
develop hydrogen bonds. This package of water molecules hydrogen bonded together in a
solid lattice is the ice crystal [Figure 6].
The formation of hydrates is also a result of the presence of hydrogen bonds between water
molecules. The hydrogen bonds cause water molecules to align in regular orientation and in
presence of certain hydrophobic molecules water molecules make a hydration shell around
them. This behaviour is attributed to clathrate behaviour of water in which water molecules
form into rather pentagonal structures (cage) compared to tetrahedral structures in pure water
ice [30, 31].
Figure 6 - Crystal structure of ice Ih [30]
In this structure, water molecules are called host molecules and other compounds, which
stabilize this crystal structure (hydrate), are called guest molecules. This stabilization, results
from van der Waals forces between molecules rather than electrostatic forces in hydrogen
bonds. It must be emphasized that there is no bonding between guest molecules and host
molecules of the cage, and the guest molecules can easily rotate inside cages. It is for this
nature of hydrates that they are usually described as solid solutions.
1.5.3. Structures of different hydrate types
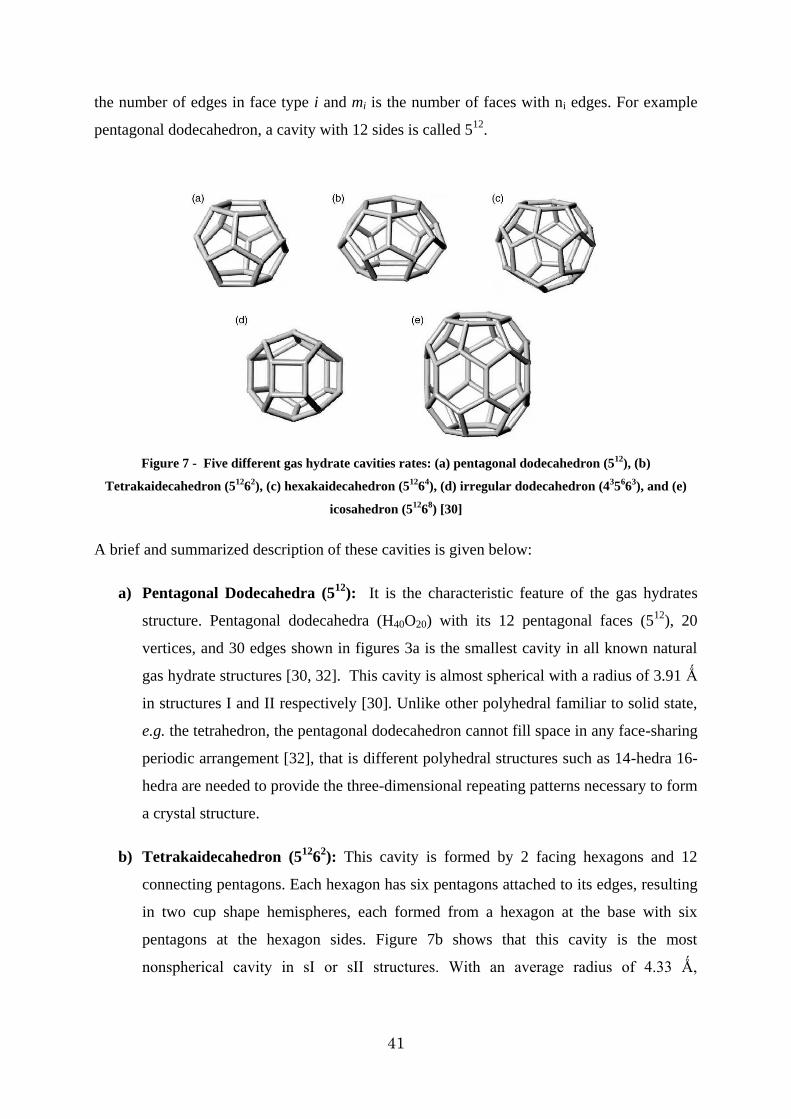
Hydrate structures include five different polyhedral structures as shown in Figure 7. The
common nomenclature for these compounds is usually described in form of nimi, where ni is
41
the number of edges in face type i and mi is the number of faces with ni edges. For example
pentagonal dodecahedron, a cavity with 12 sides is called 512.
Figure 7 - Five different gas hydrate cavities rates: (a) pentagonal dodecahedron (512), (b)
Tetrakaidecahedron (51262), (c) hexakaidecahedron (51264), (d) irregular dodecahedron (435663), and (e)
icosahedron (51268) [30]
A brief and summarized description of these cavities is given below:
a) Pentagonal Dodecahedra (512): It is the characteristic feature of the gas hydrates
structure. Pentagonal dodecahedra (H40O20) with its 12 pentagonal faces (512), 20
vertices, and 30 edges shown in figures 3a is the smallest cavity in all known natural
gas hydrate structures [30, 32]. This cavity is almost spherical with a radius of 3.91 Ǻ
in structures I and II respectively [30]. Unlike other polyhedral familiar to solid state,
e.g. the tetrahedron, the pentagonal dodecahedron cannot fill space in any face-sharing
periodic arrangement [32], that is different polyhedral structures such as 14-hedra 16-
hedra are needed to provide the three-dimensional repeating patterns necessary to form
a crystal structure.
b) Tetrakaidecahedron (51262): This cavity is formed by 2 facing hexagons and 12
connecting pentagons. Each hexagon has six pentagons attached to its edges, resulting
in two cup shape hemispheres, each formed from a hexagon at the base with six
pentagons at the hexagon sides. Figure 7b shows that this cavity is the most
nonspherical cavity in sI or sII structures. With an average radius of 4.33 Ǻ,
42
tetrakaidecahedron is large enough to contain molecules smaller the 6.0 Ǻ in diameter
[30].
c) Hexakaidecahedron (51264): It is a sixteen-sided polyhedron with twelve pentagonal
faces and four hexagonal faces. Each hexagonal face is surrounded entirely by
pentagonal faces. 16-hedron is the most spherical cavity of five types, and can contain
molecules as large as 6.6 Ǻ. Therefore, when larger components of natural gas such as
propane or iso-butane form simple (single guest) hydrates, they stabilize this cavity
alone [30, 31].
d) Irregular dodecahedron (435663) and the icosahedron (51268): These two rare
cavities are constructing parts of structure H of hydrates. Irregular dodecahedron has
three square faces, six pentagonal faces and three hexagonal faces. Icosahedron is a
twenty-sided polyhedron with twelve pentagonal faces and eight hexagonal faces.
Assembly of hydrate cavities together, forms different clathrate hydrate structures, sometimes
known as hydrate types. Among different possible hydrate structures, three types are the most
common clathrate hydrate structures: structure I (sI), structure II (sII) and structure H (sH). A
brief description of each of these different structures is given:
I. Structure I (sI):
This is the simplest structure of hydrates, made up of 2 dodecahedron (512) and 6
tetrakaidecahedron (51262). There are only 46 water molecules inside the structure I lattice,
and there are only 8 polyhedral patterns totally included within the cube. In the presence of a
hydrate former (X), and in the case that this guest molecule occupies all the cages, the
theoretical formula would be X.5 ¾ H2O, but it should be taken into account that not all of the
hydrate structures are stoichiometric, which means a stable hydrate can form without a guest
molecule occupying all the cages [30,31]. Common guest molecules for this structure include
CH4, CO2 and H2S. A schematic view of this structure is given in Figure 8.
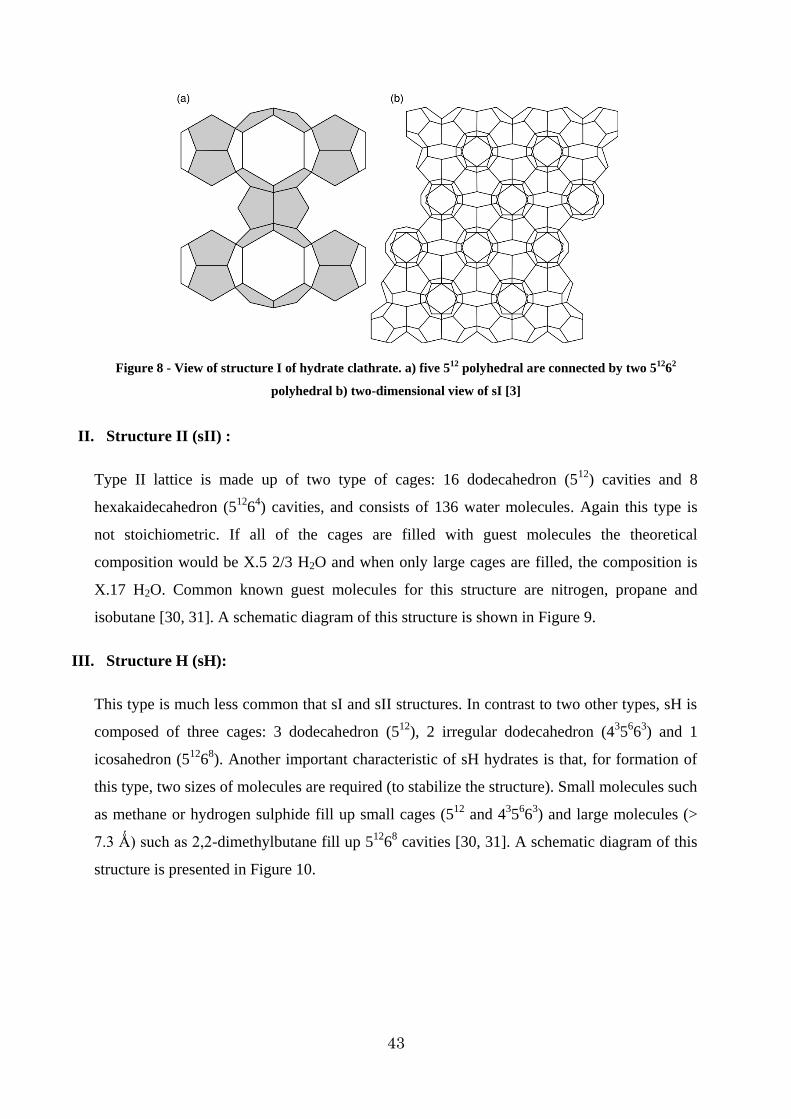
43
Figure 8 - View of structure I of hydrate clathrate. a) five 512 polyhedral are connected by two 51262
polyhedral b) two-dimensional view of sI [3]
II. Structure II (sII) :
Type II lattice is made up of two type of cages: 16 dodecahedron (512) cavities and 8
hexakaidecahedron (51264) cavities, and consists of 136 water molecules. Again this type is
not stoichiometric. If all of the cages are filled with guest molecules the theoretical
composition would be X.5 2/3 H2O and when only large cages are filled, the composition is
X.17 H2O. Common known guest molecules for this structure are nitrogen, propane and
isobutane [30, 31]. A schematic diagram of this structure is shown in Figure 9.
III. Structure H (sH):
This type is much less common that sI and sII structures. In contrast to two other types, sH is
composed of three cages: 3 dodecahedron (512), 2 irregular dodecahedron (435663) and 1
icosahedron (51268). Another important characteristic of sH hydrates is that, for formation of
this type, two sizes of molecules are required (to stabilize the structure). Small molecules such
as methane or hydrogen sulphide fill up small cages (512 and 435663) and large molecules (>
7.3 Ǻ) such as 2,2-dimethylbutane fill up 51268 cavities [30, 31]. A schematic diagram of this
structure is presented in Figure 10.
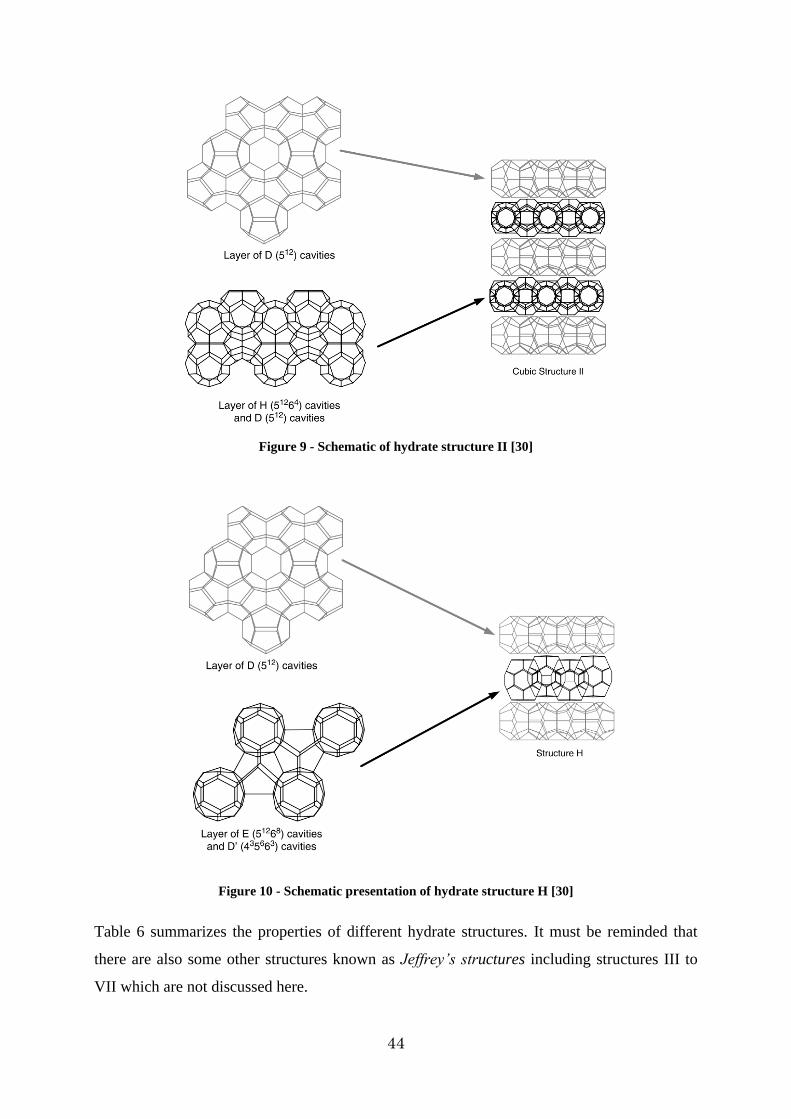
44
Figure 9 - Schematic of hydrate structure II [30]
Figure 10 - Schematic presentation of hydrate structure H [30]
Table 6 summarizes the properties of different hydrate structures. It must be reminded that
there are also some other structures known as Jeffrey’s structures including structures III to
VII which are not discussed here.
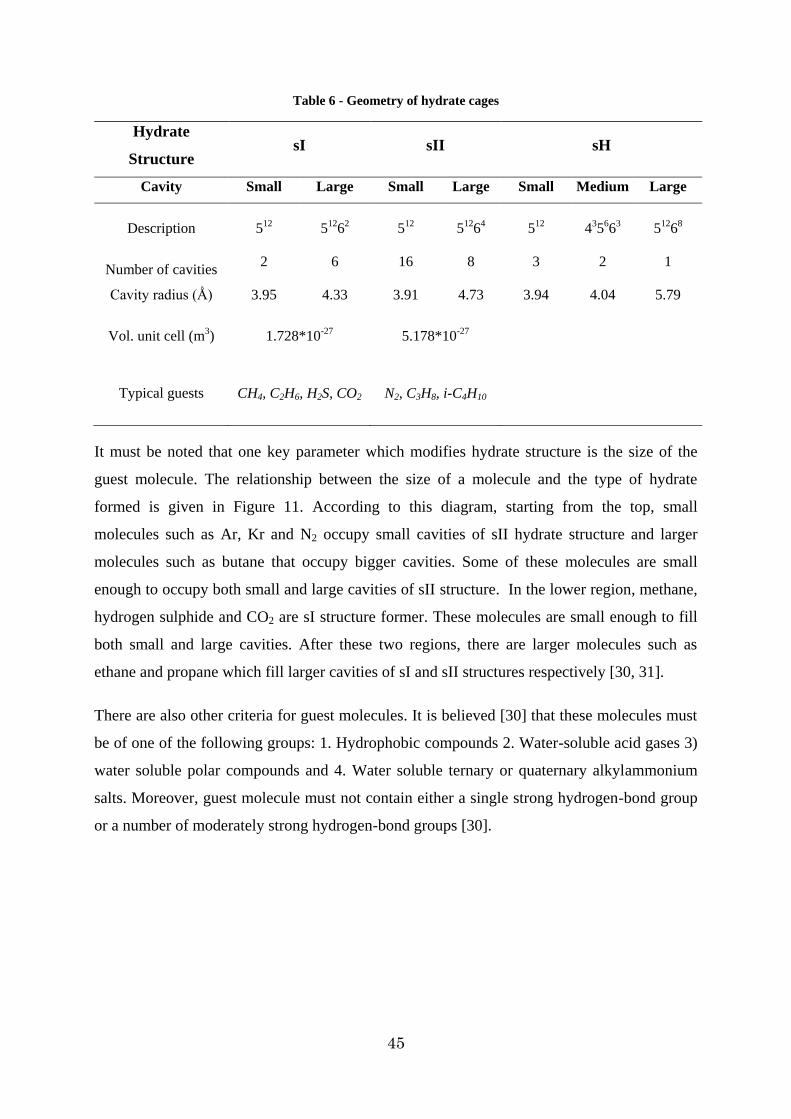
45
Table 6 - Geometry of hydrate cages
Hydrate
Structure sI sII sH
Cavity Small Large Small Large Small Medium Large
Description 512 51262 512 51264 512 435663 51268
Number of cavities 2 6 16 8 3 2 1
Cavity radius (Ǻ) 3.95 4.33 3.91 4.73 3.94 4.04 5.79
Vol. unit cell (m3) 1.728*10-27 5.178*10-27
Typical guests CH4, C2H6, H2S, CO2 N2, C3H8, i-C4H10
It must be noted that one key parameter which modifies hydrate structure is the size of the
guest molecule. The relationship between the size of a molecule and the type of hydrate
formed is given in Figure 11. According to this diagram, starting from the top, small
molecules such as Ar, Kr and N2 occupy small cavities of sII hydrate structure and larger
molecules such as butane that occupy bigger cavities. Some of these molecules are small
enough to occupy both small and large cavities of sII structure. In the lower region, methane,
hydrogen sulphide and CO2 are sI structure former. These molecules are small enough to fill
both small and large cavities. After these two regions, there are larger molecules such as
ethane and propane which fill larger cavities of sI and sII structures respectively [30, 31].
There are also other criteria for guest molecules. It is believed [30] that these molecules must
be of one of the following groups: 1. Hydrophobic compounds 2. Water-soluble acid gases 3)
water soluble polar compounds and 4. Water soluble ternary or quaternary alkylammonium
salts. Moreover, guest molecule must not contain either a single strong hydrogen-bond group
or a number of moderately strong hydrogen-bond groups [30].
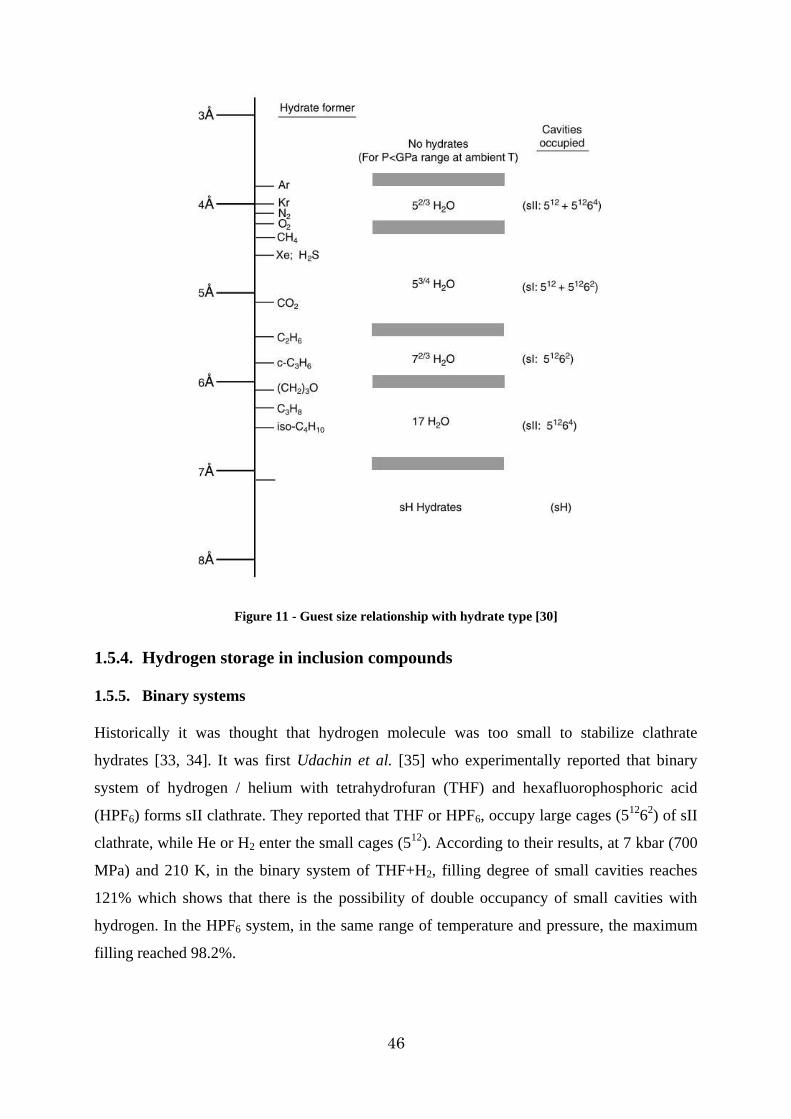
46
Figure 11 - Guest size relationship with hydrate type [30]
1.5.4. Hydrogen storage in inclusion compounds
1.5.5. Binary systems
Historically it was thought that hydrogen molecule was too small to stabilize clathrate
hydrates [33, 34]. It was first Udachin et al. [35] who experimentally reported that binary
system of hydrogen / helium with tetrahydrofuran (THF) and hexafluorophosphoric acid
(HPF6) forms sII clathrate. They reported that THF or HPF6, occupy large cages (51262) of sII
clathrate, while He or H2 enter the small cages (512). According to their results, at 7 kbar (700
MPa) and 210 K, in the binary system of THF+H2, filling degree of small cavities reaches
121% which shows that there is the possibility of double occupancy of small cavities with
hydrogen. In the HPF6 system, in the same range of temperature and pressure, the maximum
filling reached 98.2%.
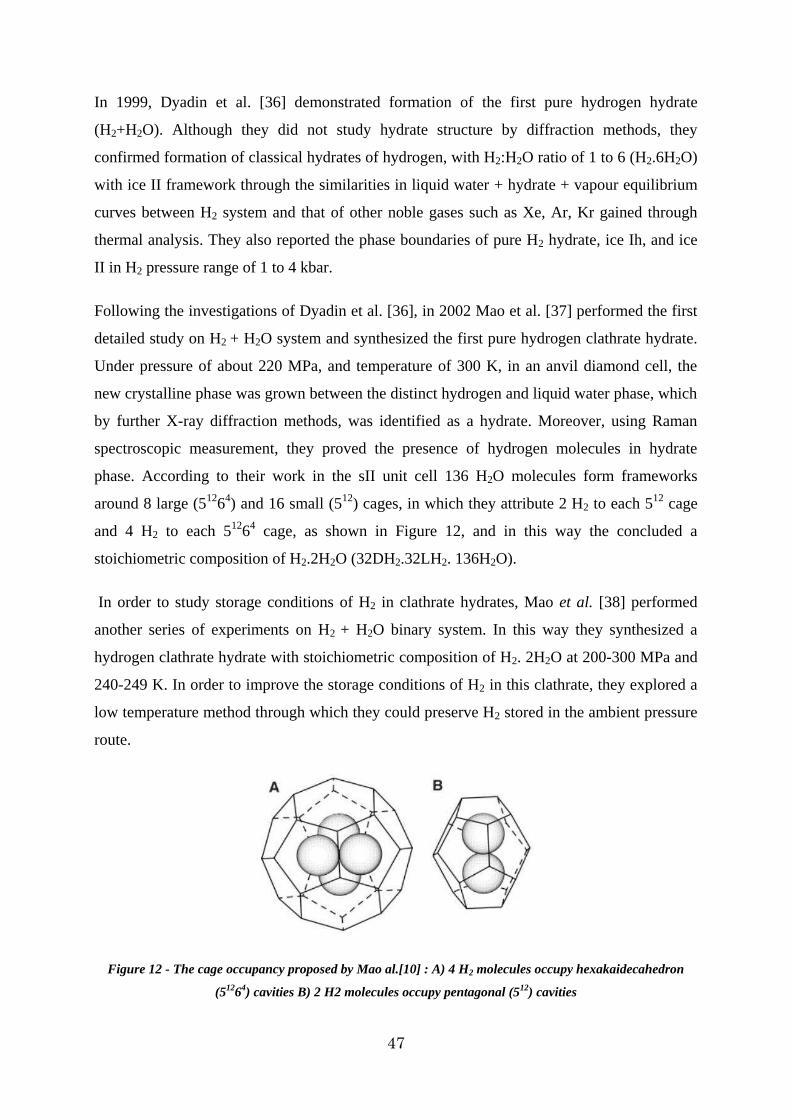
47
In 1999, Dyadin et al. [36] demonstrated formation of the first pure hydrogen hydrate
(H2+H2O). Although they did not study hydrate structure by diffraction methods, they
confirmed formation of classical hydrates of hydrogen, with H2:H2O ratio of 1 to 6 (H2.6H2O)
with ice II framework through the similarities in liquid water + hydrate + vapour equilibrium
curves between H2 system and that of other noble gases such as Xe, Ar, Kr gained through
thermal analysis. They also reported the phase boundaries of pure H2 hydrate, ice Ih, and ice
II in H2 pressure range of 1 to 4 kbar.
Following the investigations of Dyadin et al. [36], in 2002 Mao et al. [37] performed the first
detailed study on H2 + H2O system and synthesized the first pure hydrogen clathrate hydrate.
Under pressure of about 220 MPa, and temperature of 300 K, in an anvil diamond cell, the
new crystalline phase was grown between the distinct hydrogen and liquid water phase, which
by further X-ray diffraction methods, was identified as a hydrate. Moreover, using Raman
spectroscopic measurement, they proved the presence of hydrogen molecules in hydrate
phase. According to their work in the sII unit cell 136 H2O molecules form frameworks
around 8 large (51264) and 16 small (512) cages, in which they attribute 2 H2 to each 512 cage
and 4 H2 to each 51264 cage, as shown in Figure 12, and in this way the concluded a
stoichiometric composition of H2.2H2O (32DH2.32LH2. 136H2O).
In order to study storage conditions of H2 in clathrate hydrates, Mao et al. [38] performed
another series of experiments on H2 + H2O binary system. In this way they synthesized a
hydrogen clathrate hydrate with stoichiometric composition of H2. 2H2O at 200-300 MPa and
240-249 K. In order to improve the storage conditions of H2 in this clathrate, they explored a
low temperature method through which they could preserve H2 stored in the ambient pressure
route.
Figure 12 - The cage occupancy proposed by Mao al.[10] : A) 4 H2 molecules occupy hexakaidecahedron
(51264) cavities B) 2 H2 molecules occupy pentagonal (512) cavities
48
In their method, they proposed that hydrogen is retained and solidified by weak bonding to
host molecules under moderate synthesis pressure and temperature. The solid is cooled down
to low temperature (77 K) and the pressure is released to the ambient pressure. By this
experiment they claimed that they have retained 50 g·L-1 hydrogen by volume, which is 5.3
wt%.
The results of Mao et al. [37, 38] were considered as important steps in hydrogen storage. The
hydrogen content reported (5.3 wt%) was in line with the storage value targeted by DOE‟s
2010 goal (5.5 wt%). Moreover, simple hydrogen hydrate has several advantages as a
hydrogen storage material. First of all, the storage material is pure water which is abundant
and not expensive. Also, when hydrogen is released the only by-product is water which is
again reusable and compatible with hydrogen fuel cells [34]. Secondly the formation and
decomposition kinetics are rapid. Furthermore, as hydrogen is stored in molecular form, no
chemical reaction is required for decomposition of hydrate and release of hydrogen.
After the works of Dyadin et al. [36] and Mao et al. [37, 38], Lokshin et al. [39] suggested a
very fast method for hydrogen hydrate production from pure D2 gas and ice Ih at 77-273 K,
which is at least 100 times faster compared to conventional methods. (They used D2O
water/ice and D2 gas for study instead of hydrogen, in order to minimize the background of
collected diffraction patterns). In this experiment, instead of forming hydrate from H2O/H2
reaction, they produced hydrate from powdered ice Ih in presence of hydrogen gas. According
to their results, at high pressures (1500- 2000 bar) hydrates forms in less than 5 minutes, and
at moderate pressure (500 bar) hydrate forms in 30 minutes [39].
Following the work of Mao et al. [37,38] a controversy arose on the double occupancy of the
small pentagonal cages by 2 hydrogen molecules, and the reproducibility of their results was
questioned. It was first Lokshin et al. [40] who discussed the “unusually high guest/H2O ratio
of 0.45” proposed by Mao et al. [37, 38]. Through their neutron diffraction experiments they
found out that the number of D2 molecules (again deuterium was used in order to minimize
the background of collected diffraction patterns) and their distribution in the clathrate
structure depend on the temperature and pressure. They performed their measurements at two
different thermal conditions. Firstly, at temperatures below 50 K and then at temperatures
around 180 K. At temperatures below 50 K (ambient pressure) the large cage was found to be
occupied by four D2 molecules, whereas small cages were occupied by only one D2 molecule
[40]. As the temperature increases, cage occupancy decreases where at 180 K and 2 kbar, the
49
lowest occupancy of large cages is found to be 2 D2 molecules which is probably a minimum
value necessary for the stability of the framework structure. In contrary to Mao et al. findings
[37,38], Lokshin et al. [40] demonstrated single cage occupancy of the small cavities by D2
molecules at 163 K and atmospheric pressure. They also proposed a stoichiometric
composition of 48H2.136H2O for hydrogen hydrate. This was also confirmed by Strobel et al.
[34, 41]. Assuming single occupancy in small cavities, the maximum potential capacity of
hydrogen hydrates storage systems reduces from 5 wt.% to 3.8 wt.% . Although this value is
lower than DOE‟s goals, but it is still higher than the value in most metal hydrides considered
as hydrogen storage materials [40].
1.5.6. Ternary systems
Extreme pressure and temperature conditions of hydrogen hydrates formation in additions to
their low storage capacity led the efforts toward using promoters to enhance the stability of
hydrogen hydrates. It was first shown by Udachin et al. [35] that in pressure of 3.5 kbar (210
K), a sII hydrate is formed with H2 in the presence of tetrahydrofuran (THF) which
correspond to the stoichiometric structure of THF.3.64H2.17H2O.
In 2004, Florusse et al. [42] showed that hydrogen clusters can be stabilized and stored at low
pressures within the clathrate hydrate lattice by stabilizing the large water cages with THF as
a second guest component. THF was selected as the second guest component because it is
completely miscible in water and THF+water forms a sII hydrate alone. Through equilibrium
studies on the ternary H2+THF+H2O system, they found that the presence of this second guest
component stabilizes the clathrate at pressure of 5 MPa at 279.6 K, versus 300 MPa at 280 K
for pure H2 hydrogen [42]. Through diffraction and NMR measurements, they reported that
all or most of the large cages are filled with THF leaving small cages for hydrogen molecules,
and in this case, they reported the single occupancy of small molecules per small cage. In this
situation, the storage capacity of clathrate is 1.0 wt%.
In 2005, Lee et al. [43] reported the double occupancy of the small cavities by hydrogen
molecules at 12 MPa and 270 K. They also claimed that by tuning THF concentration
(lowering below 1 mole % of THF) H2 occupancy in hydrates was increased up to 4.03%.
They reasoned that by lowering THF concentration below its eutectic concentration (1.0 mole
%), both small and large cages can store H2 molecules [43].
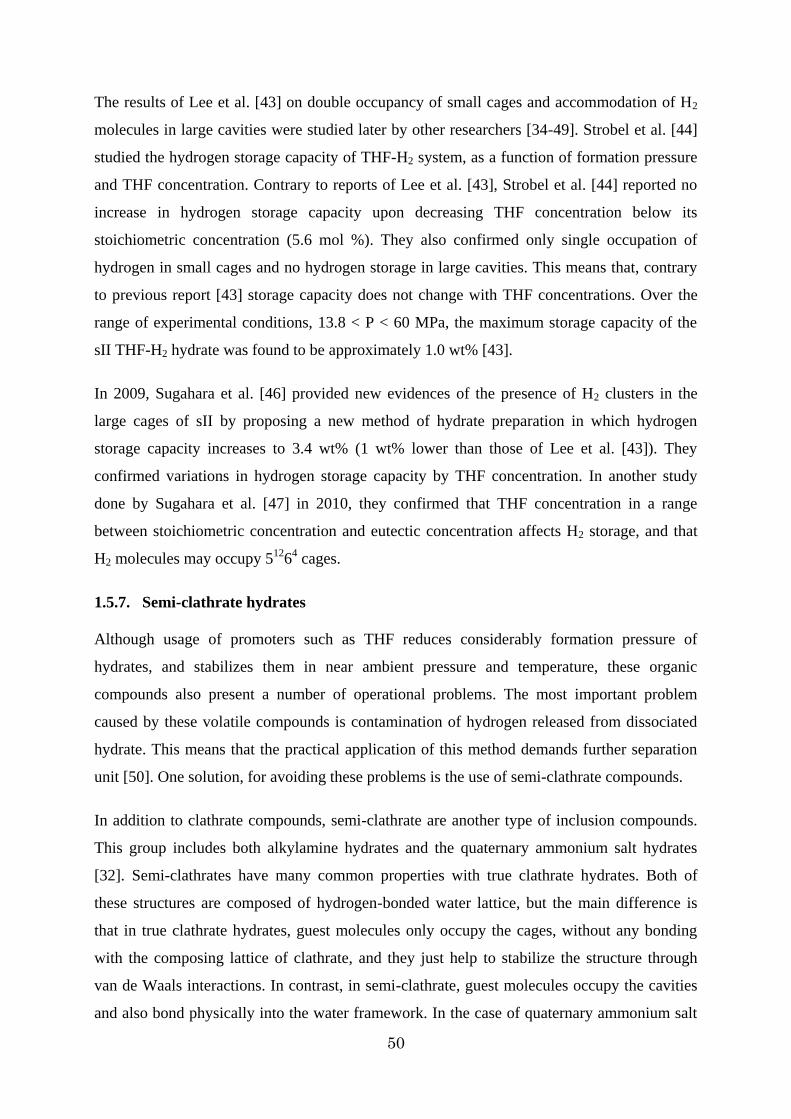
50
The results of Lee et al. [43] on double occupancy of small cages and accommodation of H2
molecules in large cavities were studied later by other researchers [34-49]. Strobel et al. [44]
studied the hydrogen storage capacity of THF-H2 system, as a function of formation pressure
and THF concentration. Contrary to reports of Lee et al. [43], Strobel et al. [44] reported no
increase in hydrogen storage capacity upon decreasing THF concentration below its
stoichiometric concentration (5.6 mol %). They also confirmed only single occupation of
hydrogen in small cages and no hydrogen storage in large cavities. This means that, contrary
to previous report [43] storage capacity does not change with THF concentrations. Over the
range of experimental conditions, 13.8 < P < 60 MPa, the maximum storage capacity of the
sII THF-H2 hydrate was found to be approximately 1.0 wt% [43].
In 2009, Sugahara et al. [46] provided new evidences of the presence of H2 clusters in the
large cages of sII by proposing a new method of hydrate preparation in which hydrogen
storage capacity increases to 3.4 wt% (1 wt% lower than those of Lee et al. [43]). They
confirmed variations in hydrogen storage capacity by THF concentration. In another study
done by Sugahara et al. [47] in 2010, they confirmed that THF concentration in a range
between stoichiometric concentration and eutectic concentration affects H2 storage, and that
H2 molecules may occupy 51264 cages.
1.5.7. Semi-clathrate hydrates
Although usage of promoters such as THF reduces considerably formation pressure of
hydrates, and stabilizes them in near ambient pressure and temperature, these organic
compounds also present a number of operational problems. The most important problem
caused by these volatile compounds is contamination of hydrogen released from dissociated
hydrate. This means that the practical application of this method demands further separation
unit [50]. One solution, for avoiding these problems is the use of semi-clathrate compounds.
In addition to clathrate compounds, semi-clathrate are another type of inclusion compounds.
This group includes both alkylamine hydrates and the quaternary ammonium salt hydrates
[32]. Semi-clathrates have many common properties with true clathrate hydrates. Both of
these structures are composed of hydrogen-bonded water lattice, but the main difference is
that in true clathrate hydrates, guest molecules only occupy the cages, without any bonding
with the composing lattice of clathrate, and they just help to stabilize the structure through
van de Waals interactions. In contrast, in semi-clathrate, guest molecules occupy the cavities
and also bond physically into the water framework. In the case of quaternary ammonium salt
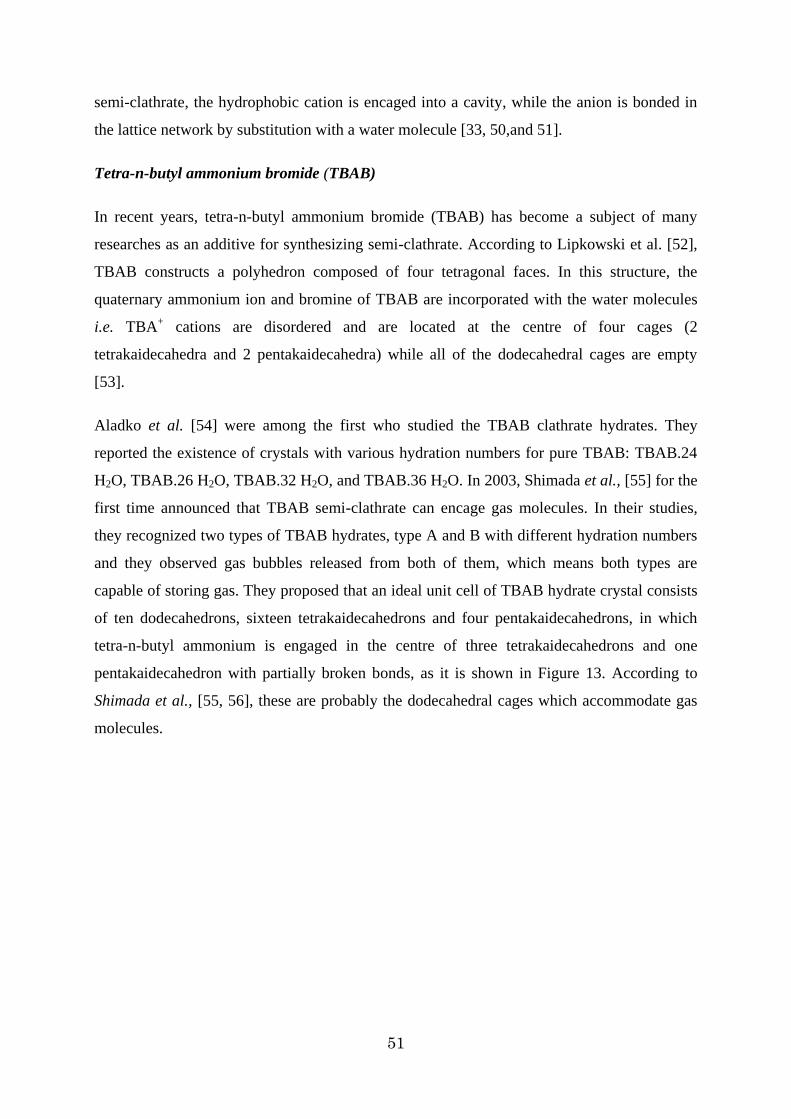
51
semi-clathrate, the hydrophobic cation is encaged into a cavity, while the anion is bonded in
the lattice network by substitution with a water molecule [33, 50,and 51].
Tetra-n-butyl ammonium bromide (TBAB)
In recent years, tetra-n-butyl ammonium bromide (TBAB) has become a subject of many
researches as an additive for synthesizing semi-clathrate. According to Lipkowski et al. [52],
TBAB constructs a polyhedron composed of four tetragonal faces. In this structure, the
quaternary ammonium ion and bromine of TBAB are incorporated with the water molecules
i.e. TBA+ cations are disordered and are located at the centre of four cages (2
tetrakaidecahedra and 2 pentakaidecahedra) while all of the dodecahedral cages are empty
[53].
Aladko et al. [54] were among the first who studied the TBAB clathrate hydrates. They
reported the existence of crystals with various hydration numbers for pure TBAB: TBAB.24
H2O, TBAB.26 H2O, TBAB.32 H2O, and TBAB.36 H2O. In 2003, Shimada et al., [55] for the
first time announced that TBAB semi-clathrate can encage gas molecules. In their studies,
they recognized two types of TBAB hydrates, type A and B with different hydration numbers
and they observed gas bubbles released from both of them, which means both types are
capable of storing gas. They proposed that an ideal unit cell of TBAB hydrate crystal consists
of ten dodecahedrons, sixteen tetrakaidecahedrons and four pentakaidecahedrons, in which
tetra-n-butyl ammonium is engaged in the centre of three tetrakaidecahedrons and one
pentakaidecahedron with partially broken bonds, as it is shown in Figure 13. According to
Shimada et al., [55, 56], these are probably the dodecahedral cages which accommodate gas
molecules.
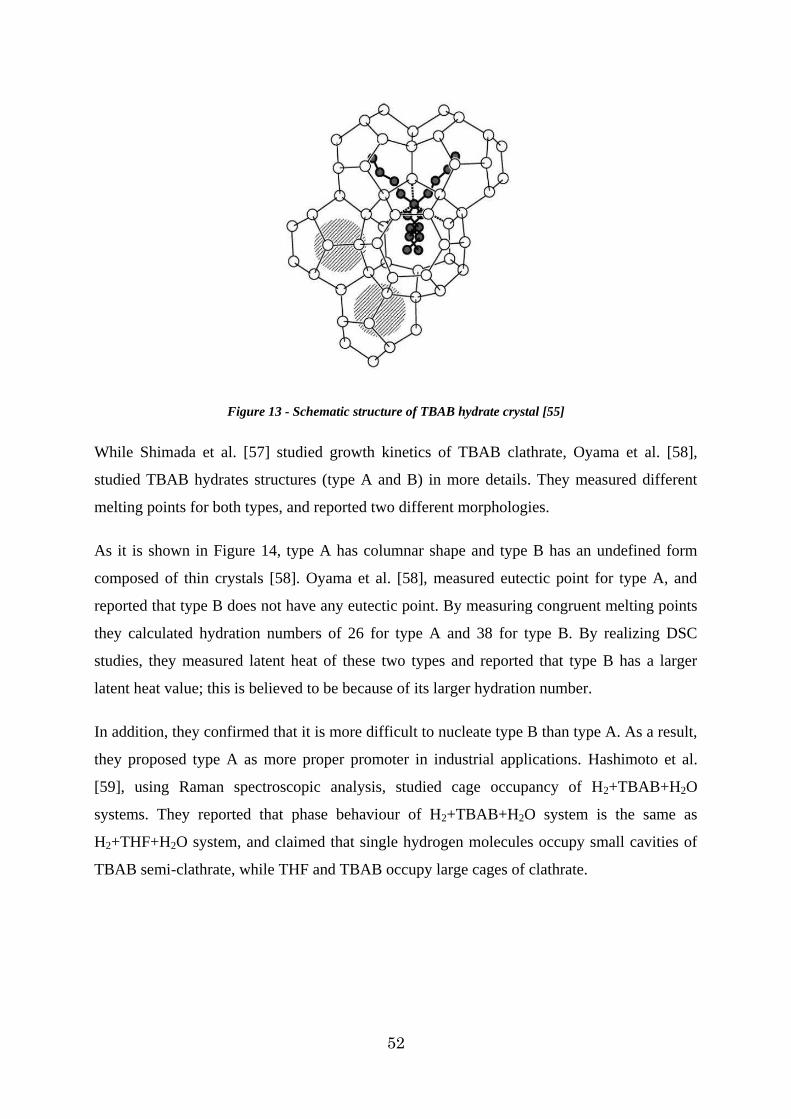
52
Figure 13 - Schematic structure of TBAB hydrate crystal [55]
While Shimada et al. [57] studied growth kinetics of TBAB clathrate, Oyama et al. [58],
studied TBAB hydrates structures (type A and B) in more details. They measured different
melting points for both types, and reported two different morphologies.
As it is shown in Figure 14, type A has columnar shape and type B has an undefined form
composed of thin crystals [58]. Oyama et al. [58], measured eutectic point for type A, and
reported that type B does not have any eutectic point. By measuring congruent melting points
they calculated hydration numbers of 26 for type A and 38 for type B. By realizing DSC
studies, they measured latent heat of these two types and reported that type B has a larger
latent heat value; this is believed to be because of its larger hydration number.
In addition, they confirmed that it is more difficult to nucleate type B than type A. As a result,
they proposed type A as more proper promoter in industrial applications. Hashimoto et al.
[59], using Raman spectroscopic analysis, studied cage occupancy of H2+TBAB+H2O
systems. They reported that phase behaviour of H2+TBAB+H2O system is the same as
H2+THF+H2O system, and claimed that single hydrogen molecules occupy small cavities of
TBAB semi-clathrate, while THF and TBAB occupy large cages of clathrate.
53
Figure 14 - TBAB semi-clathrate hydrate, type A and B [58]
As another approach for studying behaviour of semi-clathrate hydrates of quaternary
ammonium compound (QAS), Chapoy et al. [60] determined the phase equilibria for H2-
TBAB-H2O and H2-TBAF-H2O for temperature range of 280-310 K up to 25 MPa. According
to their results, H2-QAS clathrate, show considerable thermal and low-pressure stability in
comparison with pure H2 and THF hydrates. While pure H2 hydrates required pressure up to
200 MPa, and H2-THF hydrates are stabilized in pressures of 100 MPa at ambient
temperature, H2-QAS hydrates show a considerable stability in ambient condition, i.e. they
have melting point if 302 K at ambient pressure [60]. They also suggested that single
hydrogen molecules occupy small dodecahedral cages.
In another study, Shimada et al. [53], studied the structure of TBAB hydrate proposing tetra-
n-butyl ammonium cations in the centre of two tetrakaidecahedra, two pentakaidecahedra
while other surrounding dodecahedral cages are left empty (in contrary to their proposed
structure in figure 9). In this structure, each butyl group is disordered over two possible sites
with occupancy factor of 50%. A schema of this structure is presented in Figure 15. In this
study, he reported storage capacity of H2, 0.6 wt%.
Subsequent to their previous works, Hashimoto et al. [60] performed another series of
experiments on cage occupancy of H2 molecules; they confirmed that H2 cage occupancy is
independent of TBAB concentration and crystal type.
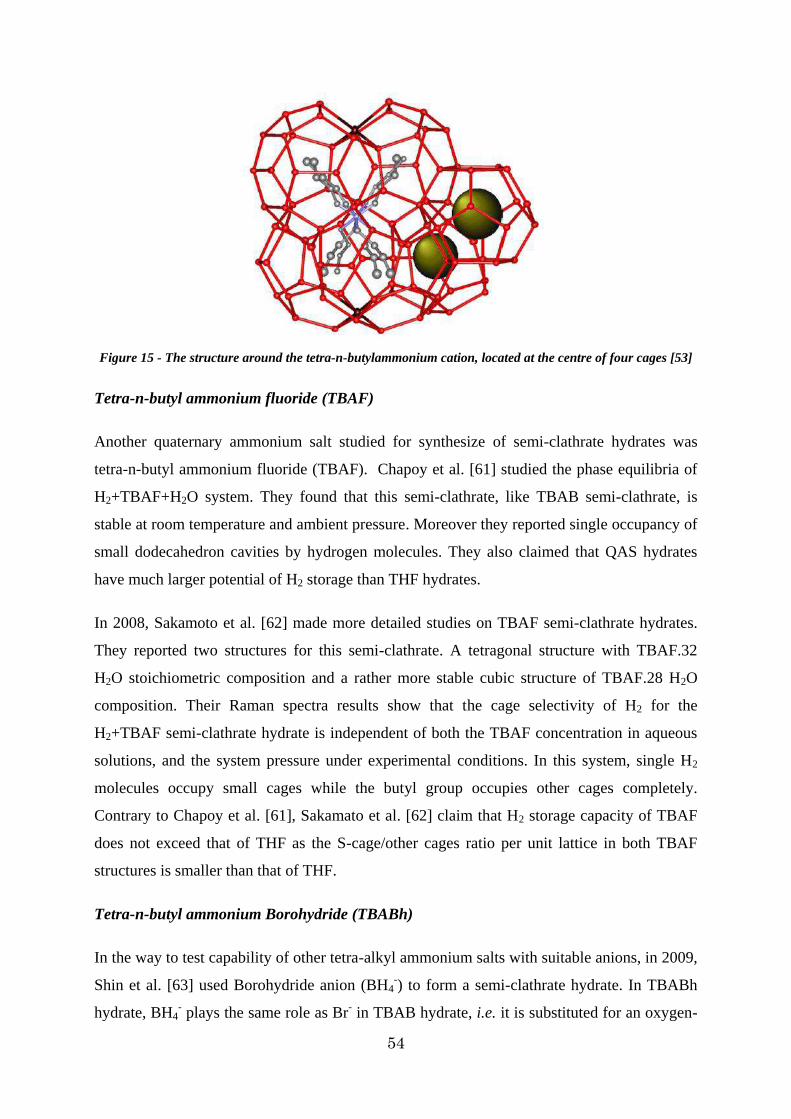
54
Figure 15 - The structure around the tetra-n-butylammonium cation, located at the centre of four cages [53]
Tetra-n-butyl ammonium fluoride (TBAF)
Another quaternary ammonium salt studied for synthesize of semi-clathrate hydrates was
tetra-n-butyl ammonium fluoride (TBAF). Chapoy et al. [61] studied the phase equilibria of
H2+TBAF+H2O system. They found that this semi-clathrate, like TBAB semi-clathrate, is
stable at room temperature and ambient pressure. Moreover they reported single occupancy of
small dodecahedron cavities by hydrogen molecules. They also claimed that QAS hydrates
have much larger potential of H2 storage than THF hydrates.
In 2008, Sakamoto et al. [62] made more detailed studies on TBAF semi-clathrate hydrates.
They reported two structures for this semi-clathrate. A tetragonal structure with TBAF.32
H2O stoichiometric composition and a rather more stable cubic structure of TBAF.28 H2O
composition. Their Raman spectra results show that the cage selectivity of H2 for the
H2+TBAF semi-clathrate hydrate is independent of both the TBAF concentration in aqueous
solutions, and the system pressure under experimental conditions. In this system, single H2
molecules occupy small cages while the butyl group occupies other cages completely.
Contrary to Chapoy et al. [61], Sakamato et al. [62] claim that H2 storage capacity of TBAF
does not exceed that of THF as the S-cage/other cages ratio per unit lattice in both TBAF
structures is smaller than that of THF.
Tetra-n-butyl ammonium Borohydride (TBABh)
In the way to test capability of other tetra-alkyl ammonium salts with suitable anions, in 2009,
Shin et al. [63] used Borohydride anion (BH4-) to form a semi-clathrate hydrate. In TBABh
hydrate, BH4- plays the same role as Br- in TBAB hydrate, i.e. it is substituted for an oxygen-
55
water position in the host lattice. One advantage of using borohydride salts such as NaBH4 is
that following a hydrolysis reaction they can generate hydrogen. It means the hydrolysable
material can be used as a source of hydrogen from both dissociation of the semi-clathrate and
hydrolysis of the salt.
In their PXRD analysis, Shin et al. [63], confirmed accommodation of hydrogen molecules in
small dodecahedron cavities. The hydrogen storage capacity of hydrogen was measured
volumetrically with and without considering hydrolysis reaction. Without hydrolysis reaction,
about 0.5 wt% of hydrogen was physically stored in the TBABh hydrate. In presence of HCl
(including hydrolysis hydrogen generation) a total of 1.35 wt% of hydrogen maybe released
from the TBABh hydrate.
Moreover, through DSC studies, Shin et al. [36] reported that TBABh semi-clathrate is more
stable than those of TBAB and TBAF.
Tetrabutylammonium chloride (TBACl) and Tetrabutyl Phosoponium bromide (TBPB)
In another study, Deschamps et al. [51], studied the thermal stability of TBACl+H2+H2O and
TBPB+H2+H2O systems in the temperature range of 282-291 K. They reported a higher
thermal stability for these two systems in comparison to that of THF and even TBAB but
lower stability in comparison to TBAF system. Hydrogen stored value reported in this study
was 0.12 wt% for TBACl system, and 0.14% wt% for TBPB system.
Trimethylamine (TMA)
One of the other additives adopted for forming semi-clathrate in mild conditions is trim
ethylamine (TMA) which was studied by Ogata et al. [64]. The hexagonal unit cell of TMA
hydrate is composed of three small 512 cages, two medium 51262 cages and two large 51263
cages. In this semi-clathrate structure, two TMA molecules occupy medium cages and one
large cage while the three small cages are left vacant. According to Ogata et al. [64],
increasing of the pressure gradually increase hydrogen storage in small cavities until it
reaches a plateau (here 80 MPa), i.e. even in higher pressure all the small cages are filled, and
neither the medium nor the large cages will accommodate any hydrogen molecule. Moreover,
no double cage occupancy of hydrogen molecules in small cavities was reported.
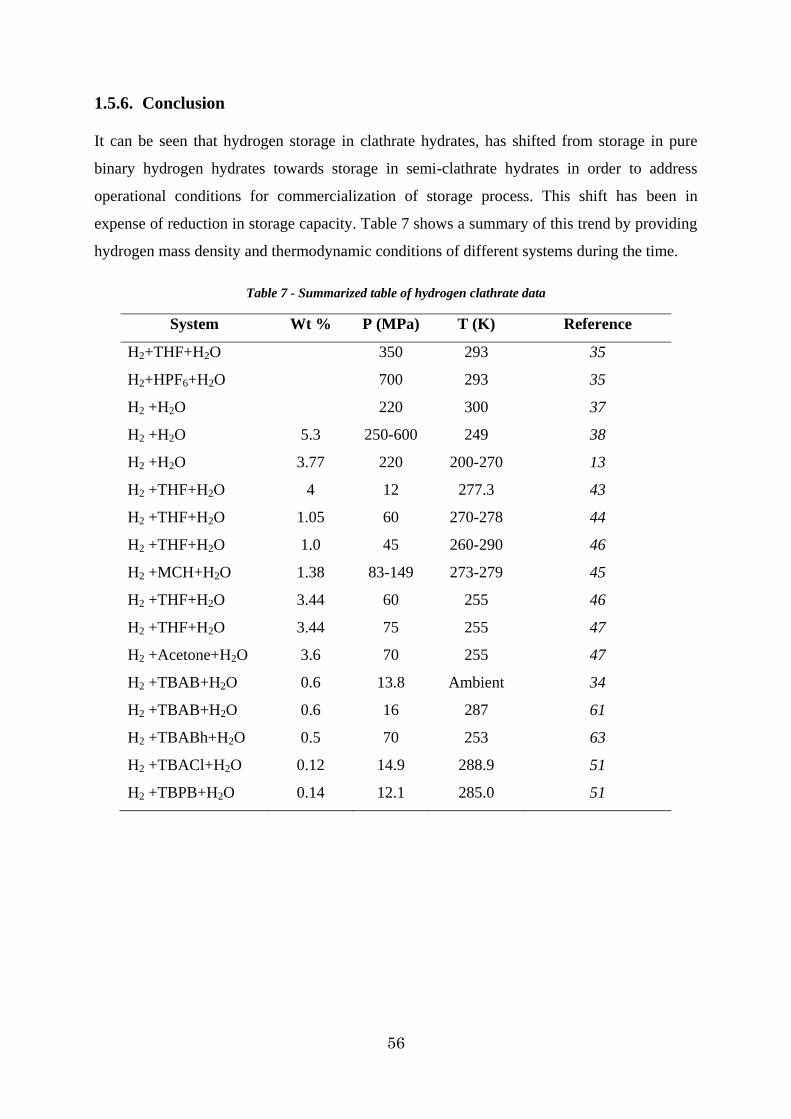
56
1.5.6. Conclusion
It can be seen that hydrogen storage in clathrate hydrates, has shifted from storage in pure
binary hydrogen hydrates towards storage in semi-clathrate hydrates in order to address
operational conditions for commercialization of storage process. This shift has been in
expense of reduction in storage capacity. Table 7 shows a summary of this trend by providing
hydrogen mass density and thermodynamic conditions of different systems during the time.
Table 7 - Summarized table of hydrogen clathrate data
System Wt % P (MPa) T (K) Reference
H2+THF+H2O 350 293 35
H2+HPF6+H2O 700 293 35
H2 +H2O 220 300 37
H2 +H2O 5.3 250-600 249 38
H2 +H2O 3.77 220 200-270 13
H2 +THF+H2O 4 12 277.3 43
H2 +THF+H2O 1.05 60 270-278 44
H2 +THF+H2O 1.0 45 260-290 46
H2 +MCH+H2O 1.38 83-149 273-279 45
H2 +THF+H2O 3.44 60 255 46
H2 +THF+H2O 3.44 75 255 47
H2 +Acetone+H2O 3.6 70 255 47
H2 +TBAB+H2O 0.6 13.8 Ambient 34
H2 +TBAB+H2O 0.6 16 287 61
H2 +TBABh+H2O 0.5 70 253 63
H2 +TBACl+H2O 0.12 14.9 288.9 51
H2 +TBPB+H2O 0.14 12.1 285.0 51
57
CChhaapptteerr ttwwoo::
EExxppeerr iimmeennttaall mmeeaassuurreemmeennttss
This chapter presents the experimental procedure, equipments and materials used in this work.
Differential Scanning Calorimetry (DSC) and a high pressure isochoric cell are presented as the main
experimental set-ups. Their application in hydrate studies is discussed and the experimental
procedures used in this work are described. Apart from these two main equipments, gas
chromatography and atomic absorption are presented for their application in the gas and liquid phase
investigations, respectively. At the end the materials used during these experiments are presented in a
table specifying their supplier and their purity.

58
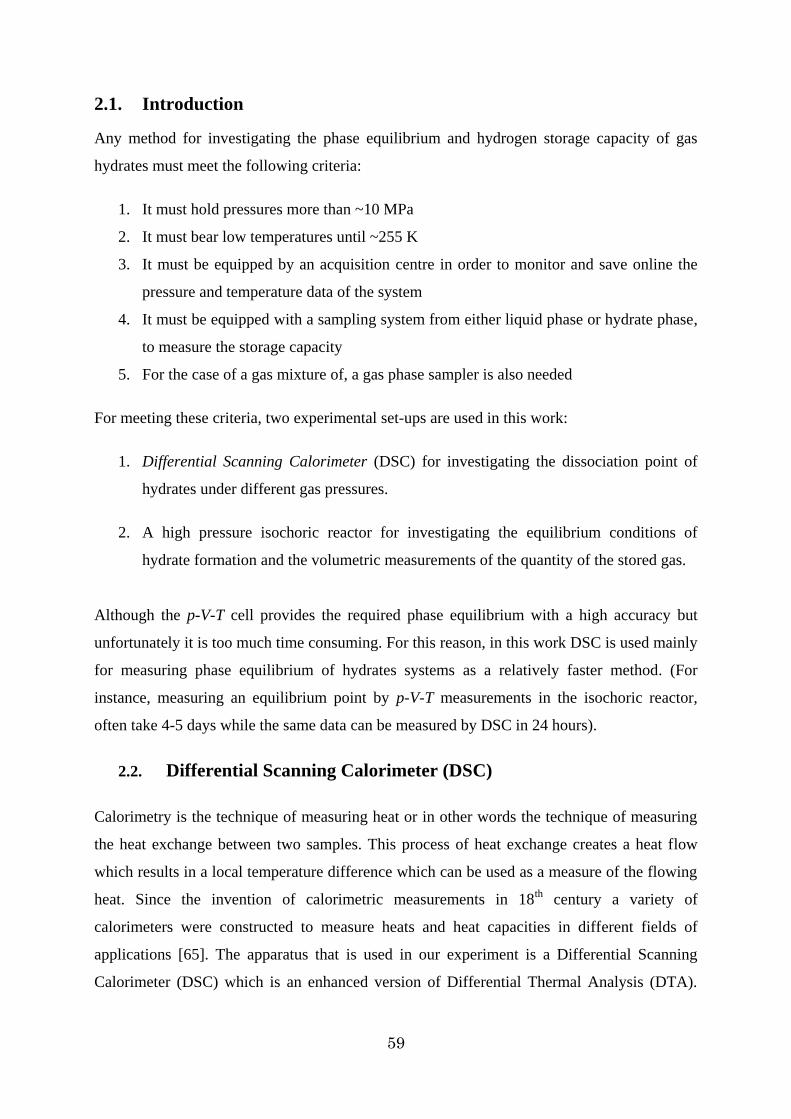
59
2.1. Introduction
Any method for investigating the phase equilibrium and hydrogen storage capacity of gas
hydrates must meet the following criteria:
1. It must hold pressures more than ~10 MPa
2. It must bear low temperatures until ~255 K
3. It must be equipped by an acquisition centre in order to monitor and save online the
pressure and temperature data of the system
4. It must be equipped with a sampling system from either liquid phase or hydrate phase,
to measure the storage capacity
5. For the case of a gas mixture of, a gas phase sampler is also needed
For meeting these criteria, two experimental set-ups are used in this work:
1. Differential Scanning Calorimeter (DSC) for investigating the dissociation point of
hydrates under different gas pressures.
2. A high pressure isochoric reactor for investigating the equilibrium conditions of
hydrate formation and the volumetric measurements of the quantity of the stored gas.
Although the p-V-T cell provides the required phase equilibrium with a high accuracy but
unfortunately it is too much time consuming. For this reason, in this work DSC is used mainly
for measuring phase equilibrium of hydrates systems as a relatively faster method. (For
instance, measuring an equilibrium point by p-V-T measurements in the isochoric reactor,
often take 4-5 days while the same data can be measured by DSC in 24 hours).
2.2. Differential Scanning Calorimeter (DSC)
Calorimetry is the technique of measuring heat or in other words the technique of measuring
the heat exchange between two samples. This process of heat exchange creates a heat flow
which results in a local temperature difference which can be used as a measure of the flowing
heat. Since the invention of calorimetric measurements in 18th century a variety of
calorimeters were constructed to measure heats and heat capacities in different fields of
applications [65]. The apparatus that is used in our experiment is a Differential Scanning
Calorimeter (DSC) which is an enhanced version of Differential Thermal Analysis (DTA).
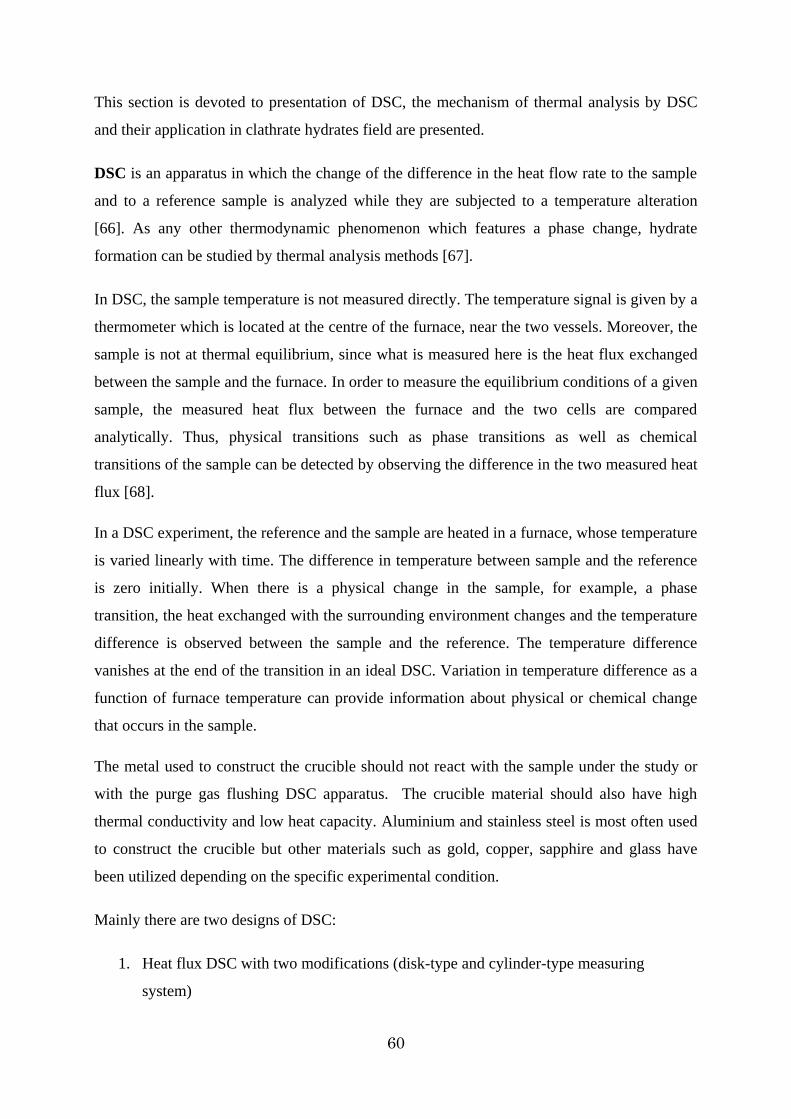
60
This section is devoted to presentation of DSC, the mechanism of thermal analysis by DSC
and their application in clathrate hydrates field are presented.
DSC is an apparatus in which the change of the difference in the heat flow rate to the sample
and to a reference sample is analyzed while they are subjected to a temperature alteration
[66]. As any other thermodynamic phenomenon which features a phase change, hydrate
formation can be studied by thermal analysis methods [67].
In DSC, the sample temperature is not measured directly. The temperature signal is given by a
thermometer which is located at the centre of the furnace, near the two vessels. Moreover, the
sample is not at thermal equilibrium, since what is measured here is the heat flux exchanged
between the sample and the furnace. In order to measure the equilibrium conditions of a given
sample, the measured heat flux between the furnace and the two cells are compared
analytically. Thus, physical transitions such as phase transitions as well as chemical
transitions of the sample can be detected by observing the difference in the two measured heat
flux [68].
In a DSC experiment, the reference and the sample are heated in a furnace, whose temperature
is varied linearly with time. The difference in temperature between sample and the reference
is zero initially. When there is a physical change in the sample, for example, a phase
transition, the heat exchanged with the surrounding environment changes and the temperature
difference is observed between the sample and the reference. The temperature difference
vanishes at the end of the transition in an ideal DSC. Variation in temperature difference as a
function of furnace temperature can provide information about physical or chemical change
that occurs in the sample.
The metal used to construct the crucible should not react with the sample under the study or
with the purge gas flushing DSC apparatus. The crucible material should also have high
thermal conductivity and low heat capacity. Aluminium and stainless steel is most often used
to construct the crucible but other materials such as gold, copper, sapphire and glass have
been utilized depending on the specific experimental condition.
Mainly there are two designs of DSC:
1. Heat flux DSC with two modifications (disk-type and cylinder-type measuring
system)
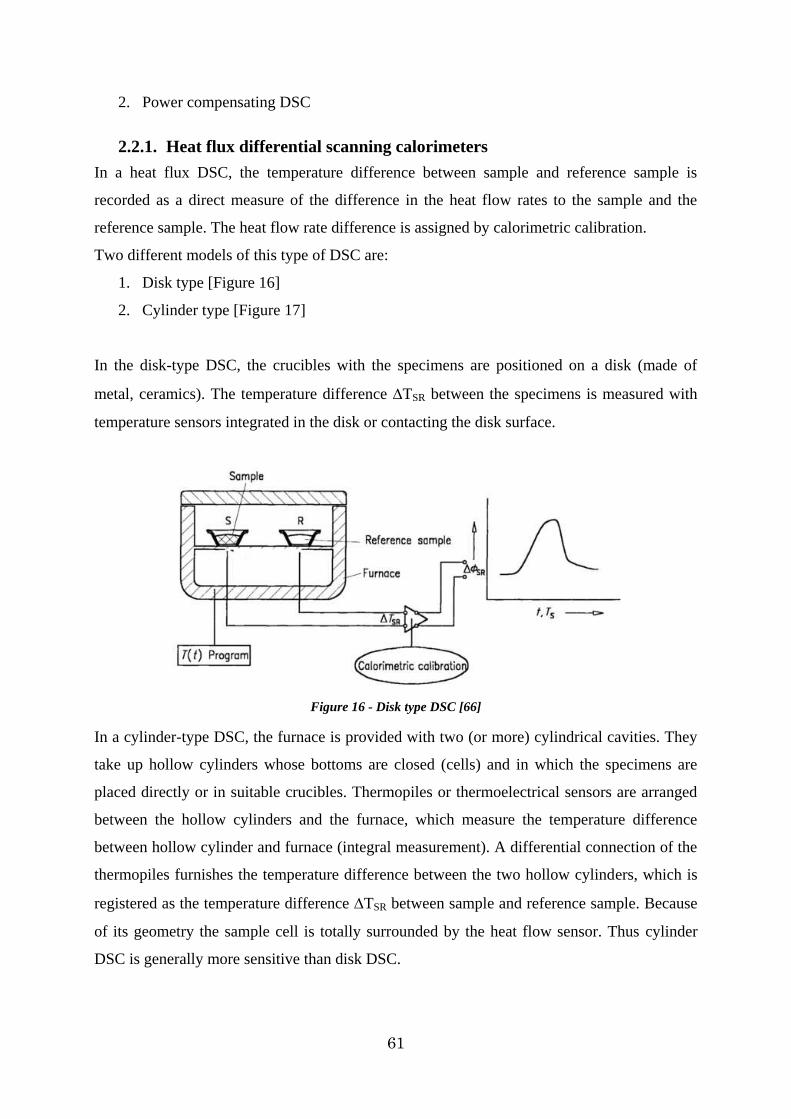
61
2. Power compensating DSC
2.2.1. Heat flux differential scanning calorimeters
In a heat flux DSC, the temperature difference between sample and reference sample is
recorded as a direct measure of the difference in the heat flow rates to the sample and the
reference sample. The heat flow rate difference is assigned by calorimetric calibration.
Two different models of this type of DSC are:
1. Disk type [Figure 16]
2. Cylinder type [Figure 17]
In the disk-type DSC, the crucibles with the specimens are positioned on a disk (made of
metal, ceramics). The temperature difference TSR between the specimens is measured with
temperature sensors integrated in the disk or contacting the disk surface.
Figure 16 - Disk type DSC [66]
In a cylinder-type DSC, the furnace is provided with two (or more) cylindrical cavities. They
take up hollow cylinders whose bottoms are closed (cells) and in which the specimens are
placed directly or in suitable crucibles. Thermopiles or thermoelectrical sensors are arranged
between the hollow cylinders and the furnace, which measure the temperature difference
between hollow cylinder and furnace (integral measurement). A differential connection of the
thermopiles furnishes the temperature difference between the two hollow cylinders, which is
registered as the temperature difference TSR between sample and reference sample. Because
of its geometry the sample cell is totally surrounded by the heat flow sensor. Thus cylinder
DSC is generally more sensitive than disk DSC.
62
Figure 17 - Cylinder type DSC [66]
2.2.2. Power compensating differential scanning calorimeters
In a power compensating DSC, the specimens are arranged in two separate small furnaces in
which each of them is provided with a heating unit and a temperature sensor [Figure 18].
During the measurement, the temperature difference between the two furnaces is maintained
at a minimum with the aid of a controller that adapts the heating powers in a way that there is
always a residual temperature difference between the two specimens (offset). When there is
thermal symmetry in the measuring system, the residual temperature difference is
proportional to the difference between the heating powers fed to sample and reference sample.
If the resulting temperature difference is due to differences in the heat capacity between
sample and reference sample, or to exothermic/endothermic transformations in the sample, the
heating power additionally required to keep this temperature difference as small as possible is
proportional to the difference SR between the heat flow rates supplied to sample and
reference (SR=CP.), or proportional to the heat flow rate of transition trs. [66].
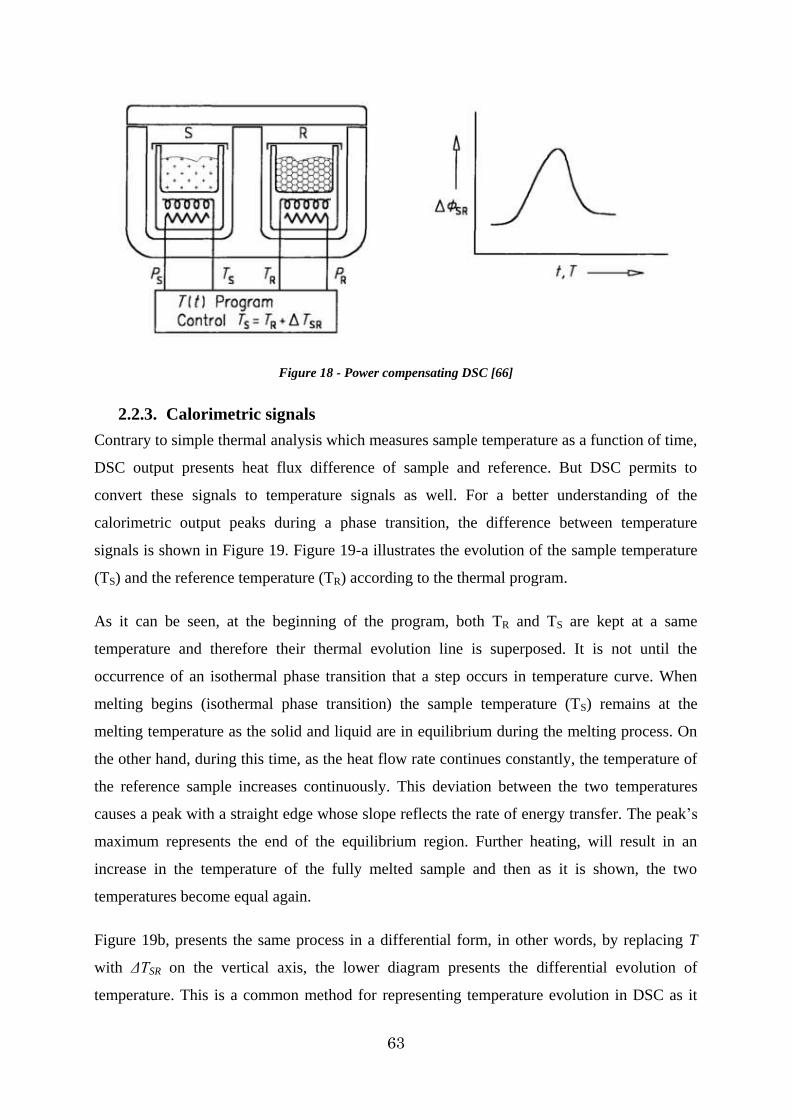
63
Figure 18 - Power compensating DSC [66]
2.2.3. Calorimetric signals
Contrary to simple thermal analysis which measures sample temperature as a function of time,
DSC output presents heat flux difference of sample and reference. But DSC permits to
convert these signals to temperature signals as well. For a better understanding of the
calorimetric output peaks during a phase transition, the difference between temperature
signals is shown in Figure 19. Figure 19-a illustrates the evolution of the sample temperature
(TS) and the reference temperature (TR) according to the thermal program.
As it can be seen, at the beginning of the program, both TR and TS are kept at a same
temperature and therefore their thermal evolution line is superposed. It is not until the
occurrence of an isothermal phase transition that a step occurs in temperature curve. When
melting begins (isothermal phase transition) the sample temperature (TS) remains at the
melting temperature as the solid and liquid are in equilibrium during the melting process. On
the other hand, during this time, as the heat flow rate continues constantly, the temperature of
the reference sample increases continuously. This deviation between the two temperatures
causes a peak with a straight edge whose slope reflects the rate of energy transfer. The peak‟s
maximum represents the end of the equilibrium region. Further heating, will result in an
increase in the temperature of the fully melted sample and then as it is shown, the two
temperatures become equal again.
Figure 19b, presents the same process in a differential form, in other words, by replacing T
with ΔTSR on the vertical axis, the lower diagram presents the differential evolution of
temperature. This is a common method for representing temperature evolution in DSC as it
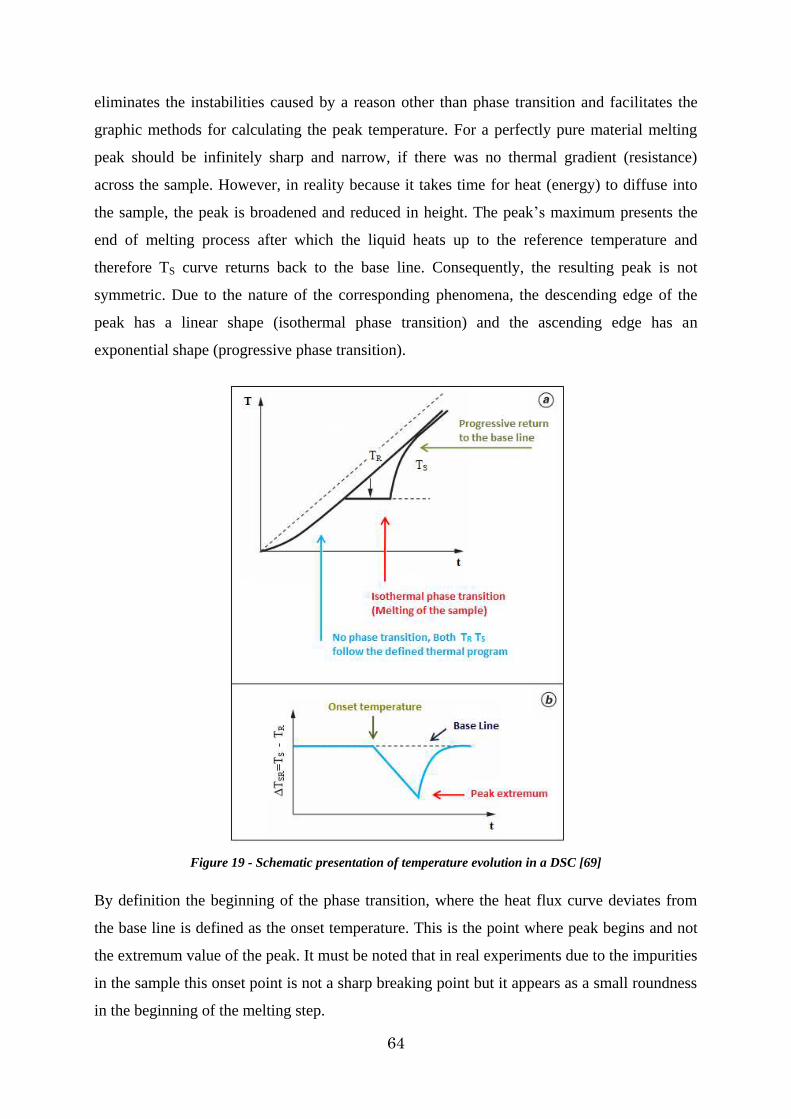
64
eliminates the instabilities caused by a reason other than phase transition and facilitates the
graphic methods for calculating the peak temperature. For a perfectly pure material melting
peak should be infinitely sharp and narrow, if there was no thermal gradient (resistance)
across the sample. However, in reality because it takes time for heat (energy) to diffuse into
the sample, the peak is broadened and reduced in height. The peak‟s maximum presents the
end of melting process after which the liquid heats up to the reference temperature and
therefore TS curve returns back to the base line. Consequently, the resulting peak is not
symmetric. Due to the nature of the corresponding phenomena, the descending edge of the
peak has a linear shape (isothermal phase transition) and the ascending edge has an
exponential shape (progressive phase transition).
Figure 19 - Schematic presentation of temperature evolution in a DSC [69]
By definition the beginning of the phase transition, where the heat flux curve deviates from
the base line is defined as the onset temperature. This is the point where peak begins and not
the extremum value of the peak. It must be noted that in real experiments due to the impurities
in the sample this onset point is not a sharp breaking point but it appears as a small roundness
in the beginning of the melting step.
65
2.2.4. DSC principle
Fundamentals
All of the DSC apparatus obey the same principle. DSC in a simple form is an instrument that
measures continuously the heat exchange between a sample and a thermostat according to a
temperature program. Independent of whether a user obtains T or ΔH from the DSC, it is
important to know the DSC principles and the functional relation between the measured
signals which are the links to calculate different thermodynamic quantities. Firstly, for a
preliminary presentation of DSC principle some simplifying assumptions must be considered:
1. The state of the system is assumed to be steady, and all the transformation are
assumed to taken place in equilibrium state.
2. Only one thermal resistance between furnace and sample is taken into account,
assuming no interaction between sample and reference sample.
3. Only the heat capacities of sample and reference are considered in calculation.
4. Sample is assumed to be homogenous all over the experiment which necessitates low
heating rates, and small sample volumes.
5. The system is assumed to have a thermal symmetry in both sample and reference
sides.
6. The whole system is assumed to be isolated in a way that there is no heat exchange
with surroundings.
A schema of DSC is illustrated in Figure 20. According to the Biot-Fourier‟s equation for
conduction heat transfer the amount of heat flux between two bodies is proportional to the
temperature gradient between them:
Equation (11)
In this equation dq/dt is the heat flux, the term dT/dx is the one dimensional temperature
gradient and the coefficient γ is a proportionality factor (thermal conductivity).
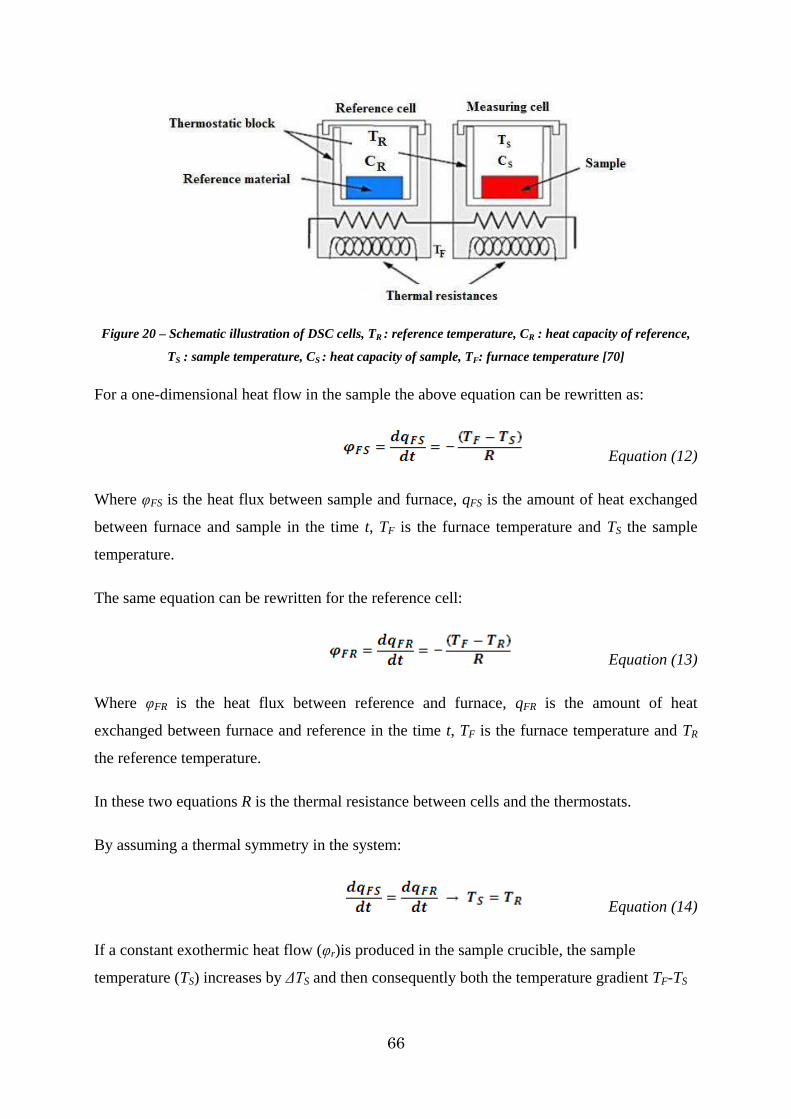
66
Figure 20 – Schematic illustration of DSC cells, TR : reference temperature, CR : heat capacity of reference,
TS : sample temperature, CS : heat capacity of sample, TF: furnace temperature [70]
For a one-dimensional heat flow in the sample the above equation can be rewritten as:
Equation (12)
Where φFS is the heat flux between sample and furnace, qFS is the amount of heat exchanged
between furnace and sample in the time t, TF is the furnace temperature and TS the sample
temperature.
The same equation can be rewritten for the reference cell:
Equation (13)
Where φFR is the heat flux between reference and furnace, qFR is the amount of heat
exchanged between furnace and reference in the time t, TF is the furnace temperature and TR
the reference temperature.
In these two equations R is the thermal resistance between cells and the thermostats.
By assuming a thermal symmetry in the system:
Equation (14)
If a constant exothermic heat flow (φr)is produced in the sample crucible, the sample
temperature (TS) increases by ΔTS and then consequently both the temperature gradient TF-TS
67
and φFS decrease. Under steady state condition this can be explained with a thermal balance
as:
Equation (15)
Knowing that no thermal phenomenon has happened in the reference side, the temperature
difference between sample and reference will be:
Equation (16)
And hence:
Equation (17)
And therefore:
Equation (18)
In this equation K is a proportionality factor (heat transfer coefficient) and is a function of
temperature, heat transfer surface area and the distance between sample and the reference.
This formulation represents the direct proportionality between the measured φr and the
measured signal ΔT, under a steady-state constant heat flow. It should be noticed that, this is
only the case of an increase in the temperature of the sample without occurrence of any phase
transition or reaction.
In the case of a non-steady state process (phase reaction or phase transition) ΔT will not be
constant by time and this difference shows itself in the form of peaks, as discussed earlier. In
this situation the heat flow rate produced inside the sample by a reaction or a phase transition
φr(t) is time dependent. By considering this time dependent heat flow rate, the heat balance
for the sample side will be:
Equation (19)
On the other hand, in the reference side, were no heat flow is produced or consumed (φr =0):
Equation (20)
68
Now, by calculating the difference between the two balance equations:
Equation (21)
Employing equations [Eq.3] and [Eq.4]:
Equation (22)
And then by replacing Tr by Ts from the equation [Eq.13]:
Equation 1
Equation (23)
This is a fundamental equation of differential calorimetric analyses in which:
dt
dq is the heat flux measured by DSC
dt
dTCC R
RS : Term for elimination of asymmetry in measurement regarding the
difference in specific heats of sample and the reference (Baseline signal)
φr: Time dependent heat flow rate produced inside the sample (Enthalpy of reaction or
phase transition)
2
2
S dt
qdRC : heat exchange between sample and furnace in a transitory state.
In absence of any phase transition:
And by solving the first-order equation of differential calorimetric analyses:
Equation (24)
where A is a constant. When t is sufficiently high comparing to RCS, the second term on the
right of the above equation can be neglected comparing to the first term:
69
Equation (25)
In this equation dq/dt represents the base line of the thermal output signal. In the absence of
any phase transition in the sample, as CS and CR vary little, it presents a parallel line to the
zero level line of the calorimeter. On the other hand, by occurring a phase change in the
sample, CS varies sensibly and therefore the base‟s slope changes rapidly.
2.2.5. Measurement of phase transition temperature
Knowing that in DSC the sample temperature is measured indirectly via measuring the
furnace temperature (Tf) and the heat flow, more precision on the measurement procedure is
needed. In this regard, the following operational conditions must be respected to obtain valid
thermodynamic data:
DSC apparatus must be carefully calibrated in several measuring points inside the
experimental temperature range.
The sample must be homogenous thermally, which necessitates slow heating and
small amount of sample.
The operational conditions must be repeatable and indeed all the experiments must be
done in one apparatus with the same cells.
Specific capacity of reference and sample cell must vary a little with temperature.
In this regard, for obtaining a mathematical relation for calculating the sample temperature
equation [Eq.13] is rearranged as:
Equation (26)
By replacing the term (TF – TR) by help of equation [Eq.11]:
Equation (27)
Assuming that t>>RCr :
Equation (28)
Equation [Eq.18] can be rewritten as:
70
Equation (29)
In which the term CS R dTf /dt shows the thermal lag or the thermal inertia of the cell and
dQ/dt represents the thermal signal deviated from the base line during a phase transition and is
defined as:
Equation (30)
In this way, equation [Eq.20] can be used to calculate sample‟s temperature by knowing R,
the thermal resistance of DSC and Tf the measured temperature of furnace.
However, often a graphical method is used to calculate sample‟s temperature. This methods is
easier and faster and is based on this assumption that during a steady-state isothermal phase
transition, the sample‟s temperature remains constant (Ts=cte). Moreover, it is assumed that
furnace temperature varies by a constant rate (dTf/dt=cte). By differentiating expression
[Eq.21] with respect to t:
Equation (31)
This equation can be developed by multiplying and dividing by the term dTf:
Equation (32)
And therefore, by eliminating the furnace temperature‟s evolution rate (dTf/dt) :
Equation (33)
According to this equation [Eq.24], the slope of the dQ/dt – Tf diagram is equal to the inverse
of thermal resistance of DSC (1/R). This is shown on the endothermic heat flux curve of
Figure 21. It should be reminded that thermal resistance (R) depends not only on the cell‟s
material, but also it depends on sample‟s quantity and its contact area with cell‟s surface [68].
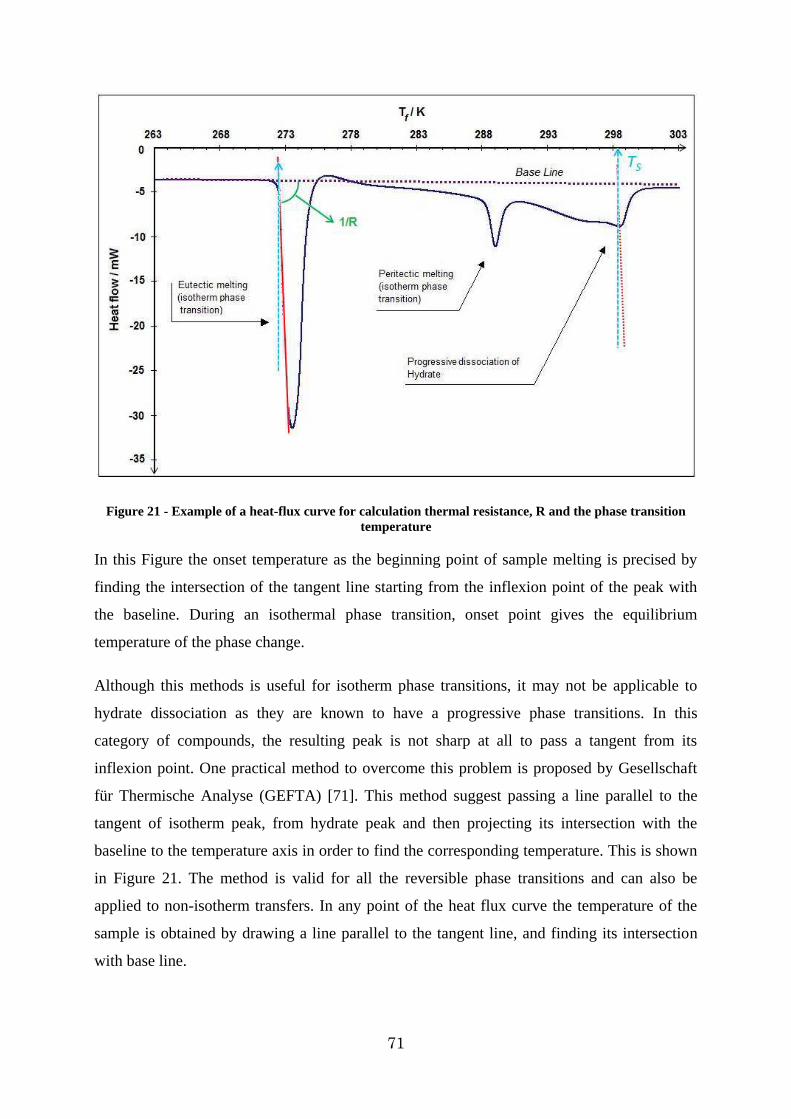
71
Figure 21 - Example of a heat-flux curve for calculation thermal resistance, R and the phase transition temperature
In this Figure the onset temperature as the beginning point of sample melting is precised by
finding the intersection of the tangent line starting from the inflexion point of the peak with
the baseline. During an isothermal phase transition, onset point gives the equilibrium
temperature of the phase change.
Although this methods is useful for isotherm phase transitions, it may not be applicable to
hydrate dissociation as they are known to have a progressive phase transitions. In this
category of compounds, the resulting peak is not sharp at all to pass a tangent from its
inflexion point. One practical method to overcome this problem is proposed by Gesellschaft
für Thermische Analyse (GEFTA) [71]. This method suggest passing a line parallel to the
tangent of isotherm peak, from hydrate peak and then projecting its intersection with the
baseline to the temperature axis in order to find the corresponding temperature. This is shown
in Figure 21. The method is valid for all the reversible phase transitions and can also be
applied to non-isotherm transfers. In any point of the heat flux curve the temperature of the
sample is obtained by drawing a line parallel to the tangent line, and finding its intersection
with base line.
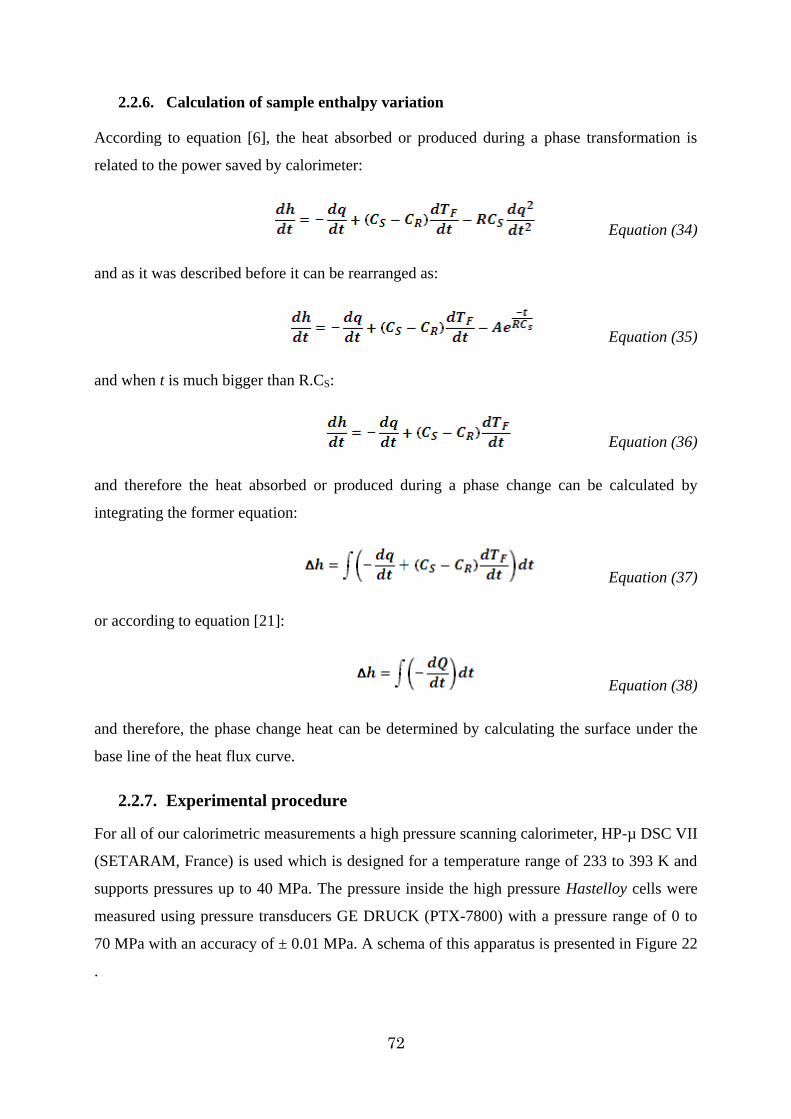
72
2.2.6. Calculation of sample enthalpy variation
According to equation [6], the heat absorbed or produced during a phase transformation is
related to the power saved by calorimeter:
Equation (34)
and as it was described before it can be rearranged as:
Equation (35)
and when t is much bigger than R.CS:
Equation (36)
and therefore the heat absorbed or produced during a phase change can be calculated by
integrating the former equation:
Equation (37)
or according to equation [21]:
Equation (38)
and therefore, the phase change heat can be determined by calculating the surface under the
base line of the heat flux curve.
2.2.7. Experimental procedure
For all of our calorimetric measurements a high pressure scanning calorimeter, HP-µ DSC VII
(SETARAM, France) is used which is designed for a temperature range of 233 to 393 K and
supports pressures up to 40 MPa. The pressure inside the high pressure Hastelloy cells were
measured using pressure transducers GE DRUCK (PTX-7800) with a pressure range of 0 to
70 MPa with an accuracy of ± 0.01 MPa. A schema of this apparatus is presented in Figure 22
.
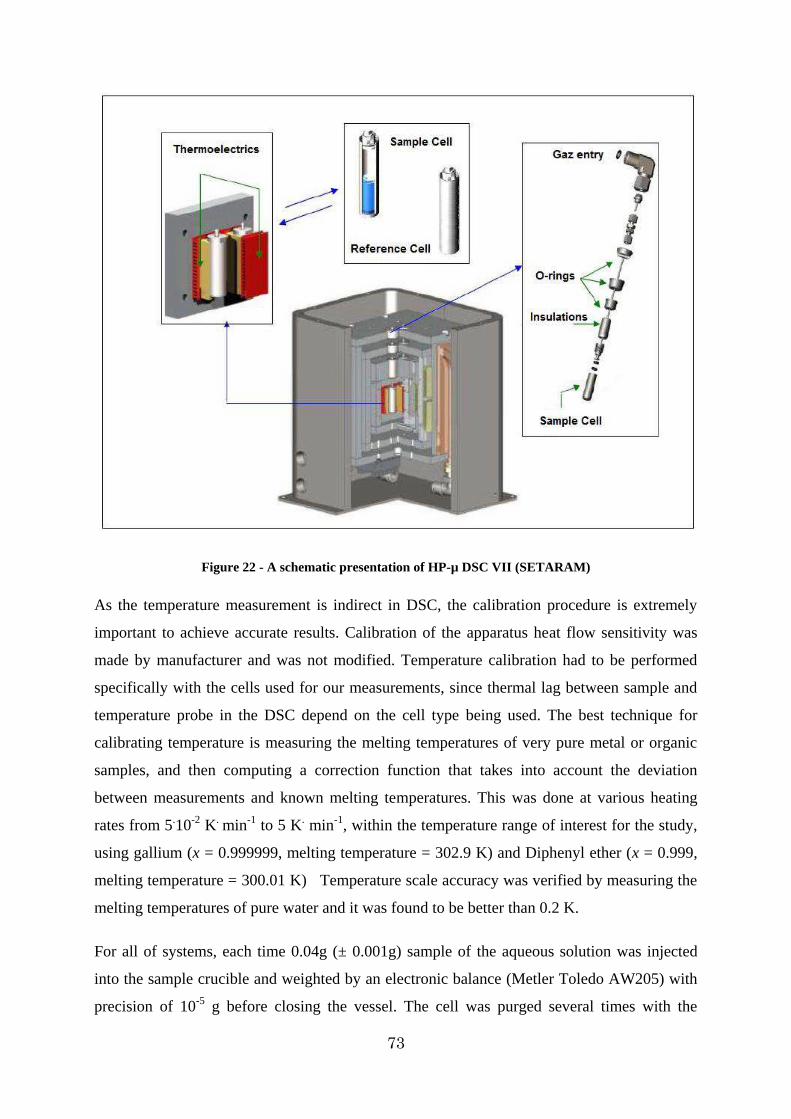
73
Figure 22 - A schematic presentation of HP-µ DSC VII (SETARAM)
As the temperature measurement is indirect in DSC, the calibration procedure is extremely
important to achieve accurate results. Calibration of the apparatus heat flow sensitivity was
made by manufacturer and was not modified. Temperature calibration had to be performed
specifically with the cells used for our measurements, since thermal lag between sample and
temperature probe in the DSC depend on the cell type being used. The best technique for
calibrating temperature is measuring the melting temperatures of very pure metal or organic
samples, and then computing a correction function that takes into account the deviation
between measurements and known melting temperatures. This was done at various heating
rates from 5.10-2 K. min-1 to 5 K. min-1, within the temperature range of interest for the study,
using gallium (x = 0.999999, melting temperature = 302.9 K) and Diphenyl ether (x = 0.999,
melting temperature = 300.01 K) Temperature scale accuracy was verified by measuring the
melting temperatures of pure water and it was found to be better than 0.2 K.
For all of systems, each time 0.04g (± 0.001g) sample of the aqueous solution was injected
into the sample crucible and weighted by an electronic balance (Metler Toledo AW205) with
precision of 10-5 g before closing the vessel. The cell was purged several times with the
74
experiment gas (hydrogen or mixture) to assure the evacuation of air. At the end desired gas
pressure was set.
As DSC cells are not equipped with agitators, in spite of the small quantity of sample, hydrate
formation is hindered by limiting diffusion of gas through the liquid. The formation reaction
is thus very slow and cannot be followed since no observation medium is provided. In order to
overcome this inconvenience a multi-cycle program was adjusted and applied to all of the
systems. These cycles consists in successively cooling the sample down to 248.15 K for
providing a proper super-cooling (driving force). After keeping the sample at 248.15 K for a
short time (usually 10 minutes) the samples were heated a temperature higher than 273.15 K,
and lower than the dissociation temperature of hydrates. The sample is kept at this
temperature for a while (10 minutes) and then again it is cooled down to 248 K. [Figure 23].
These cycles are repeated in order to accumulate the formed hydrate in cell by consuming the
remained water. The last cycle in the thermal program consists in keeping hydrate at 248 K
for a relatively longer period 100 min) for achieving at an equilibrium state and then
dissociating the accumulated hydrate at a temperature rate of 0.5 K. min-1. The number of
cycles, the duration of keeping sample in lower and higher temperature limits and the
cooling/heating rate are important factors which affect the amount of the formed hydrate and
the resolution of the final peaks. These factor are usually set by experience.
Figure 23 - A schematic presentation of multi-cycle thermal program for hydrate formation ending with
hydrate dissociation.
The evolution of heat flux rate during the thermal cycles which corresponds to the conversion
of water to hydrate can be seen in the Heat flux – time diagram illustrated in Figure 24. As it
can be seen in this diagram, doing these cycles reduces the absolute value of heat flux of the
sample. This can be interpreted as conversion of water into hydrate. As more hydrate is
formed, less free water is remained in the cell, and therefore less energy is devoted for cooling
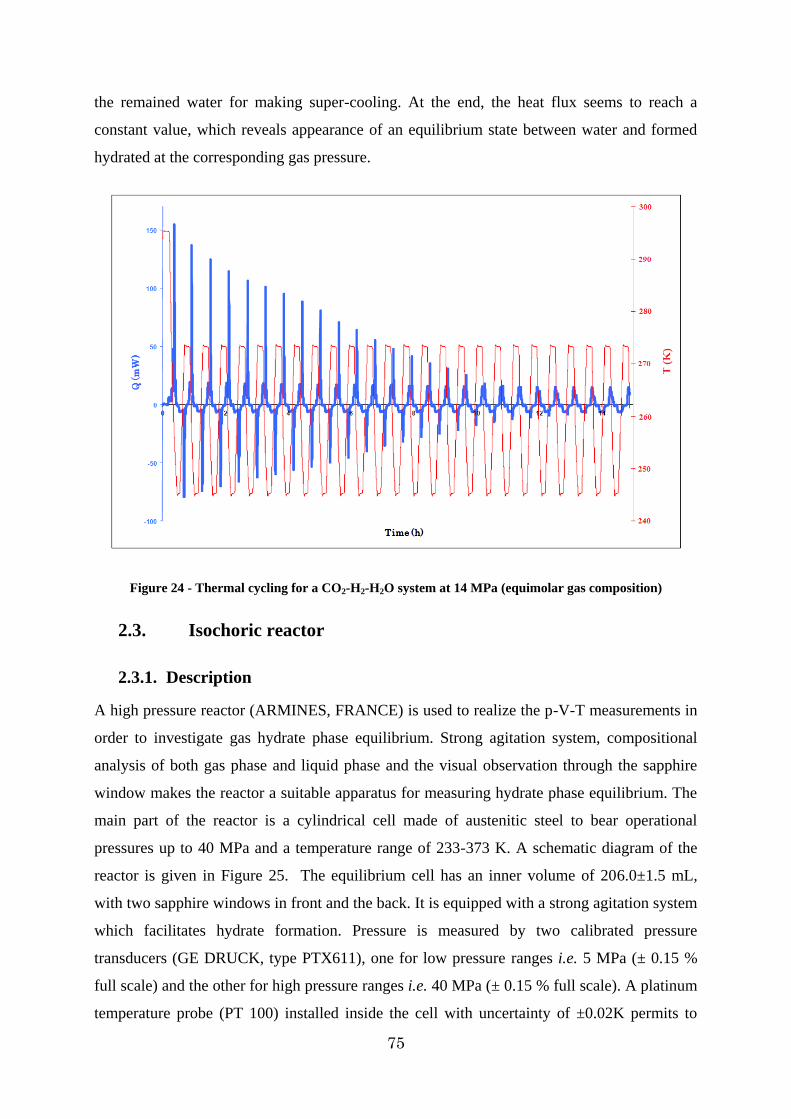
75
the remained water for making super-cooling. At the end, the heat flux seems to reach a
constant value, which reveals appearance of an equilibrium state between water and formed
hydrated at the corresponding gas pressure.
Figure 24 - Thermal cycling for a CO2-H2-H2O system at 14 MPa (equimolar gas composition)
2.3. Isochoric reactor
2.3.1. Description
A high pressure reactor (ARMINES, FRANCE) is used to realize the p-V-T measurements in
order to investigate gas hydrate phase equilibrium. Strong agitation system, compositional
analysis of both gas phase and liquid phase and the visual observation through the sapphire
window makes the reactor a suitable apparatus for measuring hydrate phase equilibrium. The
main part of the reactor is a cylindrical cell made of austenitic steel to bear operational
pressures up to 40 MPa and a temperature range of 233-373 K. A schematic diagram of the
reactor is given in Figure 25. The equilibrium cell has an inner volume of 206.0±1.5 mL,
with two sapphire windows in front and the back. It is equipped with a strong agitation system
which facilitates hydrate formation. Pressure is measured by two calibrated pressure
transducers (GE DRUCK, type PTX611), one for low pressure ranges i.e. 5 MPa (± 0.15 %
full scale) and the other for high pressure ranges i.e. 40 MPa (± 0.15 % full scale). A platinum
temperature probe (PT 100) installed inside the cell with uncertainty of ±0.02K permits to
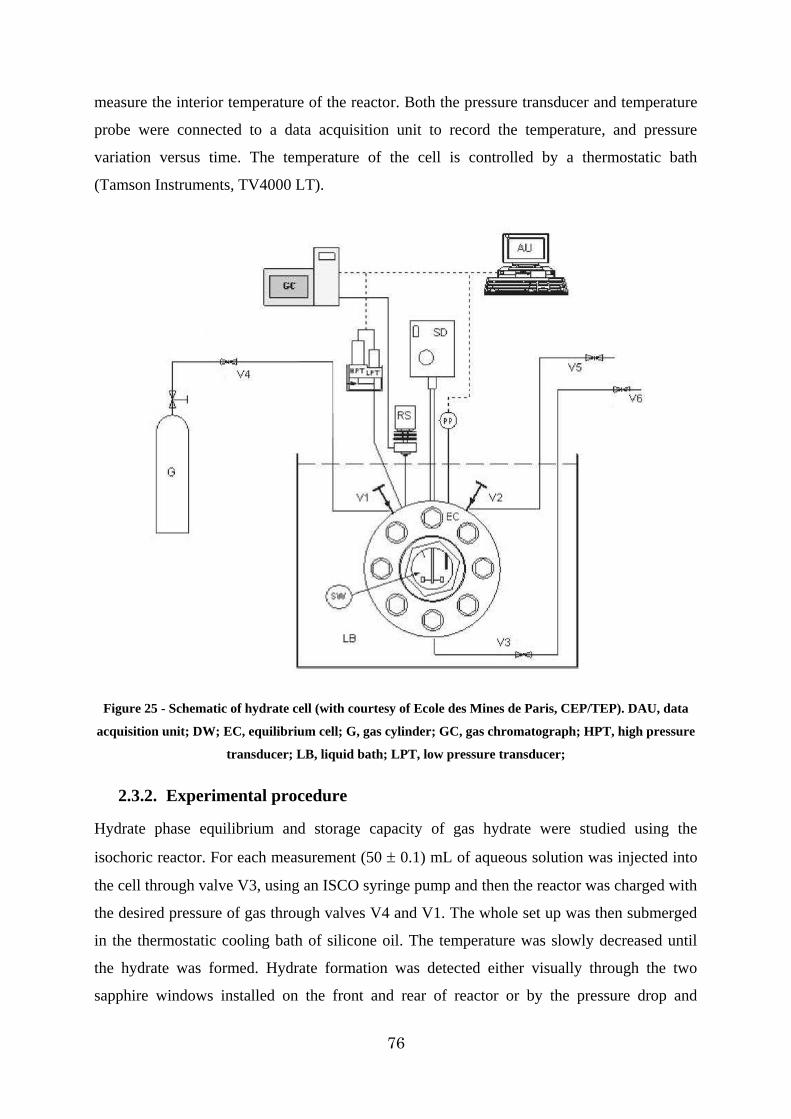
76
measure the interior temperature of the reactor. Both the pressure transducer and temperature
probe were connected to a data acquisition unit to record the temperature, and pressure
variation versus time. The temperature of the cell is controlled by a thermostatic bath
(Tamson Instruments, TV4000 LT).
Figure 25 - Schematic of hydrate cell (with courtesy of Ecole des Mines de Paris, CEP/TEP). DAU, data
acquisition unit; DW; EC, equilibrium cell; G, gas cylinder; GC, gas chromatograph; HPT, high pressure
transducer; LB, liquid bath; LPT, low pressure transducer;
2.3.2. Experimental procedure
Hydrate phase equilibrium and storage capacity of gas hydrate were studied using the
isochoric reactor. For each measurement (50 0.1) mL of aqueous solution was injected into
the cell through valve V3, using an ISCO syringe pump and then the reactor was charged with
the desired pressure of gas through valves V4 and V1. The whole set up was then submerged
in the thermostatic cooling bath of silicone oil. The temperature was slowly decreased until
the hydrate was formed. Hydrate formation was detected either visually through the two
sapphire windows installed on the front and rear of reactor or by the pressure drop and
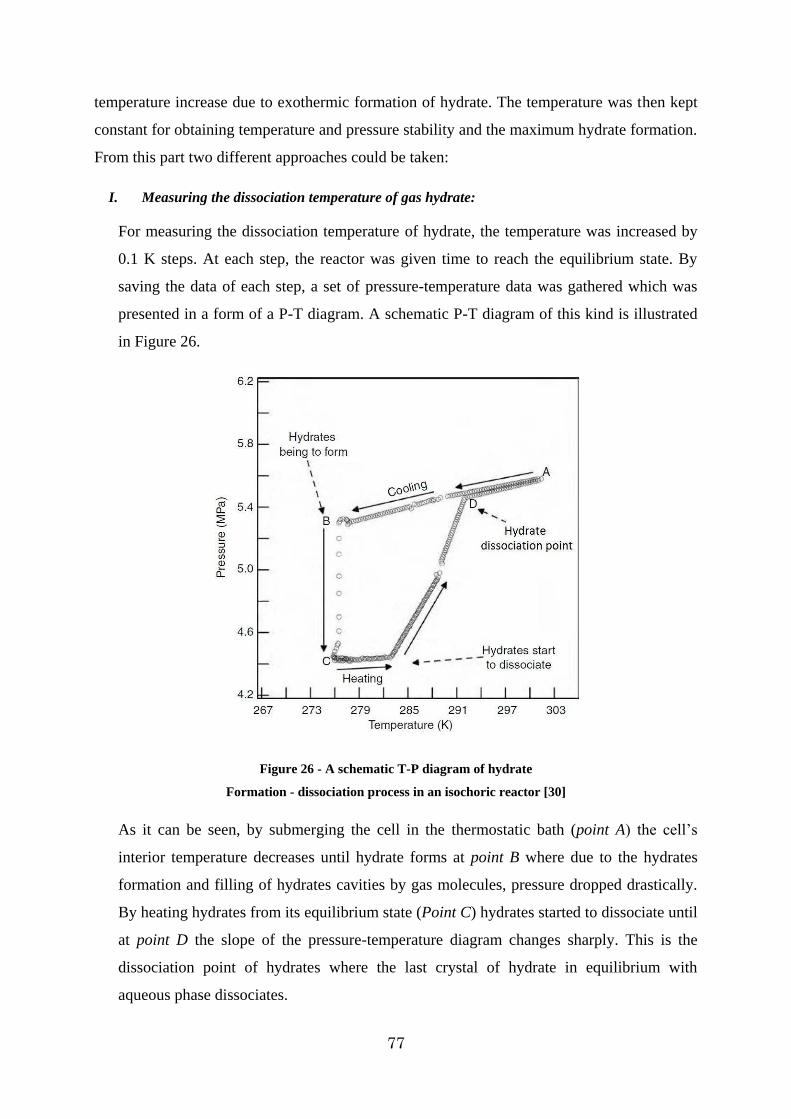
77
temperature increase due to exothermic formation of hydrate. The temperature was then kept
constant for obtaining temperature and pressure stability and the maximum hydrate formation.
From this part two different approaches could be taken:
I. Measuring the dissociation temperature of gas hydrate:
For measuring the dissociation temperature of hydrate, the temperature was increased by
0.1 K steps. At each step, the reactor was given time to reach the equilibrium state. By
saving the data of each step, a set of pressure-temperature data was gathered which was
presented in a form of a P-T diagram. A schematic P-T diagram of this kind is illustrated
in Figure 26.
Figure 26 - A schematic T-P diagram of hydrate
Formation - dissociation process in an isochoric reactor [30]
As it can be seen, by submerging the cell in the thermostatic bath (point A) the cell‟s
interior temperature decreases until hydrate forms at point B where due to the hydrates
formation and filling of hydrates cavities by gas molecules, pressure dropped drastically.
By heating hydrates from its equilibrium state (Point C) hydrates started to dissociate until
at point D the slope of the pressure-temperature diagram changes sharply. This is the
dissociation point of hydrates where the last crystal of hydrate in equilibrium with
aqueous phase dissociates.
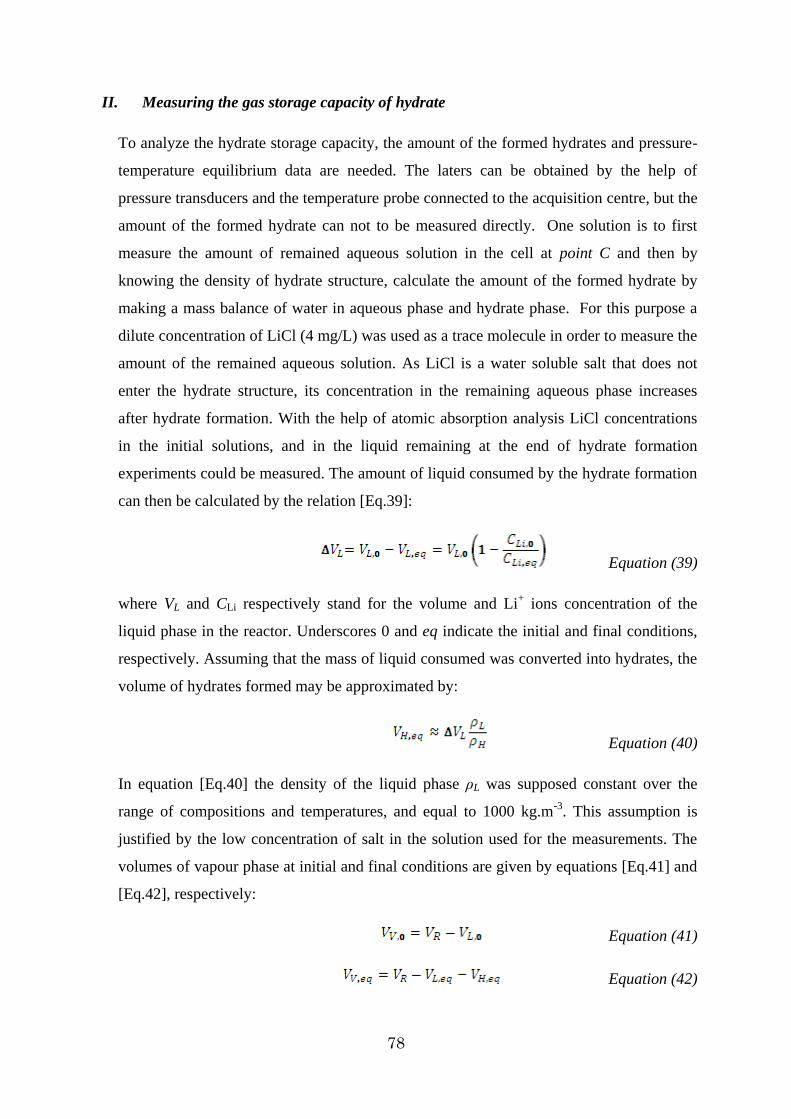
78
II. Measuring the gas storage capacity of hydrate
To analyze the hydrate storage capacity, the amount of the formed hydrates and pressure-
temperature equilibrium data are needed. The laters can be obtained by the help of
pressure transducers and the temperature probe connected to the acquisition centre, but the
amount of the formed hydrate can not to be measured directly. One solution is to first
measure the amount of remained aqueous solution in the cell at point C and then by
knowing the density of hydrate structure, calculate the amount of the formed hydrate by
making a mass balance of water in aqueous phase and hydrate phase. For this purpose a
dilute concentration of LiCl (4 mg/L) was used as a trace molecule in order to measure the
amount of the remained aqueous solution. As LiCl is a water soluble salt that does not
enter the hydrate structure, its concentration in the remaining aqueous phase increases
after hydrate formation. With the help of atomic absorption analysis LiCl concentrations
in the initial solutions, and in the liquid remaining at the end of hydrate formation
experiments could be measured. The amount of liquid consumed by the hydrate formation
can then be calculated by the relation [Eq.39]:
Equation (39)
where VL and CLi respectively stand for the volume and Li+ ions concentration of the
liquid phase in the reactor. Underscores 0 and eq indicate the initial and final conditions,
respectively. Assuming that the mass of liquid consumed was converted into hydrates, the
volume of hydrates formed may be approximated by:
Equation (40)
In equation [Eq.40] the density of the liquid phase ρL was supposed constant over the
range of compositions and temperatures, and equal to 1000 kg.m-3. This assumption is
justified by the low concentration of salt in the solution used for the measurements. The
volumes of vapour phase at initial and final conditions are given by equations [Eq.41] and
[Eq.42], respectively:
Equation (41)
Equation (42)
79
Where the volume of the reactor has been determined previously to be VR = (206.0 1.5)
mL, including the liquid transfer lines. Finally the amount of hydrogen stored in the
hydrate can be obtained from pressure and temperature measurements using equation
[Eq.43] :
Equation (43)
At the pressures investigated for our measurements, 20 MPa or less, the compressibility
factor Z of hydrogen was assigned a value of 1,1. The number of moles entrapped was
further converted to a percentage of the hydrate mass in order to compare the storage
capacity with other media.
2.4. Gas phase composition analysis: Gas Chromatography
The gas phase composition analyzing system was possible by a Rapid Online Sampling
Injector (ROLSI) developed and constructed at École des Mines de Paris, Fontainebleau,
France. ROLSI is from one side connected to the isochoric reactor for taking samples and
from the other sided connected to a Gas Chromatographer (GC) for sending the samples to the
GC through an isothermal transfer line [Figure 27]. A permanent stream of career gas in the
open cycle of ROLSI makes online sampling possible. Absence of dead volume in the
sampler, possibility of taking samples as small as 0.1 mg, wide range of operational
temperatures from cryogenic conditions to 553 K and pressures up to 60 MPa makes ROLSI a
very practical sampler for studying hydrate phase equilibrium [72].
The gas chromatograph is a PERICHROM PR2100 which uses a Thermal Conductivity
Detector (TCD) and a PORAPAK-Q packed column (length, 2 m; o.d., 1/8 in., 80/100 mesh).
The TCD was calibrated for propane, carbon dioxide and hydrogen. For this purpose, firstly a
career gas was selected for two systems of H2-C3H8 and H2-CO2 by comparing the thermal
conductibility of these gases. Table 8 presents the thermal conductibility of some common
career gas in gas chromatography in a wide range of 273 to 378 K. For the system H2-C3H8
the thermal conductibility of nitrogen produces a good resolution and was selected as the
carrier gas of the system.
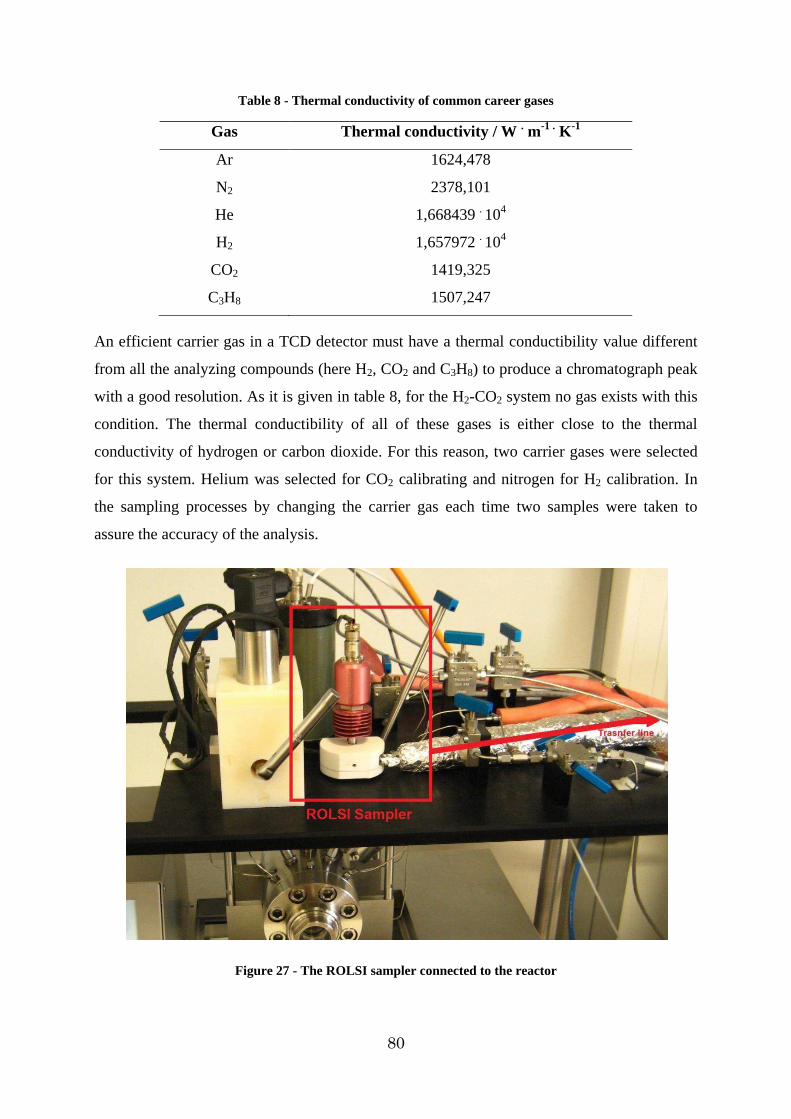
80
Table 8 - Thermal conductivity of common career gases
Gas Thermal conductivity / W . m-1 . K -1
Ar 1624,478
N2 2378,101
He 1,668439 . 104
H2 1,657972 . 104
CO2 1419,325
C3H8 1507,247
An efficient carrier gas in a TCD detector must have a thermal conductibility value different
from all the analyzing compounds (here H2, CO2 and C3H8) to produce a chromatograph peak
with a good resolution. As it is given in table 8, for the H2-CO2 system no gas exists with this
condition. The thermal conductibility of all of these gases is either close to the thermal
conductivity of hydrogen or carbon dioxide. For this reason, two carrier gases were selected
for this system. Helium was selected for CO2 calibrating and nitrogen for H2 calibration. In
the sampling processes by changing the carrier gas each time two samples were taken to
assure the accuracy of the analysis.
Figure 27 - The ROLSI sampler connected to the reactor
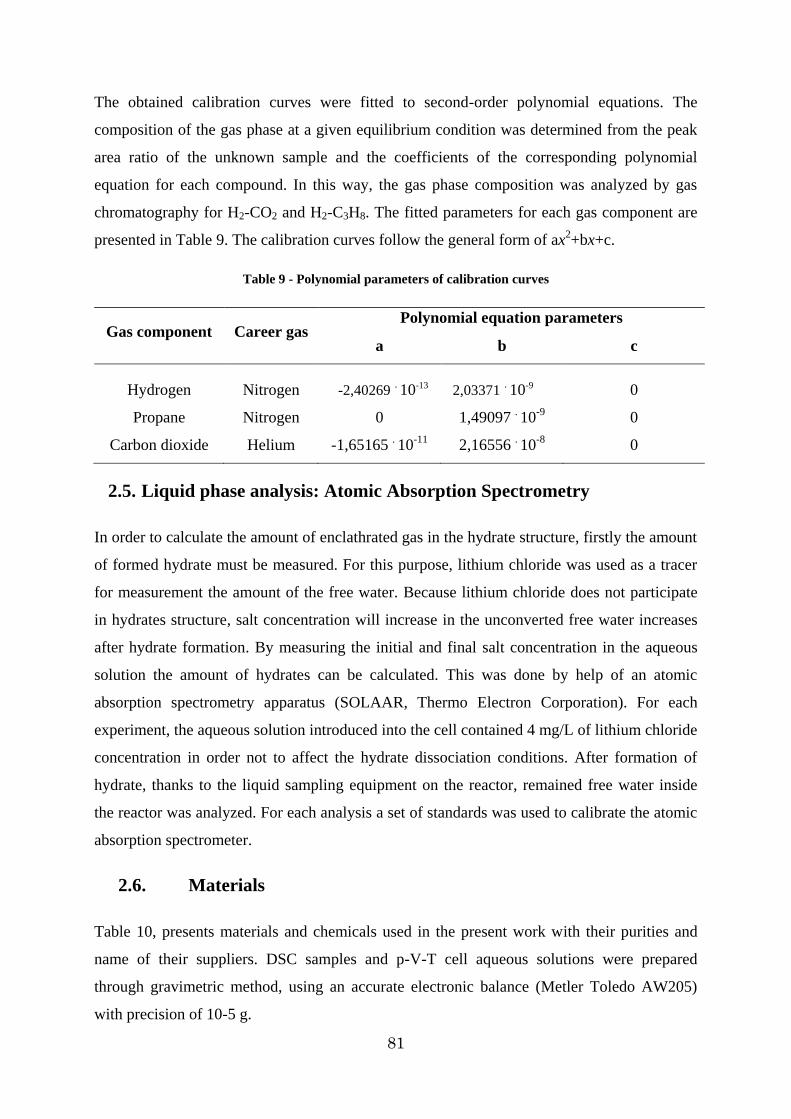
81
The obtained calibration curves were fitted to second-order polynomial equations. The
composition of the gas phase at a given equilibrium condition was determined from the peak
area ratio of the unknown sample and the coefficients of the corresponding polynomial
equation for each compound. In this way, the gas phase composition was analyzed by gas
chromatography for H2-CO2 and H2-C3H8. The fitted parameters for each gas component are
presented in Table 9. The calibration curves follow the general form of ax2+bx+c.
Table 9 - Polynomial parameters of calibration curves
Gas component Career gas Polynomial equation parameters
a b c
Hydrogen Nitrogen -2,40269 . 10-13
2,03371 . 10-9
0
Propane Nitrogen 0 1,49097 . 10-9 0
Carbon dioxide Helium -1,65165 . 10-11 2,16556 . 10-8 0
2.5. Liquid phase analysis: Atomic Absorption Spectrometry
In order to calculate the amount of enclathrated gas in the hydrate structure, firstly the amount
of formed hydrate must be measured. For this purpose, lithium chloride was used as a tracer
for measurement the amount of the free water. Because lithium chloride does not participate
in hydrates structure, salt concentration will increase in the unconverted free water increases
after hydrate formation. By measuring the initial and final salt concentration in the aqueous
solution the amount of hydrates can be calculated. This was done by help of an atomic
absorption spectrometry apparatus (SOLAAR, Thermo Electron Corporation). For each
experiment, the aqueous solution introduced into the cell contained 4 mg/L of lithium chloride
concentration in order not to affect the hydrate dissociation conditions. After formation of
hydrate, thanks to the liquid sampling equipment on the reactor, remained free water inside
the reactor was analyzed. For each analysis a set of standards was used to calibrate the atomic
absorption spectrometer.
2.6. Materials
Table 10, presents materials and chemicals used in the present work with their purities and
name of their suppliers. DSC samples and p-V-T cell aqueous solutions were prepared
through gravimetric method, using an accurate electronic balance (Metler Toledo AW205)
with precision of 10-5 g.
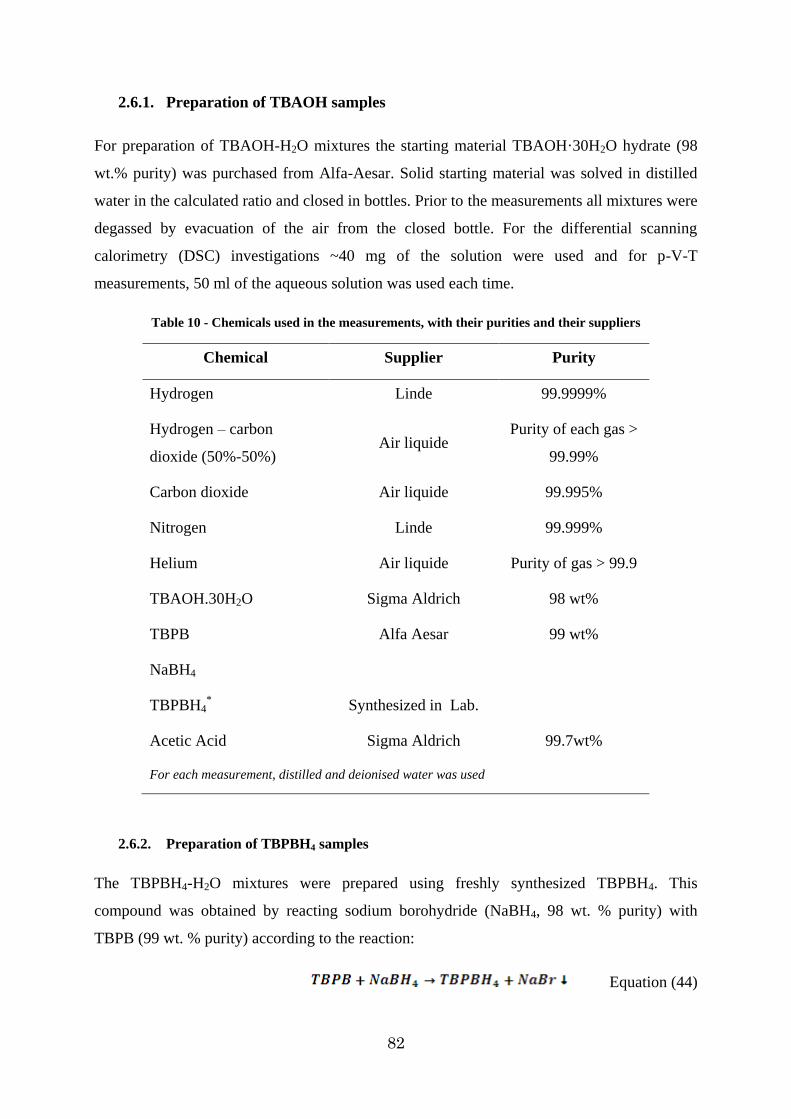
82
2.6.1. Preparation of TBAOH samples
For preparation of TBAOH-H2O mixtures the starting material TBAOH·30H2O hydrate (98
wt.% purity) was purchased from Alfa-Aesar. Solid starting material was solved in distilled
water in the calculated ratio and closed in bottles. Prior to the measurements all mixtures were
degassed by evacuation of the air from the closed bottle. For the differential scanning
calorimetry (DSC) investigations ~40 mg of the solution were used and for p-V-T
measurements, 50 ml of the aqueous solution was used each time.
Table 10 - Chemicals used in the measurements, with their purities and their suppliers
Chemical Supplier Purity
Hydrogen Linde 99.9999%
Hydrogen – carbon
dioxide (50%-50%) Air liquide
Purity of each gas >
99.99%
Carbon dioxide Air liquide 99.995%
Nitrogen Linde 99.999%
Helium Air liquide Purity of gas > 99.9
TBAOH.30H2O Sigma Aldrich 98 wt%
TBPB Alfa Aesar 99 wt%
NaBH4
TBPBH4* Synthesized in Lab.
Acetic Acid Sigma Aldrich 99.7wt%
For each measurement, distilled and deionised water was used
2.6.2. Preparation of TBPBH4 samples
The TBPBH4-H2O mixtures were prepared using freshly synthesized TBPBH4. This
compound was obtained by reacting sodium borohydride (NaBH4, 98 wt. % purity) with
TBPB (99 wt. % purity) according to the reaction:
Equation (44)
83
This reaction was carried out in a solution of ethanol, followed by solvent evacuation and
sample crystallization. To prevent the hydrolysis reaction of TBPBH4 during the preparation
of the TBPBH4-H2O mixtures, a 0.5 M water solution of NaOH was used instead of pure
distilled water. Such concentration was investigated experimentally by observation of the
hydrogen release in the mixtures with different amount of NaOH. At this concentration of
sodium hydroxide no hydrogen release was observed. To avoid a slow hydrolysis reaction
which can be invisible, all TBPBH4 -H2O mixtures were prepared separately in the DSC
sample holder prior to each measurement. At the end, for investigating the hydrogen release
from the TBPBH4 hydrolysis reaction, acetic acid was used.

84
85
CChhaapptteerr tthhrreeee::
RReessuull ttss && DDiissccuussssiioonnss ((11))
-- SSeemmii--ccllaatthhrr aattee ssyysstteemmss --
As it was discussed earlier one of the main properties of hydrogen clathrate hydrates is their severe formation / dissociation conditions. In order to overcome these severe conditions, many researches have been carried out in recent years and consequently some organic additives have been presented, among which THF is the most famous. Although additives such as THF [42-47] reduce the formation pressure of hydrogen hydrates and increase their dissociation temperature, their volatility and toxicity cause inevitable operational problems.
In this aspect, further investigations were contributed to the semi-clathrate of quaternary salts capable of hosting hydrogen molecules in more stable structures. Unfortunately, the major disadvantage of these semi-clathrates is their low storage capacity [52-64] which does not meet the technical and commercial requirements for a mobile storage system. However, they appear to be an imaginable future for in-place storage systems.
Accordingly, in this work hydrogen semi-hydrates of two quaternary salts were investigated. Effect of Tetra-n-butyl phosphonium borohydrate (TBPBH4) as a quaternary phosphonium salt and Tetra-n-butyl ammonium hydroxide (TBAOH) as a quaternary ammonium salt on hydrogen storage has been investigated for the first time. Their phase diagrams have been established and their storage capacities have been measured. Eventually efficiency of these salts is evaluated by comparing the results with other hydrogen hydrate systems.

86
87
3.1. Investigation of TBPBH4 semi-clathrate system
3.1.1. Introduction
As previously stated, hydrogen storage in sII clathrate hydrates is constrained by severe
formation conditions. Subsequent use of promoter molecules such as tetrahydrofuran (THF)
created new prospects for corssing these barriers and therefore to shift the phase equilibrium
boundaries to lower pressures and higher temperatures region. In this regard, special attention
has been given to the hydrates of tetraalkylonium salts. Several experimental evidences show
hydrogen enclathration in cavities of tetra-n-butylammonium bromide (TBAB) semi-clathrate
[73-78]. It is shown that binary H2-TBAB semi-clathrate hydrate demonstrates greatly
increased thermal and low-pressure stability when compared with H2 and H2-THF clathrate
hydrates. Moreover, when tetra-n-butylammonium fluoride (TBAF) is used instead of TBAB,
the stability can be increased even further [79].
Since the discovery that hydrogen molecules can be stored in semi-clathrate hydrates of
quaternary ammonium compounds, other members of the “quaternary ammonium/
phosphonium salts” family have been subject of many investigations. One major disadvantage
of this approach is that the total amount of hydrogen stored in semiclathrate hydrates is too
small to be compared with the mass fractions required for the practical usage.
On the other hand, some hydrolysable materials such as hydroquinone [80] and NaBH4 [91]
are attracting the attentions for a hydrogen storage scheme. The common point between these
two different storage methods is the presence of water as an essential component. Therefore,
if a hydrolysable compound be able of forming hydrates (semi-clathrate) a further hydrolysis
of this compound will result in a higher hydrogen production. This new approach is called
hybrid storage of hydrogen. An early investigation of hybrid hydrogen storage in tetra-n-
butylammonium borohydride semiclathrates shows that the additional hydrogen produced
from the hydrolysis of BH4- increases the gravimetric hydrogen storage capacity by 170%
[81]. The hydrolysis reaction can be summarized as:
Equation (45)
Theoretically the hydrolysis of sodium borohydride has an ideal gravimetric storage capacity
of 10.8 wt%, however by taking into account NaBO2 as a by-product, the actual hydrogen
capacity reduces to less than 2.9 wt% [82].
88
As it has been demonstrated earlier, [78] the tetra-alkylphosphonium salts increase the hydrate
stability more than their ammonium partners. This behaviour may be present also in the case
of TBPBH4 salt in comparison to TBABH4. In this regard, tetra-n-butylphosphonium
borohydride [(n-C4H9)4PBH4] salt has been chosen for the purpose of hydrogen hybrid storage
investigations. Using different pressures of N2 and H2 the effect of the gas nature and hydrate
stabilization kinetics has been analysed. The dissociation temperatures and phase diagram of
the system has been investigated and finally quantitative measurement of the chemically
bonded hydrogen was obtained by gas volumetric analysis.
3.1.2. Investigations of the synthesized TBPBH4 salt
In order to achieve the optimal conditions for the synthesis of the TBPBH4 salt different
parameters such as volumes of the solvent (ethanol), time and atmosphere of the reaction were
studied. The favourable synthesis procedure was chosen by comparing the results of the gas
volumetric analysis. The highest hydrogen release during the hydrolysis revealed the best
reaction conditions. Table 11 presents the results of 4 sets of operational conditions that were
tested during the study. The conditions of reaction number 1 are more favourable in
comparison to the others. It is noticeable that the reaction atmosphere does not influence the
efficiency of synthesis and in contrary, the time of mixing and volume of solvent are of great
importance. Therefore, in our investigations TBPBH4 salt was synthesized under the
conditions of reaction number 1. The 1.73 mol of hydrogen, which was released from 1 mol
of TBPBH4 corresponds to 1.26 wt. % of chemically bonded hydrogen in TBPBH4. This
amount is much higher than hydrogen storage in the hydrates stabilized by other
tetraalkylonium salts. For instance, H2 + TBACl and H2 + TBPB semiclathrate hydrates can
release 0.12 wt% and 0.14 wt. % of hydrogen respectively [78], which is almost 10 times
lower than the hydrogen storage properties of the TBPBH4. In additions to the chemically
stored hydrogen, there is a possibility of physical entrapping of hydrogen molecules into the
structure of the semiclathrate hydrates of this salt. Thereby the hydrogen content of this
material will increase even more.
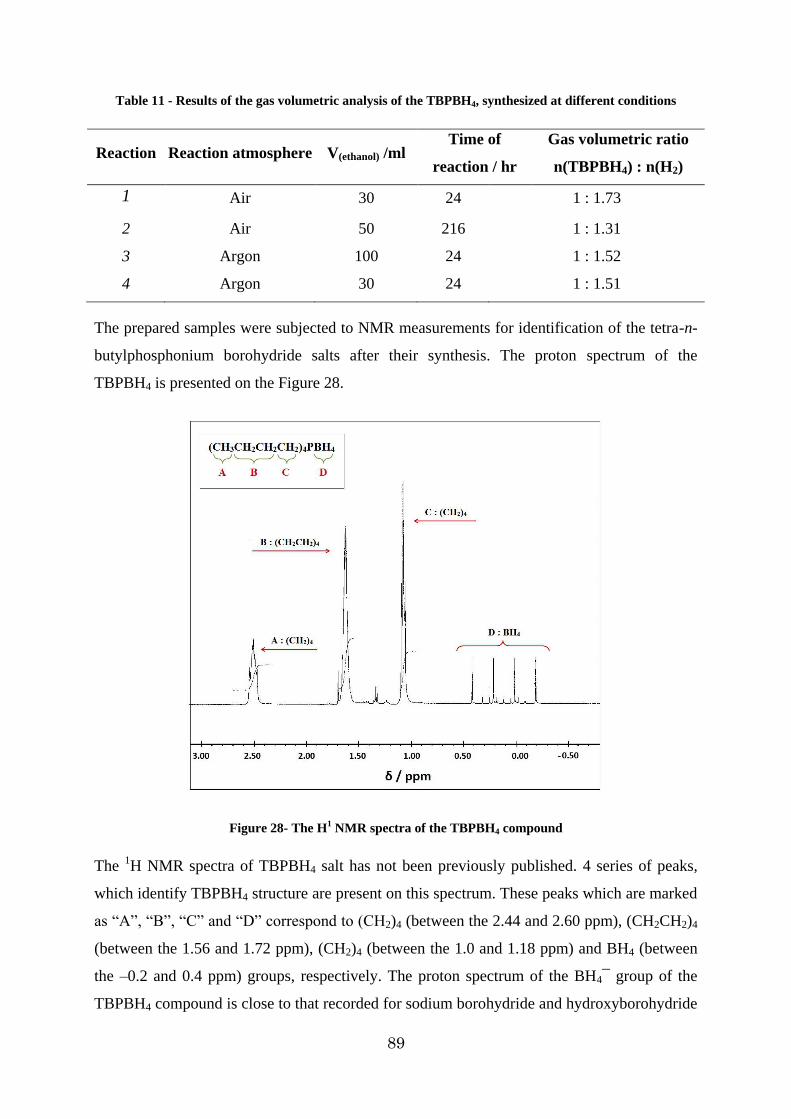
89
Table 11 - Results of the gas volumetric analysis of the TBPBH4, synthesized at different conditions
Reaction Reaction atmosphere V(ethanol) /ml Time of
reaction / hr
Gas volumetric ratio
n(TBPBH4) : n(H2)
1 Air 30 24 1 : 1.73
2 Air 50 216 1 : 1.31
3 Argon 100 24 1 : 1.52
4 Argon 30 24 1 : 1.51
The prepared samples were subjected to NMR measurements for identification of the tetra-n-
butylphosphonium borohydride salts after their synthesis. The proton spectrum of the
TBPBH4 is presented on the Figure 28.
Figure 28- The H1 NMR spectra of the TBPBH4 compound
The 1H NMR spectra of TBPBH4 salt has not been previously published. 4 series of peaks,
which identify TBPBH4 structure are present on this spectrum. These peaks which are marked
as “A”, “B”, “C” and “D” correspond to (CH2)4 (between the 2.44 and 2.60 ppm), (CH2CH2)4
(between the 1.56 and 1.72 ppm), (CH2)4 (between the 1.0 and 1.18 ppm) and BH4 (between
the –0.2 and 0.4 ppm) groups, respectively. The proton spectrum of the BH4¯ group of the
TBPBH4 compound is close to that recorded for sodium borohydride and hydroxyborohydride
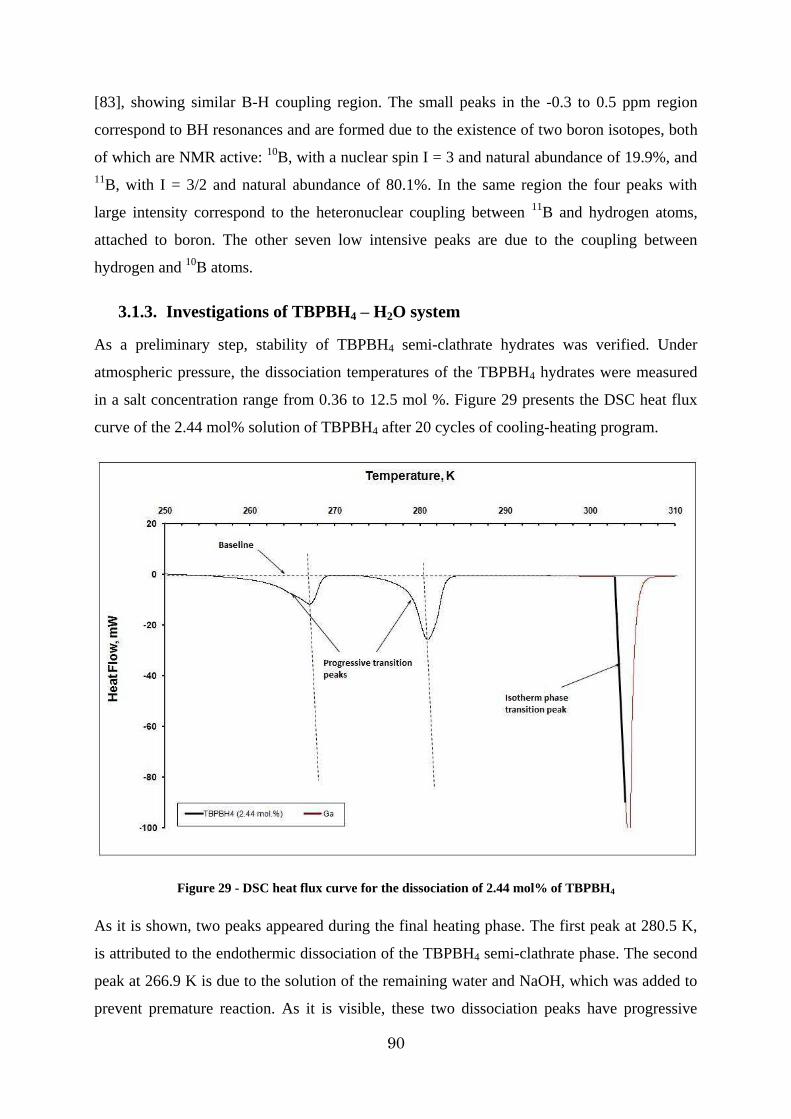
90
[83], showing similar B-H coupling region. The small peaks in the -0.3 to 0.5 ppm region
correspond to BH resonances and are formed due to the existence of two boron isotopes, both
of which are NMR active: 10B, with a nuclear spin I = 3 and natural abundance of 19.9%, and 11B, with I = 3/2 and natural abundance of 80.1%. In the same region the four peaks with
large intensity correspond to the heteronuclear coupling between 11B and hydrogen atoms,
attached to boron. The other seven low intensive peaks are due to the coupling between
hydrogen and 10B atoms.
3.1.3. Investigations of TBPBH4 – H2O system
As a preliminary step, stability of TBPBH4 semi-clathrate hydrates was verified. Under
atmospheric pressure, the dissociation temperatures of the TBPBH4 hydrates were measured
in a salt concentration range from 0.36 to 12.5 mol %. Figure 29 presents the DSC heat flux
curve of the 2.44 mol% solution of TBPBH4 after 20 cycles of cooling-heating program.
Figure 29 - DSC heat flux curve for the dissociation of 2.44 mol% of TBPBH4
As it is shown, two peaks appeared during the final heating phase. The first peak at 280.5 K,
is attributed to the endothermic dissociation of the TBPBH4 semi-clathrate phase. The second
peak at 266.9 K is due to the solution of the remaining water and NaOH, which was added to
prevent premature reaction. As it is visible, these two dissociation peaks have progressive
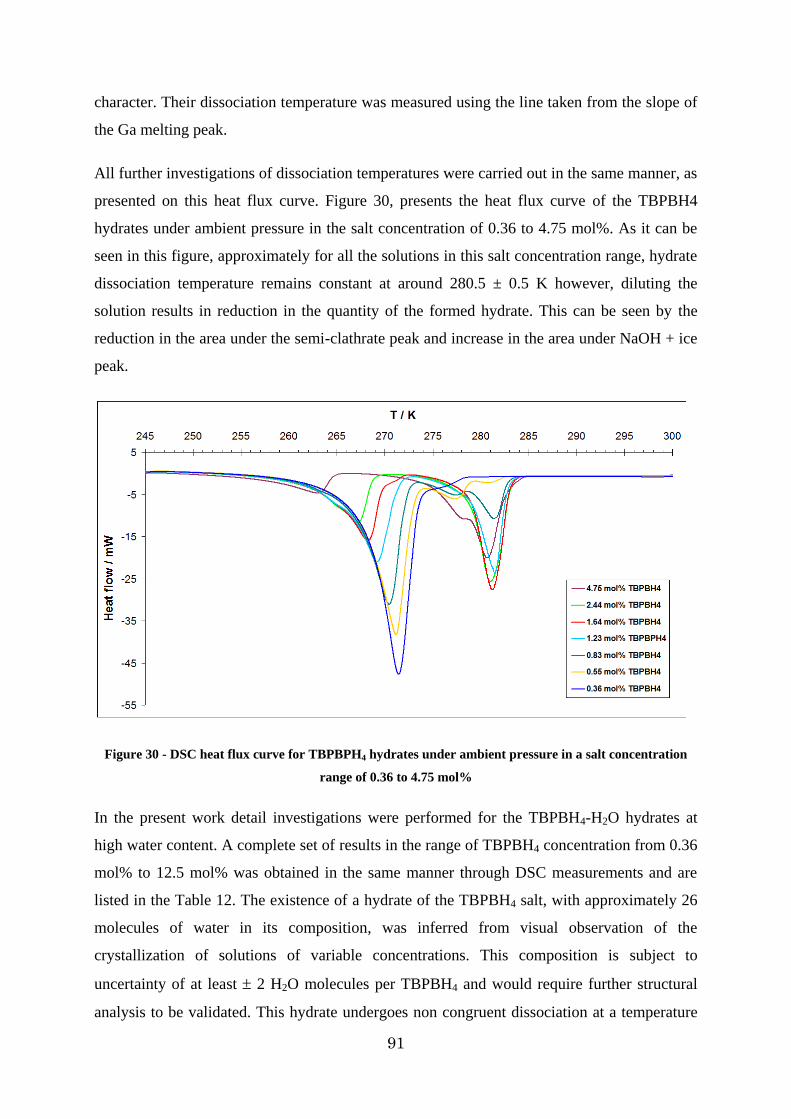
91
character. Their dissociation temperature was measured using the line taken from the slope of
the Ga melting peak.
All further investigations of dissociation temperatures were carried out in the same manner, as
presented on this heat flux curve. Figure 30, presents the heat flux curve of the TBPBH4
hydrates under ambient pressure in the salt concentration of 0.36 to 4.75 mol%. As it can be
seen in this figure, approximately for all the solutions in this salt concentration range, hydrate
dissociation temperature remains constant at around 280.5 ± 0.5 K however, diluting the
solution results in reduction in the quantity of the formed hydrate. This can be seen by the
reduction in the area under the semi-clathrate peak and increase in the area under NaOH + ice
peak.
Figure 30 - DSC heat flux curve for TBPBPH4 hydrates under ambient pressure in a salt concentration
range of 0.36 to 4.75 mol%
In the present work detail investigations were performed for the TBPBH4-H2O hydrates at
high water content. A complete set of results in the range of TBPBH4 concentration from 0.36
mol% to 12.5 mol% was obtained in the same manner through DSC measurements and are
listed in the Table 12. The existence of a hydrate of the TBPBH4 salt, with approximately 26
molecules of water in its composition, was inferred from visual observation of the
crystallization of solutions of variable concentrations. This composition is subject to
uncertainty of at least 2 H2O molecules per TBPBH4 and would require further structural
analysis to be validated. This hydrate undergoes non congruent dissociation at a temperature
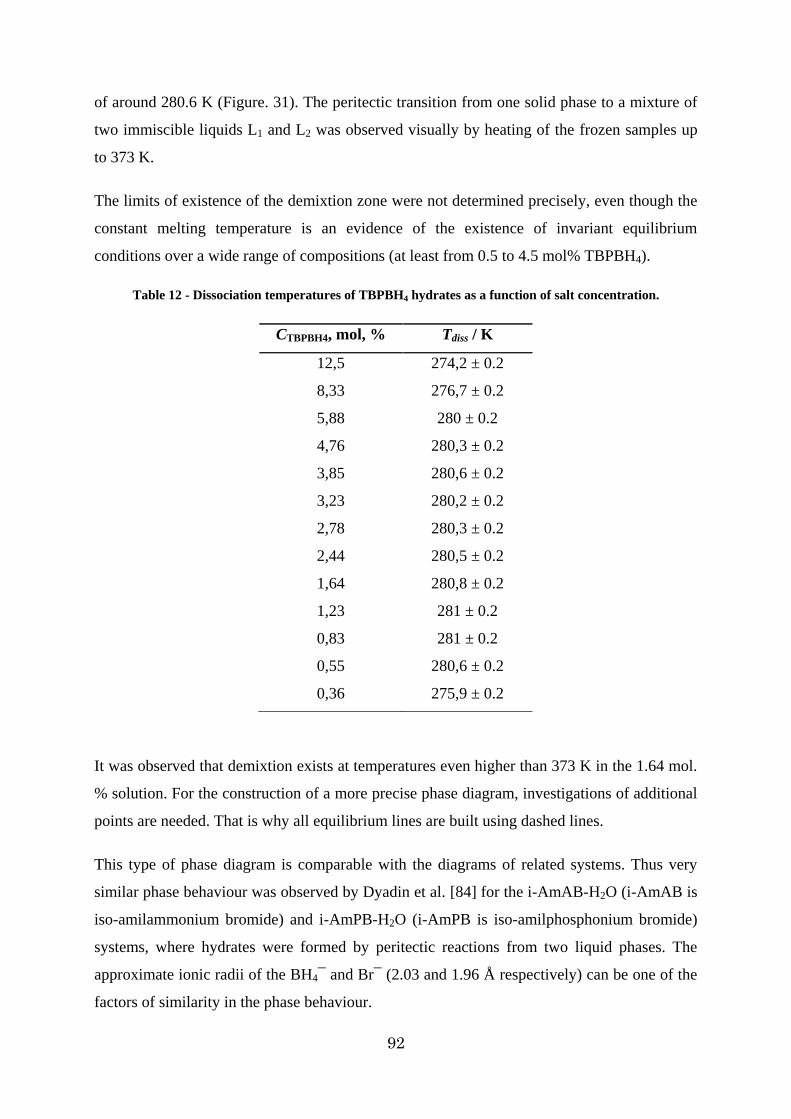
92
of around 280.6 K (Figure. 31). The peritectic transition from one solid phase to a mixture of
two immiscible liquids L1 and L2 was observed visually by heating of the frozen samples up
to 373 K.
The limits of existence of the demixtion zone were not determined precisely, even though the
constant melting temperature is an evidence of the existence of invariant equilibrium
conditions over a wide range of compositions (at least from 0.5 to 4.5 mol% TBPBH4).
Table 12 - Dissociation temperatures of TBPBH4 hydrates as a function of salt concentration.
It was observed that demixtion exists at temperatures even higher than 373 K in the 1.64 mol.
% solution. For the construction of a more precise phase diagram, investigations of additional
points are needed. That is why all equilibrium lines are built using dashed lines.
This type of phase diagram is comparable with the diagrams of related systems. Thus very
similar phase behaviour was observed by Dyadin et al. [84] for the i-AmAB-H2O (i-AmAB is
iso-amilammonium bromide) and i-AmPB-H2O (i-AmPB is iso-amilphosphonium bromide)
systems, where hydrates were formed by peritectic reactions from two liquid phases. The
approximate ionic radii of the BH4¯ and Br¯ (2.03 and 1.96 Å respectively) can be one of the
factors of similarity in the phase behaviour.
CTBPBH4, mol, % Tdiss / K
12,5 274,2 ± 0.2
8,33 276,7 ± 0.2
5,88 280 ± 0.2
4,76 280,3 ± 0.2
3,85 280,6 ± 0.2
3,23 280,2 ± 0.2
2,78 280,3 ± 0.2
2,44 280,5 ± 0.2
1,64 280,8 ± 0.2
1,23 281 ± 0.2
0,83 281 ± 0.2
0,55 280,6 ± 0.2
0,36 275,9 ± 0.2
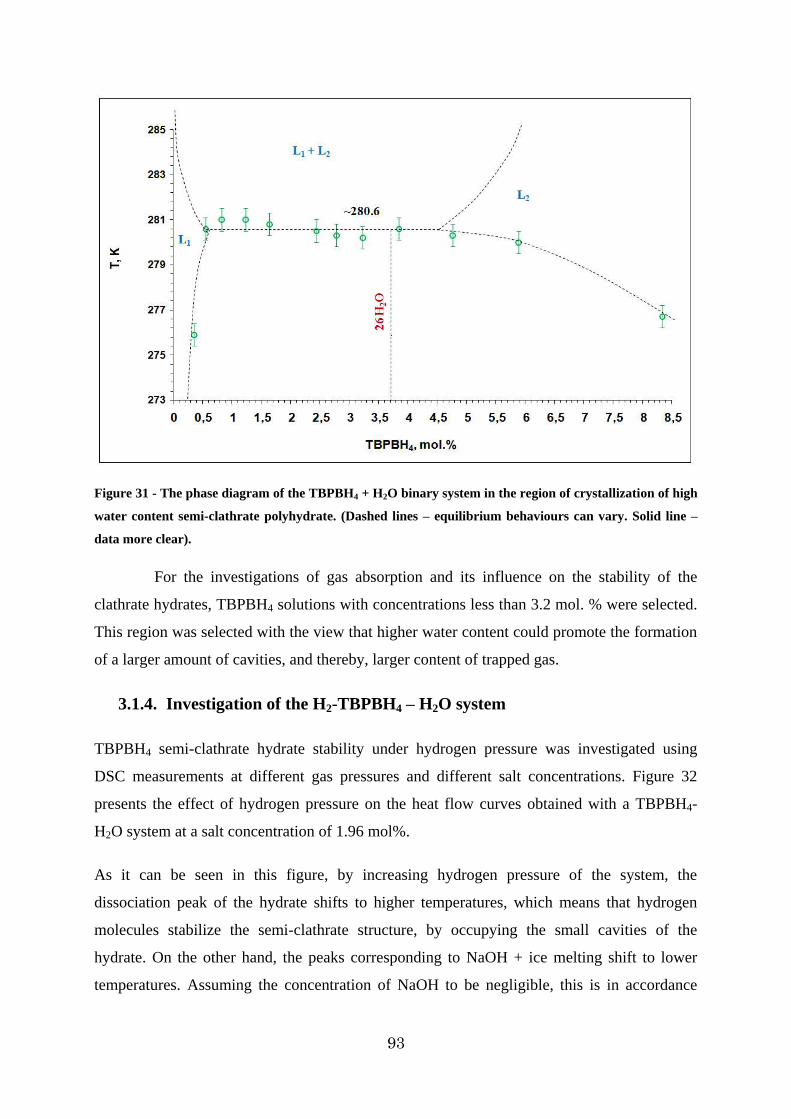
93
Figure 31 - The phase diagram of the TBPBH4 + H2O binary system in the region of crystallization of high
water content semi-clathrate polyhydrate. (Dashed lines – equilibrium behaviours can vary. Solid line –
data more clear).
For the investigations of gas absorption and its influence on the stability of the
clathrate hydrates, TBPBH4 solutions with concentrations less than 3.2 mol. % were selected.
This region was selected with the view that higher water content could promote the formation
of a larger amount of cavities, and thereby, larger content of trapped gas.
3.1.4. Investigation of the H2-TBPBH4 – H2O system
TBPBH4 semi-clathrate hydrate stability under hydrogen pressure was investigated using
DSC measurements at different gas pressures and different salt concentrations. Figure 32
presents the effect of hydrogen pressure on the heat flow curves obtained with a TBPBH4-
H2O system at a salt concentration of 1.96 mol%.
As it can be seen in this figure, by increasing hydrogen pressure of the system, the
dissociation peak of the hydrate shifts to higher temperatures, which means that hydrogen
molecules stabilize the semi-clathrate structure, by occupying the small cavities of the
hydrate. On the other hand, the peaks corresponding to NaOH + ice melting shift to lower
temperatures. Assuming the concentration of NaOH to be negligible, this is in accordance
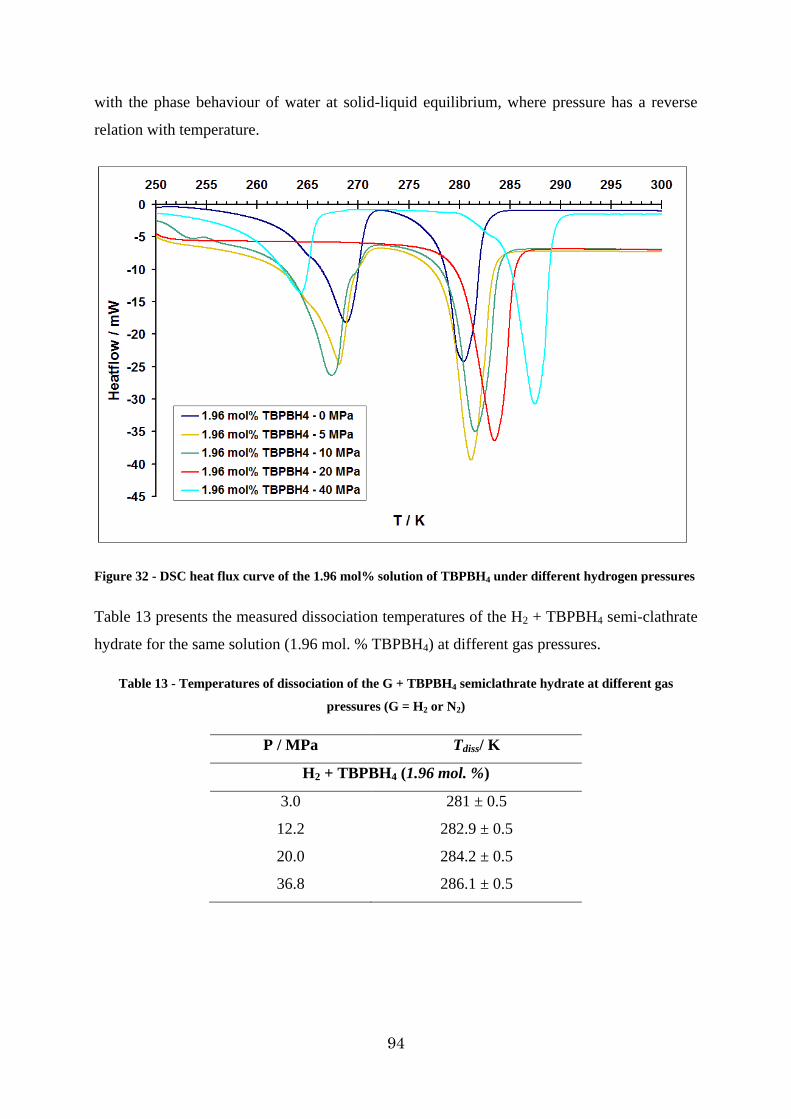
94
with the phase behaviour of water at solid-liquid equilibrium, where pressure has a reverse
relation with temperature.
Figure 32 - DSC heat flux curve of the 1.96 mol% solution of TBPBH4 under different hydrogen pressures
Table 13 presents the measured dissociation temperatures of the H2 + TBPBH4 semi-clathrate
hydrate for the same solution (1.96 mol. % TBPBH4) at different gas pressures.
Table 13 - Temperatures of dissociation of the G + TBPBH4 semiclathrate hydrate at different gas
pressures (G = H2 or N2)
P / MPa Tdiss/ K
H2 + TBPBH4 (1.96 mol. %)
3.0 281 ± 0.5
12.2 282.9 ± 0.5
20.0 284.2 ± 0.5
36.8 286.1 ± 0.5
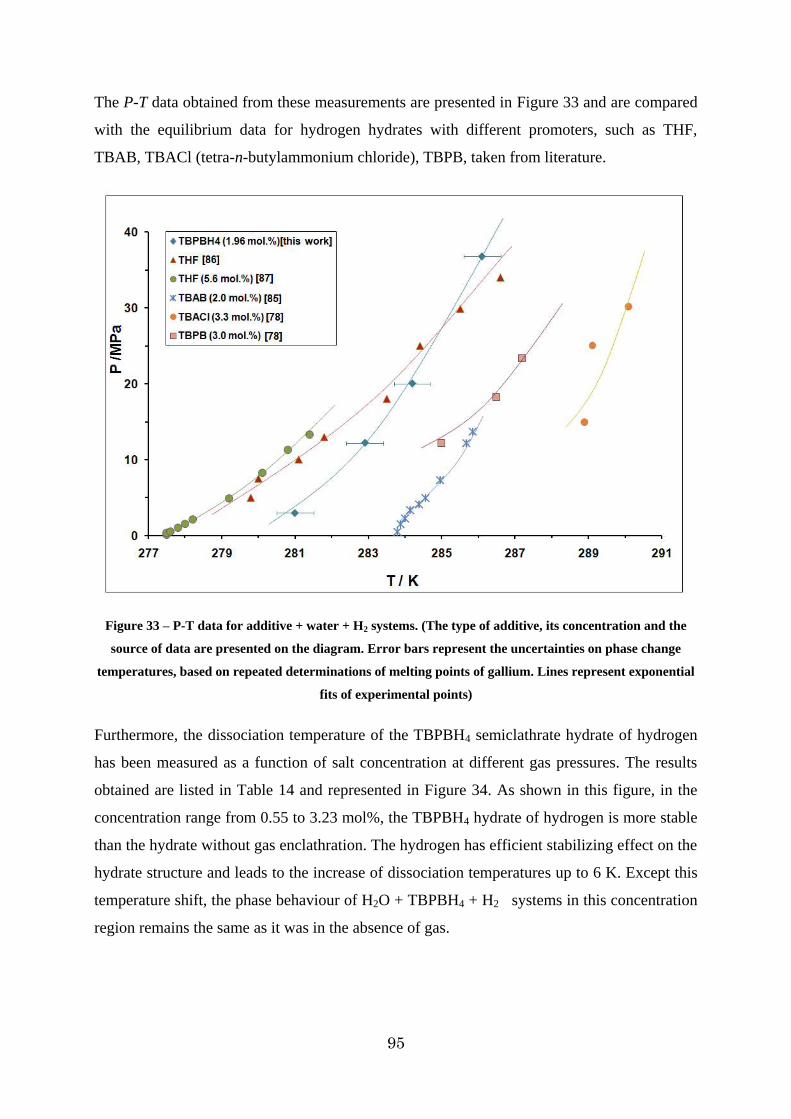
95
The P-T data obtained from these measurements are presented in Figure 33 and are compared
with the equilibrium data for hydrogen hydrates with different promoters, such as THF,
TBAB, TBACl (tetra-n-butylammonium chloride), TBPB, taken from literature.
Figure 33 – P-T data for additive + water + H2 systems. (The type of additive, its concentration and the
source of data are presented on the diagram. Error bars represent the uncertainties on phase change
temperatures, based on repeated determinations of melting points of gallium. Lines represent exponential
fits of experimental points)
Furthermore, the dissociation temperature of the TBPBH4 semiclathrate hydrate of hydrogen
has been measured as a function of salt concentration at different gas pressures. The results
obtained are listed in Table 14 and represented in Figure 34. As shown in this figure, in the
concentration range from 0.55 to 3.23 mol%, the TBPBH4 hydrate of hydrogen is more stable
than the hydrate without gas enclathration. The hydrogen has efficient stabilizing effect on the
hydrate structure and leads to the increase of dissociation temperatures up to 6 K. Except this
temperature shift, the phase behaviour of H2O + TBPBH4 + H2 systems in this concentration
region remains the same as it was in the absence of gas.
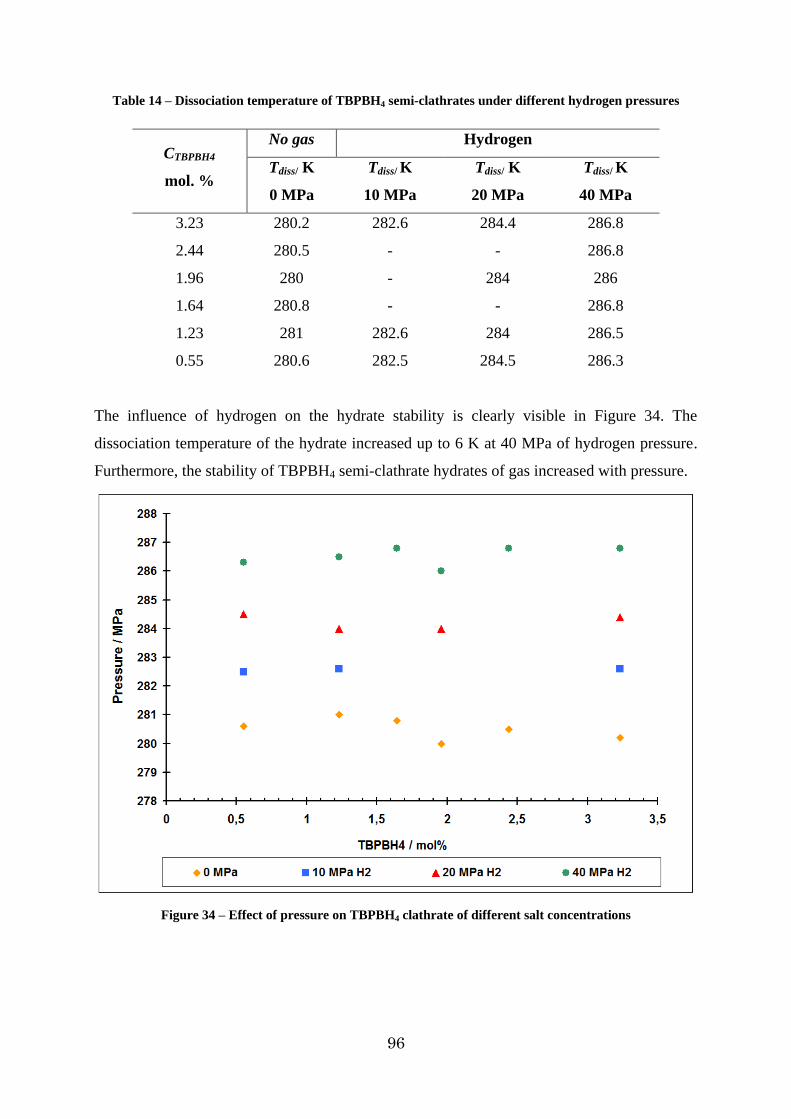
96
Table 14 – Dissociation temperature of TBPBH4 semi-clathrates under different hydrogen pressures
CTBPBH4
mol. %
No gas Hydrogen
Tdiss/ K
0 MPa
Tdiss/ K
10 MPa
Tdiss/ K
20 MPa
Tdiss/ K
40 MPa
3.23 280.2 282.6 284.4 286.8
2.44 280.5 - - 286.8
1.96 280 - 284 286
1.64 280.8 - - 286.8
1.23 281 282.6 284 286.5
0.55 280.6 282.5 284.5 286.3
The influence of hydrogen on the hydrate stability is clearly visible in Figure 34. The
dissociation temperature of the hydrate increased up to 6 K at 40 MPa of hydrogen pressure.
Furthermore, the stability of TBPBH4 semi-clathrate hydrates of gas increased with pressure.
Figure 34 – Effect of pressure on TBPBH4 clathrate of different salt concentrations
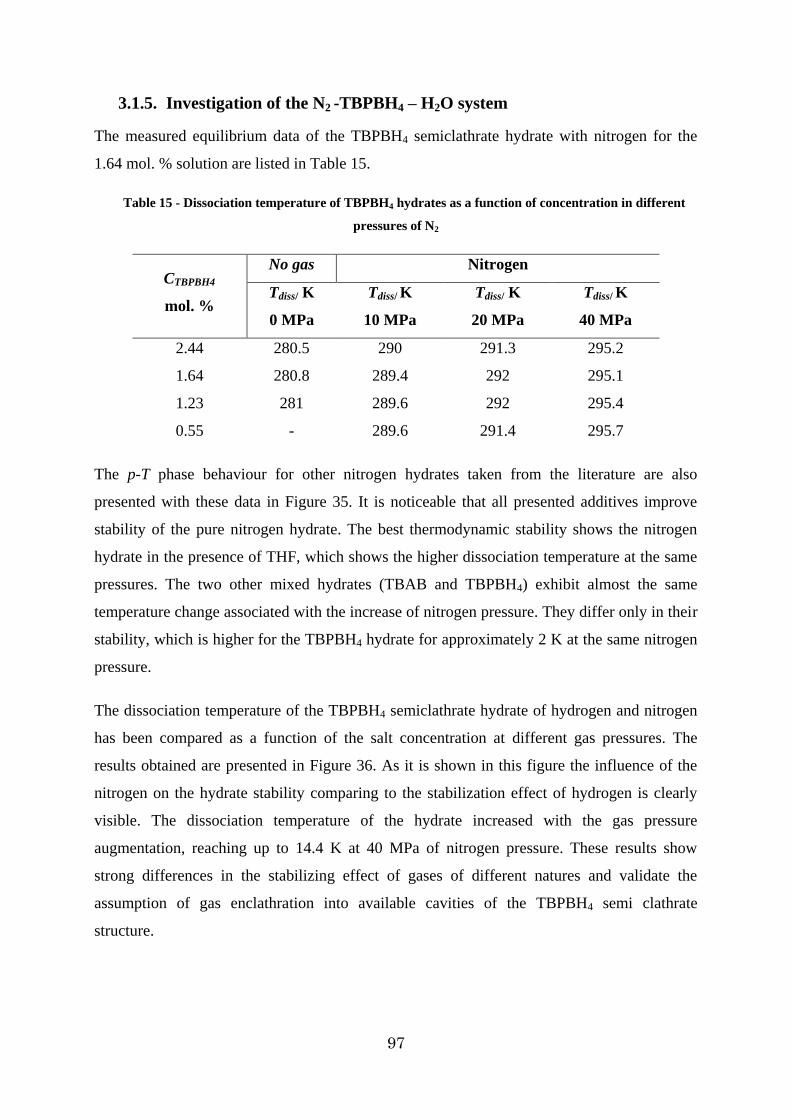
97
3.1.5. Investigation of the N2 -TBPBH4 – H2O system
The measured equilibrium data of the TBPBH4 semiclathrate hydrate with nitrogen for the
1.64 mol. % solution are listed in Table 15.
Table 15 - Dissociation temperature of TBPBH4 hydrates as a function of concentration in different
pressures of N2
CTBPBH4
mol. %
No gas Nitrogen
Tdiss/ K
0 MPa
Tdiss/ K
10 MPa
Tdiss/ K
20 MPa
Tdiss/ K
40 MPa
2.44 280.5 290 291.3 295.2
1.64 280.8 289.4 292 295.1
1.23 281 289.6 292 295.4
0.55 - 289.6 291.4 295.7
The p-T phase behaviour for other nitrogen hydrates taken from the literature are also
presented with these data in Figure 35. It is noticeable that all presented additives improve
stability of the pure nitrogen hydrate. The best thermodynamic stability shows the nitrogen
hydrate in the presence of THF, which shows the higher dissociation temperature at the same
pressures. The two other mixed hydrates (TBAB and TBPBH4) exhibit almost the same
temperature change associated with the increase of nitrogen pressure. They differ only in their
stability, which is higher for the TBPBH4 hydrate for approximately 2 K at the same nitrogen
pressure.
The dissociation temperature of the TBPBH4 semiclathrate hydrate of hydrogen and nitrogen
has been compared as a function of the salt concentration at different gas pressures. The
results obtained are presented in Figure 36. As it is shown in this figure the influence of the
nitrogen on the hydrate stability comparing to the stabilization effect of hydrogen is clearly
visible. The dissociation temperature of the hydrate increased with the gas pressure
augmentation, reaching up to 14.4 K at 40 MPa of nitrogen pressure. These results show
strong differences in the stabilizing effect of gases of different natures and validate the
assumption of gas enclathration into available cavities of the TBPBH4 semi clathrate
structure.
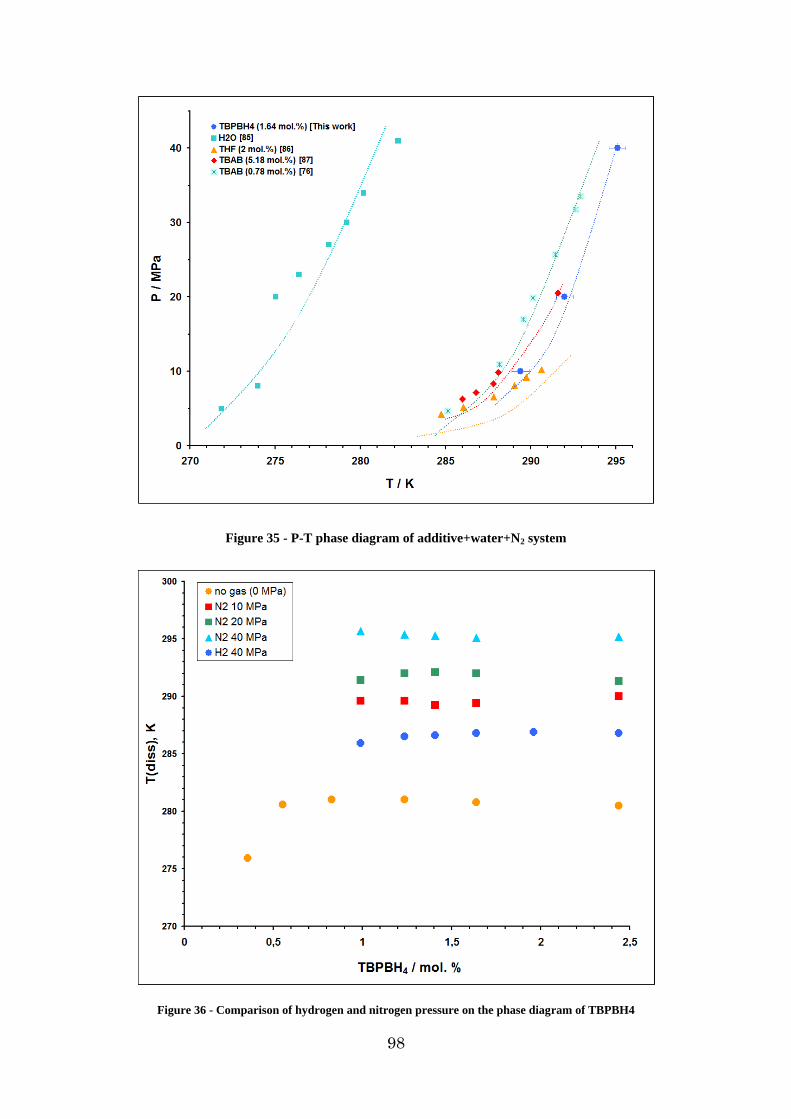
98
Figure 35 - P-T phase diagram of additive+water+N2 system
Figure 36 - Comparison of hydrogen and nitrogen pressure on the phase diagram of TBPBH4
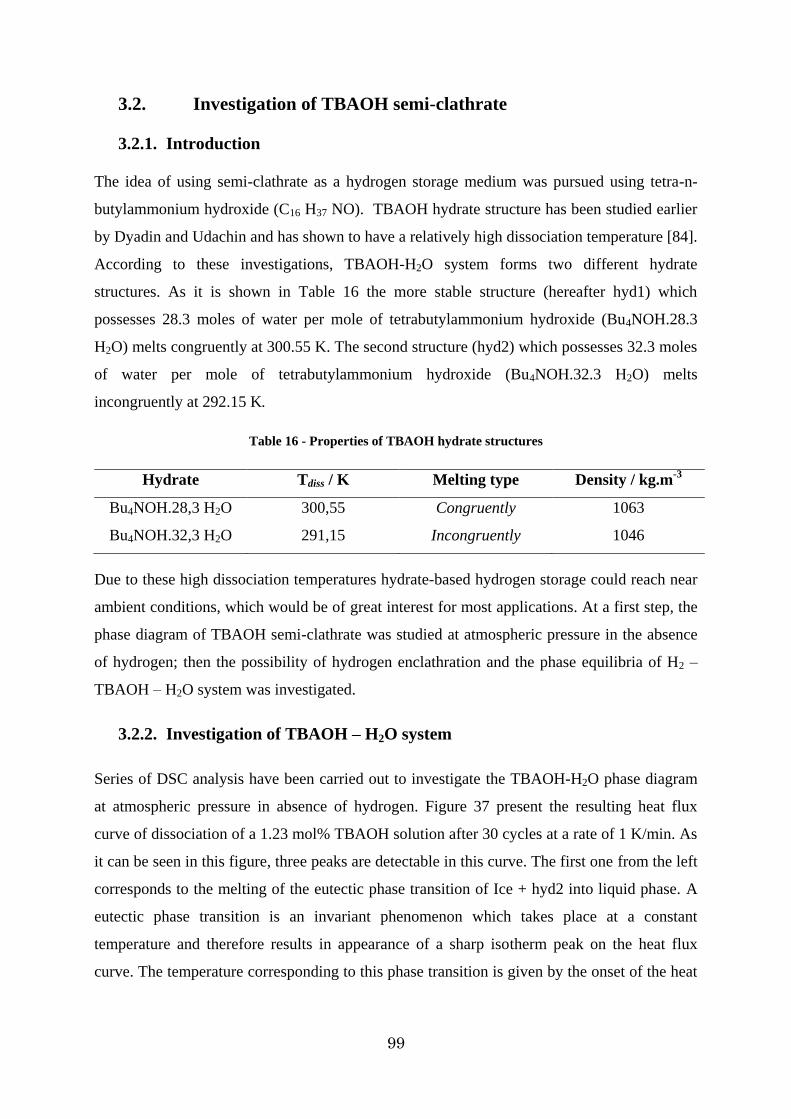
99
3.2. Investigation of TBAOH semi-clathrate
3.2.1. Introduction
The idea of using semi-clathrate as a hydrogen storage medium was pursued using tetra-n-
butylammonium hydroxide (C16 H37 NO). TBAOH hydrate structure has been studied earlier
by Dyadin and Udachin and has shown to have a relatively high dissociation temperature [84].
According to these investigations, TBAOH-H2O system forms two different hydrate
structures. As it is shown in Table 16 the more stable structure (hereafter hyd1) which
possesses 28.3 moles of water per mole of tetrabutylammonium hydroxide (Bu4NOH.28.3
H2O) melts congruently at 300.55 K. The second structure (hyd2) which possesses 32.3 moles
of water per mole of tetrabutylammonium hydroxide (Bu4NOH.32.3 H2O) melts
incongruently at 292.15 K.
Table 16 - Properties of TBAOH hydrate structures
Hydrate Tdiss / K Melting type Density / kg.m-3
Bu4NOH.28,3 H2O 300,55 Congruently 1063
Bu4NOH.32,3 H2O 291,15 Incongruently 1046
Due to these high dissociation temperatures hydrate-based hydrogen storage could reach near
ambient conditions, which would be of great interest for most applications. At a first step, the
phase diagram of TBAOH semi-clathrate was studied at atmospheric pressure in the absence
of hydrogen; then the possibility of hydrogen enclathration and the phase equilibria of H2 –
TBAOH – H2O system was investigated.
3.2.2. Investigation of TBAOH – H2O system
Series of DSC analysis have been carried out to investigate the TBAOH-H2O phase diagram
at atmospheric pressure in absence of hydrogen. Figure 37 present the resulting heat flux
curve of dissociation of a 1.23 mol% TBAOH solution after 30 cycles at a rate of 1 K/min. As
it can be seen in this figure, three peaks are detectable in this curve. The first one from the left
corresponds to the melting of the eutectic phase transition of Ice + hyd2 into liquid phase. A
eutectic phase transition is an invariant phenomenon which takes place at a constant
temperature and therefore results in appearance of a sharp isotherm peak on the heat flux
curve. The temperature corresponding to this phase transition is given by the onset of the heat
100
flux peak, around 272 K. The small peak at 288 K also shows an isotherm phase transition
which is attributed to peritectic dissociation of hyd2 phase into a mixture of hyd1 and liquid.
Eventually, the last peak in this curve (right) presents the progressive dissociation of hyd1
hydrate structure. The non-isotherm nature of the phase transition of this hydrate structure is
due to the presence of a liquid with a composition different from hyd1 in equilibrium with
hydrate. The method applied for calculating the dissociation temperature of this kind of phase
transition is the Gesellschaft für Thermische Analyse (GEFTA) [71] which was described
earlier in 3.1.
The isotherm nature of the two first peaks implies that their corresponding phase transition
temperature is independent of the salt (TBAOH) concentration. This fact can be seen in
Figure 38, where the peak evolution for four TBAOH solutions is shown. It can be seen that
the peak corresponding to the peritecitc dissociation remains at constant temperature in this
range of concentrations and the progressive dissociation peak of hyd1 shifts to the higher
temperatures by an increase in concentration of salt where at 3.23 mol% (around the
congruent concentration) only one sharp peak appears.
Figure 37 - DSC heat flux curve of dissociation of 1.23 mol% solution of TBAOH
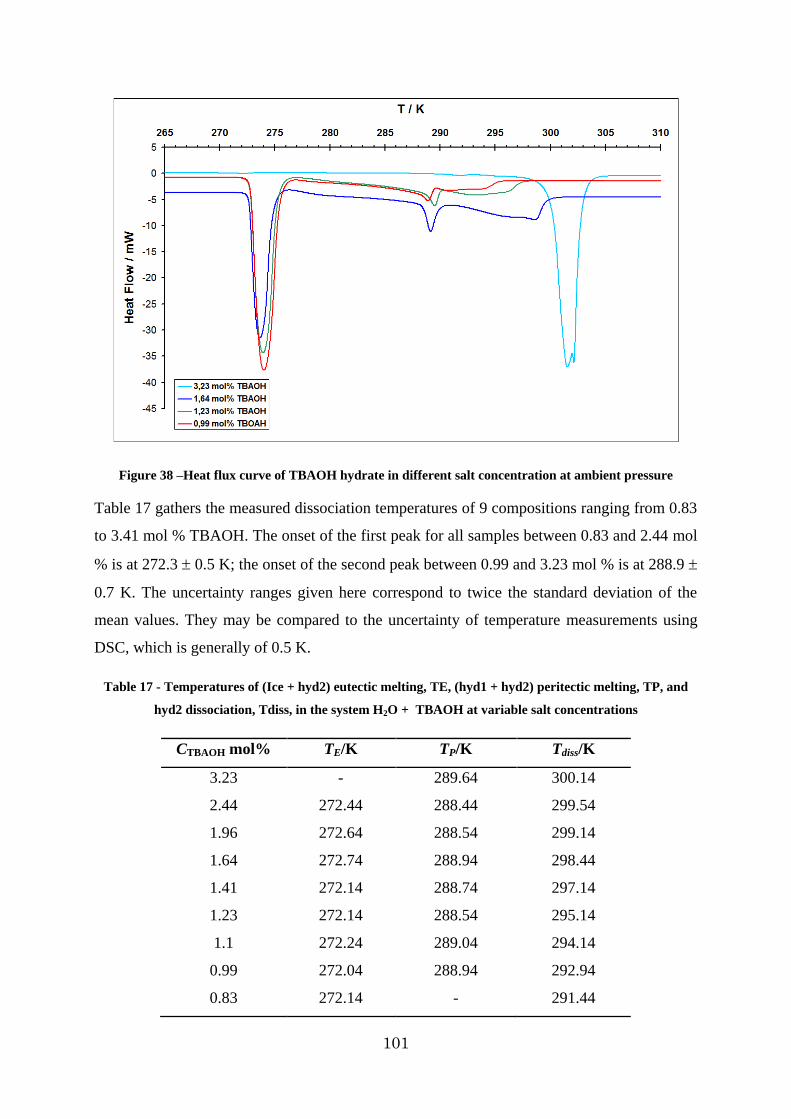
101
Figure 38 –Heat flux curve of TBAOH hydrate in different salt concentration at ambient pressure
Table 17 gathers the measured dissociation temperatures of 9 compositions ranging from 0.83
to 3.41 mol % TBAOH. The onset of the first peak for all samples between 0.83 and 2.44 mol
% is at 272.3 0.5 K; the onset of the second peak between 0.99 and 3.23 mol % is at 288.9
0.7 K. The uncertainty ranges given here correspond to twice the standard deviation of the
mean values. They may be compared to the uncertainty of temperature measurements using
DSC, which is generally of 0.5 K.
Table 17 - Temperatures of (Ice + hyd2) eutectic melting, TE, (hyd1 + hyd2) peritectic melting, TP, and
hyd2 dissociation, Tdiss, in the system H2O + TBAOH at variable salt concentrations
CTBAOH mol% TE/K TP/K Tdiss/K
3.23 - 289.64 300.14
2.44 272.44 288.44 299.54
1.96 272.64 288.54 299.14
1.64 272.74 288.94 298.44
1.41 272.14 288.74 297.14
1.23 272.14 288.54 295.14
1.1 272.24 289.04 294.14
0.99 272.04 288.94 292.94
0.83 272.14 - 291.44
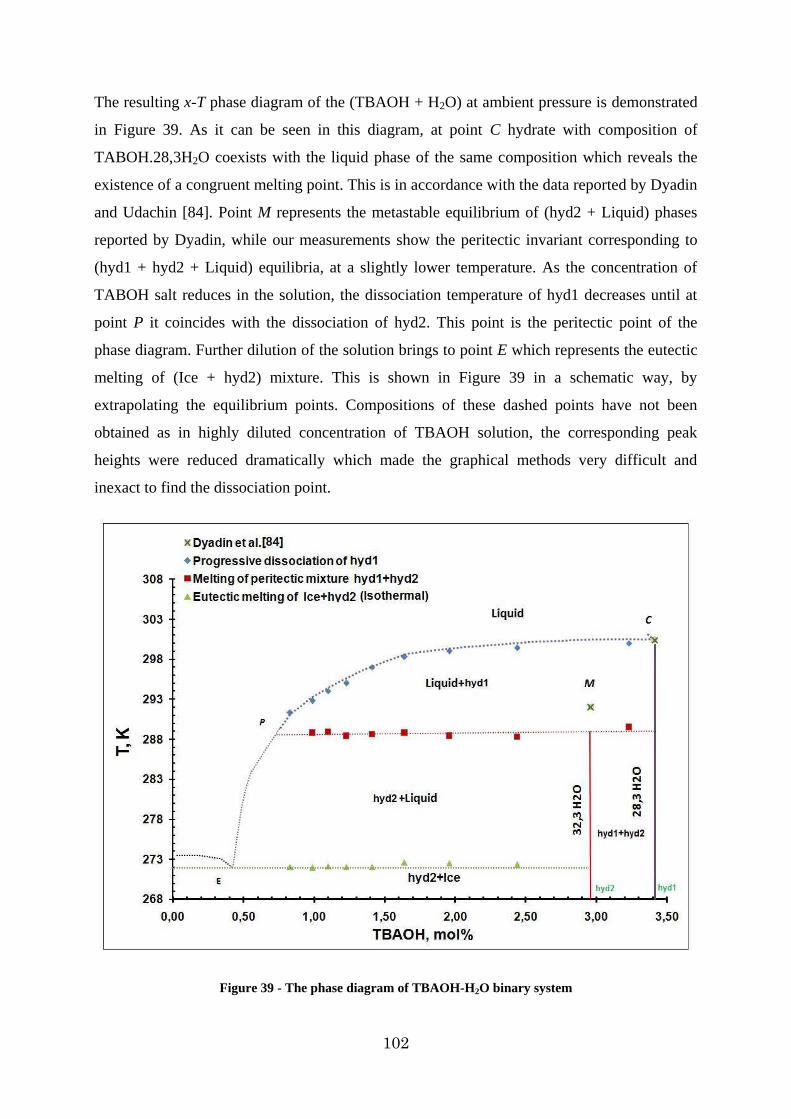
102
The resulting x-T phase diagram of the (TBAOH + H2O) at ambient pressure is demonstrated
in Figure 39. As it can be seen in this diagram, at point C hydrate with composition of
TABOH.28,3H2O coexists with the liquid phase of the same composition which reveals the
existence of a congruent melting point. This is in accordance with the data reported by Dyadin
and Udachin [84]. Point M represents the metastable equilibrium of (hyd2 + Liquid) phases
reported by Dyadin, while our measurements show the peritectic invariant corresponding to
(hyd1 + hyd2 + Liquid) equilibria, at a slightly lower temperature. As the concentration of
TABOH salt reduces in the solution, the dissociation temperature of hyd1 decreases until at
point P it coincides with the dissociation of hyd2. This point is the peritectic point of the
phase diagram. Further dilution of the solution brings to point E which represents the eutectic
melting of (Ice + hyd2) mixture. This is shown in Figure 39 in a schematic way, by
extrapolating the equilibrium points. Compositions of these dashed points have not been
obtained as in highly diluted concentration of TBAOH solution, the corresponding peak
heights were reduced dramatically which made the graphical methods very difficult and
inexact to find the dissociation point.
Figure 39 - The phase diagram of TBAOH-H2O binary system
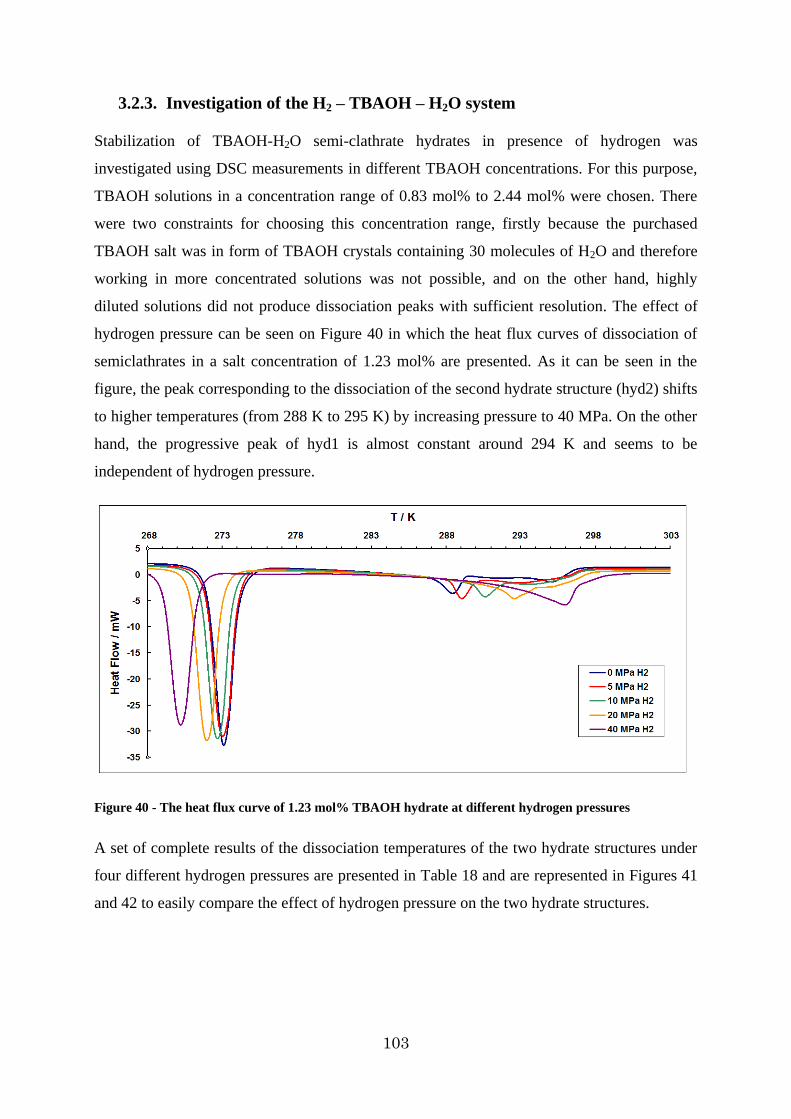
103
3.2.3. Investigation of the H2 – TBAOH – H2O system
Stabilization of TBAOH-H2O semi-clathrate hydrates in presence of hydrogen was
investigated using DSC measurements in different TBAOH concentrations. For this purpose,
TBAOH solutions in a concentration range of 0.83 mol% to 2.44 mol% were chosen. There
were two constraints for choosing this concentration range, firstly because the purchased
TBAOH salt was in form of TBAOH crystals containing 30 molecules of H2O and therefore
working in more concentrated solutions was not possible, and on the other hand, highly
diluted solutions did not produce dissociation peaks with sufficient resolution. The effect of
hydrogen pressure can be seen on Figure 40 in which the heat flux curves of dissociation of
semiclathrates in a salt concentration of 1.23 mol% are presented. As it can be seen in the
figure, the peak corresponding to the dissociation of the second hydrate structure (hyd2) shifts
to higher temperatures (from 288 K to 295 K) by increasing pressure to 40 MPa. On the other
hand, the progressive peak of hyd1 is almost constant around 294 K and seems to be
independent of hydrogen pressure.
Figure 40 - The heat flux curve of 1.23 mol% TBAOH hydrate at different hydrogen pressures
A set of complete results of the dissociation temperatures of the two hydrate structures under
four different hydrogen pressures are presented in Table 18 and are represented in Figures 41
and 42 to easily compare the effect of hydrogen pressure on the two hydrate structures.
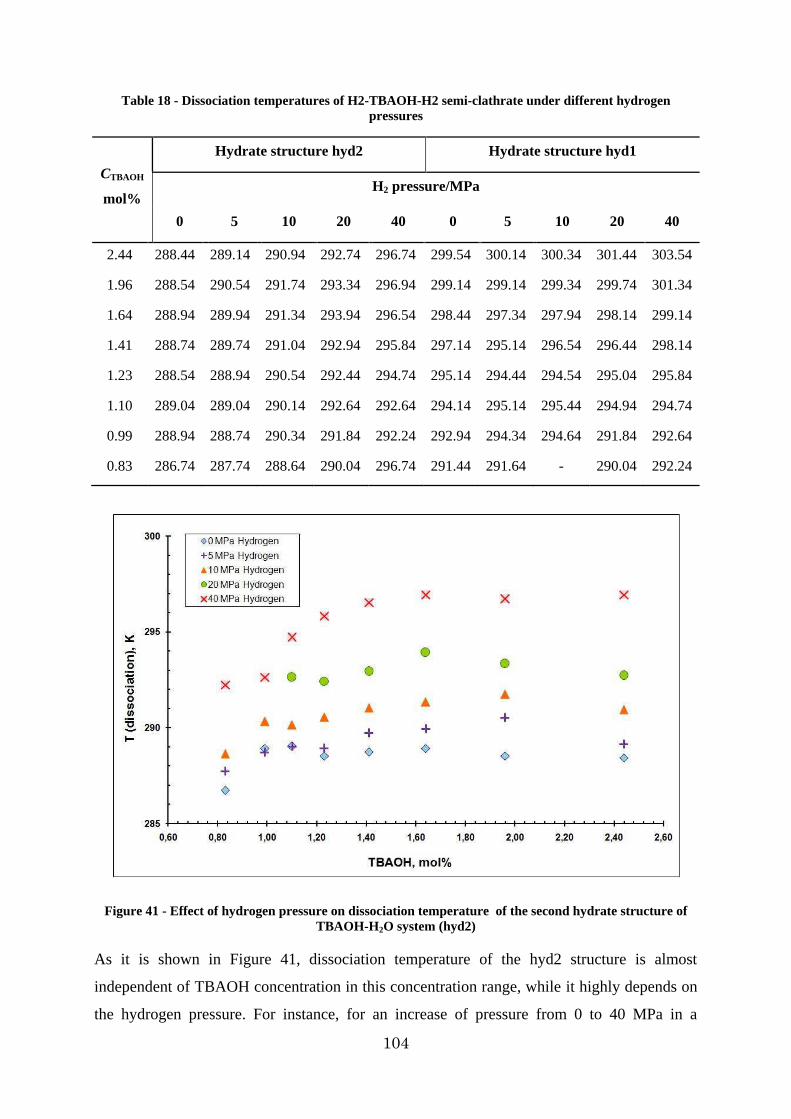
104
Table 18 - Dissociation temperatures of H2-TBAOH-H2 semi-clathrate under different hydrogen pressures
CTBAOH
mol%
Hydrate structure hyd2 Hydrate structure hyd1
H2 pressure/MPa
0 5 10 20 40 0 5 10 20 40
2.44 288.44 289.14 290.94 292.74 296.74 299.54 300.14 300.34 301.44 303.54
1.96 288.54 290.54 291.74 293.34 296.94 299.14 299.14 299.34 299.74 301.34
1.64 288.94 289.94 291.34 293.94 296.54 298.44 297.34 297.94 298.14 299.14
1.41 288.74 289.74 291.04 292.94 295.84 297.14 295.14 296.54 296.44 298.14
1.23 288.54 288.94 290.54 292.44 294.74 295.14 294.44 294.54 295.04 295.84
1.10 289.04 289.04 290.14 292.64 292.64 294.14 295.14 295.44 294.94 294.74
0.99 288.94 288.74 290.34 291.84 292.24 292.94 294.34 294.64 291.84 292.64
0.83 286.74 287.74 288.64 290.04 296.74 291.44 291.64 - 290.04 292.24
Figure 41 - Effect of hydrogen pressure on dissociation temperature of the second hydrate structure of TBAOH-H 2O system (hyd2)
As it is shown in Figure 41, dissociation temperature of the hyd2 structure is almost
independent of TBAOH concentration in this concentration range, while it highly depends on
the hydrogen pressure. For instance, for an increase of pressure from 0 to 40 MPa in a
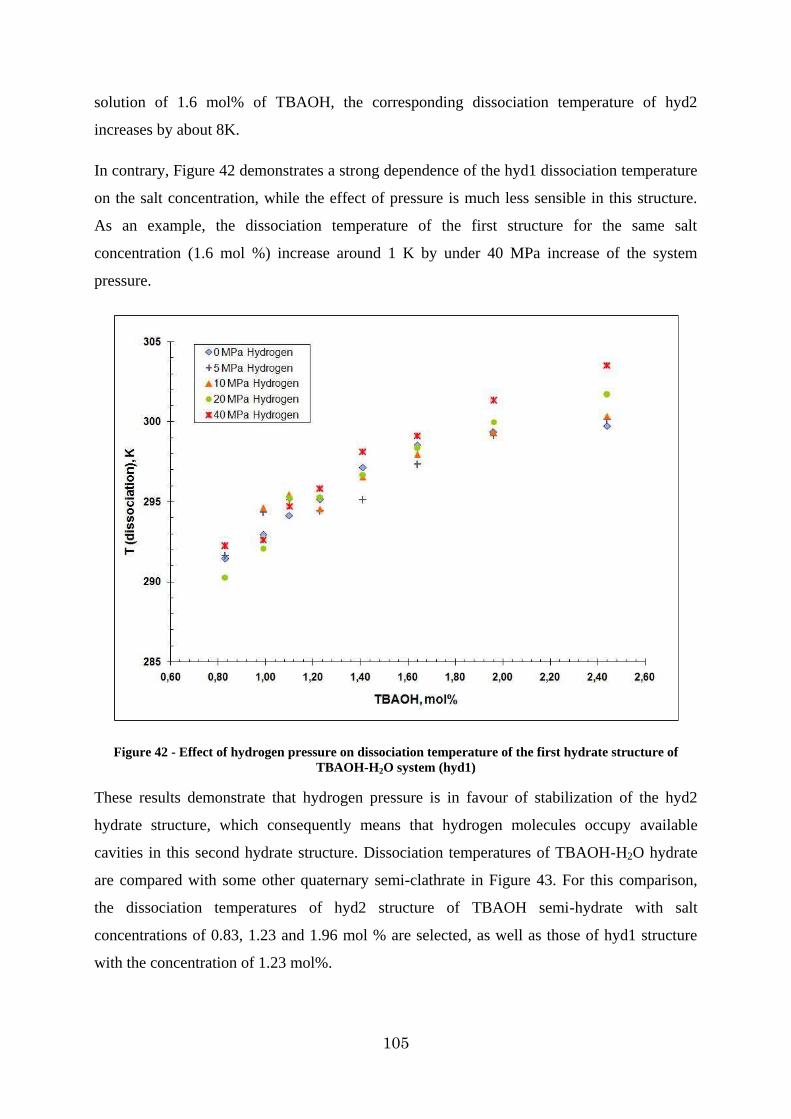
105
solution of 1.6 mol% of TBAOH, the corresponding dissociation temperature of hyd2
increases by about 8K.
In contrary, Figure 42 demonstrates a strong dependence of the hyd1 dissociation temperature
on the salt concentration, while the effect of pressure is much less sensible in this structure.
As an example, the dissociation temperature of the first structure for the same salt
concentration (1.6 mol %) increase around 1 K by under 40 MPa increase of the system
pressure.
Figure 42 - Effect of hydrogen pressure on dissociation temperature of the first hydrate structure of TBAOH-H 2O system (hyd1)
These results demonstrate that hydrogen pressure is in favour of stabilization of the hyd2
hydrate structure, which consequently means that hydrogen molecules occupy available
cavities in this second hydrate structure. Dissociation temperatures of TBAOH-H2O hydrate
are compared with some other quaternary semi-clathrate in Figure 43. For this comparison,
the dissociation temperatures of hyd2 structure of TBAOH semi-hydrate with salt
concentrations of 0.83, 1.23 and 1.96 mol % are selected, as well as those of hyd1 structure
with the concentration of 1.23 mol%.
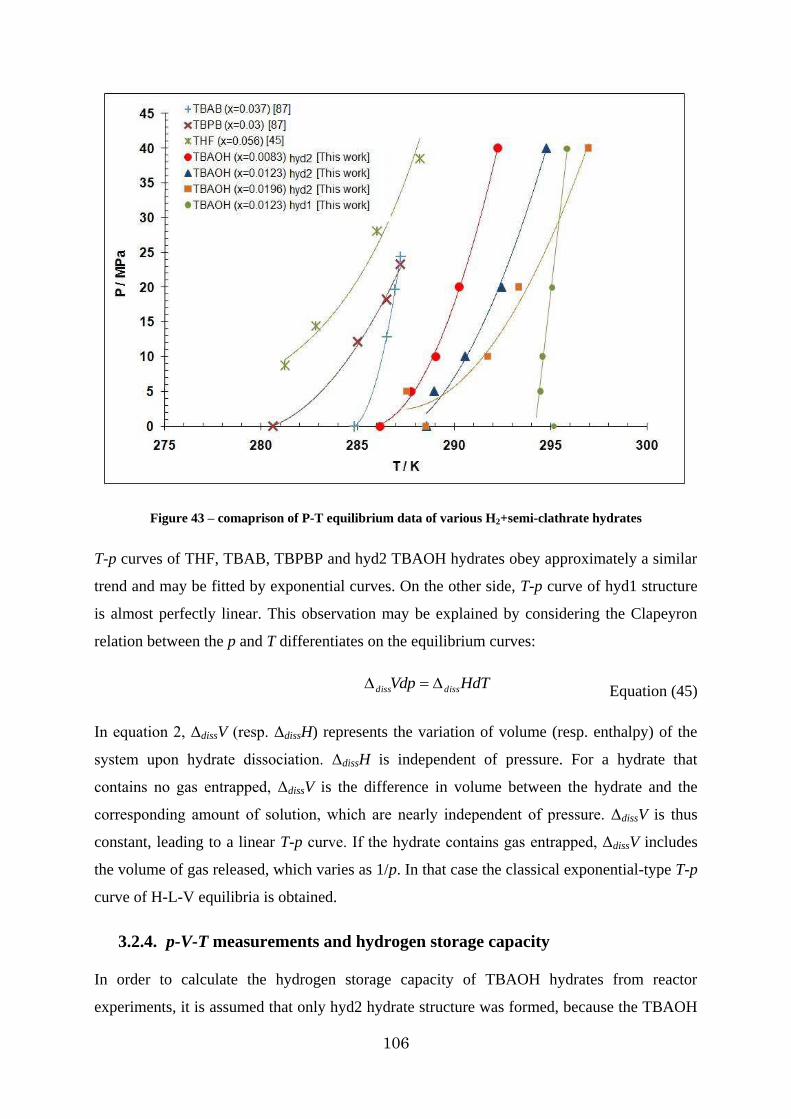
106
Figure 43 – comaprison of P-T equilibrium data of various H2+semi-clathrate hydrates
T-p curves of THF, TBAB, TBPBP and hyd2 TBAOH hydrates obey approximately a similar
trend and may be fitted by exponential curves. On the other side, T-p curve of hyd1 structure
is almost perfectly linear. This observation may be explained by considering the Clapeyron
relation between the p and T differentiates on the equilibrium curves:
HdTVdp dissdiss Equation (45)
In equation 2, ΔdissV (resp. ΔdissH) represents the variation of volume (resp. enthalpy) of the
system upon hydrate dissociation. ΔdissH is independent of pressure. For a hydrate that
contains no gas entrapped, ΔdissV is the difference in volume between the hydrate and the
corresponding amount of solution, which are nearly independent of pressure. ΔdissV is thus
constant, leading to a linear T-p curve. If the hydrate contains gas entrapped, ΔdissV includes
the volume of gas released, which varies as 1/p. In that case the classical exponential-type T-p
curve of H-L-V equilibria is obtained.
3.2.4. p-V-T measurements and hydrogen storage capacity
In order to calculate the hydrogen storage capacity of TBAOH hydrates from reactor
experiments, it is assumed that only hyd2 hydrate structure was formed, because the TBAOH
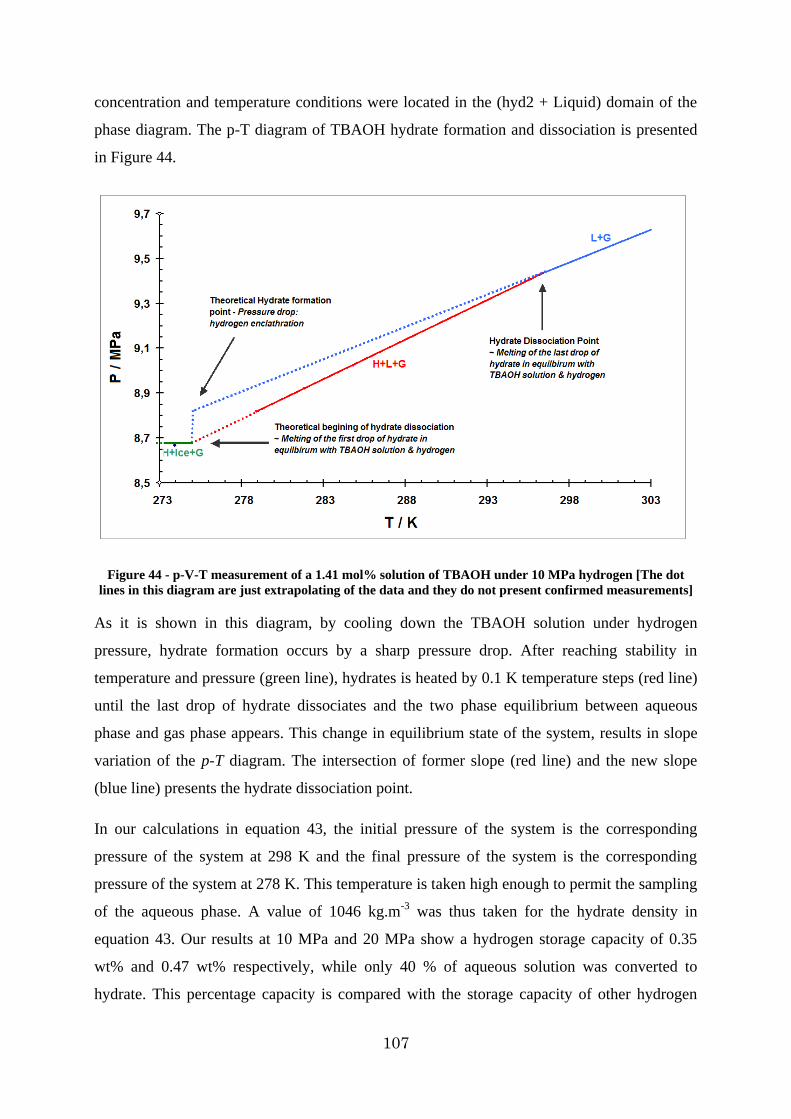
107
concentration and temperature conditions were located in the (hyd2 + Liquid) domain of the
phase diagram. The p-T diagram of TBAOH hydrate formation and dissociation is presented
in Figure 44.
Figure 44 - p-V-T measurement of a 1.41 mol% solution of TBAOH under 10 MPa hydrogen [The dot lines in this diagram are just extrapolating of the data and they do not present confirmed measurements]
As it is shown in this diagram, by cooling down the TBAOH solution under hydrogen
pressure, hydrate formation occurs by a sharp pressure drop. After reaching stability in
temperature and pressure (green line), hydrates is heated by 0.1 K temperature steps (red line)
until the last drop of hydrate dissociates and the two phase equilibrium between aqueous
phase and gas phase appears. This change in equilibrium state of the system, results in slope
variation of the p-T diagram. The intersection of former slope (red line) and the new slope
(blue line) presents the hydrate dissociation point.
In our calculations in equation 43, the initial pressure of the system is the corresponding
pressure of the system at 298 K and the final pressure of the system is the corresponding
pressure of the system at 278 K. This temperature is taken high enough to permit the sampling
of the aqueous phase. A value of 1046 kg.m-3 was thus taken for the hydrate density in
equation 43. Our results at 10 MPa and 20 MPa show a hydrogen storage capacity of 0.35
wt% and 0.47 wt% respectively, while only 40 % of aqueous solution was converted to
hydrate. This percentage capacity is compared with the storage capacity of other hydrogen
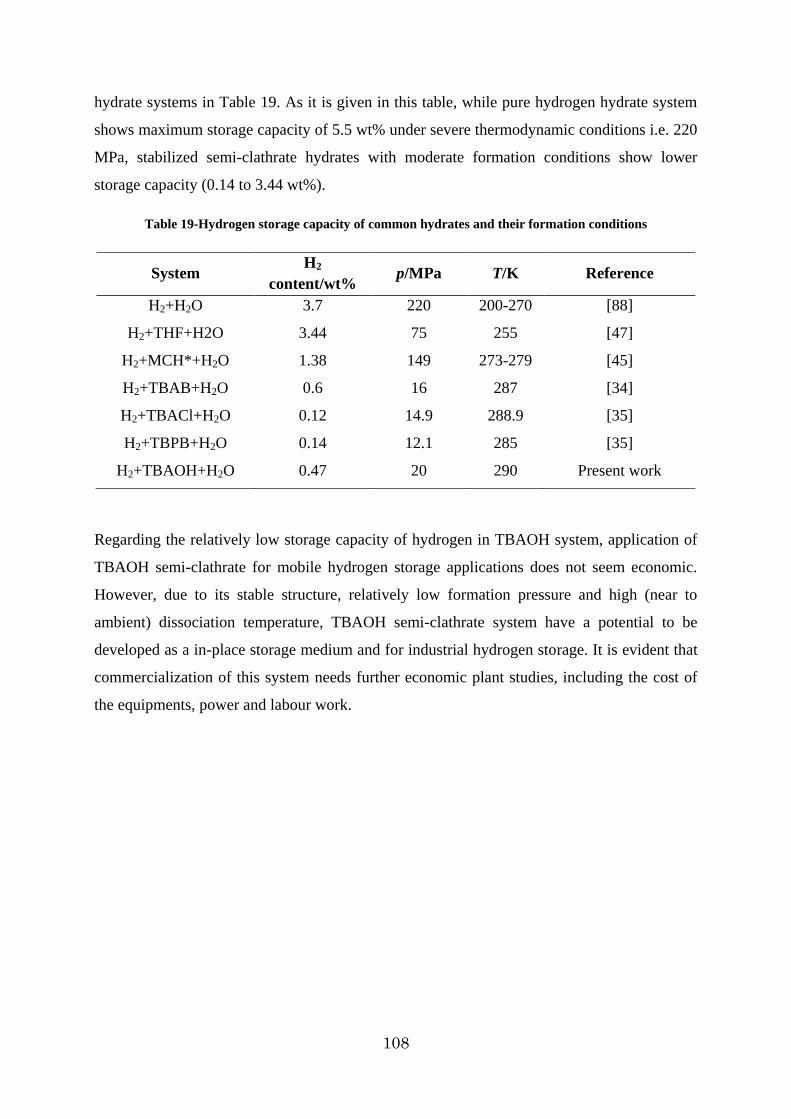
108
hydrate systems in Table 19. As it is given in this table, while pure hydrogen hydrate system
shows maximum storage capacity of 5.5 wt% under severe thermodynamic conditions i.e. 220
MPa, stabilized semi-clathrate hydrates with moderate formation conditions show lower
storage capacity (0.14 to 3.44 wt%).
Table 19-Hydrogen storage capacity of common hydrates and their formation conditions
System H2
content/wt% p/MPa T/K Reference
H2+H2O 3.7 220 200-270 [88]
H2+THF+H2O 3.44 75 255 [47]
H2+MCH*+H2O 1.38 149 273-279 [45]
H2+TBAB+H2O 0.6 16 287 [34]
H2+TBACl+H2O 0.12 14.9 288.9 [35]
H2+TBPB+H2O 0.14 12.1 285 [35]
H2+TBAOH+H2O 0.47 20 290 Present work
Regarding the relatively low storage capacity of hydrogen in TBAOH system, application of
TBAOH semi-clathrate for mobile hydrogen storage applications does not seem economic.
However, due to its stable structure, relatively low formation pressure and high (near to
ambient) dissociation temperature, TBAOH semi-clathrate system have a potential to be
developed as a in-place storage medium and for industrial hydrogen storage. It is evident that
commercialization of this system needs further economic plant studies, including the cost of
the equipments, power and labour work.
109
CChhaapptteerr ffoouurr::
RReessuull ttss && DDiissccuussssiioonnss ((22))
-- ccllaatthhrr aattee hhyyddrr aatteess iinn pprreesseennccee ooff ggaass mmiixxttuurree --
This chapter presents hydrogen hydrates phase equilibria in presence of gas mixtures, without any
soluble organic salt in the aqueous phase. These gas mixtures are selected with two different
approaches:
(1) The first system that comprises a gas mixture of propane – hydrogen is chosen to investigate
the effect of small concentrations (partial pressure) of propane on the stability of hydrogen sII
hydrate (Tuning Phenomenon)
(2) The second system is chosen in order to investigate the efficiency of hydrate clathrate as a
separation medium in a gas mixture of CO2-H2. The phase equilibrium of the system has been
studied and the gas phase molar composition has been analyzed.

110
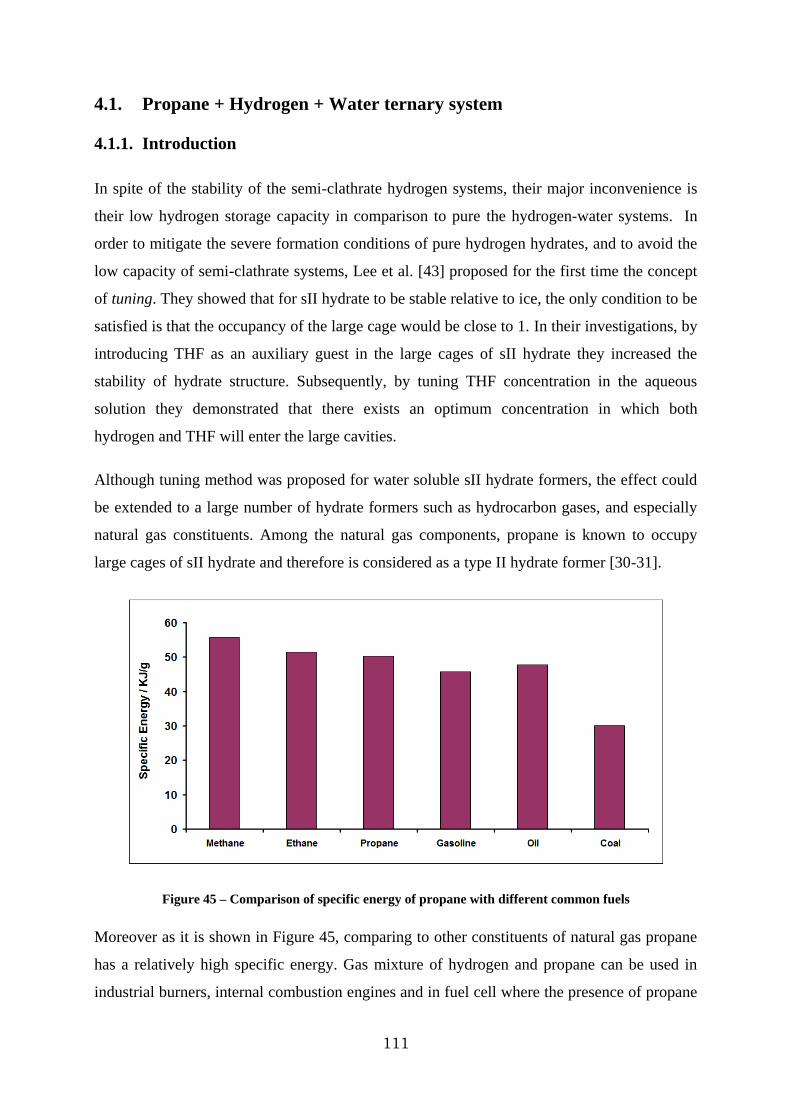
111
4.1. Propane + Hydrogen + Water ternary system
4.1.1. Introduction
In spite of the stability of the semi-clathrate hydrogen systems, their major inconvenience is
their low hydrogen storage capacity in comparison to pure the hydrogen-water systems. In
order to mitigate the severe formation conditions of pure hydrogen hydrates, and to avoid the
low capacity of semi-clathrate systems, Lee et al. [43] proposed for the first time the concept
of tuning. They showed that for sII hydrate to be stable relative to ice, the only condition to be
satisfied is that the occupancy of the large cage would be close to 1. In their investigations, by
introducing THF as an auxiliary guest in the large cages of sII hydrate they increased the
stability of hydrate structure. Subsequently, by tuning THF concentration in the aqueous
solution they demonstrated that there exists an optimum concentration in which both
hydrogen and THF will enter the large cavities.
Although tuning method was proposed for water soluble sII hydrate formers, the effect could
be extended to a large number of hydrate formers such as hydrocarbon gases, and especially
natural gas constituents. Among the natural gas components, propane is known to occupy
large cages of sII hydrate and therefore is considered as a type II hydrate former [30-31].
Figure 45 – Comparison of specific energy of propane with different common fuels
Moreover as it is shown in Figure 45, comparing to other constituents of natural gas propane
has a relatively high specific energy. Gas mixture of hydrogen and propane can be used in
industrial burners, internal combustion engines and in fuel cell where the presence of propane
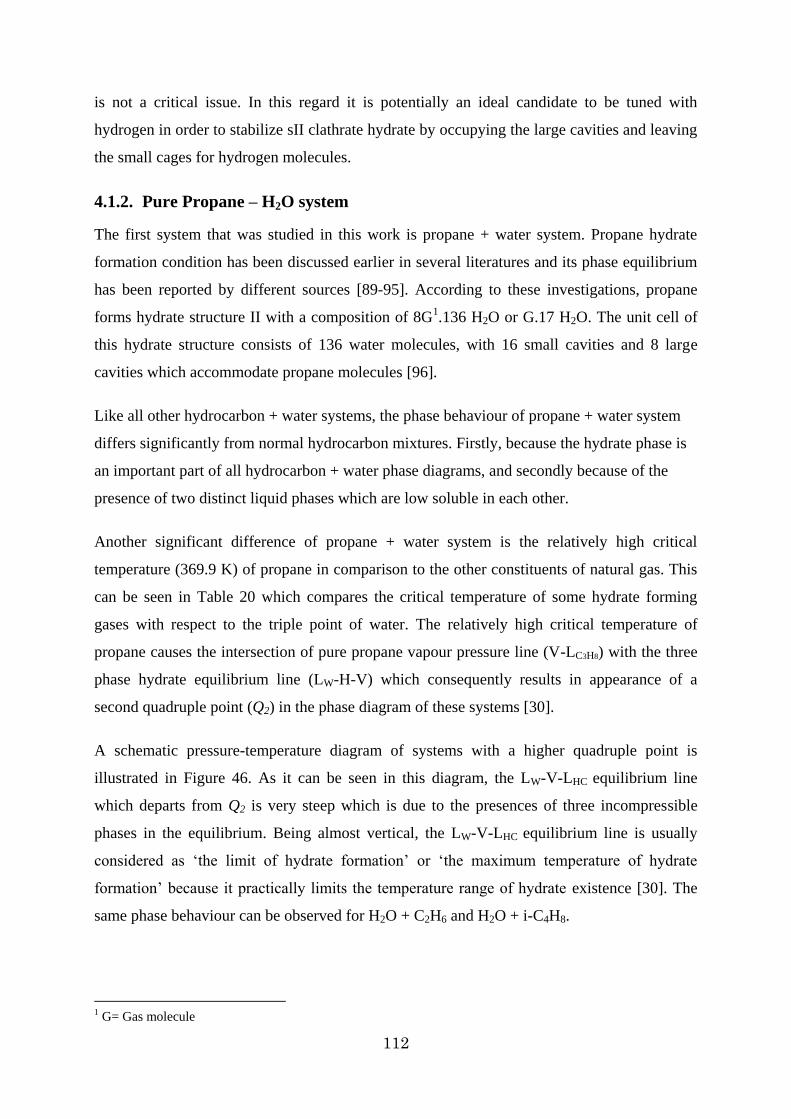
112
is not a critical issue. In this regard it is potentially an ideal candidate to be tuned with
hydrogen in order to stabilize sII clathrate hydrate by occupying the large cavities and leaving
the small cages for hydrogen molecules.
4.1.2. Pure Propane – H2O system
The first system that was studied in this work is propane + water system. Propane hydrate
formation condition has been discussed earlier in several literatures and its phase equilibrium
has been reported by different sources [89-95]. According to these investigations, propane
forms hydrate structure II with a composition of 8G1.136 H2O or G.17 H2O. The unit cell of
this hydrate structure consists of 136 water molecules, with 16 small cavities and 8 large
cavities which accommodate propane molecules [96].
Like all other hydrocarbon + water systems, the phase behaviour of propane + water system
differs significantly from normal hydrocarbon mixtures. Firstly, because the hydrate phase is
an important part of all hydrocarbon + water phase diagrams, and secondly because of the
presence of two distinct liquid phases which are low soluble in each other.
Another significant difference of propane + water system is the relatively high critical
temperature (369.9 K) of propane in comparison to the other constituents of natural gas. This
can be seen in Table 20 which compares the critical temperature of some hydrate forming
gases with respect to the triple point of water. The relatively high critical temperature of
propane causes the intersection of pure propane vapour pressure line (V-LC3H8) with the three
phase hydrate equilibrium line (LW-H-V) which consequently results in appearance of a
second quadruple point (Q2) in the phase diagram of these systems [30].
A schematic pressure-temperature diagram of systems with a higher quadruple point is
illustrated in Figure 46. As it can be seen in this diagram, the LW-V-LHC equilibrium line
which departs from Q2 is very steep which is due to the presences of three incompressible
phases in the equilibrium. Being almost vertical, the LW-V-LHC equilibrium line is usually
considered as „the limit of hydrate formation‟ or „the maximum temperature of hydrate
formation‟ because it practically limits the temperature range of hydrate existence [30]. The
same phase behaviour can be observed for H2O + C2H6 and H2O + i-C4H8.
1 G= Gas molecule
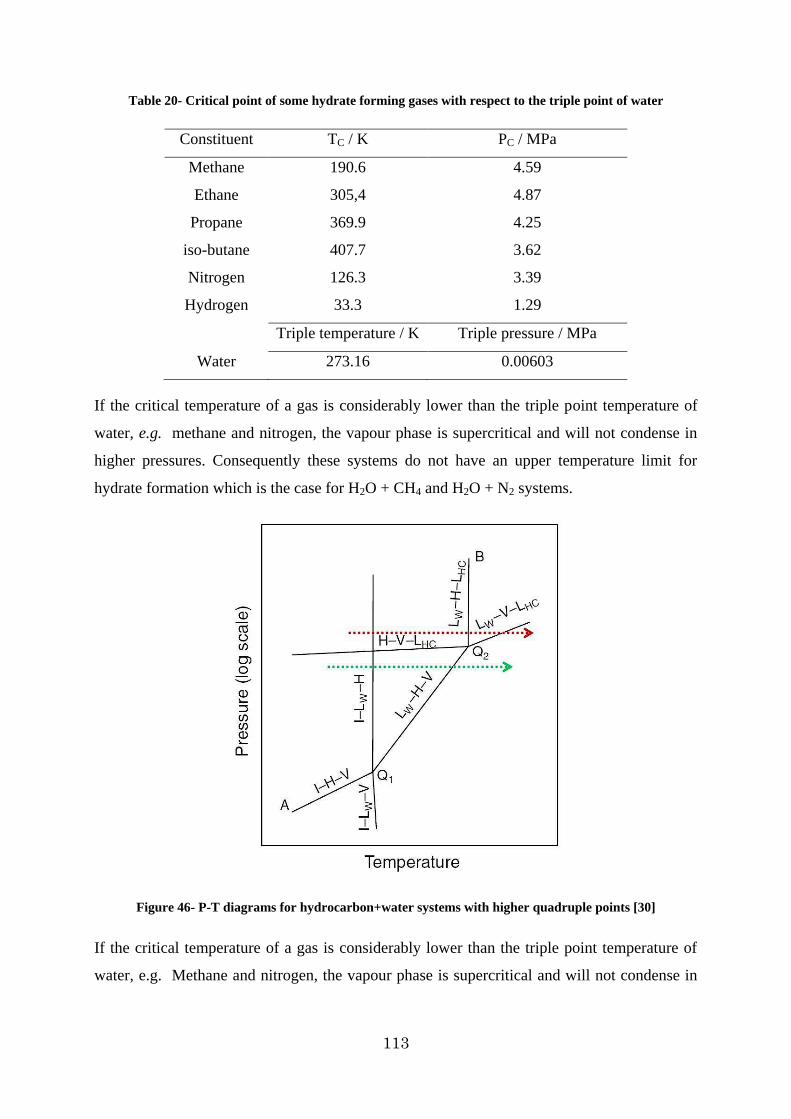
113
Table 20- Critical point of some hydrate forming gases with respect to the triple point of water
Constituent TC / K PC / MPa
Methane 190.6 4.59
Ethane 305,4 4.87
Propane 369.9 4.25
iso-butane 407.7 3.62
Nitrogen 126.3 3.39
Hydrogen 33.3 1.29
Triple temperature / K Triple pressure / MPa
Water 273.16 0.00603
If the critical temperature of a gas is considerably lower than the triple point temperature of
water, e.g. methane and nitrogen, the vapour phase is supercritical and will not condense in
higher pressures. Consequently these systems do not have an upper temperature limit for
hydrate formation which is the case for H2O + CH4 and H2O + N2 systems.
Figure 46- P-T diagrams for hydrocarbon+water systems with higher quadruple points [30]
If the critical temperature of a gas is considerably lower than the triple point temperature of
water, e.g. Methane and nitrogen, the vapour phase is supercritical and will not condense in
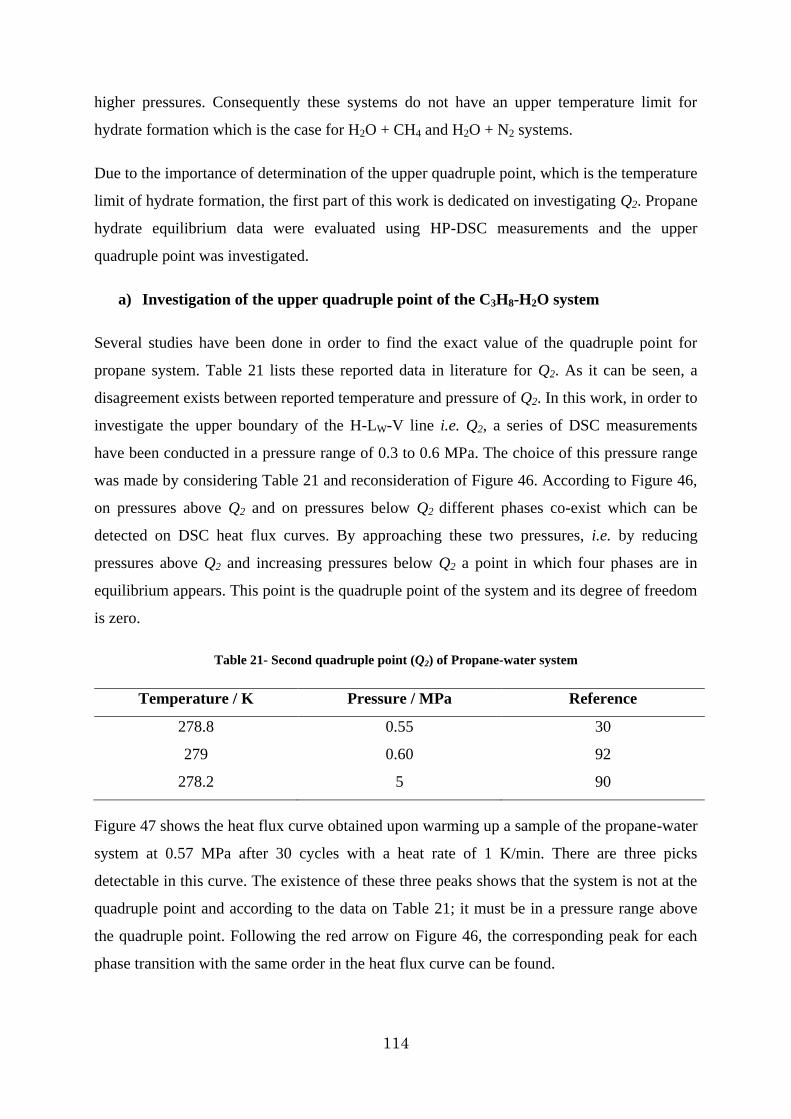
114
higher pressures. Consequently these systems do not have an upper temperature limit for
hydrate formation which is the case for H2O + CH4 and H2O + N2 systems.
Due to the importance of determination of the upper quadruple point, which is the temperature
limit of hydrate formation, the first part of this work is dedicated on investigating Q2. Propane
hydrate equilibrium data were evaluated using HP-DSC measurements and the upper
quadruple point was investigated.
a) Investigation of the upper quadruple point of the C3H8-H2O system
Several studies have been done in order to find the exact value of the quadruple point for
propane system. Table 21 lists these reported data in literature for Q2. As it can be seen, a
disagreement exists between reported temperature and pressure of Q2. In this work, in order to
investigate the upper boundary of the H-LW-V line i.e. Q2, a series of DSC measurements
have been conducted in a pressure range of 0.3 to 0.6 MPa. The choice of this pressure range
was made by considering Table 21 and reconsideration of Figure 46. According to Figure 46,
on pressures above Q2 and on pressures below Q2 different phases co-exist which can be
detected on DSC heat flux curves. By approaching these two pressures, i.e. by reducing
pressures above Q2 and increasing pressures below Q2 a point in which four phases are in
equilibrium appears. This point is the quadruple point of the system and its degree of freedom
is zero.
Table 21- Second quadruple point (Q2) of Propane-water system
Temperature / K Pressure / MPa Reference
278.8 0.55 30
279 0.60 92
278.2 5 90
Figure 47 shows the heat flux curve obtained upon warming up a sample of the propane-water
system at 0.57 MPa after 30 cycles with a heat rate of 1 K/min. There are three picks
detectable in this curve. The existence of these three peaks shows that the system is not at the
quadruple point and according to the data on Table 21; it must be in a pressure range above
the quadruple point. Following the red arrow on Figure 46, the corresponding peak for each
phase transition with the same order in the heat flux curve can be found.
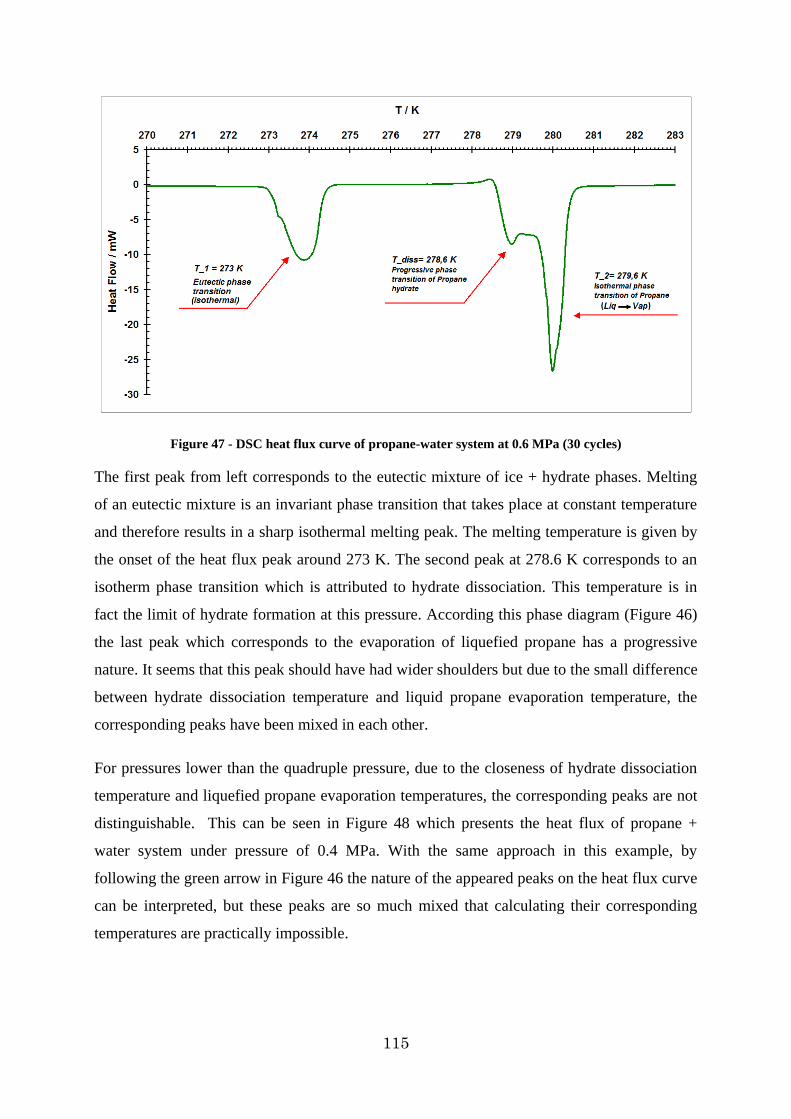
115
Figure 47 - DSC heat flux curve of propane-water system at 0.6 MPa (30 cycles)
The first peak from left corresponds to the eutectic mixture of ice + hydrate phases. Melting
of an eutectic mixture is an invariant phase transition that takes place at constant temperature
and therefore results in a sharp isothermal melting peak. The melting temperature is given by
the onset of the heat flux peak around 273 K. The second peak at 278.6 K corresponds to an
isotherm phase transition which is attributed to hydrate dissociation. This temperature is in
fact the limit of hydrate formation at this pressure. According this phase diagram (Figure 46)
the last peak which corresponds to the evaporation of liquefied propane has a progressive
nature. It seems that this peak should have had wider shoulders but due to the small difference
between hydrate dissociation temperature and liquid propane evaporation temperature, the
corresponding peaks have been mixed in each other.
For pressures lower than the quadruple pressure, due to the closeness of hydrate dissociation
temperature and liquefied propane evaporation temperatures, the corresponding peaks are not
distinguishable. This can be seen in Figure 48 which presents the heat flux of propane +
water system under pressure of 0.4 MPa. With the same approach in this example, by
following the green arrow in Figure 46 the nature of the appeared peaks on the heat flux curve
can be interpreted, but these peaks are so much mixed that calculating their corresponding
temperatures are practically impossible.
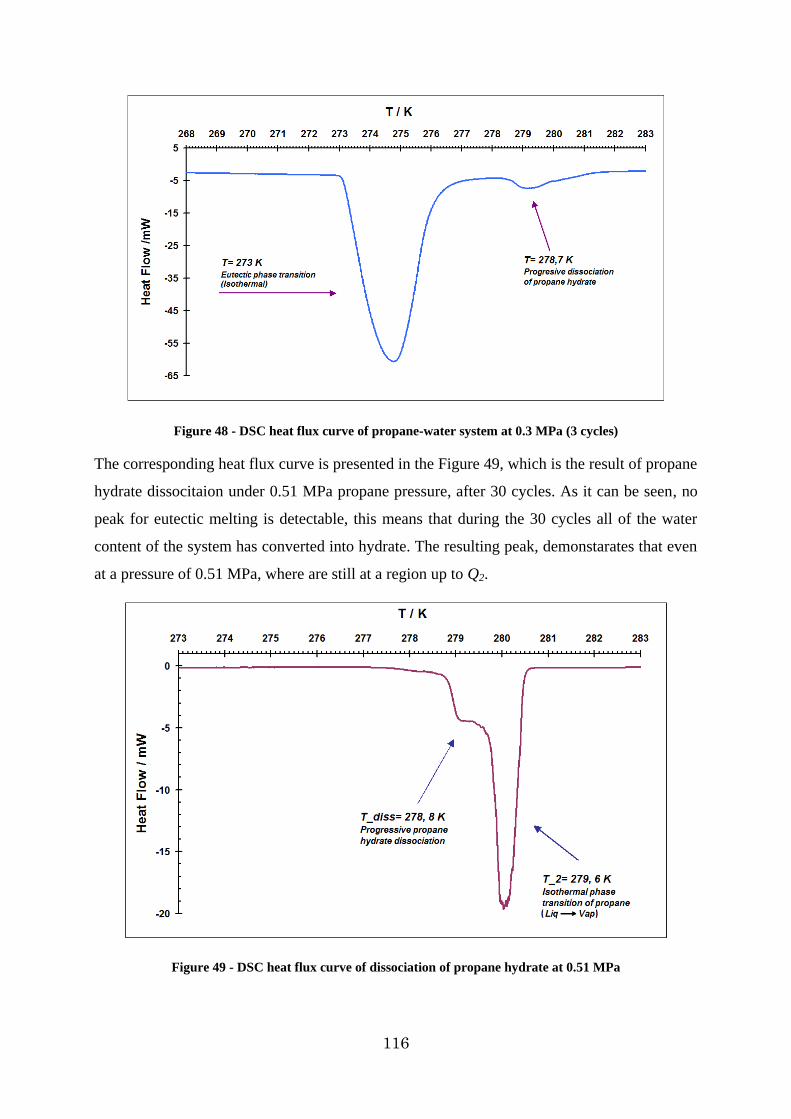
116
Figure 48 - DSC heat flux curve of propane-water system at 0.3 MPa (3 cycles)
The corresponding heat flux curve is presented in the Figure 49, which is the result of propane
hydrate dissocitaion under 0.51 MPa propane pressure, after 30 cycles. As it can be seen, no
peak for eutectic melting is detectable, this means that during the 30 cycles all of the water
content of the system has converted into hydrate. The resulting peak, demonstarates that even
at a pressure of 0.51 MPa, where are still at a region up to Q2.
Figure 49 - DSC heat flux curve of dissociation of propane hydrate at 0.51 MPa
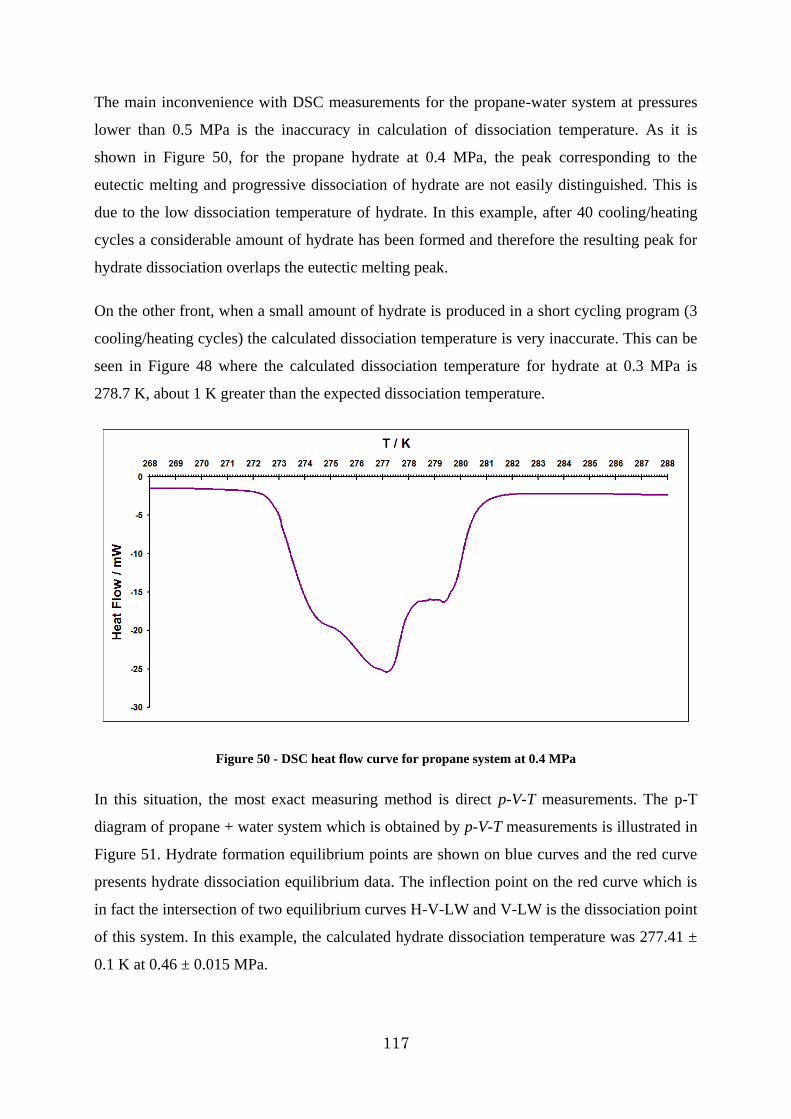
117
The main inconvenience with DSC measurements for the propane-water system at pressures
lower than 0.5 MPa is the inaccuracy in calculation of dissociation temperature. As it is
shown in Figure 50, for the propane hydrate at 0.4 MPa, the peak corresponding to the
eutectic melting and progressive dissociation of hydrate are not easily distinguished. This is
due to the low dissociation temperature of hydrate. In this example, after 40 cooling/heating
cycles a considerable amount of hydrate has been formed and therefore the resulting peak for
hydrate dissociation overlaps the eutectic melting peak.
On the other front, when a small amount of hydrate is produced in a short cycling program (3
cooling/heating cycles) the calculated dissociation temperature is very inaccurate. This can be
seen in Figure 48 where the calculated dissociation temperature for hydrate at 0.3 MPa is
278.7 K, about 1 K greater than the expected dissociation temperature.
Figure 50 - DSC heat flow curve for propane system at 0.4 MPa
In this situation, the most exact measuring method is direct p-V-T measurements. The p-T
diagram of propane + water system which is obtained by p-V-T measurements is illustrated in
Figure 51. Hydrate formation equilibrium points are shown on blue curves and the red curve
presents hydrate dissociation equilibrium data. The inflection point on the red curve which is
in fact the intersection of two equilibrium curves H-V-LW and V-LW is the dissociation point
of this system. In this example, the calculated hydrate dissociation temperature was 277.41 ±
0.1 K at 0.46 ± 0.015 MPa.
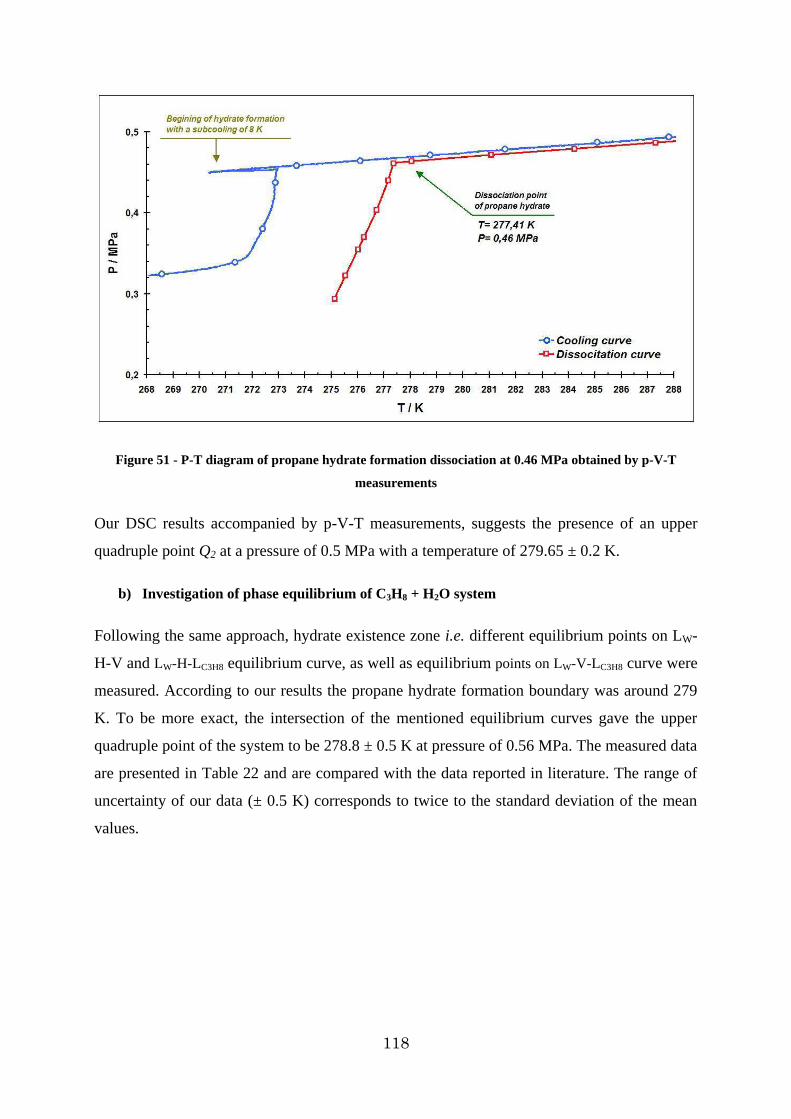
118
Figure 51 - P-T diagram of propane hydrate formation dissociation at 0.46 MPa obtained by p-V-T
measurements
Our DSC results accompanied by p-V-T measurements, suggests the presence of an upper
quadruple point Q2 at a pressure of 0.5 MPa with a temperature of 279.65 ± 0.2 K.
b) Investigation of phase equilibrium of C3H8 + H2O system
Following the same approach, hydrate existence zone i.e. different equilibrium points on LW-
H-V and LW-H-LC3H8 equilibrium curve, as well as equilibrium points on LW-V-LC3H8 curve were
measured. According to our results the propane hydrate formation boundary was around 279
K. To be more exact, the intersection of the mentioned equilibrium curves gave the upper
quadruple point of the system to be 278.8 ± 0.5 K at pressure of 0.56 MPa. The measured data
are presented in Table 22 and are compared with the data reported in literature. The range of
uncertainty of our data (± 0.5 K) corresponds to twice to the standard deviation of the mean
values.
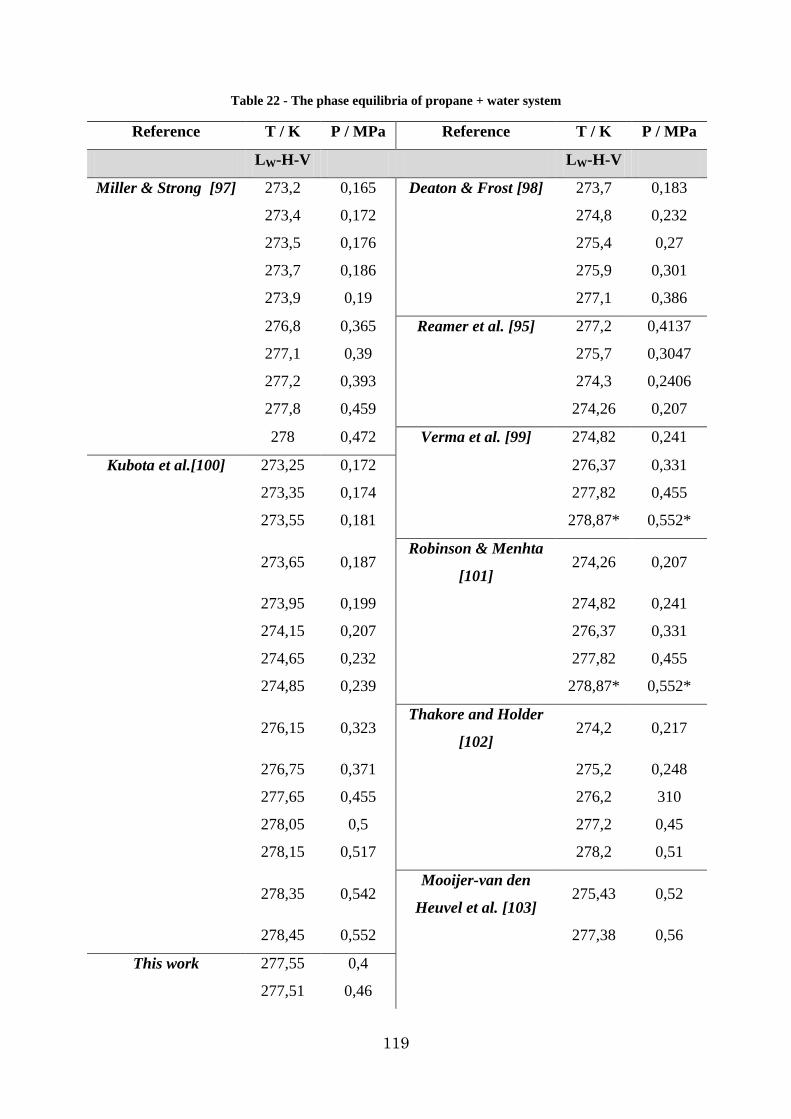
119
Table 22 - The phase equilibria of propane + water system
Reference T / K P / MPa Reference T / K P / MPa
LW-H-V LW-H-V
Miller & Strong [97] 273,2 0,165 Deaton & Frost [98] 273,7 0,183
273,4 0,172 274,8 0,232
273,5 0,176 275,4 0,27
273,7 0,186 275,9 0,301
273,9 0,19 277,1 0,386
276,8 0,365 Reamer et al. [95] 277,2 0,4137
277,1 0,39 275,7 0,3047
277,2 0,393 274,3 0,2406
277,8 0,459 274,26 0,207
278 0,472 Verma et al. [99] 274,82 0,241
Kubota et al.[100] 273,25 0,172 276,37 0,331
273,35 0,174 277,82 0,455
273,55 0,181 278,87* 0,552*
273,65 0,187 Robinson & Menhta
[101] 274,26 0,207
273,95 0,199 274,82 0,241
274,15 0,207 276,37 0,331
274,65 0,232 277,82 0,455
274,85 0,239 278,87* 0,552*
276,15 0,323 Thakore and Holder
[102] 274,2 0,217
276,75 0,371 275,2 0,248
277,65 0,455 276,2 310
278,05 0,5 277,2 0,45
278,15 0,517 278,2 0,51
278,35 0,542 Mooijer-van den
Heuvel et al. [103] 275,43 0,52
278,45 0,552 277,38 0,56
This work 277,55 0,4
277,51 0,46
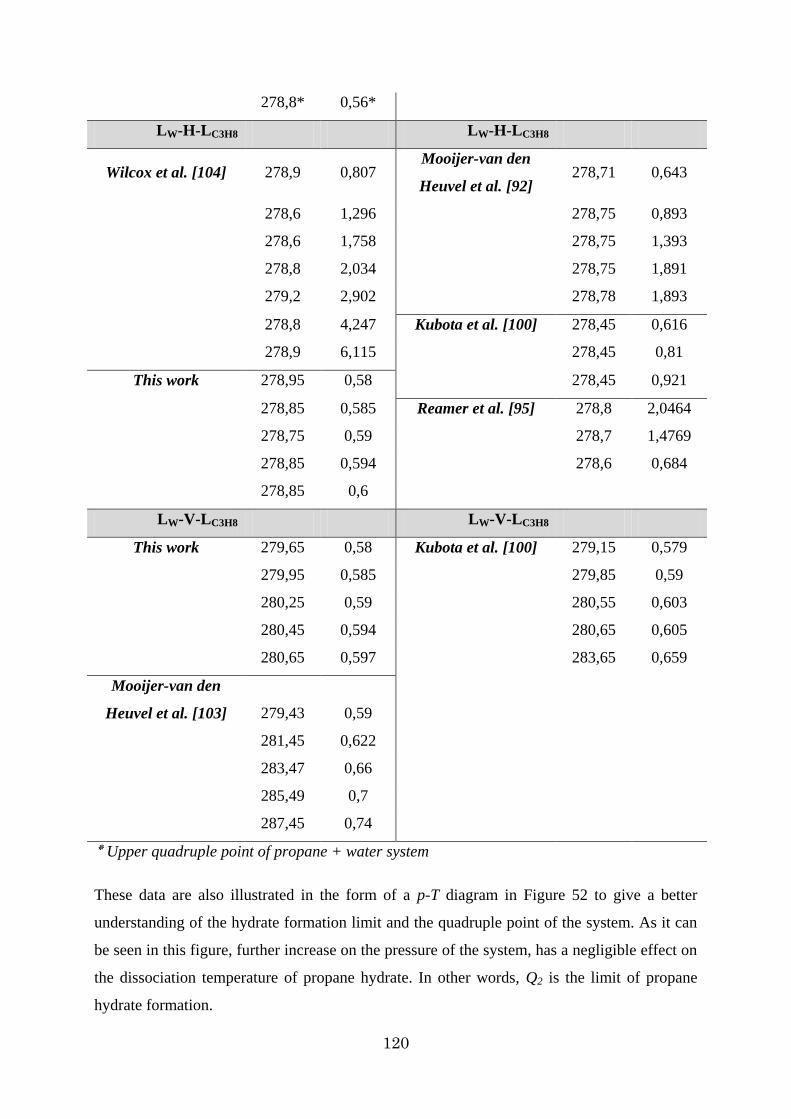
120
278,8* 0,56*
LW-H-L C3H8 LW-H-L C3H8
Wilcox et al. [104] 278,9 0,807 Mooijer-van den
Heuvel et al. [92] 278,71 0,643
278,6 1,296 278,75 0,893
278,6 1,758 278,75 1,393
278,8 2,034 278,75 1,891
279,2 2,902 278,78 1,893
278,8 4,247 Kubota et al. [100] 278,45 0,616
278,9 6,115 278,45 0,81
This work 278,95 0,58 278,45 0,921
278,85 0,585 Reamer et al. [95] 278,8 2,0464
278,75 0,59 278,7 1,4769
278,85 0,594 278,6 0,684
278,85 0,6
LW-V-L C3H8 LW-V-L C3H8
This work 279,65 0,58 Kubota et al. [100] 279,15 0,579
279,95 0,585 279,85 0,59
280,25 0,59 280,55 0,603
280,45 0,594 280,65 0,605
280,65 0,597 283,65 0,659
Mooijer-van den
Heuvel et al. [103] 279,43 0,59
281,45 0,622
283,47 0,66
285,49 0,7
287,45 0,74
Upper quadruple point of propane + water system ٭
These data are also illustrated in the form of a p-T diagram in Figure 52 to give a better
understanding of the hydrate formation limit and the quadruple point of the system. As it can
be seen in this figure, further increase on the pressure of the system, has a negligible effect on
the dissociation temperature of propane hydrate. In other words, Q2 is the limit of propane
hydrate formation.
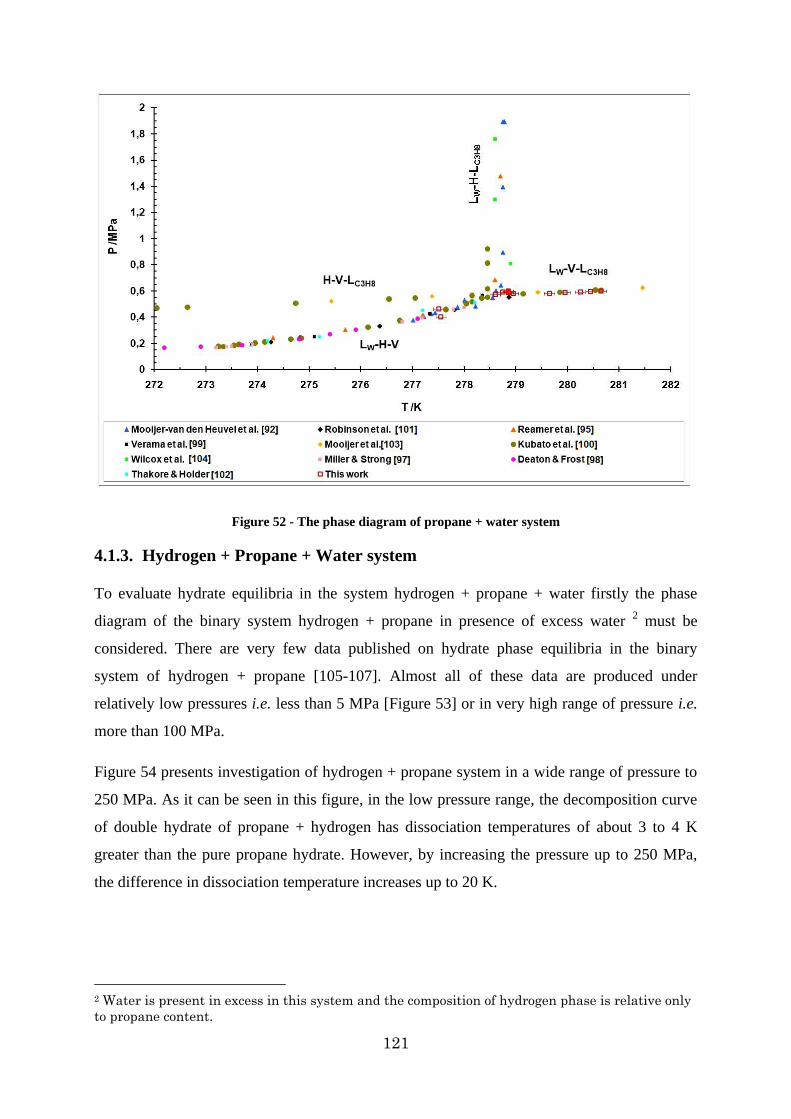
121
Figure 52 - The phase diagram of propane + water system
4.1.3. Hydrogen + Propane + Water system
To evaluate hydrate equilibria in the system hydrogen + propane + water firstly the phase
diagram of the binary system hydrogen + propane in presence of excess water 2 must be
considered. There are very few data published on hydrate phase equilibria in the binary
system of hydrogen + propane [105-107]. Almost all of these data are produced under
relatively low pressures i.e. less than 5 MPa [Figure 53] or in very high range of pressure i.e.
more than 100 MPa.
Figure 54 presents investigation of hydrogen + propane system in a wide range of pressure to
250 MPa. As it can be seen in this figure, in the low pressure range, the decomposition curve
of double hydrate of propane + hydrogen has dissociation temperatures of about 3 to 4 K
greater than the pure propane hydrate. However, by increasing the pressure up to 250 MPa,
the difference in dissociation temperature increases up to 20 K.
2 Water is present in excess in this system and the composition of hydrogen phase is relative only
to propane content.
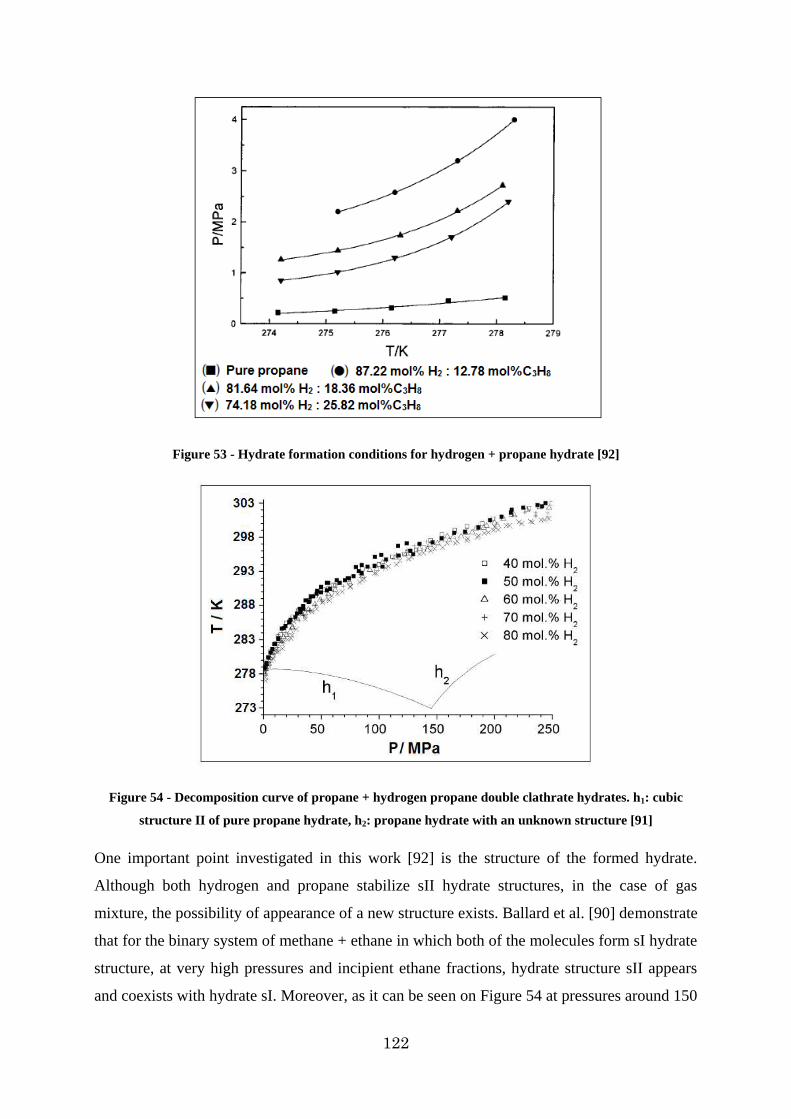
122
Figure 53 - Hydrate formation conditions for hydrogen + propane hydrate [92]
Figure 54 - Decomposition curve of propane + hydrogen propane double clathrate hydrates. h1: cubic
structure II of pure propane hydrate, h2: propane hydrate with an unknown structure [91]
One important point investigated in this work [92] is the structure of the formed hydrate.
Although both hydrogen and propane stabilize sII hydrate structures, in the case of gas
mixture, the possibility of appearance of a new structure exists. Ballard et al. [90] demonstrate
that for the binary system of methane + ethane in which both of the molecules form sI hydrate
structure, at very high pressures and incipient ethane fractions, hydrate structure sII appears
and coexists with hydrate sI. Moreover, as it can be seen on Figure 54 at pressures around 150
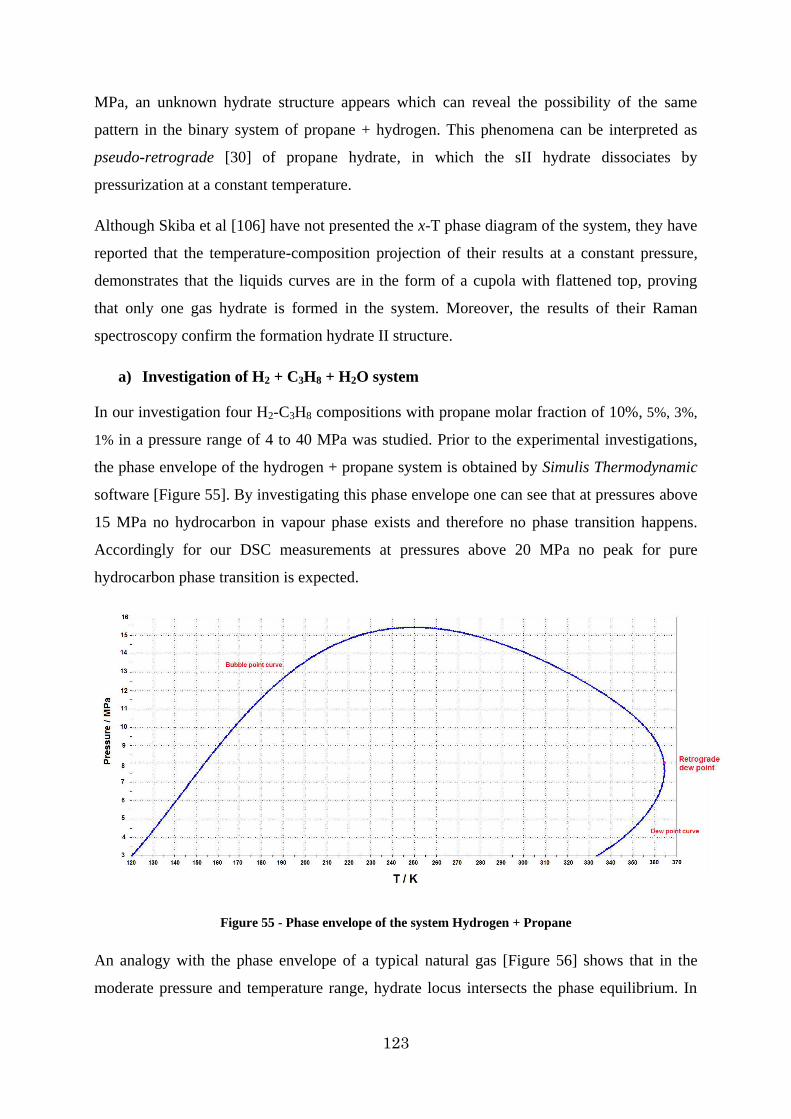
123
MPa, an unknown hydrate structure appears which can reveal the possibility of the same
pattern in the binary system of propane + hydrogen. This phenomena can be interpreted as
pseudo-retrograde [30] of propane hydrate, in which the sII hydrate dissociates by
pressurization at a constant temperature.
Although Skiba et al [106] have not presented the x-T phase diagram of the system, they have
reported that the temperature-composition projection of their results at a constant pressure,
demonstrates that the liquids curves are in the form of a cupola with flattened top, proving
that only one gas hydrate is formed in the system. Moreover, the results of their Raman
spectroscopy confirm the formation hydrate II structure.
a) Investigation of H2 + C3H8 + H2O system
In our investigation four H2-C3H8 compositions with propane molar fraction of 10%, 5%, 3%,
1% in a pressure range of 4 to 40 MPa was studied. Prior to the experimental investigations,
the phase envelope of the hydrogen + propane system is obtained by Simulis Thermodynamic
software [Figure 55]. By investigating this phase envelope one can see that at pressures above
15 MPa no hydrocarbon in vapour phase exists and therefore no phase transition happens.
Accordingly for our DSC measurements at pressures above 20 MPa no peak for pure
hydrocarbon phase transition is expected.
Figure 55 - Phase envelope of the system Hydrogen + Propane
An analogy with the phase envelope of a typical natural gas [Figure 56] shows that in the
moderate pressure and temperature range, hydrate locus intersects the phase equilibrium. In
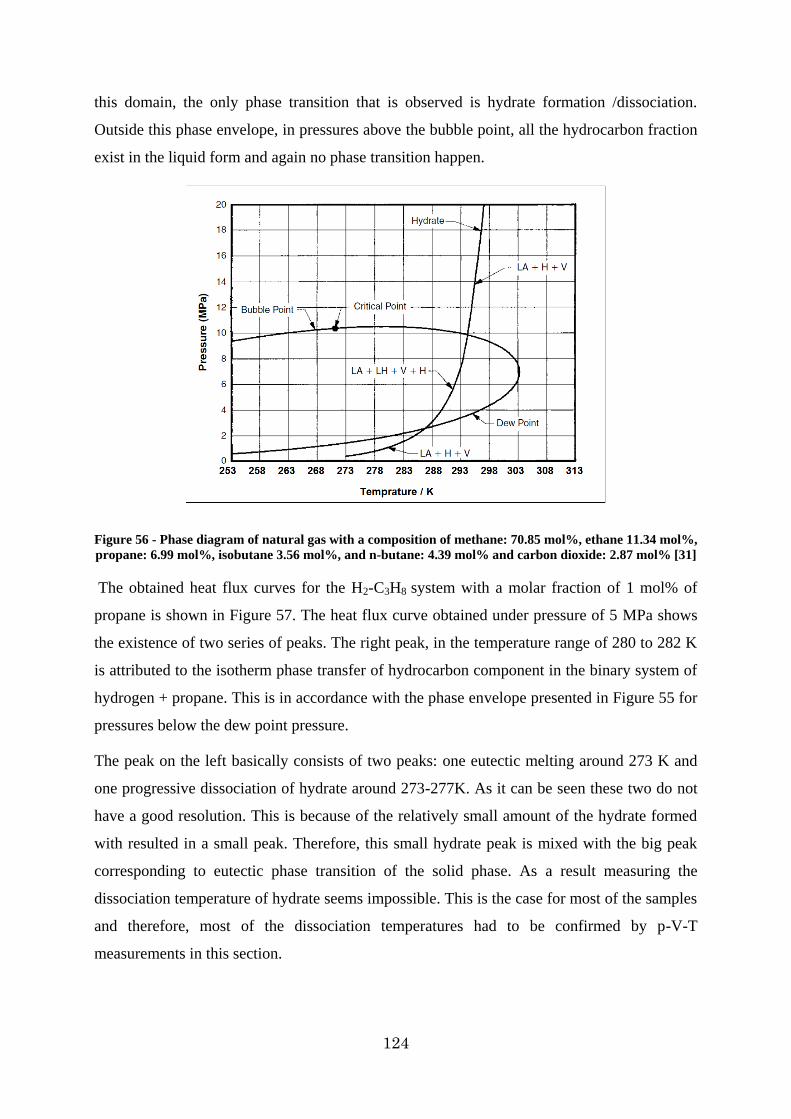
124
this domain, the only phase transition that is observed is hydrate formation /dissociation.
Outside this phase envelope, in pressures above the bubble point, all the hydrocarbon fraction
exist in the liquid form and again no phase transition happen.
Figure 56 - Phase diagram of natural gas with a composition of methane: 70.85 mol%, ethane 11.34 mol%, propane: 6.99 mol%, isobutane 3.56 mol%, and n-butane: 4.39 mol% and carbon dioxide: 2.87 mol% [31]
The obtained heat flux curves for the H2-C3H8 system with a molar fraction of 1 mol% of
propane is shown in Figure 57. The heat flux curve obtained under pressure of 5 MPa shows
the existence of two series of peaks. The right peak, in the temperature range of 280 to 282 K
is attributed to the isotherm phase transfer of hydrocarbon component in the binary system of
hydrogen + propane. This is in accordance with the phase envelope presented in Figure 55 for
pressures below the dew point pressure.
The peak on the left basically consists of two peaks: one eutectic melting around 273 K and
one progressive dissociation of hydrate around 273-277K. As it can be seen these two do not
have a good resolution. This is because of the relatively small amount of the hydrate formed
with resulted in a small peak. Therefore, this small hydrate peak is mixed with the big peak
corresponding to eutectic phase transition of the solid phase. As a result measuring the
dissociation temperature of hydrate seems impossible. This is the case for most of the samples
and therefore, most of the dissociation temperatures had to be confirmed by p-V-T
measurements in this section.
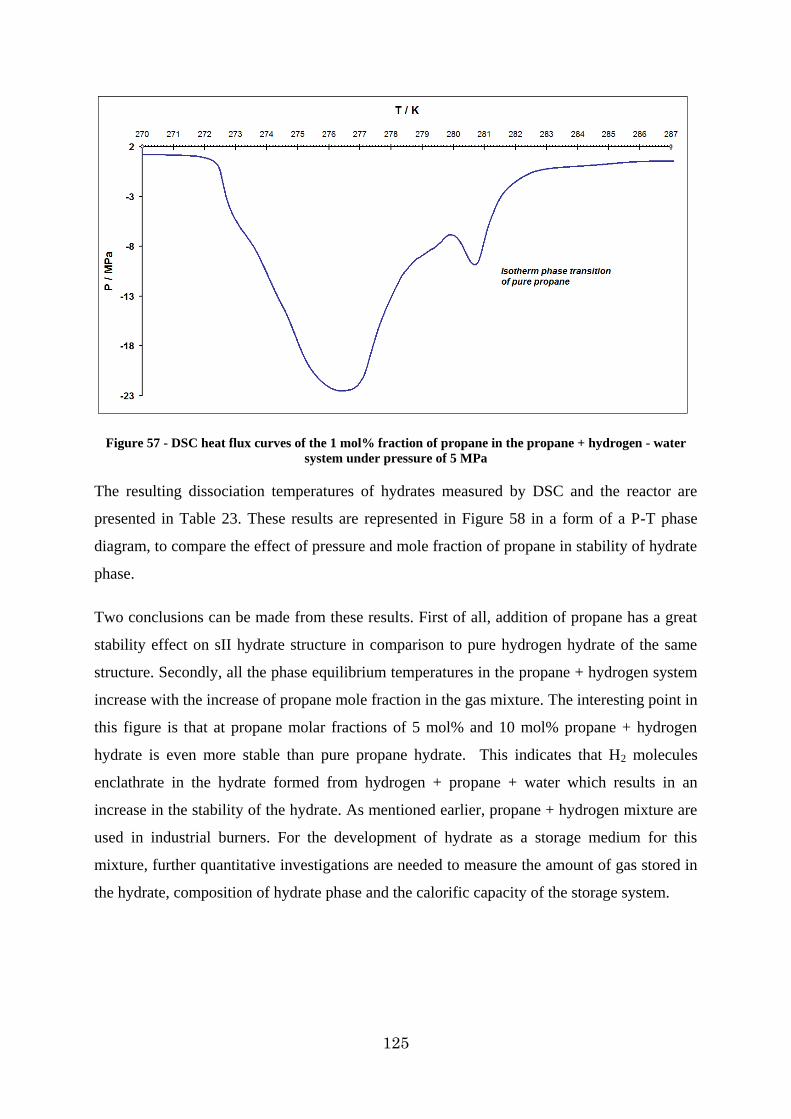
125
Figure 57 - DSC heat flux curves of the 1 mol% fraction of propane in the propane + hydrogen - water system under pressure of 5 MPa
The resulting dissociation temperatures of hydrates measured by DSC and the reactor are
presented in Table 23. These results are represented in Figure 58 in a form of a P-T phase
diagram, to compare the effect of pressure and mole fraction of propane in stability of hydrate
phase.
Two conclusions can be made from these results. First of all, addition of propane has a great
stability effect on sII hydrate structure in comparison to pure hydrogen hydrate of the same
structure. Secondly, all the phase equilibrium temperatures in the propane + hydrogen system
increase with the increase of propane mole fraction in the gas mixture. The interesting point in
this figure is that at propane molar fractions of 5 mol% and 10 mol% propane + hydrogen
hydrate is even more stable than pure propane hydrate. This indicates that H2 molecules
enclathrate in the hydrate formed from hydrogen + propane + water which results in an
increase in the stability of the hydrate. As mentioned earlier, propane + hydrogen mixture are
used in industrial burners. For the development of hydrate as a storage medium for this
mixture, further quantitative investigations are needed to measure the amount of gas stored in
the hydrate, composition of hydrate phase and the calorific capacity of the storage system.
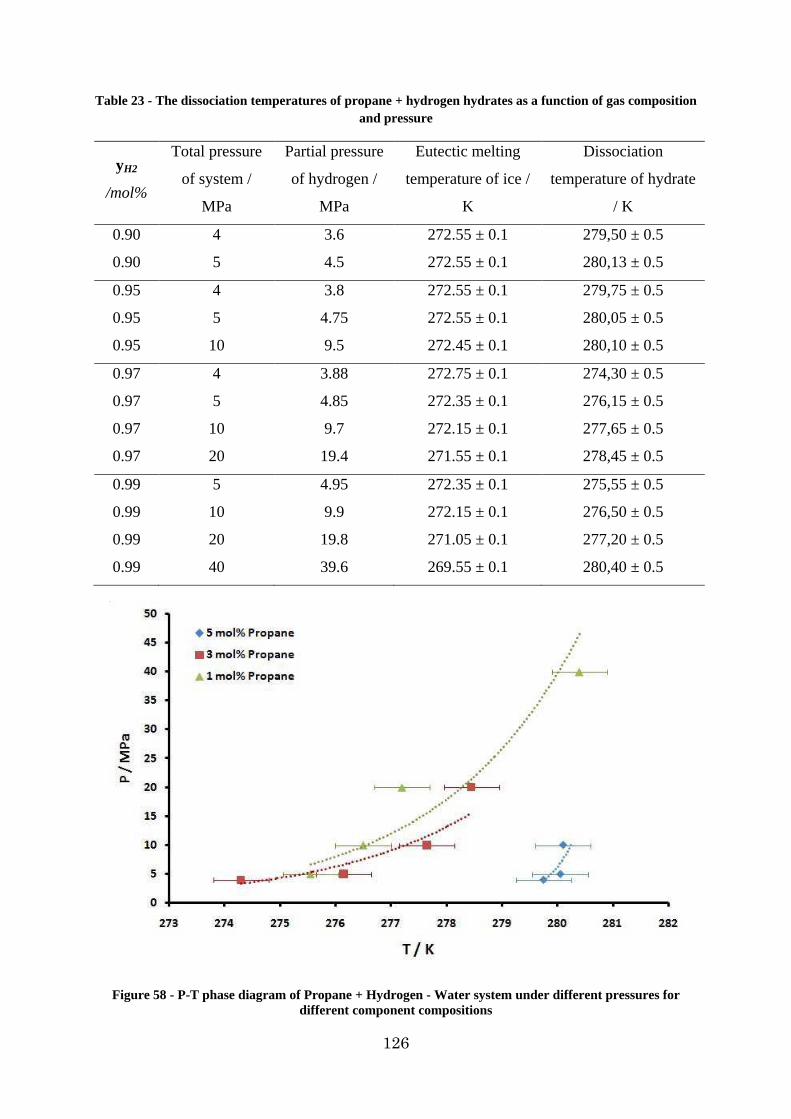
126
Table 23 - The dissociation temperatures of propane + hydrogen hydrates as a function of gas composition and pressure
yH2
/mol%
Total pressure
of system /
MPa
Partial pressure
of hydrogen /
MPa
Eutectic melting
temperature of ice /
K
Dissociation
temperature of hydrate
/ K
0.90 4 3.6 272.55 ± 0.1 279,50 ± 0.5
0.90 5 4.5 272.55 ± 0.1 280,13 ± 0.5
0.95 4 3.8 272.55 ± 0.1 279,75 ± 0.5
0.95 5 4.75 272.55 ± 0.1 280,05 ± 0.5
0.95 10 9.5 272.45 ± 0.1 280,10 ± 0.5
0.97 4 3.88 272.75 ± 0.1 274,30 ± 0.5
0.97 5 4.85 272.35 ± 0.1 276,15 ± 0.5
0.97 10 9.7 272.15 ± 0.1 277,65 ± 0.5
0.97 20 19.4 271.55 ± 0.1 278,45 ± 0.5
0.99 5 4.95 272.35 ± 0.1 275,55 ± 0.5
0.99 10 9.9 272.15 ± 0.1 276,50 ± 0.5
0.99 20 19.8 271.05 ± 0.1 277,20 ± 0.5
0.99 40 39.6 269.55 ± 0.1 280,40 ± 0.5
Figure 58 - P-T phase diagram of Propane + Hydrogen - Water system under different pressures for different component compositions
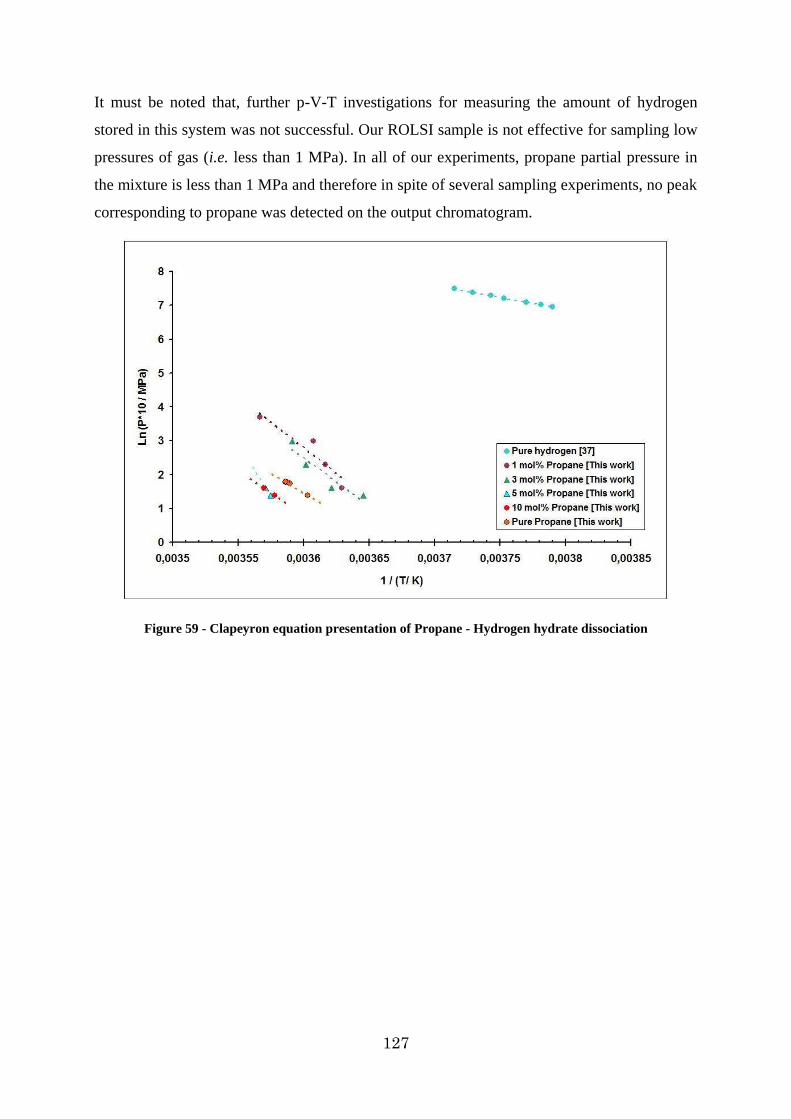
127
It must be noted that, further p-V-T investigations for measuring the amount of hydrogen
stored in this system was not successful. Our ROLSI sample is not effective for sampling low
pressures of gas (i.e. less than 1 MPa). In all of our experiments, propane partial pressure in
the mixture is less than 1 MPa and therefore in spite of several sampling experiments, no peak
corresponding to propane was detected on the output chromatogram.
Figure 59 - Clapeyron equation presentation of Propane - Hydrogen hydrate dissociation
128
4.2. Carbon dioxide – Hydrogen system
4.2.1. Introduction
The emission of carbon dioxide from the burning of fossil fuels is known as major contributor
to the global warming and climate change. Particularly, one third of the CO2 emissions
worldwide are being produced by fossil fuel electric power [108].
A promising solution to reduce greenhouse gas emissions is CO2 capture and storage. CO2
capture can be accomplished through two methods: either carbon can be removed before the
fuel‟s combustion (pre-combustion capture) or CO2 can be removed from the flue gas (post-
combustion capture). In post-combustion processes the CO2 has to be separated from the flue
gas which consists mainly of a CO2/N2 mixture whereas in pre-combustion processes one has
to consider CO2 separation from CO2/H2 mixtures [109]. The recent, IGCC3 power plants
propose new potentials for CO2 capture by converting the gas from the gasifier into a stream
of H2 and CO2 through a shift reaction [110]. After separation, the CO2 can be captured and
the remaining H2 could be used as an energy carrier [111]. In this regard, the separation of
CO2 from CO2/H2 gas mixtures plays a major role in chemical industry. The objective of this
section is the investigation of equilibrium data for hydrate clathrate formed under pressure of
CO2/H2 mixtures and the efficiency of a hydrate separation unit in gas separation.
4.2.2. A discussion on the phase diagram of H2-CO2-H2O
Prior to investigations on H2-CO2 hydrates, phase equilibrium of pure CO2 hydrate has been
investigated [112-130]. Carbon dioxide is known to form hydrate structure sI at moderate
pressure between 1 to 4 MPa. The equilibrium data of CO2 hydrates, and its comparison with
pure hydrogen equilibrium [Table 24] shows that in a mixture of hydrogen and carbon
dioxide, carbon dioxide forms a more stable hydrate structure and therefore it is the dominant
guest molecule (hydrate former). These data reveals that in a H2-CO2 gas mixture carbon
dioxide is more likely to enter the clathrate hydrates cavities by forming sI clathrate hydrates
leaving a rather purified H2 gas stream. Therefore, one may assume that presence of H2 in the
gas mixture has only an impact on the total pressure of the system but not on the nature and
the character of the formed hydrates. The validity of this assumption will be studied in the
next part, by comparing the phase equilibrium data of CO2-H2 and pure CO2.
3 Integrated Coal Gasification Cycle
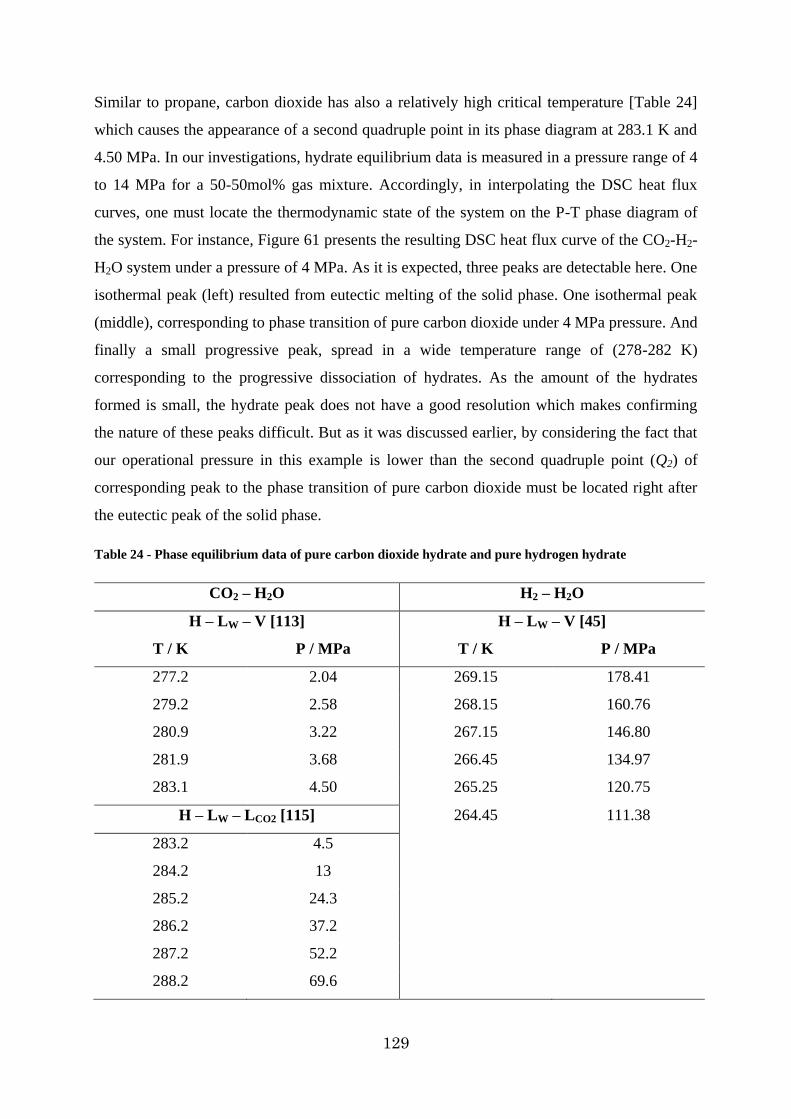
129
Similar to propane, carbon dioxide has also a relatively high critical temperature [Table 24]
which causes the appearance of a second quadruple point in its phase diagram at 283.1 K and
4.50 MPa. In our investigations, hydrate equilibrium data is measured in a pressure range of 4
to 14 MPa for a 50-50mol% gas mixture. Accordingly, in interpolating the DSC heat flux
curves, one must locate the thermodynamic state of the system on the P-T phase diagram of
the system. For instance, Figure 61 presents the resulting DSC heat flux curve of the CO2-H2-
H2O system under a pressure of 4 MPa. As it is expected, three peaks are detectable here. One
isothermal peak (left) resulted from eutectic melting of the solid phase. One isothermal peak
(middle), corresponding to phase transition of pure carbon dioxide under 4 MPa pressure. And
finally a small progressive peak, spread in a wide temperature range of (278-282 K)
corresponding to the progressive dissociation of hydrates. As the amount of the hydrates
formed is small, the hydrate peak does not have a good resolution which makes confirming
the nature of these peaks difficult. But as it was discussed earlier, by considering the fact that
our operational pressure in this example is lower than the second quadruple point (Q2) of
corresponding peak to the phase transition of pure carbon dioxide must be located right after
the eutectic peak of the solid phase.
Table 24 - Phase equilibrium data of pure carbon dioxide hydrate and pure hydrogen hydrate
CO2 – H2O H2 – H2O
H – LW – V [113] H – LW – V [45]
T / K P / MPa T / K P / MPa
277.2 2.04 269.15 178.41
279.2 2.58 268.15 160.76
280.9 3.22 267.15 146.80
281.9 3.68 266.45 134.97
283.1 4.50 265.25 120.75
H – LW – LCO2 [115] 264.45 111.38
283.2 4.5
284.2 13
285.2 24.3
286.2 37.2
287.2 52.2
288.2 69.6
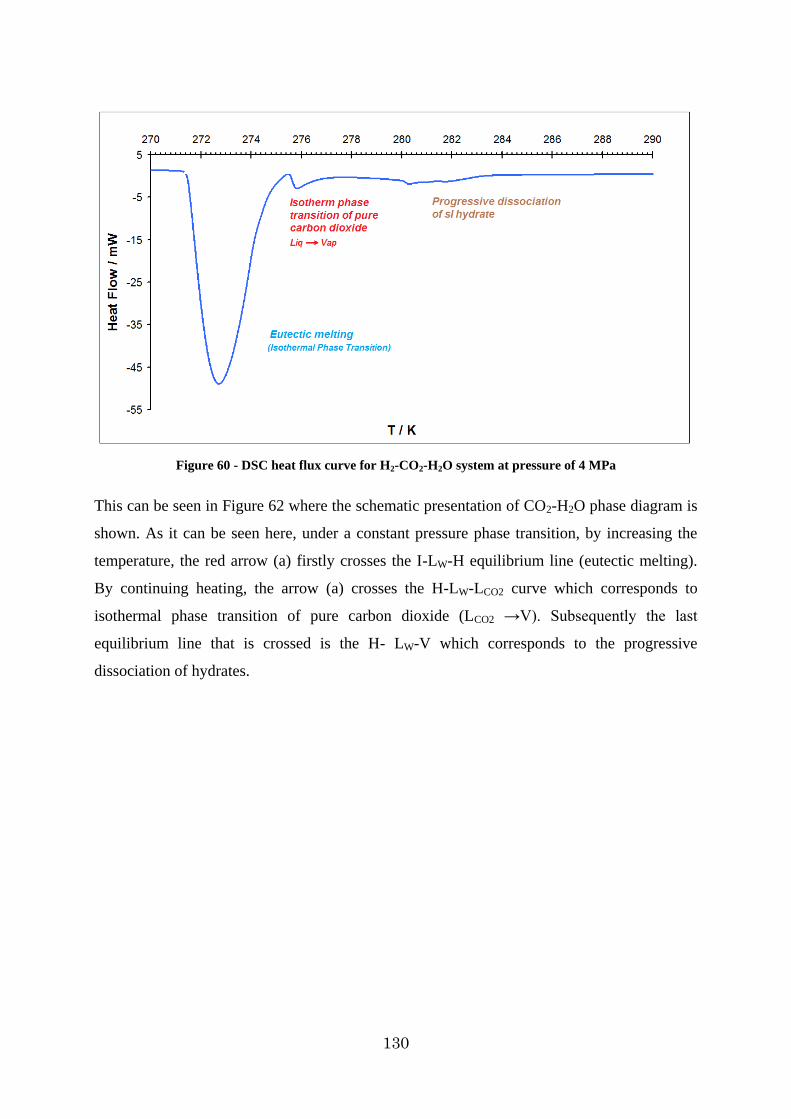
130
Figure 60 - DSC heat flux curve for H2-CO2-H2O system at pressure of 4 MPa
This can be seen in Figure 62 where the schematic presentation of CO2-H2O phase diagram is
shown. As it can be seen here, under a constant pressure phase transition, by increasing the
temperature, the red arrow (a) firstly crosses the I-LW-H equilibrium line (eutectic melting).
By continuing heating, the arrow (a) crosses the H-LW-LCO2 curve which corresponds to
isothermal phase transition of pure carbon dioxide (LCO2 →V). Subsequently the last
equilibrium line that is crossed is the H- LW-V which corresponds to the progressive
dissociation of hydrates.
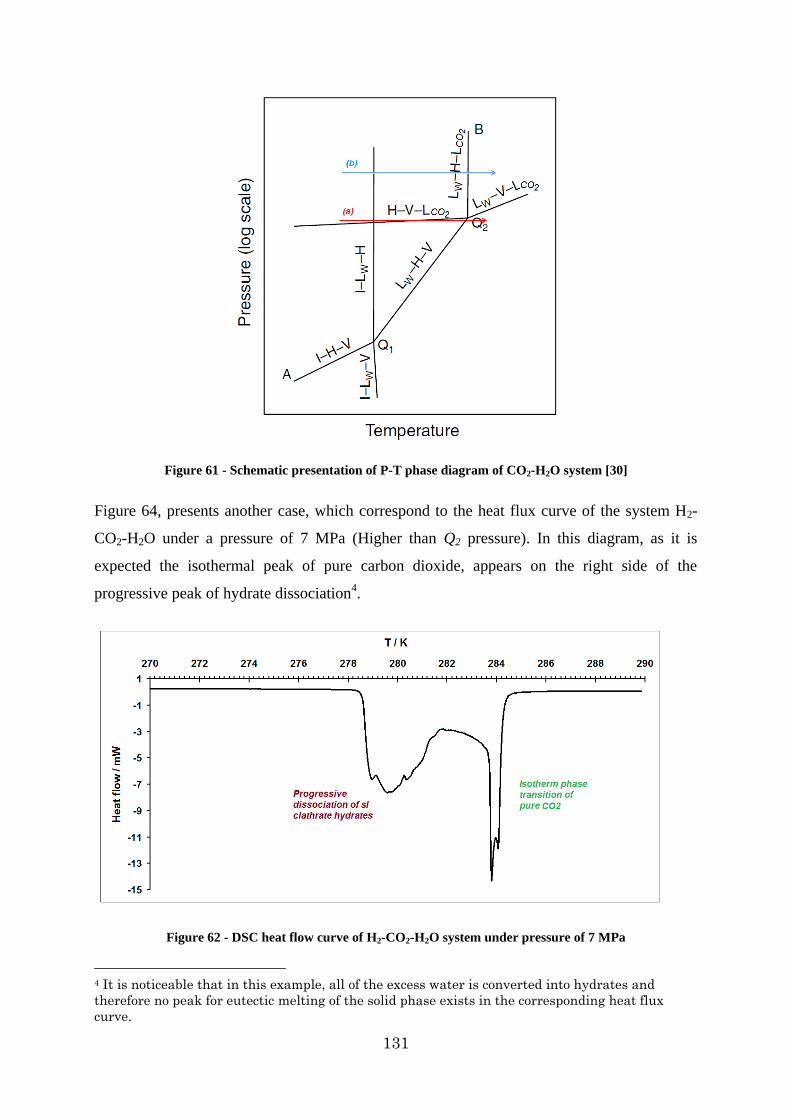
131
Figure 61 - Schematic presentation of P-T phase diagram of CO2-H2O system [30]
Figure 64, presents another case, which correspond to the heat flux curve of the system H2-
CO2-H2O under a pressure of 7 MPa (Higher than Q2 pressure). In this diagram, as it is
expected the isothermal peak of pure carbon dioxide, appears on the right side of the
progressive peak of hydrate dissociation4.
Figure 62 - DSC heat flow curve of H2-CO2-H2O system under pressure of 7 MPa
4 It is noticeable that in this example, all of the excess water is converted into hydrates and
therefore no peak for eutectic melting of the solid phase exists in the corresponding heat flux
curve.
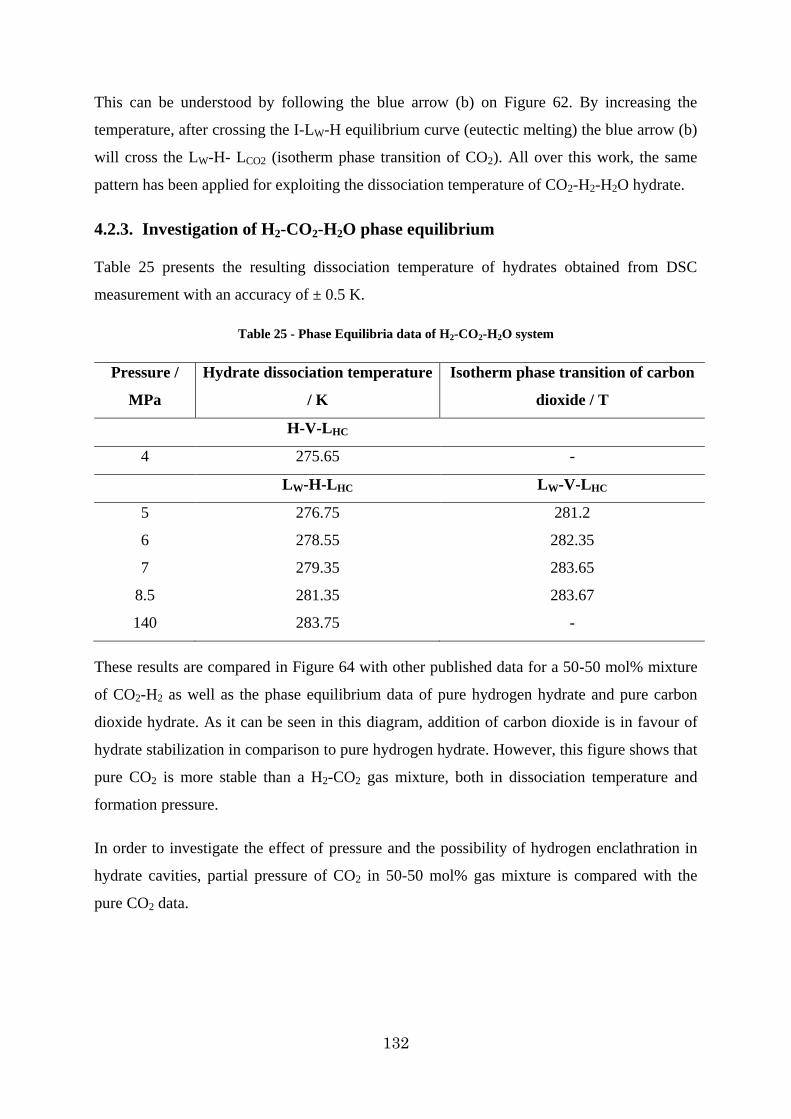
132
This can be understood by following the blue arrow (b) on Figure 62. By increasing the
temperature, after crossing the I-LW-H equilibrium curve (eutectic melting) the blue arrow (b)
will cross the LW-H- LCO2 (isotherm phase transition of CO2). All over this work, the same
pattern has been applied for exploiting the dissociation temperature of CO2-H2-H2O hydrate.
4.2.3. Investigation of H2-CO2-H2O phase equilibrium
Table 25 presents the resulting dissociation temperature of hydrates obtained from DSC
measurement with an accuracy of ± 0.5 K.
Table 25 - Phase Equilibria data of H2-CO2-H2O system
Pressure /
MPa
Hydrate dissociation temperature
/ K
Isotherm phase transition of carbon
dioxide / T
H-V-L HC
4 275.65 -
LW-H-L HC LW-V-L HC
5 276.75 281.2
6 278.55 282.35
7 279.35 283.65
8.5 281.35 283.67
140 283.75 -
These results are compared in Figure 64 with other published data for a 50-50 mol% mixture
of CO2-H2 as well as the phase equilibrium data of pure hydrogen hydrate and pure carbon
dioxide hydrate. As it can be seen in this diagram, addition of carbon dioxide is in favour of
hydrate stabilization in comparison to pure hydrogen hydrate. However, this figure shows that
pure CO2 is more stable than a H2-CO2 gas mixture, both in dissociation temperature and
formation pressure.
In order to investigate the effect of pressure and the possibility of hydrogen enclathration in
hydrate cavities, partial pressure of CO2 in 50-50 mol% gas mixture is compared with the
pure CO2 data.
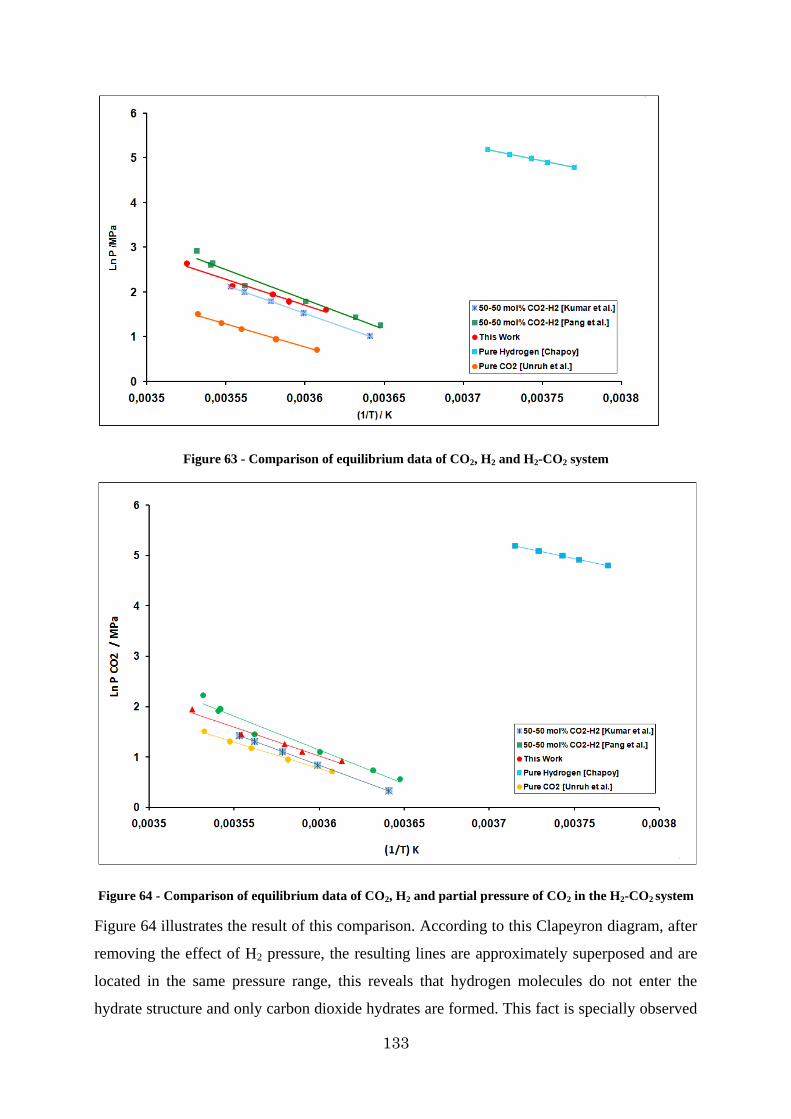
133
Figure 63 - Comparison of equilibrium data of CO2, H2 and H2-CO2 system
Figure 64 - Comparison of equilibrium data of CO2, H2 and partial pressure of CO2 in the H2-CO2 system
Figure 64 illustrates the result of this comparison. According to this Clapeyron diagram, after
removing the effect of H2 pressure, the resulting lines are approximately superposed and are
located in the same pressure range, this reveals that hydrogen molecules do not enter the
hydrate structure and only carbon dioxide hydrates are formed. This fact is specially observed
134
in lower pressures, which provide convenient operational conditions for an industrial
application of this method.
4.2.4. Composition analysis of CO2-H2O hydrate
Using p-V-T measurements, composition of a sample 50-50 mol% of CO2-H2 gas mixture
was analyzed after hydrate formation in order to investigate the efficiency of CO2 capture.
Experimental determination of the compositions of the existing phases in equilibrium with gas
hydrate by the p-V-T method is usually not an easy procedure. Some major technical
inconveniences are:
Long metastable periods
Difficulties of sampling without disturbing the thermodynamic equilibrium
Difficulties of visibility inside the reactor,
Blockage of sampling valves, etc.
For this purpose, an isochoric equilibrium cell which is a combination of precise and accurate
measuring devices such as ROLSI and the visual observation of the gas hydrate formation and
phase behaviour is used.
Table 26 presents the results of this measurement. It must be noted that all of the
chromatography sampling were done at 272 K. Due to absence of characterization method,
the composition of gases in the hydrate phase is not known, and therefore, formation of sII
hydrate structure is not known. According to this table, the separation efficiency increases
from 20% at 5.3 MPa to 45% at 8.4 MPa. Although an increase in the total pressure of the
system may reveal the possibility of hydrogen enclathration, which has been discussed earlier
in section 4.2.3., these results demonstrates that pressure increase is in favour of CO2
separation. These results can be used for a further simulation of a CO2/H2 separation unit, in
order to calculate the number of theoretical separation plates, and the number of separation
units. For this purpose a more complete investigation of the H2 – CO2 – H2O system with
variable initial H2/CO2 ratio and at variable equilibrium temperature would be required.

135
Table 26-Composition analysis of vapor phase in a mixture of CO2 - H2- H2O
Dissociation pressure/ MPa Initial composition / mol% Final composition / mol%
5,29 50.4 40.1
5,54 54.2 43.3
6,48 50.4 34.9
6,23 51.0 41.6
8,22 51.2 31.0
8,41 50.4 27.6

136
137
CCoonncclluussiioonnss aanndd ppeerr ssppeecctt iivveess
The main objective of this thesis was to carry out thermodynamic investigations on phase
equilibria of hydrogen clathrate and semi clathrate hydrates with the final aim of H2 storage
and separation. In this regard, the following steps were proceeded and with the eventual
subsequent conclusions:
1. A brief introduction on hydrogen and its properties were presented. Different
production methods of hydrogen in industrial scale were introduced and different
storage methods were explained. Hydrogen storage capacity & economy in
conventional storage methods were compared with new innovative techniques.
2. A brief literature review on gas hydrates was done, including presentation of their
physical and chemical properties, their different existing structures, effect of
promoters on their stability and different features with the regard to hydrogen
hydrates.
3. Two main experimental methods were applied for investigating phase equilibrium of
clathrate and semi-clathrate hydrates and their storage capacity. These experimental
methods are a combination of Differential Scanning Calorimeter (DSC) and p-v-T
measurements. DSC is one of the most applied techniques in thermodynamic of phase
behaviour. In this work, DSC was principally used for investigating the dissociation
temperature of hydrates under different gas pressures. Its sensitivity and fastness,
accompanied by its large range of temperature and pressure makes it a proper
technique for investigating phase equilibrium of clathrate hydrates.
4. Determination of gas storage in the hydrates is of a great significance to design the H2
storage systems. For this purpose p-v-T measurements were carried out by using a
high pressure (40 MPa) isochoric reactor. p-v-T measurements are the basic of all
experimental procedures in thermodynamic where three main thermodynamic
138
parameters i.e. Pressure, Volume and Temperature can be measured. In this work, p-v-
T measurements were undertaken for investigating the hydrogen storage on semi-
clathrate systems TBPBH4 and TBAOH. Moreover, by coupling the isocbaric reactor
with Gas Chromatograph (GC) molar composition of gas phase for the CO2-H2 system
was investigated.
5. The phase behaviours in the system G-TBPBH4-H2O (G = H2 or N2) were studied. It
was demonstrated, that TBPBH4 can be used as a hybrid hydrogen storage material.
The solutions of the new obtained TBPBH4 by reacting of the NaBH4 and TBPB were
found to form hydrates at low temperature. Using the DSC measurements the
dissociation (p, T) points of mixed hydrates at various salt concentrations were
determined. The results show that the new additive has very efficient stabilizing effect
on the hydrate structure, the dissociation temperatures ranging from 280 to 295 K,
depending on the gas, in a pressure range of 0 to 40 MPa. The 1.26 wt. % of the
chemically stored hydrogen was investigated using the volumetric analysis of the
hydrogen, released by hydrolysis of the TBPBH4 compound in the presence of acetic
acid. The influence of the gas nature on the hydrate stability was investigated. The
higher stabilization effect of nitrogen comparing to hydrogen was discovered.
6. The semi-clathrate system of hydrogen + tetra-n-butylammonium hydroxide + water
was studied for the first time. The phase diagram of this system is presented in a
concentration range of 0.83-3.23 wt% and temperature range of 273.15 K to 303.15 K.
The phase equilibrium data collected using differential scanning calorimeter (DSC)
show the capacity of hydrogen to stabilize one of the hydrate structures and therefore
occupy the semi-clathrate cavities. By using a high pressure reactor cell and the help
of atomic absorption analysis, hydrogen storage capacity of the system was measured
to be 0.35 wt% at 10 MPa and 0.47 wt% at 20 MPa. This was compared with
hydrogen storage capacity of some common hydrate structures. Although the storage
capacity of the system is not high, however, considering the favourable
thermodynamic conditions of formation and dissociation of TBAOH hydrates, and the
absence of any volatile promoter, it may reveal to be a good replacement for
conventional storage methods for in-place storage of hydrogen
139
7. Phase equilibrium of the system C3H8+H2O was investigated. The resulting
equilibrium points obtained by DSC measurements are compared with literature data.
Propane + H2O have two quadruple points; a lower one, and a higher quadruple point
which is due to its relatively high critical temperature. This second quadruple point
presents the highest temperature for hydrate equilibrium above which no hydrate can
be formed or exist.
8. The stabilizing effect of propane on hydrogen hydrate was studied by investigating
H2-C3H8-H2O system, with three different gas mixtures compositions: 1 mol%, 3
mol% and 5 mol% propane. It was shown, at very low propane concentrations that
hydrate dissociation temperature increases drastically. This is due to the enclathration
of large hydrate cavities by propane molecules which results in hydrate stability.
Moreover, it was seen that by increasing propane concentration in the system, hydrate
stability continues to increase. Due to the low partial pressure of propane in the
system, chromatographic peaks corresponding to propane did not have enough
resolution and therefore further investigation on gas phase composition and hydrogen
storage capacity, was unsuccessful.
9. CO2-H2-H2O system was the last system studied. The stability effect of carbon dioxide
was studied by comparison of equilibrium data of a CO2-H2 hydrate (50-50mol% gas
composition) with pure carbon dioxide hydrate and pure hydrogen hydrate. These
investigations were proceeded by gas molar composition analysis before and after
hydrate formation. Due to the absence of information of gas composition in hydrate
phase, investigation could not go further to analysis the performance of the system as
separation unit.
140
Perspectives
1. Evolution of hydrogen storage investigation in clathrate hydrates, demonstrates that
hydrogen storage capacity is limited to 5 wt% which is reachable only at very severe
conditions. Although this storage capacity and these severe formation conditions are
not proper for mobile application of hydrogen storage, they reveal potentials for in-
place hydrogen storage technologies. In this field of application, still more economic
studies are needed to evaluate the storage technology in industrial scale.
2. Application of hydrates in separation processes seems to have a more clear perspective
in the future. In this respect, more profound experimental investigations on CO2-H2-
H2O system, by analysing hydrate phase and aqueous phase would produce fruitful
results. It should be noted these experimental investigations, accompanied by
modelling of the system will give a useful perspective of the applicability of the
system and prediction of its behaviour under a wider range of compositions and
thermodynamic conditions.
141
RReeffeerreenncceess
1 PERRY‟s Chemical Engineers Handbook, 8th Edition, McGraw-Hill (2008)
2 Handbook of Hydrogen Storage, Edited by Michael Hircher, Wiley-VCH, ISBN 978-
3-527-32273-2
3 Schlapbach, L., Züttel, A. “Hydrogen-storage materials for mobile applications”,
Nature Vol. 414 (2001) PAGES
4 Ramachandran, R., Menon, R. K. “An overview of industrial use of hydrogen”,
International Journal of Hydrogen Energy, Vol. 23, No.7 (1998) 593-598
5 Zhou, L. “Progress and problems in hydrogen storage methods”, Renewable and
Sustainable Energy Reviews, Vol. 9 (2005) 395-408
6 Di Profio P., Arca S., Rossi F., Filipponi M. “Comparison of hydrogen hydrates with
existing hydrogen storage technologies: Energetic and economic evaluations”,
International Journal of Hydrogen Energy, Vol. 34 (2009) 9173-9180
7 Fierro, V., Szczurek, A., Zlotea, C., Mareche, J. F., Izquierdo, M. T., Albiniak, A.,
Latroche, M., Furdin, G., Celzard, A. “Experimental evidence of an upper limit for
hydrogen storage at 77 K on activated carbons” Carbon, Vol.48 (2010) 1902-1911
8 Chahine, R., Bose, T. K. “Low-pressure adsorption storage of hydrogen”, International
Journal of Hydrogen Energy, Vol.19 (1994) 161-164
9 Panella, B., Hircher, M., Roth, S. “Hydrogen Adsorption in Different Carbon
Nanostructures” Carbon, Vol.43 (2005) 2209-2214
10 Ye Y., Ahn C. C., Witham C., Fultza B., Colbert D., Smith K. A., Smalley R. E.
“Hydrogen adsorption and cohesive energy of single-walled carbon nanotubes”
Applied Physics Letters, Vol. 74 (1999) 2307-2309
11 Fitzgerald S. A., Yildirim T., Santodonato L. J., Neumann D. A., Copley J. R. D.,
Rush J. J., Trouw F., “Quantum dynamics of interstitial H2 in solid C-60” Physical
Review B, Vol.60 (1999) 6439-6451
12 Fitzgerald S. A., Forth S., Rinkoski M., “Induced infrared absorption of molecular
hydrogen in solid C-60” Physical Review B Vol. 65, (2002), 140302 – 140304
142
13 Talyzin A. V., Klyamkin S., “Hydrogen adsorption in C60 at pressures up to 2000
atm” Chemical Physics Letters, Vol.397 (2004) 77-81
14 Talyzin A. V., Jacob A., “Hydrogen adsorption by ball milled C-60” Journal of Alloys
and Compounds, Vol.395, (2005) 154-158
15 Weitkamp J., Fritz M., Ernst S. “Zeolites as media for hydrogen storage” International
Journal of Hydrogen Energy, Vol. 20 (1995) 967-970
16 Langmi H.W., Book D., Walton A., Johnson S.R., Al-Mamouri M.M., Speight J.D.,
Edwards P.P., Harris I.R., Anderson P.A. “Hydrogen Storage in Ion-exchanged
Zeolites” J. Alloys and Compounds, Vol. 404, (2005) p 637-642.
17 Furukawa H., Ko N., Go Y. B., Aratani N., Choi S. B., Choi E., Yazaydin A. O., Snurr
R. Q., O'Keeffe M., Kim J., Yaghi O. M. “Ultrahigh Porosity in Metal-Organic
Frameworks” Science, Vol. 329 (2010) 424-428
18 Rosi N. L., Eckert J., Eddaoudi M., Vodak D. T., Kim J., O‟Keeffe M., Yaghi O. M.
“Hydrogen Storage in Microporous Metal-Organic Frameworks” Science, Vol.300
(2003) 1127-1129
19 Dailly A., Vajo J. J., Ahn C. C. “Saturation of Hydrogen Sorption in Zn
Benzenedicarboxylate and Zn Naphthalenedicarboxylate” Journal of Physical
Chemistry B, Vol. 110 (2006) 1099–1101
20 Panella B., Hirscher M., Pütter H., Müller U. “Hydrogen Adsorption in Metal–Organic
Frameworks: Cu-MOFs and Zn-MOFs Compared” Advanced functional Materials,
Vol. 16, Issue 4, (2006) 520–524
21 Wong-Foy A. G., Matzger A. J., Yaghi O. M. “Exceptional H2 Saturation Uptake in
Microporous Metal−Organic Frameworks” Journal of the American Chemical Society,
Vol.128 (2006) 3494–3495
22 Zaluska A., Zaluski L., Ström–Olsen J. O. “Nanocrystalline magnesium for hydrogen
storage”, Journal of Alloys and Compounds, Vol.288 (1999) 217-225
23 Grochala W., Edwards P. P. “Thermal Decomposition of the Non-Interstitial Hydrides
for the Storage and Production of Hydrogen”, Chemical Review, Vol. 104 (2004)
1283−1315
143
24 Züttel A., Wenger P., Rentsch S., Sudan P,. Mauron P. Emmenegger C. “LiBH4 a new
hydrogen storage material”, Journal of Power Sources, Vol.118 (2003) 1–7
25 Urgnani J., Torres F.J., Palumbo M., Baricco M., “Hydrogen release from solid state
NaBH4” International Journal of Hydrogen Energy, Vol.33 (2008) 3111– 3115
26 Orimo S., Nakamori Y., Züttel A. “Material properties of MBH4 (M = Li, Na and K)”
Materials Science and Engineering B, Vol.108 (2004) 51–53
27 Chłopek K., Frommen C., Léon A., Zabara O., Fichtner M. “Synthesis and properties
of magnesium tetrahydroborate, Mg(BH4)2” Journal of Material Chemistry, Vol. 17
(2007) 3496-3503
28 Ronnebro E., Majzoub E.H. “Calcium borohydride for hydrogen storage: Catalysis
and reversibility” Journal of Physical Chemistry B, ol.111 (2007) 12045-12047
29 Schlesinger H. I., Brown H. C., Hyde E. K. “New developments in the chemistry of
diborane and the borohydrides. VII. The preparation of other borohydrides by
metathetical reactions utilizing the alkali metal borohydrides” Journal of the
American Chemical Society, Vol.75 (1953) 209-213.
30 Sloan E.D., Koh C.A. “Clathrate Hydrates of Natural Gases”, Third Edition, 2008,
CRC press.
31 Carrol J., “Natural Gas Hydrates A Guide for Engineers”, Second Edition, 2009, Gulf
Professional Publishing.
32 Jeffrey G. A. "Hydrate Inclusion Compounds" Journal of Inclusion Phenomena 1
(1984) 211-222
33 Strobel T. A., Koh C.A, Sloan, E.D. "Hydrogen storage properties of clathrate hydrate
materials" Fluid Phase Equilibria, Vol. 261 (2007) 382-389
34 Strobel T. A., Hester K.C., Koh C.A., Sum K., Sloan E.D. "Properties of the clathrates
of hydrogen and developments in their applicability for hydrogen storage" Chemical
Physics Letters, Vol. 478 (2009) 97-109
35 Udachin K. "Double clathrate hydrates with helium and hydrogen" Supermolecular
chemistry Vol. 3, Issue 3 (1994) 181-183
144
36 Dyadin Y.A., Lipkowski J., Tkacz M. "Clathrate hydrates of hydrogen and neon"
Mendeleev Communications, Vol. 9, Issue 5 (1999) 209-210
37 Wendy L. Mao, Ho-kwang Mao, Alexander F. Goncharov, Viktor V. Struzhkin,
Quanzhong Guo, Jingzhu Hu, Jinfu Shu, Russell J. Hemley, Maddury Somayazulu,
Yusheng Zhao, "Hydrogen Clusters in Clathrate Hydrate" Science, Vol. 297 (2002)
2247-2249
38 Mao , W. Mao H.K. "Hydrogen storage in molecular compounds" Proceedings of the
National Academy of Sciences, Vol. 101, Issue 3 (2003) 708-710.
39 Lokshin K., Zhao Y., "Fast synthesis method and phase diagram of hydrogen clathrate
hydrate" Applied Physics Letters, Vol. 88 (2006) 131909-1 – 131909-3
40 Lokshin K., Zhao Y., He D., Mao W.L., Mao H.K., Hemley R. "Structure and
Dynamics of Hydrogen Molecules in the Novel Clathrate Hydrate by High Pressure
Neutron Diffraction" Physical Review Letters, Vol. 93, Issue 12 (2004) 15503(1-4)
41 Strobel T.A., Sloan E.D., Koh C.A. “Raman spectroscopic studies of hydrogen
clathrate hydrates” Proceedings of the 6th International Conference on Gas Hydrates
(ICGH 2008) Vancouver, British Colombia, CANADA, July 6-10, 2008
42 Florusse L. J., Peters C.J., Schooman J., Hester K.C., Koh C.A., Dec S.F., Marsh
K.N., Sloan E.D. “Stable low-pressure hydrogen clusters stored in a binary clathrate
hydrate” Science, Vol. 306 (2004) 469-471
43 Lee H., Lee J.W., Kim D.Y., Park J. Seo Y.T., Zeng H., Moudrakovski I.L., Ratcliffe
C., Ripmeester J.A. “Tuning clathrate hydrates for hydrogen storage”, Nature, Vol.
434 (2005) 743-746
44 Strobel T.A., Taylor C.J., Hester K.C. Dec S.F., Koh C.A., Miller K.T., Sloan E.D.,
“Molecular hydrogen storage in binary THF-H2 clathrate hydrates” Journal of
Physical Chemistry B, Vol. 110 (2006) 17121-17125
45 Chapoy A., Anderson R., Tohidi B. “Effect of clathrate structure and promoter on
the phase behavior of hydrogen clathrates”, Proceedings of the 6th International
Conference on Gas Hydrates (ICGH 2008) Vancouver, British Colombia, CANADA,
July 6-10, 2008
145
46 Sugahara T., Haag J.C., Prasad S.R., Warntjes A.A., Sloan E.D., Sum A.K., Koh C.A.,
“Increasing hydrogen storage capacity using tetrahydrofouran”, Journal of the
American Chemical Society, Vol. 131, (2009) 14616-14617
47 Sugahara T., Haag J.C., Warntjes A.A., Prasad S.R., Sloan E.D., Koh C.A., Sem A.K.
“Large occupancies of hydrogen in binary clathrate hydrates dependent on pressures
and guest concentrations”, Journal of Physical Chemistry C, Vol. 114 (2010) 15218-
15222
48 Anderson R., Chapoy A., Tohidi B., “Phase relations and binary clathrate hydrate
formation in the system H2-THF-H2O” Langmuir, Vol. 23 (2007) 3440-3444
49 Belosludov R.V., Mizuseki H., Kawazoe Y. “Accurate description of guest-guest and
guest interactions in hydrogen clathrate: Role of help gas on stability of water hydrate
framework”, Proceedings of the 6th International Conference on Gas Hydrates (ICGH
2008) Vancouver, British Colombia, CANADA, July 6-10, 2008
50 Chapoy A., Anserdon R., Tohidi B. “Low-pressure molecular hydrogen storage in
semi-clathrate hydrates of quaternary ammonium compounds” Journal of the
American Chemical Society Vol. 129 (2007) 746-747
51 Deschamps J., Dalmazzone, D. “Hydrogen storage in semiclathrates of tetrabutyl
ammonium chloride and tetrabutyl phosphonium bromide” Journal of Chemical &
Engineering Data, Vol. 55, Issue 9 (2010) 3395-3399
52 Lipowski J., Komarov V.Y., Rodionova T.V., Dyadin Y.A., Aldako L.S. “The
structure of tetrabutylammonium bromide hydrate, (C4H9)4NBr.2 1/3 H2O” Journal
of Supermolecular Chemistry, Vol. 2 (2002) 435-439
53 Shimada W., Shiro M., Kondo H., Takeya S., Oyama H., Ebinuma T., Narita H.
“Tetra-n-butylammonium bromide water (1/38)”, Acta Crystallographica C, Vol. 61
(2005) 065-066
54 Aladko L.S., Dyadin Y.A., “Clathrate hydrates of tetra-butylammonium and tetra-
isoamyl-ammonium halides”, Journal of Structural Chemistry, Vol. 43, Issue 6 (2002)
990-994
146
55 Shimada W., Ebinuma T., Oyama H., Kamata Y., Takeya S., Uchida T., Nagao J.,
Narita H. “Separation of gas molecule using tetra-n-butyl ammonium bromide semi-
clathrate hydrate crystals” Japanese Journal of Applied Physics, Vol. 42 (2003) L 129-
L 131
56 Kamata Y., Shimada W., Ebinuma T., Takeya S., Uchida T., Nagao J., Narita H., “Gas
separation method using tetra-n-butyl ammonium bromide semi-clathrate hydrate”,
Japanese Journal of Applied Physics, Vol. 43, Issue 1 (2004), 362-365
57 Shimada W., Ebinuma T? Kamata Y., Oyama H., Narita H., “Free-growth forms and
growth kinetics of tetra-n-butyl ammonium bromide semi-clathrate hydrate crystals”
Journal of Crystal Growth, Vol. 274 (2005) 246-250
58 Oyama H., Shimada W., Ebinuma T., Kamata Y., Stoshi T., Tsutomu U., Jiro N.,
Narita H., “Phase diagram, latent heat and specific heat of TBAB semi-clathrate
hydrate crystals” Fluid Phase Equilibria, Vol. 234 (2005) 131-135
59 Hashimoto S., Murayama S., Sugahara T., Sato H., Ohgaki K. “Thermodynamic and
Raman spectroscopic studies on H2+tetrahydrofuran + water and H2 + tetra-n-butyl
ammonium bromide+water mixtures containing gas hydrates”, Chemical Engineering
Science, Vol. 61 (2006) 7884-7888
60 Hashimoto S., Sugahara T., Moritiki M., Sato H., Ohgaki K. “Thermodynamic
stability of hydrogen+tetra-n-butyl ammonium bromide mixed gas hydrates in
nonstoichiometric aqueous solutions” Chemical Engineering Science, Vol. 63 (2008)
1092-1097
61 Chapoy A., Gholinezhad J., Tohidi B., “Experimental clathrate dissociation for
hydrogen + water and hydrogen + tetrabutylammonium bromide+Water systems”,
Journal of Chemical & Engineering Data, Vol. 55 (2010) 5323-5327
62 Sakamoto J., “Thermodynamic and Raman spectroscopic studies on hydrogen+tetra-n-
butyl ammonium fluoride semi-clathrate hydrates” Chemical Engineering Science,
Vol. 63 (2008) 5789-5794
63 Shin K., Kim Y., Strobel T., Prasad P.S.R., Sugahara T., Lee H., Sloan E.D., Sum
A.K., Koh C.A., “Tetra-n-butylammonium borohydride semiclathrate: A Hybrid
147
Material for Hydrogen Storage”, Journal of Physical Chemistry A, Vol. 113 (2009)
6415-6418
64 Ogata K., Tsuda T., Amano S., Hashimoto S., Sugahara T., Ohgaki K., “Hydrogen
storage in trimetylamine hydrate: Thermodynamic stability and hydrogen storage
capacity of hydrogen +trimethylamine mixed semi-clathrate hydrates” Chemical
Engineering Science, Vol. 65, (2009) 1616-1620
65 Differential Scanning Calorimetry, Edited by G.W.H. Höhne, W.F. Hemminger, H.-J.
Flammersheim, Springer (2003) ISBN: 3-540-00467-X
66 Handbook of thermal analysis and Calorimetry, Edited by M. Brown (1998), Elsevier
67 Dalmazzone D., Dalmazzone C., Herzhaft B., “Differential Scanning Calorimetry: A
New Technique to Characterize Hydrate Formation in drilling Muds”, SPE 63962
(2000)
68 Kharrat M., Dalmazzone D., “Experimental determination of stabilityconditions of
methane hydrate in aqueous calcium chloride solutions using high pressure differential
scanning calorimetry” J. Chem. Thermodynamics Vol.35 (2003) 1489–1505
69 Grenet J., Legendre B., “Analyse calorimétrique différentielle à balayage (DSC) ”
Technique d‟ingénieurs P 1 205
70 Mayoufi N. Thèse de doctorat : “Caractérisation de coulis d‟hydrates contenant du
CO2 appliqué à des systèmes frigorifiques” ENSTA ParisTech, (2010)
71 Höhne G.W.H., Cammenga H.K., Eysel W., Thermochim. Acta, 160 (1990) 1-12
72 Guilbot, P., Valtz, A., Legendre, H., Richon, D. “Rapid on line sampler-injector: A
reliable tool for HT-HP sampling and on line GC analysis” Analusis (2000), Vol.28,
426–431
73 Oyama H., Shimada W., Ebinuma T., Kamata Y., Takeya S., Uchida T., Nagao J.,
Narita H. “Phase diagram, latent heat and specific heat of TBAB semi-clathrate
hydrate crystals.” Fluid Phase Equilib. 2005, 234, 131-135
74 Hashimoto S., Murayama S., Sugahara T., Sato H., Ohgaki K. “Thermodynamic and
raman spectroscopic studies on H2 + tetrahydrofuran + water and H2 + tetra-n-butyl
148
ammonium bromide + water mixtures containing gas hydrates” Chem. Eng. Sci. 2006,
61, 7884-7888.
75 Chapoy A., Anderson R., Tohidi B.“Low-pressure molecular hydrogen storage in
semi-clathrate hydrates of quaternary ammonium compounds” J. Am. Chem. Soc.
2007, 129, 746-747
76 Arjmandi M., Chapoy A., Tohidi B. “Equilibrium data of hydrogen, methane,
nitrogen, carbon dioxide, and natural gas in semi-clathrate hydrates of tetrabutyl
ammonium bromide” J. Chem. Eng. Data. 2007, 52, 2153-2158
77 Hashimoto S., Sugahara T., Moritoki M., Sato H., Ohgaki K. “Thermodynamic
stability of hydrogen+tetra-n-butyl ammonium bromide mixed gas hydrate in
nonstoichiometric aqueous solutions” Chem. Eng. Sci. 2008, 63, 1092-1097
78 Deschamps J., Dalmazzone D. “Hydrogen storage in semiclathrate hydrates of
tetrabutyl ammonium chloride and tetrabutyl phosphonium bromide” J. Chem. Eng.
Data published online on June 17th 2010, DOI: 10.1021/je100146b
79 Sakamoto J., Hashimoto S., Tsuda T., Sugahara T., Inoue Y., Ohgaki K.
“Thermodynamic and raman spectroscopic studies on hydrogen+tetra-n-butyl
ammonium fluoride semi-clathrate hydrates” Chem. Eng. Sci. 2008, 63, 5789-5794
80 Strobel T.A., Kim Y., Andrews G.S., Ferrell J.R., Koh C.A., Herring , Sloan E. D.
“Chemical-Clathrate Hybrid Hydrogen Storage: Storage in Both Guest and Host” J.
Am. Chem. Soc. 2008, 130, 14975–14977
81 Shin K., Kim Yo., Strobel T.A., Prasad P. S. R., Sugahara T., Lee H., Sloan E. D.,
Sum A.K., Koh C.A. “Tetra-n-butylammonium Borohydride Semiclathrate: A Hybrid
Material for Hydrogen Storage” Journal of Physical Chemistry Letters A, 2009, 113,
6415–6418
82 Demirci U.B., Akdim O., Miele P. “Ten-year efforts and a no-go recommendation for
sodium borohydride for on-board automotive hydrogen storage” International journal
of hydrogen energy 34, 2009, 2638–2645
83 Ruman T., Kusnierz A., Jurkiewicz A., Les A., Rode W. “The synthesis, reactivity and 1H NMR investigation of the hydroxyborohydride anion” Inorg. Chem. Commun.
2007, 10, 1074-1078
149
84 Dyadin Y.A. , Udachin K.A. “Clathrate formation in water-peralkylonium salts
systems” J. Incl. Phenom. 2 (1984) 61-72
85 A. van Cleeff, G. A. M. Diepen “Gas hydrates of nit rogen and oxygen” Rew. Trav.
Chim. 1960, 79, 582-586.
86 Seo Y.-T., Kang S.-P., Lee H. “Experimental determination and thermodynamic
modeling of methane and nitrogen hydrates in the presence of THF, propylene oxide,
1,4-dioxane and acetone” Fluid Phase Equilib. 2001, 189, 99-110.
87 Deschamps J., Dalmazzone D., “Dissociation Enthalpies and Phase Equilibrium for
TBAB semi-Clathrate Hydrates of N2, CO2, N2 + CO2 and CH4 + CO2” J. Therm.
Anal. Calorim. 2009, 98, 113-118
88 Lokshin K. A., Zhao Y. , He D. , Mao W. L. , Mao H. K., Hemley R. J., Lobanov
M. V., Greenblatt M. , Phys. Rev. Let. 93, 125503 (2004).
89 Huang H., Sandler S. I., Orbey H. “Vapor-Liquid equilibria of some hydrogen +
hydrocarbon systems with the Wong – Sandler mixing rule” Fluid Phase Equilibria,
Vol.96 (1994) 143-153
90 Ballard A.L., Sloan E.D. “Hydrate phase diagrams for methane + ethane + propane
mixtures” Chemical Engineering Science, Vol.56 (2001) 6883-6895
91 Dyadin Yu. A., Larionov E. G., Aladko E. Ya., Zhurko F. V. “Clathrate Formation in
Propane–Water and Methane–Propane–Water Systems under Pressures of up to 15
kbar” Physical Chemistry, Vol. 376 (2001) pp.497-500
92 M.M. Mooijer-van den Heuvel, Peters C.J., de Swaan Arons J. “Gas hydrate phase
equilibria for propane in the presence of additive components”, Fluid Phase Equilibria,
Vol.193 (2002) pp.245–259
93 Gaudette J. , Servio P. “Measurement of Dissolved Propane in Water in the Presence
of Gas Hydrate” J. Chem. Eng. Data Vol. 52 (2007) pp. 1449-1451
94 Lars Jensen, Kaj Thomsen, Nicolas von Solms “Propane hydrate nucleation:
Experimental investigation and correlation” Chemical Engineering Science Vol. 63
(2008) pp.3069 – 3080
95 Reamer H.H. et al., (1952), “Some properties of mixed paraffinic & other olefinic
hydrate”, Trans.Am.Inst.Min., Metall. Pet.Eng. 195-197-202
150
96 Makagon Y. F. “Liquid Propane+Water Phase Equilibruia at Hydrate Conditions”
Journal of Chemical Engineering Data Vol. 48 (2003) 347-350
97 Miller B., Strong E.R., Am. Gas Assoc. Monthly, 28, 63 (1946)
98 Deaton W.M., Frost E.M.Jr., “Gas Hydrates and Their Relation to the Operation of
Natural-Gas Pipe Lines” U.S. Bureau of Mines Monograph, 8 (1946) 101.
99 Verma Y. K., Hand J.H., Katz D.L. [Donald L.], “Gas hydrates from liquid
hydrocarbons methane-propane-water system” GVC/AIChE Joint Meeting, Munich,
1975, 10
100 Kubota H., Shimizu K., Tanaka Y., Makita T., J. Chem. Eng. Japan, 17 (1984) 423
101 Robinson D.B., Mehta B.R., J. Can. Pet. Tech., 10 (1971) 33
102 Thakore J.L., Holder G.D., Ind. Eng Chem. Res., 26 (1987) 462
103 M.M. Mooijer-van den Heuvel., “Phase Behaviour and Structural Aspects of Ternary
Clathrate Hydrate Systems : The Role of Additives” Chemical Engineering Thesis,
Delft University of Technology (2004)
104 Wilcox W.I., Carson D.B., Katz D.L., Ind. Eng. Chem., 33 (1941) 662
105 Sugahara T. et al., (2008), “Cage occupancy of hydrogen in carbon dioxide, ethane,
cyclopropane, and propane hydrates”, The Open Thermodynamics Journal, 2008, 2, 1-
6
106 Skiba S. et al., (2009), “Double clathrate hydrate of propane and hydrogen”, J Incl
Phenom Macrocycl Chem (2009) 63:383–386
107 Zhang Sh., et al., (2000), “Hydrate Formation of Hydrogen + Hydrocarbon Gas
Mixtures”, J. Chem. Eng. Data 2000, 45, 908-911
151
108 Xiao-Sen Li, Zhi-Ming Xia, Zhao-Yang Chen, Ke-Feng Yan, Gang Li, Hui-Jie Wu
“Equilibrium Hydrate Formation Conditions for the Mixtures of CO2 + H2 +
Tetrabutyl Ammonium Bromide”, J. Chem. Eng. Data Vol. 55 (2010) pp 2180–2184
109 Rajnish Kumar, Hui-jie Wu, Peter Englezos “Incipient hydrate phase equilibrium for
gas mixtures containing hydrogen, carbon dioxide and propane” Fluid Phase
Equilibria Vol.244 (2006) 167–171
110 Barchas, R., and Davis, R. (1992), “The Kerr-McGee/ABB Lummus Crest
Technology for the Recovery of CO2 from Stack Gases”, Energy Convers. Mgmt.,
Vol. 33, (1992) pp 333-340
111 Audus, H., Olav, K., & Geoff, S. (1998). Proceedings of the 4th International
Conference on Greenhouse Gas Control Technologies, (S. 557-562). Interlaken,
Switzerland.
112 Deaton, W.M., Frost, E.M., Jr., “Gas Hydrates and Their Relation to the Operation of
Natural-Gas Pipe Lines” U.S. Bureau of Mines Monograph (1946) Vol.8, 101
113 Unruh, C.H., Katz, D.L., (Gas hydrates of carbon dioxide-methane mixtures) Trans.
AIME, (1949) Vol.186, 83
114 Larson, S.D., “Phase Studies of the Two-Component Carbon Dioxide-Water System,
Involving the Carbon Dioxide Hydrate”, University of Illinois, Urbana, IL (1955)
115 Takenouchi S., Kennedy G.C., “Dissociation pressures of the phase CO2·5 ¾
H2O”Journal of Geology, (1965) Vol.73, 383
116 Miller, S.L., Smythe,W.D., “Carbon dioxide clathrate in the Martian polar cap”
Science (1970) Vol.170, 531
117 Robinson, D.B., Mehta, B.R., “Hydrates in the propane-carbon dioxide-water
system”J. Can. Pet. Tech. (1971) Vol.10, 33-35
118 Ng, H.-J., Robinson, D.B., “Hydrate formation in the CO2-H2O binary system”Fluid
Phase Equilib. (1985) Vol.21, 145
119 Vlahakis, J.G., Chen, H.-S., Suwandi, M.S., Barduhn,A.J., “The Growth Rate of Ice
Crystals: Properties of Carbon dioxide Hydrates, A Review of Properties of 51 Gas
Hydrates, Syracuse U” Research and Development Report 830, prepared for US
Department of the Interior, November (1972)
152
120 Falabella, B.J., “A Study of Natural Gas Hydrates” Ph.D. Thesis, University of
Massachusetts, University Microfilms, No. 76-5849, Ann Arbor, MI (1975)
121 Song, K.Y., Kobayashi, R., “Water Content of CO2 in Equilibrium with Liquid Water
and/or Hydrates” SPE Formation Evaluation, (1987) 500-508
122 Adisasmito, S., Frank, R.J., Sloan, E.D., “Hydrates of carbon dioxide and methane
mixtures”J. Chem. Eng. Data (1991) 36, 68-71
123 Ohgaki, K., Makihara, Y., Takano, K., “Formation of CO2 Hydrate in Pure and Sea
Waters”J. Chem. Eng. Jpn., (1993) 26, 558-564 (1993)
124 Nakano, S., Moritoki, M., Ohgaki, K., J. “High-pressure phase equilibrium and Raman
microprobe spectroscopic studies on the CO2 hydrate system” Chem. Eng. Data, 43,
807-810 (1998b)
125 Fan, S.-S., Guo, T.-M., “Hydrate Formation of CO2-Rich Binary and Quaternary Gas
Mixtures in Aqueous Sodium Chloride Solutions” J. Chem. Eng. Data, (1999) Vol. 44,
829-832
126 Fan, S.-S., Chen, G.-J., Ma, Q.-L., Guo, T.-M., (2000) Chem. Eng. J., 3595, 1
127 Mooijer-van den Heuvel, M.M., Witteman, R., Peters, C.J., “ Phase behaviour of gas
hydrates of carbon dioxide in the presence of tetrahydropyran, cyclobutanone,
cyclohexane and methylcyclohexane” Fluid Phase Equilib., (2001) Vol.182, 97-110
128 Zhang, Y., “Formation of Hydrate from Single-Phase Aqueous Solutions” M.S.
Thesis, University of Pittsburgh, PA (2003)
129 Mohammadi, A.H., Anderson, R., Tohidi, B., “Carbon monoxide clathrate hydrates:
Equilibrium data and thermodynamic modeling” AIChE J., (2005) Vol.51, 2825-2823
130 Wassila Bouchafaa, P.h.D Thesis “Mesure et modélisation des conditions de
dissociation d‟hydrates de gaz stabilisés en vue de l‟application au captage du CO2”
ENSTA ParisTech, November 2011