Embed Size (px)
Citation preview
Syntax Highlighting in Business Process Models
H.A. Reijersa,∗, Thomas Freytagb, Jan Mendlingc, Andreas Ecklederb
aEindhoven University of Technology, The NetherlandsbBaden-Wurttemberg Cooperative State University Karlsruhe, Germany
cHumboldt-Universitat zu Berlin, Germany
Abstract
Sense-making of process models is an important task in various phases of busi-
ness process management initiatives. Despite this, there is currently hardly
any support in business process modeling tools to adequately support model
comprehension. In this paper we adapt the concept of syntax highlighting to
workflow nets, a modeling technique that is frequently used for business pro-
cess modeling. Our contribution is three-fold. First, we establish a theoretical
argument to what extent highlighting could improve comprehension. Second,
we formalize a concept for syntax highlighting in workflow nets and present a
prototypical implementation with the WoPeD modeling tool. Third, we report
on the results of an experiment that tests the hypothetical benefits of high-
lighting for comprehension. Our work can easily be transferred to other process
modeling tools and other process modeling techniques.
Key words: business process models, workflow nets, understandability,
process modeling tool, coloring
1. Introduction
Capturing business processes in the form of graphical models has become
a popular way to support the communication between business professionals
and to guide the development and implementation of IT systems [11, 30]. An
∗Corresponding authorEmail addresses: [email protected] (H.A. Reijers)
Preprint submitted to Elsevier July 20, 2010
abundance of academic literature is devoted to the formal aspects of process
modeling (see e.g. [33, 45, 59]), while much of the efforts in industry are geared
towards standardizing the involved notations. A good example of the latter is
the adoption of the Business Process Modeling Notation 2.0 as a formal OMG
standard at the end of 2009.
What has received comparatively little attention are the factors that make
the usage of process models effective. Because the primary purpose of process
models is to facilitate human communication and problem solving – as is the case
for most visual diagrams [27] – a key issue is how to improve the understanding
of such models. In other words: How can process models be created such
that they can be understood more quickly and accurately by human model
readers? This question is of significant relevance. Many companies build their
process management initiatives on large-scale process model repositories that
often contain several thousands of process models [54]. Casual modelers and
usual staff members create and read these models in support of their daily
operations. Currently, research shows that there are serious issues with the
creation and comprehension of these models [39]. Therefore, answers to the
question of accurate comprehension can be expected to improve the effective
use of process models in settings such as information systems development,
compliance checking, and training of business professionals.
This paper’s focus is on the highlighting of syntactical elements in process
models to improve their understandability. More specifically, we propose the
use of color to highlight process model elements that relate to one another in a
way that is comparable to how pairs of opening and closing brackets in a natural
sentence do. The technique of syntax highlighting, i.e. the coloring or empha-
sizing of source code in meaningful ways, has become an established feature in
programming editors to support programmers in making sense of code. Despite
the similarities that have been noted between process models and software code
[26, 63], syntax highlighting of process models has not been introduced yet. This
is all the more surprising given the wide availability of process modeling tools.
At this stage, the use of color in process models is used mainly to distinguish
2
different types of model elements, for example to distinguish events (purple) and
functions (green) in Event-driven Process Chains [55], but not systematically
to aid sense-making of specific process models. Against this background, the
contribution of this article is threefold. First, we provide a detailed discussion of
potential benefits of syntax highlighting for process model comprehension from
a theoretical perspective. Second, we formalize a highlighting concept for work-
flow nets and demonstrate their applicability with an implementation within
the open source modeling tool WoPeD. Third, and based on that implementa-
tion, we report the results of an experiment that challenges the benefits of the
highlighting approach.
The structure of the paper is now as follows. In Section 2, we discuss the
effects of syntax highlighting using insights from cognitive research. Section 3
defines a formal approach to highlighting for workflow nets and presents a cor-
responding implementation. Section 4 describes an empirical test that has been
conducted to determine the effectiveness of the proposed highlighting approach.
We discuss implications of our work in Section 5 and conclude our paper with
Section 6.
2. Syntax Highlighting in Process Models
In this section we introduce the theoretical background of our research on
syntax highlighting for process models. In Section 2.1 we discuss the concept of
secondary notation and its importance for process model understanding. We use
an example of a real-world process model to illustrate the potential benefits of
highlighting as a mechanism of secondary notation. In Section 2.2 we investigate
how different user groups might benefit from highlighting.
2.1. Color and understanding
Traditionally, conceptual models including business process models are cre-
ated as an interplay between an expert in the considered domain (domain expert)
and an expert in modeling techniques (system analyst) [20]. Typically, a domain
3
expert can be characterized as someone with (1) superior, detailed knowledge
of the object under consideration but often (2) minor powers of abstraction be-
yond that knowledge. The strengths of the system analyst are exactly the oppo-
site. Recently, business process modeling projects have grown to company-wide
initiatives in which non-expert modelers (or novice modelers) are increasingly
active. Such projects can easily cover the definition and maintenance of several
thousands of models. The trend towards an increasing involvement of novices
in process modeling projects causes various quality issues [54]. Recent research
reveals considerable weaknesses of process models from practice in terms of un-
derstanding and error probability. Many real-world process model collections
have error rates of up to 30% [39]. Such quality issues have been partially
attributed to the sheer complexity of certain process models [38, 40, 41, 44].
Therefore, it is an important question how readers can be better supported in
understanding a process model in an accurate way.
Most process models and corresponding languages are rather puristic from
a visual point of view. Hardly any highlighting is used except for Event-driven
Process Chains in which sometimes events (purple) and functions (green) are
distinguished by color. The research by Bertin on the semiology of graphics
identifies eight distinct visual variables that can be used to encode graphical
information [4]. Color is considered to be one of the most effective of these
variables. The human visual system is able to recognize color quickly [37].
Distinctions between different colors can be detected accurately and three times
faster than between shapes [36]. Therefore, Moody criticizes that color is hardly
used by modeling notations to distinguish notation elements [46]. These insights
clearly point to the attractiveness of using color in a systematic way to improve
the understanding of process models.
Furthermore, the Cognitive Dimensions Framework (CDF) by Green and
Petre provides the background to postulate a way to sensibly apply coloring [23,
24]. The CDF has been highly influential in language usability studies and
numerous publications have been devoted to its further development, see its
discussion in [5]. It provides a set of characteristics to evaluate a wide variety
4
of notations, e.g. spreadsheets, style sheets, diagrams, etc. Specifically, process
modeling languages have been analyzed to be “abstraction-hating”, because
they do not provide any mechanism to group activities . This leads to several
problems in terms of cognitive processing as it is not directly visible where a
certain sub-component of a process model starts and ends. As a result, the inside
of a component cannot be ignored when considering behavioral aspects around
it and it is hard to neglect a sub-component’s environment when its internal
aspects are investigated. Additionally, in terms of the CDF the start and end
nodes of sub-components are examples of long-range “hidden dependencies”. In
a process model, it is very common that a particular type of start node calls for
a similar type of end node. However, the larger and more complex a model gets,
the more difficult it is to determine which start and end nodes belong to one
another. This is problematic since identifying matching entry and exit nodes of
a component helps the model reader in terms of information hiding [49, 53].
Motivated by the discussed shortcomings of process models as a visual nota-
tion according to the CDF and the potential power of color as a visual variable
mentioned eaerlier, it seems attractive to focus on the highlighting of entry and
exit nodes of sub-components. Such nodes typically reflect a particular routing
semantics. In a workflow net context, they are called operator transitions. We
will use this term already here; its precise definition will be part of the section
on our formal highlighting approach.
How exactly highlighting may be used to facilitate information hiding is
illustrated in Figure 1. It shows two versions of a real-world process model that
has been made available to us through a cooperation with the Dutch branch
of Sogeti1, a large ICT service provider. The process captures how within one
of Sogeti’s clients, a multinational bank, existing credit facilities are updated.
This is required at times, for example because of changes in the preferences of
the account holders or in the commercial circumstances. The process involves
the execution of various checks by bank clerks, as well as updates they have to
1http://www.sogeti.com/
5
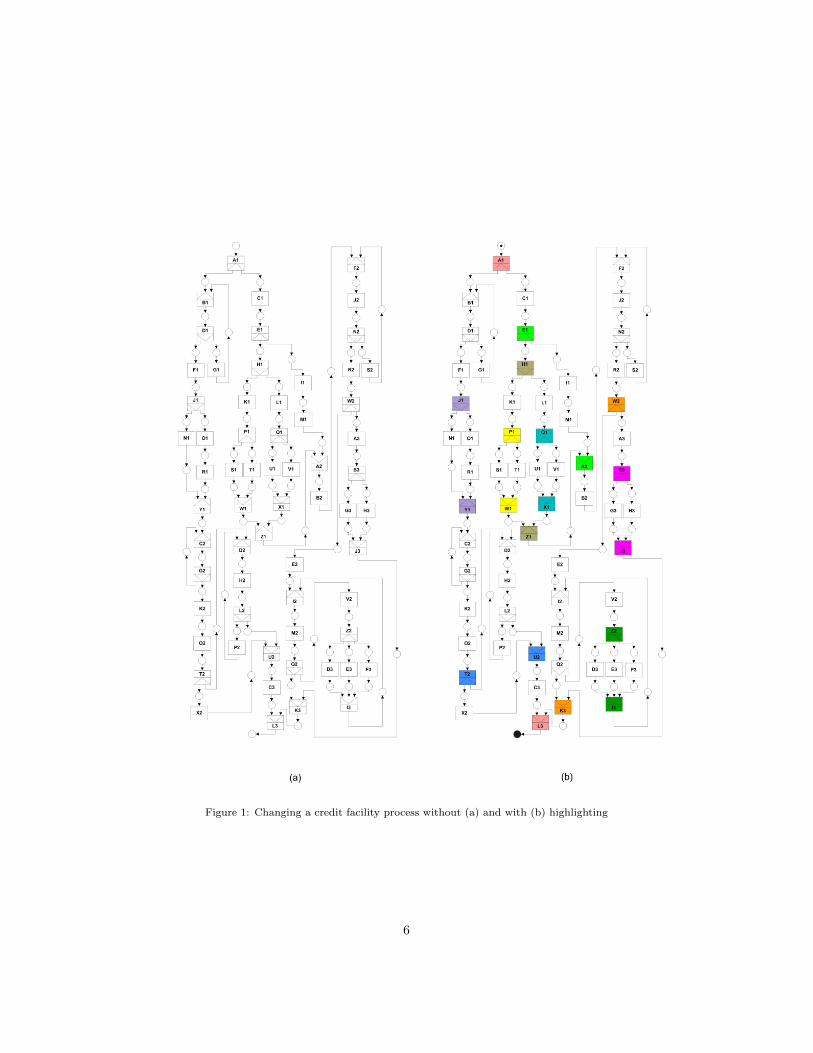
Figure 1: Changing a credit facility process without (a) and with (b) highlighting
6
carry out in IT systems. Sogeti professionals created a model for this process
to use it as a basis for discussion with bank employees on how to improve the
business process in question.
This process model is captured as a workflow net [58]. The model captures
63 different transitions representing business activities (also often referred to
tasks), 75 places indicating milestones in the process, and 157 arcs specifying the
paths along these elements. Also notable are the 30 operator transitions (XOR-
splits, XOR-joins, AND-splits and AND-joins), which capture how alternative
and concurrent paths are spawned off and joined again at different stages in the
process. A complex aspect of this model is that it is represented in a compact
form; the modelers wanted it to fit on a single sheet of A4 paper so that it
could be easily printed and reproduced. As a result, some arrows are running
bottom-up, which could easily be interpreted as iterations in the model while
this is not always so. For, example, the arrow from B2 to F2 simply indicates
sequential progress instead of a step back.
While the formal structures of both versions of the process model are the
same, there is a notable difference in the way how matching operator transitions
are highlighted. Cognitive research into program comprehension has coined the
terms primary notation and secondary notation to describe this phenomenon.
The modeling notation as a formal set of symbols is defined as primary notation.
Primary notation specifies the semantics of all graphical elements of a particular
notation, such as Petri nets. This primary notation of Petri nets is defined using
particular shapes for the different syntax elements. In the model with highlight-
ing, it can be seen that some sets of operator transitions have received the same
color, for example E1 and A2 that are both highlighted in green. Transition
operator E1 – an AND-split – signifies that two concurrent paths are initiated
after its execution, one of them starting with transition H1, the other with tran-
sition I1. By enriching the process model with information beyond the formal
notation (e.g. color, line strength, etc.), the reader may access the information
captured in the model with a differing degree of ease [50]. Visual cues, which
are not part of a notation, are known as secondary notation [51]. These visual
7
cues have a twofold advantage. First, they help to identify a decomposition of
the process model into components, which provides for information hiding when
the overall behavior of the process model is analyzed. Second, the usage of color
helps to interpret secondary notation quickly, as color can be processed by the
human visual system much faster than for instance shape [36]. These facts
should result in better comprehension performance, which is typically measured
in terms of accuracy and efficiency [7, 21]. Therefore, we formulate the following
hypotheses in relation to accuracy and efficiency of comprehension.
H1 The use of colors to highlight matching operator transitions will have a
significant positive impact on understanding accuracy.
H2 The use of colors to highlight matching operator transitions will have a
significant positive impact on understanding speed.
2.2. Highlighting, understanding, and expertise
Prior research has shown that users tend to have serious problems with un-
derstanding how different operator transitions interplay and which ones belong
together. It comes as no surprise that model readers with different character-
istics face understanding problems to a different extent. For instance, it has
been observed that readers with a solid background in Petri net concepts [41]
and theoretical concepts of process models altogether [43] show a much bet-
ter understanding performance than others. Also, other personal factors like
the duration and intensity of process modeling experience have been identified
as factors of process model understanding in prior research [52]. Altogether,
modeler expertise is a critical issue for process modeling projects [3].
Archetypically, novices and experts in process modeling can be distinguished.
The notion of expertise has been related to different aspects. As an adaptation
of [10, 16], we can state that it is established by “the amount and complex-
ity of knowledge gained through extensive experience of activities” in process
modeling [16] or by acquiring “vast amounts of knowledge and the ability to
perform pattern-based retrieval” related to process models [10]. The difference
8
between novices and experts in process model comprehension can be explained
based on the Adaptive Control of Thought architecture proposed by Ander-
son [2]. According to this architecture, the human working memory interacts
with declarative and production memory, which both the latter have distinct
features. While declarative memory stores and provides access to facts that we
explicitly know, the production memory holds rules of interference, which can be
used in problem solving. The production memory of an expert contains a much
richer set of production rules than the one of a novice. In relation to process
models, an expert would likely know productions that help to hide information,
for instance, to ignore components when interpreting the overall behaviour of
a process model. While both novices and experts will presumably benefit from
color highlighting, it is likely that their differences in production memory will
result to a difference in the extent of this effect. Both an unhighlighted and
a highlighted process model are informationally equivalent, i.e. they capture
the same information on a process [34, 56]. On the other hand, they are not
computational equivalent because they differ in the ease with which informa-
tion can be deducted from them. For a novice, this computational benefit is
great as a novice lacks suitable production rules to inspect a process model.
For an expert, the computational improvement is smaller which she possesses
production rules to manage the complexity of a process model. Therefore, it
is not a surprise that expert modelers have been observed to focus on relevant
graphical elements, recognize patterns and disregard irrelevant information [50],
while novices tend to lack reading and search strategies, which result from mod-
eling experience and extensive learning. As a result, we expect highlighting of
matching nodes in a process model to be a significant aid for novices to read
the models and their control flow semantics. Experts, in turn, can much easier
identify patterns of matching operator transitions, a skill that is also referred to
as perceptual expertise [25]. Accordingly, the highlighting support helps them
to identify patterns faster they already know, which is of less value to them
in comparison to novices. As a consequence, their performance increase should
be less strong in comparison to novices. Therefore, we formulate the following
9

hypotheses:
H3 The highlighting of matching operator transitions will have a significant
positive impact on understanding accuracy for novices.
H4 The highlighting of matching operator transitions will have a significant
positive impact on understanding speed for novices.
H5 The highlighting of matching operator transitions will have a significant
positive impact on understanding accuracy for experts.
H6 The highlighting of matching operator transitions will have a significant
positive impact on understanding speed for experts.
H7 The highlighting of matching operator transitions will be more significant
for understanding accuracy of novices than of experts.
H8 The highlighting of matching operator transitions will be more significant
for understanding speed of novices than of experts.
Before we can evaluate these hypotheses, we first have to explicitly define how
the syntax highlighting approach for process models can work. This is the
subject of the next section.
3. A Formal Approach to Syntax Highlighting
In this section we formalize a formal approach to highlighting matching entry
and exit nodes in nets that are inspired by so-called workflow nets. Section 3.1
defines some Petri net concepts, which are an important basis for the notion
of workflow nets. Section 3.2 presents the highlighting approach as we have
implemented it in WoPeD.
3.1. Petri Nets and Workflow Nets
A Petri net N = (P, T, F ) is a directed, bipartite graph where P is a set of
nodes called places, T a set of nodes called transitions and F ⊆ (P×T )∪(T×P )
10
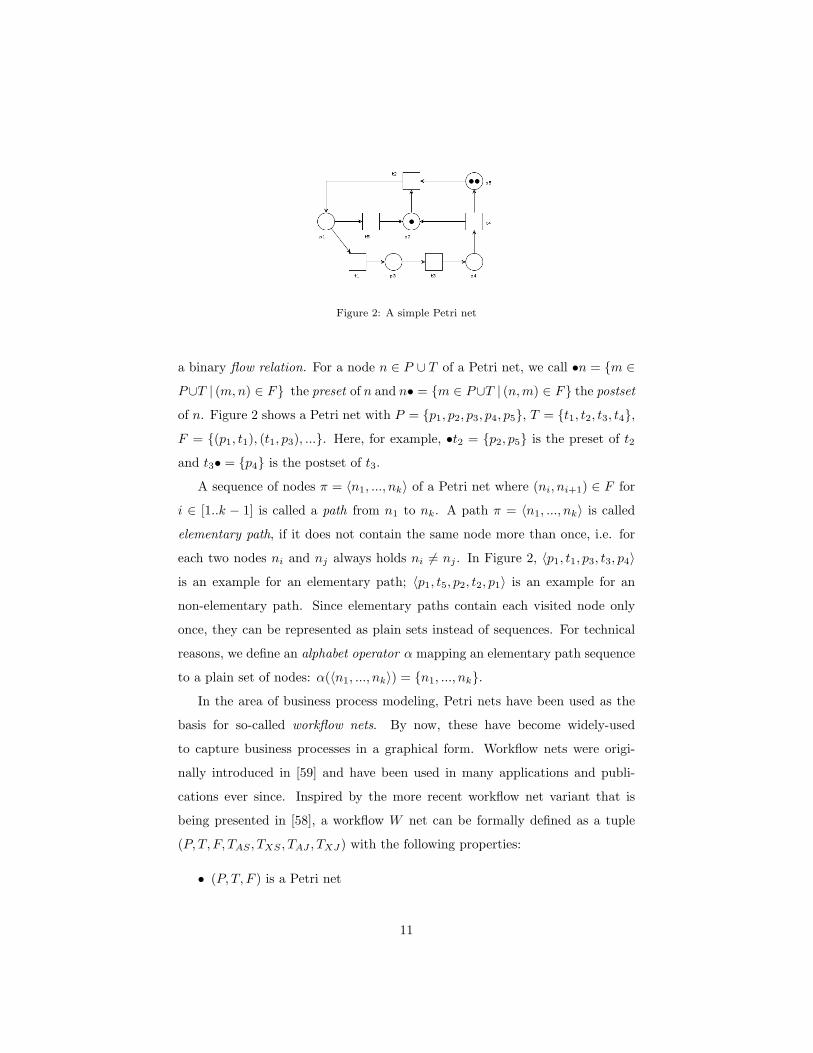
Figure 2: A simple Petri net
a binary flow relation. For a node n ∈ P ∪ T of a Petri net, we call •n = {m ∈
P∪T | (m,n) ∈ F} the preset of n and n• = {m ∈ P∪T | (n,m) ∈ F} the postset
of n. Figure 2 shows a Petri net with P = {p1, p2, p3, p4, p5}, T = {t1, t2, t3, t4},
F = {(p1, t1), (t1, p3), ...}. Here, for example, •t2 = {p2, p5} is the preset of t2
and t3• = {p4} is the postset of t3.
A sequence of nodes π = 〈n1, ..., nk〉 of a Petri net where (ni, ni+1) ∈ F for
i ∈ [1..k − 1] is called a path from n1 to nk. A path π = 〈n1, ..., nk〉 is called
elementary path, if it does not contain the same node more than once, i.e. for
each two nodes ni and nj always holds ni 6= nj . In Figure 2, 〈p1, t1, p3, t3, p4〉
is an example for an elementary path; 〈p1, t5, p2, t2, p1〉 is an example for an
non-elementary path. Since elementary paths contain each visited node only
once, they can be represented as plain sets instead of sequences. For technical
reasons, we define an alphabet operator α mapping an elementary path sequence
to a plain set of nodes: α(〈n1, ..., nk〉) = {n1, ..., nk}.
In the area of business process modeling, Petri nets have been used as the
basis for so-called workflow nets. By now, these have become widely-used
to capture business processes in a graphical form. Workflow nets were origi-
nally introduced in [59] and have been used in many applications and publi-
cations ever since. Inspired by the more recent workflow net variant that is
being presented in [58], a workflow W net can be formally defined as a tuple
(P, T, F, TAS , TXS , TAJ , TXJ) with the following properties:
• (P, T, F ) is a Petri net
11
• TAS ⊆ T , TXS ⊆ T , TAJ ⊆ T, TXJ ⊆ T are mutually disjoint sets of
operator transitions called AND-split, XOR-split, AND-join and XOR-
join transitions respectively
• |{p ∈ P : •p = ∅}| = 1, i.e. there exists exactly one place with empty
preset (called the source place, usually denoted by i)
• |{p ∈ P : p• = ∅}| = 1, i.e. there exists exactly one place with empty
postset (called the sink place, usually denoted by o)
• ∀t ∈ T : | • t| > 0 ∧ |t • | > 0, i.e. all transitions have a non-empty preset
as well as a non-empty postset
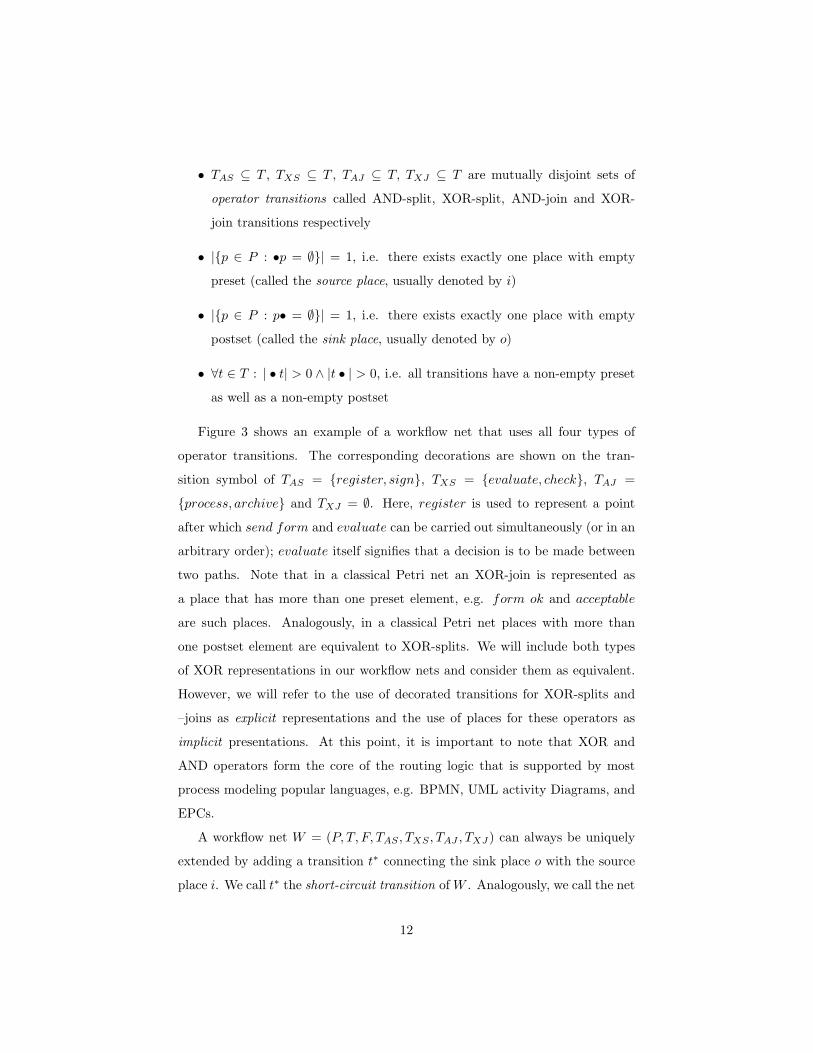
Figure 3 shows an example of a workflow net that uses all four types of
operator transitions. The corresponding decorations are shown on the tran-
sition symbol of TAS = {register, sign}, TXS = {evaluate, check}, TAJ =
{process, archive} and TXJ = ∅. Here, register is used to represent a point
after which send form and evaluate can be carried out simultaneously (or in an
arbitrary order); evaluate itself signifies that a decision is to be made between
two paths. Note that in a classical Petri net an XOR-join is represented as
a place that has more than one preset element, e.g. form ok and acceptable
are such places. Analogously, in a classical Petri net places with more than
one postset element are equivalent to XOR-splits. We will include both types
of XOR representations in our workflow nets and consider them as equivalent.
However, we will refer to the use of decorated transitions for XOR-splits and
–joins as explicit representations and the use of places for these operators as
implicit presentations. At this point, it is important to note that XOR and
AND operators form the core of the routing logic that is supported by most
process modeling popular languages, e.g. BPMN, UML activity Diagrams, and
EPCs.
A workflow net W = (P, T, F, TAS , TXS , TAJ , TXJ) can always be uniquely
extended by adding a transition t∗ connecting the sink place o with the source
place i. We call t∗ the short-circuit transition of W . Analogously, we call the net
12
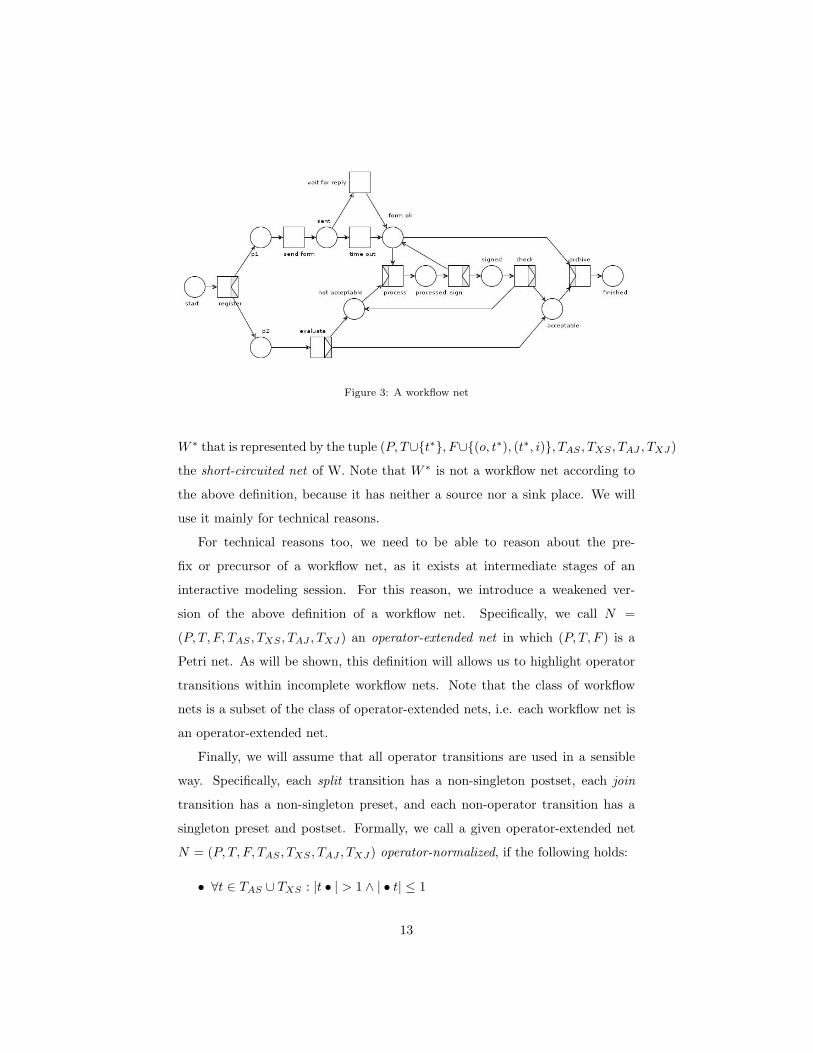
Figure 3: A workflow net
W ∗ that is represented by the tuple (P, T∪{t∗}, F∪{(o, t∗), (t∗, i)}, TAS , TXS , TAJ , TXJ)
the short-circuited net of W. Note that W ∗ is not a workflow net according to
the above definition, because it has neither a source nor a sink place. We will
use it mainly for technical reasons.
For technical reasons too, we need to be able to reason about the pre-
fix or precursor of a workflow net, as it exists at intermediate stages of an
interactive modeling session. For this reason, we introduce a weakened ver-
sion of the above definition of a workflow net. Specifically, we call N =
(P, T, F, TAS , TXS , TAJ , TXJ) an operator-extended net in which (P, T, F ) is a
Petri net. As will be shown, this definition will allows us to highlight operator
transitions within incomplete workflow nets. Note that the class of workflow
nets is a subset of the class of operator-extended nets, i.e. each workflow net is
an operator-extended net.
Finally, we will assume that all operator transitions are used in a sensible
way. Specifically, each split transition has a non-singleton postset, each join
transition has a non-singleton preset, and each non-operator transition has a
singleton preset and postset. Formally, we call a given operator-extended net
N = (P, T, F, TAS , TXS , TAJ , TXJ) operator-normalized, if the following holds:
• ∀t ∈ TAS ∪ TXS : |t • | > 1 ∧ | • t| ≤ 1
13
• ∀t ∈ TAJ ∪ TXJ : | • t| > 1 ∧ |t • | ≤ 1
• ∀t ∈ T \ (TAS ∪ TAJ ∪ TXS ∪ TXJ) : |t • | ≤ 1 ∧ | • t| ≤ 1
We are now able to more formally express the notion of matching operator
pairs that we aim to highlight as a way to improve the comprehension of the
overall model. Our definition is a generalization of the concept of PT/TP-
handles [18]:
In an operator-extended net N = (P, T, F, TAS , TXS , TAJ , TXJ), a pair of
nodes (n1, nk) ∈ (P ∪ T )× (P ∪ T ) is called a matching operator pair iff
• n1 ∈ TAS and nk ∈ TAJ or n1 ∈ P ∪ TXS and nk ∈ P ∪ TXJ
• there are at least two elementary paths π1 and π2 leading from n1 to nk
with α(π1) ∩ α(π2) = {n1,nk}
The intuition behind this definition is that if two or more different paths
connect two nodes then these nodes signify the start and end of a noteworthy
sub-component of the overall routing logic. Note that the notion of matching
operator pairs is not restricted to nets that are completely or even highly block-
structured. In the next section, we will focus on the implementation of the idea
to highlight matching operator pairs.
3.2. Implementation in WoPeD
WoPeD2 is a Java-based open source tool supporting the modeling of plain
Petri nets as well as that of workflow nets. Several publications have accom-
panied the emerging development, e.g. [13, 14]. In the most recent release,
the highlighting of matching operator pairs is supported as a switchable option.
If enabled, the current editor content is constantly monitored for user-inflicted
changes by executing a detection algorithm assigning each matching operator
pair a distinguishable color from a predefined palette.
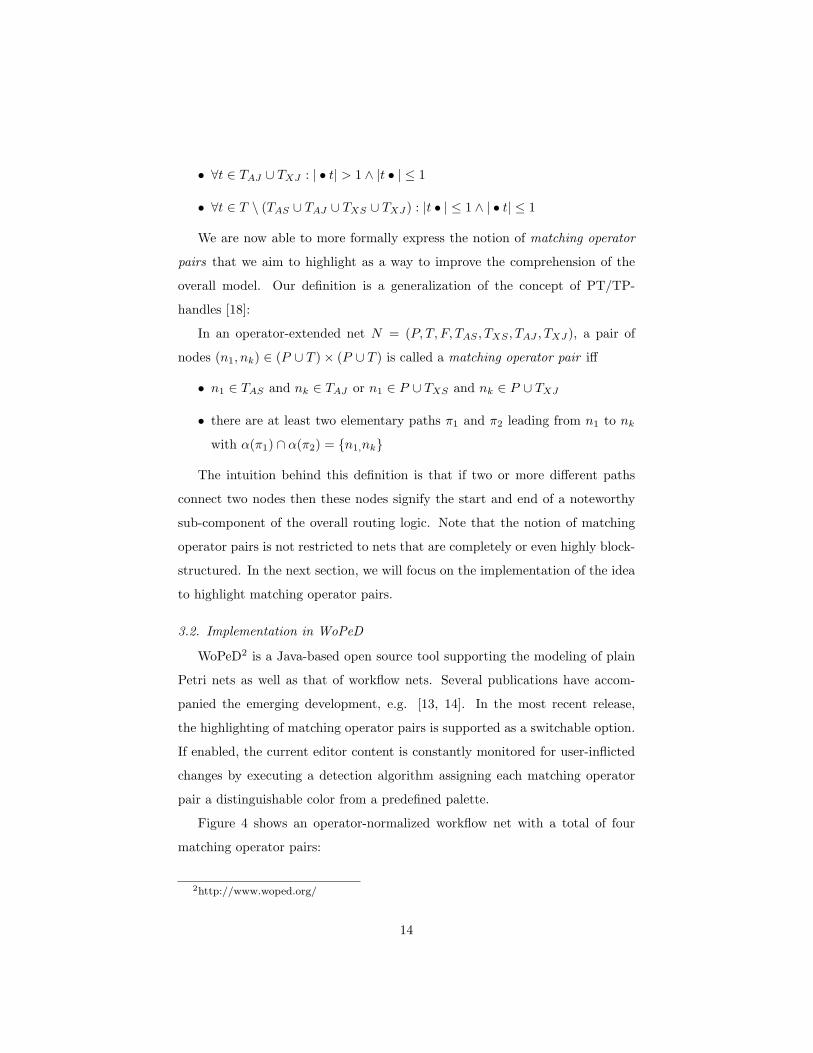
Figure 4 shows an operator-normalized workflow net with a total of four
matching operator pairs:
2http://www.woped.org/
14
Figure 4: Highlighted matching operator pairs
• (t1, t6) is an AND-split/AND-join pair (red)
• (t2, t3) is an explicit XOR-split/explicit XOR-join pair (yellow)
• (p5, t5) is an implicit XOR-split/explicit XOR-join pair (green)
• (p11, p7) is an implicit XOR-split/ implicit XOR-join pair (magenta)
Note that for determining the colors it is not necessary that the editor con-
tains a workflow net; an operator-extended net will be sufficient. For simplicity
and without loss of generality, we additionally assume that nets are operator-
normalized, i.e. all operators have a “sensible” branching context. Under this
assumption, the set of candidate pairs to be considered as potentially matching
operators can be restricted to pairs (x, y) where either (1) x is an XOR-split
(or a place with a non-singleton postset) and y an XOR-join (or a place with a
non-singleton preset) or (2) x an AND-split and y an AND-join. Additionally, if
the current editor content is detected to conform to the properties of a workflow
net, the short-circuited version of the net is considered to find additional pairs
of matching operators. For example, (p11, p7) in Figure 4 can only be detected
by considering the short-circuited version of the net. Note that as long as the
15
net under construction is not a workflow net, the detection of matching operator
pairs is not necessarily complete yet all detected pairs are indeed matches.
Each candidate pair of nodes is checked for being a matching operator pair
by applying the Ford and Fulkerson max-flow-min-cut algorithm [19]. This
algorithm can be used to determine the maximum flow in a flow network between
its source and sink. Our implementation applies this algorithm in the context of
an operator-extended net by considering for each candidate pair its first (split)
element as a source and its second (join) element as a sink. Furthermore, the
maximum capacity for each edge is set to 1 and the direction of each edge
determines the flow direction. If the max-flow-min-cut algorithm establishes
that the maximum flow between the two elements of a candidate pair exceeds 1
then this indicates a minimum of two different elementary paths between them.
In other words, in such a case a matching operator pair is found. In the example
of Figure 4, the maximum flow between p5 and t5 is exactly two since there is a
capacity of 1 along the path 〈p5, t8, p6, t5〉 and an additional capacity of 1 along
path 〈p5, t9, p7, t11, p11, t5〉.
Our implementation of the max-flow-min-cut algorithm is derived from the
one introduced in [29], with the modification to select nodes based on breadth-
first-search [15]. With this modification, our algorithm has a complexity of
O(|D ∪D′||A|2). The complete algorithm executes the max-flow-min-cut algo-
rithm |(P ∪ T ) × (P ∪ T )| times and therefore runs in polynomial time with
O(|(P ∪ T )|3|F |2).
At this point, it should be considered that the membership of a node as
an element of a matching operator pair is not exclusive. Pairs of matching
operators may exist that overlap, in the sense that they share common nodes.
Since only a single color can be assigned to each node at a time, it appears
sensible to color all overlapping pairs of matching operators in the same color.
To establish a common highlighting of overlapping operator pairs, a “clustering”
is implemented as shown in Algorithm 1.
To illustrate this algorithm, we start with the example set of matching op-
erator pairs (t1, t6), (t2, t3), (p5, t5), (t8, t6), (p11, p7) for the workflow net in
16

Algorithm 1 Computation of matching operator clustersLet OpC ⊆ P(P ∪ T ) be a set of sets where each element is the set represen-
tation of a matching operator pair (i.e. each pair (x, y) is contained as a set
{x, y})
while ∃op1, op2 ∈ OpC : op1 6= op2 ∧ op1 ∩ op2 6= ∅ do
op := op1 ∪ op2
OpC := Op\{op1, op2} ∪ {op}
end while
return OpC
Figure 5. The conversion to a set of sets yields:
OpC = {{t1, t6}, {t2, t3}, {p5, t5}, {t8, t6}, {p11, p7}}. In the first iteration, {t1, t6}
and {t8, t6} are combined into {t1, t6, t8}. After the separate elements have been
removed and the combined set is added, no overlapping elements are left in OpC .
Each of the remaining elements is OpC is now a cluster of the underlying net.
All elements in a cluster will be assigned with the same color. As can be seen
in Figure 5, indeed, t1, t6, and t8 are colored the same. The color palette itself
can be created via a settings dialog and configured by the user with individually
chosen color values, as can be seen too in Figure 5.
Note how this workflow net in Figure 5 is a slightly extended version of the
block-structured net that is shown in in Figure 4: Transition t8 is turned into an
AND-split and an additional place p15 is added between transitions t8 and t6.
As such, this example also illustrates how the coloring approach is applicable
to both block-structured and non-block-structured nets.
4. Research Method
We set up an experiment to investigate the effectiveness of our proposed high-
lighting approach by testing the hypotheses of Section 2. Section 4.1 presents
our research design and a description of how the experiment was conducted.
Section 4.2 summarizes the results of the experiment.
17
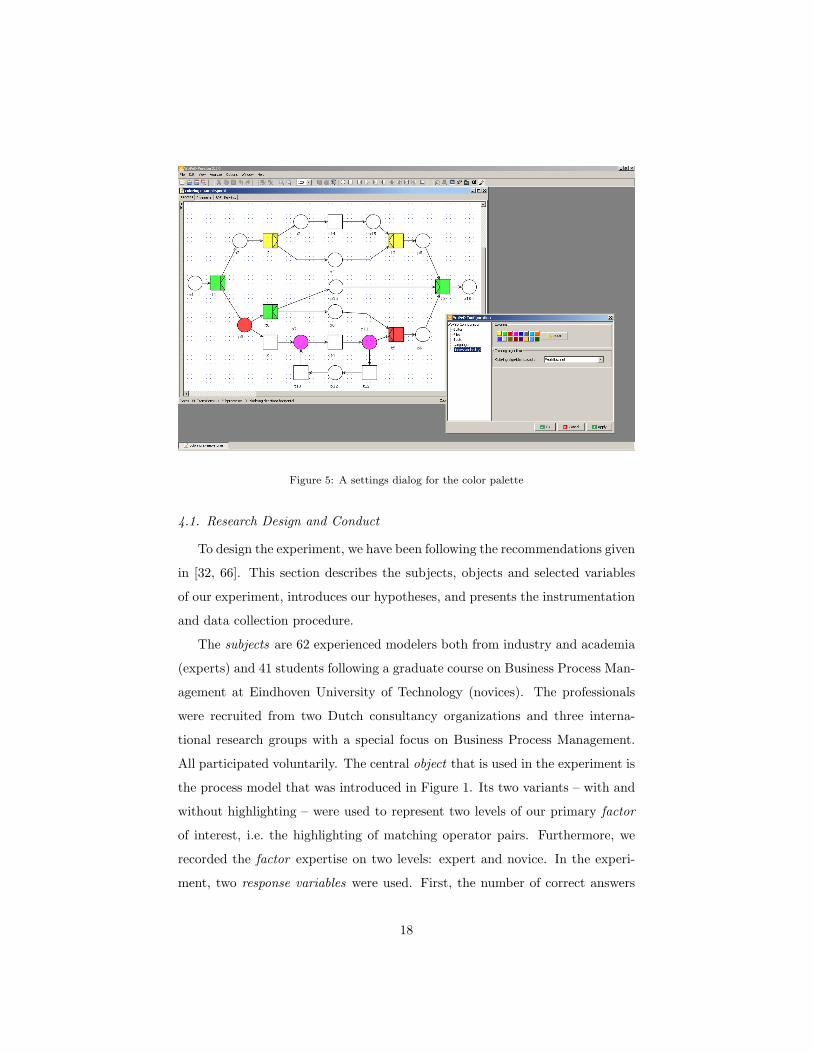
Figure 5: A settings dialog for the color palette
4.1. Research Design and Conduct
To design the experiment, we have been following the recommendations given
in [32, 66]. This section describes the subjects, objects and selected variables
of our experiment, introduces our hypotheses, and presents the instrumentation
and data collection procedure.
The subjects are 62 experienced modelers both from industry and academia
(experts) and 41 students following a graduate course on Business Process Man-
agement at Eindhoven University of Technology (novices). The professionals
were recruited from two Dutch consultancy organizations and three interna-
tional research groups with a special focus on Business Process Management.
All participated voluntarily. The central object that is used in the experiment is
the process model that was introduced in Figure 1. Its two variants – with and
without highlighting – were used to represent two levels of our primary factor
of interest, i.e. the highlighting of matching operator pairs. Furthermore, we
recorded the factor expertise on two levels: expert and novice. In the experi-
ment, two response variables were used. First, the number of correct answers
18

to a set of closed questions was used as the indicator of understanding accuracy.
The time that was taken by the respondents to answer this set questions is the
second response variable, indicating the understanding speed.
To investigate the hypotheses of Section 2, an on-line instrument was de-
veloped to conduct a self-administered experiment. The instrument was devel-
oped with PHP 5.1.4 and JavaScript and ran on an Apache Web Server hosted
at Eindhoven University of Technology. The instrument leads the participant
through three successive parts:
1. Introduction: In this first part, the purpose of the experiment is explained
as well as the expected effort to complete it. Furthermore, an explanation
of the workflow net notation is provided. Finally, it is explained that par-
ticipants are expected to answer the questions accurately and as fast as
possible.
2. Demographic information: The participant is requested to provide informa-
tion on her background, experience with process modeling, and familiarity
with the workflow net notation.
3. Experiment: Depending on a random draw, the respondent is assigned
with an equal probability to either the model with or without highlighting
support. In total, a set of nine questions is provided one after another to
the respondent. Questions could not be skipped. At all times, a legend
with an explanation on the workflow net notation is visible.
The screenshot in Figure 6 gives an impression of the look and feel of the
instrument.
The closed questions from one of our previous experiments [41] were used in
this experiment. An analysis of these questions and the data obtained in that
work provided a value of 0.675 for Cronbach’s alpha. This can be considered as
an acceptable indication for internal consistency, for example when compared
with other empirical research in the context of business process oriented research
[28]. The questions cover issues with respect to:
• concurrency, e.g. “Can tasks A and B be be executed at the same time
19
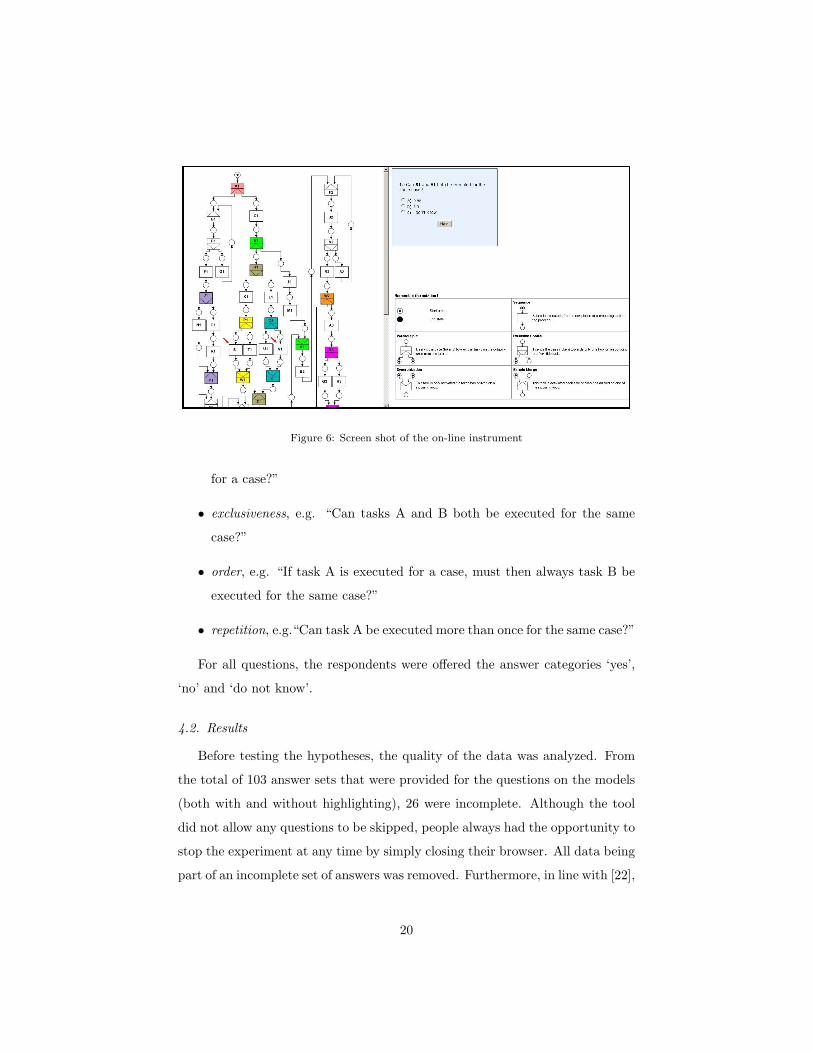
Figure 6: Screen shot of the on-line instrument
for a case?”
• exclusiveness, e.g. “Can tasks A and B both be executed for the same
case?”
• order, e.g. “If task A is executed for a case, must then always task B be
executed for the same case?”
• repetition, e.g.“Can task A be executed more than once for the same case?”
For all questions, the respondents were offered the answer categories ‘yes’,
‘no’ and ‘do not know’.
4.2. Results
Before testing the hypotheses, the quality of the data was analyzed. From
the total of 103 answer sets that were provided for the questions on the models
(both with and without highlighting), 26 were incomplete. Although the tool
did not allow any questions to be skipped, people always had the opportunity to
stop the experiment at any time by simply closing their browser. All data being
part of an incomplete set of answers was removed. Furthermore, in line with [22],
20
With highlighting With highlighting Without highlightingWithout highlighting
Figure 7: Boxplots for understanding accuracy (number of correct answers) and understanding
speed (time)
quality checking was applied to the data. We expected expert modelers to be
able to at least correctly answer 5 out of 9 questions (55%) and novices at least
4 out of 9 questions (44%). Results below these thresholds were considered to
reflect a serious lack of knowledge and/or commitment. As a result, 7 additional
answer sets had to be removed. The latter is a relatively small number, which
is an indication for the overall high quality of the raw data. In total, 70 answer
sets were taken into account for the data analysis (= 103− (26 + 7)).
General Effect of Highlighting: The 70 answer sets were explored for
the response variables of interest, understanding accuracy and understanding
speed. The subjects on average provided 7.21 correct answers for the total of
9 questions (80%) with a minimum of 5 and a maximum of 9. On average,
it took respondents a little over 10 minutes to answer the questions, with a
minimum of approximately 4 minutes and a maximum of approximately 34
minutes. Application of the Kolmogorov-Smirnov test [57] indicated that the
distributions for both variables differ significantly from the normal distribution,
which may be due to the limited size of the data set. Box plots that show the
distribution of the response variables, differentiating between the factor levels
with and without highlighting, are provided in Figure 7.
Inspection of the box plots does not point at understanding speed being af-
fected strongly by highlighting, i.e. the medians and distributions are quite
21
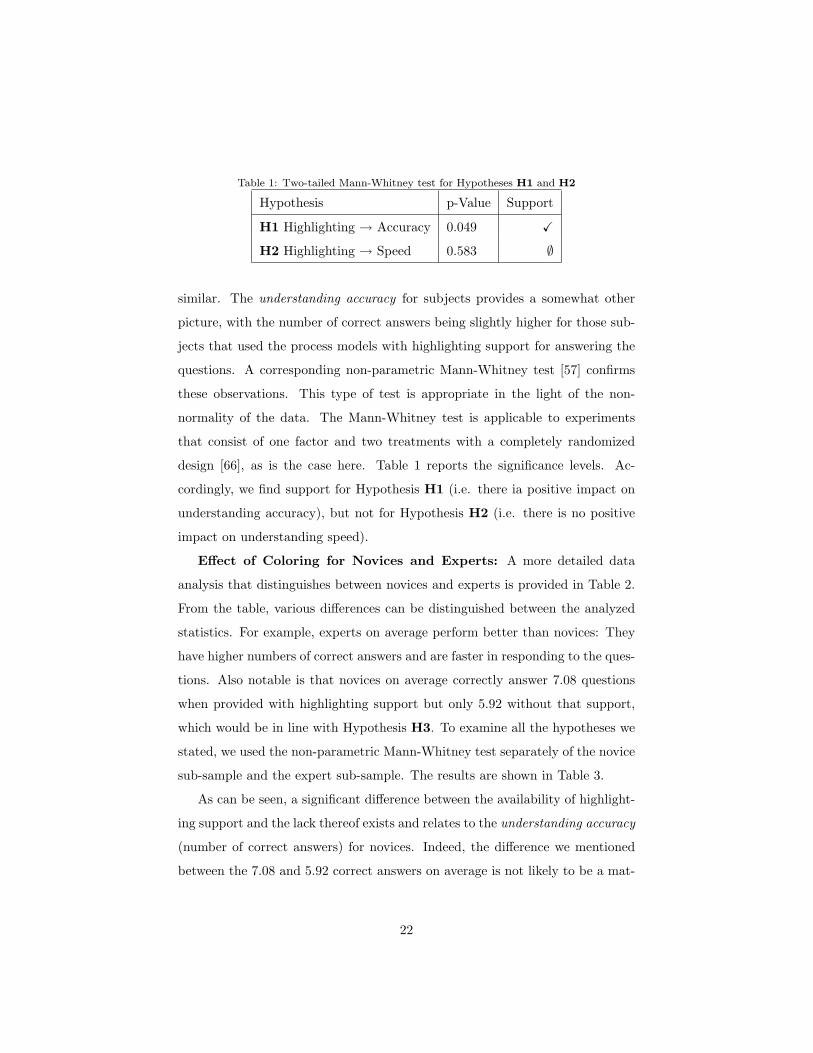
Table 1: Two-tailed Mann-Whitney test for Hypotheses H1 and H2
Hypothesis p-Value Support
H1 Highlighting → Accuracy 0.049 X
H2 Highlighting → Speed 0.583 ∅
similar. The understanding accuracy for subjects provides a somewhat other
picture, with the number of correct answers being slightly higher for those sub-
jects that used the process models with highlighting support for answering the
questions. A corresponding non-parametric Mann-Whitney test [57] confirms
these observations. This type of test is appropriate in the light of the non-
normality of the data. The Mann-Whitney test is applicable to experiments
that consist of one factor and two treatments with a completely randomized
design [66], as is the case here. Table 1 reports the significance levels. Ac-
cordingly, we find support for Hypothesis H1 (i.e. there ia positive impact on
understanding accuracy), but not for Hypothesis H2 (i.e. there is no positive
impact on understanding speed).
Effect of Coloring for Novices and Experts: A more detailed data
analysis that distinguishes between novices and experts is provided in Table 2.
From the table, various differences can be distinguished between the analyzed
statistics. For example, experts on average perform better than novices: They
have higher numbers of correct answers and are faster in responding to the ques-
tions. Also notable is that novices on average correctly answer 7.08 questions
when provided with highlighting support but only 5.92 without that support,
which would be in line with Hypothesis H3. To examine all the hypotheses we
stated, we used the non-parametric Mann-Whitney test separately of the novice
sub-sample and the expert sub-sample. The results are shown in Table 3.
As can be seen, a significant difference between the availability of highlight-
ing support and the lack thereof exists and relates to the understanding accuracy
(number of correct answers) for novices. Indeed, the difference we mentioned
between the 7.08 and 5.92 correct answers on average is not likely to be a mat-
22

Table 2: Descriptive statistics for understanding accuracy (number of correct answers) and
understanding speed (time)
Novices Experts
With Without With Without
Statistics highlighting highlighting highlighting highlighting
Number of N 13 13 18 26
Correct Answers Mean 7.08 5.92 7.89 7.46
Median 7.00 6.00 8.00 7.50
Std. Dev. 1.188 .954 1.231 1.140
Skewness -.524 .854 -1.041 -.161
Kurtosis -.105 .221 0.289 -.697
Time (minutes) N 13 13 18 26
Mean 102.680 115.449 98.796 96.231
Median 79.333 99.167 87.083 81.917
Std. Dev. 795.681 486.906 445.450 536.402
Skewness 2.587 .694 1.471 2.251
Kurtosis 7.621 .224 1.606 4.683
Table 3: Two-tailed Mann-Whitney test for Hypotheses H3 to H8
Hypothesis p-Value Support
H3 Highlighting → Accuracy of Novices 0.017 X
H4 Highlighting → Speed of Novices 0.139 ∅
H5 Highlighting → Accuracy of Experts 0.184 ∅
H6 Highlighting → Speed of Experts 0.535 ∅
H7 Accuracy of Novices << Accuracy of Experts 0.017 << 0.184 X
H8 Speed of Novices << Speed of Experts 0.184 << 0.535 X
23

ter of chance. In other words, whether a novice model reader is considering
a process model with or without highlighting will make a significant difference
in terms of her understanding accuracy. In fact, that accuracy is then higher.
The understanding speed for novices, however, does not differ significantly. Fur-
thermore, highlighting is not a distinguishing factor for the performance of the
experts.
In summary, we find support for the general benefit of highlighting for the
understanding accuracy (H1), in particular for novices (H3). The effect is not
significant for experts though (H5). Effects on understanding speed appear to
be negligible (H2, H4, H6). Still, novices appear to benefit more than experts
in terms of both understanding accuracy and understanding speed (H7-H8).
5. Discussions and Implications
In this section we discuss the results and the implications of our research.
5.1. Discussion of Results
The results of the experiment have to be interpreted in terms of significance
and strength of the noted effect. Furthermore, our distinction between novices
and experts has to be reflected upon.
Personal factors have been identified as factors of process model understand-
ing in prior research [41, 43, 52]. In this experiment we considered a classification
of novices and experts based on participants being students or professionals (ei-
ther from academia or industry). In general, the distinction between novices
and experts is not so straight-forward and related to notions that are difficult
to measure, like “the amount and complexity of knowledge gained through ex-
tensive experience of activities in a domain” [16] or “the result of acquiring [. . . ]
vast amounts of knowledge and the ability to perform pattern-based retrieval”
[10]. Furthermore, it is important to notice that task-specific experience is often
a better predictor of performance than expertise in general [6]. The fact that the
mean values in our experiment are conclusive supports the appropriateness of
24
our classification: experts without highlighting are still faster and more accurate
than novices with highlighting in Table 2.
The experiment showed that the highlighting was of greatest benefit to the
accuracy of novices, such that it was the single significant effect. This observa-
tion is in line with research that establishes modeler expertise as a critical issue
for process modeling projects [3]. Petre observed in her research on secondary
notation that novices tend to lack reading and search strategies which result
from modeling experience and extensive learning [50]. Syntax highlighting in
our experiment is a significant aid for novices to read the models and their con-
trol flow semantics. Therefore, it is no surprise that their performance in terms
of accuracy is improved. Experts, in turn, can much easier identify patterns of
matching operator transitions, a skill that is also referred to as perceptual ex-
pertise [25]. Accordingly, the highlighting helps them to identify patterns they
already know. As a consequence, the performance increase is too small to be
significant in our experiment.
It is arguable that the effect of highlighting on performance of both experts
and novices might have been stronger if the models had been more complex. It
is well known from prior research that more complex models are more difficult
to understand [38, 41]. Several metrics have been proposed to measure different
dimensions of complexity of a process model, e.g. in [1, 8, 9, 35, 38, 44, 47, 48,
62]. The models we used in the experiment are fairly structured such that a split
operator most often has a direct join counterpart. Such structured models are
rather easy to understand for experts. The highlighting effect might have been
more effective also for experts if the models had been more unstructured. The
reader may recall that, indeed, the identification of matching operator pairs is
also possible in unstructured nets. Additionally, it might be argued that models
need to be much larger before highlighting starts to have a significant effect on
experts’ performance.
5.2. Implications
The experiment and the results have implications for research and practice.
25
With this work we have shown the potential of secondary notation to improve
process model understanding. We have focussed on the highlighting of matching
operator pairs. Further research is needed to investigate the effect of other
types of secondary notation. In particular, techniques from automatic graph
drawing have been discussed regarding their support of understanding, e.g. in
[65]. A dedicated discussion of automatic layouting of process models and their
benefit to comprehension is missing so far. For such a research endeavor it
is important to consider modeling expertise and its interplay with secondary
notation. While process modeling expertise has been considered by some studies
on process model comprehension [41, 43, 52], there is a need for further research
on establishing a more detailed foundation for this notion.
In this article, we also demonstrated the feasibility of automatic highlighting
both by providing a formalization and by an implementation within the Petri
net modeling tool WoPeD. The general concepts of our approach can be eas-
ily extended to other activity-oriented process modeling languages (e.g. UML
Activity Diagrams [17], EPCs [60], or BPMN [12]). Even for those languages
that do not directly build on token passing semantics, graph parsing techniques
can be used to define colors based on so-called single-entry-single-exit compo-
nents [31, 64]. Therefore, our highlighting approach can be directly included in
industry process modeling tools to improve process model comprehension.
6. Conclusion
This paper addresses the problem of how process model users can be better
supported in the sense-making of a model. We adapted the concept of syntax
highlighting from software engineering and applied it to workflow nets, a for-
malism that is frequently used for business process modeling. Our contribution
is a theoretical discussion of the benefits of such highlighting, a formalization
of the highlighting problem along with a prototypical implementation, and a
thorough experimental study on the effects of highlighting on comprehension
performance. Due to the structural and semantic similarities between workflow
26
nets and other process modeling languages, the results from this research can
be easily applied in other process modeling tools.
Our future work is in line with some of the open issues we already noted. We
plan to conduct further experiments to study the interaction of process model
complexity with the effects of highlighting. The assumption for this work could
be that highlighting benefits increase with an increase in model complexity. Be-
yond this, there are other types of secondary notation that we did not study in
this research. Specifically, we aim to investigate to which degree the compre-
hension of a process model can be improved by a good layout. Prior work in the
area of class diagrams suggest that comprehension would deteriorate with bad
layout [65]. The challenge in this context will be, among others, to operational-
ize the notion of a good layout for process models. Furthermore, we want to
explore the spectrum of visual parameters [46] that may be utilized to enhance
process model comprehension. More specifically, many popular process model-
ing notations include a range of symbols with a fixed graphical form without any
notable consideration of their cognitive discriminability. It would be interesting
to work on a “make over” of such notations to improve their use; the developers
of the YAWL modeling language [61], for example, have already expressed their
willingness to cooperate in such an endeavor. Finally, we also have an inter-
est in developing guidelines for process modelers with respect to the way they
structure their models. The work on seven process modeling guidelines that
we presented in [42] can be seen as a first step in that direction, which offers
considerable potential for extension.
References
[1] E. R. Aguilar, F. Garcıa, F. Ruiz, M. Piattini, An exploratory experiment
to validate measures for business process models, in: First International
Conference on Research Challenges in Information Science (RCIS), 2007,
pp. 271–280.
27
[2] J. Anderson, ACT: A simple theory of complex cognition, American Psy-
chologist 51 (4) (1996) 355–365.
[3] W. Bandara, Factors and measures of business process modelling: Model
building through a multiple case study, European Journal of Information
Systems 14 (2005) 347–360.
[4] J. Bertin, Semiology of Graphics, University of Wisconsin Press, 1983.
[5] A. F. Blackwell, Ten years of cognitive dimensions in visual languages and
computing: Guest editor’s introduction to special issue, Journal of Visual
Language and Computing 17 (4) (2006) 285–287.
[6] S. Bonner, N. Pennington, Cognitive processes and knowledge as determi-
nants of auditor expertise, Journal of Accounting Literature 10 (1) (1991)
1–50.
[7] A. Burton-Jones, Y. Wand, R. Weber, Guidelines for empirical evaluations
of conceptual modeling grammars, Journal of the Association for Informa-
tion Systems 10 (6) (2009) 495–532.
[8] G. Canfora, F. Garcıa, M. Piattini, F. Ruiz, C. Visaggio, A family of exper-
iments to validate metrics for software process models, Journal of Systems
and Software 77 (2) (2005) 113–129.
[9] J. Cardoso, Workflow Handbook 2005, chap. Evaluating Workflows and
Web Process Complexity, Future Strategies, Inc., Lighthouse Point, FL,
USA, 2005, pp. 284–290.
[10] W. Chase, H. Simon, The mind’s eye in chess, Visual Information Process-
ing 215 (1973) 215–281.
[11] I. Davies, P. Green, M. Rosemann, M. Indulska, S. Gallo, How do practi-
tioners use conceptual modeling in practice?, Data & Knowledge Engineer-
ing 58 (3) (2006) 358–380.
28
[12] R. M. Dijkman, M. Dumas, C. Ouyang, Semantics and analysis of busi-
ness process models in BPMN, Information & Software Technology 50 (12)
(2008) 1281–1294.
[13] A. Eckleder, T. Freytag, WoPeD 2.0 goes BPEL 2.0, in: N. Lohmann,
K. Wolf (eds.), Proceedings of the 15th German Workshop on Algorithms
and Tools for Petri Nets, AWPN 2008, Rostock, Germany, September 26–
27, 2008, vol. 380 of CEUR Workshop Proceedings, CEUR-WS.org, 2008,
pp. 75–80.
[14] A. Eckleder, T. Freytag, J. Mendling, H. A. Reijers, Realtime detection
and coloring of matching operator nodes in workflow nets, in: T. Freytag,
A. Eckleder (eds.), 16th German Workshop on Algorithms and Tools for
Petri Nets, AWPN 2009, Karlsruhe, Germany, September 25, 2009, Pro-
ceedings, vol. 501 of CEUR Workshop Proceedings, CEUR-WS.org, 2009,
pp. 56–61.
[15] J. Edmonds, R. M. Karp, Theoretical improvements in algorithmic effi-
ciency for network flow problems, Journal of the ACM 19 (2) (1972) 248–
264.
[16] K. Ericsson, A. Lehmann, Expert and exceptional performance: Evidence
of maximal adaptation to task constraints, Annual Review of Psychology
47 (1) (1996) 273–305.
[17] R. Eshuis, R. Wieringa, Tool support for verifying uml activity diagrams,
IEEE Transacyions on Software Engineering 30 (7) (2004) 437–447.
[18] J. Esparza, M. Silva, Circuits, handles, bridges and nets, in: G. Rozenberg
(ed.), Advances in Petri Nets 1990, vol. 483, 1990, pp. 210–242.
[19] L. R. Ford, D. R. Fulkerson, Maximal flow through a network, Canadian
Journal of Mathematics 8 (3) (1956) 399–404.
29
[20] P. Frederiks, T. Weide, Information modeling: The process and the required
competencies of its participants, Data & Knowledge Engineering 58 (1)
(2006) 4–20.
[21] A. Gemino, Y. Wand, A framework for empirical evaluation of conceptual
modeling techniques., Requirements Engineering 9 (4) (2004) 248–260.
[22] M. Genero, G. Poels, M. Piattini, Defining and validating metrics for assess-
ing the understandability of entity-relationship diagrams, Data and Knowl-
edge Engineering 64 (3) (2008) 534–557.
[23] T. Green, Cognitive dimensions of notations, in: A. Sutcliffe, L. Macaulay
(eds.), People and Computers V: Proceedings of the Fifth Conference of the
British Computer Society Human-Computer Interaction Specialist Group,
1989, pp. 443–460.
[24] T. Green, M. Petre, Usability analysis of visual programming environments:
A ‘cognitive dimensions’ framework, Journal of Visual Languages and Com-
puting 7 (2) (1996) 131–174.
[25] T. Green, W. Ribarsky, B. Fisher, Building and applying a human cognition
model for visual analytics, Information Visualization 8 (1) (2009) 1–13.
[26] A. Guceglioglu, O. Demirors, Using Software Quality Characteristics to
Measure Business Process Quality, in: Proc. BPM’05, Springer, 2005, pp.
374–379.
[27] D. Harel, On visual formalisms, Communications of the ACM 31 (5) (1988)
514–530.
[28] R. Hung, Business process management as competitive advantage: A re-
view and empirical study, Total Quality Management & Business Excel-
lence 17 (1) (2006) 21–40.
[29] T. Ihringer, Diskrete Mathematik, Heldermann, 2002.
30
[30] M. Indulska, J. Recker, M. Rosemann, P. Green, Process Modeling: Cur-
rent Issues and Future Challenges, in: Advanced Information Systems
Engineering-CAiSE, 2009, pp. 501–514.
[31] R. Johnson, D. Pearson, K. Pingali, The program structure tree: Com-
puting control regions in linear time, in: Proceedings of the ACM SIG-
PLAN’94 Conference on Programming Language Design and Implementa-
tion (PLDI), Orlando, Florida, June 20-24, 1994. SIGPLAN Notices 29(6),
1994, pp. 171–185.
[32] N. Juristo, A. M. Moreno, Basics of Software Engineering Experimentation,
Springer, 2001.
[33] M. Koubarakis, D. Plexousakis, A formal framework for business process
modelling and design, Information Systems 27 (5) (2002) 299–319.
[34] J. Larkin, H. Simon, Why a Diagram is (Sometimes) Worth Ten Thousand
Words**, Cognitive Science 11 (1) (1987) 65–100.
[35] G. Lee, J.-M. Yoon, An empirical study on the complexity metrics of Petri
nets, Microelectronics and Reliability 32 (3) (1992) 323–329.
[36] G. Lohse, A cognitive model for understanding graphical perception,
Human-Computer Interaction 8 (4) (1993) 353–388.
[37] J. Mackinlay, Automating the design of graphical presentations of relational
information, ACM Transactions on Graphics 5 (2) (1986) 110–141.
[38] J. Mendling, Metrics for Process Models: Empirical Foundations of Verifi-
cation, Error Prediction, and Guidelines for Correctness, vol. 6 of Lecture
Notes in Business Information Processing, Springer, 2008.
[39] J. Mendling, Empirical studies in process model verification, LNCS Trans-
actions on Petri Nets and Other Models of Concurrency II, Special Issue
on Concurrency in Process-Aware Information Systems 2 (2009) 208–224.
31
[40] J. Mendling, G. Neumann, W. Aalst, Understanding the occurrence of
errors in process models based on metrics, in: R. Meersman, Z. Tari (eds.),
OTM Conference 2007, Proceedings, Part I, vol. 4803 of Lecture Notes in
Computer Science, Springer, 2007, pp. 113–130.
[41] J. Mendling, H. A. Reijers, J. Cardoso, What makes process models under-
standable?, in: Proc. BPM’07, 2007, pp. 48–63.
[42] J. Mendling, H. A. Reijers, W. M. P. van der Aalst, Seven process modeling
guidelines (7PMG), Information and Software Technology 52 (2) (2009)
127–136.
[43] J. Mendling, M. Strembeck, Influence factors of understanding business
process models, in: W. Abramowicz, D. Fensel (eds.), Proc. of the 11th In-
ternational Conference on Business Information Systems (BIS 2008), vol. 7
of Lecture Notes in Business Information Processing, Springer-Verlag, 2008,
p. 142153.
[44] J. Mendling, H. M. W. Verbeek, B. F. van Dongen, W. M. P. van der
Aalst, G. Neumann, Detection and Prediction of Errors in EPCs of the
SAP Reference Model, Data & Knowledge Engineering 64 (1) (2008) 312–
329.
[45] C. Minkowitz, Formal process modelling, Information and Software Tech-
nology 35 (11) (1993) 659–667.
[46] D. Moody, The “physics” of notations: toward a scientific basis for con-
structing visual notations in software engineering, IEEE Transactions on
Software Engineering 35 (6) (2009) 756–779.
[47] S. Morasca, Measuring attributes of concurrent software specifications in
petri nets, in: METRICS ’99: Proceedings of the 6th International Sym-
posium on Software Metrics, IEEE Computer Society, Washington, DC,
USA, 1999, pp. 100–110.
32
[48] M. Nissen, Redesigning reengineering through measurement-driven infer-
ence, MIS Quarterly 22 (4) (1998) 509–534.
[49] D. Parnas, On the criteria for decomposing systems into modules, Commu-
nications of the ACM 15 (12) (1972) 1053–1058.
[50] M. Petre, Why looking isn’t always seeing: Readership skills and graphical
programming, Communications of the ACM 38 (6) (1995) 33–44.
[51] M. Petre, Cognitive dimensions ‘beyond the notation’, Journal of. Visual
Languages and Computing 17 (4) (2006) 292–301.
[52] J. Recker, A. Dreiling, Does it matter which process modelling language
we teach or use? An experimental study on understanding process mod-
elling languages without formal education, in: M. Toleman, A. Cater-Steel,
D. Roberts (eds.), 18th Australasian Conference on Information Systems,
The University of Southern Queensland, Toowoomba, Australia, 2007, pp.
356–366.
[53] H. A. Reijers, J. Mendling, Modularity in process models: Review and
effects, in: Proceedings of BPM 2008, Springer, 2008, pp. 20–35.
[54] M. Rosemann, Potential pitfalls of process modeling: Part a, Business Pro-
cess Management Journal 12 (2) (2006) 249–254.
[55] A.-W. Scheer, ARIS business process modelling, Springer Verlag, 2000.
[56] K. Siau, Informational and computational equivalence in comparing infor-
mation modeling methods, Journal of Database Management 15 (1) (2004)
73–86.
[57] S. Siegel, N. J. Castellan, Nonparametric Statistics for the Behavorial Sci-
ences, 2nd ed., McGraw Hill, 1988.
[58] W. M. P. van der Aalst, K. M. van Hee, Workflow management: Models,
methods, and systems, The MIT press, 2004.
33
[59] W. M. P. van der Aalst, The application of Petri nets to workflow manage-
ment, Journal of Circuits Systems and Computers 8 (1) (1998) 21–66.
[60] W. M. P. van der Aalst, Formalization and verification of event-driven
process chains, Information and Software Technology 41 (10) (1999) 639–
650.
[61] W. M. P. van der Aalst, A. H. M. ter Hofstede, YAWL: Yet Another Work-
flow Language, Information Systems 30 (4) (2005) 245–275.
[62] I. Vanderfeesten, H. A. Reijers, J. Mendling, W. M. P. van der Aalst,
J. Cardoso, On a Quest for Good Process Models: The Cross-Connectivity
Metric, Lecture Notes in Computer Science 5074 (2008) 480–494.
[63] I. Vanderfeesten, H. A. Reijers, W. M. P. van der Aalst, Evaluating work-
flow process designs using cohesion and coupling metrics, Computers in
Industry 59 (5) (2008) 420–437.
[64] J. Vanhatalo, H. Volzer, J. Koehler, The refined process structure tree,
Data Knowledge Engineering 68 (9) (2009) 793–818.
[65] C. Ware, H. C. Purchase, L. Colpoys, M. McGill, Cognitive measurements
of graph aesthetics, Information Visualization 1 (2) (2002) 103–110.
[66] C. Wohlin, R. Runeson, M. Halst, M. Ohlsson, B. Regnell, A. Wesslen,
Experimentation in Software Engineering: An Introduction, Kluwer, 2000.
34


![[H.a. Macleod] Thin-Film Optical Filters](https://img.pdfslide.us/doc/110x75/553ff9e8550346096e8b4989/ha-macleod-thin-film-optical-filters.jpg)