Embed Size (px)
Citation preview

Abstract
A climatology of significant fog events (visibility dropping to 0.5 statute mile or lower for at least six consecutive hours) for the Truckee-Tahoe Airport (KTRK) in Truckee, California, is presented. The climatology is based on surface observation data from July 1994 through June 2009. National Centers for Environmental Prediction (NCEP) reanalysis data are used to determine which upper air patterns are favorable for periods of significant fog formation. These patterns are: (a) a building ridge after an upper low/trough passage, (b) an upper low/trough offshore/approaching from the west, and (c) an upper trough over the region. Periods of significant fog are most frequently observed at night during the winter months at Truckee.
Corresponding Author: Brian F. O’HaraNOAA/National Weather Service
2350 Raggio Parkway, Reno, Nevada 89512Email: [email protected]
SYNOPTIC CLIMATOLOGY OF SIGNIFICANT FOG EVENTS AT TRUCKEE, CALIFORNIA
Brian F. O’Hara
NOAA/National Weather ServiceWeather Forecast Office
Reno, Nevada

O'Hara
84 National Weather Digest
1. Introduction
Throughout aviation history, fog has been a major hazard to pilots. Beckwith (1971) states that fog “probably is the greatest deterrent to uninterrupted airline service, and has been so recognized since the first days of air transportation.” Fog studies have been conducted for cities and airports ranging in size from the New York City area (Tardif and Rasmussen 2007); O’Hare International Airport in Chicago (Ratzer 1996); and Atlanta Hartsfield-Jackson International Airport (Robinson 1989); to Albany, New York (Meyer et al. 1986; Meyer and Lala 1990); Spokane, Washington (Frisbie 1995); and Elkins, West Virginia (Hoover 1950). The goal of all of these studies was to understand fog formation at these various locations and to thereby help in improving its forecasting. Previous fog studies have shown that the central Sierra Nevada mountain range in eastern California has a relatively high frequency of fog occurrences when compared to other regions of the U.S. (Court and Gerston 1966; Peace 1969; Hardwick 1973; Leipper 1994; Westcott 2007). This study will focus on the Truckee-Tahoe Airport (KTRK) in Truckee, California, located in the Martis Valley east of the Sierra crest (Fig. 1). The sharp topography near the airport helps to trap cold air in the valley (Fig. 2). Low-level temperature inversions are common in this valley and can enhance fog development around the Truckee airport. Radiation fog can be a major concern at smaller airports such as Truckee (KTRK) where the control tower may not be staffed 24 hours per day. At Truckee, the terrain around the airport can make takeoffs and landings quite difficult, especially during periods of reduced visibility (Fig. 2). The landing minimum (visibility) at the Truckee-Tahoe Airport is 3 statute miles for aircraft without special instrument approach controls. For aircraft with special instrument approach controls, the landing minimum visibility is 1¼ statute miles. As will be seen in this study, visibilities can frequently drop below these values, especially during the colder half of the year.
2. Data and Methodology
Hourly surface observation data for KTRK from 1994 to 2009 were accessed from the National Oceanic and Atmospheric Administration (NOAA)/National Climatic Data Center (NCDC) website (NCDC 1994-2009) and analyzed to determine the occurrence of fog. Fog is more frequently observed during the cool season at Truckee. To maintain the seasonality of the fog events, the annual datasets were centered around the winter months from 1 July through 30 June of each year. The Automated Weather Observing System (AWOS) at KTRK was commissioned
in October 1987. All of the observation data used in this study were derived from the automated observation system, resulting in no discontinuity in the observation method (such as changing from manual observations by humans to automated observations). Since this study focuses on the effects of fog on aviation meteorology, the hourly fog data for Truckee were divided into four datasets. Three of these datasets correspond to three of the Federal Aviation Administration (FAA) flight categories – Marginal Visual Flight Rules (MVFR), Instrument Flight Rules (IFR), and Low Instrument Flight Rules (LIFR) (Definitions are listed in Table 1). Because fog frequently reduces visibility to less than 0.5 mile at Truckee, the category of Very Low Instrument Flight Rules (VLIFR) was also used (although VLIFR is not an official FAA flight category) (Definition is listed in Table 1).
Fig. 1. Truckee, California, and surrounding region.
Fig. 2. Map of terrain surrounding the Truckee-Tahoe Airport (KTRK). Map courtesy of Google Earth.

Synoptic Climatology of Significant Fog Events at Truckee, California
Volume 35 Number 1 ~ August 2011 85
Flight CategoryVisibility
Kilometers Statute miles
Very Low Instrument Flight Rules (VLIFR)* < 0.8 < 0.5
Low Instrument Flight Rules (LIFR) 0.8 to <1.5 0.5 to < 1Instrument Flight Rules (IFR) 1.5 to < 5 1 to < 3
Marginal Visual Flight Rules (MVFR) 5 to 8 3 to 5Visual Flight Rules (VFR) > 8 > 5
* VLIFR is not a FAA Flight CategoryTable 1. Flight Categories. Visibility categories used in analyzing fog data for Truckee, California.
The database for each of the flight categories studied (VLIFR, LIFR, IFR, and MVFR) was divided into 8760 bins. Each bin corresponds to one hour of data throughout the year (365 days multiplied by 24 hours per day equals 8760 bins). Data from 29 February were withheld because observations were only available for four years on that date during the study period. The dataset was analyzed to determine how often fog (corresponding to the four flight categories) occurred during each hour of the year. For the purposes of this study, an hour during which fog restricted visibility to 6 statute miles or lower is defined as a “fog-hour”. In order to create relatively smooth annual graphs of fog occurrences in each flight category, an 11-day rolling average (centered on each day of the year) was used.
In order to focus on the bigger events, this study examined periods of fog that lasted at least 6 consecutive hours during which the visibility was 0.5 statute mile or less. These 6-hour periods of fog were defined as “significant fog events” (SFEs) for the purposes of this study. Upper air reanalysis data were accessed from the NOAA/National Weather Service (NWS)/Hydrometeorological Prediction Center (HPC) website (Kalnay et al. 1996; NWS/HPC 2010) in order to assess
Fig. 3. Average daily fog-hours at Truckee, California, between July 1994 and June 2009.
whether any specific atmospheric patterns correlated well with periods of significant fog at Truckee. Upper-air data were also accessed from the Plymouth State University website (Plymouth State Univ. 2010).
Snow cover at KTRK was assessed based on data from the U. S. Forest Service Truckee Ranger Station (located approximately 2 miles northwest of the airport; labeled “Truckee R. S.” in Fig. 2), which are available on the monthly cooperative observation forms archived on the NCDC website. These data were used to examine
the relationship between snow cover and the occurrence of fog at the Truckee airport.
3. Analysis and Discussion
a. Climatology of fog at Truckee
Fog at Truckee is mainly a cold season phenomenon. As can be seen in Fig. 3, the “fog season” at KTRK generally runs from mid-October through early-April. From late-April through August, Truckee averages one half hour of fog each night. By the last week of September, Truckee averages one hour of fog each night. The incidence of fog increases gradually through October until an average of two hours of fog each night can be expected by the first week of November. The average number of hours of fog each night ranges between 1.5 and 3.0 hours from the first week of November through mid-March.
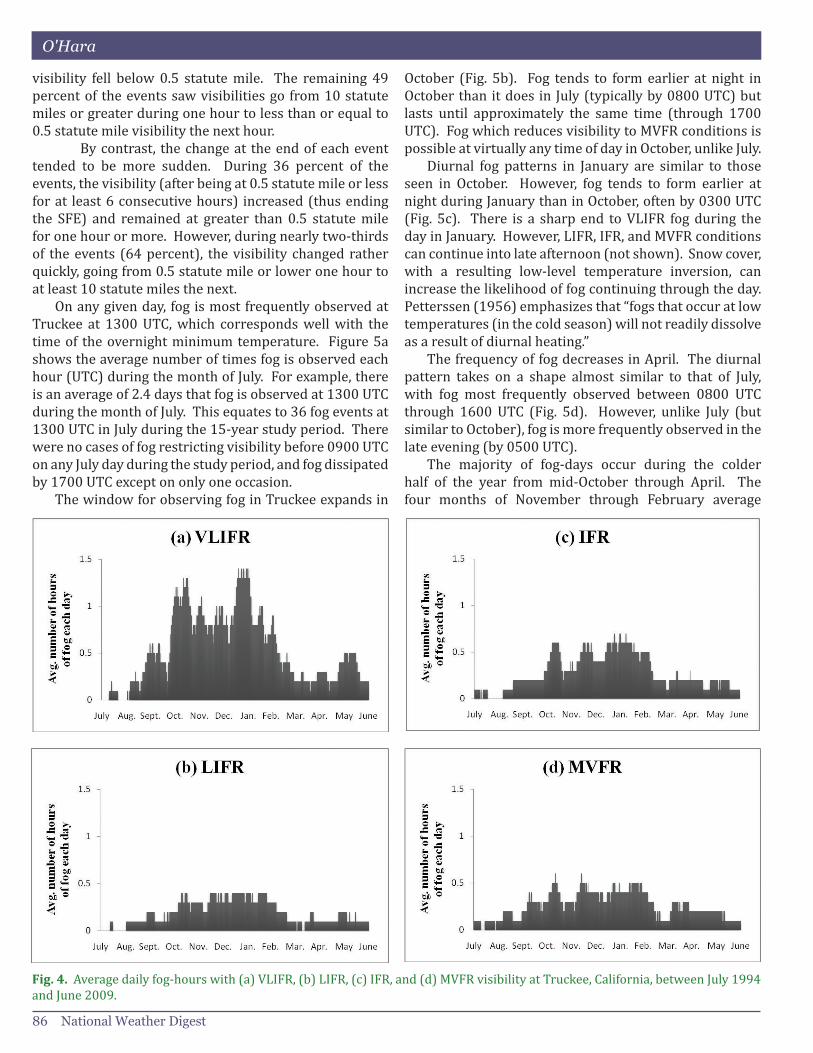
Figure 4 shows the average number of fog-hours for each day throughout the year broken out by flight category. Fog that reduces visibility to lower than 0.5 statute mile (VLIFR) accounts for approximately half of the total number of fog-hours recorded throughout the year at Truckee (cf. Figs. 3 and 4a). Figures 4b, 4c, and 4d show the daily number of fog hours throughout the year corresponding to LIFR, IFR, and MVFR visibilities, respectively. Truckee averages less than 1 hour of fog per day for each of these flight categories, even during the cold season from early November through April.
In looking at the fifteen years of data in this study, fog reduced visibility to less than 7 statute miles on 1,449 days (defined as “fog-days”). On 223 of these dates fog reduced visibility to 0.5 statute mile or less for at least 6 consecutive hours. Thus, an SFE occurred during 15 percent of all days with fog at Truckee. In addition, for the period July 1994 through June 2009, an average of 14.9 SFEs occurred per year (July through June). Sixty-two percent of all fog-hours with visibilities of 0.5 statute mile or lower occurred within these SFEs. Of the 223 SFEs, 51 percent started with at least one hour of fog before
O'Hara
86 National Weather Digest
Fig. 4. Average daily fog-hours with (a) VLIFR, (b) LIFR, (c) IFR, and (d) MVFR visibility at Truckee, California, between July 1994 and June 2009.
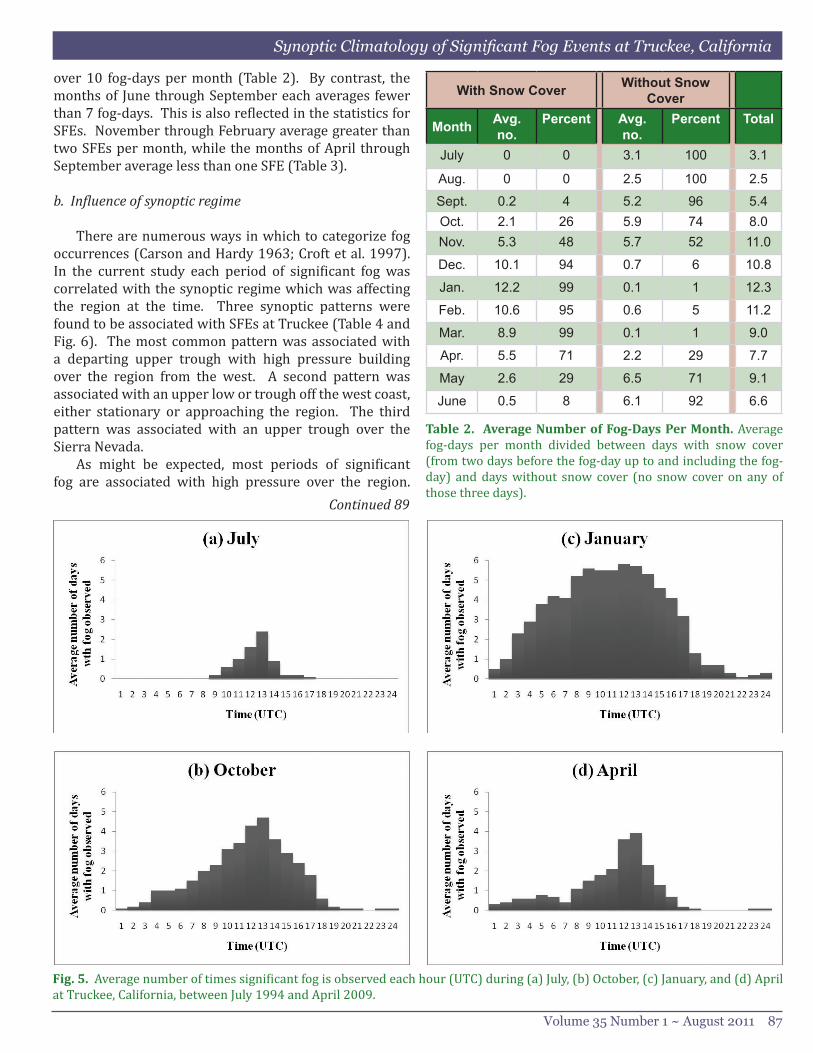
October (Fig. 5b). Fog tends to form earlier at night in October than it does in July (typically by 0800 UTC) but lasts until approximately the same time (through 1700 UTC). Fog which reduces visibility to MVFR conditions is possible at virtually any time of day in October, unlike July. Diurnal fog patterns in January are similar to those seen in October. However, fog tends to form earlier at night during January than in October, often by 0300 UTC (Fig. 5c). There is a sharp end to VLIFR fog during the day in January. However, LIFR, IFR, and MVFR conditions can continue into late afternoon (not shown). Snow cover, with a resulting low-level temperature inversion, can increase the likelihood of fog continuing through the day. Petterssen (1956) emphasizes that “fogs that occur at low temperatures (in the cold season) will not readily dissolve as a result of diurnal heating.” The frequency of fog decreases in April. The diurnal pattern takes on a shape almost similar to that of July, with fog most frequently observed between 0800 UTC through 1600 UTC (Fig. 5d). However, unlike July (but similar to October), fog is more frequently observed in the late evening (by 0500 UTC). The majority of fog-days occur during the colder half of the year from mid-October through April. The four months of November through February average
visibility fell below 0.5 statute mile. The remaining 49 percent of the events saw visibilities go from 10 statute miles or greater during one hour to less than or equal to 0.5 statute mile visibility the next hour.
By contrast, the change at the end of each event tended to be more sudden. During 36 percent of the events, the visibility (after being at 0.5 statute mile or less for at least 6 consecutive hours) increased (thus ending the SFE) and remained at greater than 0.5 statute mile for one hour or more. However, during nearly two-thirds of the events (64 percent), the visibility changed rather quickly, going from 0.5 statute mile or lower one hour to at least 10 statute miles the next. On any given day, fog is most frequently observed at Truckee at 1300 UTC, which corresponds well with the time of the overnight minimum temperature. Figure 5a shows the average number of times fog is observed each hour (UTC) during the month of July. For example, there is an average of 2.4 days that fog is observed at 1300 UTC during the month of July. This equates to 36 fog events at 1300 UTC in July during the 15-year study period. There were no cases of fog restricting visibility before 0900 UTC on any July day during the study period, and fog dissipated by 1700 UTC except on only one occasion. The window for observing fog in Truckee expands in
Synoptic Climatology of Significant Fog Events at Truckee, California
Volume 35 Number 1 ~ August 2011 87
Fig. 5. Average number of times significant fog is observed each hour (UTC) during (a) July, (b) October, (c) January, and (d) April at Truckee, California, between July 1994 and April 2009.
With Snow Cover Without Snow Cover
Month Avg. no.
Percent Avg. no.
Percent Total
July 0 0 3.1 100 3.1
Aug. 0 0 2.5 100 2.5
Sept. 0.2 4 5.2 96 5.4Oct. 2.1 26 5.9 74 8.0Nov. 5.3 48 5.7 52 11.0
Dec. 10.1 94 0.7 6 10.8
Jan. 12.2 99 0.1 1 12.3
Feb. 10.6 95 0.6 5 11.2
Mar. 8.9 99 0.1 1 9.0
Apr. 5.5 71 2.2 29 7.7
May 2.6 29 6.5 71 9.1
June 0.5 8 6.1 92 6.6
Table 2. Average Number of Fog-Days Per Month. Average fog-days per month divided between days with snow cover (from two days before the fog-day up to and including the fog-day) and days without snow cover (no snow cover on any of those three days).
over 10 fog-days per month (Table 2). By contrast, the months of June through September each averages fewer than 7 fog-days. This is also reflected in the statistics for SFEs. November through February average greater than two SFEs per month, while the months of April through September average less than one SFE (Table 3).
b. Influence of synoptic regime
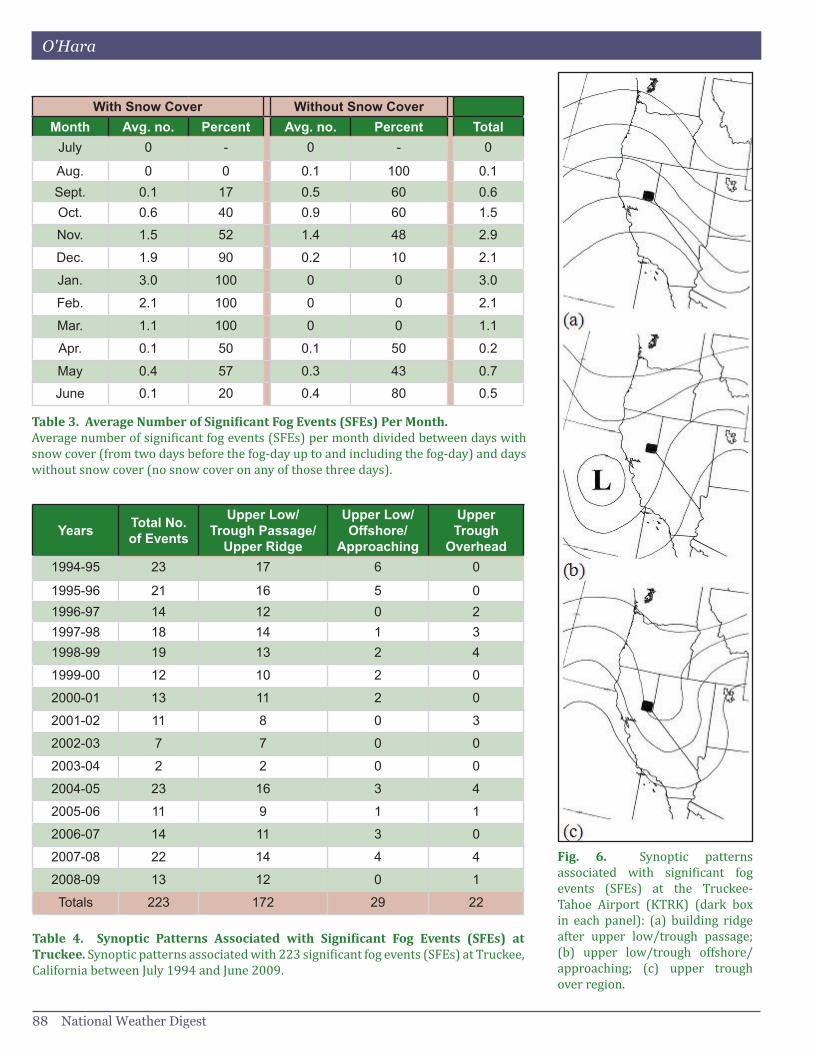
There are numerous ways in which to categorize fog occurrences (Carson and Hardy 1963; Croft et al. 1997). In the current study each period of significant fog was correlated with the synoptic regime which was affecting the region at the time. Three synoptic patterns were found to be associated with SFEs at Truckee (Table 4 and Fig. 6). The most common pattern was associated with a departing upper trough with high pressure building over the region from the west. A second pattern was associated with an upper low or trough off the west coast, either stationary or approaching the region. The third pattern was associated with an upper trough over the Sierra Nevada. As might be expected, most periods of significant fog are associated with high pressure over the region.
Continued 89
O'Hara
88 National Weather Digest
Table 3. Average Number of Significant Fog Events (SFEs) Per Month.Average number of significant fog events (SFEs) per month divided between days with snow cover (from two days before the fog-day up to and including the fog-day) and days without snow cover (no snow cover on any of those three days).
Fig. 6. Synoptic patterns associated with significant fog events (SFEs) at the Truckee-Tahoe Airport (KTRK) (dark box in each panel): (a) building ridge after upper low/trough passage; (b) upper low/trough offshore/approaching; (c) upper trough over region.
Years Total No. of Events
Upper Low/ Trough Passage/
Upper Ridge
Upper Low/ Offshore/
Approaching
Upper Trough
Overhead1994-95 23 17 6 0
1995-96 21 16 5 01996-97 14 12 0 21997-98 18 14 1 31998-99 19 13 2 4
1999-00 12 10 2 0
2000-01 13 11 2 0
2001-02 11 8 0 3
2002-03 7 7 0 0
2003-04 2 2 0 0
2004-05 23 16 3 4
2005-06 11 9 1 1
2006-07 14 11 3 0
2007-08 22 14 4 4
2008-09 13 12 0 1
Totals 223 172 29 22
Table 4. Synoptic Patterns Associated with Significant Fog Events (SFEs) at Truckee. Synoptic patterns associated with 223 significant fog events (SFEs) at Truckee, California between July 1994 and June 2009.
With Snow Cover Without Snow CoverMonth Avg. no. Percent Avg. no. Percent Total
July 0 - 0 - 0
Aug. 0 0 0.1 100 0.1Sept. 0.1 17 0.5 60 0.6Oct. 0.6 40 0.9 60 1.5
Nov. 1.5 52 1.4 48 2.9
Dec. 1.9 90 0.2 10 2.1
Jan. 3.0 100 0 0 3.0
Feb. 2.1 100 0 0 2.1
Mar. 1.1 100 0 0 1.1
Apr. 0.1 50 0.1 50 0.2
May 0.4 57 0.3 43 0.7
June 0.1 20 0.4 80 0.5
Synoptic Climatology of Significant Fog Events at Truckee, California
Volume 35 Number 1 ~ August 2011 89
Table 5. Most Extensive 1-hour Sky Cover During Each Significant Fog Event (SFE). Most extensive sky condition reported during 223 significant fog events (SFEs) at Truckee, California between July 1994 and June 2009 sorted by synoptic regime.
Sky Condition
Upper Low/ Trough Passage/
Upper Ridge
Upper Low/ Offshore/
Approaching
Upper Trough
OverheadClear 34 7 3
Scattered 84 10 6Broken 37 5 6
Overcast 17 7 7Total 172 29 22
Of the 223 SFEs, 172 events (77 percent) occurred as high pressure was building over the region as an upper trough was moving away to the east, or while a ridge of high pressure was over the region. Of the remaining 23 percent, 29 SFEs (13 percent) were associated with an upper trough either offshore or approaching the region, and 22 events (10 percent of the total) were associated with an upper trough that was stationary over the region.
c. Influence of sky cover The amount of cloud cover observed during an SFE at Truckee can loosely be related to the synoptic regime. In general, it was found that periods of high pressure were associated with skies tending to be less cloudy than when an upper-level low or trough was moving across, or was near, the region. Table 5 shows the most extensive 1-hour sky cover recorded during each of the 223 SFEs in this study sorted by synoptic regime. For example, those events listed as “Clear” had sky covers that remained Clear throughout the event. Events listed as “Scattered”, “Broken”, and “Overcast” had Scattered, Broken, or Overcast skies, respectively, as the greatest sky cover recorded for at least one hour during the event. In this study, “Scattered” sky cover is defined as clouds covering 1/8th to 4/8th of the sky, “Broken” sky cover is defined as cloud cover of 5/8th to 7/8th, and “Overcast” sky cover is defined as 8/8th cloud cover. It should be noted, however, that “Scattered” sky cover (as defined in this study) combines the official sky cover categories of “Few” (1/8th to 2/8th) and “Scattered” (3/8th to 4/8th) as defined in Federal Meteorological Handbook Number 1 (U. S. Department of Commerce (DOC)/NOAA 2005). Of the 172 SFEs that were associated with a trough passage and building high pressure, or with high pressure already over the region, 84 events (49 percent) had scattered cloud cover (at most) during some portion of the 6-hour (or greater) event. Thirty-
four events (20 percent) had clear skies throughout the event and another 37 SFEs (21 percent) had broken sky cover at some point. Only 17 events (10 percent) had skies becoming overcast. Broken and overcast skies were generally observed at the beginning and end of an SFE. During each event, as the surface visibility lowered toward 0.5 statute mile in fog, obscured conditions typically prevailed.
d. Influence of snow cover
Since snow cover data are not available for the Truckee-Tahoe Airport, data for the Truckee Ranger Station were used to determine the occurrence of snow cover in the Truckee area. Snow cover typically increases throughout the winter at Truckee with the greatest depths observed during March of each year. The snow pack at KTRK typically melts by the end of April, thanks to increasing sun angles and higher daytime temperatures. To account for the effects of moisture from recent snow cover contributing to the formation of fog, snow cover was considered on the two days leading up to an SFE, as well as on the day of the event. Tables 2 and 3 show the distribution of fog-days and their relation to snow cover. From December through March, over 90 percent of fog-days (and SFEs) occur with snow cover at Truckee. In addition, half or more of SFEs during November, April, and May occur with snow cover. No snow cover occurred during July and August during the 15 years of this study. These two months recorded the fewest fog-days and SFEs. This is probably due to the warmer daytime temperatures with larger dew point depressions, making it more difficult to reach saturation at night during these summer months.
e. Influence of local topography
The Truckee-Tahoe Airport is located in a high mountain valley in the Sierra Nevada (Figs. 1 and 2). The location of the airport in an enclosed basin makes it susceptible to the formation of radiation fog at night. This phenomenon had been known since the earliest days of aviation weather forecasting and is explained in a well-known book by Sutcliffe (1940), in which he describes the tendency for fog “to collect first in valleys, due to the greater cooling which takes place over ground sheltered from the wind, and due, no doubt also in part, to the katabatic draining of cold air into the lower-lying parts.” A relatively stable air mass in the Truckee area can last for days at a time. Periods of significant fog at the Truckee-Tahoe Airport have lasted for up to five consecutive days. Even if the fog dissipates during the day, it can reform at night due to the cold temperatures in the area. Wolyn
O'Hara
90 National Weather Digest
and McKee (1989) discussed an atmospheric condition they called a “deep stable layer” (DSL). They defined it in reference to low-level lapse rates seen in radiosonde data at four upper-air sites in the Intermountain West. Truckee is not an upper-air site but the conditions that Wolyn and McKee (1989) describe are analogous to what is seen at Truckee. The cold air drainage around the KTRK site, and the relatively cold air temperatures at the surface (especially during the winter months), can contribute to stable conditions similar to those that Wolyn and McKee (1989) discuss in their study.
4. Summary
Fog is most frequently observed at Truckee during the cold season (November through April), however fog can be observed at any time during the year. The most likely time of day to observe fog at Truckee is around 1300 UTC, which roughly corresponds with the time the overnight minimum temperature is reached. The majority (77 percent) of the 233 SFEs observed at Truckee between July 1994 and June 2009 occurred as high pressure was building over the region as an upper trough was moving away to the east, or while a ridge of high pressure was over the region. The location of the airport in an enclosed basin surely contributes to the formation of fog as cold air tends to pool near the airport during the overnight hours year round.
Author
Brian F. O’Hara is the Climate Services Focal Point at the National Weather Service (NWS) Weather Forecast Office (WFO) in Reno, Nevada. Brian has served as a Meteorologist Intern at the NWS WFO in Mobile, Alabama, and as a forecaster at WFOs in Northern Indiana and Reno. He earned a BS degree in Atmospheric Science from the University of Missouri in 1993 and a MS in Geography/Climatology from the University of Nevada–Reno in 2007. Brian’s research interests encompass many areas of climatology including winter weather and aviation meteorology.
References
Beckwith, W. B., 1971: The effect of weather on the operations and economics of air transportation today. Bull. Amer. Meteor. Soc., 52, 863-868.
Carson, R. B., and R. C. Hardy, 1963: On the forecasting of winter fog: A geographical approach. J. Appl. Meteor., 2, 351-357.
Court, A., and R. D. Gerston, 1966: Fog frequency in the United States. Geogr. Rev., 56, 543–550.
Croft, P. J., R. L. Pfost, J. M. Medlin, and G. A. Johnson, 1997: Fog forecasting for the southern region: A conceptual model approach. Wea. Forecasting, 12, 545-556.
Frisbie, P., 1995: Fog climatology at Spokane, Washington. NOAA Technical Memorandum NWS WR-232, 24 p.
Hardwick, W. C., 1973: Monthly fog frequency in the continental United States. Mon. Wea. Rev., 101, 763-766.
Hoover, R. A., 1950: Forecasting radiation fog at Elkins, W. Va. Mon. Wea. Rev., 78, 75-80.
Kalnay, E., and Coauthors, 1996: The NCEP/NCAR 40-Year Reanalysis Project. Bull. Amer. Meteor. Soc., 77, 437–471.
Leipper, D. F., 1994: Fog on the U.S. west coast: A review. Bull. Amer. Meteor. Soc., 75, 229-240.
Meyer, M. B., and G. G. Lala, 1990: Climatological aspects of radiation fog occurrence at Albany, New York. J. Climate, 3, 577-586.
Acknowledgments
The author would like to thank Dave Myrick, Science and Operations Officer at the National Weather Service (NWS) Weather Forecast Office (WFO) in Reno, Nevada for reviewing this manuscript. His extensive reviews made this a much more readable article. The author would also like to thank Chris Smallcomb, Deputy Chief of the Scientific Services Division at the NWS Western Region Headquarters in Salt Lake City, UT, for offering many suggestions that greatly improved this manuscript. Appreciation is also extended to two reviewers who read the article and offered suggestions that greatly improved the article’s structure and readability. Brian greatly appreciates the work of Scott McGuire, Observations Program Leader at WFO Reno, in creating Fig. 2. Finally, Brian has benefited from discussions with Mark Deutschendorf, a meteorologist at WFO Reno, who initiated this study of fog formation at Truckee and helped to clarify the subsequent direction of research.
Synoptic Climatology of Significant Fog Events at Truckee, California
Volume 35 Number 1 ~ August 2011 91
_____, _____, and J. E. Jiusto, 1986: FOG-82: A cooperative field study of radiation fog. Bull. Amer. Meteor. Soc., 67, 825-832.
NCDC, 1994-2009: Hourly surface observations for Truckee, California (KTRK). [Available online at http://cdo.ncdc.noaa.gov/pls/plclimprod/cdomain.subquery Router]
NWS/HPC, 2010: Upper-air reanalysis data. [Available online at http://www. hpc.ncep.noaa.gov/ncepreanal/]
Peace, R. L., Jr., 1969: Heavy-fog regions in the conterminous United States. Mon. Wea. Rev., 97, 116-123.
Petterssen, S., 1956: Weather analysis and forecasting: Vol. II, Weather and weather systems. 2nd ed. McGraw-Hill, 266 pp.
Plymouth State Univ., 2010: Upper-air synoptic data. [Available online at http://vortex.plymouth.edu/]
Ratzer, M. A., 1996: Toward a climatology of dense fog at Chicago’s O’Hare International Airport. NOAA Technical Service Publication CR-02.
Robinson, P. J., 1989: The influence of weather on flight operations at the Atlanta Hartsfield International Airport. Wea. Forecasting, 4, 461-468.
Sutcliffe, R. C., 1940: Meteorology for aviators. London, UK, HMSO, 278 pp.
Tardif, R., and R. M. Rasmussen, 2007: Event-based climatology and typology of fog in the New York City region. J. Appl. Meteor. Climatol., 46, 1141-1168.
U. S. DOC/NOAA 2005: Federal Meteorological Handbook No. 1. Washington, DC, 91 pp.
Westcott, N. E., 2007: Some aspects of dense fog in the midwestern United States. Wea. Forecasting, 22, 457-465.
Wolyn P. G. and T. B. McKee, 1989: Deep stable layers in the intermountain western United States. Mon. Wea. Rev., 117, 461-472.


![Climatology [Autosaved]](https://img.pdfslide.us/doc/110x75/577cd2e91a28ab9e78964bc6/climatology-autosaved.jpg)
