Embed Size (px)
Citation preview
Louisiana State UniversityLSU Digital Commons
LSU Master's Theses Graduate School
2010
Synoptic circulation of the North AmericanMonsoon System and precipitation within theLower Colorado River BasinJessie Frances McCannLouisiana State University and Agricultural and Mechanical College, [email protected]
Follow this and additional works at: https://digitalcommons.lsu.edu/gradschool_theses
Part of the Social and Behavioral Sciences Commons
This Thesis is brought to you for free and open access by the Graduate School at LSU Digital Commons. It has been accepted for inclusion in LSUMaster's Theses by an authorized graduate school editor of LSU Digital Commons. For more information, please contact [email protected].
Recommended CitationMcCann, Jessie Frances, "Synoptic circulation of the North American Monsoon System and precipitation within the Lower ColoradoRiver Basin" (2010). LSU Master's Theses. 1296.https://digitalcommons.lsu.edu/gradschool_theses/1296
SYNOPTIC CIRCULATION OF THE NORTH AMERICAN MONSOON SYSTEM AND PRECIPITATION WITHIN THE
LOWER COLORADO RIVER BASIN
A Thesis
Submitted to the Graduate Faculty of the Louisiana State University and Agricultural Mechanical College
In partial fulfillment of the Requirements for the degree of
Master of Science in
The Department of Geography and Anthropology
by
Jessie McCann B.S., Mississippi State University
May 2010

ii
ACKNOWLEDGEMENTS
First, I would like to thank my committee members Dr. Barry D. Keim and Dr. Jeremy E.
Diem, and specifically my advisor Dr. David P. Brown, for all their assistance during my thesis
research. Without all the helpful advice, willing assistance, and instruction I would not have
been able to complete this study.
I would also like to show my gratitude to my officemates for their tremendous
assistance to me throughout my classes, projects, and thesis research. Specifically, I
acknowledge Anna Trevino for all of her Excel assistance, Matlab help, paper revisions, coffee
breaks, etc. I could not have made it through these last two years without her help. Also, I
would like to thank Katie Lavigne for all her technical assistance and support throughout my
research.
The Southern Regional Climate Center and Department of Geography and Anthropology
at LSU provided me with the support and funding to complete my thesis.
Lastly, I want to sincerely thank my parents, grandfather, and Marc who have supported
me throughout my education, and always assisted me in any way they possibly could.
iii
Table of Contents
ACKNOWLEDGEMENTS ....................................................................................................................ii
ABSTRACT ......................................................................................................................................... v
CHAPTER 1 – INTRODUCTION ......................................................................................................... 1
1.1 Introduction and overview of studies of the North American Monsoon System ................. 1
1.2 NAMS Seasonal Development and Processes ....................................................................... 4
1.3 Teleconnections .................................................................................................................... 6
1.4 Geography of the Lower Colorado River Basin ..................................................................... 7
1.5 NAMS impacts and vulnerability in the LCRB ........................................................................ 9
CHAPTER 2‐ RESEARCH QUESTIONS AND THESIS STRUCTURE ..................................................... 11
2.1 Research Questions and Objectives .................................................................................... 11
2.2 Significance of Research ...................................................................................................... 12
2.3 Structure of Thesis .............................................................................................................. 13
CHAPTER 3‐ SYNOPTIC TYPING OF CIRCULATION ANOMALIES ASSOCIATED WITH THE NORTH
AMERICAN MONSOON, 1948‐2008 .............................................................................................. 14
3.1 Introduction ......................................................................................................................... 14
3.2 Data and Methods ............................................................................................................... 16
3.3 Results and Discussion ........................................................................................................ 19
3.3.1 Description of Synoptic Types ...................................................................................... 19
3.3.2 Trends in Type Frequencies .......................................................................................... 26
3.3.3 Intra‐seasonal (daily) type frequencies ........................................................................ 34
3.4 Conclusion ........................................................................................................................... 34
CHAPTER 4‐ PRECIPITATION TRENDS IN THE LOWER COLORADO RIVER BASIN AND LINKAGE TO
SYNOPTIC‐SCALE CIRCULATION VARIABILITY ............................................................................... 38
4.1 Introduction ......................................................................................................................... 38

iv
4.2 Data and Methods ............................................................................................................... 39
4.3 Results and Discussion ........................................................................................................ 44
4.4 Conclusion ........................................................................................................................... 55
CHAPTER 5‐ CONCLUSIONS ........................................................................................................... 57
REFERENCES .................................................................................................................................. 62
VITA ............................................................................................................................................... 64
v
ABSTRACT
The North American Monsoon System (NAMS) is an important climate phenomenon
that affects the southwestern United States during the warm season, most significantly in July
and August. Climatic variability associated with the NAMS impacts a wide range of both
physical and socio‐economic systems in this region, with a broad range of stakeholders
concentrated in the Lower Colorado River Basin (LCRB) that includes portions of five
southwestern states. This study examines variations in synoptic circulation patterns associated
with the NAMS with respect to the LCRB. Using a manual classification, daily 500‐mb
geopotential height patterns were classified for monsoon seasons (July 1‐September 15) from
1948 ‐2008. Ten synoptic types were identified and their frequency and variability assessed.
Rainfall patterns at four key sites within the LCRB were also examined for trends in both total
seasonal rainfall and the frequency of extreme events, and average daily rainfall at each site
was linked to each of the ten synoptic types. Results of this study show that the occurrence of
synoptic‐scale circulation patterns during the NAMS season has not been constant over time.
In addition, the frequency of heavy precipitation events is increasing within the LCRB, and the
occurrence of NAMS‐related rainfall is not consistent among each of the synoptic types. The
findings presented here may be used to reduce vulnerability within the LCRB, through an
improved understanding of inter‐annual and intra‐annual variability of the NAMS that can
inform forecasting applications and vulnerability assessments.
1
CHAPTER 1 – INTRODUCTION
1.1 Introduction and overview of studies of the North American Monsoon System
Every year, the southwestern United States and northwestern Mexico are affected by a
summer phenomenon known as the North American Monsoon System (NAMS). The NAMS is
also referred to as the southwestern United States monsoon, the Arizona monsoon, or the
Mexican monsoon (Douglas et al. 1993, Adams & Comrie 1997). A monsoon is defined as a
seasonal reversal of winds, and the shift of winds from the west (winter) to south (summer)
denotes the beginning of the NAMS circulation (Douglas et al. 1993, Grantz et al. 2007). The
NAMS begins in Mexico and moves northward into Arizona and New Mexico affecting these
areas most strongly in July and August (Diem & Brown 2006, Ray et al. 2007) with some
locations receiving between 50%‐70% of their annual rainfall totals during the monsoon season
(Grantz et al. 2007). The largest overall precipitation amounts are received in July and August
for the southwestern United States (Diem & Brown 2006).
Studies of the NAMS date back around 100 years (Adams & Comrie 1997), but early
analyses were limited to lack of widespread data across the region. Interest regarding the
NAMS began with the observation of summer thunderstorms in the Arizona and New Mexico
region, and the simultaneous lack of precipitation in southern California (Bryson & Lowrey
1955). The onset of this summertime precipitation was explained by Bryson and Lowrey (1955)
as the reversal of wind direction in the middle troposphere. A shift in winds from west to east
along with horizontal advection explained the increased moisture transport into the region
(Bryson & Lowrey 1955). Moisture surges were first examined by Bryson and Lowry (1957)
because of their influence upon precipitation (Wu et al. 2009). The importance of lower
2
tropospheric moisture was indicated by Reitan (1957) through an analysis of the amount of
precipitable water over Phoenix between the surface and 800mb (Douglas et al. 1993). Even
though Reitan (1957) proved the presence of moisture in the lower troposphere, a debate in
the literature occurred for many years concerning the roles of middle and lower tropospheric
moisture (Douglas et al. 1993), although recent studies (e.g. Diem and Brown 2009; Ellis et. al
2004) observe the transport of moisture over the Sierra Madre Occidental serving as the
primary contributor to middle tropospheric moisture.
Even though seasonal precipitation observations began in the early 1900s, they were
not linked to large‐scale phenomena such as the monsoon until later (Campbell 1906, Adams &
Comrie 1997). Researchers examined the precipitation “normals” for the southwestern United
States and discovered a bimodal distribution with peaks in winter and summer. This discovery
spiked the interest of many researchers and the summer peak became better understood and
attributed to convective thunderstorms that were an extension of the Mexican monsoon
(Carleton 1987). These storms were noted for affecting Arizona specifically and most strongly
between July 1‐ September 15 (Carleton 1987).
Many dynamical models have attempted to simulate the NAMS, including regional and
global scale models, but these models experience many problems with prediction due to the
highly varied terrain of the southwestern United States (Adams & Comrie 1997). Another
problem in modeling efforts is the influence of mesoscale processes which are too finite for
model prediction (Adams & Comrie 1997). Comrie and Glenn (1998) used a more statistical
approach by dividing the United States and Mexico into “quasi‐homogeneous areas” of
precipitation. Principal components analysis was used to identify 9 regions within the primary
3
region defined as the “monsoon zone” (Comrie & Glenn 1998). Through the classification of
this “monsoon zone,” precipitation and circulation patterns could be analyzed alongside each
other, aiding in the identification of the components of interannual monsoon variability
(Comrie & Glenn 1998). Another statistical study used manual classification of 500mb pressure
patterns for the monsoon season (July 7‐September 14) for 19 seasons (Diem & Brown 2009).
The researchers linked the circulation patterns to the rainfall characteristics at four stations and
also identified the influence of gulf surges on precipitation using platforms of near‐surface
humidity (Diem & Brown 2009). This influence was shown through creation of near‐surface
dew‐point temperature anomalies created for each grouping of rainfall days, each synoptic
type, and each group of synoptic type and rainfall days (Diem & Brown 2009).
In summer of 2004, a team of scientists from the United States, Mexico, and Central
America performed a large field study to gain a better understanding of the NAMS. This project
was called the North American Monsoon Experiment (NAME) and one major goal of this study
was a better understanding of the mechanisms behind this warm season precipitation
phenomenon (Higgins & Gochis 2007). Not only did these scientists seek to understand the
forcing mechanisms, but they also strived to understand the process behind the monsoon
through use of “ocean‐atmosphere‐land (O‐A‐L) models.” NAME was performed in the main
area of the NAMS: northwestern Mexico, the southwestern United States, and surrounding
ocean areas (Higgins & Gochis 2007). Benefits of this study included the data acquired through
modeling, remote sensing, and in situ activities, and the various products that have been
created including surface precipitation data and composite maps of atmospheric variables
(Higgins & Gochis 2007).
4
1.2 NAMS Seasonal Development and Processes
One key factor in the development of the NAMS circulation is the formation of the
thermal low, a surface feature that is located along the Colorado River valley near the
Arizona/California border (Ellis et al. 2004). This feature is typically located over the lowland
arid region from mid‐June through mid‐September and plays a large role in the low‐level
advection of moisture into the region from the Gulf of Mexico, Gulf of California, and the
eastern Pacific (Diem & Brown 2006, Heinselman & Schultz 2006). Two key lowland areas are
noted for their influence on the formation of the thermal low, the lower Colorado River basin
(LCRB) and surrounding low desert areas (Adams & Comrie 1997). The formation of the
thermal low causes displacement of the subtropical high pressure ridge. Numerous studies
have noted that a northward displacement of the subtropical ridge leads to a wetter monsoon
season, while a southward displacement leads to a drier season due to blocking of moisture
transport into the region (Carleton 1987, Grantz et al. 2007). Carleton (1987) noted that a
southward displacement of the subtropical ridge causes subsidence over the region, drier
conditions, and southwesterly flow. Severe thunderstorms in central Arizona have been linked
to northwestern and northeastern shifts in the location of the high pressure ridge (Diem &
Brown 2009).
Moisture is provided to the monsoon system in the upper, middle, and lower
troposphere, but the sources of moisture differ. The upper‐level moisture is mainly from the
Gulf of Mexico while the Gulf of California contributes moisture at middle and lower levels.
Variability of monsoon‐related precipitation is normally associated with “bursts” and “breaks”
of moisture advection from the Gulf of California (Ellis et al. 2004). The flow in the upper
5
atmosphere controls both “bursts” and “breaks” that result in interannual and interseasonal
monsoon variability (Carleton 1986). During the monsoon season, moisture is pumped into the
region through “…northward surges of relatively cool, moist maritime air from the eastern
tropical Pacific into the southwestern United States via the Gulf of California” (Higgins et al.
2004). These surges are referred to as gulf surges and they are the main transport of moisture
from the Gulf of California (Higgins et al. 2004). Surges are common during the monsoon
season, occurring on an average of three times a month (Diem & Brown 2006). Air is lifted over
the Sierra Madre Occidental after being advected northward by low level jets and then mixed
with other moist air from the Gulf of Mexico (Ellis et al. 2004). Airflow over the Sierra Madre
Occidental is an important component in middle troposphere moisture (Diem & Brown 2006).
The beginning of the monsoon is not associated with a certain date on the calendar, but
is generally noted as the switch from arid/dry spring conditions to a rainy summer. When the
season ends around mid‐September, the pattern reverses and switches back to arid/dry
conditions. In 2008, the NWS established the first set of official dates for the NAMS: June 15‐
September 30. Ellis et al. (2004) created a method for defining the onset and demise of the
monsoon on a regional scale through use of 193 stations and a 52‐year data set to create
composite maps of 700mb regional humidity. These maps were compared to a local method
used by the Phoenix, AZ NWSFO and a criterion was created for establishing the onset and
demise of the monsoon season (Ellis et al. 2004). From June to October, the first/last
occurrence of three successive days of moist conditions on both the synoptic and temporal
scales marks the beginning or end of the monsoon season (Ellis et al. 2004). Days that fall
6
inside the season are then termed “monsoon days” if they meet both the mean daily dewpoint
threshold and precipitation occurrence threshold (Ellis et al. 2004).
McCabe and Clark (2006) noted a relationship between winter precipitation in the
southwestern United States and summer monsoonal precipitation. An inverse relationship has
been identified between precipitation of the two seasons, and winter precipitation can be
helpful in predicting the magnitude of the summer monsoon. For example, an above‐average
monsoon is normally predicted when precipitation the previous winter is below‐average. This
trend has weakened over time and McCabe and Clark (2006) suggest a shift in the location of
the monsoon anticyclone throughout time as the reason for decrease in the intensity of the
connection. The connection was first noted in Arizona, but the strength of the relationship has
since become more pronounced in New Mexico (McCabe & Clark 2006).
1.3 Teleconnections
Connections have been observed between the Pacific‐North American (PNA) pattern
and movements in the monsoon subtropical ridge. The negative pattern of the PNA is normally
followed by southward movement of the subtropical ridge, indicating the onset of a dry
monsoon season (Carleton et al. 1990, Grantz et al. 2007). A positive phase of the PNA pattern
promotes a wet monsoon season due to the northward placement of the subtropical high
pressure system (Grantz et al. 2007) allowing moisture to advect into the region (Grantz et al.
2007). The enhancement of moisture surges during stronger phases of the Madden‐Julian
Oscillation (MJO) has also been noted (Douglas et al. 1993, Higgins & Gochis 2007), and has
been linked to the formation of gulf surges from the Gulf of California (Lorenz & Hartmann
7
2006). Connections have also been observed between ENSO and the NAMS through
fluctuations of the Intertropical Convergence Zone (Higgins & Shi 2001). Due to connections
observed between winter precipitation and summertime monsoonal precipitation, the
influence of ENSO during winter may have potential for long‐lead predictive skill of monsoon
variability (McCabe & Clark 2006).
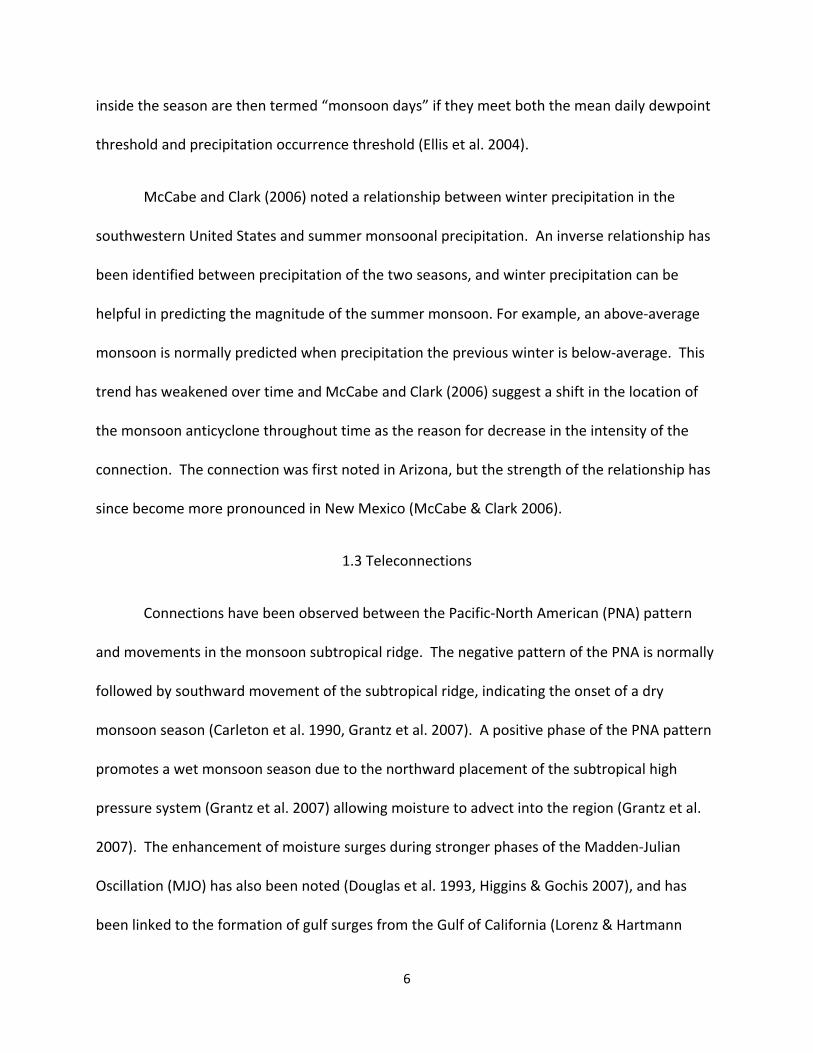
1.4 Geography of the Lower Colorado River Basin
The Lower Colorado River Basin (LCRB) is a 202,000 square mile area that is that is
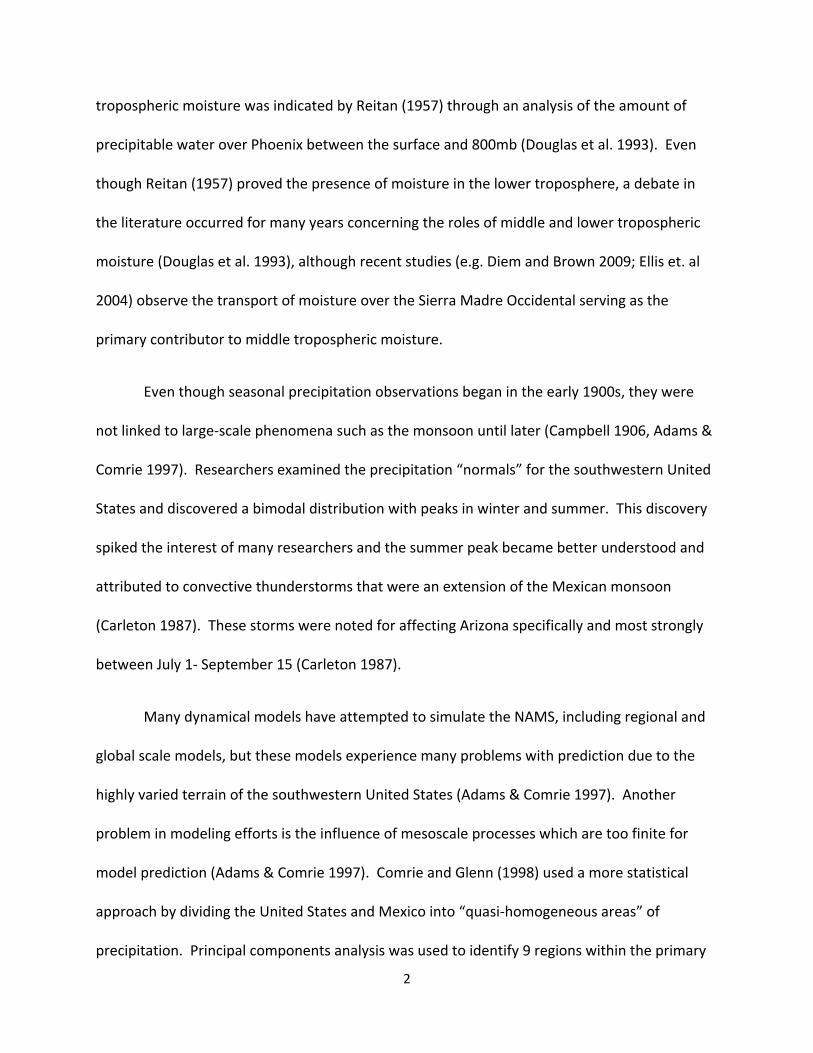
affected by the NAMS (Diem & Brown 2009). Portions of five states comprise the LCRB (Figure
1.1), which also includes three major metropolitan areas (Phoenix, AZ, Tucson, AZ, and Las
Vegas, NV). Monsoon rainfall is one of the major sources of water, contributing more than 50%
of annual rainfall (Ray et al. 2007). Population inside this region is growing rapidly, with a
population increase of around 40% in Arizona in the 1990s (Ray et al. 2007). Inside the LCRB are
many important water bodies, including the Colorado River, Lake Mead, Lake Powell, and the
Colorado River aqueduct. The location of the LCRB is an ideal study area for the NAMS because
as the monsoon rainfall moves northward from Mexico into the United States, moisture crosses
the Sierra Madre Occidental and enters the LCRB. This basin encompasses most of the
monsoon region inside the United States, but south‐central Arizona experiences the strongest
effects of the monsoon within the LCRB (Diem & Brown 2006). Also, this region is affected by
most of the gulf surges that reach the United States (Diem & Brown 2009). The growth of these
urban centers inside the LCRB may have some effects on precipitation, including the
enhancement of storms downwind of major urban areas such as Phoenix, AZ (Diem & Brown
2003). Topography inside the LCRB changes greatly from east to west, with more mountainous
8
begions towards the New Mexico border giving way to low‐level deserts on the western border
with California.
Figure 1.1: This figure illustrates the LCRB. The actual basin is shown in blue with the encompassing states indicated in green. Also, major cities for which precipitation analysis is
performed are indicated in bold font.

9
1.5 NAMS impacts and vulnerability in the LCRB
The NAMS causes broad and widespread socio‐economic impacts inside the LCRB that affect
ranchers, emergency management personnel, farmers, fire managers, and many other
stakeholders. The monsoon is seen as beneficial by many because it comprises a large
percentage of annual rainfall, providing drought relief to this arid climate region. However,
one problem stakeholders have with relying on monsoonal precipitation is the interannual
variability of the timing and magnitude of the monsoon and the lack of forecast skill for future
seasons. For example, this problem is experienced by ranchers who rely on monsoon
precipitation for their pastures as well as determining the size of their herd (Heinselman &
Schultz 2006, Ray et al. 2007).
Even though the monsoon season brings needed precipitation, the monsoon also brings
hazards (Ray et al. 2007). One of these hazards is wildfires (Ray et al. 2007), which are typically
associated with the hot and dry conditions promoted by the initial development of the
subtropical ridge in May and June. The number of fires in the region peaks one week before
monsoon onset (Swetnam & Betancourt 1998, Ray et al. 2007), and even after the arrival of
convective storms, lightning strikes can elevate the fire risk, especially during the beginning of
the season when the ground is not saturated (Swetnam & Betancourt 1998, Ray et al. 2007).
Maximum temperatures are noted for occurring prior to monsoon onset, and a delay in the
monsoon may cause drought‐like conditions to persist longer without the needed relief from
the NAMS (Douglas et al. 1993, Ray et al. 2007). Inside urban areas in Arizona the peak annual
ground water usage occurs during May and June, the months occurring prior to monsoon onset
when strong subtropical ridging dominates but monsoonal moisture is not yet present (Ray et

10
al. 2007). The amount of water used per resident in Phoenix is more than used by a resident of
any other location in the United States, and about three quarters of the amount is used for
outdoor purposes (Balling et al. 2008). These large numbers add to the stress on the
groundwater system, especially when the peak ground water usage occurs. A delayed
monsoon season can therefore strain the groundwater supply system even more. Flash
flooding is another hazard associated with the NAMS. These flash floods create many safety
concerns due to erosion, high waters in heavily populated areas, and fast‐flowing water in dry
steam beds (Diem & Brown 2006). Other hazards associated with the NAMS include high
winds, flash floods, and vector‐borne disease transmission (e.g, West Nile Virus) (Ray et al.
2007).

11
CHAPTER 2‐ RESEARCH QUESTIONS AND THESIS STRUCTURE
2.1 Research Questions and Objectives
The variability of monsoon rainfall within the LCRB has many important implications,
and an improved understanding of the atmospheric circulation features that control summer
rainfall delivery to this region is needed. While many previous studies have examined the
synoptic‐scale features of NAMS circulation [Adams and Comrie 1997], none have focused
exclusively on the variability of monsoon precipitation across the extent of the entire LCRB. In
this study the linkage between NAMS precipitation in the LCRB and synoptic‐scale circulation
patterns is examined, to identify relationships between surface environmental conditions and
atmospheric forcing mechanisms.
Using a synoptic climatology circulation‐to‐environment approach, the following
primary research question is addressed:
How does atmospheric circulation variability affect monsoon rainfall in the Lower
Colorado River Basin, USA?
To address this question, the research design is structured around three main objectives:
(1) identification of monsoonal synoptic circulation patterns for the LCRB region for the
1948‐2008 time period;
(2) identification of monsoonal precipitation patterns for key locations within the LCRB
for the 1948‐2008 time period;

12
(3) linkage of precipitation patterns to circulation anomalies, both spatially and
temporally.
2.2 Significance of Research
This research contributes significantly to the scientific understanding of the North
American Monsoon System in several ways. Determination of key synoptic circulation types
and the analysis of the intra‐ and inter‐seasonal frequency allows for a better understanding of
the position and movement of the monsoon anticyclone during the monsoon season.
Subsequent linkage of synoptic type frequencies to precipitation anomalies at key locations
within the LCRB further elucidated the important connections between atmospheric circulation
and surface environmental conditions that are present during the warm season. Taken
together, this research therefore couples the seasonal and interannual evolution of the NAMS
with synoptic‐scale circulation and surface environment responses. A more robust
understanding of this coupling can potentially be used to inform scientific applications such as
modeling studies and seasonal forecasting efforts.
In addition to the scientific impact of this study, a number of applied benefits are also
possible. These include the aforementioned potential advances in seasonal forecasting,
enhancements to short‐term weather forecasting through improved knowledge of circulation‐
precipitation relationships, and elucidation of trends in both seasonal precipitation as well as
extreme events that are useful to water, city, and emergency managers.
Overall, this study will not only contribute to existing research by identifying important
monsoon characteristics and linking circulation patterns over time to resulting rainfall, but also

13
by improving the knowledge base of NAMS variability that can then be used to minimize the
vulnerability of stakeholders inside the LCRB.
2.3 Structure of Thesis
This thesis is comprised of six main chapters. In Chapter 1, a general background about
the NAMS is given, introducing its key features and synthesizing the progression of research
about the NAMS over time. This chapter also summarizes the seasonal development of the
monsoonal structure and the influence of teleconnections, and outlines the attributes and
significance of the study region. Chapter 2 introduces the primary research question and key
research objectives, and highlights the scientific and applied benefits of the study. In Chapter 3,
a manual classification of synoptic‐scale geopotential height patterns for monsoon seasons
from 1948‐2008 is presented, including the examination of temporal frequencies per type. In
Chapter 4, an analysis of precipitation variability and trends at four cities within the LCRB, and
the linkage of rainfall patterns to synoptic‐scale circulation variability, is undertaken. Chapter 5
summarizes the key findings of the study, addresses potential scientific and applied
implications, and suggests future research directions. Finally, Chapter 6 provides a list of
references cited throughout the thesis.
14
CHAPTER 3‐ SYNOPTIC TYPING OF CIRCULATION ANOMALIES ASSOCIATED WITH THE NORTH AMERICAN MONSOON, 1948‐2008
3.1 Introduction
The North American Monsoon System (NAMS) is an important aspect of the climate of
the southwestern United States. The NAMS contributes most of the summer rainfall to this
region, and overall a high portion of the yearly average. It is characterized by the formation of a
thermal low pressure normally positioned over the Colorado Valley (Ellis et al. 2004). The
formation of this feature causes the displacement of the subtropical high pressure ridge.
Moisture sources for the NAMS include both the Gulf of California and Gulf of Mexico. The Gulf
of California supplies moisture mainly at the low and middle levels of the atmosphere, primarily
in the form of gulf surges (Higgins et al. 2004). Moisture is supplied to the higher levels of the
atmosphere mainly from the Gulf of Mexico (Ellis et al. 2004). Socio‐economic impacts
resulting from the NAMS are widespread, and include hazards such as wildfires, drought, and
lightning. Water management issues are also conditioned by precipitation delivery associated
with the NAMS (Ray et al. 2007).
Synoptic‐scale circulation variability exerts a primary control on monsoon season onset,
duration, and intensity. The position of the subtropical high pressure is key to the duration and
intensity of the monsoon season. A northward displaced anticyclone corresponds to a wetter
monsoon season, while a southward displacement leads to a drier season due to blocking of
moisture advection into the region (Carleton 1987, Grantz et al. 2007). Movements of the
subtropical ridge have been linked to fluctuations in the Pacific‐North American (PNA) pattern.
A negative PNA pattern normally denotes a southward displacement of the monsoon

15
anticyclone leading to a drier monsoon season (Carleton et al. 1990, Grantz et al. 2007).
Conversely, a wetter monsoon season is predicted by a positive phase of the PNA pattern due
to the northward displacement of the monsoon anticyclone.
Several previous studies have examined synoptic‐scale monsoon circulation variability
including Carleton (1986, 1987) and Diem and Brown (2009). However, no study has examined
circulation variations with respect to the LCRB directly. In addition, a full period classification of
daily geopotential height patterns, drawn from the NCEP/NCAR Reanalysis dataset (Kalnay et al.
1996), has not been undertaken. This study addresses the need for a circulation‐to‐
environment analysis of monsoonal variability over the LCRB, while also serving to create a new
dataset of manually classified, daily circulation patterns for the NAMS season.
The primary research question addressed in this study is therefore:
What are the key synoptic circulation types associated with the NAMS, and how
have they varied over time?
Three specific objectives were used to guide the research:
Identify the key 500 mb geopotential height pattern during the NAMS season
that correspond to the position of the monsoon anticyclone
Manually classify, using a circulation‐to‐environment approach, daily 500mb
geopotential height pattern for the period 1948‐2008
Analyze the intra‐ and inter‐seasonal variability in synoptic type frequencies
16
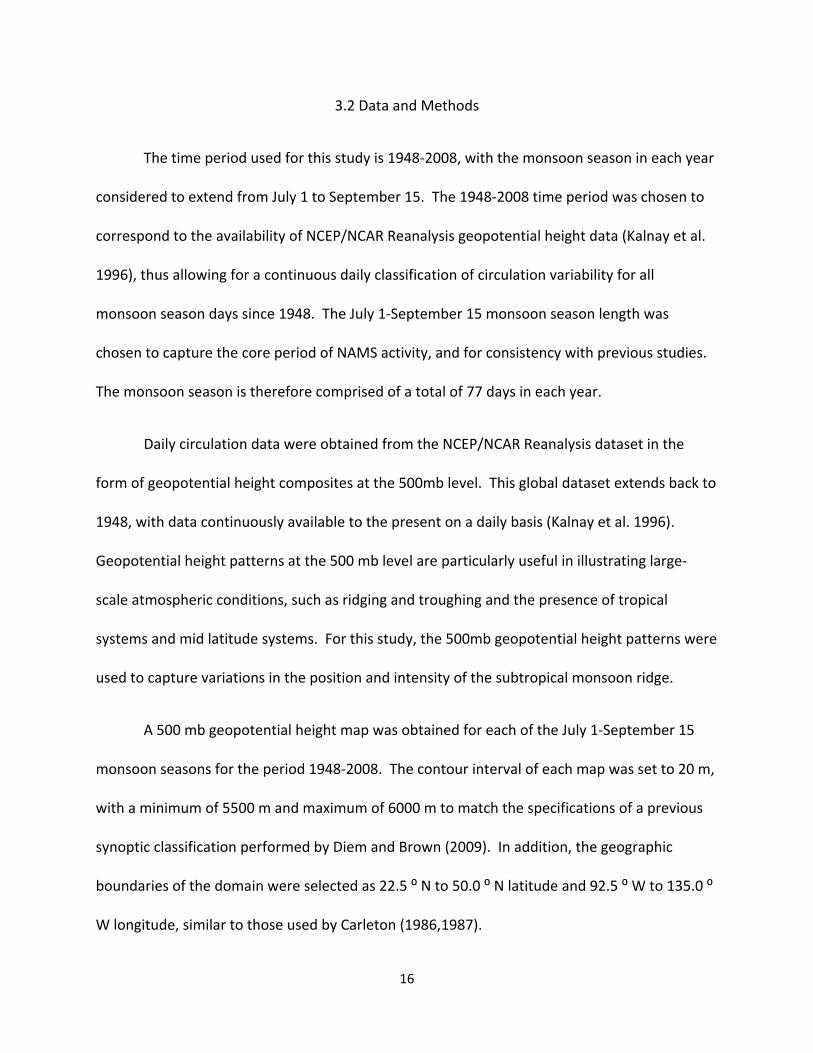
3.2 Data and Methods
The time period used for this study is 1948‐2008, with the monsoon season in each year
considered to extend from July 1 to September 15. The 1948‐2008 time period was chosen to
correspond to the availability of NCEP/NCAR Reanalysis geopotential height data (Kalnay et al.
1996), thus allowing for a continuous daily classification of circulation variability for all
monsoon season days since 1948. The July 1‐September 15 monsoon season length was
chosen to capture the core period of NAMS activity, and for consistency with previous studies.
The monsoon season is therefore comprised of a total of 77 days in each year.
Daily circulation data were obtained from the NCEP/NCAR Reanalysis dataset in the
form of geopotential height composites at the 500mb level. This global dataset extends back to
1948, with data continuously available to the present on a daily basis (Kalnay et al. 1996).
Geopotential height patterns at the 500 mb level are particularly useful in illustrating large‐
scale atmospheric conditions, such as ridging and troughing and the presence of tropical
systems and mid latitude systems. For this study, the 500mb geopotential height patterns were
used to capture variations in the position and intensity of the subtropical monsoon ridge.
A 500 mb geopotential height map was obtained for each of the July 1‐September 15
monsoon seasons for the period 1948‐2008. The contour interval of each map was set to 20 m,
with a minimum of 5500 m and maximum of 6000 m to match the specifications of a previous
synoptic classification performed by Diem and Brown (2009). In addition, the geographic
boundaries of the domain were selected as 22.5 ⁰ N to 50.0 ⁰ N latitude and 92.5 ⁰ W to 135.0 ⁰
W longitude, similar to those used by Carleton (1986,1987).
17
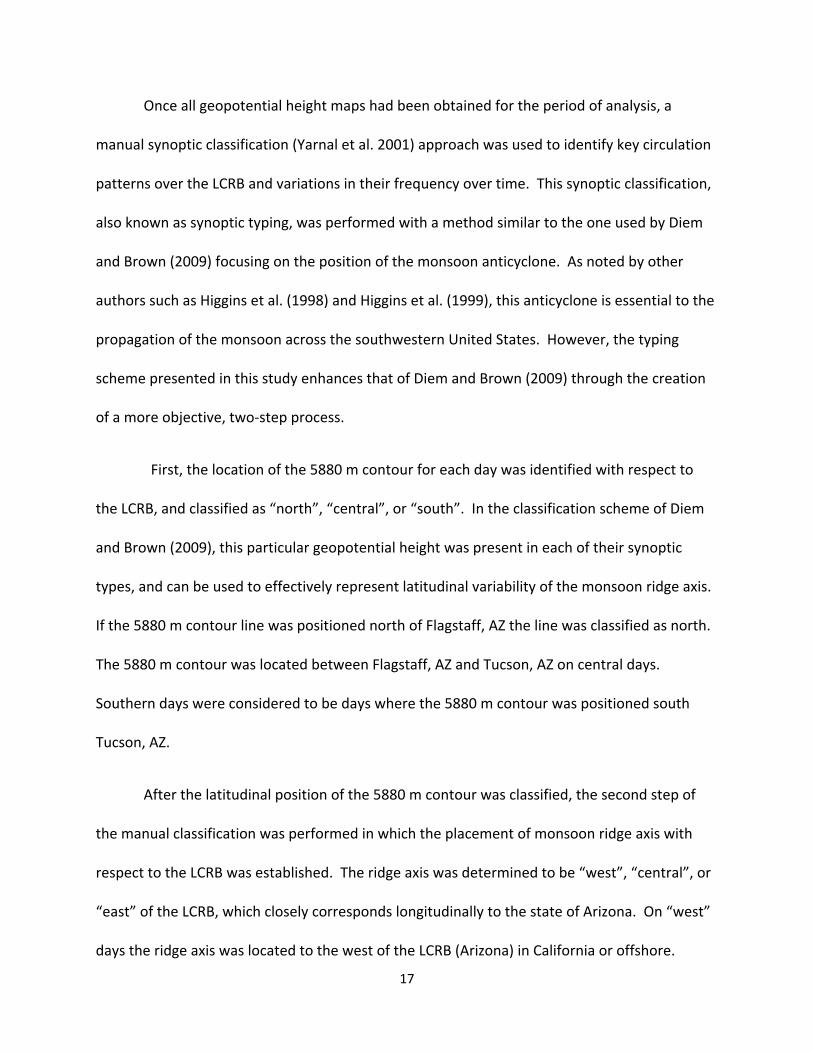
Once all geopotential height maps had been obtained for the period of analysis, a
manual synoptic classification (Yarnal et al. 2001) approach was used to identify key circulation
patterns over the LCRB and variations in their frequency over time. This synoptic classification,
also known as synoptic typing, was performed with a method similar to the one used by Diem
and Brown (2009) focusing on the position of the monsoon anticyclone. As noted by other
authors such as Higgins et al. (1998) and Higgins et al. (1999), this anticyclone is essential to the
propagation of the monsoon across the southwestern United States. However, the typing
scheme presented in this study enhances that of Diem and Brown (2009) through the creation
of a more objective, two‐step process.
First, the location of the 5880 m contour for each day was identified with respect to
the LCRB, and classified as “north”, “central”, or “south”. In the classification scheme of Diem
and Brown (2009), this particular geopotential height was present in each of their synoptic
types, and can be used to effectively represent latitudinal variability of the monsoon ridge axis.
If the 5880 m contour line was positioned north of Flagstaff, AZ the line was classified as north.
The 5880 m contour was located between Flagstaff, AZ and Tucson, AZ on central days.
Southern days were considered to be days where the 5880 m contour was positioned south
Tucson, AZ.
After the latitudinal position of the 5880 m contour was classified, the second step of
the manual classification was performed in which the placement of monsoon ridge axis with
respect to the LCRB was established. The ridge axis was determined to be “west”, “central”, or
“east” of the LCRB, which closely corresponds longitudinally to the state of Arizona. On “west”
days the ridge axis was located to the west of the LCRB (Arizona) in California or offshore.
18
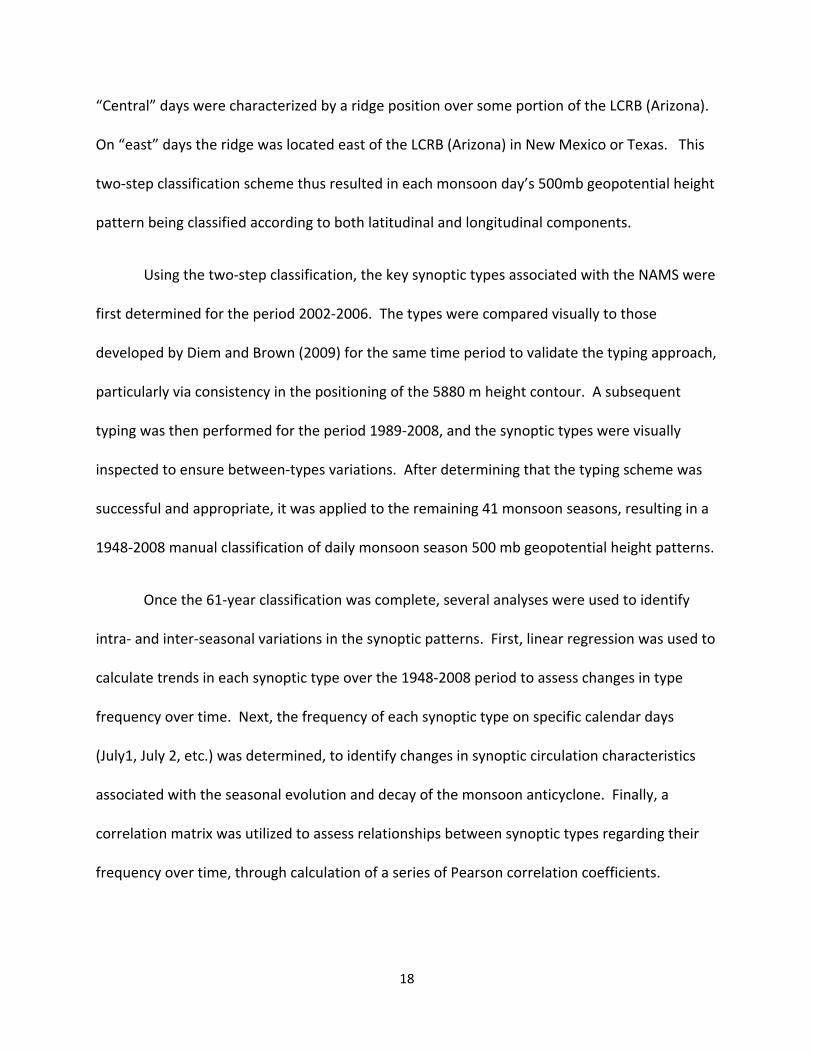
“Central” days were characterized by a ridge position over some portion of the LCRB (Arizona).
On “east” days the ridge was located east of the LCRB (Arizona) in New Mexico or Texas. This
two‐step classification scheme thus resulted in each monsoon day’s 500mb geopotential height
pattern being classified according to both latitudinal and longitudinal components.
Using the two‐step classification, the key synoptic types associated with the NAMS were
first determined for the period 2002‐2006. The types were compared visually to those
developed by Diem and Brown (2009) for the same time period to validate the typing approach,
particularly via consistency in the positioning of the 5880 m height contour. A subsequent
typing was then performed for the period 1989‐2008, and the synoptic types were visually
inspected to ensure between‐types variations. After determining that the typing scheme was
successful and appropriate, it was applied to the remaining 41 monsoon seasons, resulting in a
1948‐2008 manual classification of daily monsoon season 500 mb geopotential height patterns.
Once the 61‐year classification was complete, several analyses were used to identify
intra‐ and inter‐seasonal variations in the synoptic patterns. First, linear regression was used to
calculate trends in each synoptic type over the 1948‐2008 period to assess changes in type
frequency over time. Next, the frequency of each synoptic type on specific calendar days
(July1, July 2, etc.) was determined, to identify changes in synoptic circulation characteristics
associated with the seasonal evolution and decay of the monsoon anticyclone. Finally, a
correlation matrix was utilized to assess relationships between synoptic types regarding their
frequency over time, through calculation of a series of Pearson correlation coefficients.
19
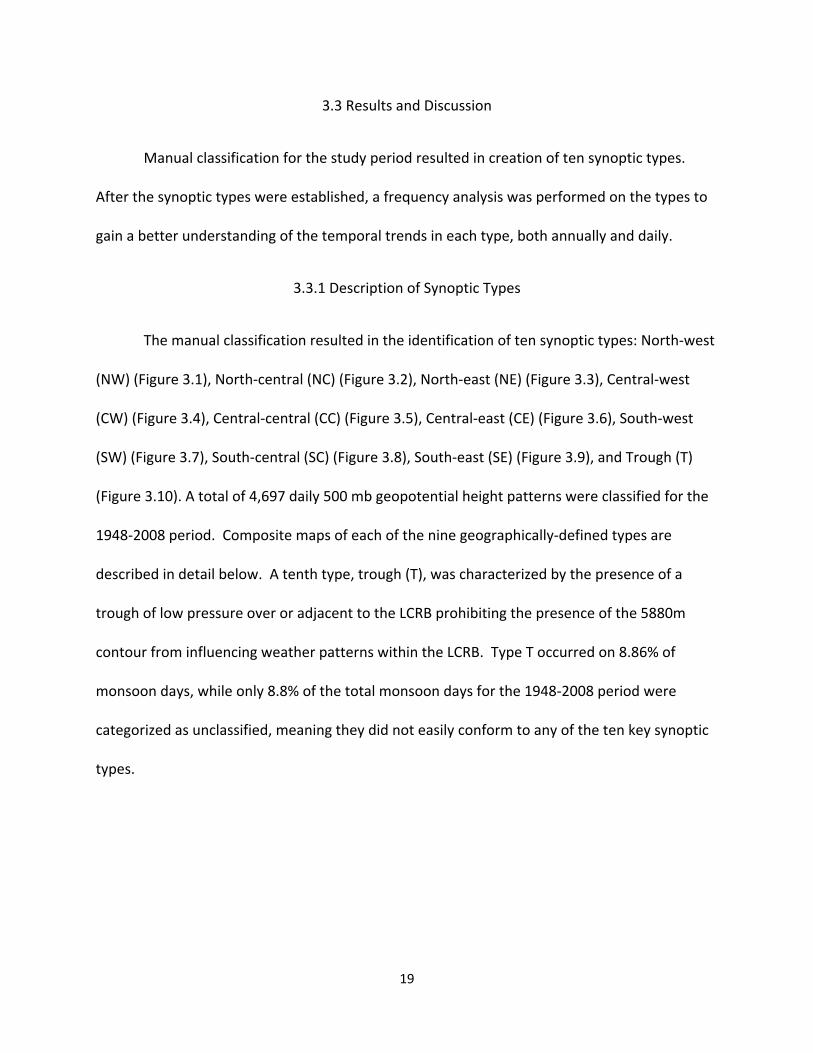
3.3 Results and Discussion
Manual classification for the study period resulted in creation of ten synoptic types.
After the synoptic types were established, a frequency analysis was performed on the types to
gain a better understanding of the temporal trends in each type, both annually and daily.
3.3.1 Description of Synoptic Types
The manual classification resulted in the identification of ten synoptic types: North‐west
(NW) (Figure 3.1), North‐central (NC) (Figure 3.2), North‐east (NE) (Figure 3.3), Central‐west
(CW) (Figure 3.4), Central‐central (CC) (Figure 3.5), Central‐east (CE) (Figure 3.6), South‐west
(SW) (Figure 3.7), South‐central (SC) (Figure 3.8), South‐east (SE) (Figure 3.9), and Trough (T)
(Figure 3.10). A total of 4,697 daily 500 mb geopotential height patterns were classified for the
1948‐2008 period. Composite maps of each of the nine geographically‐defined types are
described in detail below. A tenth type, trough (T), was characterized by the presence of a
trough of low pressure over or adjacent to the LCRB prohibiting the presence of the 5880m
contour from influencing weather patterns within the LCRB. Type T occurred on 8.86% of
monsoon days, while only 8.8% of the total monsoon days for the 1948‐2008 period were
categorized as unclassified, meaning they did not easily conform to any of the ten key synoptic
types.
20
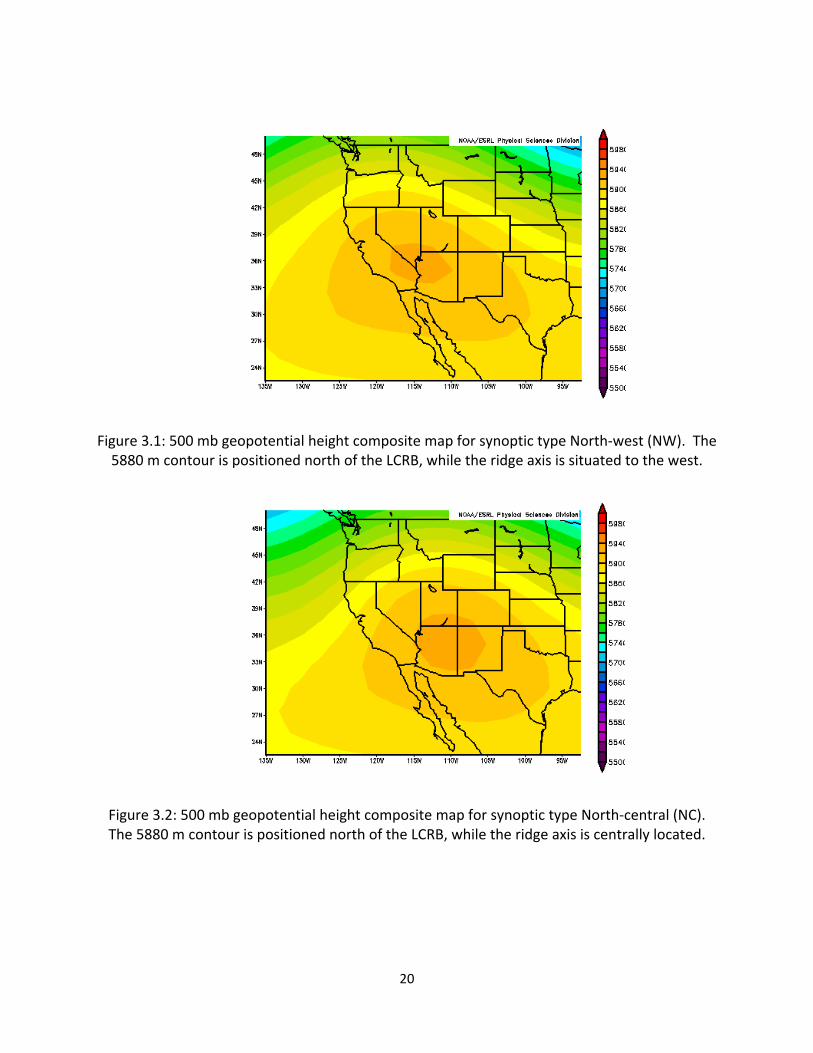
Figure 3.1: 500 mb geopotential height composite map for synoptic type North‐west (NW). The 5880 m contour is positioned north of the LCRB, while the ridge axis is situated to the west.
Figure 3.2: 500 mb geopotential height composite map for synoptic type North‐central (NC). The 5880 m contour is positioned north of the LCRB, while the ridge axis is centrally located.
21
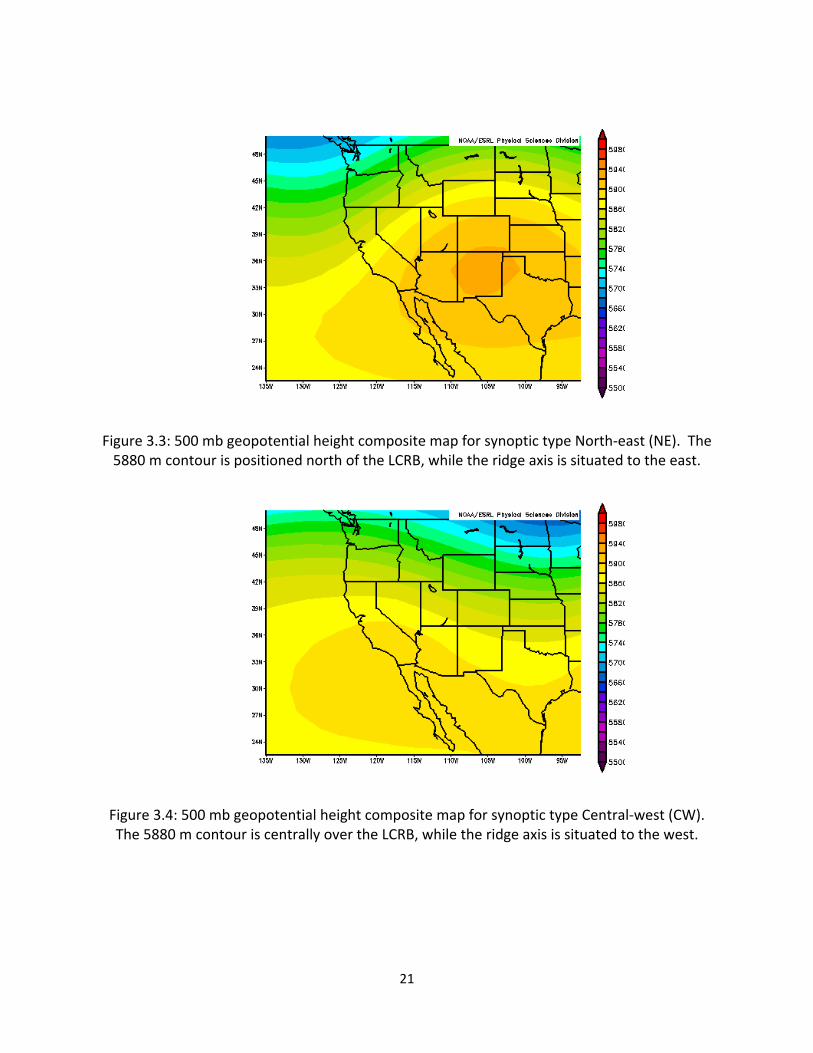
Figure 3.3: 500 mb geopotential height composite map for synoptic type North‐east (NE). The 5880 m contour is positioned north of the LCRB, while the ridge axis is situated to the east.
Figure 3.4: 500 mb geopotential height composite map for synoptic type Central‐west (CW). The 5880 m contour is centrally over the LCRB, while the ridge axis is situated to the west.
22
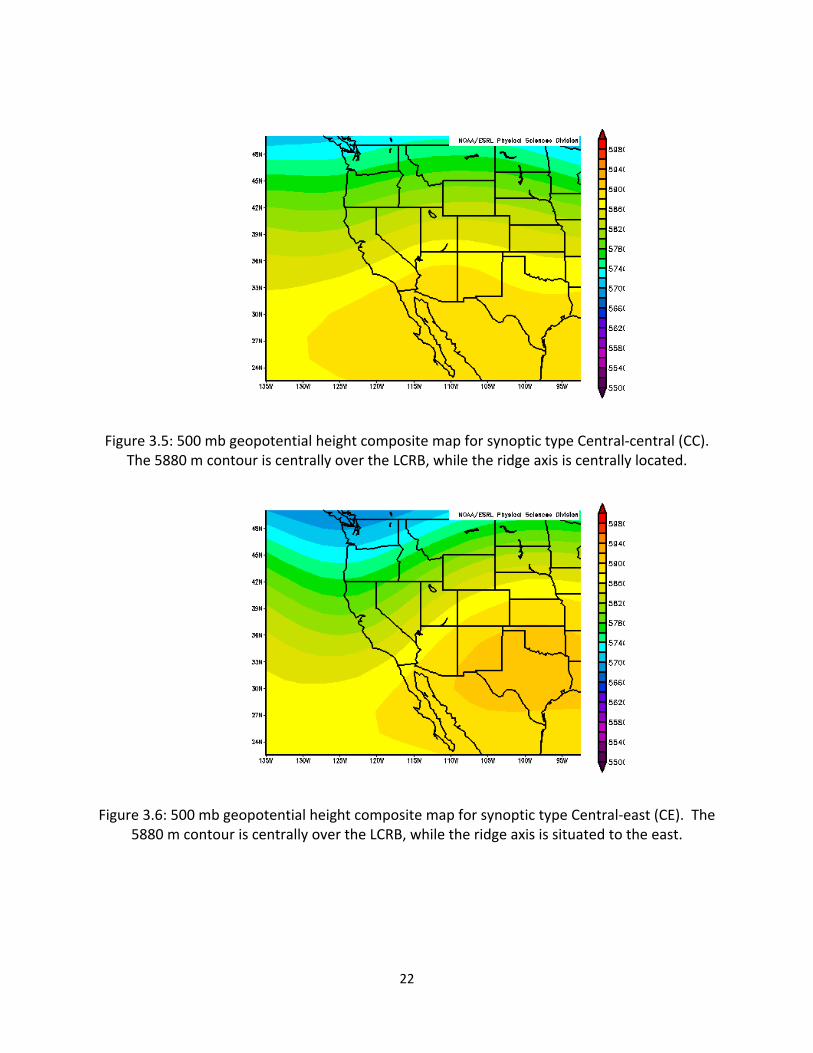
Figure 3.5: 500 mb geopotential height composite map for synoptic type Central‐central (CC).
The 5880 m contour is centrally over the LCRB, while the ridge axis is centrally located.
Figure 3.6: 500 mb geopotential height composite map for synoptic type Central‐east (CE). The
5880 m contour is centrally over the LCRB, while the ridge axis is situated to the east.
23
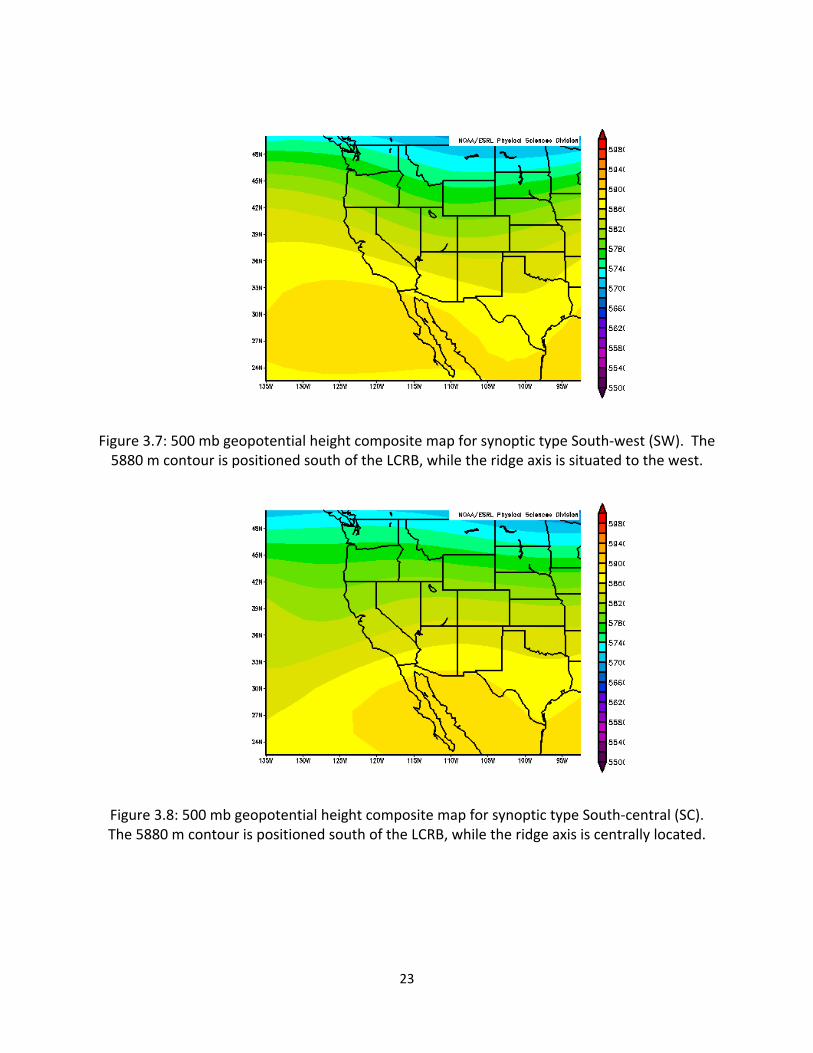
Figure 3.7: 500 mb geopotential height composite map for synoptic type South‐west (SW). The 5880 m contour is positioned south of the LCRB, while the ridge axis is situated to the west.
Figure 3.8: 500 mb geopotential height composite map for synoptic type South‐central (SC). The 5880 m contour is positioned south of the LCRB, while the ridge axis is centrally located.
24
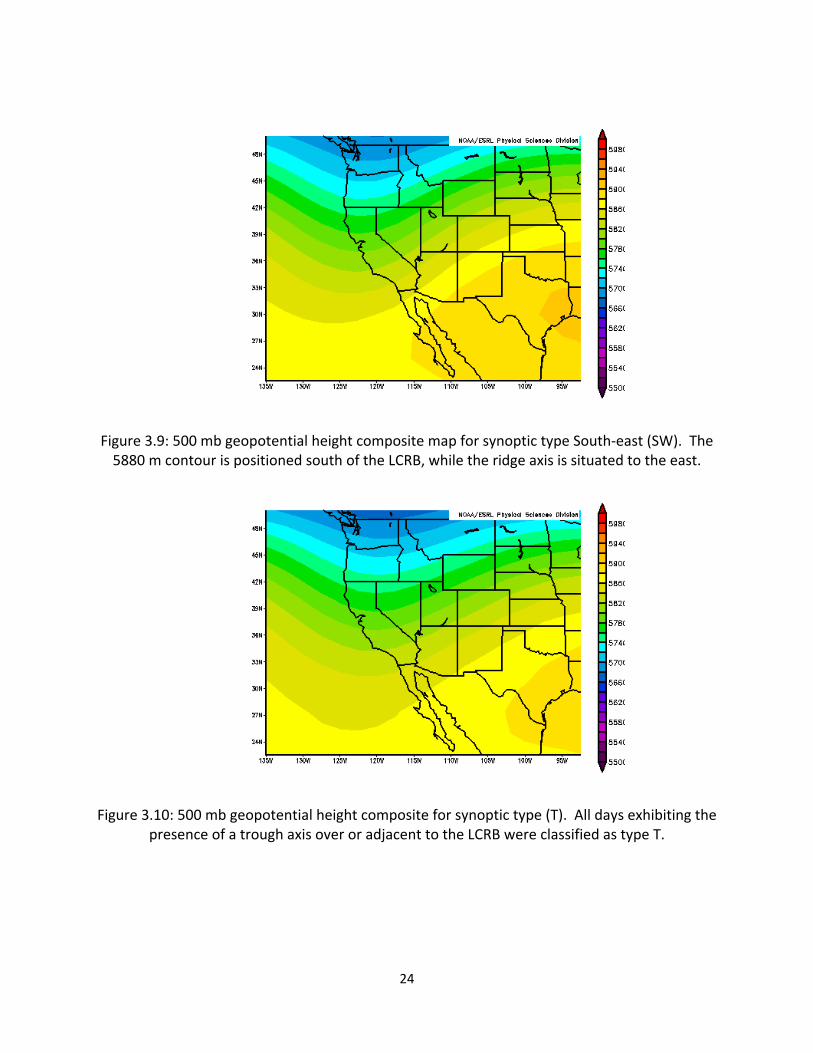
Figure 3.9: 500 mb geopotential height composite map for synoptic type South‐east (SW). The 5880 m contour is positioned south of the LCRB, while the ridge axis is situated to the east.
Figure 3.10: 500 mb geopotential height composite for synoptic type (T). All days exhibiting the
presence of a trough axis over or adjacent to the LCRB were classified as type T.

25
The majority of the monsoon season was dominated by a northward displaced contour
consistent with the influence of the monsoon ridge axis. Together, the three northern types
(NW, NC, NE) comprised 63.98% of all monsoon season days classified from 1948‐2008. Type
NW, which occurred on 11.43% of all monsoon days, was characterized by a ridge of high
pressure with the 5880 m contour positioned north of Flagstaff, AZ, and a westward positioned
ridge axis. Type NC, occurring on 17.44% of monsoon days, was denoted by a northward
displaced 5880 m contour and a centrally positioned ridge axis. Finally, type NC was
characterized by a 5880 m contour located north of Flagstaff, AZ and a ridge axis located over
Arizona. The most frequently occurring type, NC was observed on 35.11% of monsoon days
during the study period.
Among the synoptic types positioned centrally with respect to latitude, type CW was
denoted by a 5880 m contour positioned between Flagstaff, AZ and Tucson, AZ, with the
strongest portion of the ridge axis lying west of the region. This type, CW, occurred only on
1.06% of all monsoon days. Occurring on 0.70% of monsoon days, type CC was characterized by
both a centrally positioned 5880 m contour and ridge axis. Lastly, type CE has a centrally
positioned 5880 m contour, and eastward shifted ridge axis, and occurred on 10.99% of
monsoon days. In total, the three central synoptic types (CW, CC, CE) comprised only 12.75% of
monsoon days that were classified.
Regarding types associated with a southward displaced 5880 m contour, type SW was
characterized by a contour positioned south of Tucson, AZ and a ridge axis located west of
Arizona. This type comprised only 1.00% of the monsoon days classified. Type SC was
denoted by a southerly‐positioned 5880 m contour and a central ridge axis. This type, SC,

26
occurs least of all synoptic types, with a frequency of just 0.53%. The last of these types, SE, is
characterized by a 5880 m contour located south of Tucson, AZ and an easterly shifted ridge
axis. Type SE occurred on 4.85% of all monsoon days. With a total of only 6.39% of all
monsoon season days, types SW, SC, and SE represent the smallest number of typed monsoon
days.
3.3.2 Trends in Type Frequencies
To gain a better understanding of the temporal variability of the ten synoptic types,
trends in each type for the period 1948‐2008 were examined. For each type, a linear regression
was performed on the sum of events each year to establish statistical significance. As seen in
Table 3.1, a range of significance values was present with the less frequently occurring types
(central and southern) exhibiting more pronounced statistical changes over time than the more
frequent northern types. Trends in the nine core types are described in detail below. For Type
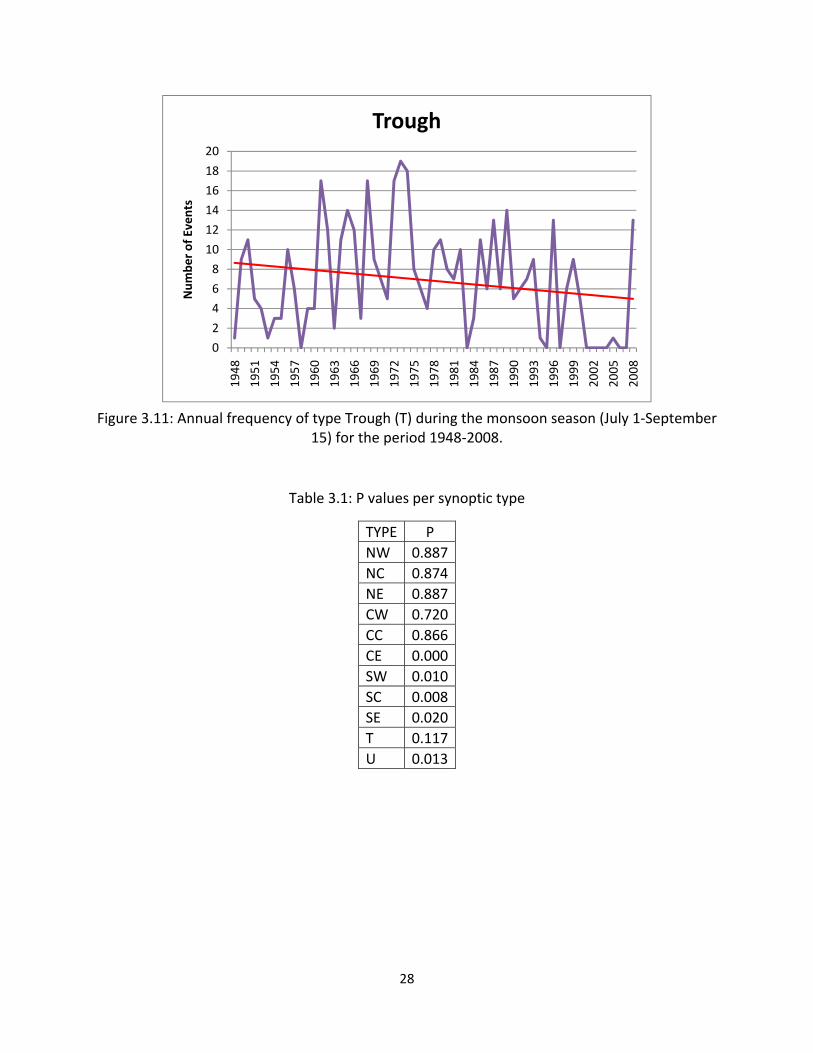
T, trough days, a slight decrease in frequency over the study period was present (Figure 3.11),
but this trend is not statistically significant (table 3.1). In general, there is a large degree of
interannual variability in the occurrence of type T days.
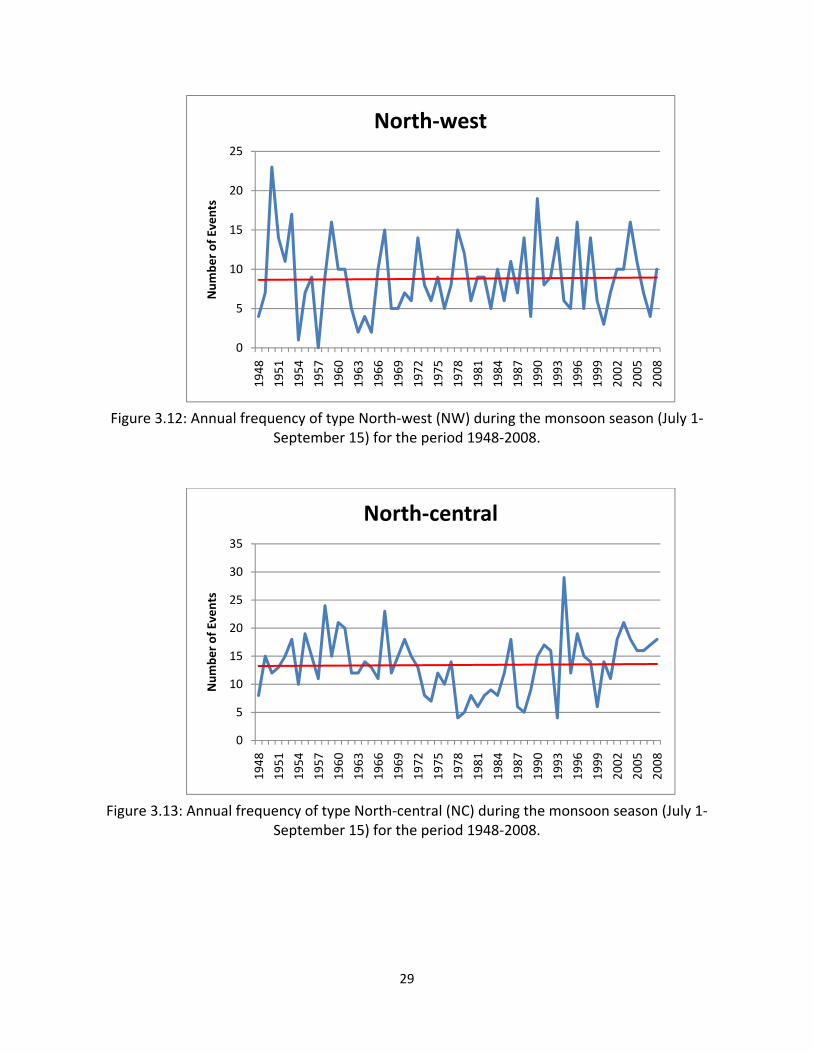
Among the northern synoptic types the frequency of type NW (figure 3.12) was
characterized by greater by a greater interannual variability in the earlier portion of the period
and reduced variability toward the middle and later years. Overall, however, no significant
trend was present as indicated by the P‐value of, 0.887, (Table 3.1). A decrease in the
frequency of type NC (figure 3.13) was present during the 1970s and early 1980s, followed by a
marked increase since the early 1990s, but no significant trend was evident in the overall

27
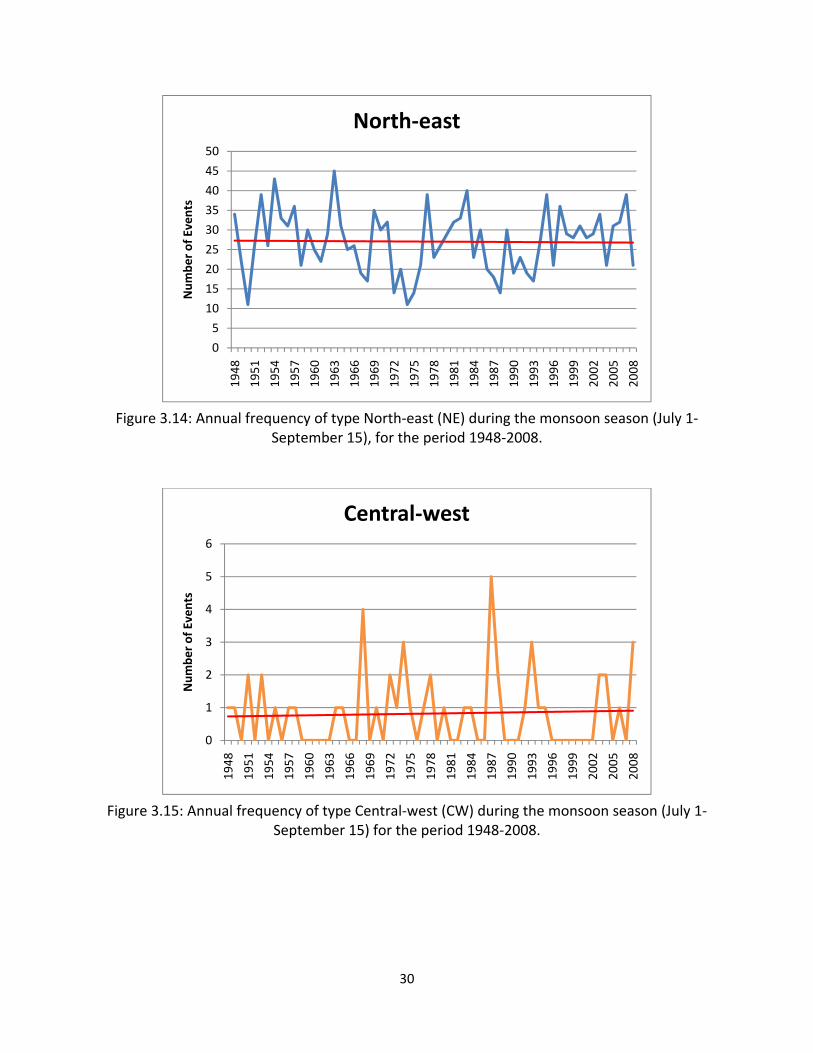
frequency of this types either (P‐value=0.874). Similarly, the P‐value for type NE was 0.887,
indicating no significant long‐term trend despite a fair amount of interannual variability (Figure
3.14). In sum, no statistically significant trends in frequency for the 1948‐2008 period were
evident in any northward positioned synoptic types.
Regarding the centrally positioned synoptic types, no statistically significant trend (P‐
value=0.720) was evident in the frequency of type CW (Figure 3.15), likely due in part to the
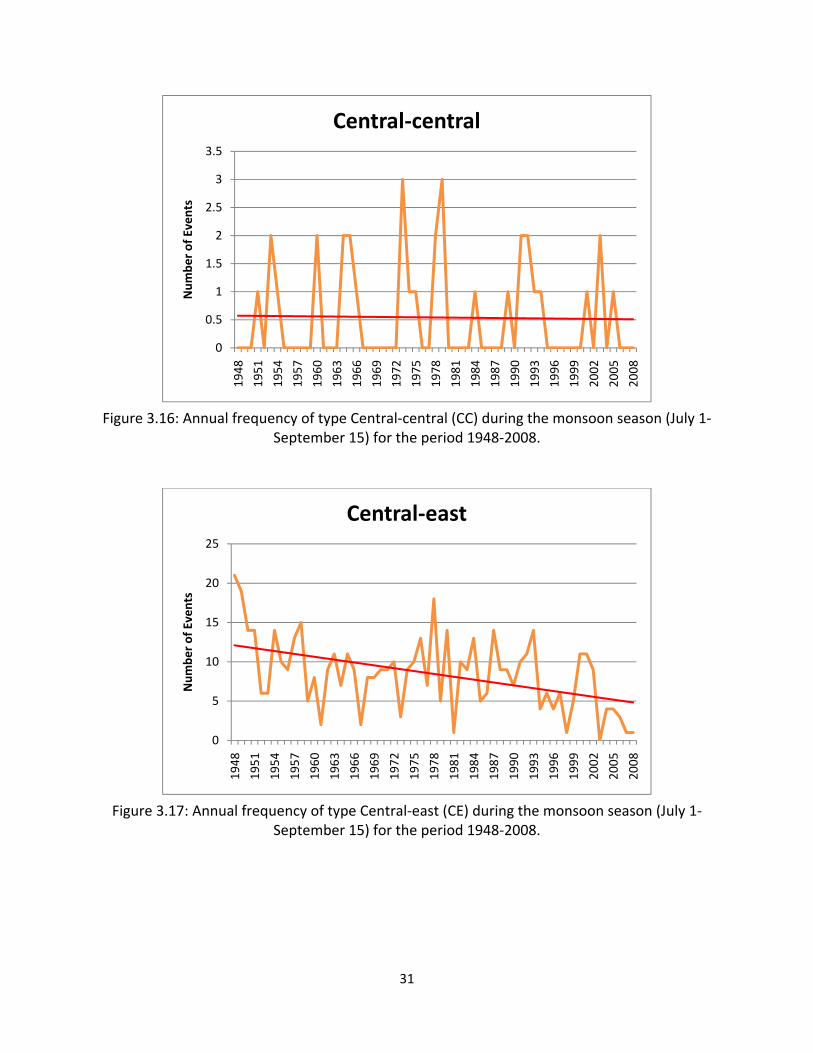
relatively small number of events per year. In similar fashion, type CC (Figure 3.16) did not
have a significant trend over time, with a P‐value, of 0.866. However, there was a dramatic
decrease throughout the study period in the frequency of type CE (Figure 3.17). This
decreasing trend was significant at the 99% level (P‐value less than 0.001).
Significant trends over time were also present in each of the southern synoptic types.
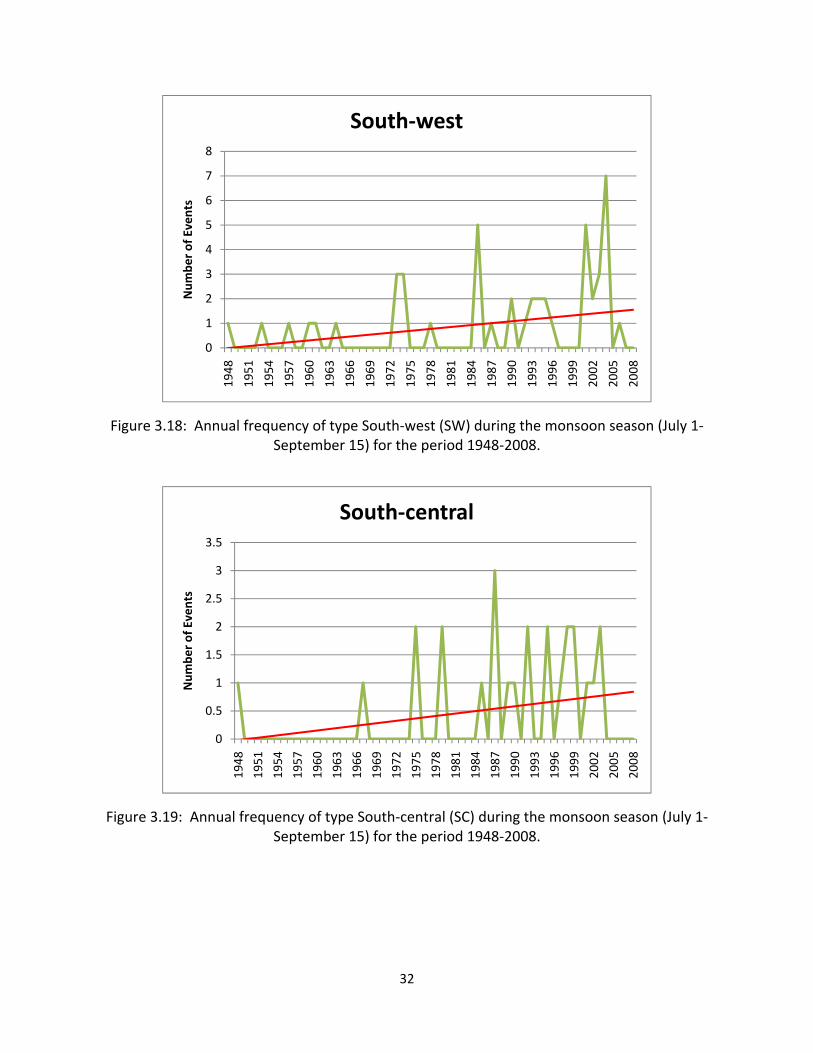
Type SW (Figure 3.18) was characterized by an increase in frequency over time, with a trend
significant at the 95% level (P‐value=0.010). Type SC (Figure 3.19) exhibits a similar pattern
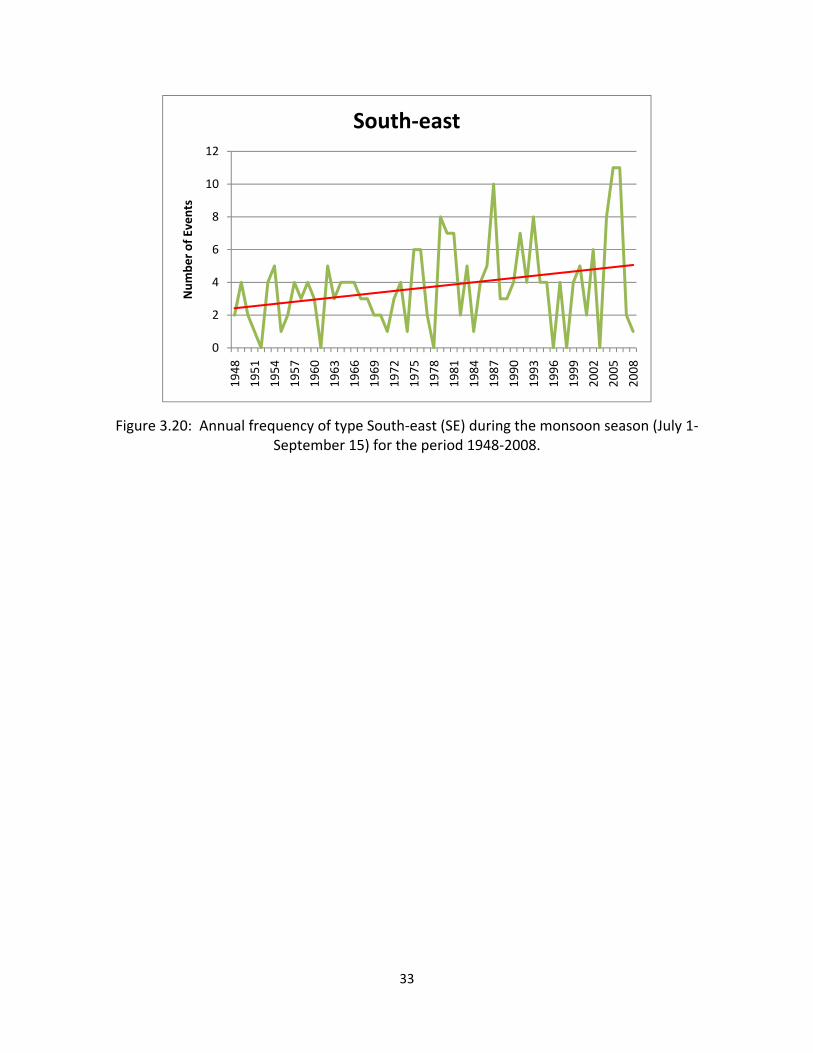
over time and was also significant at the 95% level (P‐value=0.008). Finally, among this group,
the largest change in the number of events per year is evident in type SE (Figure 3.20). This
increasing trend is again significant at the 95% confidence interval, with a P‐value of 0.020.
Although these three southern types occurred much more infrequently than most of the other
synoptic types, their increase could be meaningful, as they typically coincide with a weakening
of the monsoon ridge axis, potentially suggesting an earlier demise of the monsoon and/or
shorter monsoon seasons in recent years.
28
Figure 3.11: Annual frequency of type Trough (T) during the monsoon season (July 1‐September 15) for the period 1948‐2008.
Table 3.1: P values per synoptic type
TYPE P
NW 0.887
NC 0.874
NE 0.887
CW 0.720
CC 0.866
CE 0.000
SW 0.010
SC 0.008
SE 0.020
T 0.117
U 0.013
0
2
4
6
8
10
12
14
16
18
20
1948
1951
1954
1957
1960
1963
1966
1969
1972
1975
1978
1981
1984
1987
1990
1993
1996
1999
2002
2005
2008
Number of Events
Trough
29
Figure 3.12: Annual frequency of type North‐west (NW) during the monsoon season (July 1‐September 15) for the period 1948‐2008.
Figure 3.13: Annual frequency of type North‐central (NC) during the monsoon season (July 1‐September 15) for the period 1948‐2008.
0
5
10
15
20
25
1948
1951
1954
1957
1960
1963
1966
1969
1972
1975
1978
1981
1984
1987
1990
1993
1996
1999
2002
2005
2008
Number of Events
North‐west
0
5
10
15
20
25
30
35
1948
1951
1954
1957
1960
1963
1966
1969
1972
1975
1978
1981
1984
1987
1990
1993
1996
1999
2002
2005
2008
Number of Events
North‐central
30
Figure 3.14: Annual frequency of type North‐east (NE) during the monsoon season (July 1‐September 15), for the period 1948‐2008.
Figure 3.15: Annual frequency of type Central‐west (CW) during the monsoon season (July 1‐September 15) for the period 1948‐2008.
0
5
10
15
20
25
30
35
40
45
50
1948
1951
1954
1957
1960
1963
1966
1969
1972
1975
1978
1981
1984
1987
1990
1993
1996
1999
2002
2005
2008
Number of Events
North‐east
0
1
2
3
4
5
6
1948
1951
1954
1957
1960
1963
1966
1969
1972
1975
1978
1981
1984
1987
1990
1993
1996
1999
2002
2005
2008
Number of Events
Central‐west
31
Figure 3.16: Annual frequency of type Central‐central (CC) during the monsoon season (July 1‐September 15) for the period 1948‐2008.
Figure 3.17: Annual frequency of type Central‐east (CE) during the monsoon season (July 1‐September 15) for the period 1948‐2008.
0
0.5
1
1.5
2
2.5
3
3.5
1948
1951
1954
1957
1960
1963
1966
1969
1972
1975
1978
1981
1984
1987
1990
1993
1996
1999
2002
2005
2008
Number of Events
Central‐central
0
5
10
15
20
25
1948
1951
1954
1957
1960
1963
1966
1969
1972
1975
1978
1981
1984
1987
1990
1993
1996
1999
2002
2005
2008
Number of Events
Central‐east
32
Figure 3.18: Annual frequency of type South‐west (SW) during the monsoon season (July 1‐September 15) for the period 1948‐2008.
Figure 3.19: Annual frequency of type South‐central (SC) during the monsoon season (July 1‐September 15) for the period 1948‐2008.
0
1
2
3
4
5
6
7
8
1948
1951
1954
1957
1960
1963
1966
1969
1972
1975
1978
1981
1984
1987
1990
1993
1996
1999
2002
2005
2008
Number of Events
South‐west
0
0.5
1
1.5
2
2.5
3
3.5
1948
1951
1954
1957
1960
1963
1966
1969
1972
1975
1978
1981
1984
1987
1990
1993
1996
1999
2002
2005
2008
Number of Events
South‐central
33
Figure 3.20: Annual frequency of type South‐east (SE) during the monsoon season (July 1‐September 15) for the period 1948‐2008.
0
2
4
6
8
10
12
1948
1951
1954
1957
1960
1963
1966
1969
1972
1975
1978
1981
1984
1987
1990
1993
1996
1999
2002
2005
2008
Number of Events
South‐east
34
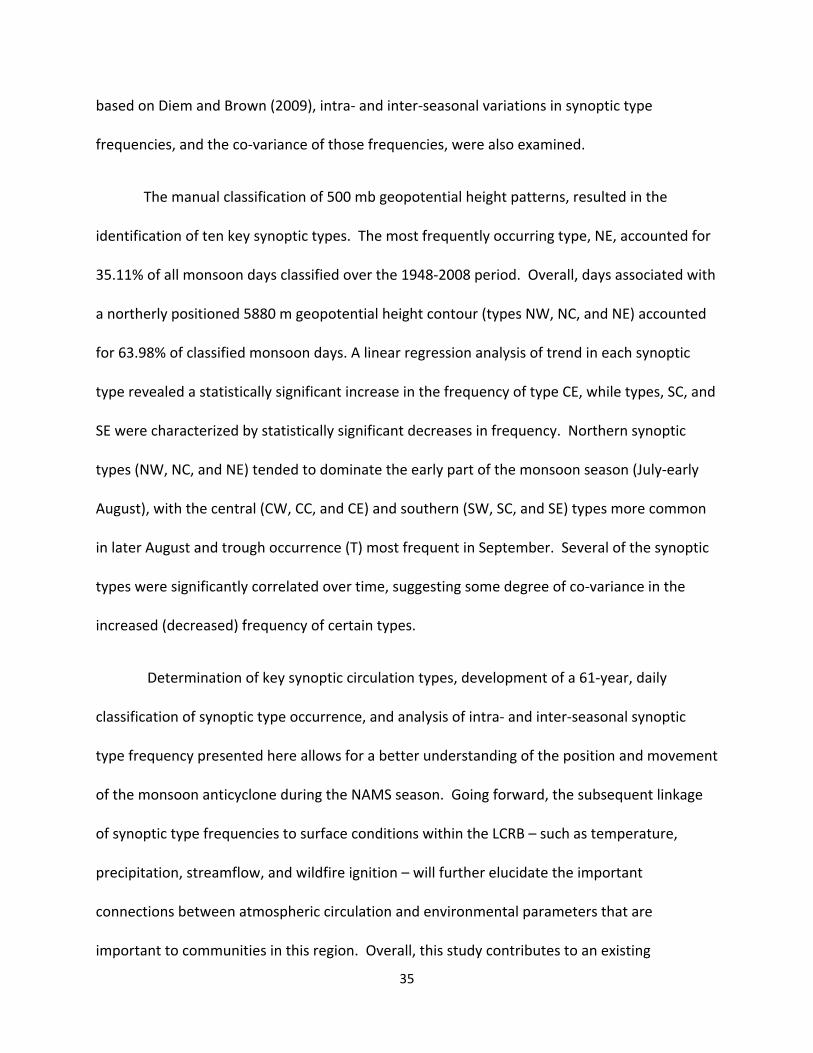
3.3.3 Intra‐seasonal (daily) type frequencies
In addition to trends in synoptic type frequencies over time, the frequency of each type
on particular days within the monsoon season (July 1, July 2, etc.) was examined. The resulting
analysis indicated a movement of the monsoon anticyclone from north to south over the course
of the monsoon season (figure 3.21). During the early portion of the season (July‐mid August),
the monsoon region is typically affected by gulf surges from the Gulf of California as well as
surges of moisture from the Gulf of Mexico. As seen in Figure 3.21, this portion of the monsoon
season was consequently dominated by northern synoptic types, which allow moisture to
advect into the region from the south. By the middle of August, central and southern synoptic
types were observed more frequently, and by September there was a marked increase in
trough frequency, corresponding to the end of the monsoon season and an increase in mid‐
latitude cyclone activity. This noticeable increase in the occurrence of trough events in late
August/early September suggests the synoptic breakdown of the NAMS.
3.4 Conclusion
A synoptic climatology of 500 mb geopotential height patterns associated with the
North American Monsoon System (NAMS) was undertaken for the period 1948‐2008. The
synoptic climatology was centered on the Lower Colorado River Basin (LCRB), a large watershed
that includes portions of five southwestern states and that contains a range of environmental
and social systems that are impacted by, or dependent upon, warm season precipitation
associated with the NAMS. In addition to a circulation‐to‐environment manual classification of
daily geopotential height patterns, which incorporated an enhanced classification scheme
35
based on Diem and Brown (2009), intra‐ and inter‐seasonal variations in synoptic type
frequencies, and the co‐variance of those frequencies, were also examined.
The manual classification of 500 mb geopotential height patterns, resulted in the
identification of ten key synoptic types. The most frequently occurring type, NE, accounted for
35.11% of all monsoon days classified over the 1948‐2008 period. Overall, days associated with
a northerly positioned 5880 m geopotential height contour (types NW, NC, and NE) accounted
for 63.98% of classified monsoon days. A linear regression analysis of trend in each synoptic
type revealed a statistically significant increase in the frequency of type CE, while types, SC, and
SE were characterized by statistically significant decreases in frequency. Northern synoptic
types (NW, NC, and NE) tended to dominate the early part of the monsoon season (July‐early
August), with the central (CW, CC, and CE) and southern (SW, SC, and SE) types more common
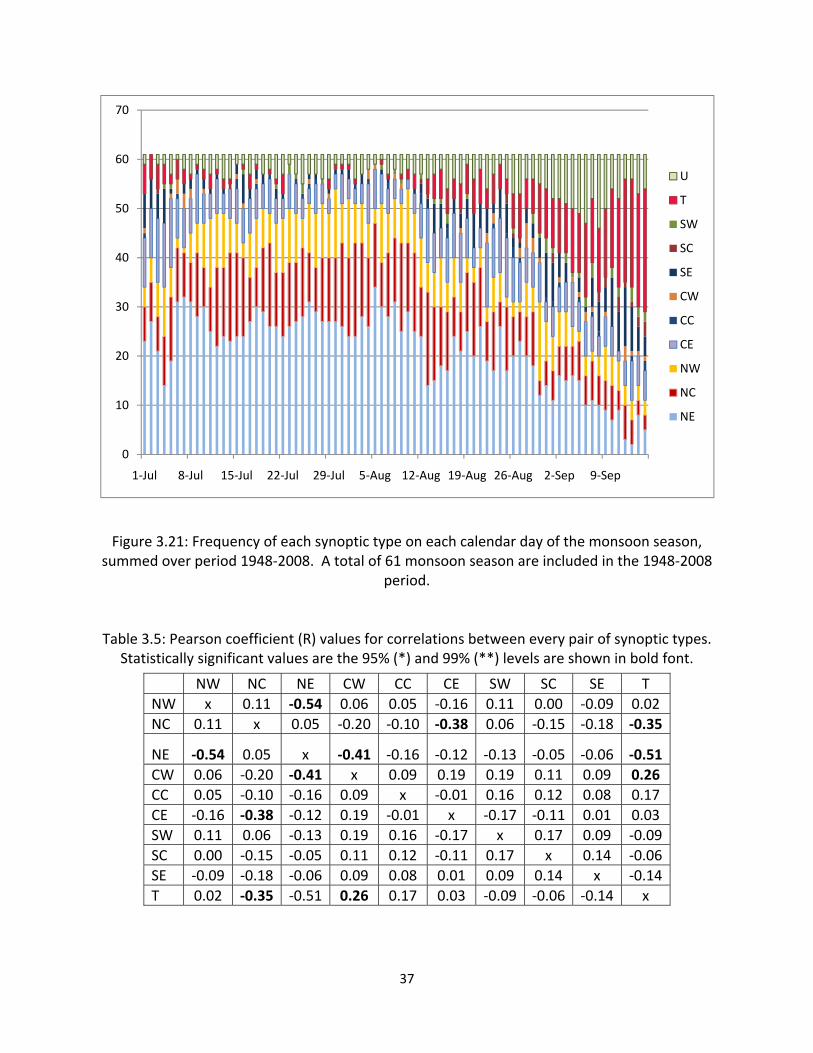
in later August and trough occurrence (T) most frequent in September. Several of the synoptic
types were significantly correlated over time, suggesting some degree of co‐variance in the
increased (decreased) frequency of certain types.
Determination of key synoptic circulation types, development of a 61‐year, daily
classification of synoptic type occurrence, and analysis of intra‐ and inter‐seasonal synoptic
type frequency presented here allows for a better understanding of the position and movement
of the monsoon anticyclone during the NAMS season. Going forward, the subsequent linkage
of synoptic type frequencies to surface conditions within the LCRB – such as temperature,
precipitation, streamflow, and wildfire ignition – will further elucidate the important
connections between atmospheric circulation and environmental parameters that are
important to communities in this region. Overall, this study contributes to an existing

36
knowledge base of NAMS research by highlighting the presence of synoptic‐scale circulation
variability both within and between monsoon seasons that can potentially be used to inform
both scientific and stakeholder‐driven applications.
37
Figure 3.21: Frequency of each synoptic type on each calendar day of the monsoon season, summed over period 1948‐2008. A total of 61 monsoon season are included in the 1948‐2008
period.
Table 3.5: Pearson coefficient (R) values for correlations between every pair of synoptic types. Statistically significant values are the 95% (*) and 99% (**) levels are shown in bold font.
NW NC NE CW CC CE SW SC SE T
NW x 0.11 ‐0.54 0.06 0.05 ‐0.16 0.11 0.00 ‐0.09 0.02
NC 0.11 x 0.05 ‐0.20 ‐0.10 ‐0.38 0.06 ‐0.15 ‐0.18 ‐0.35
NE ‐0.54 0.05 x ‐0.41 ‐0.16 ‐0.12 ‐0.13 ‐0.05 ‐0.06 ‐0.51
CW 0.06 ‐0.20 ‐0.41 x 0.09 0.19 0.19 0.11 0.09 0.26
CC 0.05 ‐0.10 ‐0.16 0.09 x ‐0.01 0.16 0.12 0.08 0.17
CE ‐0.16 ‐0.38 ‐0.12 0.19 ‐0.01 x ‐0.17 ‐0.11 0.01 0.03
SW 0.11 0.06 ‐0.13 0.19 0.16 ‐0.17 x 0.17 0.09 ‐0.09
SC 0.00 ‐0.15 ‐0.05 0.11 0.12 ‐0.11 0.17 x 0.14 ‐0.06
SE ‐0.09 ‐0.18 ‐0.06 0.09 0.08 0.01 0.09 0.14 x ‐0.14
T 0.02 ‐0.35 ‐0.51 0.26 0.17 0.03 ‐0.09 ‐0.06 ‐0.14 x
0
10
20
30
40
50
60
70
1‐Jul 8‐Jul 15‐Jul 22‐Jul 29‐Jul 5‐Aug 12‐Aug 19‐Aug 26‐Aug 2‐Sep 9‐Sep
U
T
SW
SC
SE
CW
CC
CE
NW
NC
NE
38
CHAPTER 4‐ PRECIPITATION TRENDS IN THE LOWER COLORADO RIVER BASIN AND LINKAGE
TO SYNOPTIC‐SCALE CIRCULATION VARIABILITY
4.1 Introduction
Occurring every year, the North American Monsoon System (NAMS) begins in Mexico in
early June migrating northward to affect the United States primarily in July and August. Some
locations in the southwest United States, such as the Lower Colorado River Basin (LCRB),
receive over half of their total annual precipitation during the monsoon season (Ray et al.
2007). The onset of the NAMS brings a wide range of physical and socio‐economic impacts to
the LCRB, including: lightning strikes and wildfire ignition, severe storms, flash floods, and an
increased risk of vector‐borne disease transmission. The timing of the monsoon is particularly
critical as this semiarid watershed relies upon the on the onset of the monsoon for agricultural
applications and drought and wildfire relief.
The variability of monsoon rainfall within the LCRB has many important implications,
and an understanding of the atmospheric circulation features that control summer rainfall
delivery to this region is therefore crucial. While a number of previous studies have examined
either variations in monsoonal precipitation or in synoptic‐scale features of NAMS circulation
(Adams & Comrie 1997, Higgins et al. 2004), none have focused on the variability of monsoon
precipitation across the extent of the entire LCRB and its relation to synoptic‐scale circulation.
In a recent study ( see Chapter 3), ten key 500 mb gepotential height patterns centered over
the LCRB and associated with the NAMS season were identified, and their frequency and
variability over the 1948‐2008 period analyzed. Because precipitation in the LCRB during the
warm season is closely linked to synoptic‐scale features such as the position of the monsoon
anticyclone and the occurrence of gulf surges. The establishment of a connection between
39
these ten synoptic types and precipitation in the LCRB could assist in forecasting efforts as well
as assessments of vulnerability to precipitation‐based hazards.
To assess variations in both precipitation within and circulation across the LCRB, the
following research question is addressed in this study:
How has monsoon rainfall within the Lower Colorado River Basin, USA varied
over time, and how is that rainfall linked to synoptic‐scale circulation patterns?
Three specific objectives were used to guide the research:
Identify trends in total monsoon season precipitation for the 1948‐2008 period
at four key sites located within the LCRB
Identify trends in the frequency of all‐season heavy precipitation events for the
1948‐2008 period, at the same four sites.
Assess monsoon season precipitation characteristics at each of the four sites
with respect to synoptic‐scale circulation variability, utilizing the typing scheme
developed in Chapter 3.
4.2 Data and Methods
Daily precipitation data were acquired from the National Climatic Data Center (NCDC)
for 61 years, 1948‐2008, for four key stations located within the LCRB: Flagstaff, AZ, Phoenix,
AZ, Tucson, AZ and Las Vegas, NV. These four stations were chosen because they provide an
approximate northwest‐to‐southeast transect across the LCRB, represent a variety of elevations
as well as regions of differing topographic relief, and numerous stakeholder groups who are
40
impacted by NAMS activity reside in these cities. In instances where a daily precipitation value
was missing, precipitation from a site in proximity was used as a replacement. The
precipitation data for Flagstaff, AZ were primarily collected at Flagstaff Pullman Airport, with
missing data days supplied from the Flagstaff WB station to establish a complete precipitation
record for 1948‐2008. Precipitation from the Flagstaff WB station was used for the period
January 1948‐March 1951 and then edited to comprise only the monsoon season. Complete
data records were in place at the Phoenix, AZ site, Sky Harbor International Airport, and at the
Tucson, AZ station, Tucson International Airport station. Finally, Las Vegas McCarran Airport
served as the primary site for Las Vegas, NV. Data from the nearby Las Vegas WB station was
substituted for 1948, which was missing in the McCarran record. This substitution completed
the 1948‐2008 continuous daily record.
For the first objective, identification of trends in total monsoon precipitation for the
1948‐2008 period, all days except for July 1‐September 15 were deleted from each city’s data
record. The selection of a July1‐September 15 monsoon season is consistent with the synoptic
typing analysis presented in Chapter 3, and serves to capture the core of the NAMS season in
the southwestern United States. At each of the four sites, total precipitation for each
monsoon season was calculated to assess trends over the 61‐year study period. Using linear
regression, the statistical significance of trends in total monsoon season precipitation was
assessed at Las Vegas, Flagstaff, Phoenix, and Tucson.
To assess the second objective, trends in the frequency of heavy precipitation events
over the same 1948‐2008 period, time series of precipitation extremes were created for each of
the study sites. The minimum amount of daily precipitation to be classified as a heavy event

41
was 0.50 inch at Phoenix, AZ and Las Vegas, NV and 1.00 inch at Flagstaff, AZ and Tucson, AZ.
The truncation levels for heavy events at Flagstaff, AZ and Tucson, AZ were larger because the
influence of topography (i.e., orographic lifting) and gulf surges (i.e., influx of moisture from the
Gulf of California) allowing heavier precipitation events at the two sites, respectively. Heavy
events for all season, not just the monsoon period of July1‐September15, were extracted for
each of the study sites. This was done to increase the number of observations used in the
analysis as well as to determine, on a “first order” basis, if trends in the frequence of extreme
events were present regardless of seasonality.
Each of the four heavy precipitation events series was assessed for conformity to the
Poisson distribution. If the distribution is found through tests of equality of mean and variance,
then analyses can be performed on the inter‐arrival times between events, thus permitting an
assessment of changes in the frequency of such events. The distribution relies on the
assumption that the data counts are Poisson distributed (Keim & Cruise 1998), as well the
assumption of equality of mean and variance. To prove the Poisson distribution is met, counts
of each series must be calculated. After the counts are determined, the mean and variance of
the annual counts are derived and divided to determine the R value. Using the chi‐squared
statistic, a rejection region is then established. Because 61 years of data were used in this
study, an N=60 was calculated which established a rejection region of 1.24 using the chi square
statistic. Once the reject region was derived, the ratio of the mean and variance for each series
was compared to the rejection region. To accept the hypothesis that the data are Poisson
distributed, the (mean/variance) ratio must be less than the rejection region.

42
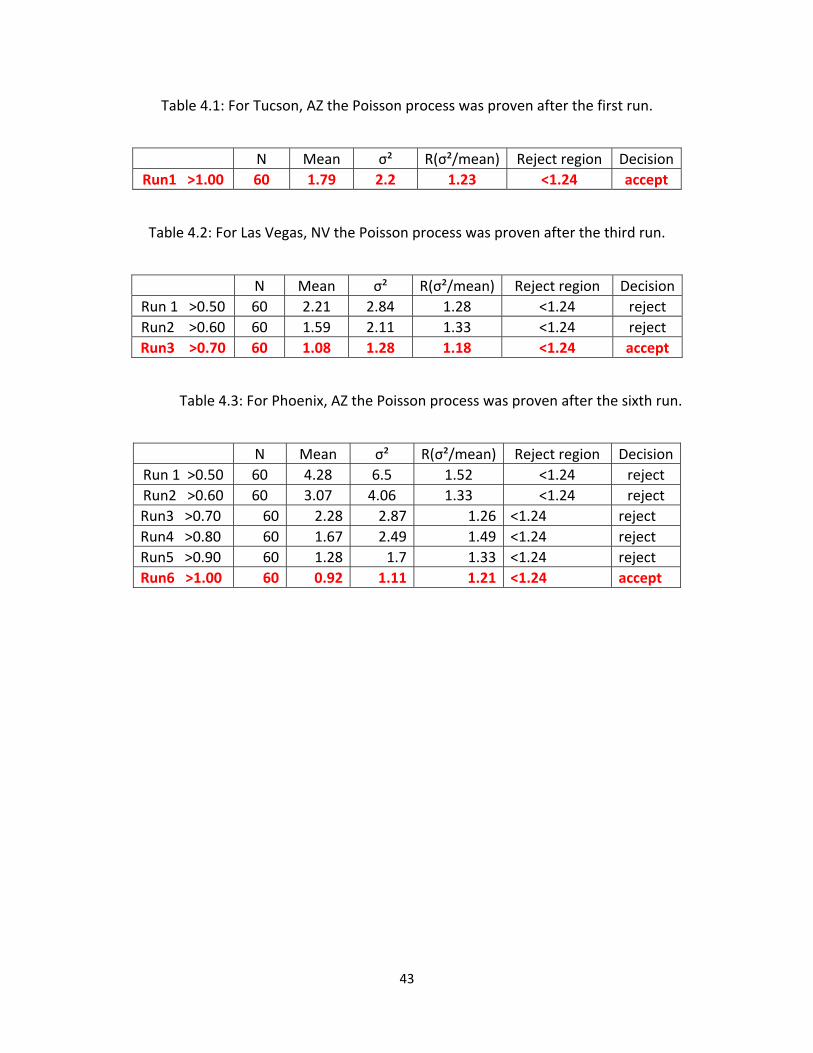
To examine the recurrence of heavy precipitation events under the Poisson process, the
mean and variance of the heavy event counts were examined. For Tucson, AZ the Poisson
distribution was proven for the counts on the first attempt (table 4.1). For the other three
sites, the mean and variance were not equal after the first attempt, requiring the truncation
level to be raised by 0.10 inches. After the level was raised, the mean and variances were
recalculated. On the first attempt at Las Vegas, NV the following values were calculated:
mean=2.21, variance=2.84. The calculations were divided resulting in an R=1.28, but the
rejection region was 1.24. In this example, because the R value was larger than the rejection
region, the hypothesis of equal mean and variance was rejected. The truncation level had to be
raised to 0.70 inches, to prove the Poisson process for Las Vegas, NV (Table 4.2). On the sixth
run the Poisson distribution was proven for Phoenix, AZ and the series was raised to events
over 1.0 inches (Table 4.3). This significant increase in the truncation level left only 56 events
in the series as compared with the original 261 events. The Poisson process was not proved for
Flagstaff, AZ. After raising the truncation level to 2.8 inches only 18 events were left in the
series, and thus the process could not be proven. Due to these results, Flagstaff, AZ was
omitted from further Poisson‐based analysis and the inter‐arrival times of heavy precipitation
events were only calculated for the remaining stations.
43
Table 4.1: For Tucson, AZ the Poisson process was proven after the first run.
N Mean σ² R(σ²/mean) Reject region Decision
Run1 >1.00 60 1.79 2.2 1.23 <1.24 accept
Table 4.2: For Las Vegas, NV the Poisson process was proven after the third run.
N Mean σ² R(σ²/mean) Reject region Decision
Run 1 >0.50 60 2.21 2.84 1.28 <1.24 reject
Run2 >0.60 60 1.59 2.11 1.33 <1.24 reject
Run3 >0.70 60 1.08 1.28 1.18 <1.24 accept
Table 4.3: For Phoenix, AZ the Poisson process was proven after the sixth run.
N Mean σ² R(σ²/mean) Reject region Decision
Run 1 >0.50 60 4.28 6.5 1.52 <1.24 reject
Run2 >0.60 60 3.07 4.06 1.33 <1.24 reject
Run3 >0.70 60 2.28 2.87 1.26 <1.24 reject
Run4 >0.80 60 1.67 2.49 1.49 <1.24 reject
Run5 >0.90 60 1.28 1.7 1.33 <1.24 reject
Run6 >1.00 60 0.92 1.11 1.21 <1.24 accept
44
Once the Poisson process was proven for Las Vegas, NV, Phoenix, AZ, and Tucson, AZ,
inter‐arrival times were derived for the heavy precipitation events included in each station’s
time series. Inter‐arrival times are defined “as the time between successive events” (Keim &
Cruise 1998). For each location inter‐arrival times, were determined by calculating the number
of days that passed between each pair of heavy precipitation events. In this study, events were
“paired”, such that two events were grouped together to reduce variance during the calculation
of inter‐arrival times. Once the inter‐arrival times between all pairs of heavy events were
determined, the natural log of the sum of consecutive events was calculated at each of the four
sites, and the resulting trend in the frequency of inter‐arrival periods between heavy
precipitation events was assessed for statistical significance.
For the final objective, the linkage of monsoon precipitation to synoptic circulation
patterns, average daily rainfall was calculated at each of the four stations for each of the ten
synoptic types identified in Chapter 3. For example, using all days in the 1948‐2008 period
classified as synoptic type North‐west (NW), average precipitation was calculated for the same
set of days at the Las Vegas, Flagstaff, Phoenix, and Tucson sites. Using a two‐tailed Student’s
t‐test for unequal variances, differences in mean precipitation between synoptic types was
determined at each location, to assess whether certain synoptic types produced significantly
different rainfall amounts than others.
4.3 Results and Discussion
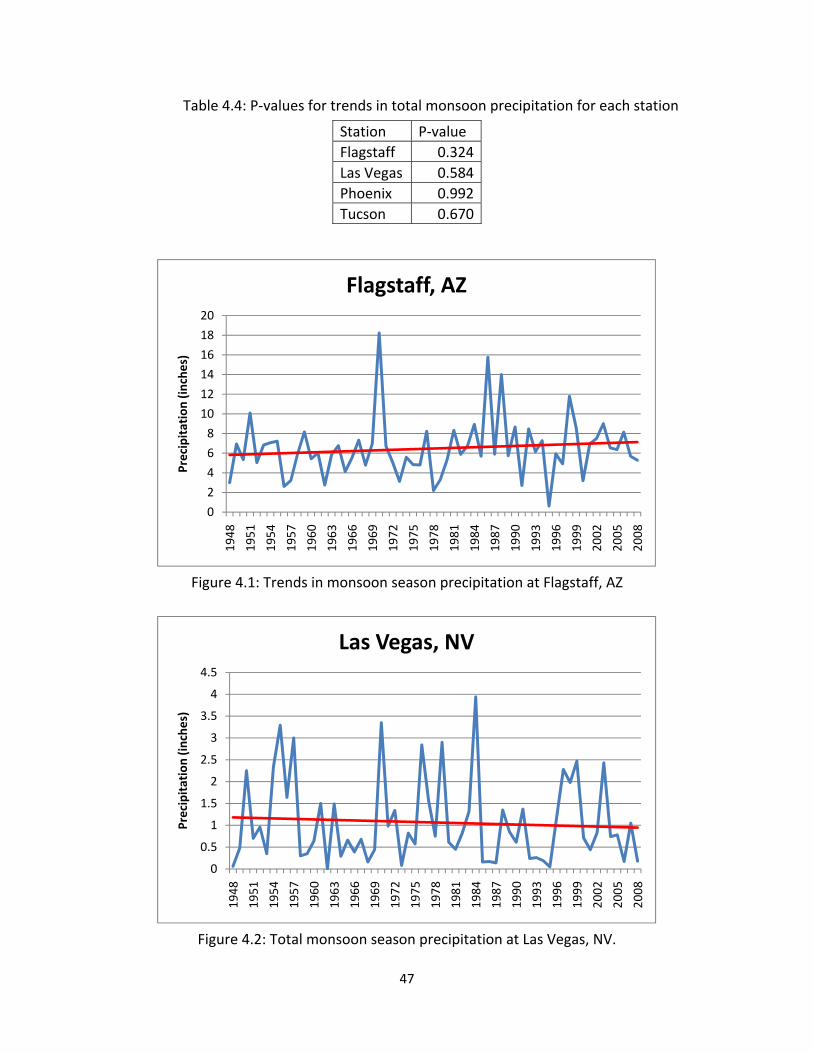
Each of the four stations was analyzed for trends in monsoonal precipitation for the
1948‐2008 time period. None of the trends were significant at the 95% confidence level (Table

45
4.4). Monsoon season rainfall at Flagstaff, AZ (Figure 4.1) did not suggest a strong trend overall,
but did exhibit marked rise in rainfall amounts in the late 1960s and early 1970s as well as in
the mid to late 1980s. Interannual fluctuations dominated the observed record in Las Vegas,
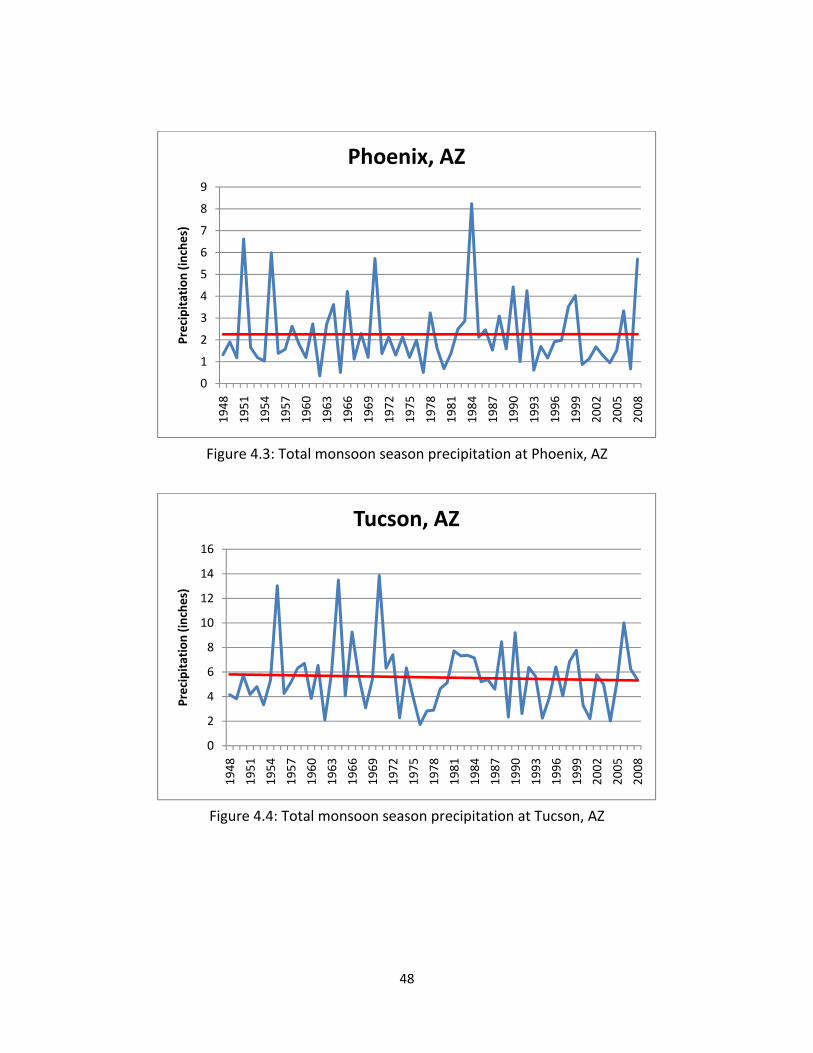
NV, but again, no statistically significant trend was present (Figure 4.2). The precipitation
record for Phoenix, AZ (Figure 4.3) was also marked by interannual variability, with, the largest
event over 8.0 inches, double the maximum event in Las Vegas. Again, though, the trend was
not statistically significant. Lastly, the trend in the total monsoon precipitation for Tucson, AZ
(figure 4.4), while also not significant, differs from those of the other three locations in that
large events occurred during the 1950s and 1960s, followed by a decrease in large precipitation
events in the late 1970s and 1980s.
Although trends in overall monsoon season precipitation were not statistically
significant, a more thorough understanding of trends in extreme events were revealed through
the analysis of inter‐arrival times of heavy precipitation events at Las Vegas, NV, Phoenix, AZ,
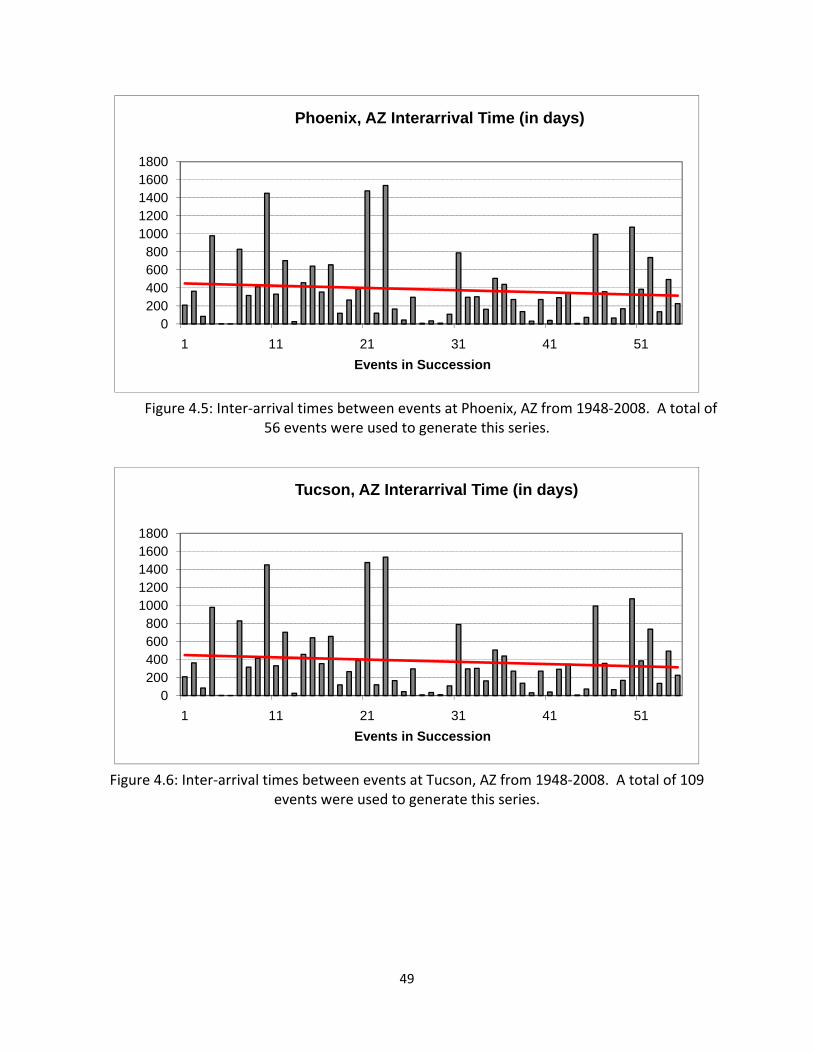
and Tucson, AZ. Inter‐arrival times between heavy events for Phoenix, AZ (Figure 4.5) exhibited
a decreasing trend, mainly because of the two larger times between events occurring during
the earlier portion of the record. For inter‐arrival times between events for Tucson, AZ (Figure
4.6) there was a weak decreasing trend, most likely due to the large amount of time between
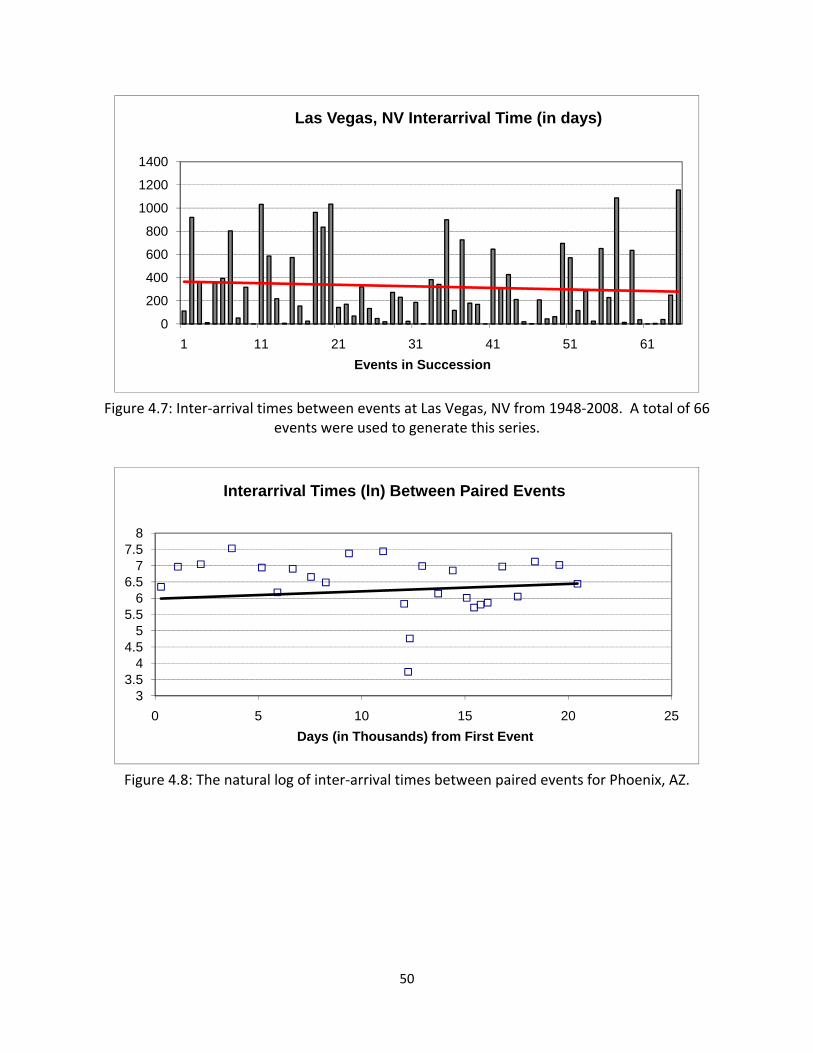
events in the earlier part of the series. The graph for Las Vegas, NV (Figure 4.7) was also
characterized by a weak decreasing trend, likely influenced by the three successive high peak
(large inter‐arrival times) events in the earlier portion of the period and the larger spacing of
heavy events later in the period. In total, the analysis of inter‐arrival periods of heavy
precipitation events at Las Vegas, NV, Phoenix, AZ, and Tucson, AZ stations showed an
46
increasing frequency of heavy events (decreasing inter‐arrival periods) over the 1948‐2008
period.
After the inter‐arrival times were calculated, the natural log of the events was plotted as
shown in Figure 4.8 for Phoenix, AZ. A linear regression was calculated for each of the sites to
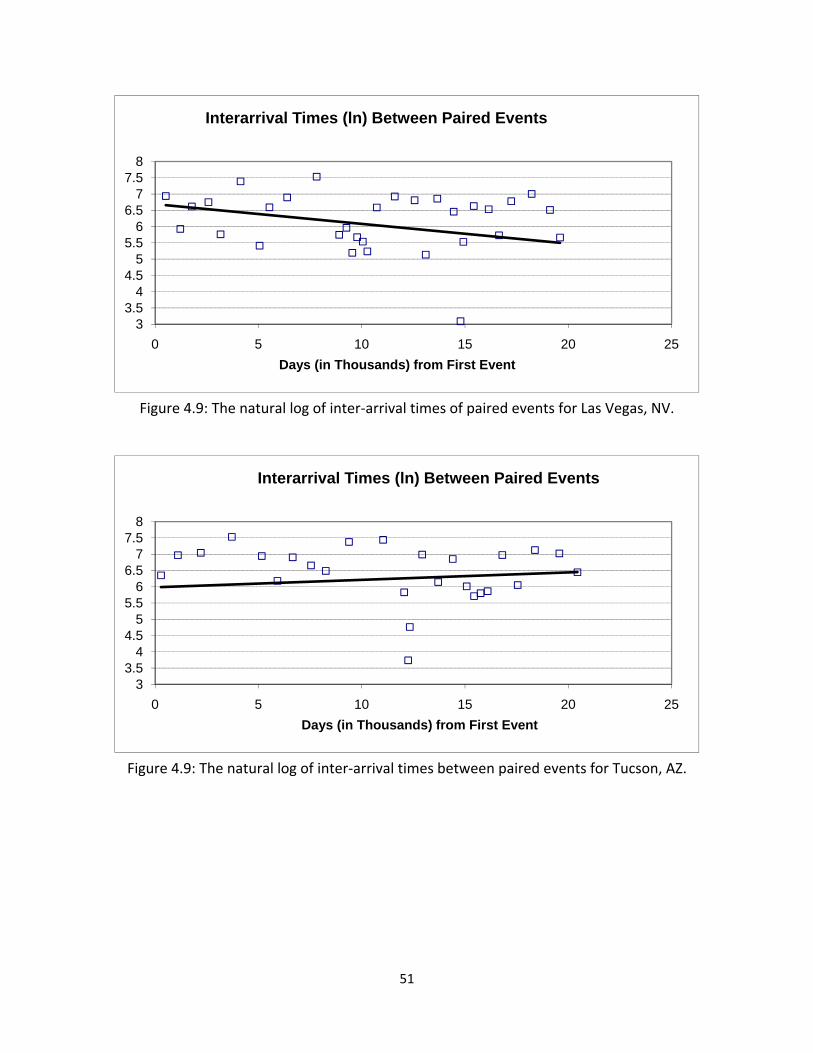
determine the significance of the trends. The strongest trend was present in the Las Vegas, NV
data (Figure 4.9), a decreasing trend significant at the 90% level. This trend indicates a rise in
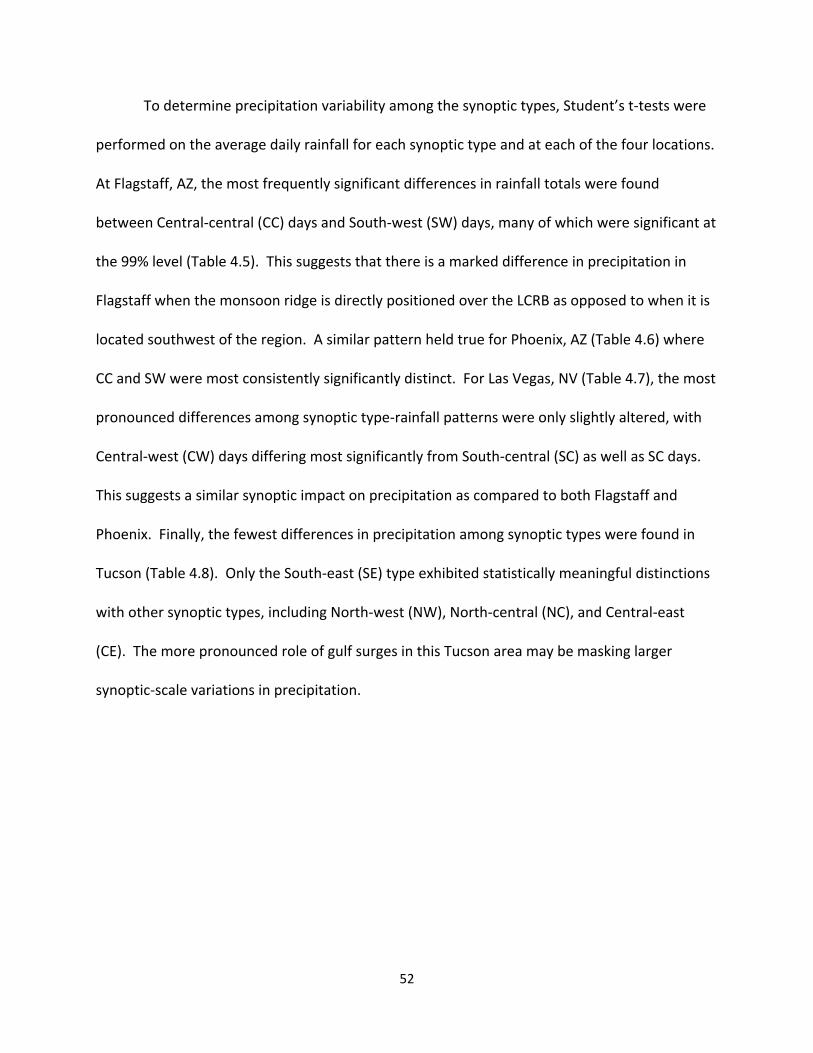
more frequent heavy rainfall events at Las Vegas, NV over the 1948‐2008 period. At Tucson,
the trend was much weaker as shown in Figure 4.10, and not statistically significant. The same
was true for Phoenix, AZ (Figure 4.8) which had the weakest trend overall.
47
Table 4.4: P‐values for trends in total monsoon precipitation for each station
Station P‐value
Flagstaff 0.324
Las Vegas 0.584
Phoenix 0.992
Tucson 0.670
Figure 4.1: Trends in monsoon season precipitation at Flagstaff, AZ
Figure 4.2: Total monsoon season precipitation at Las Vegas, NV.
0
2
4
6
8
10
12
14
16
18
20
1948
1951
1954
1957
1960
1963
1966
1969
1972
1975
1978
1981
1984
1987
1990
1993
1996
1999
2002
2005
2008
Precipitation (inches)
Flagstaff, AZ
0
0.5
1
1.5
2
2.5
3
3.5
4
4.5
1948
1951
1954
1957
1960
1963
1966
1969
1972
1975
1978
1981
1984
1987
1990
1993
1996
1999
2002
2005
2008
Precipitation (inches)
Las Vegas, NV
48
Figure 4.3: Total monsoon season precipitation at Phoenix, AZ
Figure 4.4: Total monsoon season precipitation at Tucson, AZ
0
1
2
3
4
5
6
7
8
9
1948
1951
1954
1957
1960
1963
1966
1969
1972
1975
1978
1981
1984
1987
1990
1993
1996
1999
2002
2005
2008
Precipitation (inches)
Phoenix, AZ
0
2
4
6
8
10
12
14
16
1948
1951
1954
1957
1960
1963
1966
1969
1972
1975
1978
1981
1984
1987
1990
1993
1996
1999
2002
2005
2008
Precipitation (inches)
Tucson, AZ
49
Figure 4.5: Inter‐arrival times between events at Phoenix, AZ from 1948‐2008. A total of 56 events were used to generate this series.
Figure 4.6: Inter‐arrival times between events at Tucson, AZ from 1948‐2008. A total of 109 events were used to generate this series.
0200400600800
10001200140016001800
1 11 21 31 41 51
Events in Succession
Phoenix, AZ Interarrival Time (in days)
0200400600800
10001200140016001800
1 11 21 31 41 51
Events in Succession
Tucson, AZ Interarrival Time (in days)
50
Figure 4.7: Inter‐arrival times between events at Las Vegas, NV from 1948‐2008. A total of 66 events were used to generate this series.
Figure 4.8: The natural log of inter‐arrival times between paired events for Phoenix, AZ.
0
200
400
600
800
1000
1200
1400
1 11 21 31 41 51 61
Events in Succession
Las Vegas, NV Interarrival Time (in days)
33.5
44.5
55.5
66.5
77.5
8
0 5 10 15 20 25
Days (in Thousands) from First Event
Interarrival Times (ln) Between Paired Events
51
Figure 4.9: The natural log of inter‐arrival times of paired events for Las Vegas, NV.
Figure 4.9: The natural log of inter‐arrival times between paired events for Tucson, AZ.
33.5
44.5
55.5
66.5
77.5
8
0 5 10 15 20 25
Days (in Thousands) from First Event
Interarrival Times (ln) Between Paired Events
33.5
44.5
55.5
66.5
77.5
8
0 5 10 15 20 25
Days (in Thousands) from First Event
Interarrival Times (ln) Between Paired Events
52
To determine precipitation variability among the synoptic types, Student’s t‐tests were
performed on the average daily rainfall for each synoptic type and at each of the four locations.
At Flagstaff, AZ, the most frequently significant differences in rainfall totals were found
between Central‐central (CC) days and South‐west (SW) days, many of which were significant at
the 99% level (Table 4.5). This suggests that there is a marked difference in precipitation in
Flagstaff when the monsoon ridge is directly positioned over the LCRB as opposed to when it is
located southwest of the region. A similar pattern held true for Phoenix, AZ (Table 4.6) where
CC and SW were most consistently significantly distinct. For Las Vegas, NV (Table 4.7), the most
pronounced differences among synoptic type‐rainfall patterns were only slightly altered, with
Central‐west (CW) days differing most significantly from South‐central (SC) as well as SC days.
This suggests a similar synoptic impact on precipitation as compared to both Flagstaff and
Phoenix. Finally, the fewest differences in precipitation among synoptic types were found in
Tucson (Table 4.8). Only the South‐east (SE) type exhibited statistically meaningful distinctions
with other synoptic types, including North‐west (NW), North‐central (NC), and Central‐east
(CE). The more pronounced role of gulf surges in this Tucson area may be masking larger
synoptic‐scale variations in precipitation.
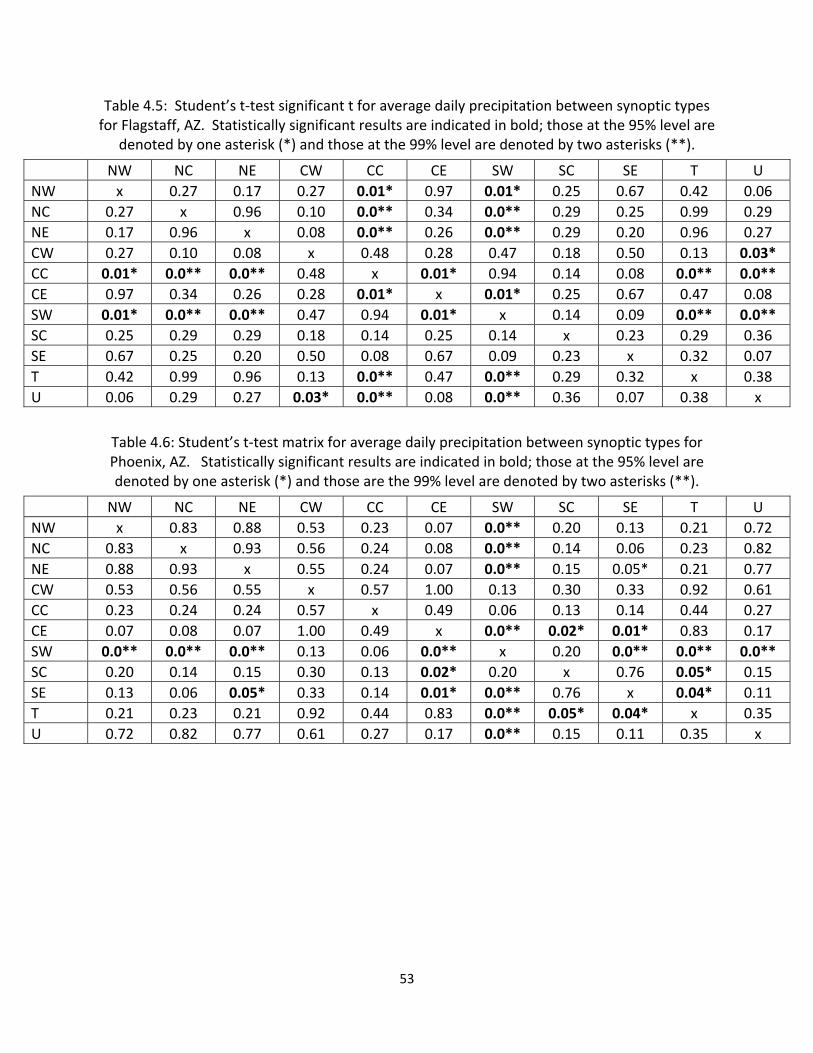
53
Table 4.5: Student’s t‐test significant t for average daily precipitation between synoptic types for Flagstaff, AZ. Statistically significant results are indicated in bold; those at the 95% level are
denoted by one asterisk (*) and those at the 99% level are denoted by two asterisks (**).
NW NC NE CW CC CE SW SC SE T U
NW x 0.27 0.17 0.27 0.01* 0.97 0.01* 0.25 0.67 0.42 0.06
NC 0.27 x 0.96 0.10 0.0** 0.34 0.0** 0.29 0.25 0.99 0.29
NE 0.17 0.96 x 0.08 0.0** 0.26 0.0** 0.29 0.20 0.96 0.27
CW 0.27 0.10 0.08 x 0.48 0.28 0.47 0.18 0.50 0.13 0.03*
CC 0.01* 0.0** 0.0** 0.48 x 0.01* 0.94 0.14 0.08 0.0** 0.0**
CE 0.97 0.34 0.26 0.28 0.01* x 0.01* 0.25 0.67 0.47 0.08
SW 0.01* 0.0** 0.0** 0.47 0.94 0.01* x 0.14 0.09 0.0** 0.0**
SC 0.25 0.29 0.29 0.18 0.14 0.25 0.14 x 0.23 0.29 0.36
SE 0.67 0.25 0.20 0.50 0.08 0.67 0.09 0.23 x 0.32 0.07
T 0.42 0.99 0.96 0.13 0.0** 0.47 0.0** 0.29 0.32 x 0.38
U 0.06 0.29 0.27 0.03* 0.0** 0.08 0.0** 0.36 0.07 0.38 x
Table 4.6: Student’s t‐test matrix for average daily precipitation between synoptic types for Phoenix, AZ. Statistically significant results are indicated in bold; those at the 95% level are denoted by one asterisk (*) and those are the 99% level are denoted by two asterisks (**).
NW NC NE CW CC CE SW SC SE T U
NW x 0.83 0.88 0.53 0.23 0.07 0.0** 0.20 0.13 0.21 0.72
NC 0.83 x 0.93 0.56 0.24 0.08 0.0** 0.14 0.06 0.23 0.82
NE 0.88 0.93 x 0.55 0.24 0.07 0.0** 0.15 0.05* 0.21 0.77
CW 0.53 0.56 0.55 x 0.57 1.00 0.13 0.30 0.33 0.92 0.61
CC 0.23 0.24 0.24 0.57 x 0.49 0.06 0.13 0.14 0.44 0.27
CE 0.07 0.08 0.07 1.00 0.49 x 0.0** 0.02* 0.01* 0.83 0.17
SW 0.0** 0.0** 0.0** 0.13 0.06 0.0** x 0.20 0.0** 0.0** 0.0**
SC 0.20 0.14 0.15 0.30 0.13 0.02* 0.20 x 0.76 0.05* 0.15
SE 0.13 0.06 0.05* 0.33 0.14 0.01* 0.0** 0.76 x 0.04* 0.11
T 0.21 0.23 0.21 0.92 0.44 0.83 0.0** 0.05* 0.04* x 0.35
U 0.72 0.82 0.77 0.61 0.27 0.17 0.0** 0.15 0.11 0.35 x
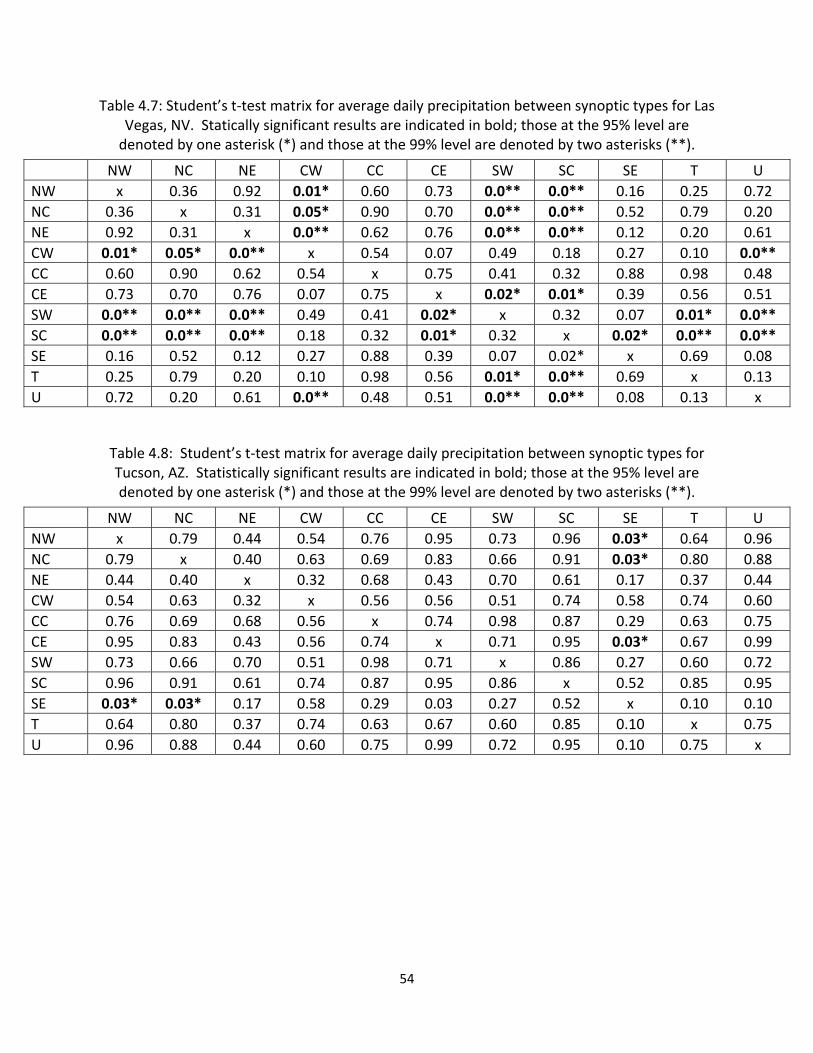
54
Table 4.7: Student’s t‐test matrix for average daily precipitation between synoptic types for Las Vegas, NV. Statically significant results are indicated in bold; those at the 95% level are denoted by one asterisk (*) and those at the 99% level are denoted by two asterisks (**).
NW NC NE CW CC CE SW SC SE T U
NW x 0.36 0.92 0.01* 0.60 0.73 0.0** 0.0** 0.16 0.25 0.72
NC 0.36 x 0.31 0.05* 0.90 0.70 0.0** 0.0** 0.52 0.79 0.20
NE 0.92 0.31 x 0.0** 0.62 0.76 0.0** 0.0** 0.12 0.20 0.61
CW 0.01* 0.05* 0.0** x 0.54 0.07 0.49 0.18 0.27 0.10 0.0**
CC 0.60 0.90 0.62 0.54 x 0.75 0.41 0.32 0.88 0.98 0.48
CE 0.73 0.70 0.76 0.07 0.75 x 0.02* 0.01* 0.39 0.56 0.51
SW 0.0** 0.0** 0.0** 0.49 0.41 0.02* x 0.32 0.07 0.01* 0.0**
SC 0.0** 0.0** 0.0** 0.18 0.32 0.01* 0.32 x 0.02* 0.0** 0.0**
SE 0.16 0.52 0.12 0.27 0.88 0.39 0.07 0.02* x 0.69 0.08
T 0.25 0.79 0.20 0.10 0.98 0.56 0.01* 0.0** 0.69 x 0.13
U 0.72 0.20 0.61 0.0** 0.48 0.51 0.0** 0.0** 0.08 0.13 x
Table 4.8: Student’s t‐test matrix for average daily precipitation between synoptic types for Tucson, AZ. Statistically significant results are indicated in bold; those at the 95% level are denoted by one asterisk (*) and those at the 99% level are denoted by two asterisks (**).
NW NC NE CW CC CE SW SC SE T U
NW x 0.79 0.44 0.54 0.76 0.95 0.73 0.96 0.03* 0.64 0.96
NC 0.79 x 0.40 0.63 0.69 0.83 0.66 0.91 0.03* 0.80 0.88
NE 0.44 0.40 x 0.32 0.68 0.43 0.70 0.61 0.17 0.37 0.44
CW 0.54 0.63 0.32 x 0.56 0.56 0.51 0.74 0.58 0.74 0.60
CC 0.76 0.69 0.68 0.56 x 0.74 0.98 0.87 0.29 0.63 0.75
CE 0.95 0.83 0.43 0.56 0.74 x 0.71 0.95 0.03* 0.67 0.99
SW 0.73 0.66 0.70 0.51 0.98 0.71 x 0.86 0.27 0.60 0.72
SC 0.96 0.91 0.61 0.74 0.87 0.95 0.86 x 0.52 0.85 0.95
SE 0.03* 0.03* 0.17 0.58 0.29 0.03 0.27 0.52 x 0.10 0.10
T 0.64 0.80 0.37 0.74 0.63 0.67 0.60 0.85 0.10 x 0.75
U 0.96 0.88 0.44 0.60 0.75 0.99 0.72 0.95 0.10 0.75 x
55
4.4 Conclusion
An analysis of trends in North American Monsoon System (NAMS) and all‐season
precipitation at four key locations within the Lower Colorado River Basin (LCRB) was
undertaken for the period 1948‐2008. The study included an assessment of trends in total
NAMS season precipitation at Las Vegas, NV, Flagstaff, AZ, Phoenix, AZ, and Tucson, AZ. In
addition, the recurrence of heavy precipitation events, using a Poisson‐based inter‐arrival
period approach, was analyzed for all seasons. Finally average daily monsoonal precipitation at
the four locations was linked to dominant patterns of 500 mb geopotential height variability,
using a synoptic typing developed in Chapter 3.
Results of the study revealed increasing frequencies of heavy precipitation events at all
four locations, with the most statistically significant occurring at Las Vegas, NV. These
increased frequencies are distinct from the overall trends in monsoon season precipitation
specifically, which were not statistically significant at any of the four study sites. At each
location, differences in average daily monsoon season precipitation were present among the
varying synoptic types, with the most frequent differences occurring between days of
regionally‐centered monsoon ridging (e.g., type CC) and days where the ridge was more
northerly (e.g., NW, NC) or southerly (SC, SW). The synoptic influence on precipitation
appeared to increase with latitude, suggesting that the precipitation regime over southern
Arizona (i.e., Tucson) is potentially more responsive to mesoscale NAMS processes such as gulf
surges.
The variability of precipitation, particularly that associated with the NAMS, impacts
many stakeholders within the LCRB. An assessment of variability associated with both

56
monsoonal and extreme precipitation events could potentially reduce vulnerability among
these stakeholders, with regards to adaption and mitigation efforts to flash flooding, seasonal
water shortages, and other physical and socioeconomic hazards. Knowledge of the typical
distribution of precipitation based on synoptic‐scale circulation variability could assist in
forecasting efforts during the NAMS, thereby also decreasing vulnerability. More research is
needed to further elucidate the synoptic‐scale impacts on precipitation within the LCRB, and
highlight additional variability and change in precipitation extremes.
57
CHAPTER 5‐ CONCLUSIONS
The southwestern United States relies on the North American Monsoon System (NAMS)
for relief from dry/arid conditions. The beginning of the NAMS circulation is denoted by a shift
of winds from west (winter) to south (summer) (Grantz et al. 2007). Beginning in Mexico, the
NAMS moves northward into Arizona and New Mexico affecting these areas most strongly in
July and August (Ray et al. 2007) with some locations receiving between 50%‐70% of their
annual rainfall totals during the monsoon season (Grantz et al. 2007). During July and August,
the largest overall precipitation amounts are received in the southwestern United States (Diem
& Brown 2006).
During the monsoon season, moisture is pumped into the region through “…northward
surges of relatively cool, moist maritime air from the eastern tropical Pacific into the
southwestern United States via the Gulf of California” (Higgins et al. 2004). These surges of
moist air are termed gulf surges, serving as the main transport of moisture from the Gulf of
California (Higgins et al. 2004). The number and strength of the gulf surges strongly influences
the variability of the NAMS. The Gulf of Mexico serves as the primary source of upper‐level
moisture to the region.
The development of the thermal low pressure is a significant part of the NAMS
circulation. Playing a large role in the advection of moisture into the region, this feature is
normally located along the lowland region from mid‐June until mid‐September (Diem & Brown
2006, Heinselman & Schultz 2006). The LCRB is noted particularly for influencing the formation
of the thermal low. Development of this low pressure causes the displacement of the
58
subtropical high pressure ridge. As noted by many researchers, a northward displacement of
the subtropical ridge allows for a wetter monsoon season while a southward displacement
blocks moisture advection causing a drier season.
The study area selected for this study was a watershed strongly impacted by the NAMS:
the Lower Colorado River Basin (LCRB). In this basin, the monsoon is essential source of rainfall
and water, but also brings many hazards. These include wildfire, drought, lightning, high winds,
flash floods, and ground water issues. In order to reduce to vulnerability of stakeholders inside
the LCRB, this study attempted to gain a better understanding of intra‐annual and interannual
variations associated with the NAMS.
These variations were examined through a manual classification or synoptic typing of
July 1‐September 15 circulation patterns for the 1948‐2008 period. This method used a two‐
step approach, first identifying the location of the 5800 m geopotential height contour in
relation to the LCRB and second identifying the position of the monsoon ridge with respect to
the LCRB. This classification resulted in the identification of 10 key synoptic types: North‐west
(NW), North‐central (NC), North‐east (NE), Central‐west (CW), Central‐central (CC), Central‐east
(CE), South‐west (SW), South‐central (SC), South‐east (SE), and Trough (T).
The majority (63.98%) of all the monsoonal days classified were dominated by the three
northern types (NW, NC, NE). The largest portion of this percentage is comprised by type NE,
the most frequently occurring of all synoptic types. Central types (CW, CC, CE) totaled 12.75 %
of all days classified, with type CE comprising 10.99% of this total. Occurring least frequently,
the southern synoptic types (SW, SC, SE), represented only 6.39% of all monsoon season days.
59
To gain a better understanding temporal variability associated with the NAMS, trends in
type frequency were examined for the period 1948‐2008. To establish statistical significance, a
linear regression was also performed on the sum of events per year. For the northern types
(NW, NC, NE) variability is observed throughout the period, but no statistically significant trends
emerged. Unlike the northern types, the central types (CW, CC, CE) did indicate temporal
trends in type occurrence, with a statistically significant and decreasing trend associated with
type CE. This decreasing trend may suggest a westward movement of the ridge axis over time.
The southern types (SW, SC, SE) also exhibited statistically significant trends over the 1948‐2008
period. Types SW and SC increased in frequency throughout the period, significant at the 95%
level. An even more pronounced increasing trend was observed in type SE, which was also
significant at the 95% level. This increase in frequency for all southern synoptic types could
indicate a change in monsoonal patterns. A southward displacement of the subtropical ridge
normally denotes a drier monsoon season due to a weaker monsoon ridge axis. This could then
lead to shorter monsoon seasons.
In addition, trends in types in frequencies, the occurrence of each type on particular
monsoon calendar day was also examined. This analysis indicated a movement of the monsoon
anticyclone from north to south throughout the season. During the early portion of the
monsoon season, northern types dominate. Central and southern synoptic types become more
frequent by mid‐August, and by September the trough type dominates. This evolution
generally corresponds to the decay of the monsoon overtime and an increase in mid‐latitude
cyclone activity.
60
A correlation matrix was generated to examine the co‐variance of the synoptic types
throughout the 1948‐2008 period. Resulting correlations were largely inverse, revealing that an
increase in a certain synoptic type over the period is strongly correlated to a decrease in the
other type. Inverse relationships among northern and central synoptic types were especially
strong, with several being significant at the 95% level.
Independent of the synoptic typing, precipitation trends were examined at four stations
within the LCRB (Flagstaff, AZ, Las Vegas, NV, Phoenix, AZ, and Tucson, AZ), providing a
northwest‐to‐southeast transect of the watershed and capturing the locations of many key
stakeholder groups. Trends were first examined for total monsoon season precipitation at each
of the stations, and linear regression was used to establish the statistical significance of the
trends. This analysis did not reveal any statistically significant trends at any of the sites.
The frequency of heavy precipitation events over the 1948‐2008 period was also
examined, to establish trends in extreme events. An assessment of inter‐arrival periods
revealed an increasing frequency of extreme precipitation events trend throughout the study
period. The strongest and only statistically significant increase was observed at Las Vegas, NV.
Lastly, monsoon precipitation was linked to synoptic circulation patterns through the
calculation of daily average precipitation at each LCRB location with respect to synoptic type. A
Student’s t‐test was used to assess differences in mean precipitation between the different
synoptic types. The precipitation analysis revealed stronger variations in precipitation between
synoptic types in the northern portion of the LCRB.
61
Results of this study show that the occurrence of synoptic‐scale circulation patterns
during the NAMS season has not been constant over time. In addition, the frequency of heavy
precipitation events is increasing within the LCRB, and the occurrence of NAMS‐related rainfall
is not consistent among each of the synoptic types. The findings presented here may be used
to reduce stakeholder vulnerability within the LCRB, through an improved understanding of
inter‐annual and intra‐annual variability of the NAMS that can inform forecasting applications
and vulnerability assessments.
62
REFERENCES
Adams DK, et al. (1997) The North American monsoon. Bulletin of the American Meteorological Society 78:2197‐2213
Balling RC, et al. (2008) Sensitivity of residential water consumption to variations in climate: An
intraurban analysis of Phoenix, Arizona. Water Resources Research 44:11 Bryson RA, et al. (1955) Synoptic climatology of the Arizona summer precipitation singularity. Bulletin of
the American Meteorological Society 36:329‐339 Campbell A (1906) Sonora storms and Sonora clouds of California. Monthly Weather Review 34:464‐465 Carleton AM (1986) SYNOPTIC‐DYNAMIC CHARACTER OF BURSTS AND BREAKS IN THE SOUTHWEST
UNITED‐STATES SUMMER PRECIPITATION SINGULARITY. Journal of Climatology 6:605‐623 Carleton AM (1987) SUMMER CIRCULATION CLIMATE OF THE AMERICAN SOUTHWEST, 1945‐1984.
Annals of the Association of American Geographers 77:619‐634 Carleton AM, et al. (1990) MECHANISMS OF INTERANNUAL VARIABILITY OF THE SOUTHWEST UNITED‐
STATES SUMMER RAINFALL MAXIMUM. Journal of Climate 3:999‐1015 Comrie AC, et al. (1998) Principal components‐based regionalization of precipitation regimes across the
southwest United States and northern Mexico, with an application to monsoon precipitation variability. Climate Research 10:201‐215
Diem J, et al. (2009) Relationships among monsoon‐season circulation patterns, gulf surges, and rainfall
within the Lower Colorado River Basin, USA. Theoretical and Applied Climatology 97:373‐383 Diem JE, et al. (2003) Anthropogenic impacts on summer precipitation in central Arizona, USA.
Professional Geographer 55:343‐355 Diem JE, et al. (2006) Tropospheric moisture and monsoonal rainfall over the southwestern United
States. Journal of Geophysical Research‐Atmospheres 111:12 Douglas MW, et al. (1993) THE MEXICAN MONSOON. Journal of Climate 6:1665‐1677 Ellis AW, et al. (2004) A method for defining monsoon onset and demise in the southwestern USA.
International Journal of Climatology 24:247‐265 Grantz K, et al. (2007) Seasonal shifts in the North American monsoon. Journal of Climate 20:1923‐1935 Heinselman PL, et al. (2006) Intraseasonal variability of summer storms over central Arizona during 1997
and 1999. Weather and Forecasting 21:559‐578 Higgins RW, et al. (2001) Intercomparison of the principal modes of interannual and intraseasonal
variability of the North American Monsoon System. Journal of Climate 14:403‐417
63
Higgins RW, et al. (2004) Relationships between Gulf of California moisture surges and precipitation in the southwestern United States. Journal of Climate 17:2983‐2997
Higgins W, et al. (2007) Synthesis of results from the North American Monsoon Experiment (NAME)
process study. Journal of Climate 20:1601‐1607 Kalnay E, et al. (1996) The NCEP/NCAR 40‐year reanalysis project. Bulletin of the American
Meteorological Society 77:437‐471 Keim BD, et al. (1998) A technique to measure trends in the frequency of discrete random events.
Journal of Climate 11:848‐855 Lorenz DJ, et al. (2006) The effect of the MJO on the North American monsoon. Journal of Climate
19:333‐343 McCabe GJ, et al. (2006) Shifting covariability of North American summer monsoon precipitation with
antecedent winter precipitation. International Journal of Climatology 26:991‐999 Ray AJ, et al. (2007) Applications of monsoon research: Opportunities to inform decision making and
reduce regional vulnerability. Journal of Climate 20:1608‐1627 Swetnam TW, et al. (1998) Mesoscale disturbance and ecological response to decadal climatic variability
in the American Southwest. Journal of Climate 11:3128‐3147 Wu MLC, et al. (2009) An Analysis of Moisture Fluxes into the Gulf of California. Journal of Climate
22:2216‐2239 Yarnal B, et al. (2001) Developments and prospects in synoptic climatology. International Journal of
Climatology 21:1923‐1950

64
VITA
A Mississippi native, Jessie attended Mississippi State University earning a Bachelor of
Science degree in geosciences. While at MSU, she was active in numerous organizations,
including honor societies. She was a 2006 recipient of the Gordon‐Gullmon memorial
scholarship from the Department of Geosciences. Desiring to further her education, she
attended Louisiana State University for graduate school where she will graduate in May 2010
with a Master of Science degree. Her research at LSU included the North American Monsoon
System and heavy precipitation events affecting the Lower Colorado River Basin.