Embed Size (px)
Citation preview

INTERNATIONAL JOURNAL OF CLIMATOLOGY
Int. J. Climatol. 18: 281–298 (1998)
SYNOPTIC ASSOCIATIONS OF WINTER CLIMATE AND SNOWFALLVARIABILITY IN NEW ENGLAND, USA, 1950–1992
SUZANNE HARTLEYa,* and MICHAEL J. KEABLESb
a Geography Department, Rutgers Uni6ersity, New Brunswick, NJ 08903, USAb Geography Department, Uni6ersity of Den6er, Den6er, CO 80208, USA
Recei6ed 28 January 1997Re6ised 2 August 1997
Accepted 20 August 1997
ABSTRACT
Seasonal snowfall in New England has exhibited wide variations over the last few decades, the underlying causes ofwhich have not been identified previously. In this paper, compositing and statistical analyses examine howinteractions among the large-scale atmospheric circulation, cyclonic activity and storm track preferences, and westernAtlantic sea-surface temperatures contribute to winter climate variability and exceptional winter snowfall totals inNew England. High winter snowfall totals are associated with a meridional circulation regime, as indicated by anegative North Atlantic Oscillation (NAO) index and negative 700 hPa height anomalies over the eastern USA.Anomalously high surface pressure over northern Canada promotes advection of cold air into the region, and thepreferred storm track is along or just to the south of the New England coast. Low winter snowfall totals areassociated with no unique set of circumstances, but a positive NAO index and more zonal circulation is indicated,along with a weaker surface high over Canada, and a storm track over interior New England rather than along thecoast. There is no direct association with the Pacific–North American index, although this may modulate theassociation with the NAO. In extreme southern New England, high (low) winter snowfall totals are associated withnegative (positive) sea-surface temperature anomalies along the Atlantic seaboard. © 1998 Royal MeteorologicalSociety.
KEY WORDS: USA New England; Snowfall; Winter climate; Pacific–North American index; North Atlantic Oscillation; Atlanticsea-surface temperatures; principal component analysis; composites; correlation
1. INTRODUCTION
Interest in changing snow climatologies has emerged recently because many believe it could serve as apossible indicator of climate change. This has prompted studies of continental and hemispheric snowcover extent (e.g. Walsh et al., 1982; Heim and Dewey, 1984; Robinson and Hughes, 1991; Gutzler andRosen, 1992; Karl et al., 1993; Leathers and Robinson, 1993), and studies of continental-scale snowfallvariability (e.g. Zapotocny, 1991, Leathers et al., 1993).
Regional snowfall variability has been given somewhat less attention, probably because it is lessimmediately relevant to the issue of global climate change. Depending on the circumstances, however,heavy winter snowfalls can be viewed as a blessing, a disruption, or both. In the western USA, snowfallis an important component of the water supply, with runoff from snowmelt accounting for a substantialfraction of the annual total (Lettenmaier and Gan, 1990). In many regions of North America, snow is animportant recreational resource on which an important winter tourism mass market is based (Shaw andWilliams, 1994). On the other hand, of all meteorological phenomena, snowfall has perhaps the greatestcapacity to disrupt transportation of all modes (road, rail, air) and at all scales (i.e. intra-urban,
* Correspondence to: Department of Geography, Government and History, Morehead State University, Morehead, KY 40351,USA. E-mail: [email protected]
Contract grant sponsor: National Science Foundation (USA); Contract grant numbers: ATM-9314721 and SBR-9320786
CCC 0899–8418/98/030281–18$17.50© 1998 Royal Meteorological Society

S. HARTLEY AND M.J. KEABLES282
interurban, interstate) (Roony, 1967). Although transportation is the activity affected most seriously bysnow, communications, power supplies, retailing, manufacturing and various public services also may beinterrupted. The disruptive impacts and monetary costs of snowfall are thus considerable in urban areas(De Freitas, 1975) and have been accentuated by the continuing trend toward urban sprawl (Roony,1967). For example, Changnon (1979) estimated that the record low temperatures and snowfall of thewinter 1977–1978 cost individuals in Illinois a total of around $1 billion, and state-wide work stoppagesin one major storm were reported to have cost the State four million dollars in lost State income taxes.
An understanding of regional snowfall variability and trends would thus be useful in anticipatingunusual snowfall seasons and for planning appropriate responses. This is certainly the case in NewEngland, given that the southern part of the region lies in the densely populated ‘BosNYWash’1 corridor,with the potential for substantial weather-related disruption. In addition, snowfall is an importantcomponent of the winter tourism economy of much of the region. Seasonal snowfall in New England hasexhibited wide variations over the last few decades (e.g. Figure 1). The period of record from the late1950s to the late 1960s was characterized by relatively high snowfall, whereas the decades of the 1970s and1980s showed considerable variability around an apparent decreasing trend. (Similar trends in thenorth-eastern USA have been identified by Suckling and Kimsey (1988), Leathers et al. (1993) and Ackerand Soule (1995)). Record snowfalls in the winters of 1992–1993 and 1993–1994 followed a succession ofrelatively low-snowfall winters, and were followed in turn by an extremely low total for 1994–1995. Thewinter of 1995–1996 exceeded seasonal snowfall records at many locations in southern and coastal NewEngland.
The transition to a snowier regime in New England in the mid-1950s does coincide with changes in thelarge-scale circulation and temperature regimes over the USA. A relatively stable zonal circulation before1950 changed abruptly to a predominantly meridional circulation (Kalnicky, 1974), more favourable tothe amplified western-ridge–eastern-trough pattern associated with high snowfall in the eastern USA(Namias, 1960; Wagner, 1979). The more zonal phase of each of the North Atlantic Oscillation (NAO)and Pacific–North American (PNA) teleconnection patterns was dominant prior to the mid-1950s, withmore frequent meridional phases thereafter (Yarnal and Leathers, 1988). Both patterns have been foundto influence the climate of the eastern USA. The combination of a strong Icelandic Low (positive NAOindex) and a weak Aleutian Low (reverse PNA) is conducive to positive atmospheric thickness anomaliesover the eastern USA (Wallace and Gutzler, 1981). Yarnal and Leathers (1988) showed that interannualwinter climatic variations in Pennyslvania are related to both patterns, with the zonal phase of eachassociated with above-normal temperatures and precipitation.
Variations in the frequency and preferred tracks of winter cyclones also have the potential to affectregional winter precipitation totals and the fraction of precipitation that falls as snow rather than as rain.
Figure 1. Seasonal snowfall at Worcester, MA 1950–1992
1 This is Boston, New York, Washington, DC—Editor.
© 1998 Royal Meteorological Society Int. J. Climatol. 18: 281–298 (1998)

WINTER CLIMATE AND SNOWFALL VARIABILITY 283
For example, when the preferred storm track is up the Ohio Valley rather than off the south-east-ern Atlantic coast, the mid-Atlantic region experiences below normal precipitation and snowfall,and above normal temperatures (Knappenberger and Michaels, 1993). The predominantly merid-ional circulation regime after the mid-1950s resulted in a rather stepwise change in the winter tem-perature regime and a southward shift of the main baroclinic zone of the Atlantic coast and thezone of maximum storm frequency. By the 1960s, increased frequency of Greenland blockingtended to impede the normal course of extratropical cyclones and thus maintained the offshoredisplacement of the mean storm track (Resio and Hayden, 1975). Reduced cyclonic activity in theIceland–Greenland area resulted, reinforcing the blocking effect and helping to maintain the pre-vailing circulation once it became established (Dickson and Namias, 1976).
The underlying reasons for the transition to a lower, and more variable, snowfall regime duringthe 1970s are not immediately apparent. The results of Yarnal and Leathers (1988) and Knappen-berger and Michaels (1993) suggest that variations in the indices of the PNA and NOA patterns,and associated variability of storm tracks, are probably important contributors to winter climaticvariability in New England. However, the nature of the response cannot necessarily be inferredfrom their neighbouring study regions. Namias (1960) demonstrated that change in a climaticregime can result in various responses over even a relatively small area such as the north-easternUSA.
The regional response to the El Nino–Southern Oscillation (ENSO) phenomenon is also notclear. Although Ropelewski and Halpert (1986) identified spatially coherent ENSO signals (in termsof temperature and precipitation anomalies) for several regions of North America, no such signalwas identified in the north-eastern USA. Indeed, Keables (1992) identified three variations of thetypical PNA pattern response during warm ENSO events, one of which is associated with abovenormal temperatures and precipitation in New England, whereas another pattern, characterized bya relative eastward displacement of the eastern trough, is associated with just the opposite condi-tions.
Finally, possible associations of snowfall, and winter climate in general, with variations in At-lantic sea-surface temperatures have gone largely unexamined. The relatively warm waters of theAtlantic Ocean and the Gulf Stream significantly influence the temperature structure of the lowertroposphere through exchanges of sensible and latent heat at the atmosphere–ocean interface(Kocin and Uccellini, 1990). Atlantic sea-surface temperature anomalies have been linked to shiftsin storm tracks (Namias, 1966) and to winter precipitation anomalies along the east coast of theUSA (Colucci, 1976), with wet (dry) conditions associated with positive (negative) sea-surface tem-perature anomalies. Ocean–atmosphere interactions can result in feedbacks between sea-surface tem-perature anomalies and anomalous atmospheric circulation patterns, allowing climatic anomalies(such as the north-eastern USA drought of 1962–1965) to persist once established (Namias, 1966).By influencing temperatures and precipitation, it is possible that variations in Atlantic sea-surfacetemperatures might also be a factor in snowfall variability.
Decadal-scale variations have been described thus by other researchers (e.g. Namias, 1960; Suck-ling and Kimsey, 1988), but the underlying causes of the most recent variations have not reallybeen identified. The overall objective of this research is to relate variations in New England snow-fall to variations in winter synoptic climatic conditions in order to:
(i) more fully explain the transition to a regime of higher snowfall in the mid-1950s;(ii) explain the transition to a regime of lower snowfall during the 1970s;
(iii) explain the increasing variability of snowfall during the 1970s and 1980s.
The latter problem is of particular interest in view of the exceptionally heavy snowfalls (especiallyin southern New England) of the winters 1992–1993, 1993–1994, and 1995–1996. It is not yet clearwhether these winters indicate a return to a regime of more frequent heavy snowfalls or are simplyextreme occurrences of the highly variable regime of the last 15 years.
© 1998 Royal Meteorological Society Int. J. Climatol. 18: 281–298 (1998)

S. HARTLEY AND M.J. KEABLES284
Figure 2. Stations selected for representation of regional winter climate (solid symbols indicate first-order stations)
2. DATA
2.1. Seasonal temperature, precipitation and snowfall fields
A network of 27 stations (Figure 2) was selected to provide adequate spatial coverage of the regionwhile maximizing record length and minimizing the amount of missing observations. Daily observationsof precipitation, snowfall, and maximum and minimum temperatures were retrieved from EarthInfo’s‘NCDC Summary of the Day’ CD-ROM data base. Seasonal average temperatures and totals ofprecipitation and snowfall were computed for the winters 1949–1950 through to 1991–1992. For thepurpose of this study, winter was defined as the months December, January, February and March(individual seasons correspond to the calendar year of January). Occasional missing daily values weresubstituted from appropriate neighbouring stations. Some stations have month-long blocks of missingdata, or months for which large numbers of daily values are missing, in which case the monthly totalswere estimated from regression analysis against a neighbouring station. Records from first-order stationsare almost complete, whereas for co-operative stations data substitutions were involved in 4% of allmonths, on average, with a worst case of 14%.
Regional climatic indices of temperature (TEMP), precipitation (PRECIP) and snowfall (SNOW) wereobtained by principal components analysis (PCA), an eigenvector-based technique that transforms a dataset of N intercorrelated variables into N orthogonal or unrelated variables (Yarnal, 1993). Separate PCAswere conducted for each of the precipitation, temperature and snowfall variables based on an S-modedecomposition, i.e. a data matrix consisting of the seasonal values of the variable through time at each ofthe 27 stations. The station–station interrelations of the variable were represented by the correlationmatrix, with the eigenvalues and corresponding eigenvectors of this matrix representing the underlyingstructure (or principal components) of the data set.
The pure mathematical (i.e. unrotated) solution frequently results in the first component explaining amajor portion of the total variance, with large component loadings of the same sign over most of thespatial domain. Although this may be undesirable if physical interpretation of the loading pattern is thegoal, the corresponding time series of component scores serves as an index of the regionally coherentvariability over time. Principal component analysis is also an effective filter of unwanted variability, suchthat problems associated with measurement errors, data substitutions, and data inhomogeneities atindividual stations are less likely to be reflected in the regional index.
© 1998 Royal Meteorological Society Int. J. Climatol. 18: 281–298 (1998)
WINTER CLIMATE AND SNOWFALL VARIABILITY 285
2.2. Gridded sea-le6el pressure and geopotential height fields
Gridded monthly values of sea-level pressure and 700 hPa geopotential heights, referenced to a 5°latitude×5° longitude grid, were obtained from the Data Support Section of the National Center forAtmospheric Research (NCAR). These analyses were constructed originally by the National Meterologi-cal Center (NMC), now the National Center for Environmental Prediction (NCEP). Monthly values forDecember through to March for the winters 1949–1950 through to 1991–1992 were retrieved forgrid-points within the region bounded approximately by latitudes 20°–70°N and longitudes 20–110°W forsea-level pressure, and longitudes 30–150°W for the 700 hPa field (so as to capture all three nodes of thePacific–North American teleconnection pattern). Monthly departures from the average for the studyperiod were computed at each grid-point, and these values were averaged for the overall winter anomaly.
2.3. Sea-surface temperatures
Gridded monthly sea-surface temperature analyses for the period 1950–1992 were obtained from theData Support Section of NCAR. These analyses were recently reconstructed by the Climate PredictionCenter (formerly Climate Analysis Center) of NCEP, and are referenced to a 2° latitude×2° longitudegrid (Smith et al., 1996). Monthly and seasonal sea-surface temperature anomalies (SSTAs) werecomputed on a grid-cell basis for the region of the western Atlantic Ocean indicated in Figure 3.
2.4. Cyclonic acti6ity
The locations and strengths of cyclones, and tracks of migrating cyclones, were inferred fromtwice-daily sea-level pressure fields, referenced to the 47×51 point NMC octagonal grid, using anupdated algorithm developed by Serreze (1995). Cyclone strength is indicated by the central pressure (inhPa) as well as the local Laplacian of the pressure field (in 10−5 hPa m−2), which is a measure of theintensity of the cyclone. Monthly cyclone frequencies, average central pressures and average intensitieswere determined for each of the grid-points shown in Figure 4.
An index of cyclonic activity (CAI) was defined (empirically) and computed at each grid point for eachwinter month as follows:
CAI=COUNTS× (1000−PRESS+LAPL)×3/GRIDS (1)
where COUNTS is the number of cyclones identified, PRESS is the average central pressure of thecyclones identified, LAPL is the average local Laplacian of the cyclones identified, and GRIDS is thenumber of grids over which the cyclone count was determined (for the earliest winters only once-dailygrids exist, and occasional grids are missing in later years). The constants were selected for convenienceto ensure a useful range of values of the CAI (which can be negative). For each winter, the monthly CAIvalues were summed as the seasonal CAI. Despite the arbitrary nature of the index, comparison of mapsof the seasonal CAI with maps of storm tracks and average grid-point central pressures (e.g. Figure 4)
Figure 3. Grid-points of sea-surface temperature field. Grid point spacing is 2° latitude by 2° longitude
© 1998 Royal Meteorological Society Int. J. Climatol. 18: 281–298 (1998)

S. HARTLEY AND M.J. KEABLES286
Figure 4. Comparison of spatial variations in cyclonic activity index with storm tracks. (a) Storm tracks and grid-point averagecentral pressures for winter 1967. (b) Seasonal cyclonic activity indices for winter 1967. (c) and (d) Same as (a) and (b) but for winter1992. Line weights represent relative storm track frequency between grid-points as determined by storm-tracking algorithm. Trackdirection is not indicated, but storms generally track west–east and south–north. Refer to text for definition of cyclonic activity
index
indicates that the CAI does capture the main axes of cyclonic activity. Seasonal departures from theaverage CAI for the study period were computed at each grid-point.
3. ANALYSIS
3.1. Composites for abo6e- and below-a6erage winters
The seven highest- and seven lowest-scoring winters on each of the regional climatic indices weredesignated above-average and below-average, respectively, with regard to that data field. For a samplesize of 43 winters, this corresponds approximately to the upper and lower 15 percentiles of the distributionand with approximately one standard deviation above and below the mean. Composite anomaly maps ofthe 700 hPa height (Z700), sea-level pressure (SLP), and sea-surface temperature (SST) fields weregenerated for winters of above- and below-average temperature, precipitation and snowfall. Compositecyclonic activity anomaly (CAI) maps were generated for winters of above- and below-average precipita-tion and snowfall. A general assessment of the significance of grid-point anomalies (except for the CAI)was undertaken with a simple bootstrap analysis (e.g. Portman and Gutzler, 1996). At each grid-point,seven winter anomalies from the period of record were selected at random and their average computed.
© 1998 Royal Meteorological Society Int. J. Climatol. 18: 281–298 (1998)

WINTER CLIMATE AND SNOWFALL VARIABILITY 287
This was repeated for a total of 500 random anomalies, from which the standard deviation wascomputed. Composite anomalies exceeding twice this value were assumed to be nominally significantat 95% probability.
3.2. Analysis of temporal indices
The significance of the PNA and NAO teleconnection patterns to New England winter climate wasassessed by statistical analysis of the regional climatic indices and the respective atmospheric circula-tion indices. Seasonal indices of the PNA and NAO patterns were computed from grid-point valuesof the 700 hPa and sea-level pressure fields, respectively, as defined in Yarnal and Leathers (1988).In addition, monthly values of the Southern Oscillation Index (SOI) were obtained from the ClimatePrediction Center. The values for the months December–March were averaged as the seasonal value.
Relationships between climatic indices (dependent variables) and circulation indices (independentvariables) were explored by: (i) examination of scatter plots and linear correlation coefficients (Bow-erman and O’Connell, 1990); (ii) comparisons of indices between winter composite groups (e.g. high-snow versus low-snow) with the Mann–Whitney U-test (Sprent, 1993); and (iii) multiple-regressionagainst two or more independent variables (Bowerman and O’Connell, 1990).
4. RESULTS AND DISCUSSION
4.1. Regional climatic indices
The component scores (standardized by square-root of eigenvalue) on the first unrotated principalcomponent of each of the precipitation, temperature and snowfall fields are shown in Figure 5. Theloading patterns (not shown) may be described simply as having large positive loadings across theentire region, i.e. the typical first mode of an unrotated PCA. The similarity of the patterns thusallows the component score time series for each of the variables to be compared in the same con-text. Decadal-scale variability is evident in the precipitation time series (Figure 5(a)), with below-av-erage precipitation prevailing through most of the 1960s, followed by a relatively wet period duringthe 1970s. Both the 1950s and 1980s are characterized by highly variable precipitation. Temperature(Figure 5(b)) shows a general downward trend from the 1950s until the early 1970s, with increasingtemperatures thereafter. Note that the winters of the early 1950s are comparable with the warmestwinters of the latest decade. Finally, the snowfall series (Figure 5(c)) also shows some decadal-scalevariations. Snowfall is relatively high from the mid-1950s through to the 1960s. The 1970s are char-acterized by great variability around an apparent downward trend, whereas the last decade is associ-ated with relatively low snowfall.
Together, TEMP and PRECIP explain only 42% of the variance in SNOW, supporting the asser-tion of Namias (1960) that snowfall variability cannot be explained entirely by variations in tempera-ture and precipitation. The values of the regression coefficients indicate that TEMP (−0.64) isrelatively more important than PRECIP (0.38) (which is in general agreement with Wagner (1979)).
4.2. Identification of composites
Based on the regional climatic indices, seasonal composites of precipitation, temperature and snow-fall were identified. Composites of stardardized winter precipitation, temperature and snowfall werecomputed at each station to verify that these anomalies were represented across the region. TheHIGH-SNOW and LOW-SNOW composites were of most concern because of the rather lower vari-ance explained (58%) by the leading snowfall component. However, the component scores are repre-sentative of snowfall anomalies across the region with the exception only of the extreme north andextreme south.
© 1998 Royal Meteorological Society Int. J. Climatol. 18: 281–298 (1998)

S. HARTLEY AND M.J. KEABLES288
4.3. WET and DRY composites
Above-average precipitation is associated with negative 700 hPa height anomalies over the south-east-ern USA, and positive anomalies over the Canadian maritimes (Figure 6(a)). This pattern results in amore meridional flow regime, with an anomalous component of flow from the south-east and anomalousadvection of moist air from over the ocean. Positive SSTAs (SST anomalies) are observed off the Atlanticcoast from Cape Hatteras to Nova Scotia (Figure 6(b)). Their contribution to increased precipitation mayinvolve increased rates of evaporation or increased baroclinicity along the coast, allowing greaterdevelopment of coastal storms.
Figure 5. Scores on the first unrotated principal component of the precipitation, temperature and snowfall fields. The scores areused as regional indices (PRECIP, TEMP, SNOW) of variability. Winters selected for compositing are indicated
© 1998 Royal Meteorological Society Int. J. Climatol. 18: 281–298 (1998)

WINTER CLIMATE AND SNOWFALL VARIABILITY 289
Figure 6. Composites of (a) 700 hPa height anomalies (m) and (b) sea-surface temperature anomalies (°C) for winters ofabove-average precipitation. Dots indicate anomalies indicated by bootstrapping as being significant at the 95% confidence level
The DRY composite is characterized by positive 700 hPa height anomalies over the USA and theadjacent Pacific Ocean and negative anomalies over Canada (Figure 7(a)), a pattern favouring a morezonal flow regime across the continent, and an anomalous westerly component of flow into New England,i.e. from over the continental land mass rather than from over the ocean. However, there is considerablevariability among the DRY winters. The positive height anomalies over the southern USA are a salientfeature, but in some winters these anomalies extend eastward over the Atlantic Ocean, whereas in othersnegative height anomalies are observed offshore. No pattern of sea-surface temperature anomalies isevident (Figure 7(b)). As a more westerly airflow dominates, the possible influence of SSTAs is likely tobe reduced.
Cyclonic activity of the WET and DRY composites is compared in Figure 8. In the WET case,above-average cyclonic activity is evident over New England and the eastern Great Lakes. In the DRYcase, below-average cyclonic activity is observed over northern and eastern New England, suggesting arelative northward displacement of the St Lawrence storm track and an offshore displacement of thecoastal storm track.
The different storm track preferences may be explained by the differences in the 700 hPa circulation. Inthe WET case, the anomalous component of flow is onshore, resulting in a corresponding displacementof the coastal storm track. The positive SSTAs along the Atlantic seaboard also may be a factor. Atlanticcoast storms tend to track along two zones of local maximum baroclinicity (Carlson, 1991). One of theseis the region of high SST gradients along the northern edge of the Gulf Stream. The other is theland–ocean boundary itself. Positive SSTAs along the Atlantic seaboard enhance the latter while
Figure 7. Same as Figure 6, except for winters of below-average precipitation
© 1998 Royal Meteorological Society Int. J. Climatol. 18: 281–298 (1998)

S. HARTLEY AND M.J. KEABLES290
Figure 8. Comparison of cyclonic activity of WET and DRY winters. (a) Composite cyclonic activity anomalies for winters ofabove-average precipitation. (b) Composite cyclonic activity anomalies for winters of below-average precipitation. (c) Difference
between WET and DRY composites. Cross-hatched areas are positive. See text for definition of cyclonic activity
decreasing the former, and thus may favour cyclones tracking closer to the coast. In the DRY case,anomalously zonal flow results in an eastward displacement of the coastal storm track, while positiveheight anomalies over the central USA may explain the apparent northward displacement of the StLawrence storm track.
Neither 700 hPa anomaly composite resembles either the PNA or NAO pattern and the correlationsbetween PRECIP and each of these indices are indeed not significant. No association with the SouthernOscillation is indicated.
4.4. WARM and COLD composites
In the WARM case, an anomalous 700 hPa high, centred over the Canadian Maritimes dominatesnorth-eastern North America (Figure 9(a)), restricting intrusions of continental Polar air masses into theNew England region. Positive SSTAs extend over a large portion of the adjacent Atlantic Ocean, fromCape Hatteras to the south-east of Newfoundland (Figure 9(b)). However, this may be as much an effectas a cause of the warmth, as the atmospheric flow pattern would tend to limit interaction of this part ofthe ocean with continental Polar air masses.
In the COLD case, an anomalous 700 hPa trough, centred over New England, dominates eastern NorthAmerica, while positive height anomalies prevail to the west (Figure 10(a)). More frequent troughing overthe eastern USA favours more frequent intrusions of continental polar air masses into New England. Inthe Atlantic Ocean, negative SSTAs are observed to the south and east of New England, from CapeHatteras to the south of Nova Scotia (Figure 10(b)). As with the warm composite, the anomalies may be
© 1998 Royal Meteorological Society Int. J. Climatol. 18: 281–298 (1998)

WINTER CLIMATE AND SNOWFALL VARIABILITY 291
Figure 9. Same as Figure 6, except for winters of above-average temperature
as much an effect as a cause, as the atmospheric circulation pattern would favour more frequentinteraction with continental polar air masses.
The COLD 700 hPa composite does bear some resemblance to the PNA pattern (with displacement ofthe centres of action), but the WARM composite is not simply the reverse of this pattern, and thecorrelation between TEMP and the PNA index is not significant, even when TEMP is detrended.Although not a significant factor of interannual temperature variability (correlation of TEMP with theNAO index is also not significant), the NAO appears to be important at the decadal time-scale. AMann–Whitney U-test comparison of NAO indices for a warm ‘decade’ (1982–1992) with those of a cold‘decade’ (1961–1971) achieves a level of significance of 0.008 (Table I). No association with the SOI isindicated.
4.5. HIGH-SNOW and LOW-SNOW composites
In the HIGH-SNOW case, negative height anomalies are observed over the conterminous USA, withthe largest anomalies centred to the south-west of New England (Figure 11(a)). Positive height anomaliesdominate over northern Canada and Greenland. The pattern appears to be a compromise between theWET composite (in which the positive height anomalies extend further south) and the COLD composite(in which the negative height anomalies extend further north), such that cold Canadian air masses morefrequently encounter warm, moist air flows from the south-eastern USA and from the Atlantic Ocean. Asmall region of positive SSTAs is observed off Newfoundland, but no clear pattern emerges off the USAcoast (Figure 11(b)).
Figure 10. Same as Figure 6, except for winters of below-average temperature
© 1998 Royal Meteorological Society Int. J. Climatol. 18: 281–298 (1998)

S. HARTLEY AND M.J. KEABLES292
Figure 11. Same as Figure 6, except for winters of above-average snowfall
Figure 12. Same as Figure 6, except for winters of below-average snowfall
Table I. Mann–Whitney U-test comparisons of NAO indices for selected groups of winters
Comparison Group 1 Group 2 Significance
1961–1971 (Cold ‘decade’) 1982–1992 (Warm ‘decade’)NAO versus TEMPTEMP (mean) −3.57 1.13 0.002
1.62−1.28NAO (mean) 0.008
HIGH-SNOW LOW-SNOWNAO versus SNOW5.98 −5.89 0.002SNOW (mean)
NAO (mean) −1.09 1.26 0.035
NAO versus SNOW 1979–1992 (Low-snow ‘decade’)1958–1972 (High-snow ‘decade’)SNOW (mean) 2.59 −2.75 0.000
0.0070.84NAO (mean) −1.15
In the LOW-SNOW case, positive 700 hPa height anomalies extend over most of North America andthe adjacent Atlantic Ocean between 40° and 50°N, approximately (Figure 12(a)). This anomaly patternreflects the fact that below-average snowfall winters may result from below-average precipitation,above-average temperatures, or both. The anomalous high over the central USA favours more westerlyflow into New England, while the extension of this ridge over the Maritimes and the North Atlanticrestricts the advance of continental polar air masses into the region. As with the DRY composite,however, the variability among the LOW-SNOW winters is considerable, and no feature of this anomaly
© 1998 Royal Meteorological Society Int. J. Climatol. 18: 281–298 (1998)
WINTER CLIMATE AND SNOWFALL VARIABILITY 293
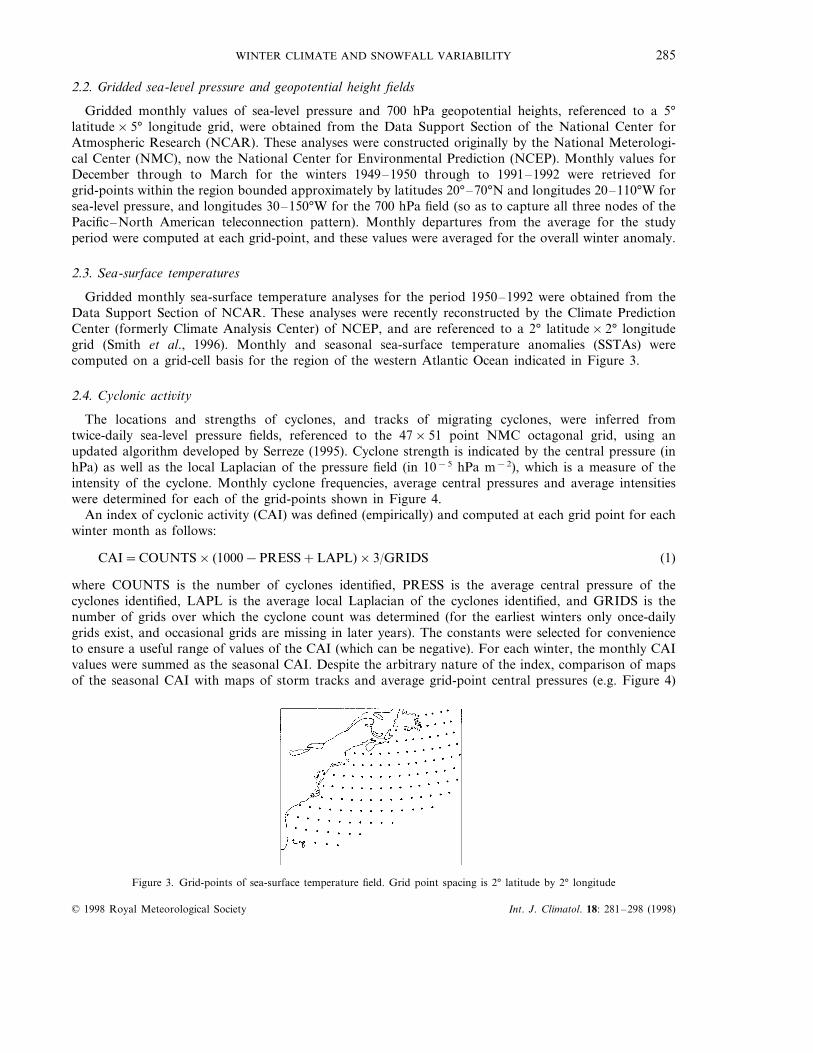
Figure 13. Comparison of cyclonic activity of HIGH-SNOW and LOW-SNOW winters. (a) Composite cyclonic activity anomaliesfor winters of above-average snowfall. (b) Composite cyclonic activity anomalies for winters of below-average snowfall. (c)Difference between HIGH-SNOW and LOW-SNOW composites. Cross-hatched areas are positive. See text for definition of cyclonic
activity
pattern appears to be significant. This pattern most closely resembles the winters 1989, 1991, and 1992.Winters 1951 and 1953 resemble the WARM composite, and winters 1980 and 1981 feature an anomalousoffshore trough. Positive SSTAs are found along the immediate coast from the mid-Atlantic States toNova Scotia (Figure 12(b)).
Although the WET, DRY, WARM and COLD 700 hPa composites are somewhat different from thoseidentified for the entire eastern USA by Wagner (1979), the similarity of the WARM and WET
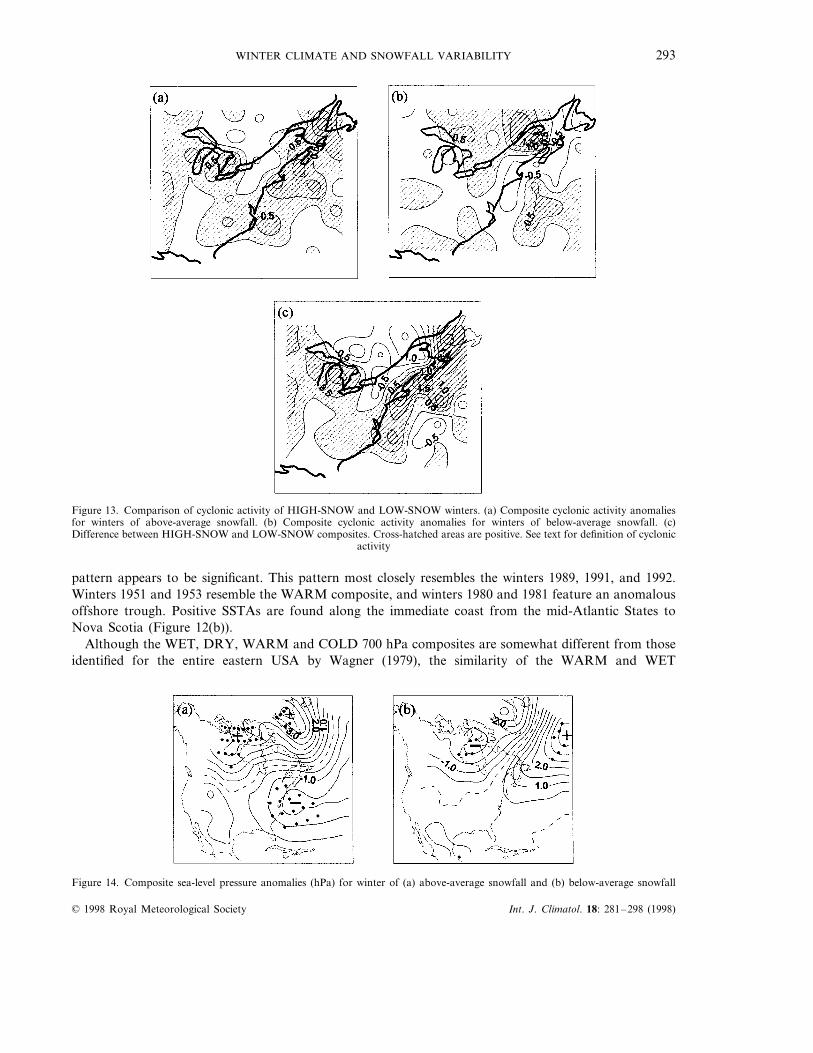
Figure 14. Composite sea-level pressure anomalies (hPa) for winter of (a) above-average snowfall and (b) below-average snowfall
© 1998 Royal Meteorological Society Int. J. Climatol. 18: 281–298 (1998)
S. HARTLEY AND M.J. KEABLES294
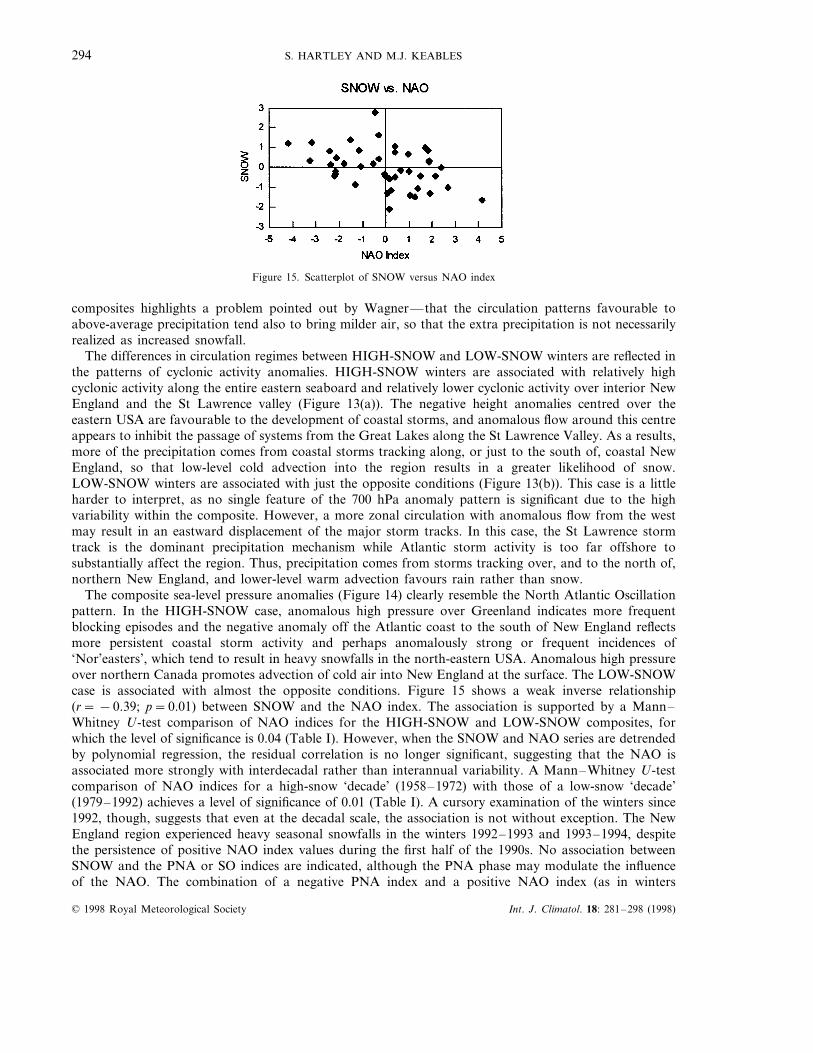
Figure 15. Scatterplot of SNOW versus NAO index
composites highlights a problem pointed out by Wagner—that the circulation patterns favourable toabove-average precipitation tend also to bring milder air, so that the extra precipitation is not necessarilyrealized as increased snowfall.
The differences in circulation regimes between HIGH-SNOW and LOW-SNOW winters are reflected inthe patterns of cyclonic activity anomalies. HIGH-SNOW winters are associated with relatively highcyclonic activity along the entire eastern seaboard and relatively lower cyclonic activity over interior NewEngland and the St Lawrence valley (Figure 13(a)). The negative height anomalies centred over theeastern USA are favourable to the development of coastal storms, and anomalous flow around this centreappears to inhibit the passage of systems from the Great Lakes along the St Lawrence Valley. As a results,more of the precipitation comes from coastal storms tracking along, or just to the south of, coastal NewEngland, so that low-level cold advection into the region results in a greater likelihood of snow.LOW-SNOW winters are associated with just the opposite conditions (Figure 13(b)). This case is a littleharder to interpret, as no single feature of the 700 hPa anomaly pattern is significant due to the highvariability within the composite. However, a more zonal circulation with anomalous flow from the westmay result in an eastward displacement of the major storm tracks. In this case, the St Lawrence stormtrack is the dominant precipitation mechanism while Atlantic storm activity is too far offshore tosubstantially affect the region. Thus, precipitation comes from storms tracking over, and to the north of,northern New England, and lower-level warm advection favours rain rather than snow.
The composite sea-level pressure anomalies (Figure 14) clearly resemble the North Atlantic Oscillationpattern. In the HIGH-SNOW case, anomalous high pressure over Greenland indicates more frequentblocking episodes and the negative anomaly off the Atlantic coast to the south of New England reflectsmore persistent coastal storm activity and perhaps anomalously strong or frequent incidences of‘Nor’easters’, which tend to result in heavy snowfalls in the north-eastern USA. Anomalous high pressureover northern Canada promotes advection of cold air into New England at the surface. The LOW-SNOWcase is associated with almost the opposite conditions. Figure 15 shows a weak inverse relationship(r= −0.39; p=0.01) between SNOW and the NAO index. The association is supported by a Mann–Whitney U-test comparison of NAO indices for the HIGH-SNOW and LOW-SNOW composites, forwhich the level of significance is 0.04 (Table I). However, when the SNOW and NAO series are detrendedby polynomial regression, the residual correlation is no longer significant, suggesting that the NAO isassociated more strongly with interdecadal rather than interannual variability. A Mann–Whitney U-testcomparison of NAO indices for a high-snow ‘decade’ (1958–1972) with those of a low-snow ‘decade’(1979–1992) achieves a level of significance of 0.01 (Table I). A cursory examination of the winters since1992, though, suggests that even at the decadal scale, the association is not without exception. The NewEngland region experienced heavy seasonal snowfalls in the winters 1992–1993 and 1993–1994, despitethe persistence of positive NAO index values during the first half of the 1990s. No association betweenSNOW and the PNA or SO indices are indicated, although the PNA phase may modulate the influenceof the NAO. The combination of a negative PNA index and a positive NAO index (as in winters
© 1998 Royal Meteorological Society Int. J. Climatol. 18: 281–298 (1998)

WINTER CLIMATE AND SNOWFALL VARIABILITY 295
Figure 16. Seasonal values of PNA (top) and NAO (bottom) indices
1973–1975 and 1989) tends to result in below-average seasonal snowfalls, whereas above-averagesnowfalls are generally associated with the opposite. Considering the long-term trends in the NAO andPNA indices (Figure 16), we see that the relatively higher snowfalls of the late 1950s and 1960s correspondwith a period of predominantly negative NAO and positive PNA winters.
The possible influence of Atlantic SSTAs warrants further discussion. In a separate study (Hartley,1996) a similar compositing approach was applied to compare snowfall variability of southern andnorthern New England. The results suggested different snowfall–SSTA associations across the region. Inthe far north (northern Vermont and New Hampshire, and northwestern Maine), snowfall shows no
Figure 17. The NAO index and seasonally averaged regional SSTA index, 1951–1992
© 1998 Royal Meteorological Society Int. J. Climatol. 18: 281–298 (1998)

S. HARTLEY AND M.J. KEABLES296
Table II. Lagged correlations between seasonal SSTA and NAO indices
Detrended seriesLag (NAO leads SSTA) (years) Raw series
r=0.45 (p=0.008)r=0.46 (p=0.008)21 r=0.43 (p=0.005) r=0.38 (p=0.011)
direct association with SSTAs. On the other hand, high (low) seasonal snowfall totals in the south(Connecticut, Rhode Island and south-eastern Massachusetts) are associated with areally extensivenegative (positive) SSTAs in the adjacent Atlantic Ocean. Examination of monthly SSTAs suggested thatthe respective anomalies are present in most months, including December and thus are not necessarily justthe result of the snowfall anomalies (e.g. through interaction with air masses modified by anomalous snowcover). The exact nature of the snowfall–SSTA association cannot be determined at this stage, but thedifferent response in the south compared with the north is worth noting, as in the north snowfall isgenerally limited by precipitation whereas in the south, temperature is more frequently the limiting factor(Brooks, 1917). High snowfall seasons in both parts of the region are associated with very similaratmospheric circulation anomaly patterns (comparable to Figure 11(a)), but high snowfall in the southalso appears to be conditional on negative SSTAs, suggesting the possibility of a direct thermal response.By reducing sea-to-air transfers of sensible and latent heat as air is advected across coastal waters, coolerSSTs may allow temperatures in the lower troposphere to remain cold enough to support snow duringwinter storms. Another possibility is that anomalous SST gradients influence the tracks taken by coastalstorms. However, these proposed linkages are purely speculative and obviously require further investiga-tion. We have also to consider the possibility that the SSTAs are forced by the atmospheric circulationanomalies that result in the anomalous snowfall conditions, in which case the SSTAs do not directly affectsnowfall and the association is merely coincidental.
The time series of a seasonal SSTA index for the adjacent area of the Atlantic Ocean (Hartley, 1996)shows a remarkable resemblance to that of the NAO index (Figure 17). Cross-correlations are significant,with the NAO leading SSTAs by 1 and 2 years (Table II), although the levels of significance are probablyinflated by strong persistence in the SSTA series (out to 3 years) and moderate persistence in the NAOseries (1 year). However, when the decadal-scale variations (and thus the persistence) are removed fromthe time series by polynomial regression, the residual cross-correlations are essentially the same at theselags. Towards the end of the analysis period, though, the association appears to be breaking down, andshould probably be re-examined as data for the winters since 1992 become available.
5. CONCLUSIONS
Heavy seasonal snowfall totals are clearly not a simple function of temperature and precipitation, butrather the product of compromise between the seasonal synoptic conditions that result in exceptionallycold and exceptionally wet winters, respectively. Snowy winters are characterized by negative 700 hPaheight anomalies over the conterminous USA and positive anomalies over Canada and Greenland,indicating a more meridional circulation regime than the average. The composite sea-level pressureanomaly pattern resembles the negative phase of the NAO, with more frequent blocking activity overGreenland and an active Atlantic coastal storm track. Low-snow winters are associated with no uniqueset of circumstances, although a more zonal circulation regime is indicated, especially over the Atlantic,where the sea-level pressure anomaly pattern resembles the positive phase of the NAO.
The differences in circulation regimes between high-snow and low-snow winters are reflected in thepatterns of cyclonic activity anomalies. In high-snow winters more of the precipitation comes from coastalstorms tracking along, or just to the south of, coastal New England, so that low-level cold advection intothe region results in a greater likelihood of snow. In the low-snow case, the St Lawrence storm track isthe dominant precipitation mechansism while Atlantic storm activity is too far offshore to substantiallyaffect the region.
© 1998 Royal Meteorological Society Int. J. Climatol. 18: 281–298 (1998)

WINTER CLIMATE AND SNOWFALL VARIABILITY 297
The North Atlantic Oscillation is evidently the most important teleconnection pattern associated withwinter climatic variability in New England, although the NAO phase alone may not be a reliable indicatorof winter conditions. The downward trend in snowfall since the early 1970s coincides with a stronglypositive trend in the NAO. At the same time, both the NAO and PNA indices have been highly variable.When both patterns are in their respective zonal (meridional) phase, relatively lower (higher) snowfalltotals are the result. Thus, the more variable snowfall regime since 1970 may be explained by interactionof the NAO and PNA patterns.
Winter climate variability, in general, shows no association with the SOI, consistent with results fromstudies by others, and suggesting that ENSO forecasts are of less long-range utility in New England thanin other regions.
Atlantic Ocean sea-surface temperatures show coherent associations with winter temperatures, withwinter precipitation (to a weaker extent), and with snowfall, especially in the south of the region. At thisstage, the exact nature of the snowfall–SSTA association cannot be determined, but is currently underinvestigation.
Sea-surface temperature anomalies along the east coast are evidently influenced by the atmosphericcirculation of previous winters, although the underlying mechanism can only be assumed. A positive(negative) NAO pattern would be expected to result in anomalous warming (cooling) of surface waters inthe anticyclonic belt (Wallace et al., 1990). The anomalously warm (cold) water could, conceivably, beadvected toward the eastern seaboard during successive seasons. In any case, the apparent memory of theSSTAs around New England may partly explain why the associations of temperature and snowfall withthe NAO have greater significance at the decadal scale.
The various interrelationships among New England winter climate, Atlantic sea-surface temperatureanomalies, and the North Atlantic Oscillation suggest that the problem of New England snowfallvariability may be part of the larger issue of climatic variability in the Northwest Atlantic region, whichhas been the subject of many recent investigations. However, consideration of winters subsequent to thestudy period suggests that these associations may not be entirely robust. Given the decadal-scalevariations in snowfall, SSTs and the NAO index, it is possible that the 1950–1992 period does notrepresent all modes of covariability among these and other factors (e.g. the PNA pattern) and the analysisperiod should be extended as more data become available. Despite this, an understanding of theassociations between Atlantic sea-surface temperature anomalies and the atmospheric circulation of thisregion, especially at the continent–ocean interface, may offer some potential for improving long-rangewinter forecasts, and anticipating exceptional snowfall seasons in New England.
ACKNOWLEDGEMENTS
The authors wish to extend thanks to David Robinson, Barry Keim, and two anonymous reviewers whosecomments and suggestions were most helpful in the preparation of this paper. This work was in partsupported by NSF grants ATM-9314721 and SBR-9320786.
REFERENCES
Acker, J.C. and Soule, P.T. 1995. ‘Temporal characteristics of Pennsylania snowfall 1950–1951 through 1989–1990’, Phys. Geogr.,16, 188–204.
Bowerman, B.L. and O’Connell, R.T. 1990. Linear Statistical Models. An Applied Approach, PWS-Kent Publishing, Boston, MA.Brooks, C.F. 1917. ‘New England snowfall’, Mon. Wea. Re6. 44, 271–285.Carlson, T.N. 1991. Mid-lattitude Weather Systems. HarperCollins, New York.Changnon, S.A. 1979. ‘How a severe winter impacts on individuals’, Bull. Am. Meteorol. Soc., 60 110–114.Colucci, S.J. 1976. ‘Winter cyclone frequencies over the eastern United States and adjacent western Atlantic’, Bull. Am. Meteorol.
Soc., 57 548–553.De Freitas, C.R. 1975. ‘Estimation of the disruptive impact of snowfalls in urban areas’, J. Appl. Meteorol., 14, 1166–1173.Dickson, R.R. and Namias, J. 1976. ‘North American influences on the circulation and climate of the North Atlantic sector’, Mon.
Wea. Re6., 104, 1255–1264.Gutzler, D.S. and Rosen, R.D. 1992. ‘Interannual variability of wintertime snow cover across the Northern Hemisphere’, J. Climate,
5, 1441–1447.
© 1998 Royal Meteorological Society Int. J. Climatol. 18: 281–298 (1998)
S. HARTLEY AND M.J. KEABLES298
Hartley, S. 1996. ‘Atlantic sea-surface temperatures and New England snowfall’, Hydrol. Process., 10, 1553–1563.Heim, R. and Dewey, K.F. 1984. ‘Circulation patterns and temperature fields associated with extensive snow cover on the North
American continent’, Phys. Geogr., 4, 66–85.Kalnicky, R.A. 1974. ‘Climatic changes since 1950’, Ann. Assoc. Am. Geogr., 64, 100–112.Karl, T.R., Groisman, P.Y., Knight, R.W. and Heim, R.R. 1993. ‘Recent variations of snow cover and snowfall in North America
and their relation to precipitation and temperature variations’, J. Climate, 6, 1327–1344.Keables, M.J. 1992. ‘Spatial variability of midtropospheric circulation patterns and associated surface climate in the United States
during ENSO winters’, Phys. Geogr., 13, 331–348.Knappenberger, P.C. and Michaels, P.J. 1993. ‘Cyclone tracks and wintertime climate in the mid-Atlantic region of the USA’, Int.
J. Climatol., 13, 509–531.Kocin, P.J. and Uccellini, L.W. 1990. ‘Snowstorms along the northeastern coast of the United States’, Am. Meteorol. Soc. Monogr.,
22(44).Leathers, D.J., Mote, T.L., Kuivinen, K.C., McFeeters, S. and Kluck, D.R. 1993. ‘Temporal characteristics of USA snowfall
1945–1946 through to 1984–1985’, Int. J. Climatol., 13, 65–76.Leathers, D.J. and Robinson, D.A. 1993. ‘The association between extremes in North American snow cover extent and United
States temperatures’, J. Climate, 6, 1345–1355.Lettenmaier, D.P. and Gan, T.Y. 1990. ‘Hydrologic sensitivities of the Sacramento–San Joaquin River basins, California, to global
warming’, Water Resour. Res., 26, 69–86.Namias, J. 1960. ‘Snowfall over the eastern United States: factors leading to its monthly and seasonal variations’, Weatherwise,
238–247.Namias, J. 1966. ‘Nature and possible causes of the Northeastern United States drought during 1962–65’, Mon. Wea. Re6., 94,
543–554.Portman, D.A. and Gutzler, D.S. 1996. ‘Explosive volcanic eruptions, the El Nino–Southen Oscillation, and US climate variability’,
J. Climate, 9, 17–33.Resio, D.T. and Hayden, B.P. 1975. ‘Recent secular variations in mid-Atlantic winter extratropical storm climate’, J. Appl.
Meteorol., 14, 1223–1234.Robinson, D.A. and Hughes, M.G. 1991. ‘Snow cover variability on the Northern Plains and Central Great Plains’, Great Plains
Res., 1, 93–113.Roony, J.F. 1967. ‘The urban snow hazard in the United States: an appraisal of disruption’, Geogr. Re6., 57, 538–559.Ropelewski, C.F. and Halpert, M.S. 1986. ‘North American precipitation and temperature patterns associated with the El
Nino/Southern Oscillation (ENSO)’, Mon. Wea. Re6., 114, 2352–2362.Serreze, M.C. 1995. ‘Aspects of cyclone development and decay in the Arctic’, Atmos. Ocean, 33, 1–23.Shaw, G. and Williams, A.M. 1994. Critial Issues in Tourism. A Geographical Perspecti6e. Blackwell, Oxford.Smith, T.M., Reynolds, R.W., Livezey, R.E. and Stokes, D.C. 1996. ‘Reconstruction of historical sea-surface temperature using
empirical orthogonal functions’, J. Climate, 9, 1403–1420.Sprent, R. 1993. Applied Nonparametric Statistical Methods. Chapman and Hall, New York.Suckling, P.W. and Kimsey, M.B. 1988. ‘Seasonal snowfall totals in northern New England: recent trends and variability’, Climatol.
Bull., 22, 15–25.Wagner, A.J. 1979. ‘Mean 700 mb circulation patterns associated with snowiest and least snowy winter months over the eastern
United States’, Proc. 36th East. Snow Conf., 75–94.Wallace, J.M. and Gutzler, D.S. 1981. ‘Teleconnections in the geopotential height field during the Northern Hemisphere winter’,
Mon. Wea. Re6., 109, 784–811.Wallace, J.M., Smith, C. and Jiango, Q. 1990. ‘Spatial patterns of atmosphere–ocean interaction in the northern winter’, J. Climate,
3, 990–998.Walsh, J.E. Tucek, D.R. and Peterson, M.R. 1982. ‘Seasonal snow cover and short-term climatic fluctuations over the United
States’, Mon. Wea. Re6., 110, 1474–1560.Yarnal, B. 1993. Synoptic Climatology in En6ironmental Analysis: A Primer. Belhaven Press, Boca Raton, FL.Yarnal, B. and Leathers, D.J. 1988. ‘Relationships between interdecadal and interannual climatic variations and their effect on
Pennsylvania climate’, Ann. Assoc. Am. Geogr., 78, 624–641.Zapotocny, J.V. 1991. ‘Variability of snowfall over the conterminous United States during period 1940–1990’, Proceedings of the
Fifth Conference on Climatological Variations, Denver, CO, American Meteorological Society, pp. 191–192.
© 1998 Royal Meteorological Society Int. J. Climatol. 18: 281–298 (1998)