Embed Size (px)
Citation preview
Synergy between Refinery – Petrochemicals
and Future Configuration for Aromatics
Shailendra Mohite
Kuwait Petroleum International
18th September 2014
Presentation Outline
1. Global Business Environment
2. Changing Competitive Landscape
3. Challenges, Drivers & Opportunities
4. Technological Options and Configuration
5. Conclusion
2
1. Global Business Environment
3
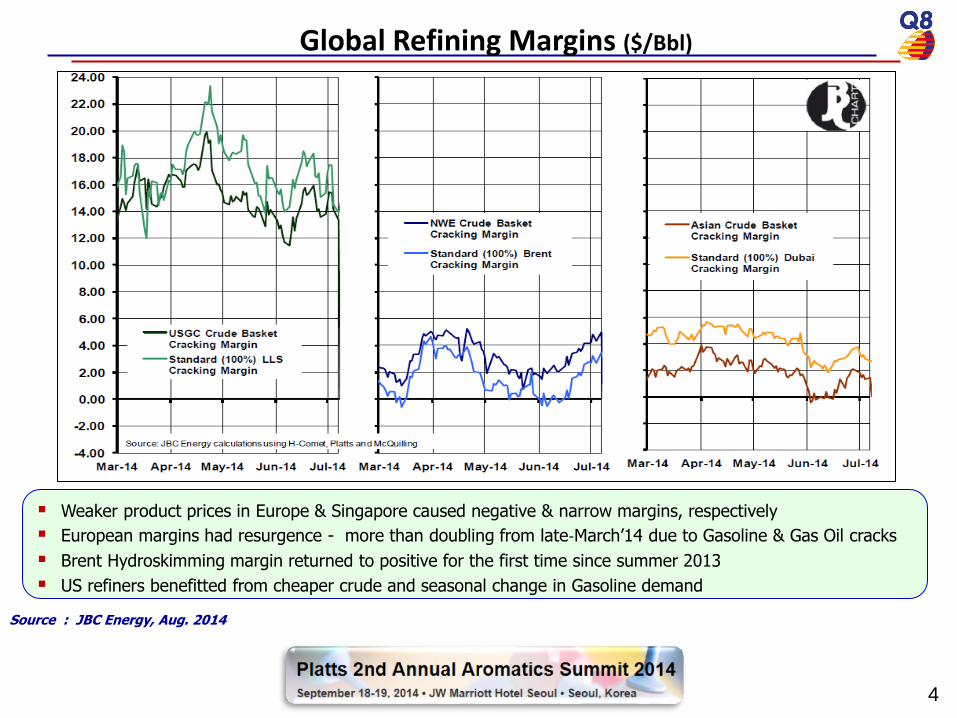
Source : JBC Energy, Aug. 2014
-529 -644
535 1101
-994 -1367
Weaker product prices in Europe & Singapore caused negative & narrow margins, respectively
European margins had resurgence - more than doubling from late‐March’14 due to Gasoline & Gas Oil cracks
Brent Hydroskimming margin returned to positive for the first time since summer 2013
US refiners benefitted from cheaper crude and seasonal change in Gasoline demand
Global Refining Margins ($/Bbl)
4
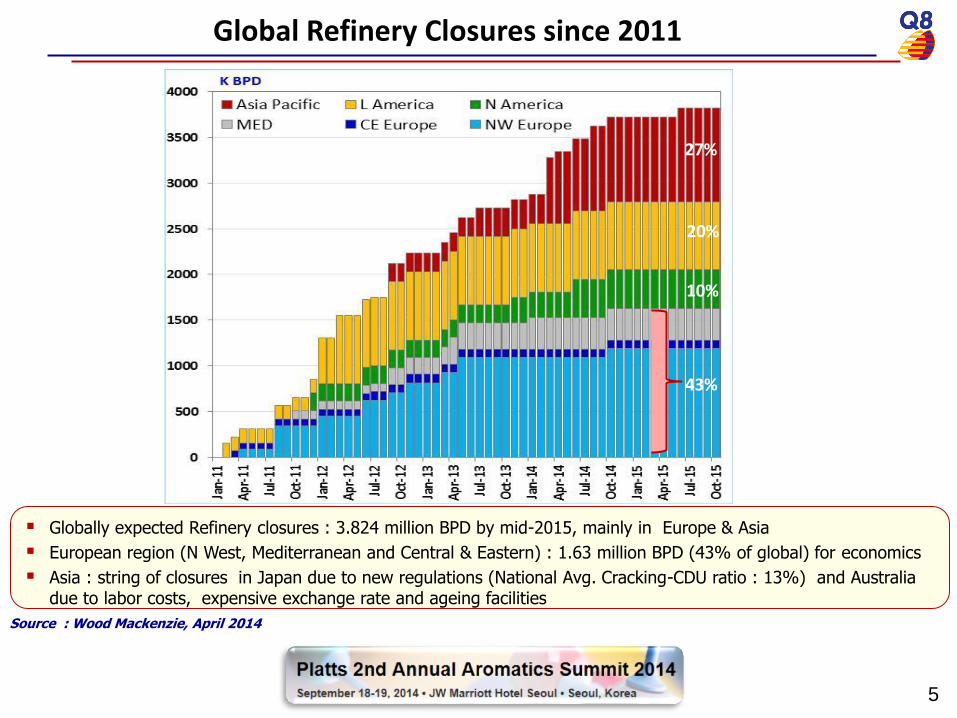
Global Refinery Closures since 2011
Source : Wood Mackenzie, April 2014
Globally expected Refinery closures : 3.824 million BPD by mid-2015, mainly in Europe & Asia
European region (N West, Mediterranean and Central & Eastern) : 1.63 million BPD (43% of global) for economics
Asia : string of closures in Japan due to new regulations (National Avg. Cracking-CDU ratio : 13%) and Australia due to labor costs, expensive exchange rate and ageing facilities
27%
20%
10%
43%
5
Source : IHS, KOGS-Oct. 2013
$/Ton
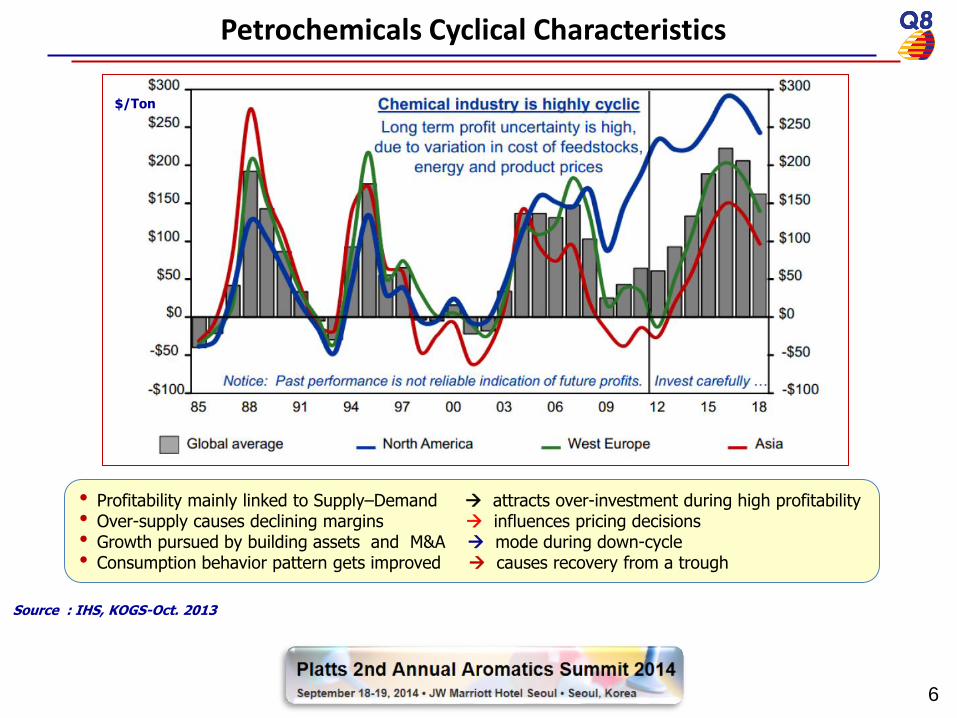
Petrochemicals Cyclical Characteristics
• Profitability mainly linked to Supply–Demand attracts over-investment during high profitability • Over-supply causes declining margins influences pricing decisions • Growth pursued by building assets and M&A mode during down-cycle • Consumption behavior pattern gets improved causes recovery from a trough
6
7
Source : IHS - 2013
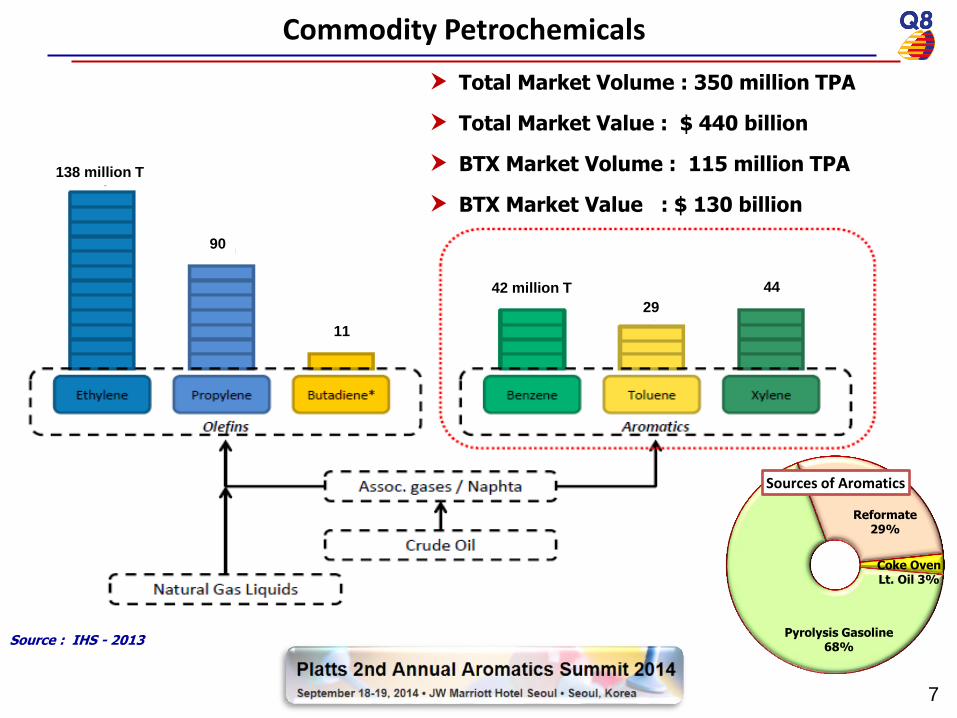
138 million T
90
11
42 million T
29
44
Total Market Volume : 350 million TPA
Total Market Value : $ 440 billion
BTX Market Volume : 115 million TPA
BTX Market Value : $ 130 billion
Commodity Petrochemicals
Sources of Aromatics
Pyrolysis Gasoline 68%
Coke Oven Lt. Oil 3%
Reformate 29%

Demand : Cracker Operating rates : high in USA (95%), stable in SE Asia (88%)
Self-sufficiency of China increasing, impacted imports from Middle East
Global Ethylene balance shifting in favor of producers
Healthy Polymer demand growth in China (PP : 5%, PE : 15%) and India (PP : 3%, PE : 5%)
Supply : Shale Gas revolution : main driver of profitability in USA for olefins and has reduced pygas supplies
US Ethylene operating rates : 96% - higher than last 5 years average 87%
Costs : Ethylene v/s Naphtha economics widened as Gas prices remained soft
LPG as a popular feed-stock in Western Europe
Naphtha spreads to BTX wide : oversupply pushing prices down, reforming attractive for Aromatics
Margins : Sluggish Polymer demand : margin improvement in PE and PP, but PVC (-ve) due to tight FS supply
High margin for PX – strongly driven by demand from fibers and packaging
Petrochemicals Business Environment (2013-2014)
Source : Argus 2013, Reliance Financial Results 2014
8
2. Changing Competitive Landscape
9
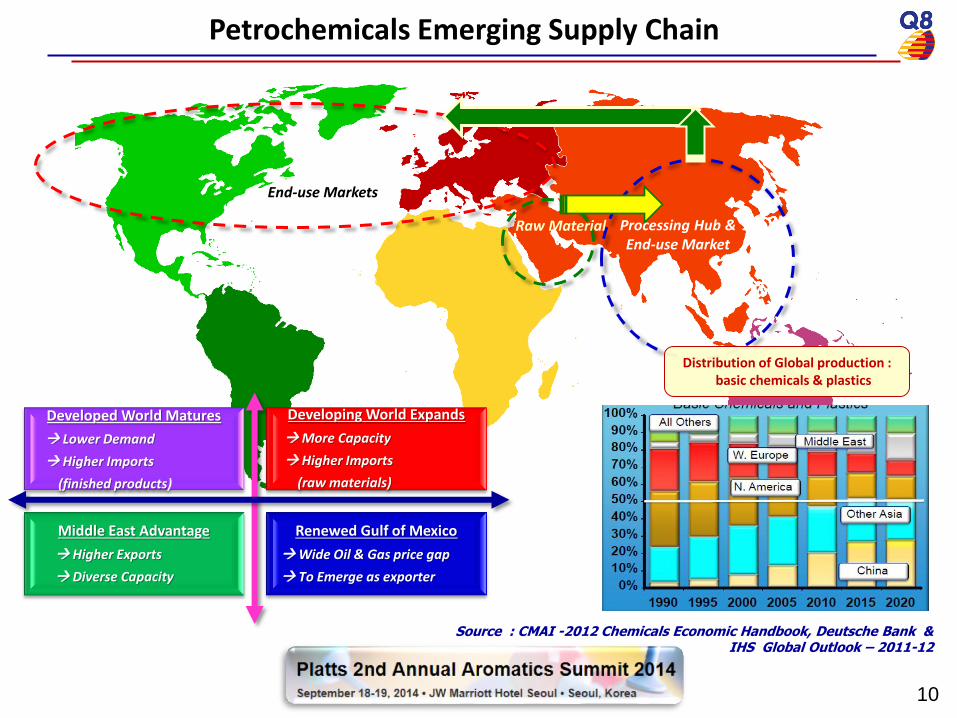
Petrochemicals Emerging Supply Chain
End-use Markets
Raw Material Processing Hub & End-use Market
Developed World Matures
Lower Demand
Higher Imports
(finished products)
Developing World Expands
More Capacity
Higher Imports
(raw materials)
Middle East Advantage
Higher Exports
Diverse Capacity
Renewed Gulf of Mexico
Wide Oil & Gas price gap
To Emerge as exporter
Source : CMAI -2012 Chemicals Economic Handbook, Deutsche Bank & IHS Global Outlook – 2011-12
Distribution of Global production : basic chemicals & plastics
10
11
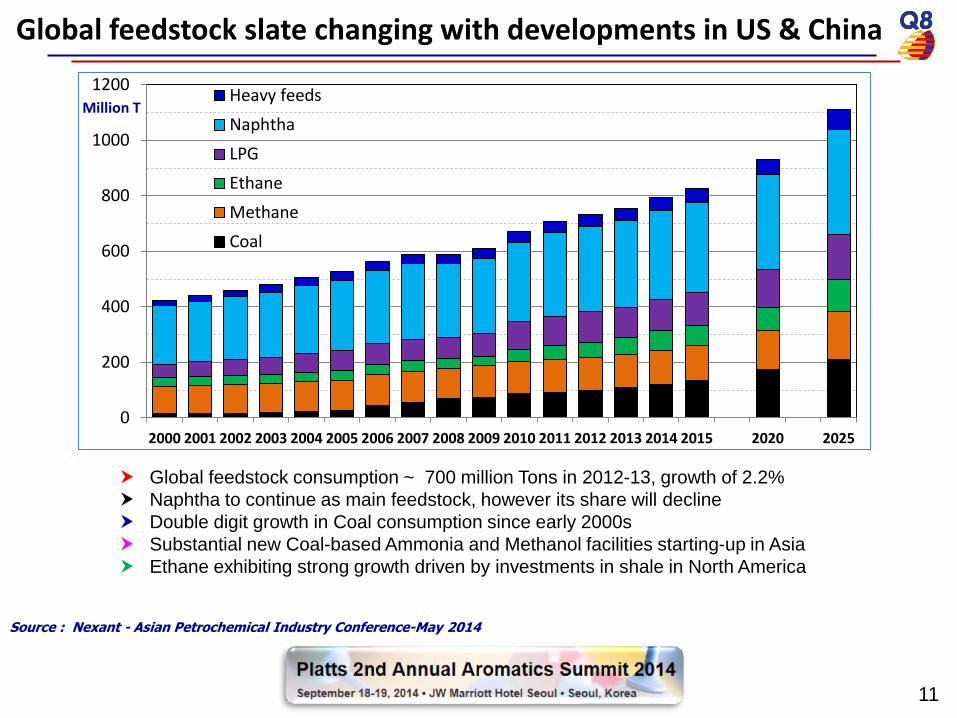
Global feedstock slate changing with developments in US & China
Global feedstock consumption ~ 700 million Tons in 2012-13, growth of 2.2%
Naphtha to continue as main feedstock, however its share will decline
Double digit growth in Coal consumption since early 2000s
Substantial new Coal-based Ammonia and Methanol facilities starting-up in Asia
Ethane exhibiting strong growth driven by investments in shale in North America
Source : Nexant - Asian Petrochemical Industry Conference-May 2014
0
200
400
600
800
1000
1200
2000 2001 2002 2003 2004 2005 2006 2007 2008 2009 2010 2011 2012 2013 2014 2015 2020 2025
Million T Heavy feeds
Naphtha
LPG
Ethane
Methane
Coal
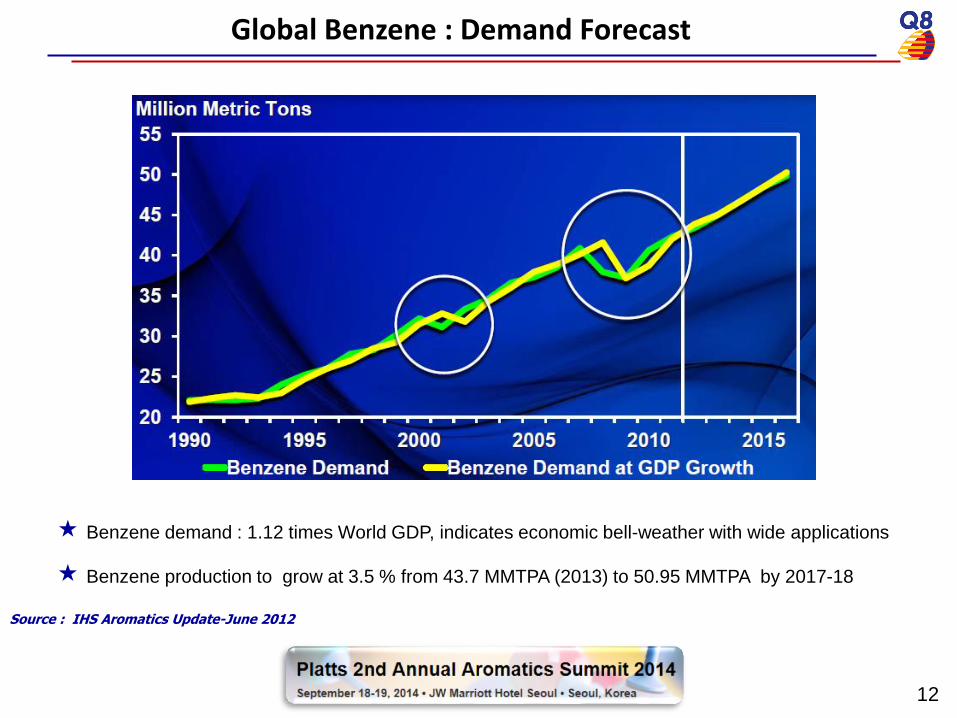
Global Benzene : Demand Forecast
Source : IHS Aromatics Update-June 2012
Benzene demand : 1.12 times World GDP, indicates economic bell-weather with wide applications
Benzene production to grow at 3.5 % from 43.7 MMTPA (2013) to 50.95 MMTPA by 2017-18
12
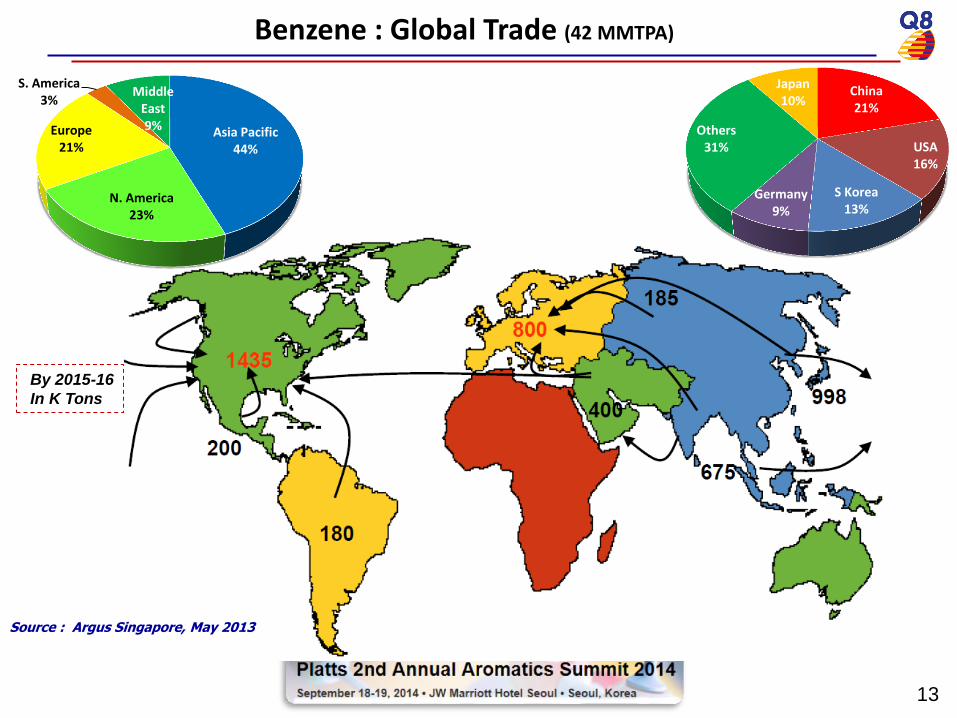
Benzene : Global Trade (42 MMTPA)
Source : Argus Singapore, May 2013
Asia Pacific 44%
N. America 23%
Europe 21%
S. America 3%
Middle East 9%
China 21%
USA 16%
S Korea 13%
Germany 9%
Others 31%
Japan 10%
By 2015-16
In K Tons
13
14
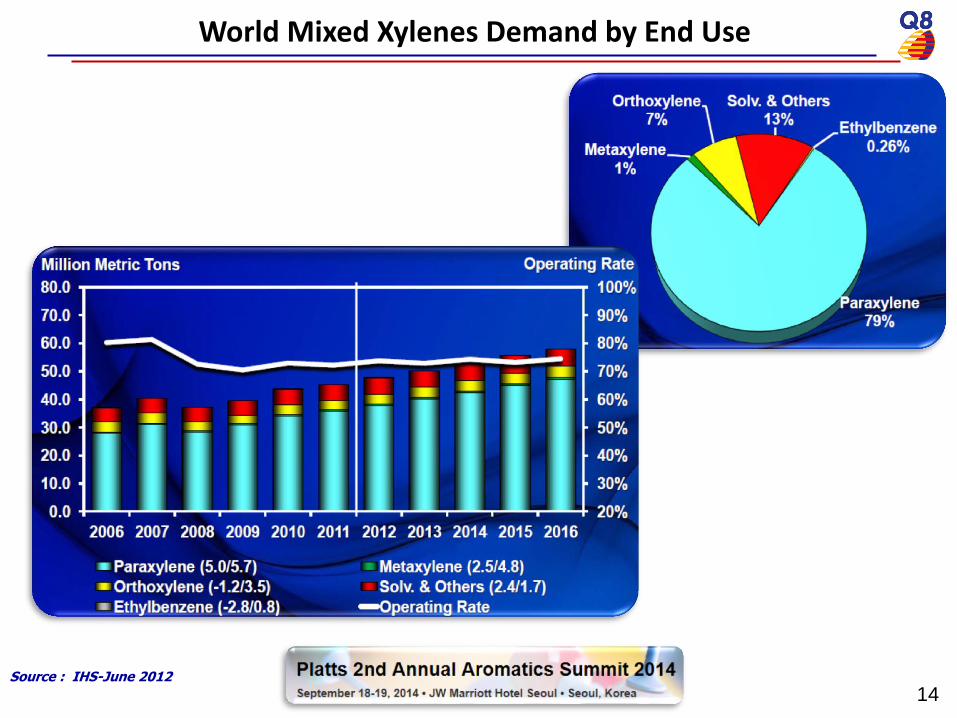
World Mixed Xylenes Demand by End Use
Source : IHS-June 2012
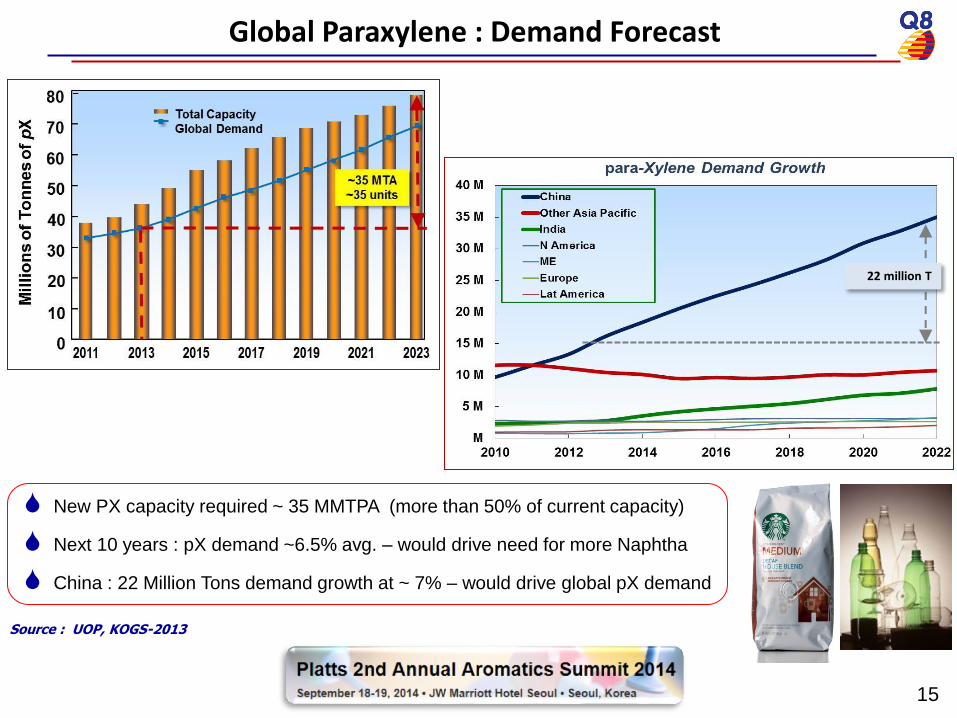
Global Paraxylene : Demand Forecast
Source : UOP, KOGS-2013
New PX capacity required ~ 35 MMTPA (more than 50% of current capacity)
Next 10 years : pX demand ~6.5% avg. – would drive need for more Naphtha
China : 22 Million Tons demand growth at ~ 7% – would drive global pX demand
22 million T
15

16
Paraxylene : Net Trade 2012-2016
Source : PCI Xylenes & Polyesters Asia Sdn Bhd, March 2013
Capacity additions to exceed demand growth after 2014
Asia : major investments ($1 billion+) with new or re-vamped refineries - inevitably taking longer completion
Asia : Constraints on feed-stocks encouraging JV’s for MX thus avoiding heavy investment in Reforming
Mid. East : SATORP JV in 2013 first in 4 years, four investments from 2016 : Saudi & Qatar : 4 MMTPA
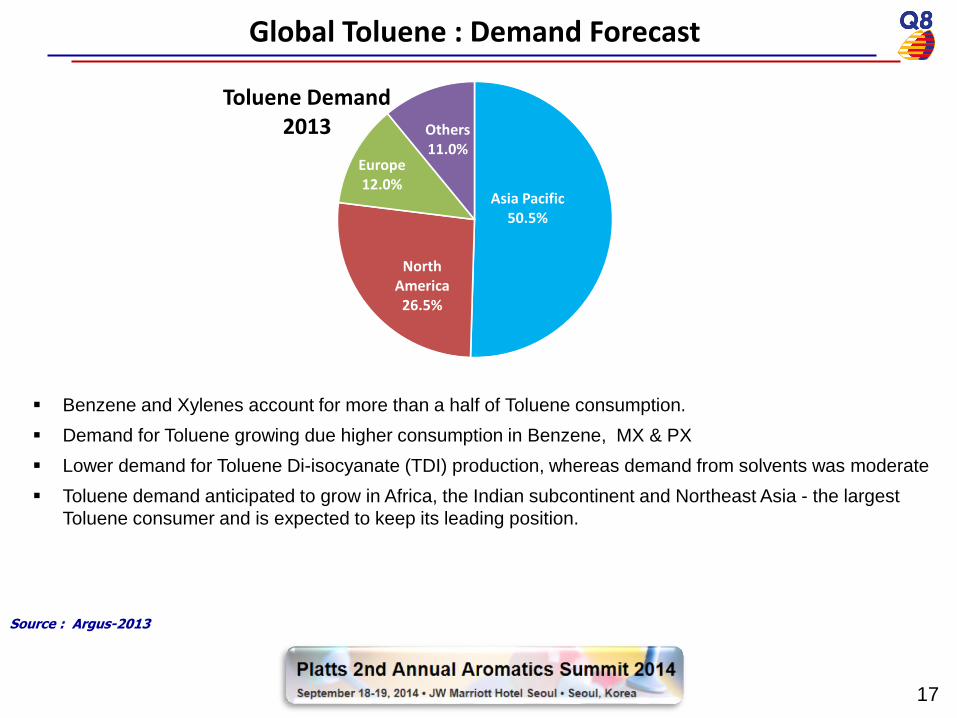
Benzene and Xylenes account for more than a half of Toluene consumption.
Demand for Toluene growing due higher consumption in Benzene, MX & PX
Lower demand for Toluene Di-isocyanate (TDI) production, whereas demand from solvents was moderate
Toluene demand anticipated to grow in Africa, the Indian subcontinent and Northeast Asia - the largest
Toluene consumer and is expected to keep its leading position.
17
Global Toluene : Demand Forecast
Source : Argus-2013
Asia Pacific 50.5%
North America 26.5%
Europe 12.0%
Others 11.0%
Toluene Demand 2013

3. Challenges, Drivers & Opportunities
18

ECONOMIC : In a single global market; manufacturers must be highly competitive to survive
Cyclic market and high-priced feed-stocks
High energy costs
Price forecasting of feed-stocks & products : assess full value of exchange of streams, Capex & Opex
Effective Resource management
POLICY DECISIONS : Government-Business cooperation strengthening
Stringent environmental norms and Fuels quality spec. : Benzene in Gasoline adjust Reformer or extract for Petrochemicals
Bio-ethanol blends in Gasoline in Europe can create surplus Naphtha
TECHNOLOGICAL : Increasing reliance on Refineries for Propylene and Aromatics
Limited flexibility in product reprocessing and by-products utilization
Disposal of high sulfur residues makes gasification attractive for potential chemical use
Challenges in Petrochemicals
Source : Global Polyethylene IHS PEMEX PE June 2012
19
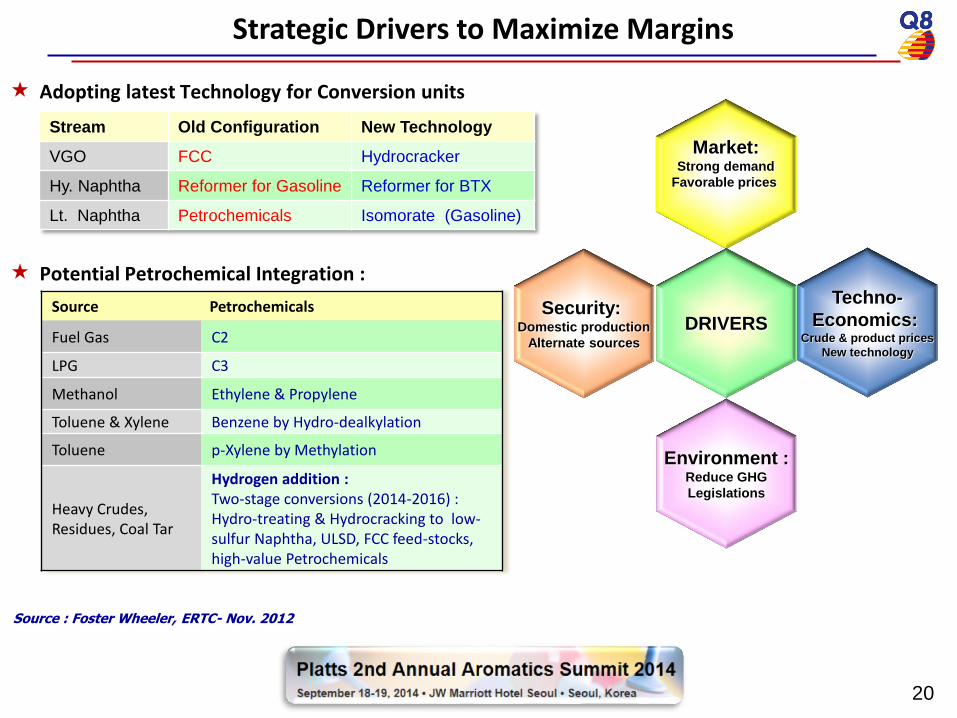
Strategic Drivers to Maximize Margins
Adopting latest Technology for Conversion units
Potential Petrochemical Integration :
Market: Strong demand
Favorable prices
Security: Domestic production
Alternate sources
Techno-
Economics: Crude & product prices
New technology
Environment : Reduce GHG
Legislations
DRIVERS
Source : Foster Wheeler, ERTC- Nov. 2012
Stream Old Configuration New Technology
VGO FCC Hydrocracker
Hy. Naphtha Reformer for Gasoline Reformer for BTX
Lt. Naphtha Petrochemicals Isomorate (Gasoline)
Source Petrochemicals
Fuel Gas C2
LPG C3
Methanol Ethylene & Propylene
Toluene & Xylene Benzene by Hydro-dealkylation
Toluene p-Xylene by Methylation
Heavy Crudes, Residues, Coal Tar
Hydrogen addition : Two-stage conversions (2014-2016) : Hydro-treating & Hydrocracking to low-sulfur Naphtha, ULSD, FCC feed-stocks, high-value Petrochemicals
20

Drivers for Refinery-Petrochemicals multi-unit complex
21
Source : Foster Wheeler - Feb. 2014
Product prices relative to Naphtha
FCC technology has developed to produce higher volumes of Olefins and Aromatics
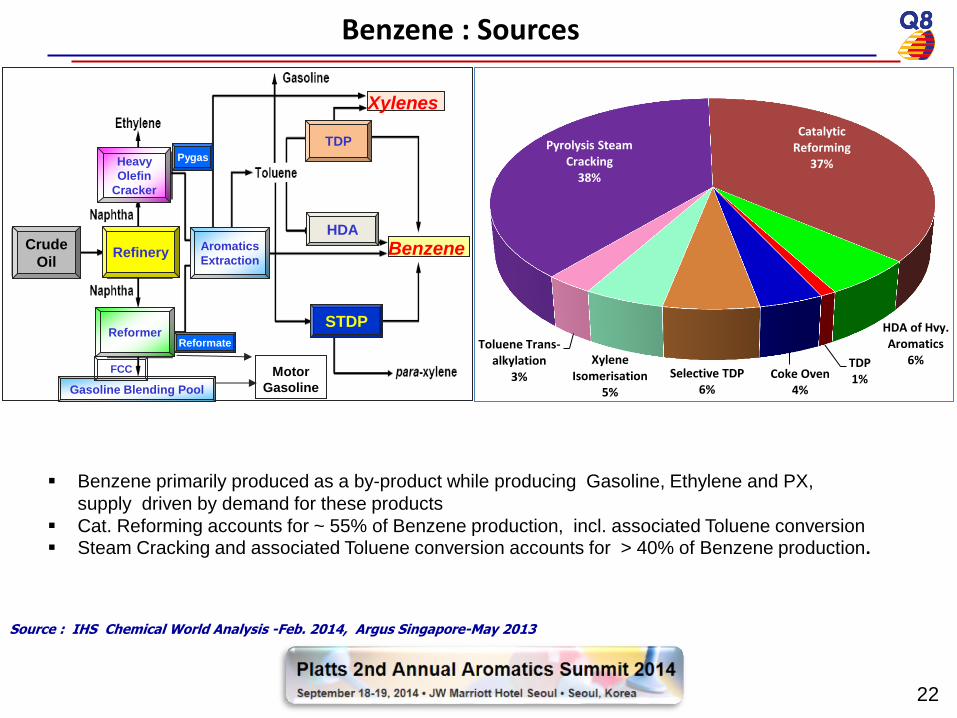
Benzene : Sources
Source : IHS Chemical World Analysis -Feb. 2014, Argus Singapore-May 2013
Benzene primarily produced as a by-product while producing Gasoline, Ethylene and PX,
supply driven by demand for these products
Cat. Reforming accounts for ~ 55% of Benzene production, incl. associated Toluene conversion Steam Cracking and associated Toluene conversion accounts for > 40% of Benzene production.
Reformer
Aromatics
Extraction
HDA
TDP
Benzene
Gasoline Blending Pool
Motor
Gasoline
STDP
FCC
Heavy
Olefin
Cracker
Xylenes
Refinery
Pygas
Reformate
Crude
Oil
Pyrolysis Steam Cracking
38%
Catalytic Reforming
37%
HDA of Hvy. Aromatics
6% TDP 1% Coke Oven
4%
Selective TDP 6%
Xylene Isomerisation
5%
Toluene Trans-alkylation
3%
22
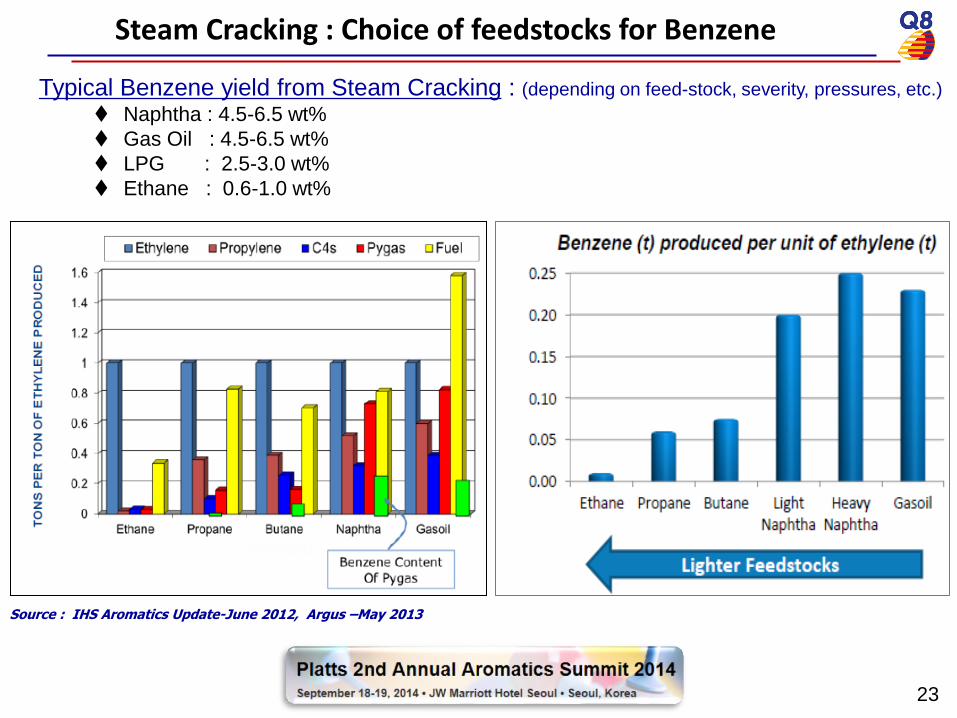
Typical Benzene yield from Steam Cracking : (depending on feed-stock, severity, pressures, etc.)
Naphtha : 4.5-6.5 wt%
Gas Oil : 4.5-6.5 wt%
LPG : 2.5-3.0 wt%
Ethane : 0.6-1.0 wt%
23
Steam Cracking : Choice of feedstocks for Benzene
Source : IHS Aromatics Update-June 2012, Argus –May 2013
24
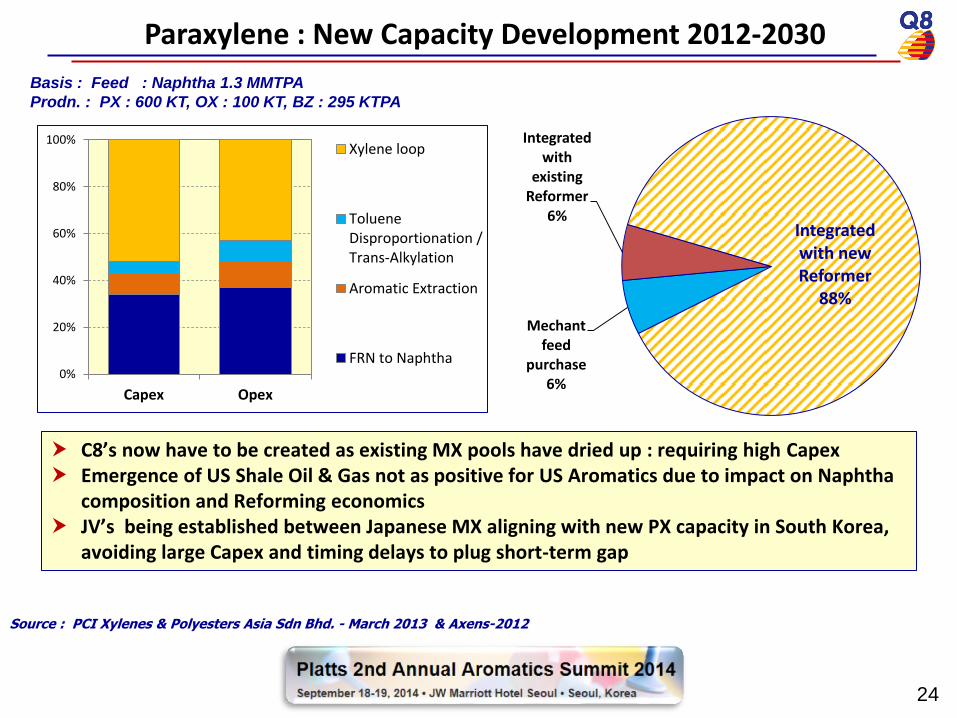
Paraxylene : New Capacity Development 2012-2030
Source : PCI Xylenes & Polyesters Asia Sdn Bhd. - March 2013 & Axens-2012
C8’s now have to be created as existing MX pools have dried up : requiring high Capex Emergence of US Shale Oil & Gas not as positive for US Aromatics due to impact on Naphtha
composition and Reforming economics JV’s being established between Japanese MX aligning with new PX capacity in South Korea,
avoiding large Capex and timing delays to plug short-term gap
Basis : Feed : Naphtha 1.3 MMTPA
Prodn. : PX : 600 KT, OX : 100 KT, BZ : 295 KTPA
Mechant feed
purchase 6%
Integrated with
existing Reformer
6% Integrated with new Reformer
88%
0%
20%
40%
60%
80%
100%
Capex Opex
Xylene loop
TolueneDisproportionation /Trans-Alkylation
Aromatic Extraction
FRN to Naphtha

Steam Cracker Feed Options
Source : Foster Wheeler – ERTC-Nov. 2012 & EQUATE, PetChem Arabia-Oct. 2012
Yields for Steam Cracker Feeds v/s FCC and CCR LNG cost impact on world-scale Olefins Cracker Margins
VM : Variable Margin (Revenue – feedstocks & utilities) COP : Crude Oil Price at 100 $/bbl , equivalent to LNG ~ 13 $/MMBTU
25
4. Technological Options
26
To
tal N
atu
ral R
es
ou
rce
s : U
S $
1.5
Billio
n/y
ea
r
To
tal P
etr
oc
he
mic
als
Pro
du
cts
: U
S $
8.6
Billio
n/y
ea
r
Refineries
Cracker # 1
US $ 1.1 Billion
Aromatics
US $ 575 Million
Cracker # 2
US $ 1.1 Billion
Ethane 1,100 KTPA
US $ 80 Million
Propane 1,200 KTPA
US $ 360 Million
Crude to Naphtha
20 MMTPA
(equiv. 400 MBPD)
US $ 800 Million
Raffinate &
Naphtha
4.5 MMTPA
US $ 350 Million
Secondary Feeds
US $ 225 Million
Ethylene Derivatives
US $ 2.6 Billion
Propylene Derivatives
US $ 2.5 Billion
C4 Derivatives
US $ 460 Million
Aromatics Derivatives
US $ 3.4 Billion
Ethylene 2,600 KTPA
US $ 1000 Million
Propylene 965 KTPA
US $ 385 Million
Mixed C4s 450 KTPA
US $ 75 Million
Aromatics 1500 KTPA
US $ 450 Million
Secondary Products
US $ 300 Million
Products
US $ 3.1 Billion
Products
US $ 0.25 Billion
Products
US $ 1.77 Billion
Products
US $ 3.39 Billion
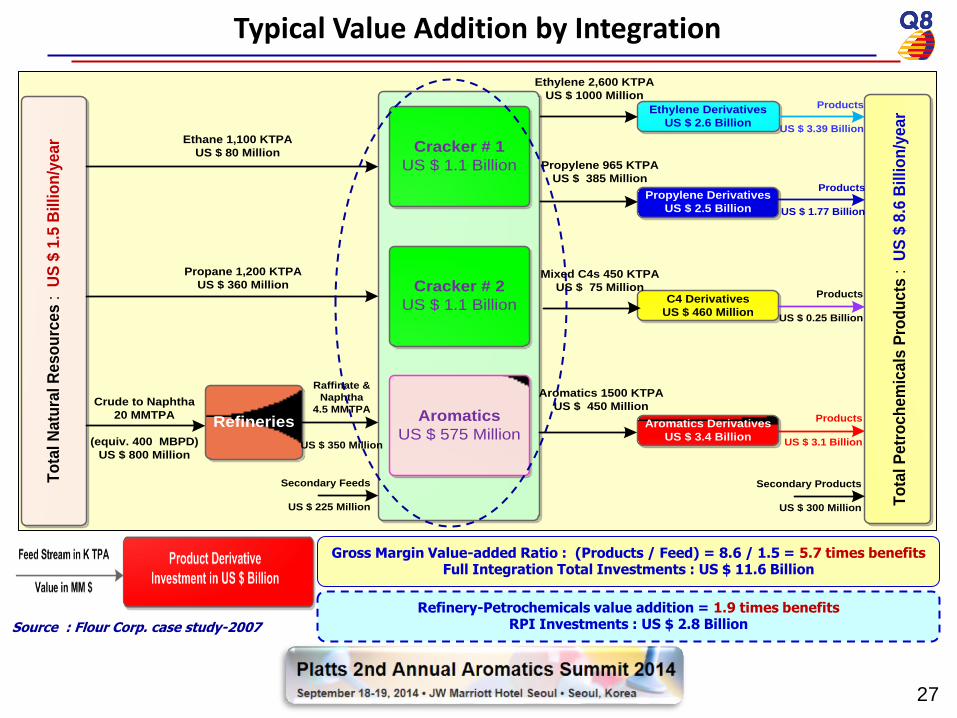
Typical Value Addition by Integration
Source : Flour Corp. case study-2007
Gross Margin Value-added Ratio : (Products / Feed) = 8.6 / 1.5 = 5.7 times benefits Full Integration Total Investments : US $ 11.6 Billion
Refinery-Petrochemicals value addition = 1.9 times benefits RPI Investments : US $ 2.8 Billion
27
Source : Jacobs Consultancy– Nov. 2009 & Grass-root project in SE Asia
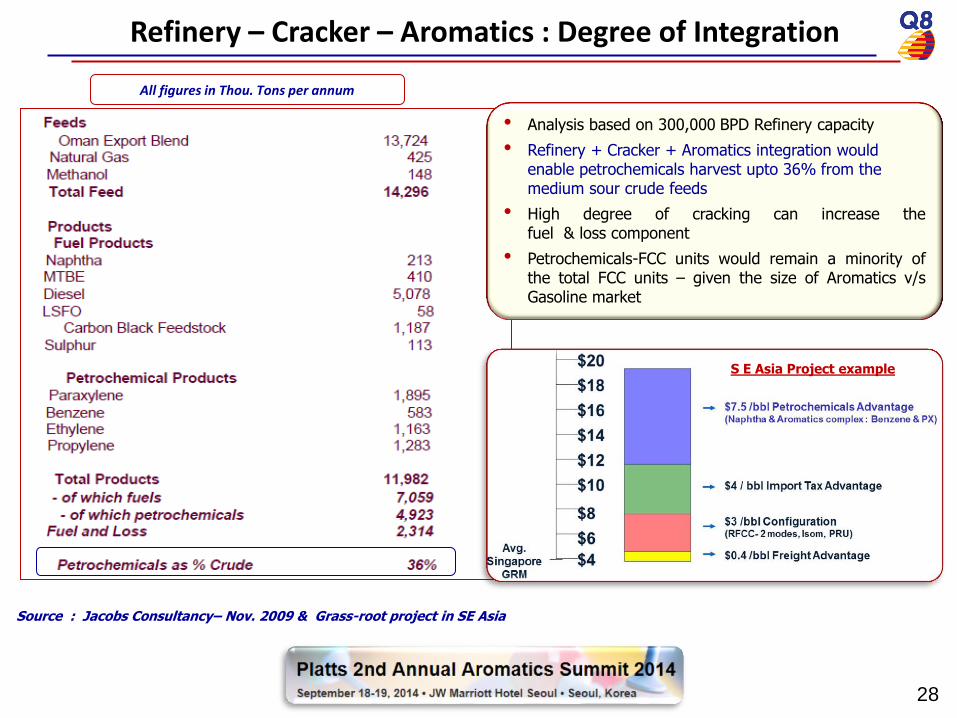
Refinery – Cracker – Aromatics : Degree of Integration
All figures in Thou. Tons per annum
• Analysis based on 300,000 BPD Refinery capacity
• Refinery + Cracker + Aromatics integration would enable petrochemicals harvest upto 36% from the medium sour crude feeds
• High degree of cracking can increase the fuel & loss component
• Petrochemicals-FCC units would remain a minority of the total FCC units – given the size of Aromatics v/s Gasoline market
S E Asia Project example
28

Refinery with Hydro-cracker + FCC + Aromatics
FCC
CDU
Benzene
Para-xylene SR Naphtha
Propylene
Naphtha
Bleed
HCGO
VGO
Kero
Coke
Aromatic Complex (ParamaX)
Delayed
Coker
HCK
VDU
Naphtha
LPG
Diesel
Aromatics production : Refinery feed-rate :
Benzene : 140 KT/yr.
Paraxylene: 700 KT/yr. 400,000 bbl/d
Gasoline
Pool H2
Toluene rich cut, A8+
A9+, Raffinate, light Naphtha
Gasoline
Source : Axens-2012
29

Steam
Cracker
Exis
ting r
efinery
Refinery with Steam Cracker + Aromatics
Benzene
Paraxylene Heavy Naphtha
Propylene
Aromatic Complex (ParamaX)
Pygas
Light Naphtha
C2, LPG, Raffinate
Ethylene
Aromatics production : Refinery feed-rate :
Benzene : 650 KT/yr.
Paraxylene : 1,400 KT/yr. 400,000 bbl/d
Kero
Diesel
Gasoline
Residue
H2 export
Source : Axens-2012
30

• Toluene extraction will increase for converting to Benzene and Xylenes via dis-proportionation
Types of Aromatics : feed-stock based
31
Source : ThyssenKrupp UHDE & Axens
Components, wt% Pygas Reformate Light Reformate Coke Oven Lt. Oil
Benzene 30 3 24 65
Toluene 20 13 46 18
Xylenes 4 18 < 0.5 6
Ethyl-Benzene 3 5 < 0.5 2
C9+ Aromatics 3 16 0 7
Total Aromatics 60 55 70 98
Naphthenes High Low Low High
Olefins High High Low High
Paraffins Low High High Low
Sulfur ~ 1000 ppm < 1 ppm Low ~ 1 %
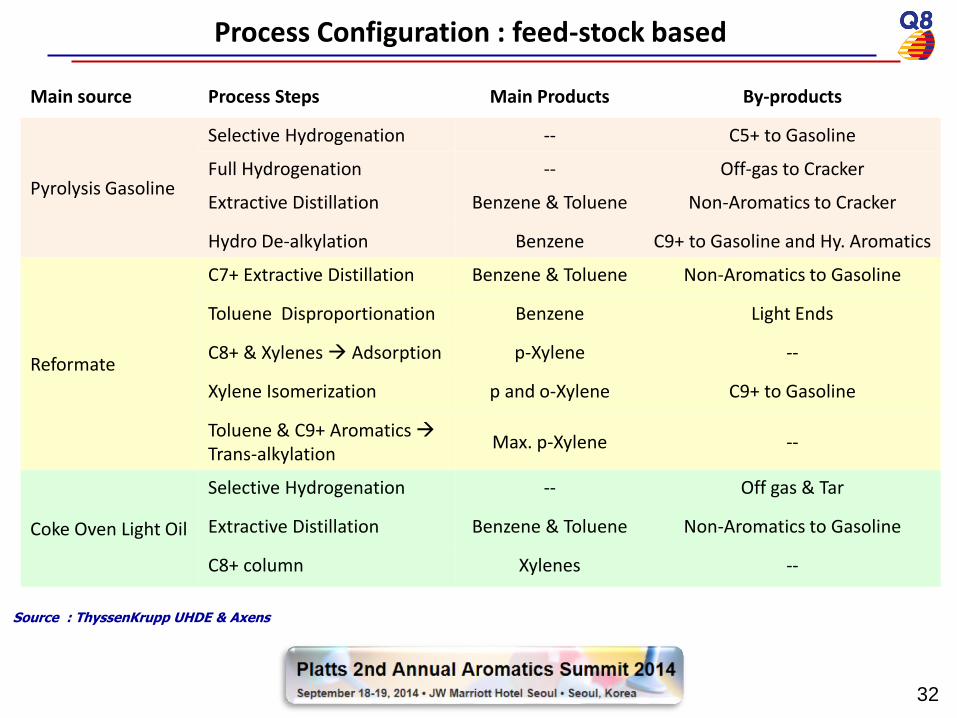
Process Configuration : feed-stock based
32
Source : ThyssenKrupp UHDE & Axens
Main source Process Steps Main Products By-products
Pyrolysis Gasoline
Selective Hydrogenation -- C5+ to Gasoline
Full Hydrogenation -- Off-gas to Cracker
Extractive Distillation Benzene & Toluene Non-Aromatics to Cracker
Hydro De-alkylation Benzene C9+ to Gasoline and Hy. Aromatics
Reformate
C7+ Extractive Distillation Benzene & Toluene Non-Aromatics to Gasoline
Toluene Disproportionation Benzene Light Ends
C8+ & Xylenes Adsorption p-Xylene --
Xylene Isomerization p and o-Xylene C9+ to Gasoline
Toluene & C9+ Aromatics Trans-alkylation
Max. p-Xylene --
Coke Oven Light Oil
Selective Hydrogenation -- Off gas & Tar
Extractive Distillation Benzene & Toluene Non-Aromatics to Gasoline
C8+ column Xylenes --
Coal to Aromatics from Coke Oven Light Oil
Feed from : C2 in FCC dry gas, Refinery LPG, C5+ from Light Naphtha
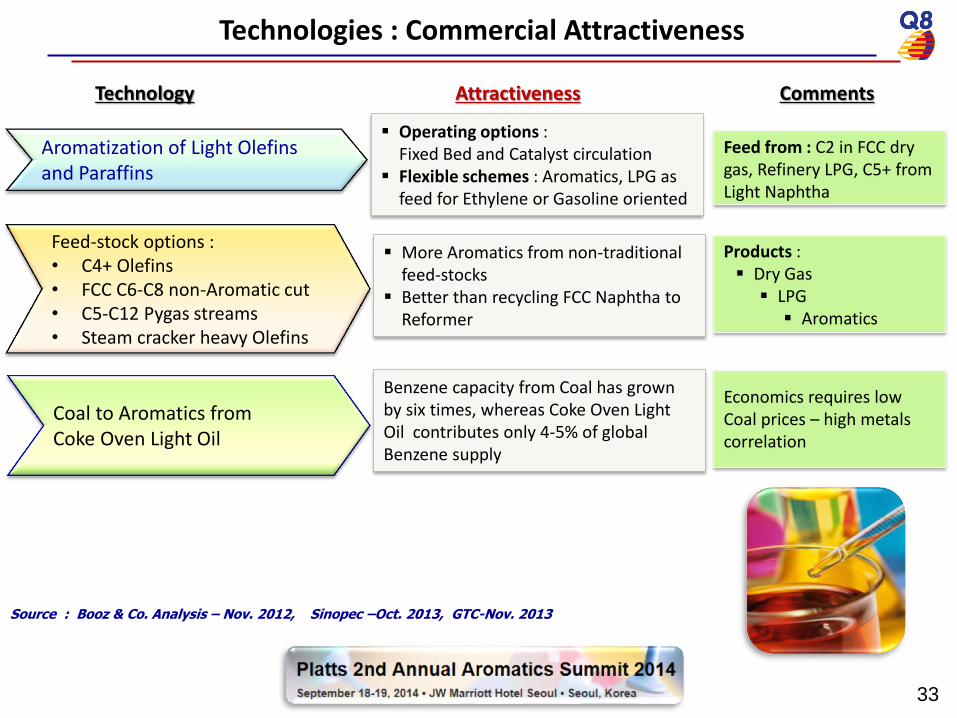
Technologies : Commercial Attractiveness
Technology Attractiveness Comments
Aromatization of Light Olefins and Paraffins
Operating options : Fixed Bed and Catalyst circulation
Flexible schemes : Aromatics, LPG as feed for Ethylene or Gasoline oriented
Feed-stock options : • C4+ Olefins • FCC C6-C8 non-Aromatic cut • C5-C12 Pygas streams • Steam cracker heavy Olefins
33
Source : Booz & Co. Analysis – Nov. 2012, Sinopec –Oct. 2013, GTC-Nov. 2013
More Aromatics from non-traditional feed-stocks
Better than recycling FCC Naphtha to Reformer
Products : Dry Gas LPG Aromatics
Economics requires low Coal prices – high metals correlation
Benzene capacity from Coal has grown by six times, whereas Coke Oven Light Oil contributes only 4-5% of global Benzene supply

5. Conclusion
34
Investment options come with wide range of Capex and Risks :
Opportunities for enhancing value-addition from cheaper advantageous feed-stocks :
1. Operational flexibility to swing production from BTX intermediates to Gasoline blends
as per market demand
2. Unlock value from non-traditional feeds : by-product streams of Naphtha Cracker & FCC
3. Upgrade heavy Naphtha and Condensates to Aromatics
Aromatics Molecule Management, mainly in view of :
1. Shifting towards lighter feed-stocks in Crackers will produce less Benzene
2. Increased Ethanol blending to reduce need for Aromatic octane boosters in Gasoline
3. Decrease in US Gasoline demand would lower need for Reformate
Closing Remarks
35
Thank You

Happy to take Questions