Embed Size (px)
Citation preview

Synergism : what does it mean?
JW MoutonDept Medical Microbiology
Canisius Wilhelmina Hospital
Nijmegen, The Netherlands
RATIONALE FOR ANTIMICROBIAL COMBINATIONS
• Extension of spectrum
• Minimization of resistance
• Minimization of toxicity
• Synergism
Classical definition of Synergism
A combination of two drugs is synergistic if the effect of the combination is more than it would be if the concentration of the second drug is replaced by the first drug.
SYNERGISM
• Increase killing rate
• Potentiation of a drug
• Prevention of elimination– metabolic (enzyme inhibitors)
– renal function (e.g. probenicide)
• Significant better outcome in vivo
SYNERGISM : IN VITRO METHODS
• Checkerboard titrations
• Time-kill curves
• Diffusion methods– disks
– paperstrips
– E-test

SYNERGISM DEFINITIONSTIME KILL CURVES
• >100 fold killing then most active agent after 6 or 24h
• >1000 fold killing then most active agent after 6 or 24h
• significant earlier reduction to 99% or 99.9% cfu

SYNERGISM DEFINITIONSTIME KILL CURVES
• >100 fold killing then most active agent after 24h or 48h
• >1000 fold killing then most active agent after 24h or 48h
• significant earlier reduction to 99% or 99.9% cfu
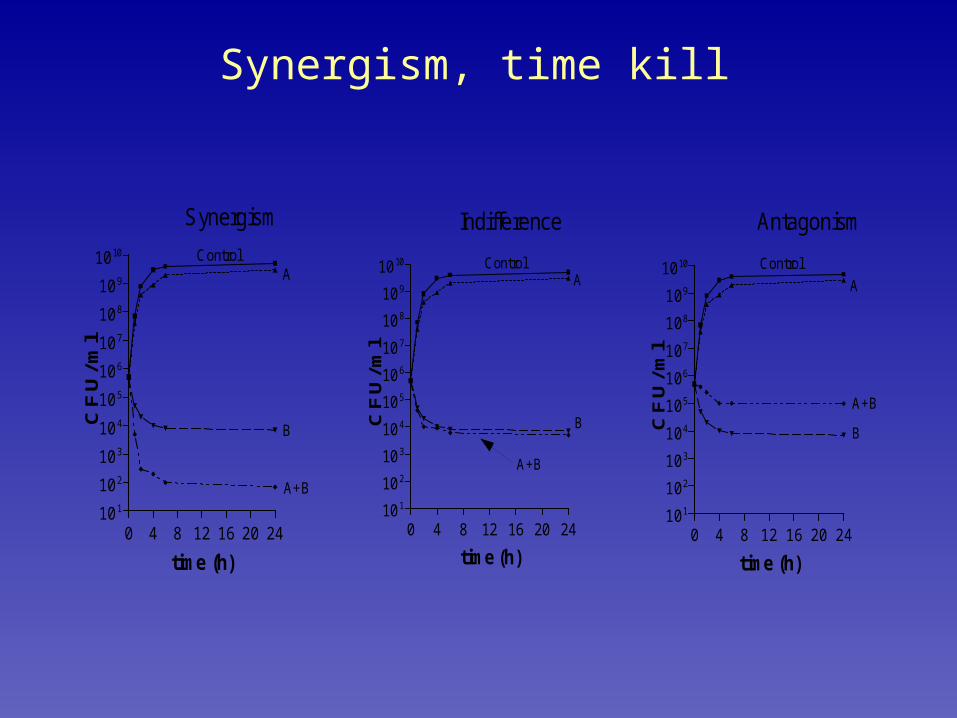
Synergism, time kill
0 4 8 12 16 20 2410 1
10 2
10 3
10 4
10 5
10 6
10 7
10 8
10 9
10 10
A
B
A+B
Control
time (h)
C F
U /
m l
0 4 8 12 16 20 2410 1
10 2
10 3
10 4
10 5
10 6
10 7
10 8
10 9
10 10 ControlA
B
A+B
time (h)
C F
U /
m l
0 4 8 12 16 20 24101
102
103
104
105
106
107
108
109
1010
A
B
A+B
Control
time (h)
C F
U /
m l
Synergism Indifference Antagonism
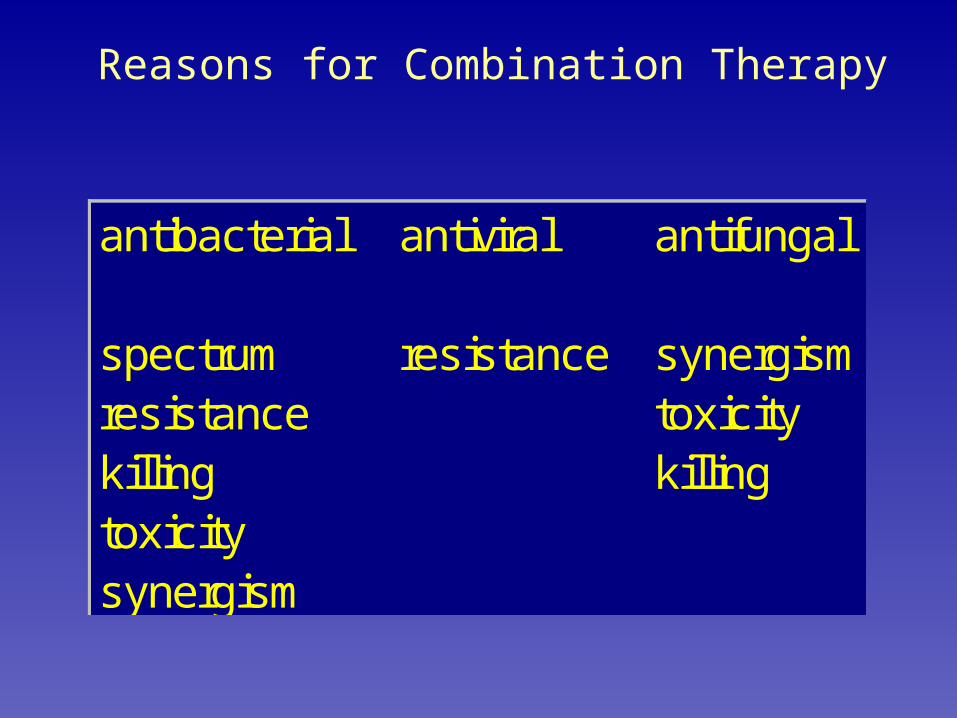
Reasons for Combination Therapy
antibacterial antiviral antifungal
spectrum resistance synergismresistance toxicitykilling killingtoxicitysynergism
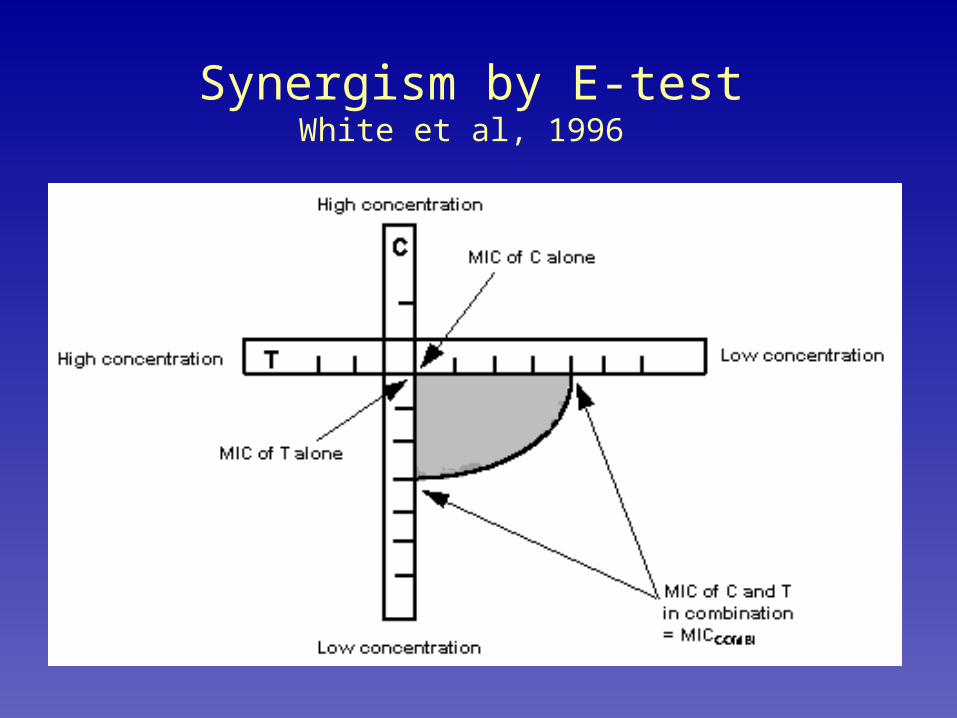
Synergism by E-testWhite et al, 1996

Functions of drug concentration
• Two fold checkerboard dilutions, FIC– advantage : easy to perform– disadvantage :
• very crude, hardly informative• only with steep effect curves
• Effect function– advantage :
• uniformly applicable if effect function is known
– disadvantage : extensive calculations
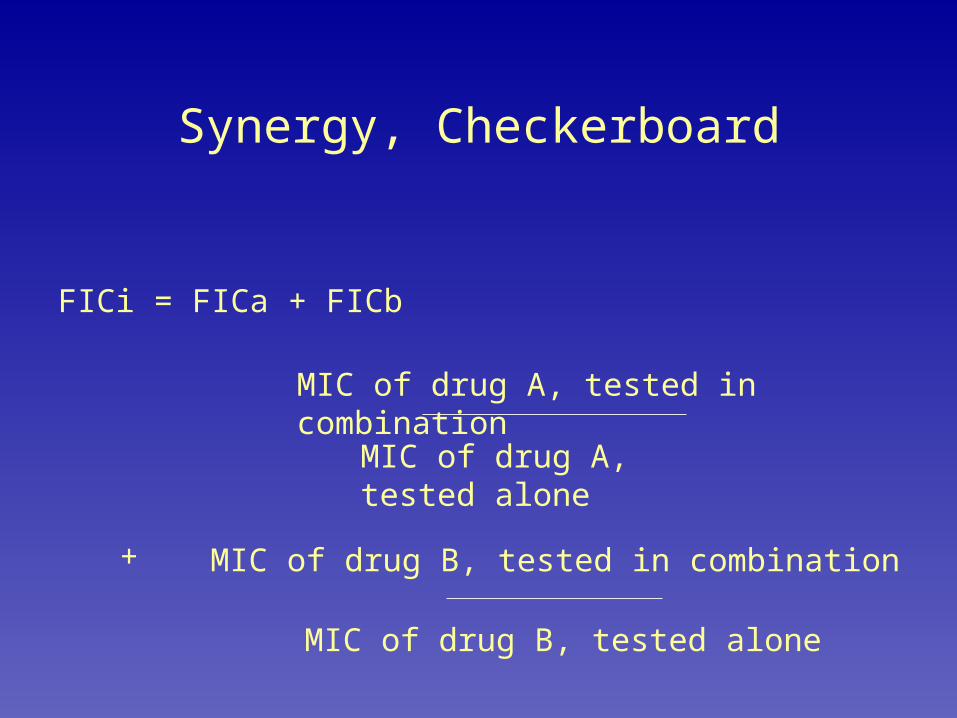
Synergy, Checkerboard
FICi = FICa + FICb
MIC of drug A, tested in combination
MIC of drug B, tested in combination
MIC of drug A, tested alone
MIC of drug B, tested alone
+

Simple Isobole Constraints
1= [drug1] + [drug2]
Conc d1 Conc d2
Where Conc d is concentration that would individually produce the same effect as the combination
URSAUniversal Response Surface Approach
• Loewe constraints
• Berenbaum constraints
• URSA possible if effect measured quantitatively (Greco, 1990)
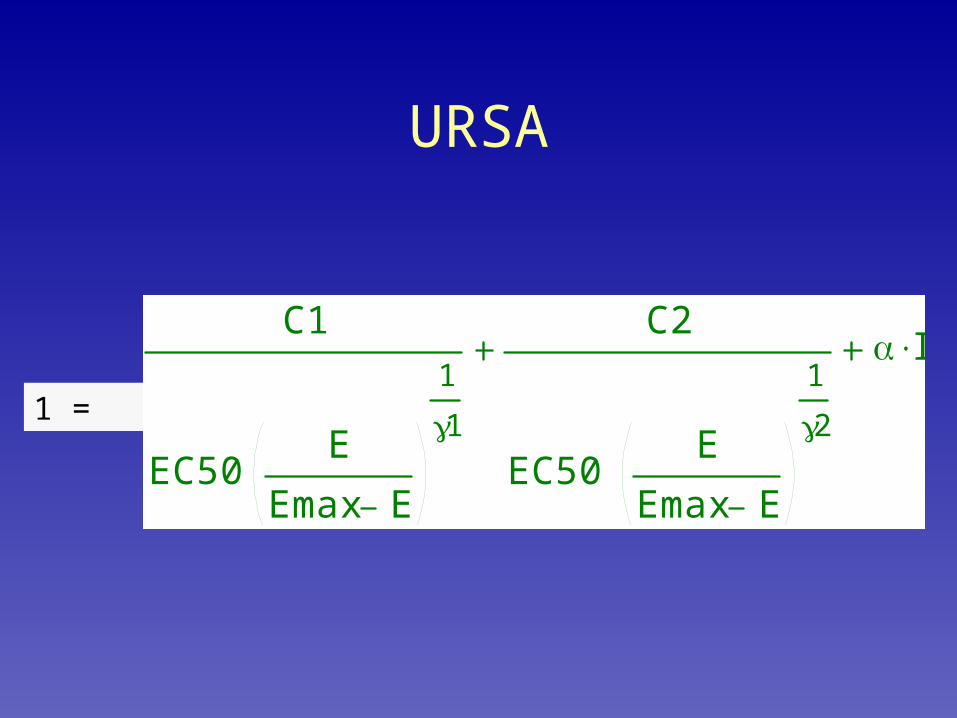
URSA
1 =
C1
EC50E
Emax E
1
1
C2
EC50E
Emax E
1
2
I
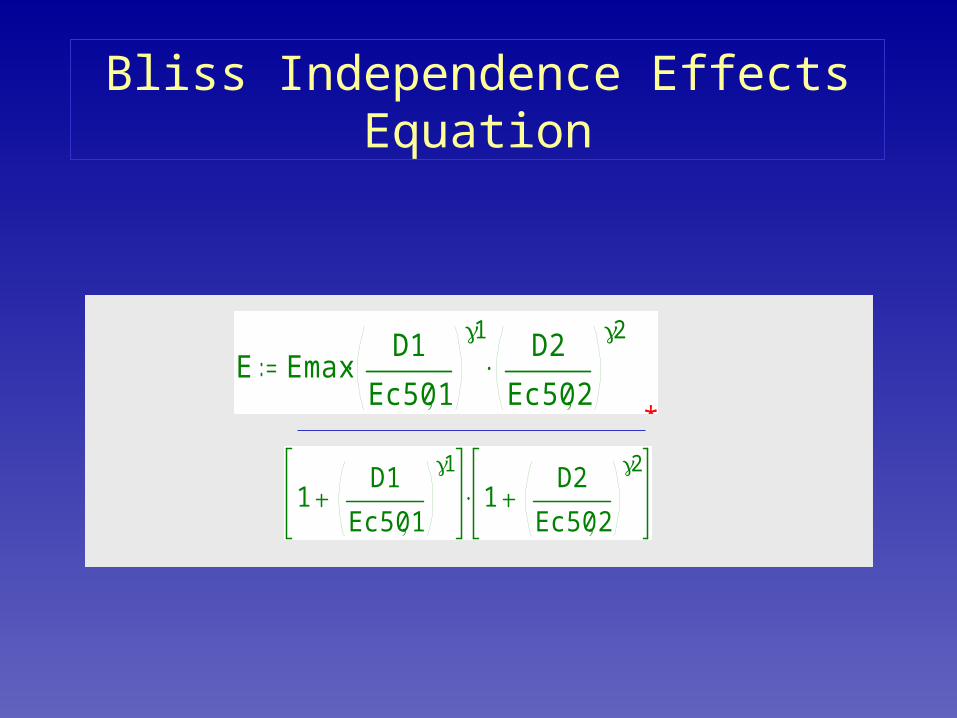
Bliss Independence Effects Equation
E EmaxD1
Ec50 1
1 D2
Ec50 2
2
*
1D1
Ec50 1
11
D2
Ec50 2
2

Zero Surface Substraction Bliss
-1.000 -0.900 -0.800 -0.700 -0.600 -0.500 -0.400 -0.300 -0.200 -0.100 0.000 0.100 0.200 0.300 0.400 0.500 0.600 above
Data: 817pAMFL.STA 10v * 186c
exp2

SYNERGISM DEFINITIONScheckerboard
• FIC index– <0.5 to <1 for synergism– >1 to >2 for antagonism– at least 3 different methods to calculate FICi
• Isoboles– by eye– math expression
• Universal Response Surface

SYNERGISM EXPRESSIONScheckerboard
• FIC index– <0.5 to <1 for synergism– >1 to >2 for antagonism
• Isoboles– by eye– math expression
• Function of Effect– Universal Response Surface (Greco, based on Loewe
and Berenbaum)– Interaction (Bliss)
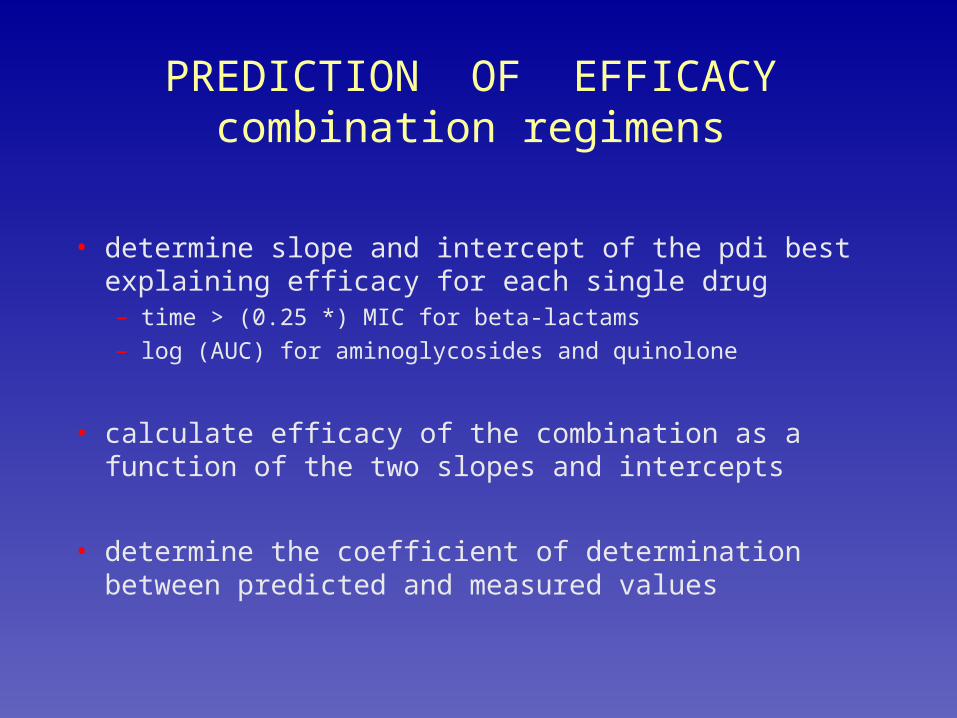
PREDICTION OF EFFICACYcombination regimens
• determine slope and intercept of the pdi best explaining efficacy for each single drug– time > (0.25 *) MIC for beta-lactams
– log (AUC) for aminoglycosides and quinolone
• calculate efficacy of the combination as a function of the two slopes and intercepts
• determine the coefficient of determination between predicted and measured values
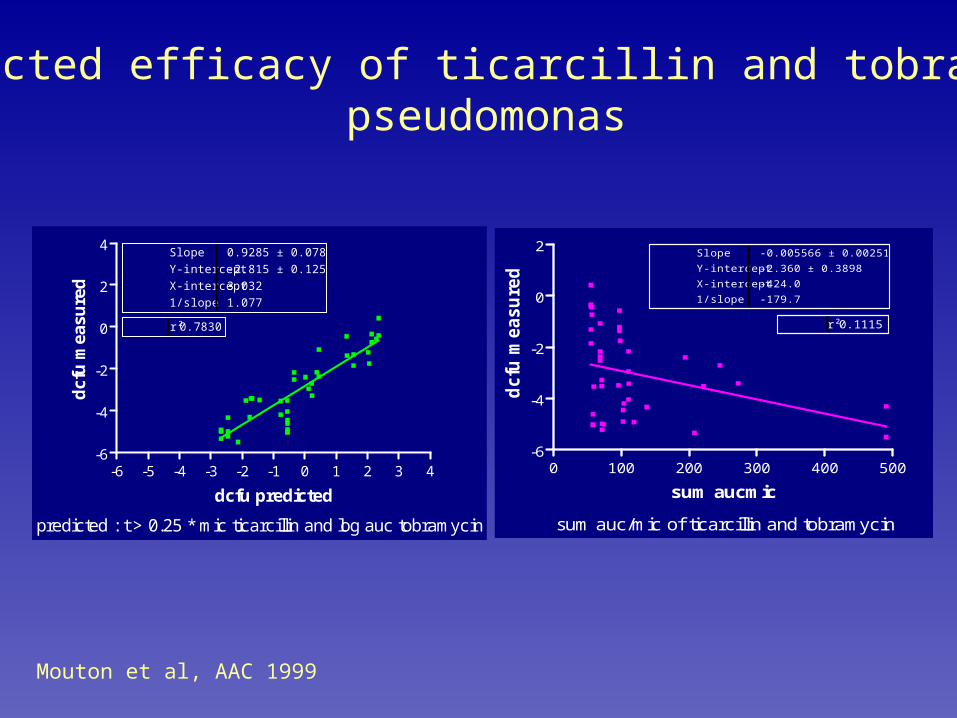
Predicted efficacy of ticarcillin and tobramycinpseudomonas
-6 -5 -4 -3 -2 -1 0 1 2 3 4-6
-4
-2
0
2
4
predicted : t > 0.25 * mic ticarcillin and log auc tobramycin
Slope
Y-intercept
X-intercept
1/slope
0.9285 ± 0.07826
-2.815 ± 0.1250
3.032
1.077
r² 0.7830
dcfu predicted
dcf
u m
easu
red
0 100 200 300 400 500-6
-4
-2
0
2
sum auc/mic of ticarcillin and tobramycin
Slope
Y-intercept
X-intercept
1/slope
-0.005566 ± 0.002515
-2.360 ± 0.3898
-424.0
-179.7
r² 0.1115
sum aucmicd
cfu
measu
red
Mouton et al, AAC 1999

CONCLUSIONS
• Pharmacodynamic indices can be used to predict efficacy of combination therapy in vivo
• These are the same indices as during single drug therapy
• These indexes vary over classes, one index for all classes is not proper


![synergism of nutrition(AHN THR)[1]](https://img.pdfslide.us/doc/110x75/577d2ee01a28ab4e1eb03a65/synergism-of-nutritionahn-thr1.jpg)