Embed Size (px)
Citation preview
1
Syndicate Assignment (syndicate # and firm)
1. Nike
2. GE
3. Procter and Gamble
4. IBM
5. Unilever
6. SAP
7. Qantas
8. Salesforce
9. Nestle
10. Wesfarmers
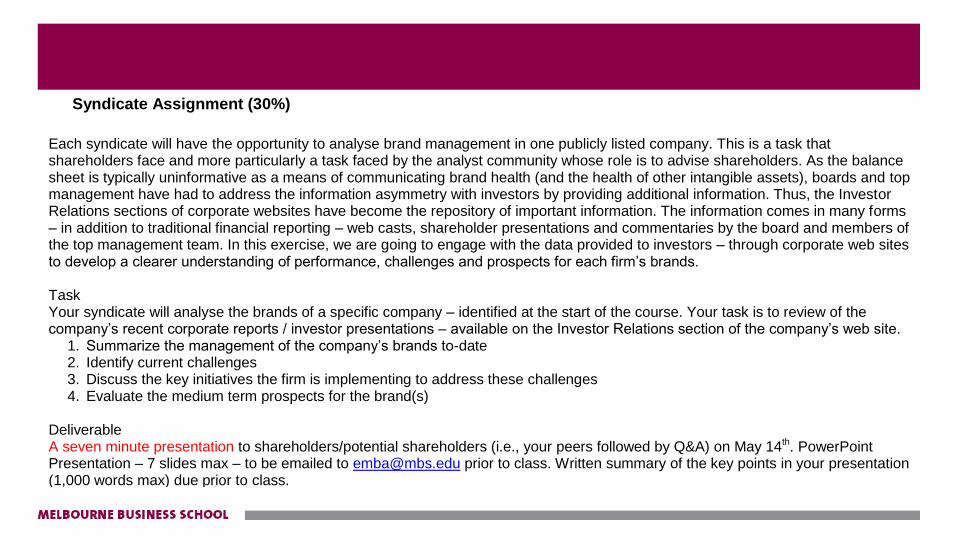
Syndicate Assignment (30%)
Each syndicate will have the opportunity to analyse brand management in one publicly listed company. This is a task that shareholders face and more particularly a task faced by the analyst community whose role is to advise shareholders. As the balance sheet is typically uninformative as a means of communicating brand health (and the health of other intangible assets), boards and top management have had to address the information asymmetry with investors by providing additional information. Thus, the Investor Relations sections of corporate websites have become the repository of important information. The information comes in many forms – in addition to traditional financial reporting – web casts, shareholder presentations and commentaries by the board and members of the top management team. In this exercise, we are going to engage with the data provided to investors – through corporate web sites to develop a clearer understanding of performance, challenges and prospects for each firm’s brands. Task Your syndicate will analyse the brands of a specific company – identified at the start of the course. Your task is to review of the company’s recent corporate reports / investor presentations – available on the Investor Relations section of the company’s web site.
1. Summarize the management of the company’s brands to-date 2. Identify current challenges 3. Discuss the key initiatives the firm is implementing to address these challenges 4. Evaluate the medium term prospects for the brand(s)
Deliverable A seven minute presentation to shareholders/potential shareholders (i.e., your peers followed by Q&A) on May 14th. PowerPoint Presentation – 7 slides max – to be emailed to [email protected] prior to class. Written summary of the key points in your presentation (1,000 words max) due prior to class.
BRAND MANAGEMENT Session 3 & 4 Leveraging The Brand
4 4
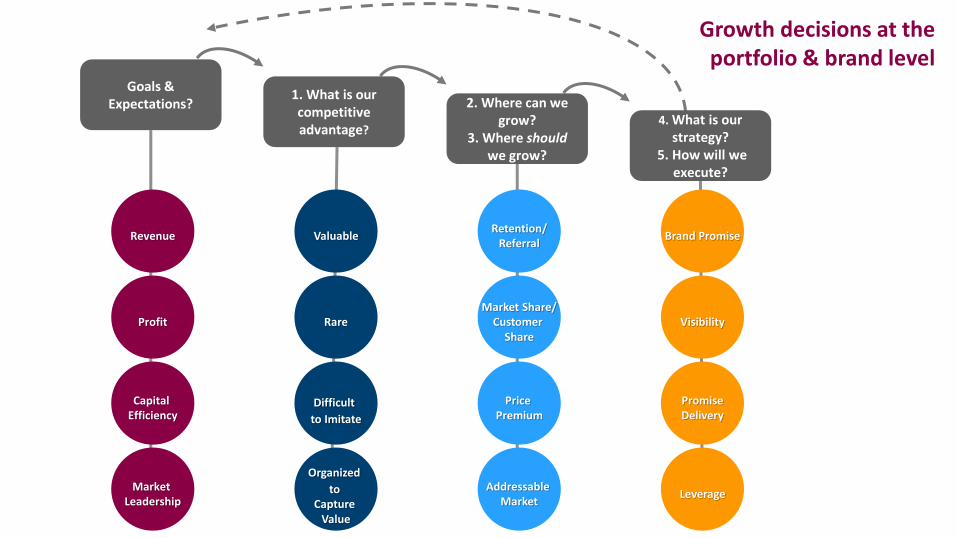
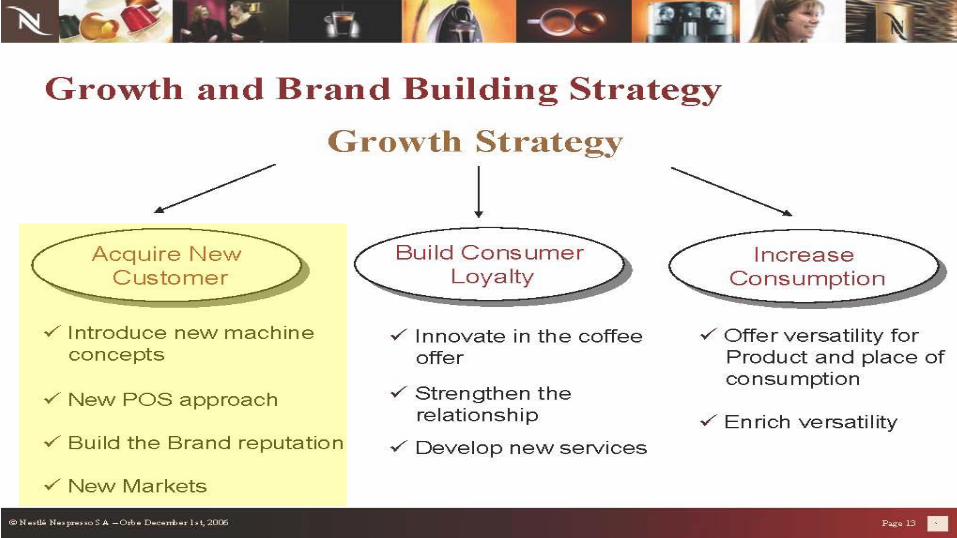
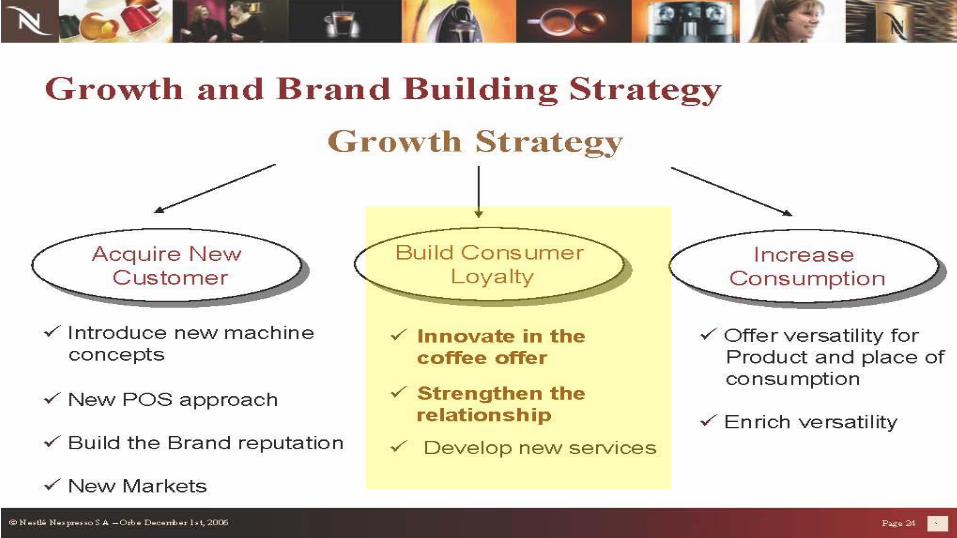
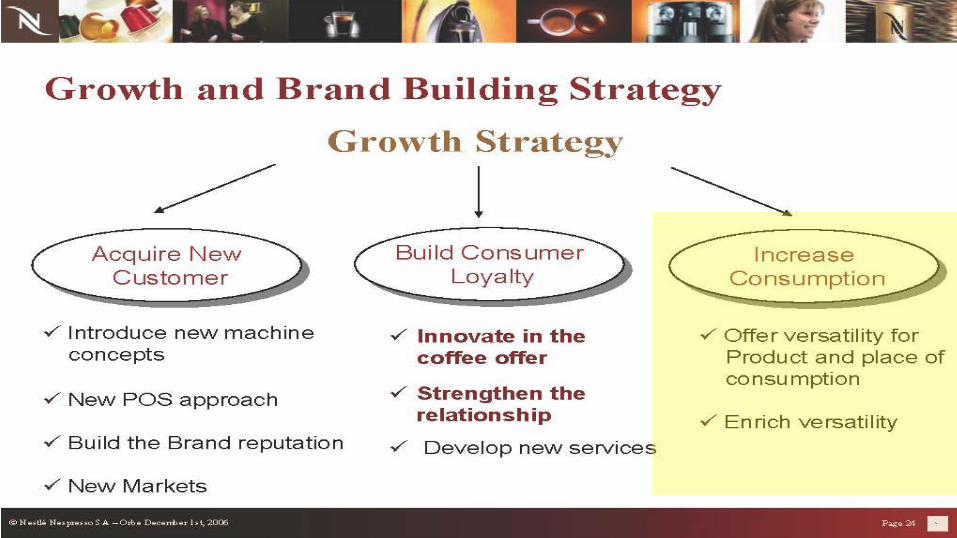
Growth decisions at the portfolio & brand level
2. Where can we grow?
3. Where should we grow?
Retention/ Referral
Market Share/ Customer
Share
Price Premium
Addressable Market
4. What is our strategy?
5. How will we execute?
Brand Promise
Visibility
Promise Delivery
Leverage
Goals & Expectations?
Revenue
Profit
Capital Efficiency
Market Leadership
1. What is our competitive advantage?
Valuable
Rare
Difficult to Imitate
Organized to
Capture Value
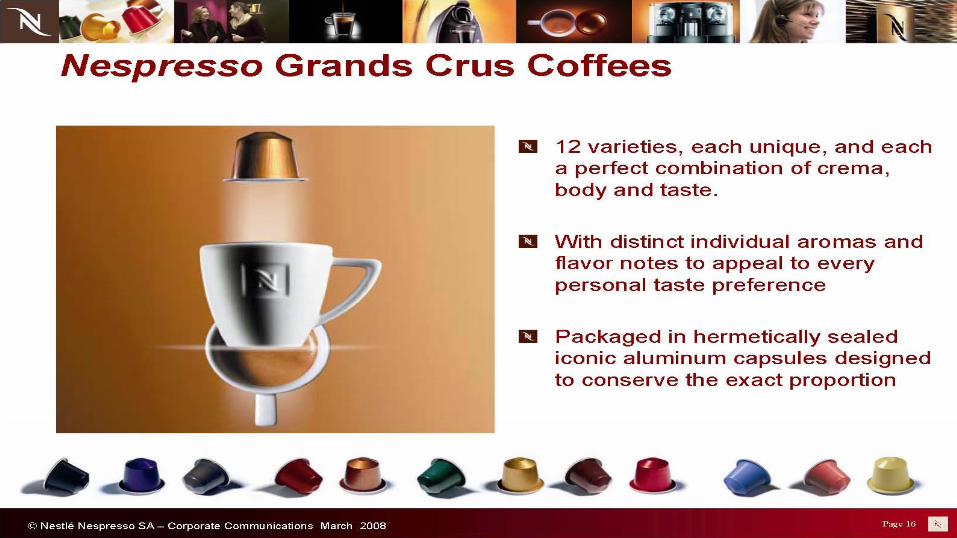
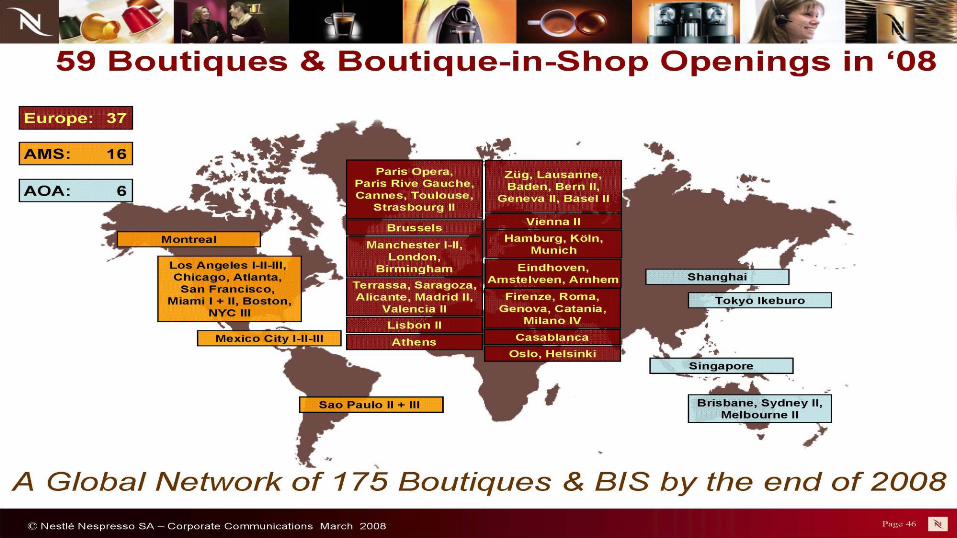
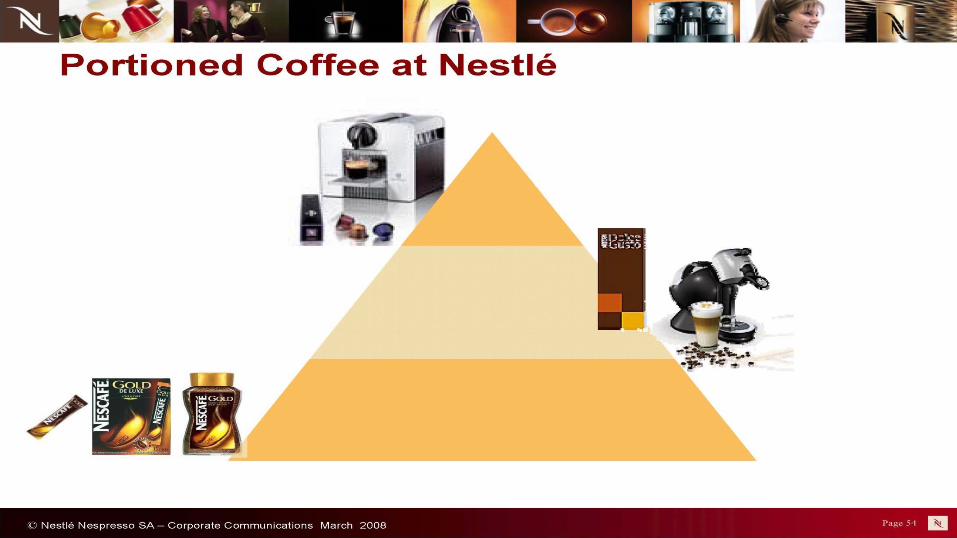
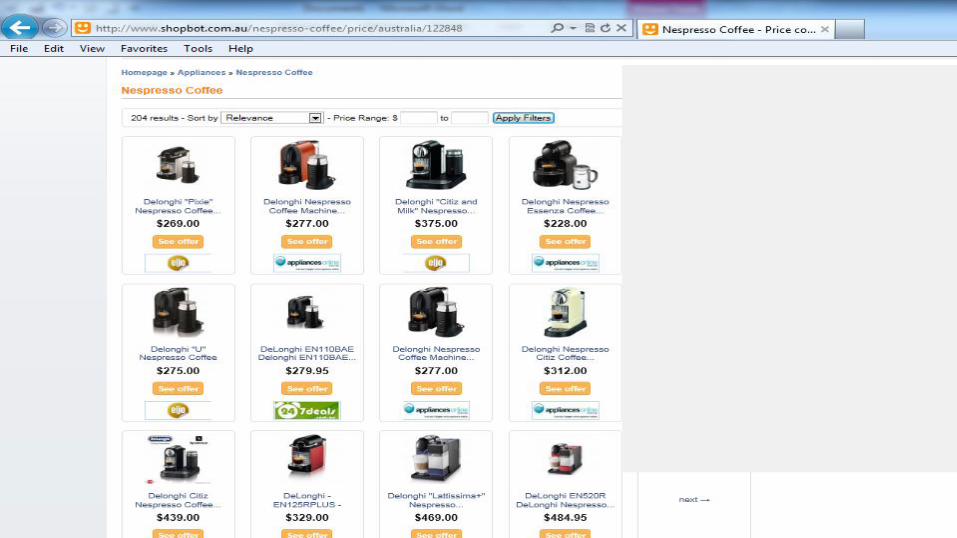
NESTLE AND THE MULTI-BEVERAGE MACHINE MARKET

6
Paul Bulcke: CEO Nestlé
7
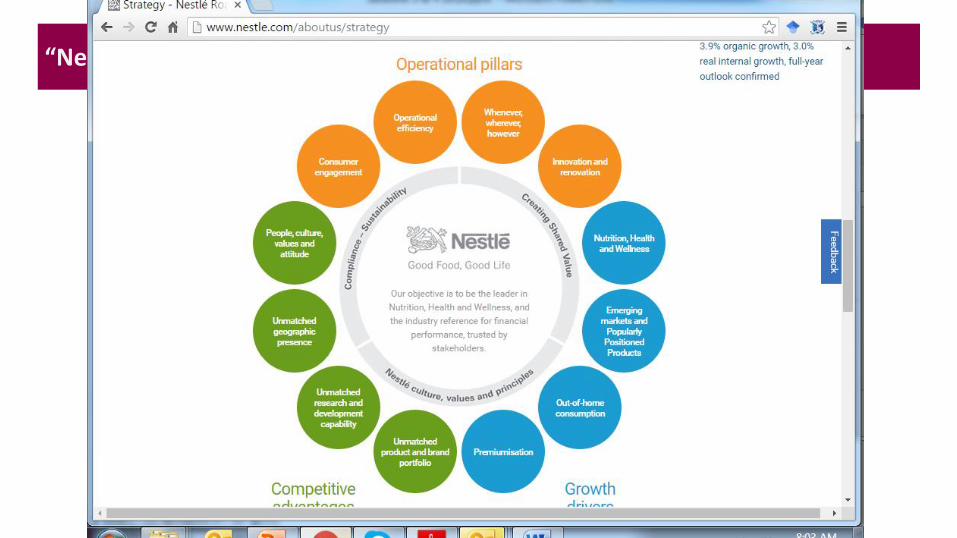
“Nestle Model & Roadmap”
Long-term organic growth of 5%-6%
EBIT margin improvement every year
Increase return on invested capital
Market Leadership
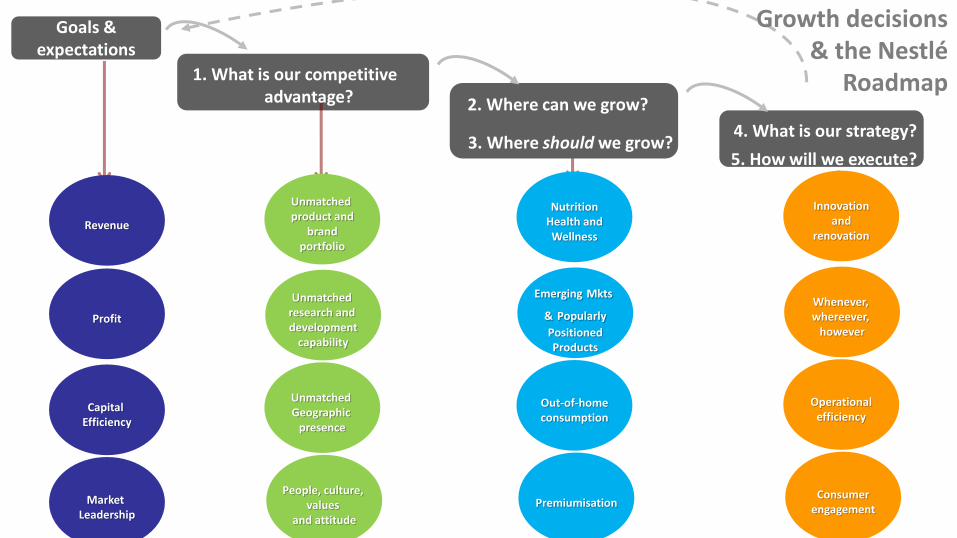
Growth decisions & the Nestlé
Roadmap
3. Where should we grow?
Goals & expectations
1. What is our competitive advantage? 2. Where can we grow?
4. What is our strategy?
5. How will we execute?
Revenue
Profit
Capital Efficiency
Market Leadership
Unmatched product and
brand portfolio
People, culture, values
and attitude
Unmatched Geographic
presence
Nutrition Health and Wellness
Premiumisation
Out-of-home consumption
Innovation and
renovation
Whenever, whereever,
however
Consumer engagement
Operational efficiency
Unmatched research and development
capability
Emerging Mkts
& Popularly
Positioned Products

9
Case questions
1. Should Nestle entre the multi-beverage machine market (yes or no)?
2. Assuming they do entre the market, how should the product be branded?
(a) Nespresso branded
(b) Nestlé branded
(c) Nescafé branded
(d) as a standalone brand
(e) something else

11
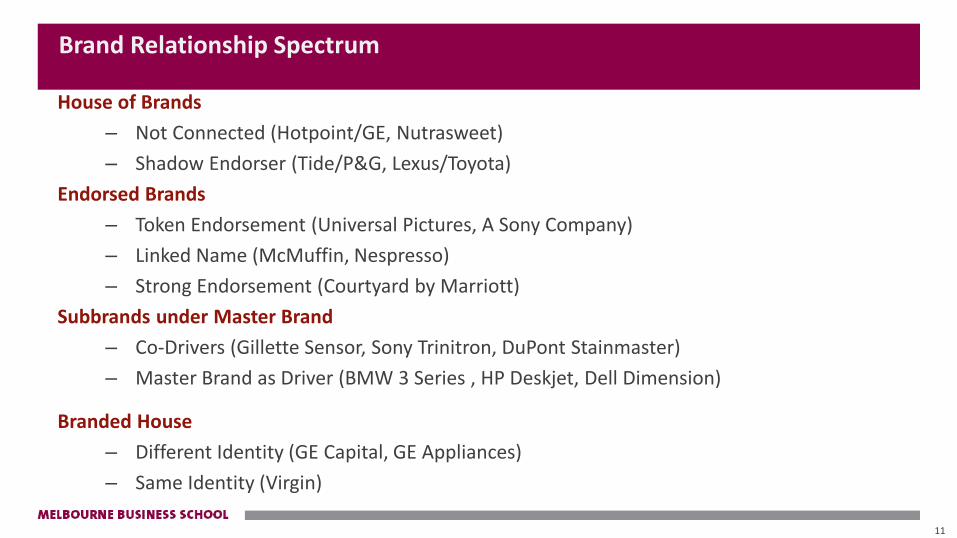
Brand Relationship Spectrum
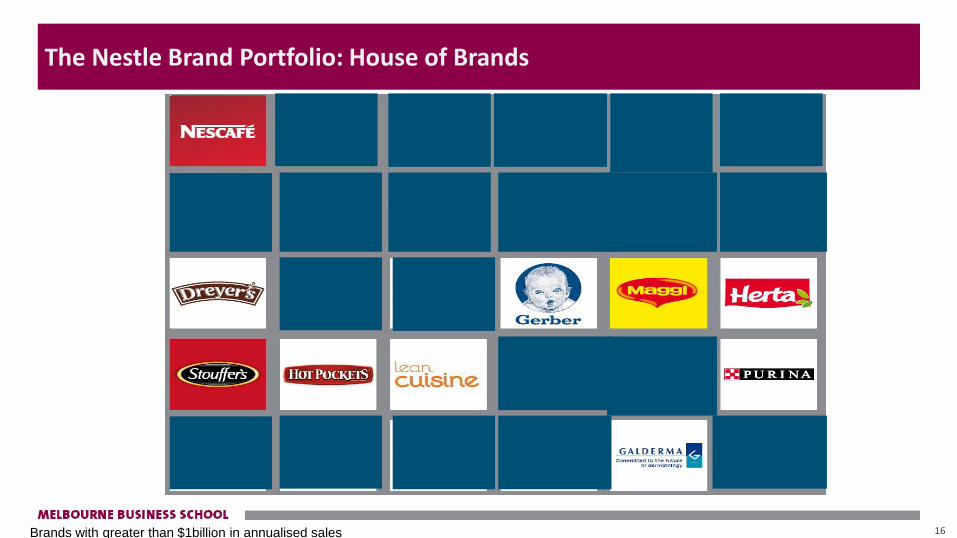
House of Brands
– Not Connected (Hotpoint/GE, Nutrasweet)
– Shadow Endorser (Tide/P&G, Lexus/Toyota)
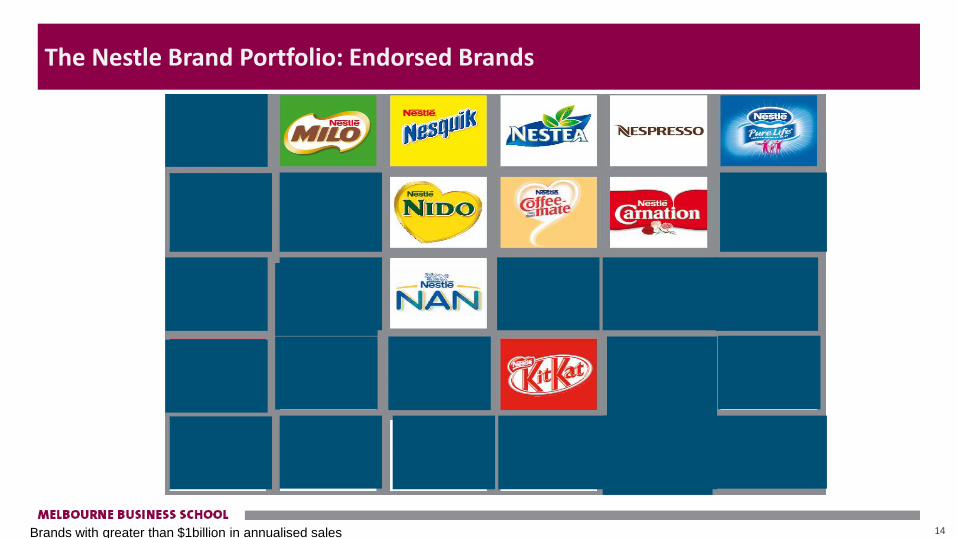
Endorsed Brands
– Token Endorsement (Universal Pictures, A Sony Company)
– Linked Name (McMuffin, Nespresso)
– Strong Endorsement (Courtyard by Marriott)
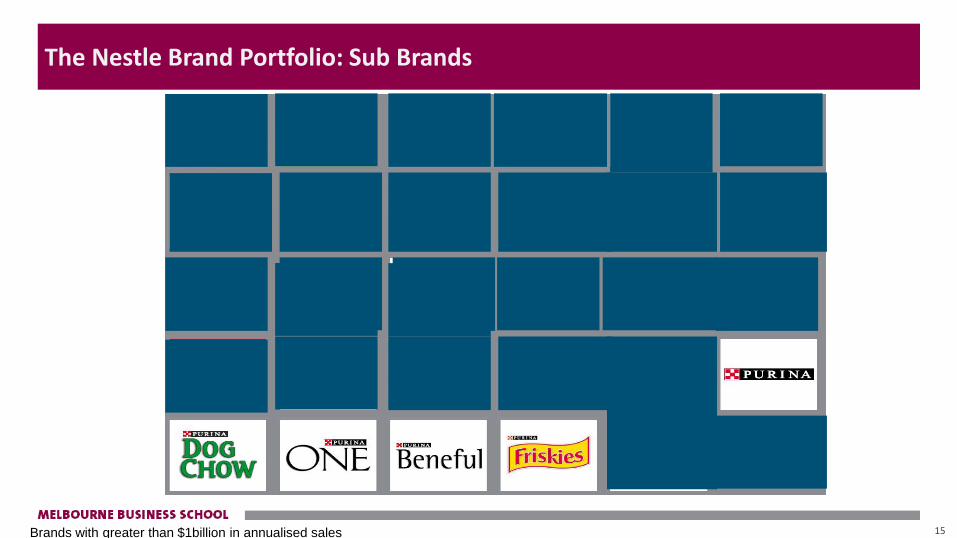
Subbrands under Master Brand
– Co-Drivers (Gillette Sensor, Sony Trinitron, DuPont Stainmaster)
– Master Brand as Driver (BMW 3 Series , HP Deskjet, Dell Dimension)
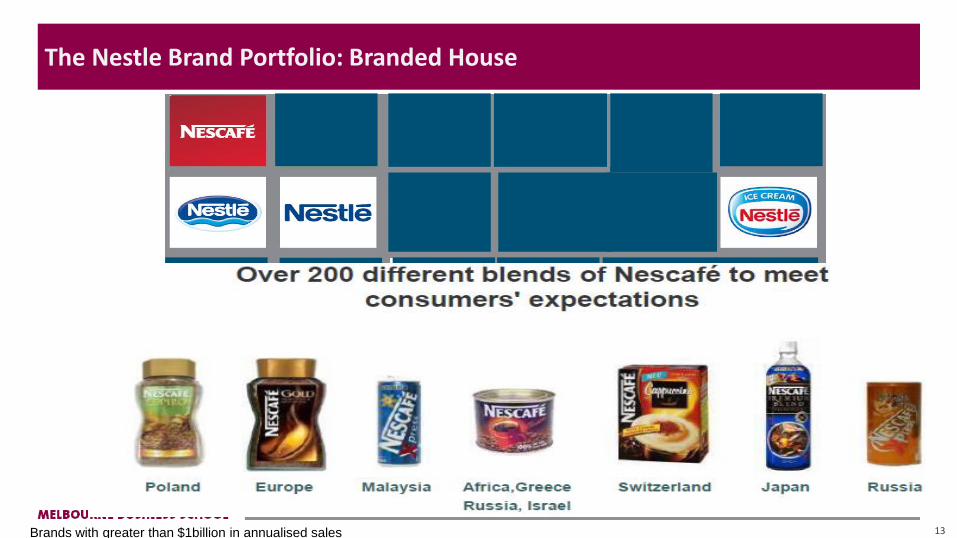
Branded House
– Different Identity (GE Capital, GE Appliances)
– Same Identity (Virgin)

12
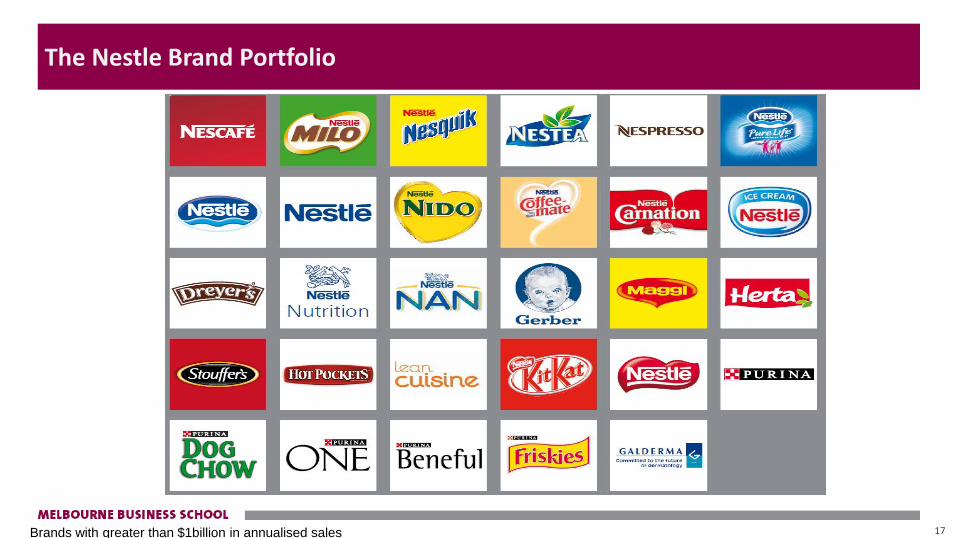
The Nestle Brand Portfolio
Brands with greater than $1billion in annualised sales
13
The Nestle Brand Portfolio: Branded House
Brands with greater than $1billion in annualised sales
14
The Nestle Brand Portfolio: Endorsed Brands
Brands with greater than $1billion in annualised sales
15
The Nestle Brand Portfolio: Sub Brands
Brands with greater than $1billion in annualised sales
16
The Nestle Brand Portfolio: House of Brands
Brands with greater than $1billion in annualised sales
17
The Nestle Brand Portfolio
Brands with greater than $1billion in annualised sales
18
Case questions
1. Should Nestle entre the multi-beverage machine market (yes or no)?
2. Assuming they do entre the market, how should the product be branded?
(a) Nespresso branded
(b) Nestlé branded
(c) Nescafé branded
(d) as a standalone brand
(e) something else

20
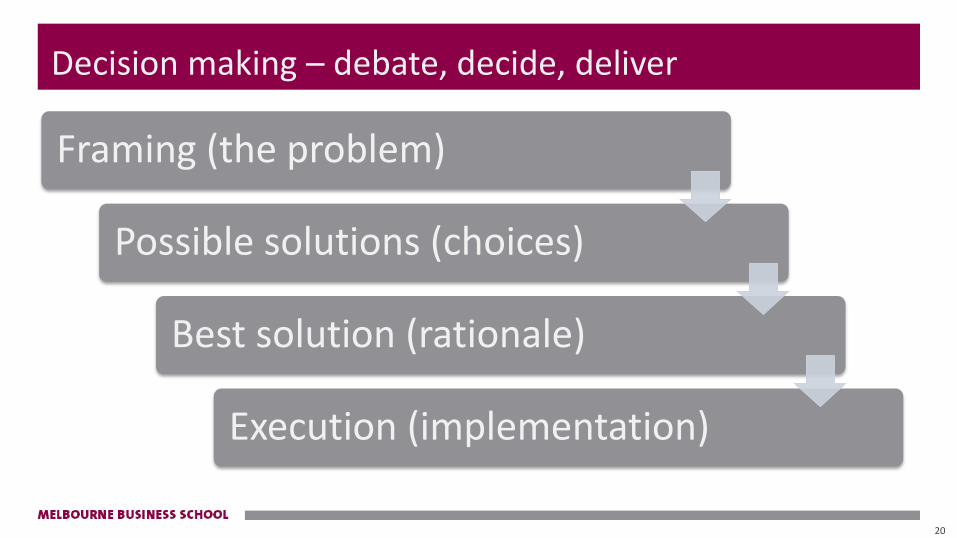
Framing (the problem)
Possible solutions (choices)
Best solution (rationale)
Execution (implementation)
Decision making – debate, decide, deliver
25
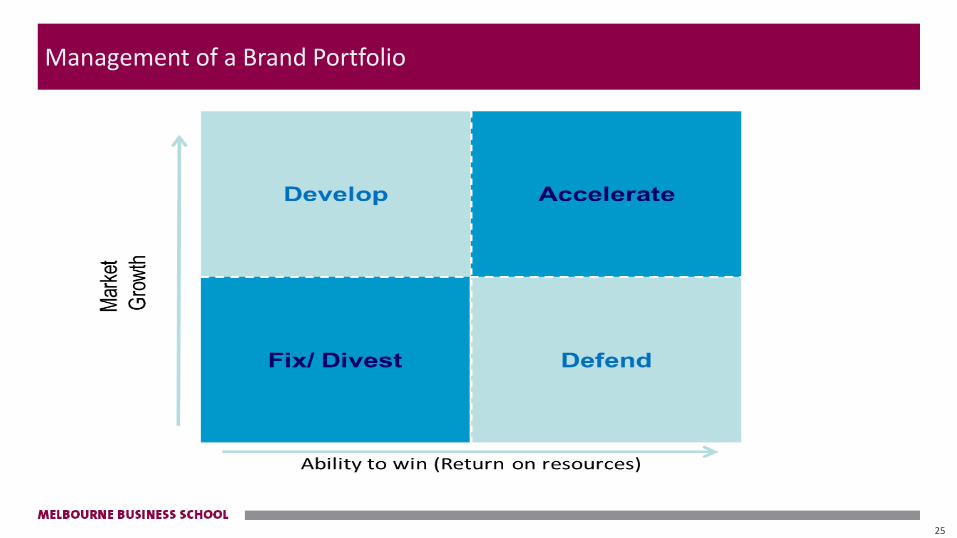
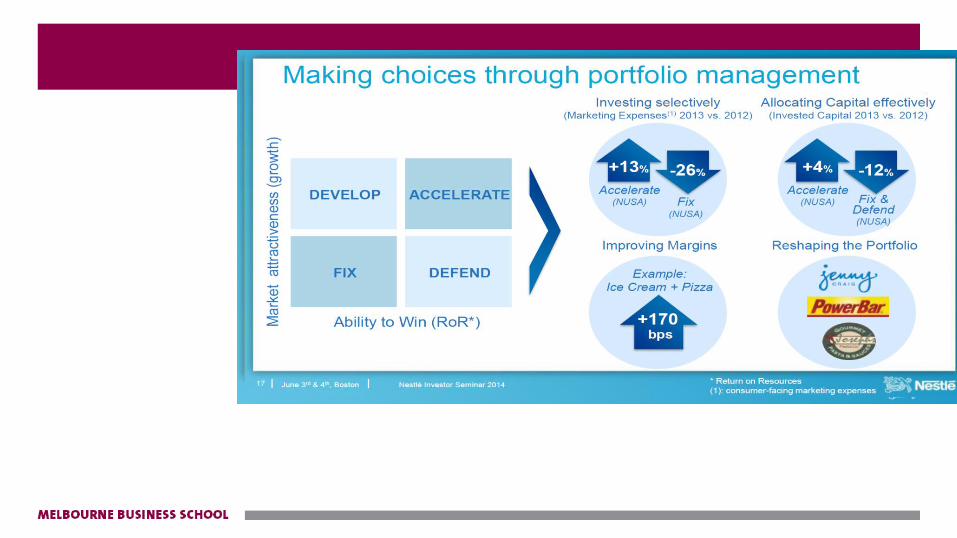
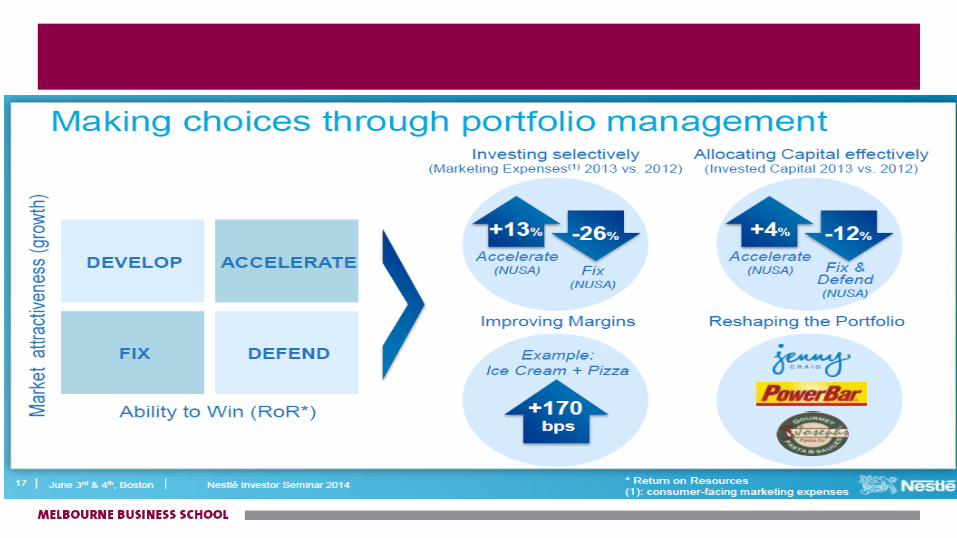
Management of a Brand Portfolio
26
29
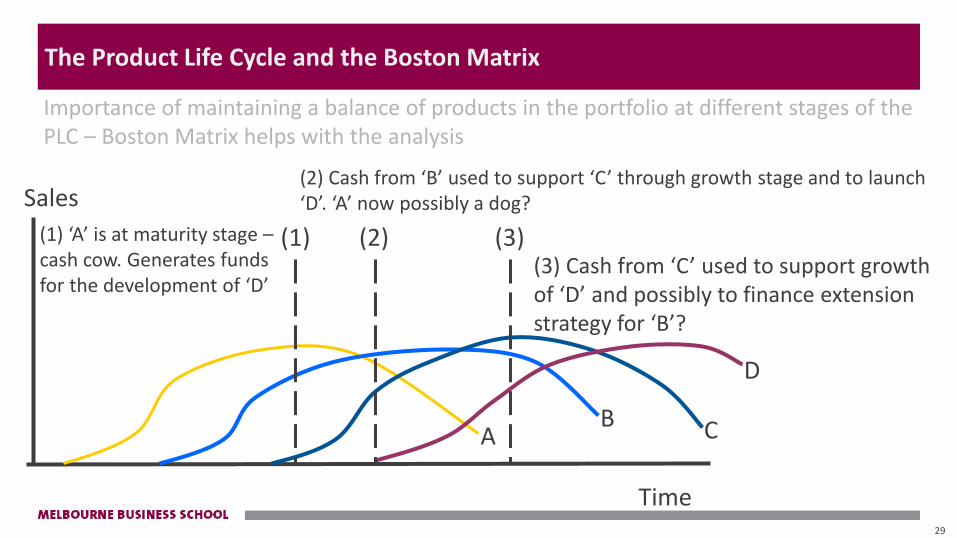
The Product Life Cycle and the Boston Matrix
Sales
Time
A B C
D
(1) (1) ‘A’ is at maturity stage – cash cow. Generates funds for the development of ‘D’
(2)
(2) Cash from ‘B’ used to support ‘C’ through growth stage and to launch ‘D’. ‘A’ now possibly a dog?
(3) (3) Cash from ‘C’ used to support growth of ‘D’ and possibly to finance extension strategy for ‘B’?
Importance of maintaining a balance of products in the portfolio at different stages of the PLC – Boston Matrix helps with the analysis
74
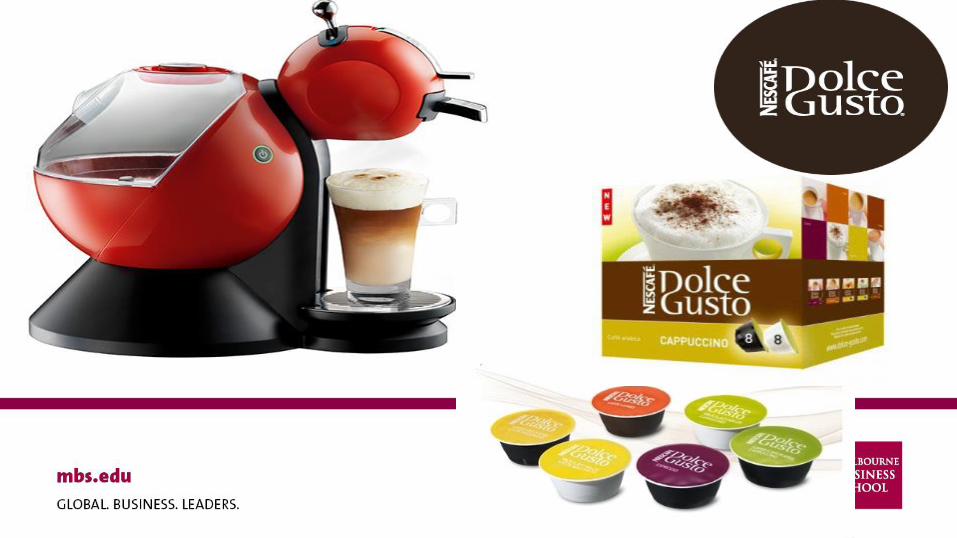
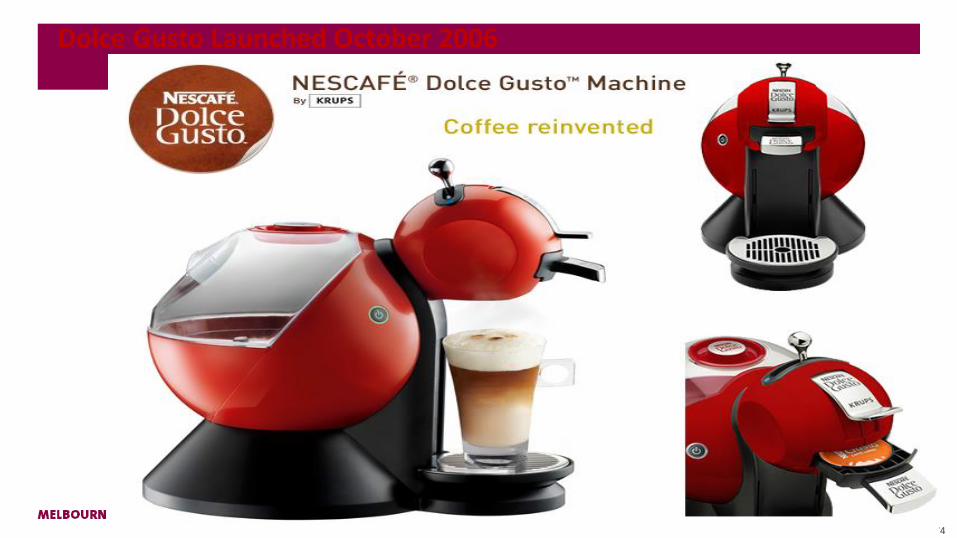
Dolce Gusto Launched October 2006
75
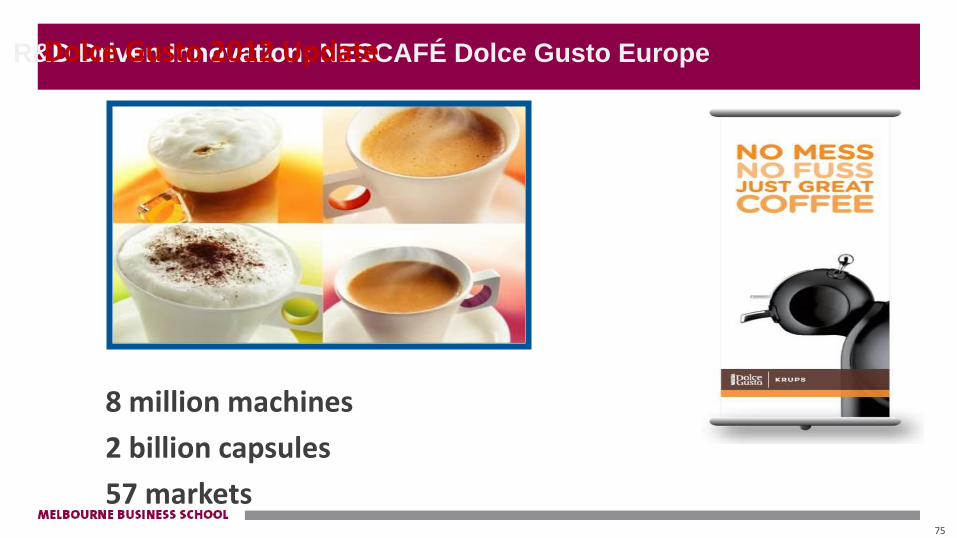
R&D Driven Innovation: NESCAFÉ Dolce Gusto Europe Dolce Gusto 2012 Update
8 million machines
2 billion capsules
57 markets
76
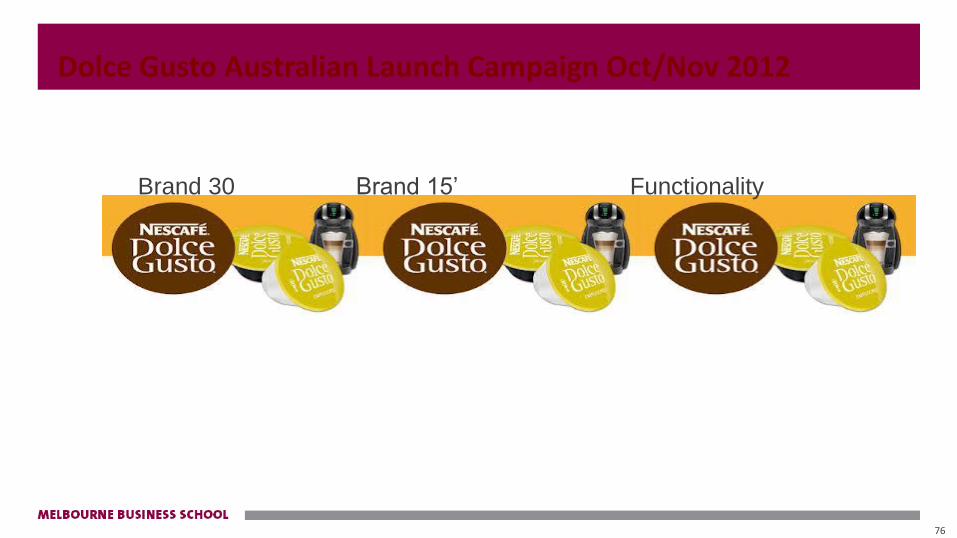
Dolce Gusto Australian Launch Campaign Oct/Nov 2012
Brand 30 Brand 15’ Functionality
77
78
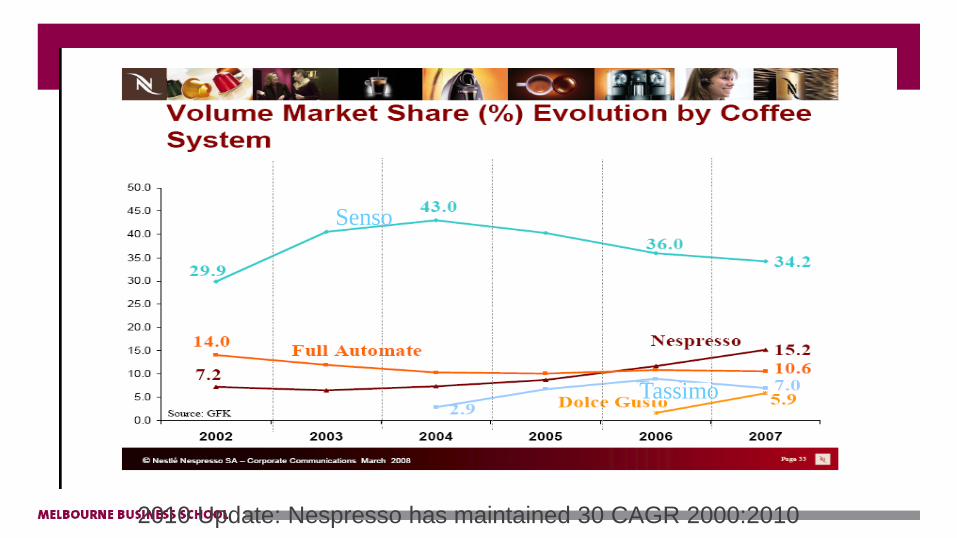
Senso
Tassimo
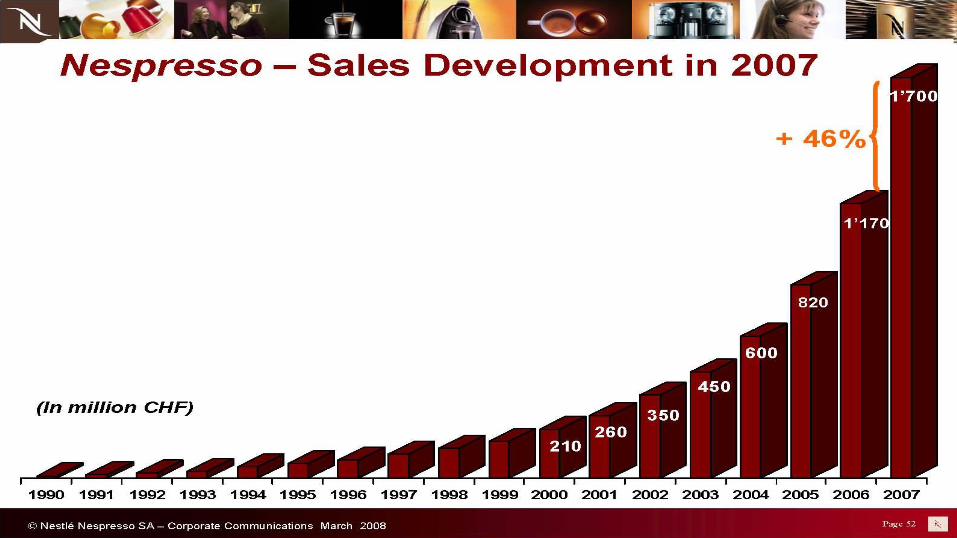
2010 Update: Nespresso has maintained 30 CAGR 2000:2010
82
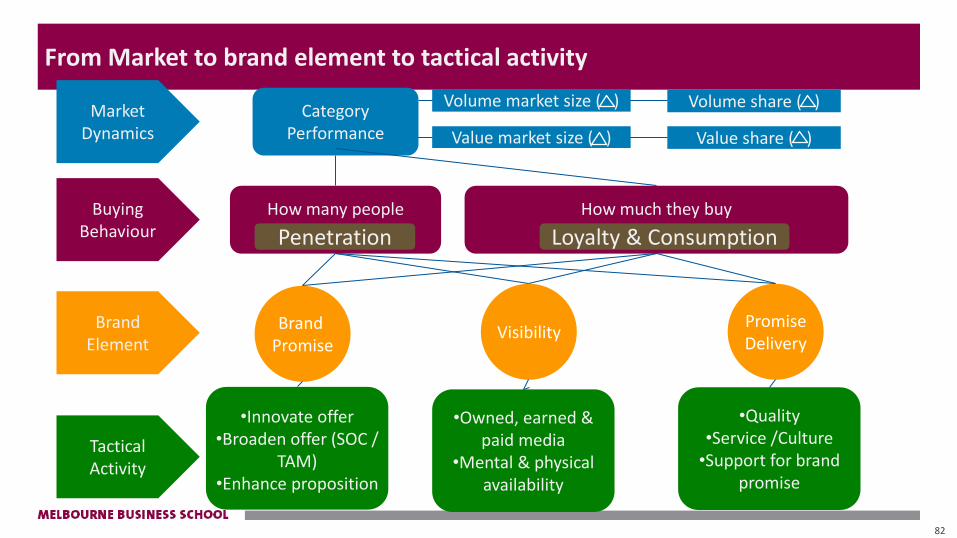
From Market to brand element to tactical activity
Market Dynamics
Category Performance
Volume market size ( ) Volume share ( )
Value market size ( ) Value share ( )
Brand Element
Brand Promise
Visibility Promise Delivery
Tactical Activity
•Innovate offer •Broaden offer (SOC /
TAM) •Enhance proposition
•Owned, earned & paid media
•Mental & physical availability
•Quality •Service /Culture
•Support for brand promise
Buying Behaviour
How many people
How much they buy Penetration Loyalty & Consumption
88
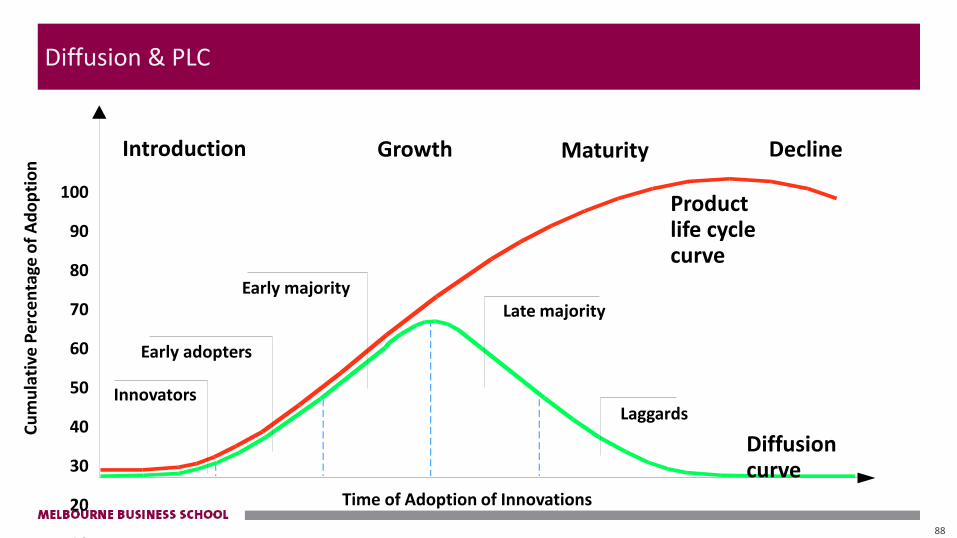
Diffusion & PLC
Innovators
Early adopters
Early majority Late majority
Laggards
Product life cycle curve
Diffusion curve
Cu
mu
lati
ve P
erc
en
tage
of
Ad
op
tio
n
100
90
80
70
60
50
40
30
20
10
0
Introduction Growth Maturity Decline
Time of Adoption of Innovations
89
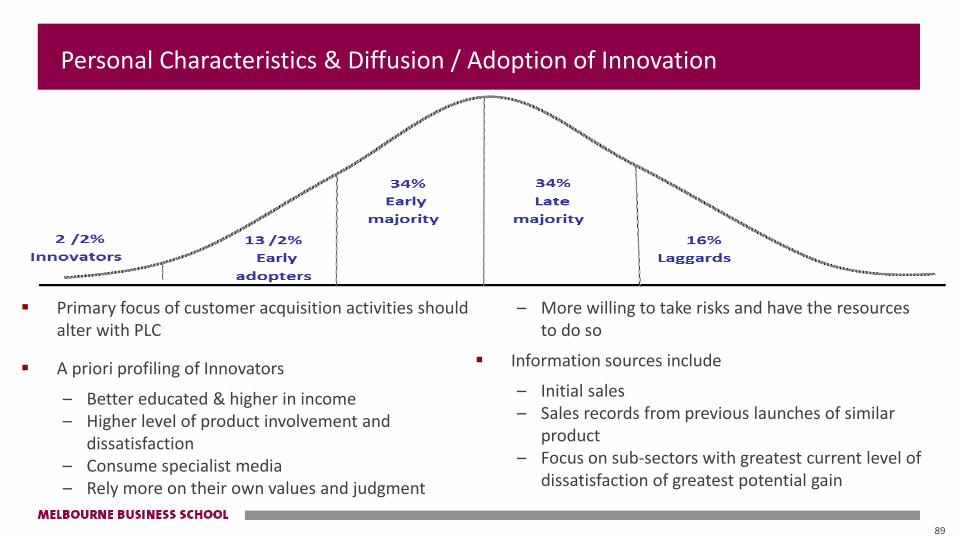
Personal Characteristics & Diffusion / Adoption of Innovation
Primary focus of customer acquisition activities should alter with PLC
A priori profiling of Innovators
– Better educated & higher in income – Higher level of product involvement and
dissatisfaction – Consume specialist media – Rely more on their own values and judgment
– More willing to take risks and have the resources to do so
Information sources include
– Initial sales – Sales records from previous launches of similar
product – Focus on sub-sectors with greatest current level of
dissatisfaction of greatest potential gain

BRAND MANAGEMENT Session 3 & 4 Leveraging The Brand