Embed Size (px)
Citation preview

feature articles
1056 http://dx.doi.org/10.1107/S1600577516009024 J. Synchrotron Rad. (2016). 23, 1056–1069
Received 30 November 2015
Accepted 3 June 2016
Edited by I. Schlichting, Max Planck Institute
for Medical Research, Germany
Keywords: bound water; hydroxyl radical
labeling; mass spectrometry; protein
conformation; protein modification.
Synchrotron X-ray footprinting as a method tovisualize water in proteins
Sayan Gupta,a Jun Feng,b Leanne Jade G. Chan,c Christopher J. Petzoldc and
Corie Y. Ralstona*
aMolecular Biophysics and Integrated Bioimaging, Lawrence Berkeley National Laboratory, Berkeley, CA 94720, USA,bExperimental Systems, Advanced Light Source, Lawrence Berkeley National Laboratory, Berkeley, CA 94720, USA, andcBiological Systems and Engineering, Lawrence Berkeley National Laboratory, Berkeley, CA 94720, USA.
*Correspondence e-mail: [email protected]
The vast majority of biomolecular processes are controlled or facilitated by
water interactions. In enzymes, regulatory proteins, membrane-bound receptors
and ion-channels, water bound to functionally important residues creates
hydrogen-bonding networks that underlie the mechanism of action of the
macromolecule. High-resolution X-ray structures are often difficult to obtain
with many of these classes of proteins because sample conditions, such as
the necessity of detergents, often impede crystallization. Other biophysical
techniques such as neutron scattering, nuclear magnetic resonance and Fourier
transform infrared spectroscopy are useful for studying internal water, though
each has its own advantages and drawbacks, and often a hybrid approach is
required to address important biological problems associated with protein–
water interactions. One major area requiring more investigation is the study of
bound water molecules which reside in cavities and channels and which are
often involved in both the structural and functional aspects of receptor,
transporter and ion channel proteins. In recent years, significant progress has
been made in synchrotron-based radiolytic labeling and mass spectroscopy
techniques for both the identification of bound waters and for characterizing the
role of water in protein conformational changes at a high degree of spatial and
temporal resolution. Here the latest developments and future capabilities of this
method for investigating water–protein interactions and its synergy with other
synchrotron-based methods are discussed.
1. Introduction
Water plays a substantial role in the fundamental events of
biological processes and regulates biomolecular structure and
dynamics in living cells (Ball, 2008). Interactions with water
are demonstrated to be critical for protein structure, flexibility
and folding (Williams et al., 1994; Renthal, 2008; Chaplin,
2006; Angel, Chance et al., 2009; Jiang & Brunger, 1994). It has
also become increasingly clear that water molecules play an
active role in protein–ligand and protein–protein interactions
(Bhat et al., 1994; Braden et al., 1995; Papoian et al., 2003;
Rispens et al., 2014; Levinson & Boxer, 2014; Breiten et al.,
2013), protein activity and catalysis (Nibali & Havenith, 2014;
Royer et al., 1996; Hare et al., 2010; Yoon et al., 2004; Cui et al.,
2014), electron and proton transfer (Garczarek & Gerwert,
2006; Lin et al., 2005; Rich & Marechal, 2013), transmembrane
signaling in receptors (Yuan et al., 2014; Angel, Chance et al.,
2009) and substrate transfer by ion channels and transporters
(Gupta, Chai et al., 2014; Ostmeyer et al., 2013). Because
proteins are the central players in cellular sensory cascades,
antibody-antigen recognition and metabolite transport, de-
ISSN 1600-5775
# 2016 International Union of Crystallography

lineating protein–water interactions in these systems is of
prime importance in understanding these pharmacological
targets. Waters in proteins are also an important component of
the dynamic aspect of photosynthetic and photoregulatory
protein systems (Kerfeld et al., 2003; Frankel et al., 2013).
Therefore, elucidation of their functional mechanisms, which
is important for bioenergy applications, relies on our detailed
understanding of protein–water interactions.
X-ray crystallography is one of the tools used to determine
the positions of water molecules within proteins at atomic
resolution. With the continuous evolution of X-ray sources,
detectors, software and protein engineering techniques, very
high resolution crystal structures are often obtainable at 2 A
or higher resolution. These structures typically show one to
two waters per residue (Carugo & Bordo, 1999), and analysis
of structures from the Protein Data Bank (PDB) has shown
a threefold higher concentration of water in cavities and
grooves over water at protein surfaces (Williams et al., 1994;
Kuhn et al., 1992). In contrast to protein surfaces, water in
cavities shows a preference for polar side chains over back-
bone amide bonds when forming hydrogen-bonding networks
(Kuhn et al., 1992). Such water–side-chain hydrogen-bonding
networks in protein cavities are formed to a much greater
extent than between surface-exposed residues and bulk water
(Williams et al., 1994). Waters in cavities are commonly
referred to as bound water (Fig. 1a), which predominantly
forms polar contacts with residues rather than with other
waters in proximity. Buried water is a form of bound water
which is apparently isolated from the bulk and often
conserved, forming hydrogen-bonding networks with
conserved and functionally important side chains (Angel,
Chance et al., 2009; Halle, 2004; Renthal, 2008; Carugo &
Bordo, 1999). The chemical nature of the solvent component
used for protein stabilization and crystal formation can affect
the occupancy of bound water molecules. The degree to which
these solvent components, relative to water, are attracted to or
repelled from hydrophobic or polar regions may therefore
cause the protein molecule to stabilize preferentially with
feature articles
J. Synchrotron Rad. (2016). 23, 1056–1069 Sayan Gupta et al. � Synchrotron footprinting to visualize water in proteins 1057
Figure 1Major reactions scenarios for X-ray radiolysis in dilute protein samples. (a) Schematic showing the position of bulk-, surface- and bound-water (cavity-and buried-water) (light blue) in a protein molecule (dark blue). (b) Radiolysis of water and the timescale of sequence of events. Reproduced fromGupta et al. (2014) and Liljenzin (2002). (c) The location of hydroxyl radicals (red) generated in situ from ionization or activation of water by X-rayirradiation. The �OH radicals react with nearby side chains in close proximity, and yield covalent modifications on the protein side chains (yellow).Radiolysis of bulk water starts with the ionization of water on the time scale of 10�16 s. The key product, �OH, diffuses (10�7 s) out in the bulk (redarrows) and undergoes reactions with other �OH, buffer molecules and protein side chains (bimolecular reactions are indicated by black arrows, andapproximate values of the rate constants for different reactions are shown). The rapid counterproductive reactions, such as �OH—�OH recombination,as well as various other reactions, scavenge �OH and reduce the concentration of �OH in the bulk. Thus a sufficient X-ray dose or high-flux-density beamis needed to maintain a steady concentration of �OH that will lead to a detectable yield of side-chain modification on the protein in solution. In contrast,�OH radicals formed from activation of a bound water can react faster with side chains in proximity because of the translational and rotational orderingof water and because fewer scavenging reactions by other �OH or highly reactive buffer constituents are available. Radiolysis of water also produceselectrons, which rapidly become solvated and react with O2 to produce superoxide radicals. In general, the reactivity of side chains to solvated electronsis lower than to hydroxyl radicals (Xu & Chance, 2007). Peroxides and superoxides undergo slow reactions with protein side chains and are quenched asdescribed in x2.1 and x2.3. Solvated electrons consume O2, which is also required for side-chain labeling by �OH radicals (Fig. 2); thus short irradiationtime as well as high flux density are the key factors for success of the XF-MS experiment. Reproduced in part from Gupta et al. (2014).

certain inter- and intra-molecular interactions. Hence, protein
crystals might not give structural information on bound water
locations that matches the native environment in solution
phase and/or physiological conditions. Moreover, while high-
resolution crystal structures provide a detailed structural view
of the bound water, they also necessarily lack information on
the dynamic properties related to protein function.
Other high-resolution methods such as neutron diffraction
can provide information on the dynamics of protein surface
hydration on a time scale of pico- to nano-seconds and on
distance scales of a few angstroms (Tarek & Tobias, 2000;
Nickels et al., 2012; Frolich et al., 2009), and high-field nuclear
magnetic resonance (NMR) such as NOESY (nuclear Over-
hauser enhancement spectroscopy) and MRD (magnetic
resonance dispersion) methods can also directly determine the
dynamics of bound waters in proteins with a high degree of
spatial and temporal resolution in solution (Bertini et al., 2000;
Brunne et al., 1993; Denisov & Halle, 1996; Denisov et al., 1996;
Nucci et al., 2011; Otting et al., 1991; Persson & Halle, 2008).
These methods can determine residence times of individual
bound waters on the order of sub-nanoseconds to milli-
seconds; however, such experimental approaches are limited
due to specific sample condition requirements.
The much lower resolution method of vibrational absorp-
tion spectroscopy has a high degree of sensitivity to changes in
a hydrogen-bonded environment and therefore has proven
useful for detecting protein–water interactions. Non-invasive
NIR (near infrared at �1400 cm�1) spectroscopy has been
used as a spectral biomarker to reveal differences in water–
protein interactions in protein samples (Gowen et al., 2013;
Tsenkova, 2009). FTIR (Fourier transform infrared spectro-
scopy) at O—H and O—D stretching frequencies, together
with site-directed mutagenesis, has been used to identify site-
specific protein–water interactions, which in turn have
revealed important information about the role of internal
waters in membrane protein systems (Furutani et al., 2003;
Kandori, 2000; Garczarek & Gerwert, 2006; Marechal & Rich,
2011; Muroda et al., 2012). While FITR methods directly
determine the location of bound waters, sample preparation
requirements and mutagenesis steps often limit the applic-
ability of the technique.
Theoretical predictions from molecular dynamics (MD)
simulations provide another important approach that can
probe structural, dynamical and thermodynamical properties
of protein–water interactions over a broad range of time scales
(Beuming et al., 2012; Tran et al., 2013; Breiten et al., 2013;
Tarek & Tobias, 2000; Nibali & Havenith, 2014). MD results
are often unclear due to discrepancies in interpreting experi-
mental results. However, recent microsecond MD simulations
have revealed the importance of structural water in both a
potassium channel and rhodopsin activation, and the results
correlated well with existing biophysical and structural infor-
mation (Ostmeyer et al., 2013; Yuan et al., 2014). It is impor-
tant that these methods continue to be developed to pinpoint
the locations and dynamics of bound water in physiologically
relevant samples in order to address a wide range of biological
questions.
Recently, the method of synchrotron X-ray radiolytic
labeling mass spectrometry (XF-MS) has been shown to be
able to directly distinguish the interactions of bulk and bound
water with protein side chains in solution. With this technique,
reactive hydroxyl radicals (�OH) are generated in situ by high-
flux-density X-rays, causing covalent labeling of protein side
chains which are detected by mass spectrometry analysis. The
in situ covalent labeling approach eliminates most of the
complexity associated with sample preparation necessary with
other high-resolution techniques and at the same time allows
easy comparative structural analysis of protein samples under
various physiologically relevant conditions. This review
describes the XF-MS method, reviews recent developments
and future applications to study water–protein interactions
and protein conformational changes, and discusses the synergy
of the method with other synchrotron and biophysical
methods when a hybrid approach is needed to solve important
biological questions.
2. Synchrotron X-ray radiolytic labeling and massspectrometry (XF-MS)
XF-MS has developed in the past decade into a nearly routine
technique, and has been applied to a diverse range of biolo-
gical systems, yielding unique structural insights impossible to
obtain using only the standard structural methods of crystal-
lography, NMR, electron microscopy and small-angle scat-
tering (Bohon et al., 2008; Gupta et al., 2007, 2010, 2012;
Kiselar & Chance, 2010; Angel, Gupta et al., 2009; Chaudhuri
et al., 2011; Kamal et al., 2007; Kiselar et al., 2003; Orban et al.,
2012; Padayatti et al., 2013; Xu & Chance, 2007; Gupta, Chai et
al., 2014; Leverenz et al., 2015; Klinger et al., 2014; Salanga et
al., 2014). The key reaction for XF-MS is the covalent labeling
of solvent accessible protein side chains by �OH, which is
generated rapidly and isotropically in situ by high-flux-density
broad-band synchrotron X-rays in an aqueous buffered solu-
tion (Xu & Chance, 2007; Gupta, Celestre et al., 2014). Under
controlled irradiation and aerobic conditions, labeling results
in permanent mass adducts, predominantly +16, +14, +32 and
+48 Da, at various side chains. These covalent markers on the
protein accessible sites are analyzed by mass-spectrometry-
based bottom-up proteomics (Takamoto & Chance, 2006; Xu
& Chance, 2007). The extent of reaction between protein and�OH or yield of covalent labeling depends on both the
intrinsic reactivity and the solvent accessibility of the residues.
However, since most footprinting studies compare two or
more states of proteins, the changes in the amount of covalent
labeling on the same residue from one state to another
depends solely on the solvent accessibility difference between
the two states. The information obtained can be interpreted in
the context of existing high-resolution structures of one state
and compared with that of an unknown state, or incorporated
into molecular modeling strategies that provide information
about protein or ligand docking and conformational changes
(Kamal & Chance, 2008; Leverenz et al., 2015; Gupta, Chai et
al., 2014).
feature articles
1058 Sayan Gupta et al. � Synchrotron footprinting to visualize water in proteins J. Synchrotron Rad. (2016). 23, 1056–1069

2.1. Chemical basis of radiolysis for XF
A synchrotron bending-magnet beamline can deliver a high
flux such as 1015–1016 photon s�1 of continuous X-ray beam
with a wide energy range (1–20 keV), and X-rays of this
energy range interact with water almost exclusively via the
photoelectric effect. The ionization of both bulk and bound
water results in formation of �OH radicals. The time scale for
the sequence of events in the radiolysis of pure water leading
to the generation of the highly reactive but short-lived �OH in
solution has been discussed previously (Gupta et al., 2007; Xu
& Chance, 2007) (Fig. 1b). The �OH undergoes diffusion-
controlled recombination reactions with other �OH in bulk,
and other rapid counterproductive reactions with buffer
constituents that lead to scavenging of the radicals as well as
generation of secondary radical products. Secondary radical
products such as peroxide and superoxide can undergo reac-
tions with proteins by slower kinetic pathways, and are often
quenched by methionine amide within milliseconds (Gupta et
al., 2007; Xu & Chance, 2007) (Fig. 1c). To overcome the loss
of �OH by the recombination and counterproductive reac-
tions, the synchrotron X-ray beam is focused to deliver flux
density of the order of 1016 photon s�1 in a 100 mm spot, such
that a sufficient concentration of radicals is generated on a
microsecond time scale to label side chains while reducing
adverse effects of protein damage by secondary radicals
(Gupta, Celestre et al., 2014). Generation of �OH in situ by
ionizing irradiation is a flux-driven process. It is known that in
an aqueous environment, and in the presence of other reac-
tants or amino acid side chains (which have bimolecular rate
constants for reaction with �OH near diffusion controlled
processes), �OH is very short-lived and reacts within 1 to 5
molecular diameters of the site of formation (Pryor, 1986).
The intrinsic reactivities of free amino acids towards �OH in
aqueous solution vary widely; for example, Cys > Met, Trp >
Tyr > Phe > His > Iie > Leu > Arg (according to their order of
reactivity as measured in aerobic aqueous solution) can react
with �OH extremely rapidly (rate constants 109 to
1010 M�1 s�1) in contrast to Lys ’ Val > Ser ’ Thr ’ Pro >
Gln ’ Glu > Asp ’ ASN > Ala > Gly (according to their
order of reactivity as measured in aerobic aqueous solution),
which react 10- to 1000-fold slower. Thus, the former set of
residues generally shows modification in protein samples. The
mechanism of the side-chain reaction to �OH can be broadly
classified into two major categories: First, hydrogen abstrac-
tion from the carbon in a side chain (for most of the aliphatic
side chains and Pro), and, second, direct nucleophilic attack on
sulfur atoms or conjugated double bonds (Cys, Met, aromatic
side chains and His) (Xu & Chance, 2007). In both cases a
protein radical is formed at the side chain, which then
undergoes hydroperoxyl elimination in the presence of
dissolved molecular oxygen and forms a stable mass adduct
(Fig. 2). Overall, XF-MS can detect modifications in 15 out of
feature articles
J. Synchrotron Rad. (2016). 23, 1056–1069 Sayan Gupta et al. � Synchrotron footprinting to visualize water in proteins 1059
Figure 2Reaction schemes for modification of side chains by �OH. The hydrocarbon side chain (of aliphatic non-polar and polar amino acids) predominantlyundergoes hydrogen abstraction by �OH to give carbon-centered radicals, which then react with molecular O2 under aerobic conditions andsubsequently form stable hydroxylated (+16 Da) or carbonylated (+14 Da) products. Aromatics and sulfur-containing side chains directly undergohydroxylation by �OH followed by reaction with O2 under aerobic conditions to form stable hydroxylated products (+16 Da) and other oxygen adducts.Aromatics and sulfur-containing side chains can be labeled by 18O (red) from radiolysis of H2
18O water.
20 standard amino acids, making it a very useful tool for
analyzing protein structure at the residue level.
In dilute solutions, amino acids or small polypeptides react
with �OH by a homogeneous kinetics process; however, �OH-
induced modification in large protein systems follows a
complex kinetic pathway, and in many instances does not
follow the order of amino acid reactivity listed above. As
previously described, protein molecules create distinct
hydration environments which are different from that of bulk
water. The cavities, grooves and active sites on a protein
surface contain hydrogen-bonding networks and ionic inter-
locks with amino acid side chains that can bind three times as
many water molecules as the solvent exposed surface. Low
linear energy transfer ionizing radiation, such as 5–20 keV
X-ray photon beams, can generate spurs inside such cavities
that result in selective modification of local side chains
(Fig. 1c). To date there is no report of side-chain reactivity
order within a folded protein, and therefore it is possible that
the reactivity order is governed by the proximity of the side
chain to �OH, which originates from the ionization of a water
molecule that might have strong translational and rotational
ordering due to participation in a hydrogen-bonding network.
In contrast, a fully exposed side chain has to compete with
equally or more reactive �OH or other additives (buffer
constituents) in order to yield detectable amounts of modifi-
cation. Hence, in analyzing XF-MS results it is often not
surprising to see limited modification of a fully surface-
exposed residue as compared with considerable modification
of a similar side chain inside a cavity.
XF-MS has already been shown to label amino acid residues
adjacent to bound water in globular proteins (Gupta et al.,
2010). In membrane proteins such as ion channels and
receptors, this method detects modification of specific residues
inside the transmembrane domain where bound waters are
located, in contrast to the nonspecific labeling of the solvent-
exposed amino acid residues that are exposed to bulk water
(Gupta et al., 2010; Angel, Gupta et al., 2009). Thus, in many
cases the �OH reaction with amino acid side chains within
complex proteins might not strictly follow homogeneous
kinetic pathways; instead, the reaction can be strongly affected
by the ionization of the local water in the vicinity of the
reactive amino-acid side chains (Pearson & Williams, 1987).
We will review recent developments of the XF-MS technique
at synchrotron facilities, and experimental results in the
context of detecting bound water and protein conformational
changes in the following sections.
2.2. Synchrotron beamline configuration
XF-MS was originally developed at beamline X9A at the
NSLS (Ralston et al., 2000) and then moved to a similar
bending-magnet beamline, NSLS X28C, where it began
serving the user community (Gupta et al., 2007). Beamline
X28C was equipped with a palladium-coated toroidal focusing
mirror which was used to deliver millisecond X-ray doses to
protein samples (Sullivan et al., 2008). Now the NSLS foot-
printing program is transitioning to the new XFP beamline at
NSLS II. The new XFP beamline will utilize a three-pole
wiggler source capable of delivering tenfold-higher flux
density than X28C. Recently, XF-MS was also developed at
the Advanced Light Source (ALS) using beamlines 5.3.1 and
3.2.1 (Gupta, Celestre et al., 2014; Gupta et al., 2016). Beam-
line 5.3.1 is located on a bending magnet and equipped with a
platinum-coated toroidal focusing mirror suitable for focusing
a white-light X-ray beam. The broadband X-ray beam (1–
13 keV) exits from the beryllium window of the beampipe
under ultrahigh vacuum, with a flux of �1 � 1016 photon s�1.
Focused beam sizes can be set to match 100–535 mm inner-
diameter microcapillary tubes, which are used to deliver
samples using syringe pumps and allow irradiation on the
microsecond timescale. Beamline 3.2.1 is a white-light
bending-magnet beamline with similar characteristics to 5.3.1
but without a focusing mirror. The ALS has recently dedicated
beamline 3.3.1, from the same bending source as 3.2.1, for
development of a dedicated XF-MS facility, which will be the
highest-flux-density XF-MS facility in the USA in the coming
years, second to the NSLS II XFP beamline. Recently, XF-MS
studies were reported using several other low-flux-density
synchrotron beamlines (Bohon et al., 2014). However, the low
flux at these beamlines necessitates long irradiation times,
resulting in secondary damage, which is time-dependent and
results in specific structural perturbations. In contrast, a short
pulse of high-flux-density photons produces adequate �OH
concentration to overcome scavenging reactions while
preserving the structural integrity of complex protein assem-
blies.
2.3. Liquid-chromatography mass-spectrometry-basedquantification, data analysis and recent advancements
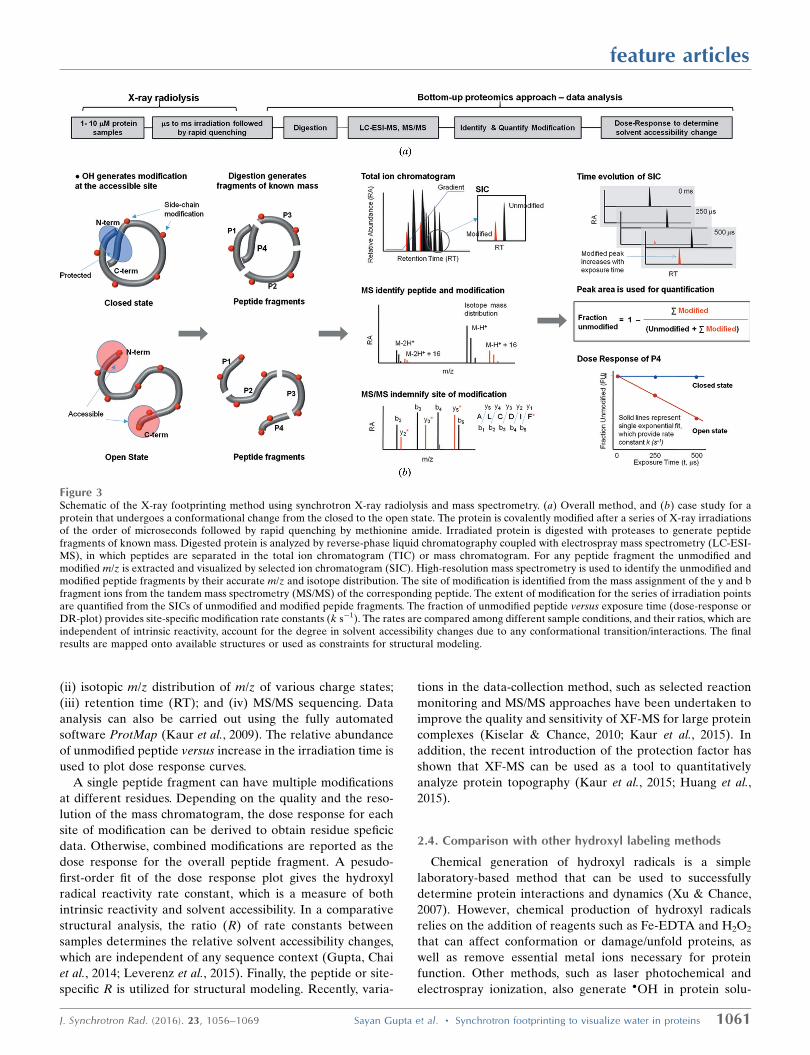
The experimental scheme for a typical XF-MS experiment
is shown in Fig. 3. Dilute buffered protein samples are
subjected to a series of irradiations ranging from microseconds
to milliseconds (Gupta, Celestre et al., 2014). The use of
microcapillary high-flow-rate sample-handling systems has
improved the experiment by allowing short irradiation times,
better temperature control, and fast post-exposure quenching
by methionine amide to stop any secondary radical reactions
(Gupta, Celestre et al., 2014; Xu & Chance, 2007). The irra-
diated samples are subjected to standard mass-spectrometry-
based bottom-up proteomics analysis using various protease
digestion methods to increase overall sequence coverage.
Reverse-phase liquid chromatography coupled to a mass
spectrometer generates a mass chromatogram (TIC, total ion
chromatogram), where unmodified and modified peptides are
separated. We have introduced a new standard-flow liquid-
chromatography method with a high degree of chromato-
graphic reproducibility and increased throughput for sample
analysis (Gonzalez Fernandez-Nino et al., 2015). Peak identi-
fication and peak area analysis is carried out in a semi-auto-
mated fashion using Mascot (Matrix Science Inc), Skyline
(Schilling et al., 2012) and instrument-based software by
considering four basic characteristics of unmodified and
modified products: (i) accurate m/z (mass to charge ratio);
feature articles
1060 Sayan Gupta et al. � Synchrotron footprinting to visualize water in proteins J. Synchrotron Rad. (2016). 23, 1056–1069
(ii) isotopic m/z distribution of m/z of various charge states;
(iii) retention time (RT); and (iv) MS/MS sequencing. Data
analysis can also be carried out using the fully automated
software ProtMap (Kaur et al., 2009). The relative abundance
of unmodified peptide versus increase in the irradiation time is
used to plot dose response curves.
A single peptide fragment can have multiple modifications
at different residues. Depending on the quality and the reso-
lution of the mass chromatogram, the dose response for each
site of modification can be derived to obtain residue speficic
data. Otherwise, combined modifications are reported as the
dose response for the overall peptide fragment. A pesudo-
first-order fit of the dose response plot gives the hydroxyl
radical reactivity rate constant, which is a measure of both
intrinsic reactivity and solvent accessibility. In a comparative
structural analysis, the ratio (R) of rate constants between
samples determines the relative solvent accessibility changes,
which are independent of any sequence context (Gupta, Chai
et al., 2014; Leverenz et al., 2015). Finally, the peptide or site-
specific R is utilized for structural modeling. Recently, varia-
tions in the data-collection method, such as selected reaction
monitoring and MS/MS approaches have been undertaken to
improve the quality and sensitivity of XF-MS for large protein
complexes (Kiselar & Chance, 2010; Kaur et al., 2015). In
addition, the recent introduction of the protection factor has
shown that XF-MS can be used as a tool to quantitatively
analyze protein topography (Kaur et al., 2015; Huang et al.,
2015).
2.4. Comparison with other hydroxyl labeling methods
Chemical generation of hydroxyl radicals is a simple
laboratory-based method that can be used to successfully
determine protein interactions and dynamics (Xu & Chance,
2007). However, chemical production of hydroxyl radicals
relies on the addition of reagents such as Fe-EDTA and H2O2
that can affect conformation or damage/unfold proteins, as
well as remove essential metal ions necessary for protein
function. Other methods, such as laser photochemical and
electrospray ionization, also generate �OH in protein solu-
feature articles
J. Synchrotron Rad. (2016). 23, 1056–1069 Sayan Gupta et al. � Synchrotron footprinting to visualize water in proteins 1061
Figure 3Schematic of the X-ray footprinting method using synchrotron X-ray radiolysis and mass spectrometry. (a) Overall method, and (b) case study for aprotein that undergoes a conformational change from the closed to the open state. The protein is covalently modified after a series of X-ray irradiationsof the order of microseconds followed by rapid quenching by methionine amide. Irradiated protein is digested with proteases to generate peptidefragments of known mass. Digested protein is analyzed by reverse-phase liquid chromatography coupled with electrospray mass spectrometry (LC-ESI-MS), in which peptides are separated in the total ion chromatogram (TIC) or mass chromatogram. For any peptide fragment the unmodified andmodified m/z is extracted and visualized by selected ion chromatogram (SIC). High-resolution mass spectrometry is used to identify the unmodified andmodified peptide fragments by their accurate m/z and isotope distribution. The site of modification is identified from the mass assignment of the y and bfragment ions from the tandem mass spectrometry (MS/MS) of the corresponding peptide. The extent of modification for the series of irradiation pointsare quantified from the SICs of unmodified and modified pepide fragments. The fraction of unmodified peptide versus exposure time (dose-response orDR-plot) provides site-specific modification rate constants (k s�1). The rates are compared among different sample conditions, and their ratios, which areindependent of intrinsic reactivity, account for the degree in solvent accessibility changes due to any conformational transition/interactions. The finalresults are mapped onto available structures or used as constraints for structural modeling.
tions (Aye et al., 2005; Hambly & Gross, 2005; Downard et al.,
2012; Konermann et al., 2013; Maleknia & Downard, 2012;
Wong et al., 2005). In the laser photochemical method, a
sufficient amount of �OH is produced on the microsecond
timescale to conduct footprinting analysis; however, one
drawback of this method is that it requires a millimolar
concentration of H2O2, which can unfold proteins and/or
perturb complex protein assemblies with metal-active centers
(Ling et al., 2012; Shacter, 2000; Watson et al., 2009). The
electrospray ionization-based hydroxyl radical footprinting
method uses a very high electrospray voltage in the presence
of O2 to produce �OH radicals in solutions with a high
concentration of volatile buffer components. The radiolytic
generation of hydroxyl radicals is a straightforward technique
but it is important to control the dose received by samples
since both modifications of proteins and secondary radical
reactions can lead to unfolding or conformational changes. An
alternate approach to X-ray radiolysis is electron beam radi-
olysis using a van de Graaff generator (Watson et al., 2009).
Data on cyt c and rhodopsin using this approach (Gupta,
unpublished data) indicated that the electron pulse delivers
high enough flux to probe radiolytic modifications on the sub-
microsecond to microsecond time scale. This time scale is fast
enough that modifications occur before protein unfolding can
take place in simple globular proteins. However, the energy
deposition by 2 MeV electrons can be
�200-fold more than that of a
synchrotron X-ray beamline. In this
process, direct energized electron-
induced protein damage can be a
major problem.
All the radical-generating techni-
ques have unique advantages and
disadvantages, and therefore should
be applied variously depending on
the system under study. The unique
advantages of synchrotron-based XF-
MS include the following. First, the
technique provides a straightforward
way to vary the �OH dose from 5- to
20-fold by varying the flow rate of the
sample across the fixed size and flux
density of a continuous X-ray beam.
This simple approach is highly advan-
tageous in terms of generating multiple
dose-dependent data to detemine
precise hydroxyl radical reactivity
rates followed by error analysis
for accurate comparisons between
multiple states of complex biological
samples. Second, in situ �OH genera-
tion has the advantage of allowing
nearly any type of sample condition
without deleterious effects from
external reagents. Third, XF-MS can
be used to detect bound water, as
described below.
3. XF distinguishes internal versus bulk waterinteractions in proteins and probes water dynamics
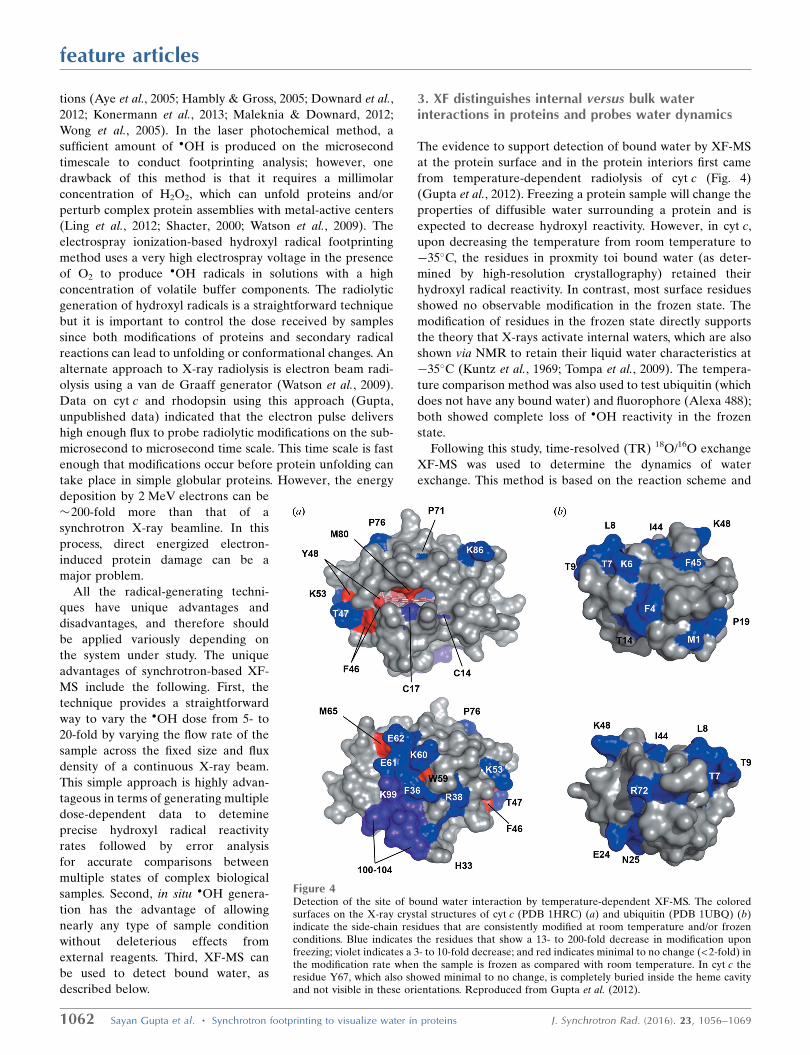
The evidence to support detection of bound water by XF-MS
at the protein surface and in the protein interiors first came
from temperature-dependent radiolysis of cyt c (Fig. 4)
(Gupta et al., 2012). Freezing a protein sample will change the
properties of diffusible water surrounding a protein and is
expected to decrease hydroxyl reactivity. However, in cyt c,
upon decreasing the temperature from room temperature to
�35�C, the residues in proxmity toi bound water (as deter-
mined by high-resolution crystallography) retained their
hydroxyl radical reactivity. In contrast, most surface residues
showed no observable modification in the frozen state. The
modification of residues in the frozen state directly supports
the theory that X-rays activate internal waters, which are also
shown via NMR to retain their liquid water characteristics at
�35�C (Kuntz et al., 1969; Tompa et al., 2009). The tempera-
ture comparison method was also used to test ubiquitin (which
does not have any bound water) and fluorophore (Alexa 488);
both showed complete loss of �OH reactivity in the frozen
state.
Following this study, time-resolved (TR) 18O/16O exchange
XF-MS was used to determine the dynamics of water
exchange. This method is based on the reaction scheme and
feature articles
1062 Sayan Gupta et al. � Synchrotron footprinting to visualize water in proteins J. Synchrotron Rad. (2016). 23, 1056–1069
Figure 4Detection of the site of bound water interaction by temperature-dependent XF-MS. The coloredsurfaces on the X-ray crystal structures of cyt c (PDB 1HRC) (a) and ubiquitin (PDB 1UBQ) (b)indicate the side-chain residues that are consistently modified at room temperature and/or frozenconditions. Blue indicates the residues that show a 13- to 200-fold decrease in modification uponfreezing; violet indicates a 3- to 10-fold decrease; and red indicates minimal to no change (< 2-fold) inthe modification rate when the sample is frozen as compared with room temperature. In cyt c theresidue Y67, which also showed minimal to no change, is completely buried inside the heme cavityand not visible in these orientations. Reproduced from Gupta et al. (2012).

time-resolved experimental scheme shown in Figs. 2 and 5(a),
respectively. Only Phe, Tyr, Trp, Met and Cys can be directly
labeled by �18OH following irradiation of a protein solution
containing H218O. The extent of 18O labeling is calculated from
the relative isotopic m/z distribution from zoomed scan
analysis (Fig. 5b). In a typical water-exchange experiment, 1:1
mixing was carried out between proteins (cyt c and ubiquitin)
in H218O buffer and regular H2
16O buffer. The temperature of
the mixing and irradiation setup was maintained at 4�C to slow
the water-exchange process in the proteins. After millisecond
delays, the sample was irradiated and immediately quenched.
Protease digestion was carried out after completely drying out
the sample to eliminate any 18O incorporation from residual
H218O during the digestion reactions. The extent of water
exchange at a particular side-chain residue (the ratio of18O/16O) versus mixing delays generated site-specific progress
curves and determined the residence time of proximal bound
water. The temperature-dependent and time-resolved XF-MS
methods were able to explicitly probe bound water interac-
tions inside the heme binding pocket of cyt c (Fig. 5d). These
results are further supported by the high-resolution crystal
structure (Bushnell et al., 1990), while the millisecond
exchange rates are consistent with NMR studies (Bertini et al.,
2001). These two techniques provide a direct and powerful
method to follow the structural changes of bound water in
enzyme active sites, channels, ion pumps and membrane
feature articles
J. Synchrotron Rad. (2016). 23, 1056–1069 Sayan Gupta et al. � Synchrotron footprinting to visualize water in proteins 1063
Figure 5Determination of residence time of tightly bound water by XF-MS. (a) Rapid mixing combined with 18O-mediated hydroxyl radical labeling to monitorthe time-course of exchange of water in cyt c. LC-ESI-MS is used to identify and isolate the modified peptides, targeted MS/MS is used to identify thesites of 18O labeling, and zoom scans are used to quantify the ratio of 18O- versus 16O-labeling at various mixing delays. (b) Zoom scans for singlyprotonated peptide 61–72 showing the decrease in the abundance of the 2m/z shifted 18O monoisotopic mass (arrow) that corresponds to the waterexchange at M65 and Y67 with increase in the mixing delays. (c) Progress curves (circles and error bars) of water exchange for the 18O labeled side-chainresidues. The solid line represents the fit to a single exponential function. Residues W59 and F36 have exchange that is complete at the firstmeasurement, while the rates of exchange of C14, C17, F46, Y48, M65, Y67 and M80 are discretely measured. (d) Sites of 18O-modifications arevisualized from the crystal structure 1HRC using PyMOL (DeLano Scientific). The 18O-labeled residues (light blue) in and around the heme (light pink)crevices, and the position of residue T78 (gray) and conserved waters (cyan spheres) HOH112, HOH139 are shown in two orientations of the cyt cmolecule. Reproduced from Gupta et al. (2012).

protein pores. Ultra-fast continuous-flow mixing devices are
being developed, and, in combination with the short pulse of
intense X-rays available from the focused bending-magnet
sources at the ALS or NSLS II, will allow monitoring of even
faster time course structural dynamics, which will contribute
significantly to our understanding of water-mediated bio-
molecular processes.
The X-ray crystal structures of rhodopsin and of its photo-
intermediates have dramatically increased our understanding
of structural rearrangements upon the activation of G-protein-
coupled receptors (GPCRs) (Orban et al., 2012). But it is also
increasingly clear that static structures alone are not sufficient
to provide a complete understanding of GPCR function,
especially given the prominent role that is played by structural
waters, which are only visible in high-resolution crystal
structures. XF-MS has emerged as a novel approach to study
GPCRs by in situ labeling of transmembrane (TM) residues,
which are located in proximity to bound water (Angel, Chance
et al., 2009). The first molecular details of the photoactivation
process in the solution state came from XF-MS studies of
dark, activated (meta II) and opsin states of detergent-solu-
bilized samples (Angel, Gupta et al., 2009). Results indicated
that local conformational changes arising from the isomer-
ization of the covalently bound retinal appeared to be
propagated to the cytoplasmic surface by means of water
reorganization, and rearrangement of the hydrogen-bonding
network between bound water and amino-acid side chains in
the TM domain (Fig. 6). This study allowed XF-MS to be used
to structurally validate a homology model for the 5-HT4R
receptor, and predict sites for internal water–side-chain
interactions necessary for its activation process (Padayatti et
al., 2013).
XF-MS combined with hydrogen deuterium exchange mass
spectrometry (HDX-MS) studies on rhodopsin, activated
rhodopsin and rhodopsin-G-protein complex have elucidated
the finer details of the dynamics of the internal water re-
arrangements that accompany G-protein binding, as well as
revealing the location of the protein–protein interactions in
both rhodopsin and G-protein (Orban et al., 2012).
4. Studying gating in a K+ channel by XF-MS
Ion channels are excellent targets for XF-MS-based solution
structural studies since activation of these channels is in
general associated with ‘gating’ events, which usually result
in dramatic changes in water accessibility of the conserved
transmembrane pore regions (Aryal et al., 2015). These
proteins also respond to a variety of regulatory stimuli by
allosteric conformational regulation in distal domains (Swartz,
2004). Crystallography has proved to be challenging as the
closed or inactive form of ion channels appears to be ener-
getically favorable, resulting in channels preferentially crys-
tallizing in the closed state (Tao et al.,
2009; Uysal et al., 2009), while their
size and complexity precludes NMR
analysis, which has left the question
of structural transitions during gating
unanswered for a number of years.
The first XF-MS studies on ion
channels were carried out on a deter-
gent reconstituted full length bacterial
inwardly rectifying ion channel,
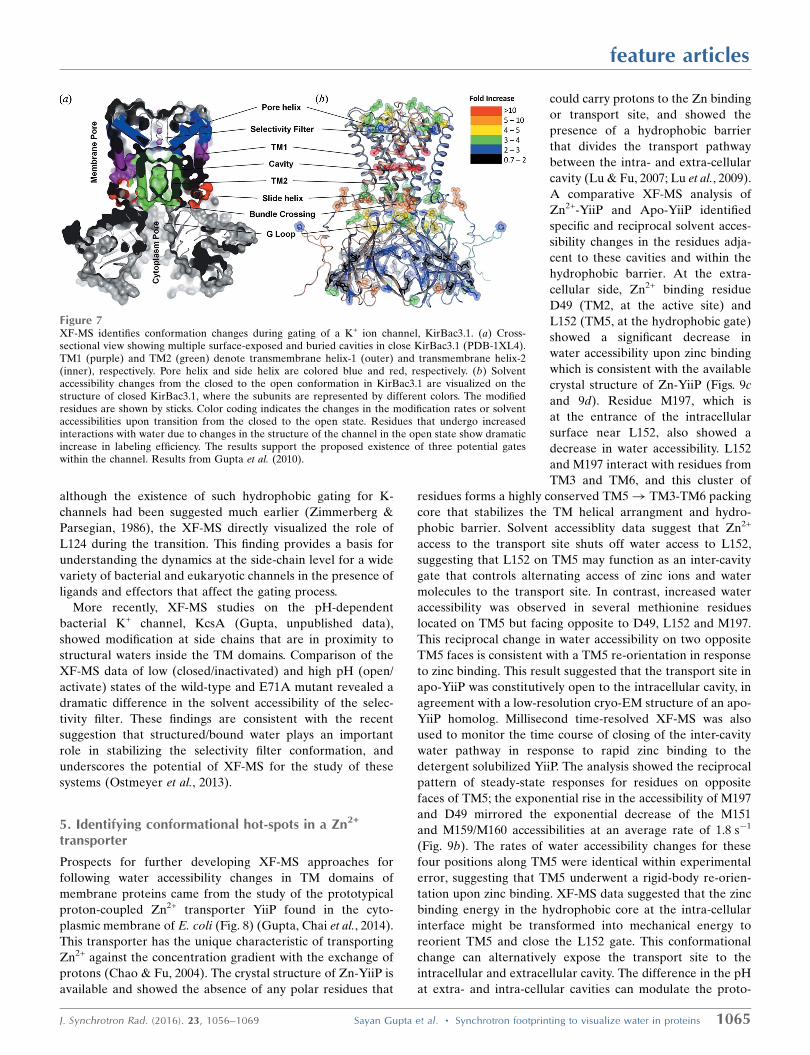
KirBac3.1 (Gupta et al., 2010).
Comparative XF-MS labeling between
open and closed states revealed that,
upon opening of the KirBac3.1 channel,
there was a significant increase in the
solvent accessibility near the selectivity
filter, along the central cavity, and at
the interface between the TM and the
cytoplasmic regulatory domain of the
channel (Fig. 7). This study not only
supports the existence of a potential
gate inside the channel but also identi-
fies functionally important amino acid
residues. In particular, the highest
accessibility changes (<30-fold) were
observed at the hydrophobic residue
L124, which is located inside the central
cavity. A few years later, these obser-
vations were confirmed in full by the
crystal structure of the open state of the
channel (Bavro et al., 2012). Notably,
feature articles
1064 Sayan Gupta et al. � Synchrotron footprinting to visualize water in proteins J. Synchrotron Rad. (2016). 23, 1056–1069
Figure 6XF-MS probes bound water mediated signal transfer pathway in bovine rhodopsin. (a) DR-plots ofdark (black) versus meta II (red) for the peptide p333–348 (at the solvent exposed cytoplasmic side)and p160–164 (at the TM region) for modified residues as indicated. (b) Pictorial summary ofrelative solvent accessibility changes for the photoactivation of dark to meta II state. Residues withrate constants > 0.1 s�1 are shown as sticks. The color coding represents the ratio of rate constantsbetween meta II and rhodopsin. Conserved transmembrane waters are shown as cyan spheres. Thechanges in rates of modification reflect local structural changes inside the TM domain uponformation of meta II. The results demonstrate disruption and reorganization of multiple close-packing interactions, mediated by both side chains and bound waters. The information istransmitted from the chromophore (ligand-binding site) to the cytoplasmic surface for G-proteinactivation. Results from Angel, Gupta et al. (2009).
although the existence of such hydrophobic gating for K-
channels had been suggested much earlier (Zimmerberg &
Parsegian, 1986), the XF-MS directly visualized the role of
L124 during the transition. This finding provides a basis for
understanding the dynamics at the side-chain level for a wide
variety of bacterial and eukaryotic channels in the presence of
ligands and effectors that affect the gating process.
More recently, XF-MS studies on the pH-dependent
bacterial K+ channel, KcsA (Gupta, unpublished data),
showed modification at side chains that are in proximity to
structural waters inside the TM domains. Comparison of the
XF-MS data of low (closed/inactivated) and high pH (open/
activate) states of the wild-type and E71A mutant revealed a
dramatic difference in the solvent accessibility of the selec-
tivity filter. These findings are consistent with the recent
suggestion that structured/bound water plays an important
role in stabilizing the selectivity filter conformation, and
underscores the potential of XF-MS for the study of these
systems (Ostmeyer et al., 2013).
5. Identifying conformational hot-spots in a Zn2+
transporter
Prospects for further developing XF-MS approaches for
following water accessibility changes in TM domains of
membrane proteins came from the study of the prototypical
proton-coupled Zn2+ transporter YiiP found in the cyto-
plasmic membrane of E. coli (Fig. 8) (Gupta, Chai et al., 2014).
This transporter has the unique characteristic of transporting
Zn2+ against the concentration gradient with the exchange of
protons (Chao & Fu, 2004). The crystal structure of Zn-YiiP is
available and showed the absence of any polar residues that
could carry protons to the Zn binding
or transport site, and showed the
presence of a hydrophobic barrier
that divides the transport pathway
between the intra- and extra-cellular
cavity (Lu & Fu, 2007; Lu et al., 2009).
A comparative XF-MS analysis of
Zn2+-YiiP and Apo-YiiP identified
specific and reciprocal solvent acces-
sibility changes in the residues adja-
cent to these cavities and within the
hydrophobic barrier. At the extra-
cellular side, Zn2+ binding residue
D49 (TM2, at the active site) and
L152 (TM5, at the hydrophobic gate)
showed a significant decrease in
water accessibility upon zinc binding
which is consistent with the available
crystal structure of Zn-YiiP (Figs. 9c
and 9d). Residue M197, which is
at the entrance of the intracellular
surface near L152, also showed a
decrease in water accessibility. L152
and M197 interact with residues from
TM3 and TM6, and this cluster of
residues forms a highly conserved TM5! TM3-TM6 packing
core that stabilizes the TM helical arrangment and hydro-
phobic barrier. Solvent accessiblity data suggest that Zn2+
access to the transport site shuts off water access to L152,
suggesting that L152 on TM5 may function as an inter-cavity
gate that controls alternating access of zinc ions and water
molecules to the transport site. In contrast, increased water
accessibility was observed in several methionine residues
located on TM5 but facing opposite to D49, L152 and M197.
This reciprocal change in water accessibility on two opposite
TM5 faces is consistent with a TM5 re-orientation in response
to zinc binding. This result suggested that the transport site in
apo-YiiP was constitutively open to the intracellular cavity, in
agreement with a low-resolution cryo-EM structure of an apo-
YiiP homolog. Millisecond time-resolved XF-MS was also
used to monitor the time course of closing of the inter-cavity
water pathway in response to rapid zinc binding to the
detergent solubilized YiiP. The analysis showed the reciprocal
pattern of steady-state responses for residues on opposite
faces of TM5; the exponential rise in the accessibility of M197
and D49 mirrored the exponential decrease of the M151
and M159/M160 accessibilities at an average rate of 1.8 s�1
(Fig. 9b). The rates of water accessibility changes for these
four positions along TM5 were identical within experimental
error, suggesting that TM5 underwent a rigid-body re-orien-
tation upon zinc binding. XF-MS data suggested that the zinc
binding energy in the hydrophobic core at the intra-cellular
interface might be transformed into mechanical energy to
reorient TM5 and close the L152 gate. This conformational
change can alternatively expose the transport site to the
intracellular and extracellular cavity. The difference in the pH
at extra- and intra-cellular cavities can modulate the proto-
feature articles
J. Synchrotron Rad. (2016). 23, 1056–1069 Sayan Gupta et al. � Synchrotron footprinting to visualize water in proteins 1065
Figure 7XF-MS identifies conformation changes during gating of a K+ ion channel, KirBac3.1. (a) Cross-sectional view showing multiple surface-exposed and buried cavities in close KirBac3.1 (PDB-1XL4).TM1 (purple) and TM2 (green) denote transmembrane helix-1 (outer) and transmembrane helix-2(inner), respectively. Pore helix and side helix are colored blue and red, respectively. (b) Solventaccessibility changes from the closed to the open conformation in KirBac3.1 are visualized on thestructure of closed KirBac3.1, where the subunits are represented by different colors. The modifiedresidues are shown by sticks. Color coding indicates the changes in the modification rates or solventaccessibilities upon transition from the closed to the open state. Residues that undergo increasedinteractions with water due to changes in the structure of the channel in the open state show dramaticincrease in labeling efficiency. The results support the proposed existence of three potential gateswithin the channel. Results from Gupta et al. (2010).

nation state of His153, a critical residue for Zn2+ binding in the
transport site, which in turn can regulate Zn2+ binding.
6. Structural mechanism of the photoactivation oforange carotenoid protein
Photoprotective mechanisms are of fundamental importance
for the survival of photosynthetic organisms. In cyanobacteria,
the orange carotenoid protein (OCP), when activated by
intense blue light, forms OCPR, which binds to the light
harvesting antenna and triggers the dissipation of excess
captured light energy. X-ray crystal structures of inactive OCP
(OCPO) and the N-terminal part of OCPR (RCP) are avail-
able. A comparison of these two structures shows that
photoactivation results in a 12 A movement of the carotenoid
inside the N-terminal half of OCP. Comparative XF-MS
studies on OCPO and RCP showed that, in RCP, specific
residues adjacent to the carotenoid binding region in the N-
terminal domain (NTD) are protected. This result directly
supported carotenoid translocation in solution similar to that
in the crystal structure (Leverenz et
al., 2015). However, RCP is only a
substructure of the full-length OCPR. A
hybrid approach comprising XF-MS,
small-angle X-ray scattering (SAXS)
and HDX-MS dispelled the uncertainty
about the structural changes in the wild-
type OCP and provided mechanistic
details of the conformation changes for
the photoactivation of full-length OCPO
to OCPR (Gupta et al., 2015). While XF-
MS revealed detailed residue-specific
solvent accessibility changes that
supported both domain dissociation and
carotenoid translocation in the full-
length protein, synergistic application of
SAXS and HDX-MS methods comple-
mented the XF-MS results by showing
that photoactivation underwent a
dissociation of the NTD and C-terminal
domain (CTD) without substantially
altering the secondary structure. XF-MS
identified several functionally important
residues involved in a hydrogen-
bonding network with bound as well as
conserved water molecules at the major
and minor interfaces of the NTD and
CTD (Fig. 9). The study provided a
model for the photoactivation process
in which the carotenoid translocation
induces changes in the water–protein
network connecting the carotenoid site
with the protein surface. The hybrid
approach was necessary to delineate the
detailed molecular mechanism under-
lying photoprotection initiation in
cyanobacteria. Further studies on OCP-
phycobilisome and OCP-FRP interactions are in progress,
which will contribute to a detailed understanding of the
photoprotection cycle in photosynthetic systems.
7. Future directions
For the past decade, XF-MS has been integrated effectively
with many other structural and biochemical techniques
to provide a comprehensive picture of macromolecular
complexes and their functional states. Examples highlighted in
this review included hybrid methods combining information
on local changes in solvent accessibility deduced from the
profiles of hydroxyl radical reactivity with static atomic
structures obtained from X-ray crystallography, global struc-
tures obtained from SAXS and cryo-EM, and backbone
accessibility measurements obtained from HDX-MS. Crystal-
lographic structure information, in particular, is often used as
a reference point to enrich footprinting interpretations by
providing details at atomic resolution for individual compo-
nents or complexes in native or non-functional states (Kamal
feature articles
1066 Sayan Gupta et al. � Synchrotron footprinting to visualize water in proteins J. Synchrotron Rad. (2016). 23, 1056–1069
Figure 8XF-MS probes proton-coupled Zn2+ transfer mechanism in Zn transporter YiiP. (a) Bar plotshowing radiometric water accessibility changes in response to Zn2+ binding measured by ratio (R)of �OH labeling rates for residues with increase (blue), decrease (red) and no change (grey) inaccessibility after rapid Zn2+ exposure. (b) Time courses of water accessibility changes for theindicated residues. Solid lines represent single exponential fits, which provide rate constants ofconformational changes associated with Zn2+ binding and translocation. (c) X-ray footprintingreveals a hydrophobic gate at residue L152, which controls the opening of the inner cavity waterpathway for zinc-proton exchange in the YiiP transporter. The cross-sectional view shows theposition of TM helices, which separate two cavities at the intra-cellular (IC) and extra-cellular (EC)sides. Residues are color coded as in (a). XF-MS results suggest the protein conformational changealternates the membrane-facing on–off mode of zinc coordination (in D49) and protonation–deprotonation (H153) of the transport site in a coordinated fashion. (d) The red arrow indicates theproposed water pathway, which connects EC with IC after excluding the residue L152 from thesurface drawing of the TM helices. Results from Gupta et al. (2014).

et al., 2007; Takamoto et al., 2007; Gupta et al., 2004). In this
case, XF-MS analysis is used to interpret protein conforma-
tional changes associated with the dynamics of proximally
bound water, which are determined from the available crystal
structures of the native state. XF-MS is now established as a
direct method for pinpointing both positional and dynamical
aspects of water–protein interactions. However, there are only
a limited number of studies which correlate the location of
water molecules in protein crystal structures with their role in
the protein function. In one such study, crystal structures and
database analysis were used to identify protein functional
surfaces and cavities and assess conformational changes for
bound and unbound states (Tseng et al., 2010). Another study
investigated the existence of conserved cavities and the
intriguing role of bound water in these cavities in gating of ion
channels (Ostmeyer et al., 2013). These studies strongly put
forward the critical question of how the functional coopera-
tivity between bound water in conserved cavities and ligand
binding in distal domains can control the overall function
of large protein complexes. We anticipate that theoretical
predictions of conserved cavities by bioinformatics can be
combined with the experimentally determined functional sites
obtained by XF-MS (which includes information about the
sites of bound water and proximal cavities). This approach
could provide a strategy to classify and model proteins
according to their conserved surface or cavity topography and
correlate the results with their functional divergence. In
addition, more recent studies have shown the importance of
bound water networks in ligand binding and the complicated
role of water in the overall thermodynamics of binding
(Breiten et al., 2013; Beuming et al., 2012). The XF-MS method
offers a new tool for optimizing ligand design by mapping the
locations and thermodynamic properties of water molecules at
protein binding sites and, at the same time, XF-MS data can
be used to develop, validate and refine molecular dynamics
approaches that determine water–protein side-chain inter-
actions.
Another exciting future application is the use of X-ray
footprinting for protein crystallography, which could yield
valuable information in several important areas. First, foot-
printing data on proteins in crystal form could be used to
delineate protein–protein contacts in very small and weakly
diffracting crystals. By comparing solvent accessibility of
proteins in crystals to solvent accessibility in solution,
feature articles
J. Synchrotron Rad. (2016). 23, 1056–1069 Sayan Gupta et al. � Synchrotron footprinting to visualize water in proteins 1067
Figure 9XF-MS probes bound water mediated signal transfer pathway in OCP. (a) Solvent accessibility changes from dark adapted-OCPO to illuminated-OCPR
are visualized on the structure of OCPO (3MG1). The modified residues are represented by sticks and the carotenoid is shown in pink. The color codingrepresents the ratio of rate constants between these two states. (c) The proposed signal propagation pathway from the carotenoid through the water side-chain hydrogen-bonding network to the protein surface that facilitates carotenoid shift, dissociation of NTD-CTD and detachment of the N-terminalhelix from CTD. Conserved waters are shown in spheres and color codes indicate their depth from the surface of OCP. The modified residues are shownby green sticks. The results demonstrate disruption and reorganization of multiple close-packing interactions, mediated by both side chains and boundwaters. (d) Ab initio bead reconstructions (gray volume) based on the SAXS results are shown for OCPO and OCPR. The subunit of OCPO from thecrystal structure is docked into the volume envelope with the far N-terminal helix (red), NTD (purple) and CTD (green). The SAXS results showdissociation of NTD and CTD. (d) Schematic of the photoactivation of OCPO showing regions with the largest conformational rearrangement associatedwith changes in the hydrogen-bonding network and water rearrangements. Reproduced from Gupta et al. (2016).

protections due to crystal contacts could be identified and
used to engineer more ordered, and therefore better
diffracting, crystals. Second, XF-MS applied to proteins in
solution as a function of denaturant concentration would yield
information on regions of disorder by allowing calculation of
free energies of unfolding on a residue-by-residue basis, which
could be used to engineer optimized protein crystals. Third,
XF-MS could be used to investigate radiation damage in
protein crystals, yielding information on the different struc-
tural changes at various residues as a result of radiation
exposure. XF-MS is ideally suited to this endeavor; XF-MS is
able to detect both oxidation addition reactions (i.e. addition
of O atoms and/or OH groups) and subtraction reactions, such
as decarboxylation of aspartate and glutamate. Indeed, the
response of each amino acid to hydroxyl radicals is unique, can
be detected post-irradiation with LC-MS/MS, and can be
investigated as a function of dose. For example, in a series of
preliminary experiments, crystals were irradiated at the ALS
footprinting beamline 3.2.1. The crystals were then divided
into two batches: one batch was digested and analyzed for
residue specific changes as in a standard XF-MS experiment,
and the other batch was run on ALS macromolecular crys-
tallography beamline 5.0.1. These experiments were repeated
with different exposure times, correlating the global damage
as measured by loss of diffraction, with specific damage as
measured by changes to residues in the crystals (Ralston,
unpublished data).
Currently, dedicated XF-MS beamlines are under devel-
opment at both the ALS and NSLS II. These beamlines are
designed for fully automated sample handling, microsecond
irradiation timescales and time-resolved experiments, and will
open the door to even further advances in the technique of
XF-MS.
Acknowledgements
We thank Rich Celestre for help with the studies performed at
the Advanced Light Source. The Advanced Light Source is
supported by the Director, Office of Science, Office of Basic
Energy Sciences, of the US Department of Energy under
Contract No. DE-AC02-05CH11231. The National Synchro-
tron Light Source, Brookhaven National Laboratory, was
supported by the US Department of Energy, Office of Science,
Office of Basic Energy Sciences, under Contract No. DE-
AC02-98CH10886. The Center for Synchrotron Biosciences at
the National Synchrotron Light Sources is supported by
NIBIB under P30-EB0966. Studies on potassium channel
work are supported by the Welcome Trust. Studies on YiiP are
supported by NIH and DOE. Study on OCP is supported by
NIH and DOE. This research used resources of the Joint
BioEnergy Institute supported by the Office of Science, Office
of Biological and Environmental Research, US DOE under
contract DE-AC02-05CH11231.
References
Angel, T. E., Chance, M. R. & Palczewski, K. (2009). Proc. Natl Acad.Sci. USA, 106, 8555–8560.
Angel, T. E., Gupta, S., Jastrzebska, B., Palczewski, K. & Chance,M. R. (2009). Proc. Natl Acad. Sci. USA, 106, 14367–14372.
Aryal, P., Sansom, M. S. & Tucker, S. J. (2015). J. Mol. Biol. 427, 121–130.
Aye, T. T., Low, T. Y. & Sze, S. K. (2005). Anal. Chem. 77, 5814–5822.Ball, P. (2008). Chem. Rev. 108, 74–108.Bavro, V. N., De Zorzi, R., Schmidt, M. R., Muniz, J. R., Zubcevic, L.,
Sansom, M. S., Venien-Bryan, C. & Tucker, S. J. (2012). Nat. Struct.Mol. Biol. 19, 158–163.
Bertini, I., Hajieva, P., Luchinat, C. & Nerinovski, K. (2001). J. Am.Chem. Soc. 123, 12925–12926.
Bertini, I., Huber, J. G., Luchinat, C. & Piccioli, M. (2000). J. Magn.Reson. 147, 1–8.
Beuming, T., Che, Y., Abel, R., Kim, B., Shanmugasundaram, V. &Sherman, W. (2012). Proteins, 80, 871–883.
Bhat, T. N., Bentley, G. A., Boulot, G., Greene, M. I., Tello, D.,Dall’Acqua, W., Souchon, H., Schwarz, F. P., Mariuzza, R. A. &Poljak, R. J. (1994). Proc. Natl Acad. Sci. USA, 91, 1089–1093.
Bohon, J., D’Mello, R., Ralston, C., Gupta, S. & Chance, M. R. (2014).J. Synchrotron Rad. 21, 24–31.
Bohon, J., Jennings, L. D., Phillips, C. M., Licht, S. & Chance, M. R.(2008). Structure, 16, 1157–1165.
Braden, B. C., Fields, B. A. & Poljak, R. J. (1995). J. Mol. Recognit. 8,317–325.
Breiten, B., Lockett, M. R., Sherman, W., Fujita, S., Al-Sayah, M.,Lange, H., Bowers, C. M., Heroux, A., Krilov, G. & Whitesides,G. M. (2013). J. Am. Chem. Soc. 135, 15579–15584.
Brunne, R. M., Liepinsh, E., Otting, G., Wuthrich, K. & vanGunsteren, W. F. (1993). J. Mol. Biol. 231, 1040–1048.
Bushnell, G. W., Louie, G. V. & Brayer, G. D. (1990). J. Mol. Biol. 214,585–595.
Carugo, O. & Bordo, D. (1999). Acta Cryst. D55, 479–483.Chao, Y. & Fu, D. (2004). J. Biol. Chem. 279, 12043–12050.Chaplin, M. (2006). Nat. Rev. 7, 861–866.Chaudhuri, B. N., Gupta, S., Urban, V. S., Chance, M. R., D’Mello, R.,
Smith, L., Lyons, K. & Gee, J. (2011). Biochemistry, 50, 1799–1807.
Conti Nibali, V. & Havenith, M. (2014). J. Am. Chem. Soc. 136,12800–12807.
Cui, P. X., Wang, Y., Chu, W. S., Guo, X. Y., Yang, F. F., Yu, M. J.,Zhao, H. F., Dong, Y. H., Xie, Y. N., Gong, W. M. & Wu, Z. Y.(2014). Sci. Rep. 4, 7453.
Denisov, V. P. & Halle, B. (1996). Faraday Discuss. 103, 227–244.Denisov, V. P., Peters, J., Horlein, H. D. & Halle, B. (1996). Nat. Struct.
Biol. 3, 505–509.Downard, K. M., Maleknia, S. D. & Akashi, S. (2012). Rapid
Commun. Mass Spectrom. 26, 226–230.Frankel, L. K., Sallans, L., Bellamy, H., Goettert, J. S., Limbach, P. A.
& Bricker, T. M. (2013). J. Biol. Chem. 288, 23565–23572.Frolich, A., Gabel, F., Jasnin, M., Lehnert, U., Oesterhelt, D., Stadler,
A. M., Tehei, M., Weik, M., Wood, K. & Zaccai, G. (2009). FaradayDiscuss. 141, 117–130.
Furutani, Y., Shichida, Y. & Kandori, H. (2003). Biochemistry, 42,9619–9625.
Garczarek, F. & Gerwert, K. (2006). Nature (London), 439, 109–112.Gonzalez Fernandez-Nino, S. M., Smith-Moritz, A. M., Chan, L. J.,
Adams, P. D., Heazlewood, J. L. & Petzold, C. J. (2015). Front.Bioeng. Biotechnol. 3, 44.
Gowen, A. A., Amigo, J. M. & Tsenkova, R. (2013). Anal. Chim. Acta,759, 8–20.
Gupta, S., Bavro, V. N., D’Mello, R., Tucker, S. J., Venien-Bryan, C. &Chance, M. R. (2010). Structure, 18, 839–846.
Gupta, S., Celestre, R., Feng, J. & Ralston, C. (2016). SynchrotronRadiat. News, 29, 39–44.
Gupta, S., Celestre, R., Petzold, C. J., Chance, M. R. & Ralston, C.(2014). J. Synchrotron Rad. 21, 690–699.
Gupta, S., Chai, J., Cheng, J., D’Mello, R., Chance, M. R. & Fu, D.(2014). Nature (London), 512, 101–104.
feature articles
1068 Sayan Gupta et al. � Synchrotron footprinting to visualize water in proteins J. Synchrotron Rad. (2016). 23, 1056–1069

Gupta, S., D’Mello, R. & Chance, M. R. (2012). Proc. Natl Acad. Sci.USA, 109, 14882–14887.
Gupta, S., Guttman, M., Leverenz, R. L., Zhumadilova, K.,Pawlowski, E. G., Petzold, C. J., Lee, K. K., Ralston, C. Y. &Kerfeld, C. A. (2015). Proc. Natl Acad. Sci. USA, 112, E5567–E5574.
Gupta, S., Mangel, W. F., McGrath, W. J., Perek, J. L., Lee, D. W.,Takamoto, K. & Chance, M. R. (2004). Mol. Cell. Proteom. 3, 950–959.
Gupta, S., Sullivan, M., Toomey, J., Kiselar, J. & Chance, M. R. (2007).J. Synchrotron Rad. 14, 233–243.
Halle, B. (2004). Philos. Trans. R. Soc. B, 359, 1207–1223.Hambly, D. M. & Gross, M. L. (2005). J. Am. Soc. Mass Spectrom. 16,
2057–2063.Hare, S., Vos, A. M., Clayton, R. F., Thuring, J. W., Cummings, M. D.
& Cherepanov, P. (2010). Proc. Natl Acad. Sci. USA, 107, 20057–20062.
Huang, W., Ravikumar, K. M., Chance, M. R. & Yang, S. (2015).Biophys. J. 108, 107–115.
Jiang, J. S. & Brunger, A. T. (1994). J. Mol. Biol. 243, 100–115.Kamal, J. K., Benchaar, S. A., Takamoto, K., Reisler, E. & Chance,
M. R. (2007). Proc. Natl Acad. Sci. USA, 104, 7910–7915.Kamal, J. K. & Chance, M. R. (2008). Protein Sci. 17, 79–94.Kandori, H. (2000). Biochim. Biophys. Acta, 1460, 177–191.Kaur, P., Kiselar, J. G. & Chance, M. R. (2009). Anal. Chem. 81, 8141–
8149.Kaur, P., Kiselar, J., Yang, S. & Chance, M. R. (2015). Mol. Cell.
Proteom. 14, 1159–1168.Kerfeld, C. A., Sawaya, M. R., Brahmandam, V., Cascio, D., Ho, K. K.,
Trevithick-Sutton, C. C., Krogmann, D. W. & Yeates, T. O. (2003).Structure, 11, 55–65.
Kiselar, J. G. & Chance, M. R. (2010). J. Mass Spectrom. 45, 1373–1382.
Kiselar, J. G., Janmey, P. A., Almo, S. C. & Chance, M. R. (2003). Proc.Natl Acad. Sci. USA, 100, 3942–3947.
Klinger, A. L., Kiselar, J., Ilchenko, S., Komatsu, H., Chance, M. R. &Axelsen, P. H. (2014). Biochemistry, 53, 7724–7734.
Konermann, L., Ahadi, E., Rodriguez, A. D. & Vahidi, S. (2013).Anal. Chem. 85, 2–9.
Kuhn, L. A., Siani, M. A., Pique, M. E., Fisher, C. L., Getzoff, E. D. &Tainer, J. A. (1992). J. Mol. Biol. 228, 13–22.
Kuntz, I. D. Jr, Brassfield, T. S., Law, G. D. & Purcell, G. V. (1969).Science, 163, 1329–1331.
Leverenz, R. L., Sutter, M., Wilson, A., Gupta, S., Thurotte, A.,Bourcier de Carbon, C., Petzold, C. J., Ralston, C., Perreau, F.,Kirilovsky, D. & Kerfeld, C. A. (2015). Science, 348, 1463–1466.
Levinson, N. M. & Boxer, S. G. (2014). Nat. Chem. Biol. 10, 127–132.
Liljenzin, J. (2002). In Radiochemistry and Nuclear Chemistry.Oxford: Butterworth-Heinemann.
Lin, J., Balabin, I. A. & Beratan, D. N. (2005). Science, 310, 1311–1313.
Ling, J., Cho, C., Guo, L. T., Aerni, H. R., Rinehart, J. & Soll, D.(2012). Mol. Cell, 48, 713–722.
Lu, M., Chai, J. & Fu, D. (2009). Nat. Struct. Mol. Biol. 16, 1063–1067.Lu, M. & Fu, D. (2007). Science, 317, 1746–1748.Maleknia, S. D. & Downard, K. M. (2012). Rapid Commun. Mass
Spectrom. 26, 2311–2318.Marechal, A. & Rich, P. R. (2011). Proc. Natl Acad. Sci. USA, 108,
8634–8638.Muroda, K., Nakashima, K., Shibata, M., Demura, M. & Kandori, H.
(2012). Biochemistry, 51, 4677–4684.Nickels, J. D., O’Neill, H., Hong, L., Tyagi, M., Ehlers, G., Weiss, K. L.,
Zhang, Q., Yi, Z., Mamontov, E., Smith, J. C. & Sokolov, A. P.(2012). Biophys. J. 103, 1566–1575.
Nucci, N. V., Pometun, M. S. & Wand, A. J. (2011). Nat. Struct. Mol.Biol. 18, 245–249.
Orban, T., Jastrzebska, B., Gupta, S., Wang, B., Miyagi, M., Chance,M. R. & Palczewski, K. (2012). Structure, 20, 826–840.
Ostmeyer, J., Chakrapani, S., Pan, A. C., Perozo, E. & Roux, B.(2013). Nature (London), 501, 121–124.
Otting, G., Liepinsh, E. & Wuthrich, K. (1991). Science, 254, 974–980.Padayatti, P. S., Wang, L., Gupta, S., Orban, T., Sun, W., Salom, D.,
Jordan, S. R., Palczewski, K. & Chance, M. R. (2013). Mol. Cell.Proteom. 12, 1259–1271.
Papoian, G. A., Ulander, J. & Wolynes, P. G. (2003). J. Am. Chem. Soc.125, 9170–9178.
Pearson, R. G. & Williams, E. L. (1987). J. Polym. Sci. A, 25, 565–573.Persson, E. & Halle, B. (2008). J. Am. Chem. Soc. 130, 1774–1787.Pryor, W. A. (1986). Annu. Rev. Physiol. 48, 657–667.Ralston, C. Y., Sclavi, B., Sullivan, M., Deras, M. L., Woodson, S. A.,
Chance, M. R. & Brenowitz, M. (2000). Methods Enzymol. 317,353–368.
Renthal, R. (2008). Protein Sci. 17, 293–298.Rich, P. R. & Marechal, A. (2013). J. R. Soc. Interface, 10, 20130183.Rispens, T., Davies, A. M., Ooijevaar-de Heer, P., Absalah, S., Bende,
O., Sutton, B. J., Vidarsson, G. & Aalberse, R. C. (2014). J. Biol.Chem. 289, 6098–6109.
Royer, W. E. Jr, Pardanani, A., Gibson, Q. H., Peterson, E. S. &Friedman, J. M. (1996). Proc. Natl Acad. Sci. USA, 93, 14526–14531.
Salanga, C. L., Dyer, D. P., Kiselar, J. G., Gupta, S., Chance, M. R. &Handel, T. M. (2014). J. Biol. Chem. 289, 14896–14912.
Schilling, B., Rardin, M. J., MacLean, B. X., Zawadzka, A. M.,Frewen, B. E., Cusack, M. P., Sorensen, D. J., Bereman, M. S., Jing,E., Wu, C. C., Verdin, E., Kahn, C. R., Maccoss, M. J. & Gibson,B. W. (2012). Mol. Cell. Proteom. 11, 202–214.
Shacter, E. (2000). Drug Metab. Rev. 32, 307–326.Sullivan, M. R., Rekhi, S., Bohon, J., Gupta, S., Abel, D., Toomey, J. &
Chance, M. R. (2008). Rev. Sci. Instrum. 79, 025101.Swartz, K. J. (2004). Nat. Rev. Neurosci. 5, 905–916.Takamoto, K. & Chance, M. R. (2006). Annu. Rev. Biophys. Biomol.
Struct. 35, 251–276.Takamoto, K., Kamal, J. K. & Chance, M. R. (2007). Structure, 15, 39–
51.Tao, X., Avalos, J. L., Chen, J. & MacKinnon, R. (2009). Science, 326,
1668–1674.Tarek, M. & Tobias, D. J. (2000). Biophys. J. 79, 3244–3257.Tompa, K., Banki, P., Bokor, M., Kamasa, P., Lasanda, G. & Tompa, P.
(2009). Biophys. J. 96, 2789–2798.Tran, Q. T., Williams, S., Farid, R., Erdemli, G. & Pearlstein, R. (2013).
Proteins, 81, 291–299.Tseng, Y. Y., Chen, Z. J. & Li, W. H. (2010). Nucleic Acids Res. 38,
D288–D295.Tsenkova, R. (2009). J. Near Infrared Spectrosc. 17, 303–313.Uysal, S., Vasquez, V., Tereshko, V., Esaki, K., Fellouse, F. A., Sidhu,
S. S., Koide, S., Perozo, E. & Kossiakoff, A. (2009). Proc. Natl Acad.Sci. USA, 106, 6644–6649.
Watson, C., Janik, I., Zhuang, T., Charvatova, O., Woods, R. J. &Sharp, J. S. (2009). Anal. Chem. 81, 2496–2505.
Williams, M. A., Goodfellow, J. M. & Thornton, J. M. (1994). ProteinSci. 3, 1224–1235.
Wong, J. W., Maleknia, S. D. & Downard, K. M. (2005). J. Am. Soc.Mass Spectrom. 16, 225–233.
Xu, G. & Chance, M. R. (2007). Chem. Rev. 107, 3514–3543.Yoon, J., Oh, B., Kim, K., Park, J., Han, D., Kim, K. K., Cha, S. S., Lee,
D. & Kim, Y. (2004). J. Biol. Chem. 279, 341–347.Yuan, S., Filipek, S., Palczewski, K. & Vogel, H. (2014). Nat. Commun.
5, 4733.Zimmerberg, J. & Parsegian, V. A. (1986). Nature (London), 323, 36–
39.
feature articles
J. Synchrotron Rad. (2016). 23, 1056–1069 Sayan Gupta et al. � Synchrotron footprinting to visualize water in proteins 1069