Embed Size (px)
Citation preview

DOI: 10.1126/science.1226368, 1060 (2013);339 Science
et al.F. ParreninTemperature During the Last Deglacial Warming
and Antarctic2Synchronous Change of Atmospheric CO
This copy is for your personal, non-commercial use only.
clicking here.colleagues, clients, or customers by , you can order high-quality copies for yourIf you wish to distribute this article to others
here.following the guidelines
can be obtained byPermission to republish or repurpose articles or portions of articles
): February 28, 2013 www.sciencemag.org (this information is current as of
The following resources related to this article are available online at
http://www.sciencemag.org/content/339/6123/1060.full.htmlversion of this article at:
including high-resolution figures, can be found in the onlineUpdated information and services,
http://www.sciencemag.org/content/suppl/2013/02/28/339.6123.1060.DC1.html can be found at: Supporting Online Material
http://www.sciencemag.org/content/339/6123/1060.full.html#relatedfound at:
can berelated to this article A list of selected additional articles on the Science Web sites
http://www.sciencemag.org/content/339/6123/1060.full.html#ref-list-1, 6 of which can be accessed free:cites 28 articlesThis article
http://www.sciencemag.org/content/339/6123/1060.full.html#related-urls1 articles hosted by HighWire Press; see:cited by This article has been
registered trademark of AAAS. is aScience2013 by the American Association for the Advancement of Science; all rights reserved. The title
CopyrightAmerican Association for the Advancement of Science, 1200 New York Avenue NW, Washington, DC 20005. (print ISSN 0036-8075; online ISSN 1095-9203) is published weekly, except the last week in December, by theScience
on
Feb
ruar
y 28
, 201
3w
ww
.sci
ence
mag
.org
Dow
nloa
ded
from
effects such as surface pinning (26). Additionalexperiments are needed to understand the high Voc.
Because multijunction III-V PV is currentlybeing deployed for concentrator PV—where large-area, low-cost optics are used to collect sunlightand focus it onto small, high-performance solarcells—we have also investigated the performanceof the cell with highest Voc (sample E) under con-centration (Fig. 4). The Voc increases logarithmi-cally as expected up to 0.97 V. However, the fillfactor decreases, which indicates a series resist-ance, possibly originating from the TCO or thesmall contact area of the NW tips. The efficiencyunder concentrated illumination for this cell there-fore peaks at 13.4% at 2.6 suns. The angulardependence, which is important for diffuse lightconditions, has not been investigated experimen-tally, but previous simulations have indicated weakangular dependence up to 40° (12).
Lastly, we assess the technical maturity ofour design. We fabricated seven working cellson the same sample (average efficiency of 12.0%with standard deviation of 1.4%) and reproduced
similar results in separate growth and processingbatches. The best sample was stored 2 monthsin ambient air before the measurement, and thedegradation in absolute efficiency of somewhatolder samples is less than 0.5% over a period of6 months. This design should be readily scalableto wafer-sized cells and be useful for similar op-toelectronic devices such as photodetectors.
References and Notes1. W. U. Huynh, J. J. Dittmer, A. P. Alivisatos, Science 295,
2425 (2002).2. B. O'Regan, M. Grätzel, Nature 353, 737 (1991).3. A. Polman, H. A. Atwater, Nat. Mater. 11, 174 (2012).4. T. Mårtensson et al., Nano Lett. 4, 1987 (2004).5. C. Colombo, M. Heib, M. Grätzel, A. Fontcuberta i Morral,
Appl. Phys. Lett. 94, 173108 (2009).6. J. F. Wang, M. S. Gudiksen, X. Duan, Y. Cui, C. M. Lieber,
Science 293, 1455 (2001).7. M. T. Borgström et al., IEEE J. Sel. Top. Quantum Electron.
17, 1050 (2011).8. E. C. Garnett, M. L. Brongersma, Y. Cui, M. D. McGehee,
Annu. Rev. Mater. Res. 41, 269 (2011).9. H. Goto et al., Appl Phys Express 2, 035004 (2009).10. J. Kupec, R. L. Stoop, B. Witzigmann, Opt. Express 18,
27589 (2010).
11. L. Hu, G. Chen, Nano Lett. 7, 3249 (2007).12. N. Anttu, H. Q. Xu, J. Nanosci. Nanotechnol. 10,
7183 (2010).13. M. D. Kelzenberg et al., Nat. Mater. 9, 368 (2010).14. E. Garnett, P. D. Yang, Nano Lett. 10, 1082 (2010).15. C. J. Keavney, V. E. Haven, S. M. Vernon, in Photovoltaic
Specialists Conference, 1990, Conference Record of theTwenty First IEEE (IEEE, Piscataway, NJ, 1990), vol. 1,pp. 141–144.
16. M. A. Green, K. Emery, Y. Hishikawa, W. Warta,E. D. Dunlop, Prog. Photovolt. Res. Appl. 20, 606 (2012).
17. M. T. Borgström et al., Nano Research 3, 264(2010).
18. T. Mårtensson et al., Nano Lett. 4, 699 (2004).19. See supplementary materials on Science Online.20. N. Anttu, H. Q. Xu, Phys. Rev. B 83, 165431 (2011).21. P. M. Wu, N. Anttu, H. Q. Xu, L. Samuelson, M. E. Pistol,
Nano Lett. 12, 1990 (2012).22. S. Münch et al., Nanotechnology 21, 105711 (2010).23. H. J. Joyce et al., Nano Lett. 12, 5325 (2012).24. A. Mishra et al., Appl. Phys. Lett. 91, 263104 (2007).25. O. J. Glembocki, H. Piller, in Handbook of Optical
Constants of Solids, E. D. Palik, Ed. (Academic Press,Orlando, FL, 1985), pp. 503–516.
26. M. H. M. van Weert et al., Appl. Phys. Lett. 88,043109 (2006).
27. A. Yella et al., Science 334, 629 (2011).28. A. H. Ip et al., Nat Nano 7, 577 (2012).
Acknowledgments: This work was performed within theNanometer Structure Consortium at Lund University(nmC@LU) and was supported by the Swedish ResearchCouncil (Vetenskapsrådet), by the Knut and Alice WallenbergFoundation, by the Swedish Energy Agency, and by theEuropean Union program AMON-RA (214814). This Report isbased on a project that was funded by E.ON AG as part of theE.ON International Research Initiative. We thank M. Graczykfor nanoimprint lithography and S. Lehmann for transmissionelectron microscopy.
Supplementary Materialswww.sciencemag.org/cgi/content/full/science.1230969/DC1Materials and MethodsFigs. S1 to S3Table S1References (29–33)
1 October 2012; accepted 17 December 2012Published online 17 January 2013;10.1126/science.1230969
Synchronous Change of AtmosphericCO2 and Antarctic Temperature Duringthe Last Deglacial WarmingF. Parrenin,1* V. Masson-Delmotte,2 P. Köhler,3 D. Raynaud,1 D. Paillard,2 J. Schwander,4
C. Barbante,5,6 A. Landais,2 A. Wegner,3† J. Jouzel2
Understanding the role of atmospheric CO2 during past climate changes requires clearknowledge of how it varies in time relative to temperature. Antarctic ice cores preserve highlyresolved records of atmospheric CO2 and Antarctic temperature for the past 800,000 years.Here we propose a revised relative age scale for the concentration of atmospheric CO2 andAntarctic temperature for the last deglacial warming, using data from five Antarctic ice cores.We infer the phasing between CO2 concentration and Antarctic temperature at four timeswhen their trends change abruptly. We find no significant asynchrony between them, indicatingthat Antarctic temperature did not begin to rise hundreds of years before the concentration ofatmospheric CO2, as has been suggested by earlier studies.
Analyses of polar ice cores have shownthat the concentration of atmosphericCO2 (aCO2) and surface air temperature
are closely related and that they have risen andfallen in tandem over most of the past 800,000years. However, whether changes of temperature
occurred first and how large that lead may havebeen have been topics of considerable controver-sy. The most highly resolved aCO2 record duringthe last deglacial warming, Termination I (TI), isfrom the European Project for Ice Coring in An-tarctica (EPICA) Dome C (EDC) ice core (1, 2).In this record, aCO2 appears to lag local Antarctictemperature (AT) by 800 T 600 years at the onsetof TI, in agreement with an earlier study on theVostok and Taylor Dome ice cores, which iden-tified a lag of 600 T 400 years at the end of the
Fig. 4. Characterization of cellfrom sample E under concentratedillumination.
1Laboratoire de Glaciologie et Géophysique de l'Environnement(CNRS/UJF), Grenoble, France. 2Laboratoire des Sciences duClimat et de l'Environnement (CEA/CNRS/UVSQ-IPSL), Gif-sur-Yvette, France. 3Alfred Wegener Institute for Polar and MarineResearch, Bremerhaven, Germany. 4Physics Institute, Univer-sity of Bern, Bern, Switzerland. 5Department of EnvironmentalSciences, University of Venice, Venice, Italy. 6Institute for theDynamics of Environmental Processes–CNR,University of Venice,Venice, Italy.
*Corresponding author. E-mail: [email protected]†Present address: Byrd Polar Research Center, Ohio StateUniversity, Columbus, OH, USA.
1 MARCH 2013 VOL 339 SCIENCE www.sciencemag.org1060
REPORTS
on
Feb
ruar
y 28
, 201
3w
ww
.sci
ence
mag
.org
Dow
nloa
ded
from
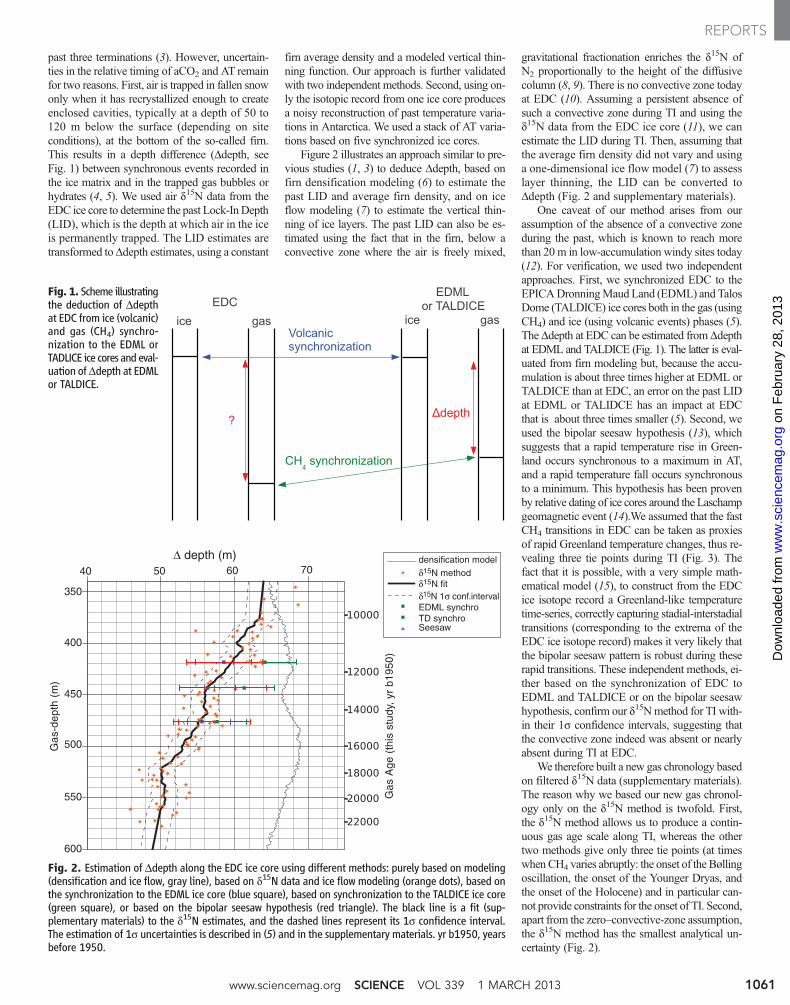
past three terminations (3). However, uncertain-ties in the relative timing of aCO2 and AT remainfor two reasons. First, air is trapped in fallen snowonly when it has recrystallized enough to createenclosed cavities, typically at a depth of 50 to120 m below the surface (depending on siteconditions), at the bottom of the so-called firn.This results in a depth difference (Ddepth, seeFig. 1) between synchronous events recorded inthe ice matrix and in the trapped gas bubbles orhydrates (4, 5). We used air d15N data from theEDC ice core to determine the past Lock-InDepth(LID), which is the depth at which air in the iceis permanently trapped. The LID estimates aretransformed toDdepth estimates, using a constant
firn average density and a modeled vertical thin-ning function. Our approach is further validatedwith two independent methods. Second, using on-ly the isotopic record from one ice core producesa noisy reconstruction of past temperature varia-tions in Antarctica. We used a stack of AT varia-tions based on five synchronized ice cores.
Figure 2 illustrates an approach similar to pre-vious studies (1, 3) to deduce Ddepth, based onfirn densification modeling (6) to estimate thepast LID and average firn density, and on iceflow modeling (7) to estimate the vertical thin-ning of ice layers. The past LID can also be es-timated using the fact that in the firn, below aconvective zone where the air is freely mixed,
gravitational fractionation enriches the d15N ofN2 proportionally to the height of the diffusivecolumn (8, 9). There is no convective zone todayat EDC (10). Assuming a persistent absence ofsuch a convective zone during TI and using thed15N data from the EDC ice core (11), we canestimate the LID during TI. Then, assuming thatthe average firn density did not vary and usinga one-dimensional ice flow model (7) to assesslayer thinning, the LID can be converted toDdepth (Fig. 2 and supplementary materials).
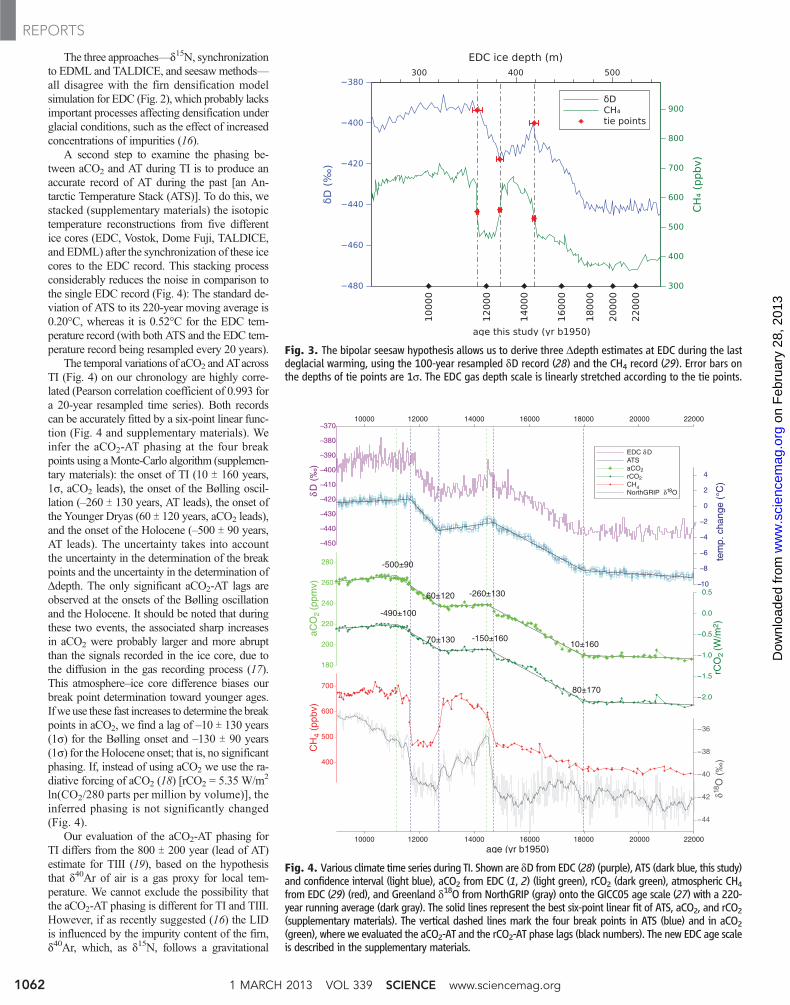
One caveat of our method arises from ourassumption of the absence of a convective zoneduring the past, which is known to reach morethan 20m in low-accumulation windy sites today(12). For verification, we used two independentapproaches. First, we synchronized EDC to theEPICADronningMaudLand (EDML) and TalosDome (TALDICE) ice cores both in the gas (usingCH4) and ice (using volcanic events) phases (5).The Ddepth at EDC can be estimated from Ddepthat EDML and TALDICE (Fig. 1). The latter is eval-uated from firn modeling but, because the accu-mulation is about three times higher at EDML orTALDICE than at EDC, an error on the past LIDat EDML or TALIDCE has an impact at EDCthat is about three times smaller (5). Second, weused the bipolar seesaw hypothesis (13), whichsuggests that a rapid temperature rise in Green-land occurs synchronous to a maximum in AT,and a rapid temperature fall occurs synchronousto a minimum. This hypothesis has been provenby relative dating of ice cores around the Laschampgeomagnetic event (14).We assumed that the fastCH4 transitions in EDC can be taken as proxiesof rapid Greenland temperature changes, thus re-vealing three tie points during TI (Fig. 3). Thefact that it is possible, with a very simple math-ematical model (15), to construct from the EDCice isotope record a Greenland-like temperaturetime-series, correctly capturing stadial-interstadialtransitions (corresponding to the extrema of theEDC ice isotope record) makes it very likely thatthe bipolar seesaw pattern is robust during theserapid transitions. These independent methods, ei-ther based on the synchronization of EDC toEDML and TALDICE or on the bipolar seesawhypothesis, confirm our d15Nmethod for TI with-in their 1s confidence intervals, suggesting thatthe convective zone indeed was absent or nearlyabsent during TI at EDC.
We therefore built a new gas chronology basedon filtered d15N data (supplementary materials).The reason why we based our new gas chronol-ogy only on the d15N method is twofold. First,the d15N method allows us to produce a contin-uous gas age scale along TI, whereas the othertwo methods give only three tie points (at timeswhenCH4 varies abruptly: the onset of the Bøllingoscillation, the onset of the Younger Dryas, andthe onset of the Holocene) and in particular can-not provide constraints for the onset of TI. Second,apart from the zero–convective-zone assumption,the d15N method has the smallest analytical un-certainty (Fig. 2).
Fig. 1. Scheme illustratingthe deduction of Ddepthat EDC from ice (volcanic)and gas (CH4) synchro-nization to the EDML orTADLICE ice cores and eval-uation ofDdepth at EDMLor TALDICE.
∆ depth (m)
Gas
-dep
th (
m)
Gas
Age
(th
is s
tudy
, yr
b195
0)
350
40
400
450
500
550
600
densification model
δ15N methodδ15N fitδ15N 1σ conf.intervalEDML synchroTD synchroSeesaw
50 60 70
Fig. 2. Estimation of Ddepth along the EDC ice core using different methods: purely based on modeling(densification and ice flow, gray line), based on d15N data and ice flow modeling (orange dots), based onthe synchronization to the EDML ice core (blue square), based on synchronization to the TALDICE ice core(green square), or based on the bipolar seesaw hypothesis (red triangle). The black line is a fit (sup-plementary materials) to the d15N estimates, and the dashed lines represent its 1s confidence interval.The estimation of 1s uncertainties is described in (5) and in the supplementary materials. yr b1950, yearsbefore 1950.
www.sciencemag.org SCIENCE VOL 339 1 MARCH 2013 1061
REPORTS
on
Feb
ruar
y 28
, 201
3w
ww
.sci
ence
mag
.org
Dow
nloa
ded
from
The three approaches—d15N, synchronizationto EDML and TALDICE, and seesawmethods—all disagree with the firn densification modelsimulation for EDC (Fig. 2), which probably lacksimportant processes affecting densification underglacial conditions, such as the effect of increasedconcentrations of impurities (16).
A second step to examine the phasing be-tween aCO2 and AT during TI is to produce anaccurate record of AT during the past [an An-tarctic Temperature Stack (ATS)]. To do this, westacked (supplementary materials) the isotopictemperature reconstructions from five differentice cores (EDC, Vostok, Dome Fuji, TALDICE,and EDML) after the synchronization of these icecores to the EDC record. This stacking processconsiderably reduces the noise in comparison tothe single EDC record (Fig. 4): The standard de-viation of ATS to its 220-year moving average is0.20°C, whereas it is 0.52°C for the EDC tem-perature record (with both ATS and the EDC tem-perature record being resampled every 20 years).
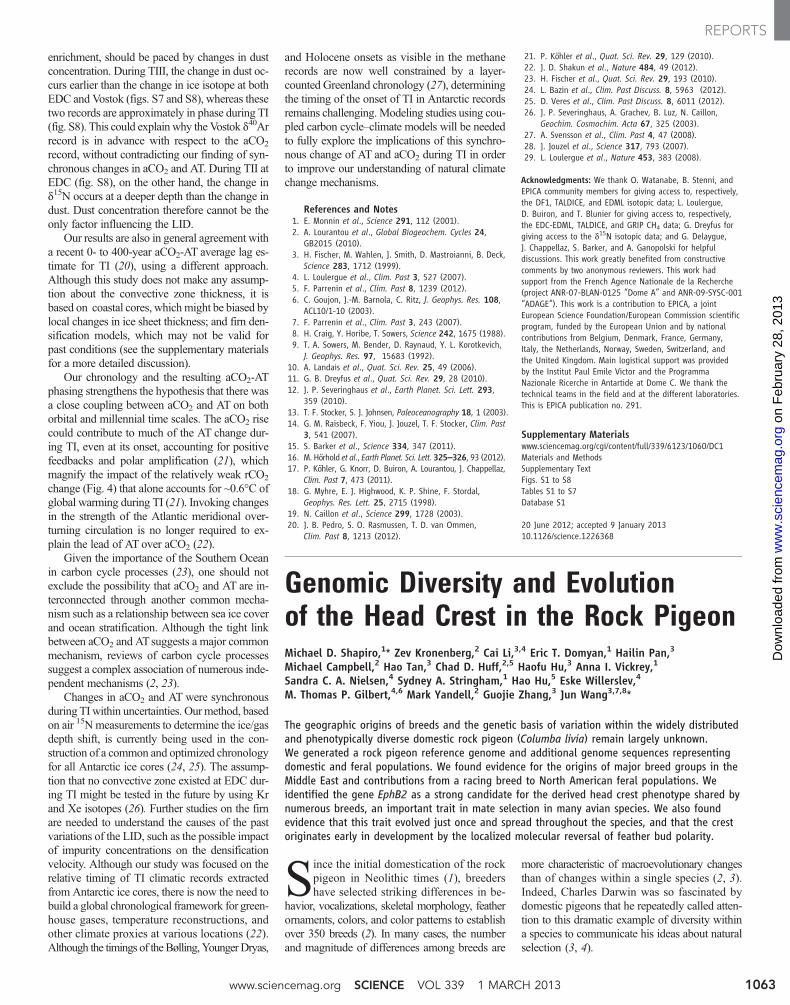
The temporal variations of aCO2 andATacrossTI (Fig. 4) on our chronology are highly corre-lated (Pearson correlation coefficient of 0.993 fora 20-year resampled time series). Both recordscan be accurately fitted by a six-point linear func-tion (Fig. 4 and supplementary materials). Weinfer the aCO2-AT phasing at the four breakpoints using aMonte-Carlo algorithm (supplemen-tary materials): the onset of TI (10 T 160 years,1s, aCO2 leads), the onset of the Bølling oscil-lation (–260 T 130 years, AT leads), the onset ofthe Younger Dryas (60 T 120 years, aCO2 leads),and the onset of the Holocene (–500 T 90 years,AT leads). The uncertainty takes into accountthe uncertainty in the determination of the breakpoints and the uncertainty in the determination ofDdepth. The only significant aCO2-AT lags areobserved at the onsets of the Bølling oscillationand the Holocene. It should be noted that duringthese two events, the associated sharp increasesin aCO2 were probably larger and more abruptthan the signals recorded in the ice core, due tothe diffusion in the gas recording process (17).This atmosphere–ice core difference biases ourbreak point determination toward younger ages.Ifwe use these fast increases to determine the breakpoints in aCO2, we find a lag of –10 T 130 years(1s) for the Bølling onset and –130 T 90 years(1s) for the Holocene onset; that is, no significantphasing. If, instead of using aCO2 we use the ra-diative forcing of aCO2 (18) [rCO2 = 5.35 W/m2
ln(CO2/280 parts per million by volume)], theinferred phasing is not significantly changed(Fig. 4).
Our evaluation of the aCO2-AT phasing forTI differs from the 800 T 200 year (lead of AT)estimate for TIII (19), based on the hypothesisthat d40Ar of air is a gas proxy for local tem-perature. We cannot exclude the possibility thatthe aCO2-AT phasing is different for TI and TIII.However, if as recently suggested (16) the LIDis influenced by the impurity content of the firn,d40Ar, which, as d15N, follows a gravitational
Fig. 3. The bipolar seesaw hypothesis allows us to derive three Ddepth estimates at EDC during the lastdeglacial warming, using the 100-year resampled dD record (28) and the CH4 record (29). Error bars onthe depths of tie points are 1s. The EDC gas depth scale is linearly stretched according to the tie points.
Fig. 4. Various climate time series during TI. Shown are dD from EDC (28) (purple), ATS (dark blue, this study)and confidence interval (light blue), aCO2 from EDC (1, 2) (light green), rCO2 (dark green), atmospheric CH4from EDC (29) (red), and Greenland d18O from NorthGRIP (gray) onto the GICC05 age scale (27) with a 220-year running average (dark gray). The solid lines represent the best six-point linear fit of ATS, aCO2, and rCO2(supplementary materials). The vertical dashed lines mark the four break points in ATS (blue) and in aCO2(green), where we evaluated the aCO2-AT and the rCO2-AT phase lags (black numbers). The new EDC age scaleis described in the supplementary materials.
age (yr b1950)
22000200001800016000140001200010000
22000200001800016000140001200010000
−450
−440
−430
−420
−410
−400
−390
−380
−370
δD (
‰)
−10
−8
−6
−4
−2
0
2
4
tem
p. c
hang
e (°
C)
180
200
220
240
260
280
aCO
2 (p
pmv)
−2.0
−1.5
−1.0
−0.5
0.0
0.5
rCO
2 (W
/m2 )
400
500
600
700
CH
4 (p
pbv)
−44
−42
−40
−38
−36δ18
O (
‰)
-500±90
60±120 -260±130
10±160
-490±100
70±130 -150±160
80±170
EDC δDATSaCO2rCO2CH4NorthGRIP δ18O
1 MARCH 2013 VOL 339 SCIENCE www.sciencemag.org1062
REPORTS
on
Feb
ruar
y 28
, 201
3w
ww
.sci
ence
mag
.org
Dow
nloa
ded
from
enrichment, should be paced by changes in dustconcentration. During TIII, the change in dust oc-curs earlier than the change in ice isotope at bothEDC and Vostok (figs. S7 and S8), whereas thesetwo records are approximately in phase during TI(fig. S8). This could explainwhy the Vostok d40Arrecord is in advance with respect to the aCO2
record, without contradicting our finding of syn-chronous changes in aCO2 and AT. During TII atEDC (fig. S8), on the other hand, the change ind15N occurs at a deeper depth than the change indust. Dust concentration therefore cannot be theonly factor influencing the LID.
Our results are also in general agreement witha recent 0- to 400-year aCO2-AT average lag es-timate for TI (20), using a different approach.Although this study does not make any assump-tion about the convective zone thickness, it isbased on coastal cores, whichmight be biased bylocal changes in ice sheet thickness; and firn den-sification models, which may not be valid forpast conditions (see the supplementary materialsfor a more detailed discussion).
Our chronology and the resulting aCO2-ATphasing strengthens the hypothesis that there wasa close coupling between aCO2 and AT on bothorbital and millennial time scales. The aCO2 risecould contribute to much of the AT change dur-ing TI, even at its onset, accounting for positivefeedbacks and polar amplification (21), whichmagnify the impact of the relatively weak rCO2
change (Fig. 4) that alone accounts for ~0.6°C ofglobal warming during TI (21). Invoking changesin the strength of the Atlantic meridional over-turning circulation is no longer required to ex-plain the lead of AT over aCO2 (22).
Given the importance of the Southern Oceanin carbon cycle processes (23), one should notexclude the possibility that aCO2 and AT are in-terconnected through another common mecha-nism such as a relationship between sea ice coverand ocean stratification. Although the tight linkbetween aCO2 and ATsuggests a major commonmechanism, reviews of carbon cycle processessuggest a complex association of numerous inde-pendent mechanisms (2, 23).
Changes in aCO2 and AT were synchronousduring TIwithin uncertainties. Ourmethod, basedon air 15Nmeasurements to determine the ice/gasdepth shift, is currently being used in the con-struction of a common and optimized chronologyfor all Antarctic ice cores (24, 25). The assump-tion that no convective zone existed at EDC dur-ing TI might be tested in the future by using Krand Xe isotopes (26). Further studies on the firnare needed to understand the causes of the pastvariations of the LID, such as the possible impactof impurity concentrations on the densificationvelocity. Although our study was focused on therelative timing of TI climatic records extractedfrom Antarctic ice cores, there is now the need tobuild a global chronological framework for green-house gases, temperature reconstructions, andother climate proxies at various locations (22).Although the timings of theBølling, YoungerDryas,
and Holocene onsets as visible in the methanerecords are now well constrained by a layer-counted Greenland chronology (27), determiningthe timing of the onset of TI in Antarctic recordsremains challenging.Modeling studies using cou-pled carbon cycle–climate models will be neededto fully explore the implications of this synchro-nous change of AT and aCO2 during TI in orderto improve our understanding of natural climatechange mechanisms.
References and Notes1. E. Monnin et al., Science 291, 112 (2001).2. A. Lourantou et al., Global Biogeochem. Cycles 24,
GB2015 (2010).3. H. Fischer, M. Wahlen, J. Smith, D. Mastroianni, B. Deck,
Science 283, 1712 (1999).4. L. Loulergue et al., Clim. Past 3, 527 (2007).5. F. Parrenin et al., Clim. Past 8, 1239 (2012).6. C. Goujon, J.-M. Barnola, C. Ritz, J. Geophys. Res. 108,
ACL10/1-10 (2003).7. F. Parrenin et al., Clim. Past 3, 243 (2007).8. H. Craig, Y. Horibe, T. Sowers, Science 242, 1675 (1988).9. T. A. Sowers, M. Bender, D. Raynaud, Y. L. Korotkevich,
J. Geophys. Res. 97, 15683 (1992).10. A. Landais et al., Quat. Sci. Rev. 25, 49 (2006).11. G. B. Dreyfus et al., Quat. Sci. Rev. 29, 28 (2010).12. J. P. Severinghaus et al., Earth Planet. Sci. Lett. 293,
359 (2010).13. T. F. Stocker, S. J. Johnsen, Paleoceanography 18, 1 (2003).14. G. M. Raisbeck, F. Yiou, J. Jouzel, T. F. Stocker, Clim. Past
3, 541 (2007).15. S. Barker et al., Science 334, 347 (2011).16. M. Hörhold et al., Earth Planet. Sci. Lett. 325–326, 93 (2012).17. P. Köhler, G. Knorr, D. Buiron, A. Lourantou, J. Chappellaz,
Clim. Past 7, 473 (2011).18. G. Myhre, E. J. Highwood, K. P. Shine, F. Stordal,
Geophys. Res. Lett. 25, 2715 (1998).19. N. Caillon et al., Science 299, 1728 (2003).20. J. B. Pedro, S. O. Rasmussen, T. D. van Ommen,
Clim. Past 8, 1213 (2012).
21. P. Köhler et al., Quat. Sci. Rev. 29, 129 (2010).22. J. D. Shakun et al., Nature 484, 49 (2012).23. H. Fischer et al., Quat. Sci. Rev. 29, 193 (2010).24. L. Bazin et al., Clim. Past Discuss. 8, 5963 (2012).25. D. Veres et al., Clim. Past Discuss. 8, 6011 (2012).26. J. P. Severinghaus, A. Grachev, B. Luz, N. Caillon,
Geochim. Cosmochim. Acta 67, 325 (2003).27. A. Svensson et al., Clim. Past 4, 47 (2008).28. J. Jouzel et al., Science 317, 793 (2007).29. L. Loulergue et al., Nature 453, 383 (2008).
Acknowledgments: We thank O. Watanabe, B. Stenni, andEPICA community members for giving access to, respectively,the DF1, TALDICE, and EDML isotopic data; L. Loulergue,D. Buiron, and T. Blunier for giving access to, respectively,the EDC-EDML, TALDICE, and GRIP CH4 data; G. Dreyfus forgiving access to the d15N isotopic data; and G. Delaygue,J. Chappellaz, S. Barker, and A. Ganopolski for helpfuldiscussions. This work greatly benefited from constructivecomments by two anonymous reviewers. This work hadsupport from the French Agence Nationale de la Recherche(project ANR-07-BLAN-0125 “Dome A” and ANR-09-SYSC-001“ADAGE”). This work is a contribution to EPICA, a jointEuropean Science Foundation/European Commission scientificprogram, funded by the European Union and by nationalcontributions from Belgium, Denmark, France, Germany,Italy, the Netherlands, Norway, Sweden, Switzerland, andthe United Kingdom. Main logistical support was providedby the Institut Paul Emile Victor and the ProgrammaNazionale Ricerche in Antartide at Dome C. We thank thetechnical teams in the field and at the different laboratories.This is EPICA publication no. 291.
Supplementary Materialswww.sciencemag.org/cgi/content/full/339/6123/1060/DC1Materials and MethodsSupplementary TextFigs. S1 to S8Tables S1 to S7Database S1
20 June 2012; accepted 9 January 201310.1126/science.1226368
Genomic Diversity and Evolutionof the Head Crest in the Rock PigeonMichael D. Shapiro,1* Zev Kronenberg,2 Cai Li,3,4 Eric T. Domyan,1 Hailin Pan,3
Michael Campbell,2 Hao Tan,3 Chad D. Huff,2,5 Haofu Hu,3 Anna I. Vickrey,1
Sandra C. A. Nielsen,4 Sydney A. Stringham,1 Hao Hu,5 Eske Willerslev,4
M. Thomas P. Gilbert,4,6 Mark Yandell,2 Guojie Zhang,3 Jun Wang3,7,8*
The geographic origins of breeds and the genetic basis of variation within the widely distributedand phenotypically diverse domestic rock pigeon (Columba livia) remain largely unknown.We generated a rock pigeon reference genome and additional genome sequences representingdomestic and feral populations. We found evidence for the origins of major breed groups in theMiddle East and contributions from a racing breed to North American feral populations. Weidentified the gene EphB2 as a strong candidate for the derived head crest phenotype shared bynumerous breeds, an important trait in mate selection in many avian species. We also foundevidence that this trait evolved just once and spread throughout the species, and that the crestoriginates early in development by the localized molecular reversal of feather bud polarity.
Since the initial domestication of the rockpigeon in Neolithic times (1), breedershave selected striking differences in be-
havior, vocalizations, skeletal morphology, featherornaments, colors, and color patterns to establishover 350 breeds (2). In many cases, the numberand magnitude of differences among breeds are
more characteristic of macroevolutionary changesthan of changes within a single species (2, 3).Indeed, Charles Darwin was so fascinated bydomestic pigeons that he repeatedly called atten-tion to this dramatic example of diversity withina species to communicate his ideas about naturalselection (3, 4).
www.sciencemag.org SCIENCE VOL 339 1 MARCH 2013 1063
REPORTS
on
Feb
ruar
y 28
, 201
3w
ww
.sci
ence
mag
.org
Dow
nloa
ded
from


![ANTARCTIC TREATY AND ANTARCTIC TERRITORY PROTECTION … · 463 Revista Chilena de Derecho, vol. 40 Nº 2, pp. 461 - 488 [2013] Villamizar Lamus, Fernando “Antarctic treaty and antarctic](https://img.pdfslide.us/doc/110x75/5bd437f009d3f209338b8b25/antarctic-treaty-and-antarctic-territory-protection-463-revista-chilena-de-derecho.jpg)