Embed Size (px)
Citation preview

© 2
017
Nat
ure
Am
eric
a, In
c., p
art
of
Sp
rin
ger
Nat
ure
. All
rig
hts
res
erve
d.
Nature GeNetics ADVANCE ONLINE PUBLICATION �
l e t t e r s
A defining goal of synthetic biology is to engineer cells to coordinate tasks that often require precise temporal modulation of gene expression. Although a variety of relatively small gene circuits have been constructed and characterized, their logical combination into larger networks remains a central challenge. This is due primarily to the lack of compatible and orthogonal elements for predictable dynamic control of gene expression. As an alternative approach to promoter-level regulation, we explored the use of DNA copy number as a circuit control element. We engineered colony-wide DNA cycling in Escherichia coli in the form of plasmid copy number oscillations via a modular design that can be readily adapted for use with other gene circuitry. Copy number modulation is a generalizable principle that adds a layer of control to synthetic gene circuits, allowing dynamic regulation of circuit elements without requiring specially engineered promoters.
The adaptation of DNA copy number in response to environmental pressures is a widespread mechanism found in natural systems. Copy number adjustments can be observed as relatively fixed changes, such as the evolution of ribosomal DNA tandem arrays, but also can drive rapid alterations in gene expression programs1,2. In synthetic biol-ogy, DNA copy number has typically been used to tune static gene expression levels. Recently, a synthetic circuit demonstrated plasmid amplification driven by changes in E. coli growth state as cultures approached saturation3. In this work we present strategies that allow both negative and positive plasmid copy number modulation in E. coli cells grown at a fixed density in continuous culture. We demonstrate that this can enable the rational design of synthetic circuits that har-ness plasmid copy number to dynamically control expression levels, in single genes or entire gene modules.
We initially investigated an approach for reversibly repressing gene expression by reducing copy number. We found that when a nuclease is expressed alongside a plasmid that contains the nuclease recogni-tion sequence, the plasmid’s copy number can be temporarily reduced below its natural levels. To characterize this effect, we constructed a ColE1 origin plasmid with a unique recognition sequence for the I-SceI endonuclease on the backbone and a constitutive promoter driv-ing a sequence encoding a red fluorescent protein (RFP). On a second plasmid with the compatible p15A origin, we used an arabinose- inducible promoter to drive expression of the SCEI gene from
Saccharomyces cerevisiae, which encodes the I-SceI protein (plasmid diagrams are shown in Supplementary Fig. 1). In E. coli cells trans-formed with both plasmids, the induction of I-SceI with arabinose resulted in a decrease of the ColE1 plasmid copy number, as evi-denced by a reduction in RFP levels both in batch (Fig. 1a) and in continuous culture (Fig. 1b). We verified this result by qPCR (Fig. 1a) and found that the majority of linearized plasmids were quickly degraded (Supplementary Fig. 2). The expression of high levels of nuclease did not result in any obvious effect on cell size or growth, as assessed by single-cell microscopy (Fig. 1b, bottom). These experi-ments demonstrate that a targeted nuclease can be used to negatively regulate the expression of genes on a plasmid—even those driven by unregulated promoters.
We reasoned that controlled nuclease expression could enable the regulation of an entire module of genes and promoters when placed on a plasmid containing the cognate cut site. To demonstrate the util-ity of this novel mode of regulation, we constructed a synthetic gene oscillator that uses plasmid copy number repression by a nuclease as the sole negative feedback component. We adapted the architecture of the circuit (Fig. 1c) from a synthetic oscillator previously constructed by our group4, using the lux quorum-sensing system from Aliivibrio fischeri5. In brief, LuxI catalyzes the production of a diffusible N-acyl homoserine lactone (AHL) molecule, which binds to the constitu-tively produced LuxR transcription factor and activates transcription from the luxI promoter, thereby forming a positive feedback loop. In the synthetic oscillator circuit, the lux quorum-sensing genes luxI and luxR are placed under their native bidirectional promoter on the ColE1 origin plasmid (‘activator plasmid’), with an additional copy of this promoter driving the expression of a sequence encoding a green fluorescent protein (GFP), which can be used as a readout of the luxI promoter activation state. A second p15A origin plasmid (‘repressor plasmid’) contains a third copy of the luxI promoter driving expres-sion of I-SceI, which targets and represses the activator plasmid. To facilitate fast protein-turnover dynamics, LuxI, GFP, and I-SceI all have an added ssrA tag targeting them for degradation by the native E. coli ClpXP protease6. When we grew E. coli with both of these plas-mids in continuous culture in microfluidic cell chambers, we observed regular oscillations of GFP expression that were synchronized across the cells within each chamber (Fig. 1d,e and Supplementary Video 1; see Supplementary Fig. 3 for the microfluidic chip design). This syn-thetic oscillator circuit demonstrates that nuclease-mediated copy
Synchronized DNA cycling across a bacterial populationLeo Baumgart1,2, William Mather3,5 & Jeff Hasty1,2,4,5
1Molecular Biology Section, Division of Biological Science, University of California, San Diego, La Jolla, California, USA. 2BioCircuits Institute, University of California, San Diego, La Jolla, California, USA. 3Departments of Physics and Biology, Virginia Polytechnic Institute and State University, Blacksburg, Virginia, USA. 4Department of Bioengineering, University of California, San Diego, La Jolla, California, USA. 5These authors contributed equally to this work. Correspondence should be addressed to J.H. ([email protected]).
Received 1 December 2016; accepted 16 June 2017; published online 10 July 2017; doi:10.1038/ng.3915

© 2
017
Nat
ure
Am
eric
a, In
c., p
art
of
Sp
rin
ger
Nat
ure
. All
rig
hts
res
erve
d.
� ADVANCE ONLINE PUBLICATION Nature GeNetics
l e t t e r s
number repression can override the strong positive feedback provided by the lux quorum-sensing module and is a powerful tool for control-ling gene expression.
Because the synthetic oscillator circuit we constructed relies on induced copy number changes in one plasmid, we measured the copy number of the second plasmid in the system as well. It has been reported that for the ColE1 family plasmids, including p15A, copy number can be altered by changes in cell state, such as metabolic bur-den resulting from high rates of translation7. To investigate whether the copy number of p15A was affected over the course of a period of oscillation, we measured RFP expression from a constitutive promoter on the p15A repressor plasmid. We observed a small increase in RFP signal after each peak of GFP signal (Fig. 2), which suggested a slight temporary amplification in p15A copy number. In response to this observation, we considered whether repressor plasmid copy number modulation could have a dynamic role in oscillations.
To explore this further, we constructed a p15A plasmid for which luxI promoter activation directly amplified plasmid copy number. We took advantage of the native regulation of the p15A plasmid, which is composed of an antisense RNA system8,9. Overproduction of one of these RNA transcripts (RNAII) has been shown to lead to copy number amplification10. We removed the transcriptional termina-tor directly downstream of the SCEI gene on the repressor plasmid and replaced it with a second copy of the luxI promoter, such that transcription from these promoters drove into the p15A origin in the same direction as the RNAII promoter (Fig. 2a). To visualize the effect of transcription into the origin on plasmid copy number, we replaced the SCEI gene with an ssrA-tagged gfp gene that could serve as a reporter for luxI promoter activation. We used RFP expressed from a constitutive promoter on the same plasmid as a reporter for copy number. As expected, we observed that luxI promoter activa-tion by exogenously added AHL, which manifested as an increase in GFP levels, led to amplification of p15A copy number and a transient increase in RFP (Fig. 2b). qPCR measurements showed a 2.3-fold (P = 3 × 10⁻⁸) amplification of p15A copy number after 90 min of induction with 450 nM AHL (Supplementary Fig. 4).
Next, we investigated the effects of this modified repressor plasmid on the oscillator dynamics. We imaged cells transformed with both the activator plasmid and the modified repressor plasmid, grown under the same conditions used in the previous microfluidic experi-ments. Using the RFP reporter, we found that the previously observed oscillations in repressor plasmid copy number were indeed amplified 1.5-fold (P = 4 × 10⁻⁷) in this modified oscillator circuit (Fig. 2c, bot-tom). The introduction of RNAII overexpression also led to a decrease in period and altered waveform compared with the first oscillator. To assess whether the use of a nuclease and RNAII overexpression adversely affects plasmid maintenance and thus the stability of this circuit, we imaged growing cells in a microfluidic device continuously for several days under constant antibiotic selection. We observed reg-ular oscillations without apparent mutations or significant effects on cell growth (Fig. 2d,e and Supplementary Video 2).
We compared the two oscillator circuits to investigate whether the addition of engineered copy number amplification to the repressor plasmid could produce more robust oscillations. As a test for robust-ness with respect to microfluidic device geometries, we cultured cells of each strain in an alternative microfluidic device with cell chambers designed to have an approximately fivefold greater volume per cham-ber (Supplementary Fig. 5). When the chambers were seeded with the strain containing the second circuit modified to include engineered RNAII overexpression, we observed regular oscillations in these larger chambers as well (Fig. 3a and Supplementary Video 3). Furthermore,
this modified circuit produced oscillations even when the growth medium was switched from rich lysogeny broth (LB) to minimal salts (M9) medium with glycerol (Fig. 3b). In contrast, we observed at best low-amplitude irregular oscillations in the larger microfluidic chambers when we used the original circuit with the unmodified repres-sor plasmid grown in either LB or M9 medium (Supplementary Video 4 shows a side-by-side comparison). This suggests that modifying the circuit to incorporate both negative and positive DNA copy number regulation produces more robust oscillations across different culturing conditions.
Peak +48+24 min +72 +96 +120 +144 +168
50 µm
a
c
e
b
2
4
RF
P (
AU
)
Time (min)180 360 540
580 min180 min 380 min
25 µm
00
InducedI-SceI
d
2
4
0 300 600 900
GF
P (
AU
)
Time (min)
0
Cutsite
GFP
LuxR
LuxR LuxI I-SceI
Activatorplasmid
Repressorplasmid
0.5
1
Fol
d ch
ange
0Control Induced
I-SceI
Plasmid copy number
RFP fluorescence
Figure 1 A meganuclease (I-SceI) serves as a negative feedback element in this synthetic quorum oscillator by targeting the activator plasmid. (a) To demonstrate copy number modulation, we placed I-SceI under the control of an arabinose-inducible promoter, with I-SceI targeting a ColE1 origin plasmid that codes for constitutive RFP production. After 3 h of exponential growth in a flask containing arabinose, both RFP levels and ColE1 copy number decreased significantly (P = 2 × 10⁻⁴ for RFP, P = 6 × 10⁻¹² for copy number). Plasmid copy number was quantified by qPCR with primers spanning the cut site. Data are shown as mean and s.e.m. We used an independent two-sample t-test for statistical analysis, with n = 10 replicate wells each for fluorescence measurements and qPCR. (b) Growth of the strain from a in a microfluidic cell chamber. RFP production dropped sharply after the induction of I-SceI by arabinose (gray shaded region), then recovered after the removal of arabinose. The images below the plot show a composite of phase contrast and RFP fluorescence at the indicated time points. AU, arbitrary fluorescence units (background subtracted). (c) The two-plasmid circuit: a ColE1 origin plasmid (activator plasmid) includes the lux quorum-sensing system from A. fischeri, which serves as a positive feedback loop for synchronized luxI promoter activation. A p15A origin plasmid (repressor plasmid) has the luxI promoter controlling expression of I-SceI, which targets the activator plasmid and reduces the copy number. LuxI, GFP, and I-SceI proteins are ssrA-tagged for ClpXP degradation. (d) Time series of average GFP signal from a representative chamber, showing regular synchronized oscillations produced by the circuit. The result is representative of seven replicate microfluidic chambers per experiment, with at least two replicate experiments for each strain. (e) A film strip showing a composite of phase contrast and GFP fluorescence produced by the oscillator circuit, covering one period of oscillation.

© 2
017
Nat
ure
Am
eric
a, In
c., p
art
of
Sp
rin
ger
Nat
ure
. All
rig
hts
res
erve
d.
Nature GeNetics ADVANCE ONLINE PUBLICATION �
l e t t e r s
We integrated our observations into quantitative reaction network models for the circuit without RNAII overexpression feedback (model 1) and the circuit with RNAII overexpression feedback (model 2), which differed only in that model 2 included control of the repressor plasmid copy number. We based these models on degrade-and-fire models previously fit to experiments4,11,12, including the effects of both delay in feedback11 and proteolytic queuing13 (details are presented in Supplementary Note 1). The models agreed well with experimental trajectories (Fig. 3c), and predicted that oscillation amplitudes for the plasmid copy number are small enough that plasmid extinction in cells is a rare event (Fig. 3d). A robustness analysis of the models showed that these oscillator designs are robust to general parameter variation (Fig. 3e and Supplementary Fig. 6). Curiously, we identi-fied model 1 as more robust than model 2; this observation does not seem to be consistent with our experiments, but we believe that the more sinusoidal oscillations in Figure 2d as compared with the strong relaxation oscillations in Figure 1d placed model 2 in the vicinity of a Hopf bifurcation, which would be consistent with lower robustness
for model 2. Additional investigation of quasi-1D scans of robustness supported the idea that model 2 is less robust and close to a bifurca-tion (Supplementary Fig. 7). We addressed the robustness experi-ments (Fig. 3a,b) by demonstrating that slightly perturbed parameters consistent with a change in trap geometry could lead to a situation in which only model 2 oscillates, as in the experiment (Supplementary Fig. 8). This observation indicated that the robustness of the circuits may be dependent on trap geometry.
The engineered interactions discussed previously are sufficient to explain oscillations, but we also considered the effect of implicit interactions arising from the limited abundance of transcription fac-tors. When transcription factors are not present in a large excess, the ratio of binding sites to binding proteins becomes relevant to gene expression. An amplified DNA copy number necessarily implies an increased number of binding sites, an effect that is multiplied when a single DNA copy contains multiple binding sites. In the oscillator circuits described in this work, positive feedback is sustained only when LuxR sufficiently binds to and activates the luxI promoter located upstream of the luxI gene. Thus we reasoned that this positive feedback could be effectively interrupted if sufficient decoy binding sites were supplied to titrate LuxR away from this promoter. We demonstrated this by modifying a circuit to remove the effect of the nuclease and to uncouple quorum sensing from repressor plasmid
50 µm
Peak +52+26 min +78 +104 +130 +156
+208+182 +234 +260 +286 +312 +338
e
a
p15AORI
Plasmidreplication
(RNAII)
Transcription
PluxI
PluxI
0
4
2
Time (min)F
luor
esce
nce
(AU
)
0
4
2
Time (h)
GF
P (
AU
)
cb
d
RFP
Flu
ores
cenc
e (A
U)
Time (min)
0 300150
0 4824 3612 0 600300
0
4
2
0 600300
0
4
2
InducedPluxI
Figure 2 Amplification of DNA copy number by engineered transcription into the origin of replication. (a) The arrangement of promoters allowing overproduction of RNAII. A second luxI promoter (PluxI) replaces the terminator after the SCEI gene, with both promoters facing the same direction as the native p15A promoter that primes plasmid replication (RNAII promoter). Constitutive RFP production reports on plasmid copy number. (b) To demonstrate the effect of luxI promoter activation on copy number, we replaced the SCEI gene with gfp. Induction with 450 nM AHL for 90 min (shaded region) resulted in GFP production from the luxI promoter (green) and a concomitant increase in RFP signal (red), indicating plasmid copy number amplification. Note that GFP was ssrA-tagged for degradation, whereas RFP was untagged. (c) Small oscillations in RFP constitutively expressed from the p15A plasmid (red) were apparent even in the circuit without RNAII overproduction (top; circuit as shown in Fig. 1c). When the repressor plasmid was modified to include RNAII overproduction, these RFP oscillations were magnified 1.5-fold (bottom; P = 4 × 10⁻⁷). In both circuits, GFP (green) was expressed from the lux promoter on the activator plasmid. (d) Time series of average GFP signal in a representative cell chamber, showing regular synchronized oscillations produced by the circuit with RNAII overproduction. (e) A film strip of GFP fluorescence in a single chamber over approximately 2.5 periods of oscillation, produced by the same circuit as in d.
c
d
�PA
A (
thou
sand
s)
0
7
10 25 40
Fra
ctio
nos
cilla
ting
0.80.3
1.0
0 0.455
e
Modeling
GF
P (
AU
)
14
0
7
1,40
040
0
Model 1Model 2Expt 1Expt 2
Time (min)
600
800
1,00
01,
200
GF
P (
AU
)
0
4
2
Time (h)
0 4824 3612
Rich medium
b
Peak +105min
+210 +315 +420
Time (h)0 4824 3612
0
4
2
Minimal medium
a
GF
P (
AU
)
Figure 3 Robustness and model analysis of the DNA feedback circuit. (a) Cells containing the circuit modified for repressor plasmid amplification produced regular oscillations in an alternative microfluidic device with taller chambers and a larger volume. (b) Observations from the same microfluidic device and bacterial strain from a cultured with minimal salts medium instead of rich medium. Oscillations remained regular but shifted to a longer period. The images at the bottom show a composite of phase contrast and GFP fluorescence in a single chamber over two periods of oscillation. (c) Trajectories that show good agreement between the mean GFP intensities from our two models and the corresponding mean GFP intensities averaged across single representative microfluidic traps (experiments (Expt) 1 and 2). Experiments have been aligned in time so that the first peaks have a similar time. (d) Projection of these oscillations onto LuxI concentration (A) and plasmid copy number for the activator (PA). The model predicts that plasmid copy number does not require excessive variation, which is important to avoid plasmid extinction. (e) A robustness analysis of our model fit as a function of parameter perturbation strength η, suggesting that our model is reasonably robust in a high dimensional parameter space (supplementary Note 1). The curves represent the fraction of perturbed parameter sets that oscillated out of 100,000 parameter sets per η value. The statistical error (sample s.d. of the batch mean) is indicated by gray shading, and was determined by bootstrapping over 100 independent batches of 1,000 parameter sets.

© 2
017
Nat
ure
Am
eric
a, In
c., p
art
of
Sp
rin
ger
Nat
ure
. All
rig
hts
res
erve
d.
� ADVANCE ONLINE PUBLICATION Nature GeNetics
l e t t e r s
amplification, and we observed that LuxR transcription factor titra-tion counteracted ongoing positive feedback from the activator plasmid (Supplementary Fig. 9). This indirect interaction due to transcription factor titration points toward future opportunities to control DNA copy number modulation in applications.
The original genetic clock14 and toggle switch15 circuits firmly established the engineering pillar of the field of synthetic biology. While the two designs used similar forms of transcriptional regula-tion, they were also prescient with regard to the modern practice of parsing gene circuits into ‘analog’ and ‘digital’ components16–18. Subsequently, analog clocks evolved into platforms for exploring the synchronization of gene circuits in4,19 and between bacterial colo-nies20,21, whereas digital logic was generalized to complex intracel-lular algorithms22–29 and memory storage30,31. Our work establishes a framework for the engineering of a DNA ‘master clock’ at the colony level that can serve to coordinate digital subprocessing within single cells. More broadly, our results demonstrate how DNA copy number modulation can be used as a general tool for controlling gene expres-sion in synthetic biology.
MeThoDsMethods, including statements of data availability and any associated accession codes and references, are available in the online version of the paper.
Note: Any Supplementary Information and Source Data files are available in the online version of the paper.
AcknoWLedgMentsWe thank R. Johnson for assistance with microfluidic device design and fabrication, and P.J. Steiner and J. Humphries for helpful input and discussions. We are also grateful to the laboratory of B. Palsson for generously providing access to real-time PCR equipment. This work was supported by the NSF (award MCB-1616997 to J.H. and L.B.; award MCB-1330180 to W.M.).
AUtHoR contRIBUtIonsL.B. and J.H. contributed to the circuit design and development of the project. L.B. constructed the plasmids and strains, conducted the experiments, and analyzed results. W.M. and J.H. conducted the mathematical analysis and computational modeling. L.B. and W.M. prepared the figures, and L.B., W.M., and J.H. prepared the manuscript.
coMPetIng FInAncIAL InteRestsThe authors declare no competing financial interests.
Reprints and permissions information is available online at http://www.nature.com/reprints/index.html. Publisher’s note: Springer Nature remains neutral with regard to jurisdictional claims in published maps and institutional affiliations.
1. Slager, J., Kjos, M., Attaiech, L. & Veening, J.-W. Antibiotic-induced replication stress triggers bacterial competence by increasing gene dosage near the origin. Cell 157, 395–406 (2014).
2. Narula, J. et al. Chromosomal arrangement of phosphorelay genes couples sporulation and DNA replication. Cell 162, 328–337 (2015).
3. Marguet, P., Tanouchi, Y., Spitz, E., Smith, C. & You, L. Oscillations by minimal bacterial suicide circuits reveal hidden facets of host-circuit physiology. PLoS One 5, e11909 (2010).
4. Danino, T., Mondragón-Palomino, O., Tsimring, L. & Hasty, J. A synchronized quorum of genetic clocks. Nature 463, 326–330 (2010).
5. Stevens, A.M. & Greenberg, E.P. Quorum sensing in Vibrio fischeri: essential elements for activation of the luminescence genes. J. Bacteriol. 179, 557–562 (1997).
6. Gottesman, S., Roche, E., Zhou, Y. & Sauer, R.T. The ClpXP and ClpAP proteases degrade proteins with carboxy-terminal peptide tails added by the SsrA-tagging system. Genes Dev. 12, 1338–1347 (1998).
7. Wróbel, B. & Wegrzyn, G. Replication regulation of ColE1-like plasmids in amino wacid-starved Escherichia coli. Plasmid 39, 48–62 (1998).
8. Tomizawa, J. Control of ColE1 plasmid replication: binding of RNA I to RNA II and inhibition of primer formation. Cell 47, 89–97 (1986).
9. Selzer, G., Som, T., Itoh, T. & Tomizawa, J. The origin of replication of plasmid p15A and comparative studies on the nucleotide sequences around the origin of related plasmids. Cell 32, 119–129 (1983).
10. Panayotatos, N. DNA replication regulated by the priming promoter. Nucleic Acids Res. 12, 2641–2648 (1984).
11. Stricker, J. et al. A fast, robust and tunable synthetic gene oscillator. Nature 456, 516–519 (2008).
12. Mather, W., Bennett, M.R., Hasty, J. & Tsimring, L.S. Delay-induced degrade-and-fire oscillations in small genetic circuits. Phys. Rev. Lett. 102, 068105 (2009).
13. Cookson, N.A. et al. Queueing up for enzymatic processing: correlated signaling through coupled degradation. Mol. Syst. Biol. 7, 561 (2011).
14. Elowitz, M.B. & Leibler, S. A synthetic oscillatory network of transcriptional regulators. Nature 403, 335–338 (2000).
15. Gardner, T.S., Cantor, C.R. & Collins, J.J. Construction of a genetic toggle switch in Escherichia coli. Nature 403, 339–342 (2000).
16. Roquet, N. & Lu, T.K. Digital and analog gene circuits for biotechnology. Biotechnol. J. 9, 597–608 (2014).
17. Brophy, J.A. & Voigt, C.A. Principles of genetic circuit design. Nat. Methods 11, 508–520 (2014).
18. Rubens, J.R., Selvaggio, G. & Lu, T.K. Synthetic mixed-signal computation in living cells. Nat. Commun. 7, 11658 (2016).
19. You, L., Cox, R.S. III, Weiss, R. & Arnold, F.H. Programmed population control by cell-cell communication and regulated killing. Nature 428, 868–871 (2004).
20. Prindle, A. et al. A sensing array of radically coupled genetic ‘biopixels’. Nature 481, 39–44 (2011).
21. Basu, S., Gerchman, Y., Collins, C.H., Arnold, F.H. & Weiss, R. A synthetic multicellular system for programmed pattern formation. Nature 434, 1130–1134 (2005).
22. Moon, T.S., Lou, C., Tamsir, A., Stanton, B.C. & Voigt, C.A. Genetic programs constructed from layered logic gates in single cells. Nature 491, 249–253 (2012).
23. Purcell, O. & Lu, T.K. Synthetic analog and digital circuits for cellular computation and memory. Curr. Opin. Biotechnol. 29, 146–155 (2014).
24. Xie, Z., Wroblewska, L., Prochazka, L., Weiss, R. & Benenson, Y. Multi-input RNAi-based logic circuit for identification of specific cancer cells. Science 333, 1307–1311 (2011).
25. Kobayashi, H. et al. Programmable cells: interfacing natural and engineered gene networks. Proc. Natl. Acad. Sci. USA 101, 8414–8419 (2004).
26. Friedland, A.E. et al. Synthetic gene networks that count. Science 324, 1199–1202 (2009).
27. Tamsir, A., Tabor, J.J. & Voigt, C.A. Robust multicellular computing using genetically encoded NOR gates and chemical ‘wires’. Nature 469, 212–215 (2011).
28. Tabor, J.J. et al. A synthetic genetic edge detection program. Cell 137, 1272–1281 (2009).
29. Bonnet, J., Yin, P., Ortiz, M.E., Subsoontorn, P. & Endy, D. Amplifying genetic logic gates. Science 340, 599–603 (2013).
30. Siuti, P., Yazbek, J. & Lu, T.K. Synthetic circuits integrating logic and memory in living cells. Nat. Biotechnol. 31, 448–452 (2013).
31. Bonnet, J., Subsoontorn, P. & Endy, D. Rewritable digital data storage in live cells via engineered control of recombination directionality. Proc. Natl. Acad. Sci. USA 109, 8884–8889 (2012).

© 2
017
Nat
ure
Am
eric
a, In
c., p
art
of
Sp
rin
ger
Nat
ure
. All
rig
hts
res
erve
d.
Nature GeNeticsdoi:10.1038/ng.3915
oNLINe MeThoDsStrains and culturing. All plasmids were constructed by Gibson assembly fol-lowed by transformation into Mach1 (Invitrogen) chemically competent E. coli. Plasmids were verified by Sanger sequencing before transformation into E. coli strain MG1655. For strains containing quorum-sensing constructs, growth on plates was limited to a maximum of 10 h, and 0.2% (wt/vol) glucose was added to all plates and media used during cloning and transformation to prevent auto-induction. All experiments were carried out in the MG1655 strain with the appropriate antibiotics: 50 µg/ml kanamycin for strains containing ColE1 origin plasmids, and 34 µg/ml chloramphenicol for strains containing p15A origin plasmids. For the experiments with strain LABS1 involving induction of I-SceI with arabinose, cells were cultured in low-density conditions that pre-vented auto-induction. The AHL inducer used in experiments was 3-oxo-C6-HSL. A detailed description of all strains is available in Supplementary Table 1, and the corresponding plasmid diagrams are shown in Supplementary Figures 1 and 9. Plasmid sequence accession numbers are provided in the “Data avail-ability” section. The doubling time of oscillator strains LABS2 and LABS4 was measured in a 96-well plate in rich LB medium with antibiotics as 20.7 min (n = 6 wells for each strain; s.e.m. = 0.2 min).
Microfluidics and microscopy. For each experiment, the appropriate E. coli strain was seeded from a −80 °C glycerol stock into 3 ml of LB supplemented with 0.2% (wt/vol) glucose, the appropriate antibiotics, and 0.075% (wt/vol) Tween 20. After growth for 8–12 h at 37 °C in a shaking incubator, the cul-ture was diluted 100-fold into 3 ml of the same medium and grown for one additional hour. This culture was concentrated by centrifugation at 5,000g for 1 min and resuspended in 3 µl of the same medium. Cells were loaded by degas-driven flow into microfluidic chambers via the waste port. Microfluidic experiments were conducted with media supplemented with appropriate anti-biotics and 0.075% (wt/vol) Tween 20. Experiments involving lux-mediated positive feedback were done with media containing a low background con-centration of AHL, which was also required to induce oscillations: 5 nM AHL for experiments using rich LB medium, and 1 nM AHL for experiments using minimal medium. The minimal medium used was M9 salts medium supple-mented with 0.4% (vol/vol) glycerol, 0.2% (wt/vol) casamino acids, and 1 µM thiamine. For experiments involving induction with chemical inducers, the medium source was switched manually at the device inlet at the times indicated in figures. Time-lapse images were acquired on a Nikon TI microscope fitted with a Lumencor SOLA SE light engine for fluorescence imaging. Average fluorescence values across each chamber were determined with Fiji software32. A single baseline fluorescence value was measured from a region outside the chamber for each time series and used for background subtraction. Schematics of the microfluidic devices are shown in Supplementary Figures 3 and 5.
For comparison of the oscillation amplitude of RFP in the two circuits, we de-trended RFP time series by subtracting a moving average over a window equal to the period of each circuit (152 min for the first circuit, 128 min for the modified circuit). De-trended time series were used to measure peak-to-trough amplitudes for each time series, which were averaged and normalized by the mean RFP fluorescence for the time series. Statistical significance was determined by independent two-sample t-test, using mean-adjusted average amplitude values for each time series with n = 40 peaks from seven time series for the first circuit and n = 42 peaks from six time series for the modified circuit, with d.f. = 80.
Relative copy number determination by qPCR and fluorescence. A culture was seeded from a −80 °C glycerol stock into 3 ml of LB medium supplemented with 0.2% (wt/vol) glucose. After 12 h of growth at 37 °C in a shaking incubator, the culture was diluted 100-fold into fresh LB medium without glucose and grown for an additional 2 h to ensure that cells were in the exponential growth phase.
The culture was then diluted into 250-ml flasks, each containing 50 ml of prewarmed LB, and chemical inducer was added: 0.2% (wt/vol) arabinose for copy number repression with strain LABS1 (sterile water for control), and 450 nM AHL for copy amplification with strain LABS3 (DMSO for control). After growth in the presence of inducer (3 h with arabinose for LABS1, 1.5 h with AHL for LABS3), 100-µl samples were taken from each flask for qPCR, heated at 95 °C for 10 min, and then immediately frozen at −20 °C for subsequent qPCR analysis, as described by Škulj et al.33.
For fluorescence measurements, cultures were normalized to the same OD600 and pipetted into 10 replicate wells in a 96-well plate, and readings were taken with a Tecan Infinite M200Pro plate reader. A culture of wild-type E. coli strain MG1655 at the same OD600 was used to measure background fluorescence signal, using the mean of ten replicate wells. Cultures were in the exponential growth phase at the time of sampling, with OD600 readings of 0.1–0.2. Statistical significance for RFP fluorescence measurements was determined by independent two-sample t-test, with d.f. = 18.
qPCR primers were validated in a five-point template dilution series to ensure that the amplification efficiency for each pair was >90%. The genomic reference primers chosen were as described by Škulj et al.33. Three sets of prim-ers were designed, targeting the ColE1 plasmid in different locations: primer set A with one primer on either side of the I-SceI cut site, primer set B begin-ning 147 bp from the cut site in the kanamycin-resistance gene, and primer set C beginning 2,722 bp from the cut site in the gfp gene. The same genomic reference primer set and primer set C were also used in a separate experi-ment to measure p15A plasmid amplification. qPCR primer sequences are presented in Supplementary Table 2. For relative copy number determination, cell culture samples were thawed, diluted 2,000-fold in sterile water, and added at a ratio of 2:3 to a master mix consisting of appropriate primers (500 nM final concentration) added to Bio-Rad iQ SYBR Green Supermix. Each reac-tion condition was pipetted into 10 replicate wells in a 96-well PCR plate, and threshold values were determined with a Bio-Rad CFX Connect Real-Time PCR detection system with the associated software. Melt curves were examined for each reaction well to verify the presence of a single amplification product. Relative copy numbers were calculated via the ∆∆Ct method, and error bars were calculated by propagation of the s.e.m. Ct values. Statistical significance for ∆Ct values was determined by independent two-sample t-test with the mean ∆Ct values and associated propagated error with d.f. = 18.
Quantitative modeling. Model creation and fitting were done with the pack-age COPASI34 and custom Python scripts. Details concerning the quantitative modeling appear in Supplementary Note 1.
Data availability. Complete annotated sequences for both repressor plas-mids and the activator plasmid are available in GenBank under accession numbers MF033067, MF033068, and MF033069. Plasmids, bacterial strains, and modeling files and scripts are available from the corresponding author upon request.
32. Schindelin, J. et al. Fiji: an open-source platform for biological-image analysis. Nat. Methods 9, 676–682 (2012).
33. Škulj, M. et al. Improved determination of plasmid copy number using quantitative real-time PCR for monitoring fermentation processes. Microb. Cell Fact. 7, 6 (2008).
34. Hoops, S. et al. COPASI—a complex pathway simulator. Bioinformatics 22, 3067–3074 (2006).
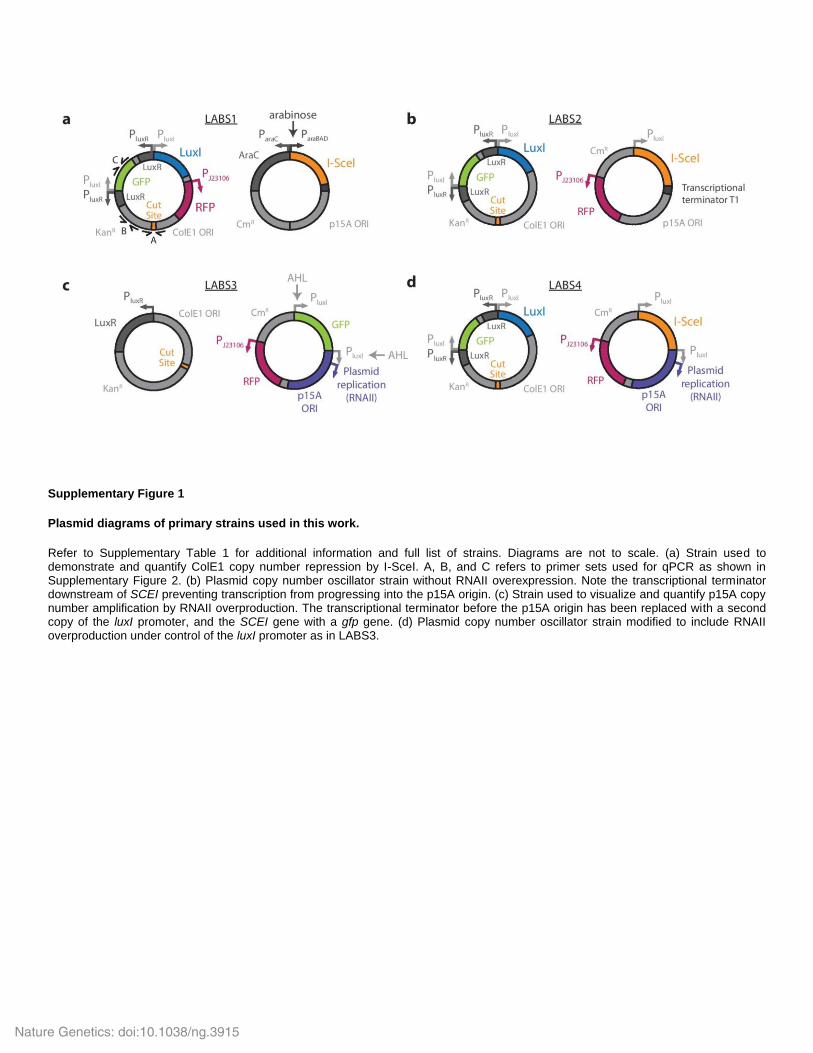
Supplementary Figure 1
Plasmid diagrams of primary strains used in this work.
Refer to Supplementary Table 1 for additional information and full list of strains. Diagrams are not to scale. (a) Strain used to demonstrate and quantify ColE1 copy number repression by I-SceI. A, B, and C refers to primer sets used for qPCR as shown in Supplementary Figure 2. (b) Plasmid copy number oscillator strain without RNAII overexpression. Note the transcriptional terminator downstream of SCEI preventing transcription from progressing into the p15A origin. (c) Strain used to visualize and quantify p15A copy number amplification by RNAII overproduction. The transcriptional terminator before the p15A origin has been replaced with a second copy of the luxI promoter, and the SCEI gene with a gfp gene. (d) Plasmid copy number oscillator strain modified to include RNAII overproduction under control of the luxI promoter as in LABS3.
Nature Genetics: doi:10.1038/ng.3915

Supplementary Figure 2
qPCR analysis of ColE1 copy number repression.
qPCR analysis of ColE1 copy number repression after I-SceI induction with 0.2% w/v arabinose for 3 hours, using multiple primer sets annealing at different locations around the plasmid. Results demonstrate that after being cut by I-SceI, the majority of linear plasmids are quickly degraded. Primer set A is the same that used to quantify copy number in Figure 1, a. Mean and s.e.m. are displayed.
Statistical significance was calculated by independent 2-sample t test with d.f. = 18, yielding P = 6 × 10-12
for primer set A, P = 9 × 10-
7 for primer set B, and P = 2 × 10
-7 for primer set C. See Methods for detailed description of experimental design, Supplementary
Figure 1 for detailed plasmid diagrams, and Supplementary Table 2 for primer sequences.
Nature Genetics: doi:10.1038/ng.3915

Supplementary Figure 3
Schematic of microfluidic device 1.
Each flow channel feeds growth medium to a single cell chamber (displayed in blue), preventing AHL diffusion between individual
chambers. Flat rectangular chambers (x, y, z = 100 μm, 85 μm, 1.6 μm) allow visualization of single E. coli cells. Flow channels are 30
μm high.
Nature Genetics: doi:10.1038/ng.3915

Supplementary Figure 4
qPCR analysis of p15A copy number amplification by RNAII overexpression.
Copy number amplification after 90 minutes of induction with 450 nM AHL, where Pluxl promoter induction leads to RNAII overexpression from the p15A origin. Mean and s.e.m. are displayed. Statistical significance was calculated by independent 2-sample t test with d.f. = 18, yielding P = 3 × 10
-8 for plasmid copy number and P = 3 × 10
-4 for RFP fluorescence. See Methods for detailed
description of experimental design, Supplementary Figure 1 for detailed plasmid diagrams, and Supplementary Table 2 for primer sequences.
Nature Genetics: doi:10.1038/ng.3915
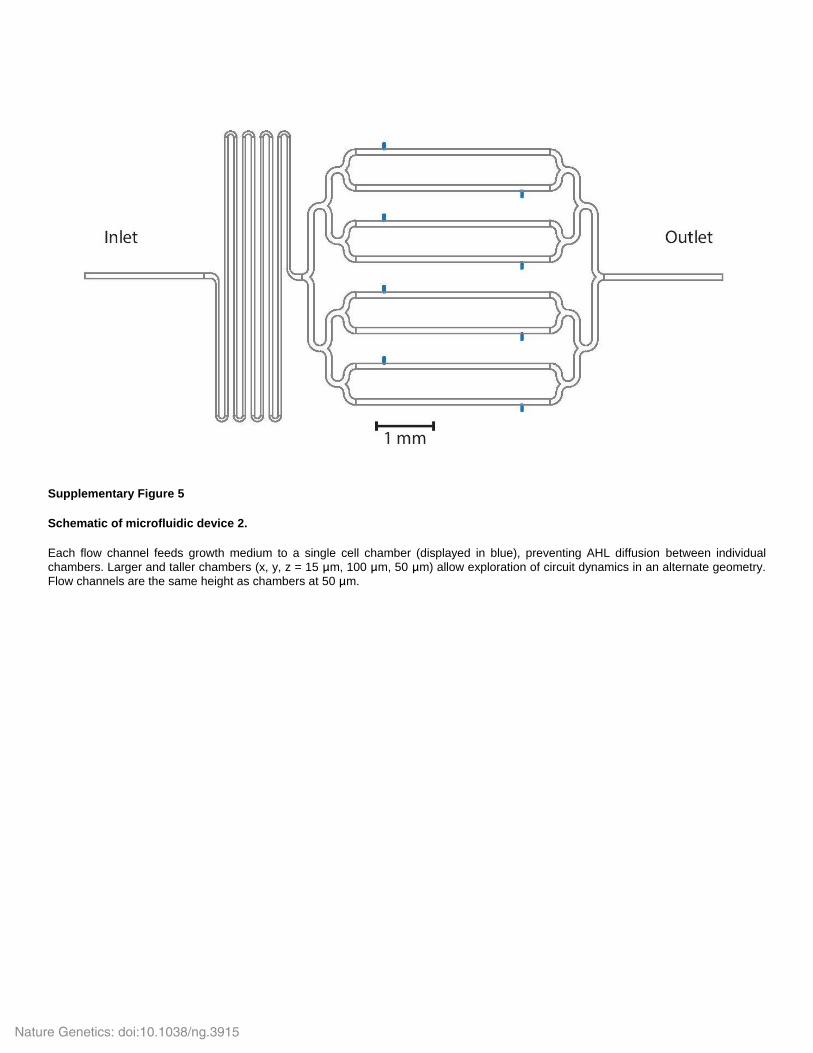
Supplementary Figure 5
Schematic of microfluidic device 2.
Each flow channel feeds growth medium to a single cell chamber (displayed in blue), preventing AHL diffusion between individual
chambers. Larger and taller chambers (x, y, z = 15 μm, 100 μm, 50 μm) allow exploration of circuit dynamics in an alternate geometry.
Flow channels are the same height as chambers at 50 μm.
Nature Genetics: doi:10.1038/ng.3915

Supplementary Figure 6
PCA analysis of sensitive parameters.
Robustness analysis was done to identify which parameters most sensitively control oscillations (see Supplementary Note for details). For (a) model 1 and (b) model 2, we formed non-oscillatory parameter sets from the data used to generate Figure 3, e, and we determined the principal components with the lowest coefficient of variation (a proxy for sensitivity in this set). We examined
representative non-oscillatory sets using η = 0.3 and η = 0.1 when studying model 1 and model 2, respectively, containing non-oscillatory parameter set sizes of 5,869 and 6,468, respectively. The principal component with the least coefficient of variation was found using standard techniques, the absolute magnitude for each parameter value was taken, and the sum of principal components was normalized to 1. For each model, this process was repeated using 1,000 ensembles containing a random 20% of the full non-oscillatory set. We applied bootstrapping to determine the mean (blue bars) and standard deviation (red lines) of the principal
component with the least coefficient of variation. Overall, the enzymatic velocity μ was consistently a sensitive parameter.
Nature Genetics: doi:10.1038/ng.3915

Supplementary Figure 7
The fraction of oscillatory models with a scan of two oscillator parameters.
(a) The cutting rate constant, kc, for I-SceI was varied from 0 to 10-times its best fit value. All other parameters were varied using a
uniform distribution ranging ± 5% (similarly as done for Figure 3, e for η = 0.10, but using 100 ensembles of size 100 each to estimate error). The dashed line indicates the best fit value. (b) We similarly investigated robustness for the cooperativity coefficient n, which was scanned from 1 to 8. The observation that model 2 for both (a) and (b) has fewer nearby parameter sets that oscillate in the vicinity of the best fit is consistent with the picture that model 2 is tuned closer to a bifurcation point.
Nature Genetics: doi:10.1038/ng.3915
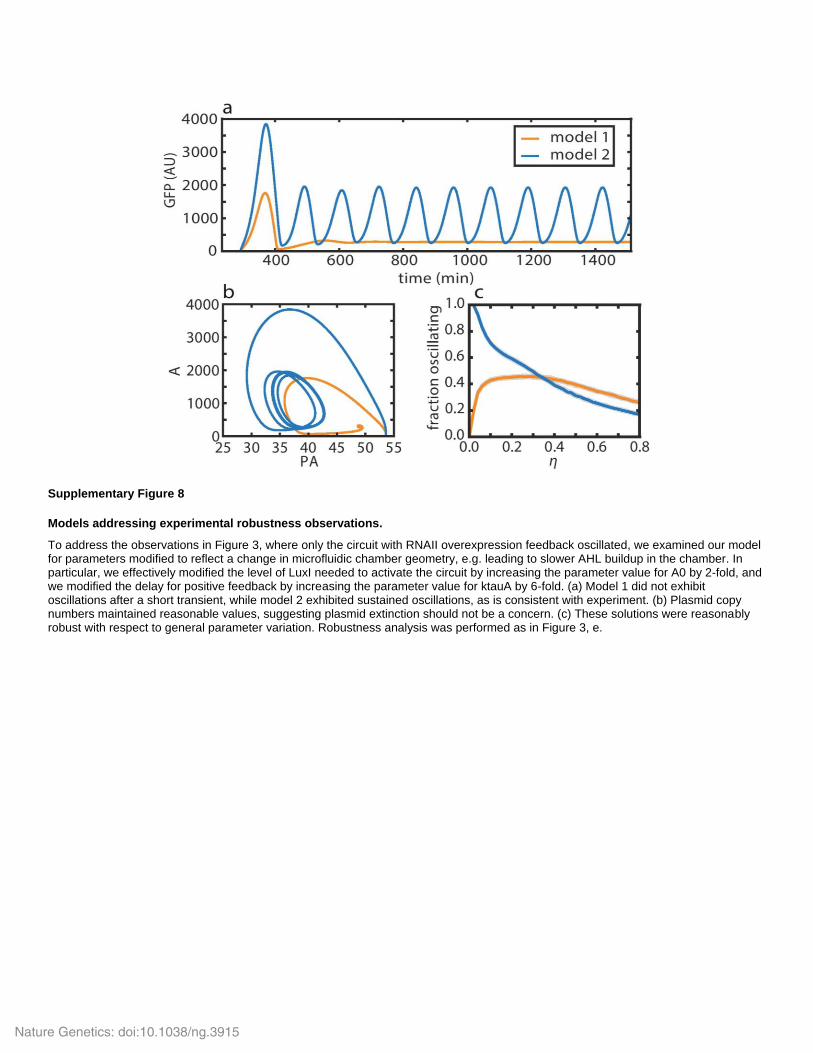
Supplementary Figure 8
Models addressing experimental robustness observations.
To address the observations in Figure 3, where only the circuit with RNAII overexpression feedback oscillated, we examined our model for parameters modified to reflect a change in microfluidic chamber geometry, e.g. leading to slower AHL buildup in the chamber. In particular, we effectively modified the level of LuxI needed to activate the circuit by increasing the parameter value for A0 by 2-fold, and we modified the delay for positive feedback by increasing the parameter value for ktauA by 6-fold. (a) Model 1 did not exhibit oscillations after a short transient, while model 2 exhibited sustained oscillations, as is consistent with experiment. (b) Plasmid copy numbers maintained reasonable values, suggesting plasmid extinction should not be a concern. (c) These solutions were reasonably robust with respect to general parameter variation. Robustness analysis was performed as in Figure 3, e.
Nature Genetics: doi:10.1038/ng.3915

Supplementary Figure 9
Transcription factor titration by plasmid copy number amplification.
p15A copy number amplification counteracts positive feedback from the activator plasmid even without cutting by I-SceI. The activator plasmid used here lacks an I-SceI cut site. The repressor plasmid has been modified to allow inducible plasmid amplification with IPTG, driven by the lac-repressible PLlacO1 promoter. Both luxI promoters are left intact, each containing a single LuxR binding site, however the transcriptional terminator downstream of the luxI promoters prevents transcription from progressing into the p15A origin. RFP reports on p15A copy number and GFP on lux activation state. A small amount of AHL (5 nM) is introduced at t = 1 hour to start lux
positive feedback from the activator plasmid, causing a rise in GFP signal. At t = 2 hours, 100 μM IPTG is added in addition, causing amplification of the p15A copy number as seen by the rising RFP signal. IPTG is removed again at t = 6 hours, which allows p15A copy number to slowly drop back to natural levels by dilution due to cell division, at which point positive feedback from the activator plasmid resumes.
Nature Genetics: doi:10.1038/ng.3915

Table of Strains
Supplementary Table 1. Strains used in this work and gene expression constructs found on each plasmid. All experiments were conducted in E. coli MG1655. LABS5 is in strain MG1655-z1, which is modified to express high levels of constitutive lac repressor from the genome. RFP refers to mKate2 and GFP refers to sfGFP. Constructs with promoter ``Plux'' and denoted ``+ luxR'' contain the entire bi-directional lux promoter (both PluxI and PluxR) and the luxR gene. J23106 is a medium-strength constitutive promoter. PLlacO1 is an IPTG-inducuble (i.e. LacI-repressible) promoter. SsrA tags used here code for the amino acids AANDENYALAA and are inserted directly before the stop codon. Plasmid diagrams of LABS1-4 are available in Supplementary Figure 1 and a diagram of LABS5 is available in Supplementary Figure 9.
Strain Construct(s) on ColE1 origin plasmid
Construct(s) on p15A origin plasmid Referenced in Figure
LABS1 Plux-‐luxI-‐ssrA + luxR Plux-‐gfp-‐ssrA + luxR pJ23106-‐rfp (no ssrA)
ParaBAD-‐ISceI (no ssrA) Fig. 1, a and b Supplementary Fig. 2
LABS2 Plux-‐luxI-‐ssrA + luxR Plux-‐gfp-‐ssrA + luxR
PluxI-‐ISceI-‐ssrA PJ23106-‐rfp (no ssrA)
Fig. 1, c and d Fig. 2, c: top
LABS3 PluxR-‐luxR
PluxI-‐gfp-‐ssrA PJ23106-‐rfp (no ssrA) (with copy amplification: PluxI-‐RNAII)
Fig. 2, a and b Supplementary Fig. 4
LABS4 Plux-‐luxI-‐ssrA + luxR Plux-‐gfp-‐ssrA + luxR
PluxI-‐ISceI-‐ssrA PJ23106-‐rfp (no ssrA) (with copy amplification: PluxI-‐RNAII)
Fig. 2, c: bottom, d, and e Fig. 3, a and b
LABS5 Plux-‐luxI-‐ssrA + luxR Plux-‐gfp-‐ssrA + luxR (no I-‐SceI cut site)
PluxI-‐ISceI-‐ssrA + 2nd PluxI (terminated) PJ23106-‐rfp (no ssrA) (with IPTG-‐inducible copy amplification: PLlacO1-‐RNAII)
Supplementary Fig. 9
Nature Genetics: doi:10.1038/ng.3915

Table of qPCR Primers
Supplementary Table 2. Primers used for determination of relative copy numbers by qPCR. The same genomic reference primers were used in all qPCR experiments. In addition, primer sets A, B, and C were used for measuring copy number repression using strain LABS1, while primer set C was used for measuring copy number amplification using strain LABS3.
Primer Set Forward Primer (5’ to 3’) Reverse Primer (5’ to 3’)
Genomic GCGAGCGATCCAGAAGATCT GGGTAAAGGATGCCACAGACA
A GACGCTCAGTGGAACGAAA GTAATGACCTCAGAACTCCATCTG
B CTCGTCAAGAAGGCGATAGAAG CGTTGGCTACCCGTGATATT
C CCATTACCTGTCGACACAATCT GTGTAATCCCAGCAGCAGTTA
Nature Genetics: doi:10.1038/ng.3915

Supplementary Note: Synchronized DNA cycling across abacterial population
1 Details of the Quantitative Model
We explored a number of models for the experimental oscillators. The simplest models consid-
ered the dynamics for the concentrations of LuxI, I-SceI, GFP, and the plasmid expressing LuxI,
with the constraint that the concentrations of GFP and I-SceI are simply proportional to LuxI.
These two-dimensional models with appropriate parameter values produced oscillations reminis-
cent of experimental trajectories (results not shown), which demonstrates that the basic elements
of gene regulation-based positive feedback coupled to plasmid copy number regulation-based neg-
ative feedback are theoretically sufficient for oscillations.
These suggestive results prompted us to explore a more complex empirical model with addi-
tional elements, leading to a model that includes gene regulation-based positive feedback, plasmid
copy number regulation-based negative feedback, intracellular delay in feedback, and proteolytic
queueing effects, all of which are known to potentially be important based on the design of the
circuit and based on prior studies. These additional details led to a model that can both describe
aspects of the experimental data and also be relatively robust with respect to parameter variation,
as Supplementary Note Section 3 will discuss. It is worth noting that we found a few qualitatively
similar parameter sets for the model that all fit experimental data comparably, so we picked our
final parameter set based largely on robustness.
1
Nature Genetics: doi:10.1038/ng.3915

The model considers the dynamics of five key variables: the concentrations of LuxI (la-
beled A), I-SceI (labeled S), GFP (labeled G), the plasmid expressing LuxI (labeled PA), and the
plasmid expressing I-SceI (labeled PS). Concentrations are indicated by square brackets, e.g. the
concentration [A] for species A. Furthermore, we include explicit dynamics for Ai, Si, PAi, and
PSi (i = 1,2, ...5), which effectively model a delay in the production of species or perhaps a delay
in the feedback on the species. These effective intermediate species were introduced, because we
expect delay to exist for both protein production and plasmid production in the experimental con-
text. Note that we use the concentration [A] as an effective proxy for the concentration (up to some
scale) of other activating species, such as AHL, to simplify our system.
These species are governed by the following reactions, where the reaction velocities are
assumed to have appropriate mass action terms included. Production of precursors for activator
and repressor follow from the respective reactions
PAF([A])−−−→ PA+A1 (1)
PSF([A])−−−→ PS+S1 (2)
Note that the velocity of these reactions depends linearly on plasmid concentrations due to mass
action terms, which allows plasmid copy number to influence gene expression. F([A]) encodes
gene regulation by the act of LuxI producing AHL, which in turn activates pLuxI promoters. F([A])
can be written
F([A]) =α ·
(1+ f ·
([A]+H0
A0
)n)1+
([A]+H0
A0
)n (3)
2
Nature Genetics: doi:10.1038/ng.3915
where α is the maximum production rate (per plasmid), f characterizes the strength of gene ac-
tivation by A (value constrained by f ≥ 1), n is the cooperativity of gene activation (set to n = 2,
but allowed to vary in our robustness analysis), A0 is the value of [A] required to strongly activate
gene expression, and H0 allows for a generally time-dependent background level of AHL that can
stimulate activation. We assume that the background level of H0 increases suddenly from a0 to a1
at a time t0, obeying the equation
H0 = a0 · (1−θ(t− t0))+a1 ·θ(t− t0) (4)
with θ the Heaviside step function.
Production of the intermediates, A1 and S1, eventually leads to the arrival of mature forms A
and S, respectively, via the reactions
AiktauA−−−→ Ai+1 , i = 1,2, ..,4 (5)
A5ktauA−−−→ A (6)
SiktauS−−−→ Si+1 , i = 1,2, ..,4 (7)
S5ktauS−−−→ S (8)
with ktauA and ktauS being rate constants that characterize the delay in production (effectively
a feedback delay), with respective associated mean delay 5/ktauA and 5/ktauS. These delays
appeared to be important to fit the initial large pulse of GFP seen in experiment.
The proteins A and S are tagged for rapid degradation by the protease ClpXP, so we model
3
Nature Genetics: doi:10.1038/ng.3915

their degradation using enzymatic kinetics. This is modeled by the reactions
AGA([A],[S])−−−−−−→∅ (9)
SGS([A],[S])−−−−−−→∅ (10)
with functions
GA([A], [S]) =µν1
K +ν1[A]+ν2[S](11)
GS([A], [S]) =µν2
K +ν1[A]+ν2[S](12)
where µ is the maximum degradation velocity, and the parameters K, ν1, and ν2 characterize the
affinities of protein to the protease. Recall that mass action terms should be included in the reaction
velocities.
Cutting of PA is modeled by a bimolecular reaction that allows S to degrade PA
PA+S kc−−→ S (13)
with kc the cutting rate constant. We assume then that the act of cutting immediately degrades the
activator plasmid, which is likely reasonable given that we expect linearized DNA to be degraded
within the cell. It is possible that linearized DNA could re-circularize, but we do not model this. It
is also possible that re-circularization may only effectively modify (reduce) the rate constant kc.
Proteins are assumed to be diluted due to cell growth and division. This is modeled by the
4
Nature Genetics: doi:10.1038/ng.3915

reactions
Aga−−→∅ (14)
Sgs−−→∅ (15)
with ga = gs = ln2/30.0 min. the dilution rate. Plasmids are assumed to be degraded also by
dilution, so we set
PA k−−→∅ (16)
PS k−−→∅ (17)
with k = ln2/30.0 min. We will allow ga, gs, and k to be varied independently in our robustness
analysis, even though we set them to have the same value here.
For the oscillator without the effect of read-through on the repressor plasmid (termed Model 1),
we model plasmid production by the production of an intermediate, e.g. PA1 representing a par-
tially replicated plasmid. Production follows from the reactions
∅ k ·PA0−−−→ PA1 (18)
∅ k ·PS0−−−→ PS1 (19)
where the parameters PA0 and PS0 allow different plasmid copy numbers for activator and re-
pressor plasmids. Plasmid intermediates eventually lead to an complete plasmid by the additional
5
Nature Genetics: doi:10.1038/ng.3915

reactions
PAiktauPA−−−−→ PAi+1 , i = 1,2, ..,4 (20)
PA5ktauPA−−−−→ PA (21)
PSiktauPS−−−−→ PSi+1 , i = 1,2, ..,4 (22)
PS5ktauPS−−−−→ PS (23)
which are analogous to the corresponding reactions for A and S. Notice that we do not allow plas-
mid extinction using this scheme, but we will check self-consistently that plasmid copy numbers
do not become so low that extinction is likely to be an issue.
For the oscillator with the effect of read-through affecting repressor plasmid copy number
(Model 2), we replaced the production reaction for PS1 by the reaction
∅ R([A])−−−→ PS1 (24)
with
R([A]) = k ·PS0 ·f PS1+ f PS2 ·
([A]APS
)nPS
1+(
[A]APS
)nPS (25)
with parameters f PS1, f PS2, APS, and nPS parameters characterizing this function. We set
f PS1 = 1 and nPS = 1, but we allow these parameters to vary in our robustness analysis. Note
that again, we use [A] as a proxy for the concentration (to to some scale) of other activator species.
The concentration of GFP ([G]) is assumed to always be proportional to [A], though the
proportionality constant is allowed to vary slightly from experiment to experiment to account for
6
Nature Genetics: doi:10.1038/ng.3915

variations in lamp intensity, etc. Thus, GFP effectively does not play any important dynamical role
in the model.
Finally, all concentrations are divided by a fictitious standard volume, V 0. We normalize this
volume to V 0 = 1, though this parameter is allowed to vary in our robustness analysis.
2 Fitting the Model Using COPASI
We encoded our model into the simulation package COPASI for basic simulation and fitting. CO-
PASI provides several advantages: an environment that is readily installed on a variety of platforms,
an ability to import from and export to a variety of model formats, and inclusion of numerous tasks
(including model fitting) that can be run on models.
The numerous unknown parameters in the model prompted us to attempt automated fitting of
the time-course data to determine these parameters. Within COPASI, we fitted the model to exper-
imental data by (1) importing two representative experimental mean GFP trajectories (averaging
across a whole microfluidic chamber) for the circuits without and with read-through feedback, (2)
configuring COPASI’s Parameter Estimation task to simultaneously fit these two experimental re-
sults to our model, (3) ensuring the model has run to near steady state before experimental data
is compared to the model (by allowing the first pulse of the experimental oscillator to be occur
at a late time, roughly at 300 min.), and (4) running the Parameter Estimation task with given
constraints on parameter sizes and with a given fitting method. We used deterministic integration
to simulate the model when comparing it to experimental data, using the LSODA method with
7
Nature Genetics: doi:10.1038/ng.3915

relative tolerance 10−6 and absolute tolerance 10−12. Fitted parameters followed by attempting
to minimize the root-mean-square error between the model’s trajectory for GFP concentration and
the measured mean GFP in experiment. Recall that we assume GFP concentration is proportional
to [A].
The above step (4) was executed many times to find a model that optimized accuracy. First,
global optimization techniques, such as the COPASI method “Evolutionary Strategy,” were used to
find broad regions of parameter space with accurate solutions. These methods were followed with
local optimization methods in COPASI, such as “Hooke and Jeeves,” to further increase accuracy.
We ultimately found a deterministic ODE model that was both accurate and exhibited reasonable
robustness, the latter of which is discussed in the next section. We use the term “Model 1” for the
model where read-through does not affect repressor plasmid copy number, while we use the term
“Model 2” for the model where read-through does affect repressor plasmid copy number. These
models share the same parameters, except that Model 2 has additional parameters to characterize
the potential effects of read-through.
Our final parameter set for our model fit is reported in Supplementary Note Table 1.
3 Robustness Analysis of the Quantitative Model
We checked whether our model was robust, i.e. it produces oscillations for a wide range of param-
eter values. For models with few (∼ 2) parameters, robustness can be checked using bifurcation
diagrams. However, our model has many parameters, and a standard bifurcation analysis may not
8
Nature Genetics: doi:10.1038/ng.3915

properly reflect any underlying robustness. To address these concerns, we performed a robustness
analysis that samples many parameter sets around our fitted parameter set, and we tested whether
these parameter sets corresponded to oscillations. Custom Python software was written to trans-
late C-code output from COPASI into fast Python code, since COPASI was apparently unable to
perform the robustness analysis we desired. The scipy.integrate.odeint module in the scipy library
was used, with relative tolerance 10−6 and absolute tolerance 10−12.
Robustness was explored as follows. We scanned a parameter η from 0.00 to 0.80 in incre-
ments of 0.02. For each value of η , we constructed 100 parameter ensembles that each consisted
of 1000 random parameter sets. A random parameter set is generated by multiplying the respective
fitted value of every parameter in Supplementary Note Table 1 by an independent random number
uniformly distributed between 1− (η/2) and 1+(η/2). This samples a large hypervolume of pa-
rameter space that is difficult to obtain using bifurcation diagrams. A trajectory was determined to
be oscillatory if the standard deviation (across time) of the trajectory [A](t) exceeded 10% of the
mean (across time) during a specific window of time. For simulations starting at time t = 0, this
window of time was 814-1512 min. for Model 1 (without read-through effects) and 862-1510 min.
for Model 2 (with read-through effects). The time each model was induced was t0 = 288 min.
Figure 3, e reports the robustness based on this analysis. These statistics support that Model 1
is generally more robust than Model 2 with respect to oscillations. We suspect this is due to
Model 2 being tuned closer to a bifurcation such as a Hopf bifurcation, which would lead to GFP
oscillations that appear more sinusoidal in shape, i.e. not relaxing to zero during each oscillation.
9
Nature Genetics: doi:10.1038/ng.3915

The trajectories of mean GFP for the experimental construct with read-through regulation exhibit
similar oscillations as in Model 2, i.e. oscillations that do not relax to zero (background) intensity.
Thus, our numerical results and this overall logic suggest that the experimental construct with
read-through regulation should be less robust.
We quantified the most sensitive parameters with respect to robustness using the same data
set as above (the scan of η). For each ensemble of 1000 trajectories, we construct a non-oscillatory
set consisting only of parameters not leading to oscillations (by our above test). Within this non-
oscillatory set, the principal component with the lowest coefficient of variation (standard deviation
divided by the mean) was determined. The idea is that the most sensitive parameters would have
a narrow distribution in the non-oscillatory set, since a parameter that does not heavily influence
the stability of oscillations would have a wide distribution (sampling most of the default fractional
range 1− (η/2) and 1+(η/2)). We report out results from this principal component analysis in
Supplementary Figure 6. We found that the degradation velocity µ was a key sensitive parameter
in this investigation, which is not terribly surprising given the important role of degradation in
oscillatory dynamics.
Nature Genetics: doi:10.1038/ng.3915

Name Description Value Name Description Value
A0parameter for the pro-duction rate of LuxIand I-SceI
1105.9400 gs dilution rate of I-SceI 0.0231
APSparameter for RNAIIoverexpression copynumber control
929.4370 k dilution rate of plasmid 0.0231
K parameter for enzy-matic degradation 100.7700 kc I-SceI cutting rate con-
stant 4.8375×10⁻⁵
PA0 scale of activator plas-mid copy number 53.7116 ktauA
effective delay rateconstant for LuxIproduction
0.1810
PS0 scale of repressorplasmid copy number 11.3784 ktauPA
effective delay rateconstant for activatorplasmid production
0.2141
V0 volume of cell in natu-ral units 1.0 ktauPS
effective delay rateconstant for repressorplasmid production
0.1155
a0the background levelof AHL before induc-tion (AU)
0.0 ktauSeffective delay rateconstant for I-SceIproduction
0.3536
a1the background levelof AHL after induction(AU)
2296.6800 µ
enzymatic degra-dation velocity ofproteins
698.8910
α
maximum productionrate per plasmid forLuxI and I-SceI
0.6582 ncooperativity parame-ter for LuxI and I-SceIproduction
2
f
fold activation for satu-rating AHL vs. absentAHL in for LuxI and I-SceI production
27.7632 nPS
cooperativity parame-ter for RNAII overex-pression copy numbercontrol
1
fPS1 parameter for RNAIIfeedback 1.0 ν1
parameter for enzy-matic degradation 3.4699
fPS2 parameter for RNAIIfeedback 3.4870 ν2
parameter for enzy-matic degradation 4.9963
ga dilution rate of LuxI 0.0231
Supplementary Note Table 1: Parameter names and corresponding values for our opti-mized model fit. Time is in units of minutes. Concentrations and other physical units aredimensionless (AU).
Nature Genetics: doi:10.1038/ng.3915


![The Janthinobacterium sp. HH01 Genome Encodes a · PDF filehomologue identified in the HH01 genome was designated jqsA.In ... on the E. coli strain OP50 [32]. Clean eggs and synchronized](https://img.pdfslide.us/doc/110x75/5aa1b7a67f8b9a1f6d8c4cbe/the-janthinobacterium-sp-hh01-genome-encodes-a-identified-in-the-hh01-genome.jpg)