Embed Size (px)
Citation preview
Lettershttps://doi.org/10.1038/s41566-018-0297-y
1State Key Laboratory for Mesoscopic Physics and Collaborative Innovation Center of Quantum Matter, School of Physics, Peking University, Beijing, People’s Republic of China. 2Department of microelectronics and nanoelectronics, Tsinghua University, Beijing, People’s Republic of China. 3Collaborative Innovation Center of Extreme Optics, Shanxi University, Shanxi, People’s Republic of China. 4Department of Electrical and Computer Engineering, National University of Singapore, Singapore, Singapore. 5Institute of Microelectronics, Tsinghua University, Beijing, People’s Republic of China. 6Department of Electrical and Systems Engineering, Washington University in St. Louis, St. Louis, MO, USA. 7Present address: Thomas J. Watson, Sr., Laboratory of Applied Physics, California Institute of Technology, Pasadena, CA, USA. 8These authors contributed equally: Xueyue Zhang, Qi-Tao Cao. *e-mail: [email protected]
Second-order nonlinear optical processes lie at the heart of many applications in both classical and quantum regimes1–3. Inversion symmetry, however, rules out the second-order non-linear electric-dipole response1,4,5 in materials widely adopted in integrated photonics (for example, SiO2, Si and Si3N4). Here, we report nonlinear optics induced by symmetry breaking6–10 at the surface of an ultrahigh-Q silica microcavity under a sub-milliwatt continuous-wave pump. By dynamically coordinat-ing the double-resonance phase matching, a second harmonic is achieved with an unprecedented conversion efficiency of 0.049% W−1, 14 orders of magnitude higher than that of the non-enhancement case11. In addition, the nonlinear effect from the intrinsic symmetry breaking at the surface8,12 can be identified unambiguously, with guided control of the pump polarization and the recognition of the second-harmonic mode distribution. This work not only extends the emission frequency range of silica photonic devices, but also lays the groundwork for applications in ultra-sensitive surface analysis.
The second-order nonlinearity in centrosymmetric materi-als originates from both the asymmetric potential experienced by the surface/interface layer and the bulk multipole response7,8. Different from breaking the bulk inversion symmetry, such as by exerting external strain13,14 or an electric field15, second-harmonic generation (SHG) and sum-frequency generation (SFG) induced by the intrinsic symmetry breaking at a surface have been devel-oped as non-invasive, label-free probes, for example, to measure the arrangement, adsorption or reaction of molecules on a surface12,16,17. However, such nonlinear optical signals at a surface are extremely weak even under a high-intensity pulsed pump. Typically, only thousands of second-harmonic photons are generated by a 50-fs pulse with 500 GW cm–2 averaged intensity11, corresponding to a conversion efficiency of 1.7 × 10⁻¹⁶% W−1. Additionally, the bulk multipole effects disturb the deterministic study of surface proper-ties, which has long been highly challenging8,11.
Nonlinear optical effects enhanced by microcavities have been extensively investigated since the 1980s18–25. For example, second-order nonlinearity had been studied in optical cavities made of materials without inversion symmetry24. Recently, second-order nonlinear signals were also observed in cavities with centrosym-metric materials26–30. These studies, however, required high pump power due to the lack of an efficient phase-matching method.
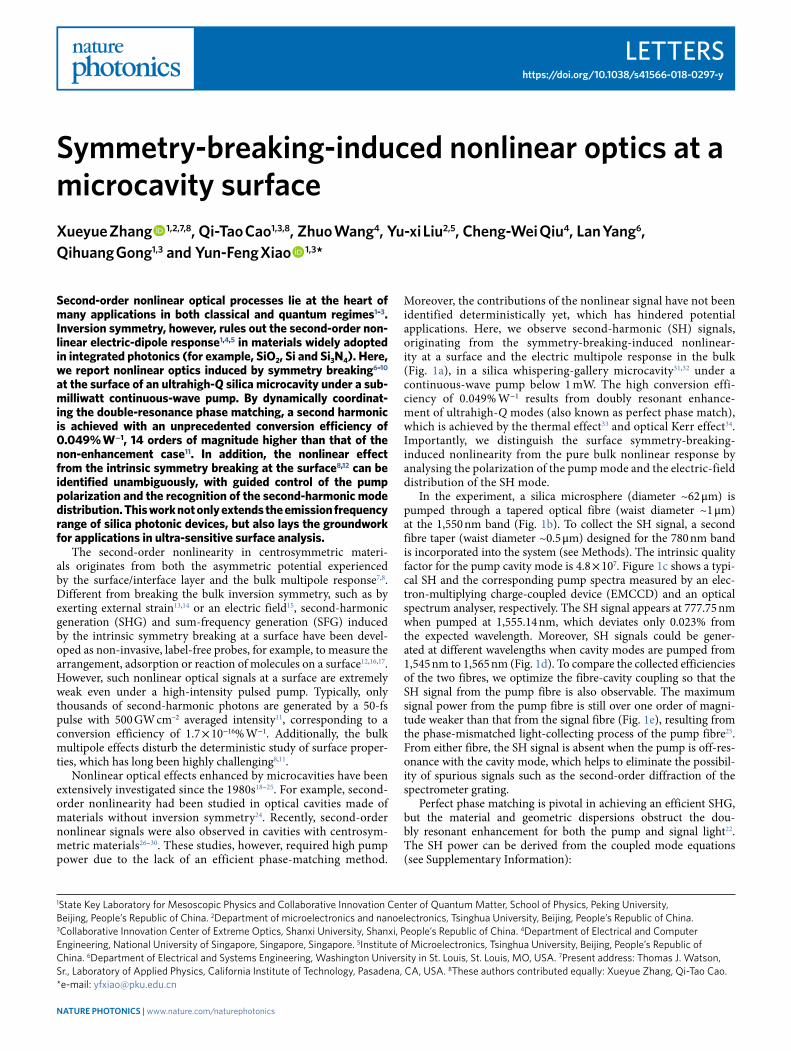
Moreover, the contributions of the nonlinear signal have not been identified deterministically yet, which has hindered potential applications. Here, we observe second-harmonic (SH) signals, originating from the symmetry-breaking-induced nonlinear-ity at a surface and the electric multipole response in the bulk (Fig. 1a), in a silica whispering-gallery microcavity31,32 under a continuous-wave pump below 1 mW. The high conversion effi-ciency of 0.049% W−1 results from doubly resonant enhance-ment of ultrahigh-Q modes (also known as perfect phase match), which is achieved by the thermal effect33 and optical Kerr effect34. Importantly, we distinguish the surface symmetry-breaking-induced nonlinearity from the pure bulk nonlinear response by analysing the polarization of the pump mode and the electric-field distribution of the SH mode.
In the experiment, a silica microsphere (diameter ~62 μ m) is pumped through a tapered optical fibre (waist diameter ~1 μ m) at the 1,550 nm band (Fig. 1b). To collect the SH signal, a second fibre taper (waist diameter ~0.5 μ m) designed for the 780 nm band is incorporated into the system (see Methods). The intrinsic quality factor for the pump cavity mode is 4.8 × 10⁷. Figure 1c shows a typi-cal SH and the corresponding pump spectra measured by an elec-tron-multiplying charge-coupled device (EMCCD) and an optical spectrum analyser, respectively. The SH signal appears at 777.75 nm when pumped at 1,555.14 nm, which deviates only 0.023% from the expected wavelength. Moreover, SH signals could be gener-ated at different wavelengths when cavity modes are pumped from 1,545 nm to 1,565 nm (Fig. 1d). To compare the collected efficiencies of the two fibres, we optimize the fibre-cavity coupling so that the SH signal from the pump fibre is also observable. The maximum signal power from the pump fibre is still over one order of magni-tude weaker than that from the signal fibre (Fig. 1e), resulting from the phase-mismatched light-collecting process of the pump fibre25. From either fibre, the SH signal is absent when the pump is off-res-onance with the cavity mode, which helps to eliminate the possibil-ity of spurious signals such as the second-order diffraction of the spectrometer grating.
Perfect phase matching is pivotal in achieving an efficient SHG, but the material and geometric dispersions obstruct the dou-bly resonant enhancement for both the pump and signal light22. The SH power can be derived from the coupled mode equations (see Supplementary Information):
Symmetry-breaking-induced nonlinear optics at a microcavity surfaceXueyue Zhang 1,2,7,8, Qi-Tao Cao1,3,8, Zhuo Wang4, Yu-xi Liu2,5, Cheng-Wei Qiu4, Lan Yang6, Qihuang Gong1,3 and Yun-Feng Xiao 1,3*
NaTure PhoToNiCS | www.nature.com/naturephotonics
Letters Nature PhotoNics
ω ω ω ω ω ω=
∣ ∣ ∕∕ − +
∕
∕ − +P
g Q QQ
Q Q
QP
44 (2 1) 1
16
[4 ( 1) 1](1)2
2
2 12
22
2e
22
p 22
14
1e2
12
p 12 2 1
2
where the subscripts j = 1, 2 represent the pump and SH cavity modes with resonance frequencies ωj, respectively, Qj is the loaded quality factor, Qje is the external (coupling related) quality factor, g is the second-order nonlinear coupling strength between the two modes, and ωp and P1 are the pump frequency and power, respec-tively. Equation (1) shows that ultrahigh Q is indispensable in boosting the SH power, while the corresponding ultra-narrow line-width also presents the challenge of achieving the double resonance. To compensate for the dispersion, we leverage the cavity-enhanced thermal33 and optical Kerr effects34 to dynamically manipulate the frequencies of both the pump and SH cavity modes.
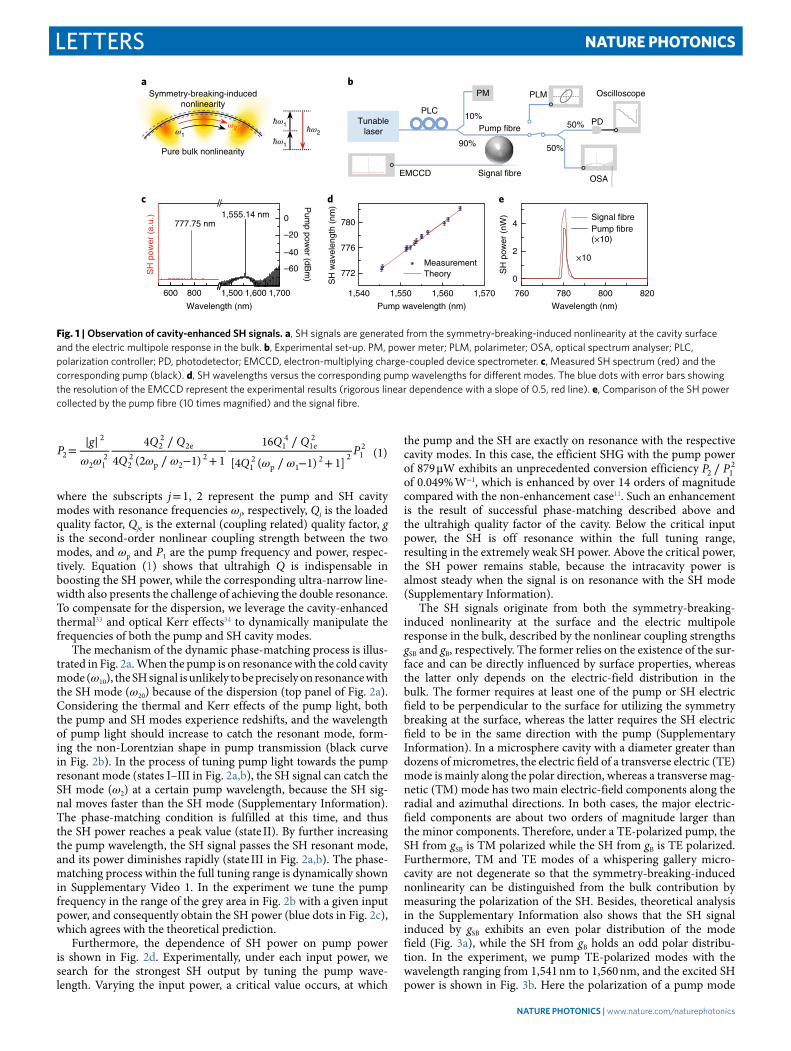
The mechanism of the dynamic phase-matching process is illus-trated in Fig. 2a. When the pump is on resonance with the cold cavity mode (ω10), the SH signal is unlikely to be precisely on resonance with the SH mode (ω20) because of the dispersion (top panel of Fig. 2a). Considering the thermal and Kerr effects of the pump light, both the pump and SH modes experience redshifts, and the wavelength of pump light should increase to catch the resonant mode, form-ing the non-Lorentzian shape in pump transmission (black curve in Fig. 2b). In the process of tuning pump light towards the pump resonant mode (states I–III in Fig. 2a,b), the SH signal can catch the SH mode (ω2) at a certain pump wavelength, because the SH sig-nal moves faster than the SH mode (Supplementary Information). The phase-matching condition is fulfilled at this time, and thus the SH power reaches a peak value (state II). By further increasing the pump wavelength, the SH signal passes the SH resonant mode, and its power diminishes rapidly (state III in Fig. 2a,b). The phase-matching process within the full tuning range is dynamically shown in Supplementary Video 1. In the experiment we tune the pump frequency in the range of the grey area in Fig. 2b with a given input power, and consequently obtain the SH power (blue dots in Fig. 2c), which agrees with the theoretical prediction.
Furthermore, the dependence of SH power on pump power is shown in Fig. 2d. Experimentally, under each input power, we search for the strongest SH output by tuning the pump wave-length. Varying the input power, a critical value occurs, at which
the pump and the SH are exactly on resonance with the respective cavity modes. In this case, the efficient SHG with the pump power of 879 μ W exhibits an unprecedented conversion efficiency ∕P P2 1
2 of 0.049% W−1, which is enhanced by over 14 orders of magnitude compared with the non-enhancement case11. Such an enhancement is the result of successful phase-matching described above and the ultrahigh quality factor of the cavity. Below the critical input power, the SH is off resonance within the full tuning range, resulting in the extremely weak SH power. Above the critical power, the SH power remains stable, because the intracavity power is almost steady when the signal is on resonance with the SH mode (Supplementary Information).
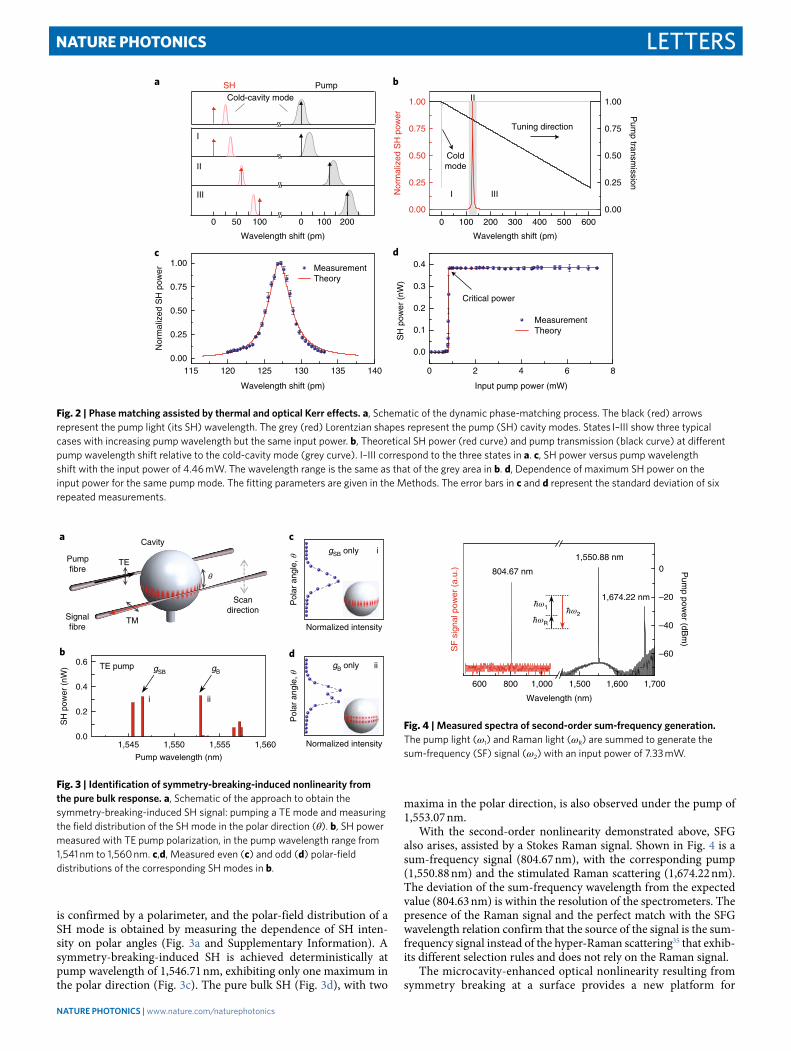
The SH signals originate from both the symmetry-breaking-induced nonlinearity at the surface and the electric multipole response in the bulk, described by the nonlinear coupling strengths gSB and gB, respectively. The former relies on the existence of the sur-face and can be directly influenced by surface properties, whereas the latter only depends on the electric-field distribution in the bulk. The former requires at least one of the pump or SH electric field to be perpendicular to the surface for utilizing the symmetry breaking at the surface, whereas the latter requires the SH electric field to be in the same direction with the pump (Supplementary Information). In a microsphere cavity with a diameter greater than dozens of micrometres, the electric field of a transverse electric (TE) mode is mainly along the polar direction, whereas a transverse mag-netic (TM) mode has two main electric-field components along the radial and azimuthal directions. In both cases, the major electric-field components are about two orders of magnitude larger than the minor components. Therefore, under a TE-polarized pump, the SH from gSB is TM polarized while the SH from gB is TE polarized. Furthermore, TM and TE modes of a whispering gallery micro-cavity are not degenerate so that the symmetry-breaking-induced nonlinearity can be distinguished from the bulk contribution by measuring the polarization of the SH. Besides, theoretical analysis in the Supplementary Information also shows that the SH signal induced by gSB exhibits an even polar distribution of the mode field (Fig. 3a), while the SH from gB holds an odd polar distribu-tion. In the experiment, we pump TE-polarized modes with the wavelength ranging from 1,541 nm to 1,560 nm, and the excited SH power is shown in Fig. 3b. Here the polarization of a pump mode
Symmetry-breaking-inducednonlinearity
Pure bulk nonlinearity
Tunablelaser
777.75 nm0 780
a
c d e
b
4Signal fibrePump fibre(×10)
2
0
776
772MeasurementTheory
1,540 1,550
Pump wavelength (nm)
1,560 1,570 760 780
Wavelength (nm)
800 820
–20
–40
SH
wav
elen
gth
(nm
)
SH
pow
er (
nW)
Pum
p power (dB
m)
–60
600 800 1,500
Wavelength (nm)
1,600 1,700
1,555.14 nm
PLC
PLM
PD
OSA
OscilloscopePM
10%
90%
50%
50%
Pump fibre
Signal fibreEMCCD
SH
pow
er (
a.u.
)
ω1
ω2ћω1 ћω2
ћω1
×10
Fig. 1 | observation of cavity-enhanced Sh signals. a, SH signals are generated from the symmetry-breaking-induced nonlinearity at the cavity surface and the electric multipole response in the bulk. b, Experimental set-up. PM, power meter; PLM, polarimeter; OSA, optical spectrum analyser; PLC, polarization controller; PD, photodetector; EMCCD, electron-multiplying charge-coupled device spectrometer. c, Measured SH spectrum (red) and the corresponding pump (black). d, SH wavelengths versus the corresponding pump wavelengths for different modes. The blue dots with error bars showing the resolution of the EMCCD represent the experimental results (rigorous linear dependence with a slope of 0.5, red line). e, Comparison of the SH power collected by the pump fibre (10 times magnified) and the signal fibre.
NaTure PhoToNiCS | www.nature.com/naturephotonics
LettersNature PhotoNics
is confirmed by a polarimeter, and the polar-field distribution of a SH mode is obtained by measuring the dependence of SH inten-sity on polar angles (Fig. 3a and Supplementary Information). A symmetry-breaking-induced SH is achieved deterministically at pump wavelength of 1,546.71 nm, exhibiting only one maximum in the polar direction (Fig. 3c). The pure bulk SH (Fig. 3d), with two
maxima in the polar direction, is also observed under the pump of 1,553.07 nm.
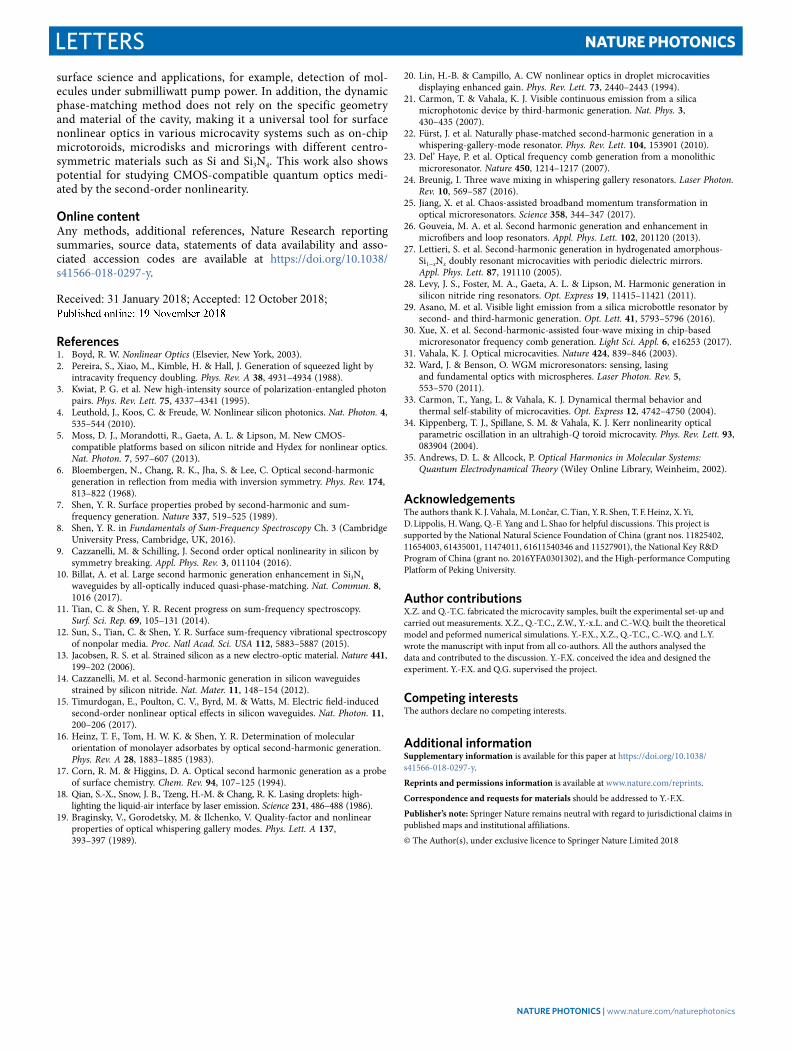
With the second-order nonlinearity demonstrated above, SFG also arises, assisted by a Stokes Raman signal. Shown in Fig. 4 is a sum-frequency signal (804.67 nm), with the corresponding pump (1,550.88 nm) and the stimulated Raman scattering (1,674.22 nm). The deviation of the sum-frequency wavelength from the expected value (804.63 nm) is within the resolution of the spectrometers. The presence of the Raman signal and the perfect match with the SFG wavelength relation confirm that the source of the signal is the sum-frequency signal instead of the hyper-Raman scattering35 that exhib-its different selection rules and does not rely on the Raman signal.
The microcavity-enhanced optical nonlinearity resulting from symmetry breaking at a surface provides a new platform for
115 120 125 130 135 1400.00
0.25
0.50
0.75
1.00c
Wavelength shift (pm)
Nor
mal
ized
SH
pow
er MeasurementTheory
0 2 4 6 8
0.0
0.1
0.2
0.3
0.4d
SH
pow
er (
nW)
Input pump power (mW)
MeasurementTheory
Critical power
0 100 200 300 400 500 6000.00
0.25
0.50
0.75
1.00
0.00
0.25
0.50
0.75
1.00
Nor
mal
ized
SH
pow
er Pum
p transmission
Cold-cavity mode
0 50 100 0 100 200
SH Pump
Wavelength shift (pm)
I
II
III I
Coldmode
II
III
a b
Tuning direction
Wavelength shift (pm)
Fig. 2 | Phase matching assisted by thermal and optical Kerr effects. a, Schematic of the dynamic phase-matching process. The black (red) arrows represent the pump light (its SH) wavelength. The grey (red) Lorentzian shapes represent the pump (SH) cavity modes. States I–III show three typical cases with increasing pump wavelength but the same input power. b, Theoretical SH power (red curve) and pump transmission (black curve) at different pump wavelength shift relative to the cold-cavity mode (grey curve). I–III correspond to the three states in a. c, SH power versus pump wavelength shift with the input power of 4.46 mW. The wavelength range is the same as that of the grey area in b. d, Dependence of maximum SH power on the input power for the same pump mode. The fitting parameters are given in the Methods. The error bars in c and d represent the standard deviation of six repeated measurements.
a c
d
Pumpfibre
Signalfibre
0.6
0.4
TE pump
0.2
0.01,545 1,550 1,555 1,560
Pump wavelength (nm)
gB only ii
Normalized intensity
Normalized intensity
i ii
b
TM
TE
Cavity
Scandirection
igSB only
gSB gB
Pol
ar a
ngle
, θP
olar
ang
le, θ
SH
pow
er (
nW)
θ
Fig. 3 | identification of symmetry-breaking-induced nonlinearity from the pure bulk response. a, Schematic of the approach to obtain the symmetry-breaking-induced SH signal: pumping a TE mode and measuring the field distribution of the SH mode in the polar direction (θ). b, SH power measured with TE pump polarization, in the pump wavelength range from 1,541 nm to 1,560 nm. c,d, Measured even (c) and odd (d) polar-field distributions of the corresponding SH modes in b.
Pum
p power (dB
m)
SF
sig
nal p
ower
(a.
u.)
Wavelength (nm)
600 800 1,000 1,500 1,600 1,700
–60
–40
–20
0
1,674.22 nm
1,550.88 nm
804.67 nm
ℎω1 ℎω2ℎωR
Fig. 4 | Measured spectra of second-order sum-frequency generation. The pump light (ω1) and Raman light (ωR) are summed to generate the sum-frequency (SF) signal (ω2) with an input power of 7.33 mW.
NaTure PhoToNiCS | www.nature.com/naturephotonics
Letters Nature PhotoNics
surface science and applications, for example, detection of mol-ecules under submilliwatt pump power. In addition, the dynamic phase-matching method does not rely on the specific geometry and material of the cavity, making it a universal tool for surface nonlinear optics in various microcavity systems such as on-chip microtoroids, microdisks and microrings with different centro-symmetric materials such as Si and Si3N4. This work also shows potential for studying CMOS-compatible quantum optics medi-ated by the second-order nonlinearity.
online contentAny methods, additional references, Nature Research reporting summaries, source data, statements of data availability and asso-ciated accession codes are available at https://doi.org/10.1038/s41566-018-0297-y.
Received: 31 January 2018; Accepted: 12 October 2018; Published: xx xx xxxx
references 1. Boyd, R. W. Nonlinear Optics (Elsevier, New York, 2003). 2. Pereira, S., Xiao, M., Kimble, H. & Hall, J. Generation of squeezed light by
intracavity frequency doubling. Phys. Rev. A 38, 4931–4934 (1988). 3. Kwiat, P. G. et al. New high-intensity source of polarization-entangled photon
pairs. Phys. Rev. Lett. 75, 4337–4341 (1995). 4. Leuthold, J., Koos, C. & Freude, W. Nonlinear silicon photonics. Nat. Photon. 4,
535–544 (2010). 5. Moss, D. J., Morandotti, R., Gaeta, A. L. & Lipson, M. New CMOS-
compatible platforms based on silicon nitride and Hydex for nonlinear optics. Nat. Photon. 7, 597–607 (2013).
6. Bloembergen, N., Chang, R. K., Jha, S. & Lee, C. Optical second-harmonic generation in reflection from media with inversion symmetry. Phys. Rev. 174, 813–822 (1968).
7. Shen, Y. R. Surface properties probed by second-harmonic and sum-frequency generation. Nature 337, 519–525 (1989).
8. Shen, Y. R. in Fundamentals of Sum-Frequency Spectroscopy Ch. 3 (Cambridge University Press, Cambridge, UK, 2016).
9. Cazzanelli, M. & Schilling, J. Second order optical nonlinearity in silicon by symmetry breaking. Appl. Phys. Rev. 3, 011104 (2016).
10. Billat, A. et al. Large second harmonic generation enhancement in Si3N4 waveguides by all-optically induced quasi-phase-matching. Nat. Commun. 8, 1016 (2017).
11. Tian, C. & Shen, Y. R. Recent progress on sum-frequency spectroscopy. Surf. Sci. Rep. 69, 105–131 (2014).
12. Sun, S., Tian, C. & Shen, Y. R. Surface sum-frequency vibrational spectroscopy of nonpolar media. Proc. Natl Acad. Sci. USA 112, 5883–5887 (2015).
13. Jacobsen, R. S. et al. Strained silicon as a new electro-optic material. Nature 441, 199–202 (2006).
14. Cazzanelli, M. et al. Second-harmonic generation in silicon waveguides strained by silicon nitride. Nat. Mater. 11, 148–154 (2012).
15. Timurdogan, E., Poulton, C. V., Byrd, M. & Watts, M. Electric field-induced second-order nonlinear optical effects in silicon waveguides. Nat. Photon. 11, 200–206 (2017).
16. Heinz, T. F., Tom, H. W. K. & Shen, Y. R. Determination of molecular orientation of monolayer adsorbates by optical second-harmonic generation. Phys. Rev. A 28, 1883–1885 (1983).
17. Corn, R. M. & Higgins, D. A. Optical second harmonic generation as a probe of surface chemistry. Chem. Rev. 94, 107–125 (1994).
18. Qian, S.-X., Snow, J. B., Tzeng, H.-M. & Chang, R. K. Lasing droplets: high-lighting the liquid-air interface by laser emission. Science 231, 486–488 (1986).
19. Braginsky, V., Gorodetsky, M. & Ilchenko, V. Quality-factor and nonlinear properties of optical whispering gallery modes. Phys. Lett. A 137, 393–397 (1989).
20. Lin, H.-B. & Campillo, A. CW nonlinear optics in droplet microcavities displaying enhanced gain. Phys. Rev. Lett. 73, 2440–2443 (1994).
21. Carmon, T. & Vahala, K. J. Visible continuous emission from a silica microphotonic device by third-harmonic generation. Nat. Phys. 3, 430–435 (2007).
22. Fürst, J. et al. Naturally phase-matched second-harmonic generation in a whispering-gallery-mode resonator. Phys. Rev. Lett. 104, 153901 (2010).
23. Del’ Haye, P. et al. Optical frequency comb generation from a monolithic microresonator. Nature 450, 1214–1217 (2007).
24. Breunig, I. Three wave mixing in whispering gallery resonators. Laser Photon. Rev. 10, 569–587 (2016).
25. Jiang, X. et al. Chaos-assisted broadband momentum transformation in optical microresonators. Science 358, 344–347 (2017).
26. Gouveia, M. A. et al. Second harmonic generation and enhancement in microfibers and loop resonators. Appl. Phys. Lett. 102, 201120 (2013).
27. Lettieri, S. et al. Second-harmonic generation in hydrogenated amorphous-Si1−xNx doubly resonant microcavities with periodic dielectric mirrors. Appl. Phys. Lett. 87, 191110 (2005).
28. Levy, J. S., Foster, M. A., Gaeta, A. L. & Lipson, M. Harmonic generation in silicon nitride ring resonators. Opt. Express 19, 11415–11421 (2011).
29. Asano, M. et al. Visible light emission from a silica microbottle resonator by second- and third-harmonic generation. Opt. Lett. 41, 5793–5796 (2016).
30. Xue, X. et al. Second-harmonic-assisted four-wave mixing in chip-based microresonator frequency comb generation. Light Sci. Appl. 6, e16253 (2017).
31. Vahala, K. J. Optical microcavities. Nature 424, 839–846 (2003). 32. Ward, J. & Benson, O. WGM microresonators: sensing, lasing
and fundamental optics with microspheres. Laser Photon. Rev. 5, 553–570 (2011).
33. Carmon, T., Yang, L. & Vahala, K. J. Dynamical thermal behavior and thermal self-stability of microcavities. Opt. Express 12, 4742–4750 (2004).
34. Kippenberg, T. J., Spillane, S. M. & Vahala, K. J. Kerr nonlinearity optical parametric oscillation in an ultrahigh-Q toroid microcavity. Phys. Rev. Lett. 93, 083904 (2004).
35. Andrews, D. L. & Allcock, P. Optical Harmonics in Molecular Systems: Quantum Electrodynamical Theory (Wiley Online Library, Weinheim, 2002).
acknowledgementsThe authors thank K. J. Vahala, M. Lončar, C. Tian, Y. R. Shen, T. F. Heinz, X. Yi, D. Lippolis, H. Wang, Q.-F. Yang and L. Shao for helpful discussions. This project is supported by the National Natural Science Foundation of China (grant nos. 11825402, 11654003, 61435001, 11474011, 61611540346 and 11527901), the National Key R&D Program of China (grant no. 2016YFA0301302), and the High-performance Computing Platform of Peking University.
author contributionsX.Z. and Q.-T.C. fabricated the microcavity samples, built the experimental set-up and carried out measurements. X.Z., Q.-T.C., Z.W., Y.-x.L. and C.-W.Q. built the theoretical model and peformed numerical simulations. Y.-F.X., X.Z., Q.-T.C., C.-W.Q. and L.Y. wrote the manuscript with input from all co-authors. All the authors analysed the data and contributed to the discussion. Y.-F.X. conceived the idea and designed the experiment. Y.-F.X. and Q.G. supervised the project.
Competing interestsThe authors declare no competing interests.
additional informationSupplementary information is available for this paper at https://doi.org/10.1038/s41566-018-0297-y.
Reprints and permissions information is available at www.nature.com/reprints.
Correspondence and requests for materials should be addressed to Y.-F.X.
Publisher’s note: Springer Nature remains neutral with regard to jurisdictional claims in published maps and institutional affiliations.
© The Author(s), under exclusive licence to Springer Nature Limited 2018
NaTure PhoToNiCS | www.nature.com/naturephotonics
LettersNature PhotoNics
MethodsCavity fabrication and the dual-fibre coupling system. The silica microsphere was fabricated directly by a standard single-mode telecom fibre. We attenuated the fibre with a CO2 laser, and obtained the microsphere by melting the end of the fibre. The dual fibres were fabricated respectively with standard single-mode fibre in the 1,550 nm and 780 nm bands, using different fabrication parameters. The influence of the signal fibre to Q is minor in the experiment. For example, the intrinsic Q of the pump mode in Fig. 1c before and after the incorporation of the signal fibre is 4.8 × 10⁷ and 3.6 × 10⁷. The coupling between the signal fibre and the microsphere is adjusted while monitoring the transmission from the signal fibre with a tunable laser in the 780-nm band. The EMCCD and the pump laser are placed at the same side of the microsphere considering the linear momentum conservation requirement in SHG.
Theoretical model and fitting. The SHG can be described by the following coupled mode equations:
αω ω
κ κα κ α α= − −
++ +
ti s ig
dd
( )2
* * (2)1p 1
10 1e1 1e 1 2
αω ω
κ κα α= − −
++
ti ig
dd
(2 )2
(3)2p 2
20 2e2 1
2
where αj denotes the field amplitude in the cavity, s is the amplitude of the pump, κje denotes the external coupling rate and κj0 (j = 1, 2) represents the intrinsic decay rate, which is related to the intrinsic Q as κj0 = ωj/Qj0, g* and a1* are the complex conjugates of the corresponding quantities and t is the time. To introduce the influence of the thermal and Kerr effects, ω1 = ω10 − B11|α1|2 and ω2 = ω20 − B12|α1|2 are used to describe the redshift of the cavity modes. B11 and B12 are determined by the effective thermal-induced refractive index change (∂ n/∂ T)eff and the Kerr susceptibility χKerr (Supplementary Information). The steady-state solution of equations (2) and (3) with the shifted ωj are used to fit the measured data in Fig. 2c,d. The experimental data used in the fitting are cold-cavity pump frequency ω10/2π = 192.7901 THz, κ10/2π = 5.32 MHz, cold-cavity resonance transmission T = 0.2. B11 is extracted to be 4.93 × 10²¹ rad s–1 J–1 from the pump wavelength shift at the peak in Fig. 2c and the corresponding intracavity energy. Figure 2c,d are both fitted with the same set of parameters, including the critical power of 832 μ W with the corresponding SH power of 0.381 nW. The loaded Q factor of the SH mode is fitted to be 8.03 × 10⁶, the cold-cavity resonance frequency ω20/2π = 385.5784 THz and the resonance shift coefficient 9.29 × 10²¹ rad s–1 J–1. The fitted coefficient gives 2B11/B12 = 1.06.
Data availabilityThe data that support the plots within this paper and other findings of this study are available from the corresponding author upon reasonable request.
NaTure PhoToNiCS | www.nature.com/naturephotonics