Embed Size (px)
Citation preview

Symbolizing Quantity
Praveen K. Paritosh ([email protected]) Qualitative Reasoning Group, Department of Computer Science,
Northwestern University, 1890 Maple Ave, Evanston, IL 60201 USA
Abstract
Quantities are ubiquitous and an important part of our understanding about the world – we talk of engine horsepower, size, mileage, price of cars; GDP, population, area of countries; wingspan, weight, surface area of birds, and so on. In this paper, we present cognitively plausible symbolic representations of quantity and principles for generating those representations. Bringing together evidence in linguistics and psychology, we argue that our representations must make two kinds of distinctions – dimensional, those that denote changes of quantity, e.g., large and small; and structural, those that denote changes of quality, e.g. boiling point and poverty line. We present results of a pilot experiment that suggests that there is a significant agreement between people about the dimensional distinctions. We then describe a computational model CARVE, which is a system that learns to make dimensional and structural distinctions on quantities by being exposed to examples.
1 Introduction Our knowledge about quantities is of various kinds – we understand that there are Expensive and Cheap things, that Canada is larger (in area) than the USA, that basketball players are usually tall, that the boiling point of water is 100 degrees Celsius. A key part of such knowledge seems to be a symbolization of the space of values that a quantity can take. By symbolization, we mean identifying and naming intervals and points in the space of values of a quantity. Some examples include tall and short for the quantity of height of people; poverty line, lower class, middle class and upper class for income of people; freezing point and boiling point for the temperature of water.
These symbolizations and their mapping onto quantitative values seem to be determined by a mixture of personal experience (e.g., what I consider to be spicy in regards to food), society (e.g., middle class), science (e.g., phase transitions). Some are task-specific – one makes more distinctions than freezing and boiling for bath water. Furthermore, some of these symbolizations have been said to be vague [Va rzi, 2003], in the sense that it is not possible to tell exactly at what value of height one becomes tall, and is not tall if any less than that. Given these concerns, finding systematic principles behind such symbolizations seems to be a daunting task, and has not been tackled head-on in cognitive science. That said, there is a vast literature that bears on these issues. In this paper, we address the following two fundamental questions about people’s knowledge of quantities –
1. Representational: What do our representations of quantity look like? Or, what representational machinery is needed to make the distinctions that we do?
2. Computational: How are these representations built with experience? Large scale knowledge representation efforts like Cyc
[Lenat and Guha, 1989] refer to quantities either purely numerically, or using ad hoc representations. Most existing computational models of retrieval and similarity cannot use numerical representations [Falkenhainer et al, 1989; Holyoak and Thagard, 1989; Hummel and Holyoak, 1997; Goldstone and Rogosky, 2002], leading to quantitative information being ignored in computation of similarity. There are models in case based reasoning [Ashley, 1990; Leake, 1996; Ram and Santamaria, 1997] that use numeric information, but they employ ad hoc similarity metrics that are not psychologically grounded. A major motivation of this work is to generate cognitively plausible symbolic representations of quantity that will enhance computational models of similarity, retrieval and generalization.
The rest of the paper proceeds as follows: We next present relevant research from Linguistics, Psychology, Qualitative Reasoning, and models of similarity and retrieval, which provide both background and motivation. Section 3 reports results of a pilot experiment measuring just how vague our notion of large, medium and small is. Section 4 proposes an answer to the representational question above. Section 5 describes CARVE, a computational model for building such representations. We conclude with future work in section 6.
2 Background and Motivation
2.1 Linguistics In language, one of the ways these symbolizations get represented is by relative adjectives like large and tall. Relative adjectives are different from absolute adjectives like rectangular, red and married in the sense that (1) they can imply varying degrees of the property in question, as opposed to all-or-none for the absolute adjectives, and (2) their meaning varies with context, e.g., tall means different things in context of men and buildings.
These adjectives have been variously called degree, relative, gradable or dimensional adjectives [Bierwisch 1987]. Here we will stick to the term dimensional adjectives, emphasizing our focus on those that denote quantity. It has been proposed that dimensional adjectives denote measure functions that maps from objects to quantity values/ intervals [Kennedy, 2003]. It has long been
In Proceedings of the 26th Annual Conference of Cognitive Science Society, 2004, Chicago.
recognized by linguists that dimensional adjectives convey an implicit reference to a norm or a standard associated with the modified noun [Sapir, 1944]. This implies two steps in interpreting a phrase like “a large x” where x can be a country/ insect/ etc.: (1) x establishes a comparison class. A comparison class is a set of objects that are in someway similar to x. For instance, in some cases, this comparison class might be the immediate superordinate of the subject [Bierwisch, 1971]. How to obtain the comparison class is an open question. Staab and Hahn (1998) propose a computational model that uses knowledge about correlations to determine comparison classes on the fly. (2) Once the comparison class has been found, a standard of comparison is computed for the class. It is usually believed that this is the norm value of the property for the comparison class, but Kennedy (2003) observes that it can also be the minimum or maximum (e.g., full and open).
The norm in step 2 has not been spelled out in this literature. In cases where we are referring to stable taxonomic categories like insects and countries, it is believed to be some kind of central tendency. But clearly, it is more than a central tendency, since that would imply that most things in this world will be either large or small, as not many will be exactly equal to the norm.
2.2 Psychology 2.2.1 Context sensitivity Rips (1980) considers two hypotheses about how absolute and relative adjectives might be stored in memory – Pre-Storage and Computational model. For absolute adjectives like married and pink, he accepts the pre-storage model, where these predicates are stored with the concept they apply to. But because of context dependence of relative adjectives like big, e.g., in, “Flamingos are big”, he argues against storing these predicates in memory. We might have a predicate pink attached to flamingo, but in order to decide a flamingo is larger than an eagle, we might need a predicate is-larger-than-an-eagle associated with flamingo, which then deescalates into having infinitely many of those like is-larger-than-turnips and so on. He also observes that relative adjectives don’t propagate in a isa hierarchy – e.g., Grasshoppers are large insects does not imply Grasshoppers are large animals, but if you replace ‘large’ by ‘green’, the implication is right. He then shows reaction time and error rates for verifying the truth of statements containing relative adjectives which supports a different model. In his ‘computational model’ no relative information is stored. Attached to every predicate is a normal value, e.g. with insects, a normal size of quarter inches. An object is called large if it is bigger than this normal size. Once again the problem is that just storing the norm doesn’t tell you when the object can be classified as large. The representation that we propose in section 4 solves his concerns with pre-storage models. 2.2.1 Reference Points The psychological reality of such special reference points on the scale of quantity has been shown in various domains.
Rosch (1975) argued for the special status of such “cognitive reference points” by showing an asymmetry – namely that a non-reference stimulus is judged closer to a reference stimulus (e.g., the color off-red to basic-red) than otherwise, while such relationship between two non-reference stimuli is symmetric. Existence of landmarks to organize spatial knowledge of the environment, similar asymmetries [Holyoak and Mah, 1984 among others]. Other relevant psychological studies that support the existence of reference points come from categorical perception [Harnad, 1987] and sensitivity to landmarks [Cech and Shoben, 1985]. Brown and Siegler (1993) proposed the metrics and mappings framework for real-world quantitative estimation. They make a distinction between the quantitative, or metric knowledge (which includes distributional properties of parameters), and ordinal information (mapping knowledge). 2.2.2 Models of Retrieval, Similarity and Generalization There is converging psychological evidence for structured models of retrieval, similarity and generalization.
The structure-mapping engine (SME) [Falkenhainer et al, 1989] is a computational model of structure-mapping theory [Gentner, 1983]. Given two structured propositional representations as inputs, the base (about which we know more) and a target , SME computes a mapping (or a handful of them). MAC/FAC [Forbus et al, 1995] is a model of similarity-based retrieval, that uses a computationally cheap, structure-less filter before doing structural matching. It uses a secondary representation, the content vector, which summarizes the relative frequency of predicates occurring in the structured representation. The dot product of content vectors for two structured representations provide a rough estimate of their structural match. SEQL [Kuehne et al, 2000] provides a framework for making generalizations based on computing progressive structural overlaps of multiple exemplars.
One limitation of these models – and of other models of analogical processing (e.g., ACME [Holyoak and Thagard, 1989, LISA [Hummel and Holyoak, 1997], ABSURDIST [Goldstone and Rogosky, 2002]) – is that they do not handle numerical properties well: Retrieval: Just as Red occurring in the probe might remind me of other red objects, a bird with wing-surface-area of 0.272 sq.m. (that is the Great black-bucked gull, a large bird) should remind me of other large birds. This will not happen in the current model, unless we abstract the numeric representation of wing-surface-area to a symbol, say, Large. Similarity: A model of similarity must be sensitive to quantity.For example, in current matchers, two cars which are identical in all dimensions have the same similarity as two that differ in some dimensions, if other aspects of their representations are identical. Generalization: A key part of learning a new domain is acquiring the sense of quantity for different quantities. E.g., from a trip to the zoo, a kid probably has learnt something about sizes of animals.
A symbolic and relational representation of the kind we propose here would make models of analogical processing more quantity-aware.
2.3 Qualitative Reasoning Qualitative reasoning research seeks to understand human-like commonsense reasoning without resorting to differential equations and real-valued numbers. There is a substantial body of research in QR that has shown that one can, indeed, do powerful reasoning with partial knowledge. Qualitative reasoning has explored many different representations: status algebras (normal/abnormal); sign algebra (– , 0, +), which is the weakest representation that supports reasoning about continuity; quantity spaces, where we represent a quantity value by ordinal relationships with specially chosen points in the space; intervals and their fuzzy versions; order of magnitude representations; finite algebras, among others. While these representations are very promising for cognitive modeling, there has been little psychological work to date on this.
3 Experiment We conducted a pilot experiment to see how much people agreed on what they would call large, small or medium. We expected agreement across subjects on their labeling. Furthermore, we expected to find out how people go about mapping these symbols to quantity values in a specific scenario – being presented with all the examples at once. And if people indeed agreed on their partitioning, then we expected to gain insight about where they drew the boundaries.
Method The experiment consisted of two tasks – Size Labeling task and Country Naming task. In the size labeling task, subjects were presented with an outline political map of Africa. The countries were numbered from 1 through 54, and at the bottom of the map were 54 numbered blanks. They were given the following instruction – “On the following page you will find a map of Africa. All the different countries are shown and numbered. For each country, we want you to think if you will call it LARGE, MEDIUM or SMALL on the basis of size (land area) as shown in the map. Below the map you will find numbered index of all the countries on the map. Please place your answer (LARGE/ MEDIUM/ SMALL) in the blank next to it. Please fill out all the blanks.”
At the end of this task, they did the country naming task. Here they were presented another copy of the map, and were told to name as many of the countries as they could. The participants were 19 graduate students at Northwestern University.
Results and Discussion We found significant agreement across the subjects. Subjects could correctly name very few countries (mean 6
out of 54 countries, sd = 6.5). This suggests that prior knowledge should be irrelevant, and their judgments were based on examining the map.
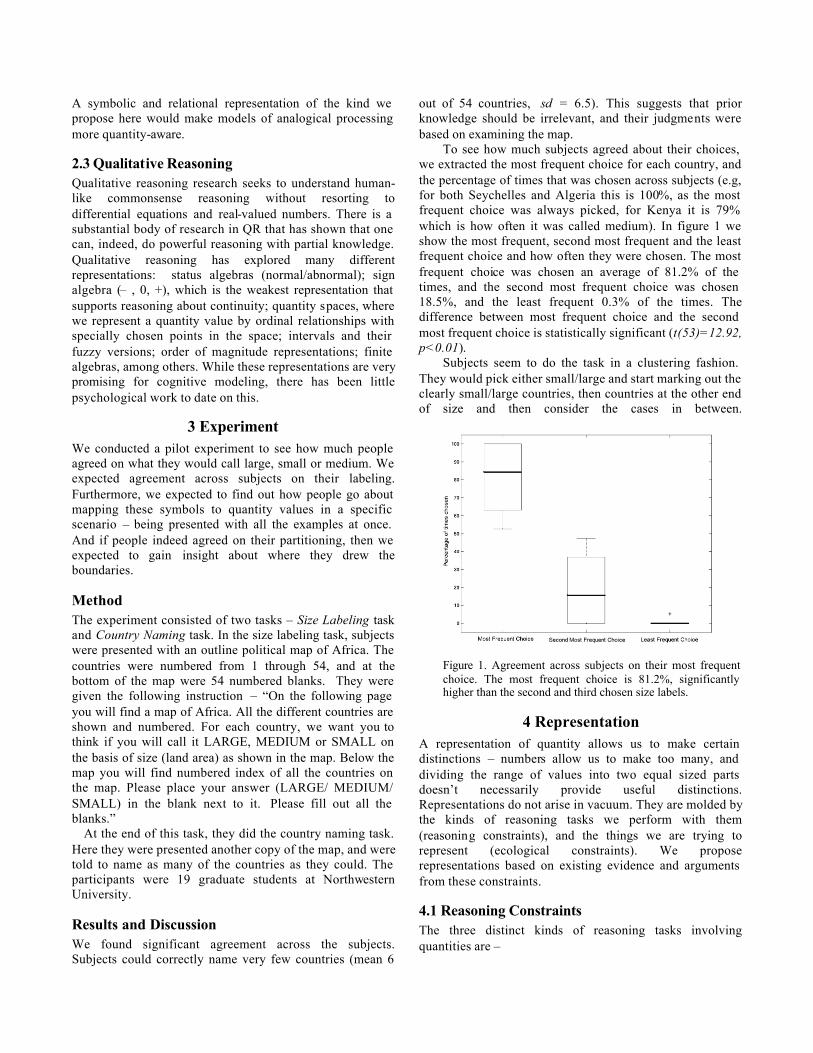
To see how much subjects agreed about their choices, we extracted the most frequent choice for each country, and the percentage of times that was chosen across subjects (e.g, for both Seychelles and Algeria this is 100%, as the most frequent choice was always picked, for Kenya it is 79% which is how often it was called medium). In figure 1 we show the most frequent, second most frequent and the least frequent choice and how often they were chosen. The most frequent choice was chosen an average of 81.2% of the times, and the second most frequent choice was chosen 18.5%, and the least frequent 0.3% of the times. The difference between most frequent choice and the second most frequent choice is statistically significant (t(53)=12.92, p<0.01).
Subjects seem to do the task in a clustering fashion. They would pick either small/large and start marking out the clearly small/large countries, then countries at the other end of size and then consider the cases in between.
Figure 1. Agreement across subjects on their most frequent choice. The most frequent choice is 81.2%, significantly higher than the second and third chosen size labels.
4 Representation A representation of quantity allows us to make certain distinctions – numbers allow us to make too many, and dividing the range of values into two equal sized parts doesn’t necessarily provide useful distinctions. Representations do not arise in vacuum. They are molded by the kinds of reasoning tasks we perform with them (reasoning constraints), and the things we are trying to represent (ecological constraints). We propose representations based on existing evidence and arguments from these constraints.
4.1 Reasoning Constraints The three distinct kinds of reasoning tasks involving quantities are –
1. Comparison: These involve comparing two values on an underlying scale of quantity, e.g., “Is John taller than Chris?” Our knowledge of how the quantity varies (its distribution), and linguistic labels like Large and Small, are but a compressed record of large number of such comparisons. The semantic congruity effect [Banks and Flora, 1977] is the fact that we are better and faster at judging the larger of two large things than the smaller of two large things. Part of the account from experiments involving adults learning novel dimension words, by Ryalls and Smith (2000) is the fact that in usage, we make statements like “X is larger than Y” more often than “Y is smaller than X”, if X and Y are both on the large end of the scale. 2. Classification: These involve making judgments about whether a quantity value is equal to, less than or greater than a specific value, e.g., Is the water boiling?, Will this couch fit in the freight elevator?, etc. Usually, such classifications involve comparisons with interesting points (called limit points in QR) in the space of values for a quantity, where conditions on either side are qualitatively distinct. The metaphor of phase transitions describes many such interesting points, although such transitions in everyday domains are not as sharply and well defined as in scientific domains (consider poverty line versus freezing point). 3. Estimation: These involve inferring a numerical value for a particular quantity, e.g., How tall is he? What is the mileage of your car? This is the activity that has the strongest connection to quantitative scales – one can go a long way in accounting for the above two without resorting to numbers, but estimation involves mapping back to numbers [Subrahmanyam and Gelman, 1998]. Knowledge of interesting points on the scale might play an important role in estimation, for example in providing anchors to adjust from [Tversky and Kahmenan, 1974].
These tasks are not completely distinct – classification involves comparison, and estimation might be used in the service of classification. Two interesting aspects of our representations follow from these constraints: 1. Our representations must keep track of interesting points on the scale of quantity, to classify, as well as to estimate. 2. Labels like large ease making comparisons, as they setup implicit ordinal relationships (it is larger than most objects).
4.2 Ecological Constraints Our representational framework must be capable of capturing the interesting ways in which a quantity varies in real-world instances of it. Below we present two different kinds of constraints on values a quantity can take – 1. Distributional Constraints: Most quantities have a range (a minimum and a maximum) and a distribution that determines how often a specific value shows up. For example, the height of adult men might be between 4 and 10 ft, with most being around 5-6.5ft. More than just the norm, we can usually talk about the low, medium, high for many quantities, which seems to be a qualitative summary
of the distributional information. There is psychological evidence that establishes that we can and do accumulate distributions of quantities [refer to Malmi and Samson, 1983; Fried and Holyoak, 1984; Kraus et al, 1993; among others, for more]. Given a distribution of values for a quantity, the next question of how we partition these distributions has not been raised at all. 2. Structural Constraints: Quantities are constrained by what values other quantities in the system take, its relationship with those other quantities, via its relationships with them1. For instance, for all internal combustion engines – as the engine mass increases, the Brake Horse Power (BHP), Bore (diameter), Displacement (volume) increases, and the RPM decreases. These constraints represent the underlying mechanism, or causal model of the object. Limit points decompose values into regions where the underlying causal story is different (e.g., ice starting to melt, at the freezing point), which induces extremely important and interesting distinctions of quality on the space of quantity.
These two ecological constraints point us to the two different kinds of information about quantities, which must be parts of our representations –
1. Distributional information about how the quantity varies.
2. Its role in and relationship to the underlying structure/mechanism, and the points at which there are changes in underlying structure.
4.3 Proposed Representation There are two kinds of distinctions that our representation of quantity must make –
1. Dimensional partitions: Symbols like Large and Small, which arise from distributional information about how that quantity varies.
2. Structural Partitions: Symbols like Boiling Point and Poverty Line, that denote changes of quality, usually changes in the underlying causal story and many other aspects of the objects in concern.
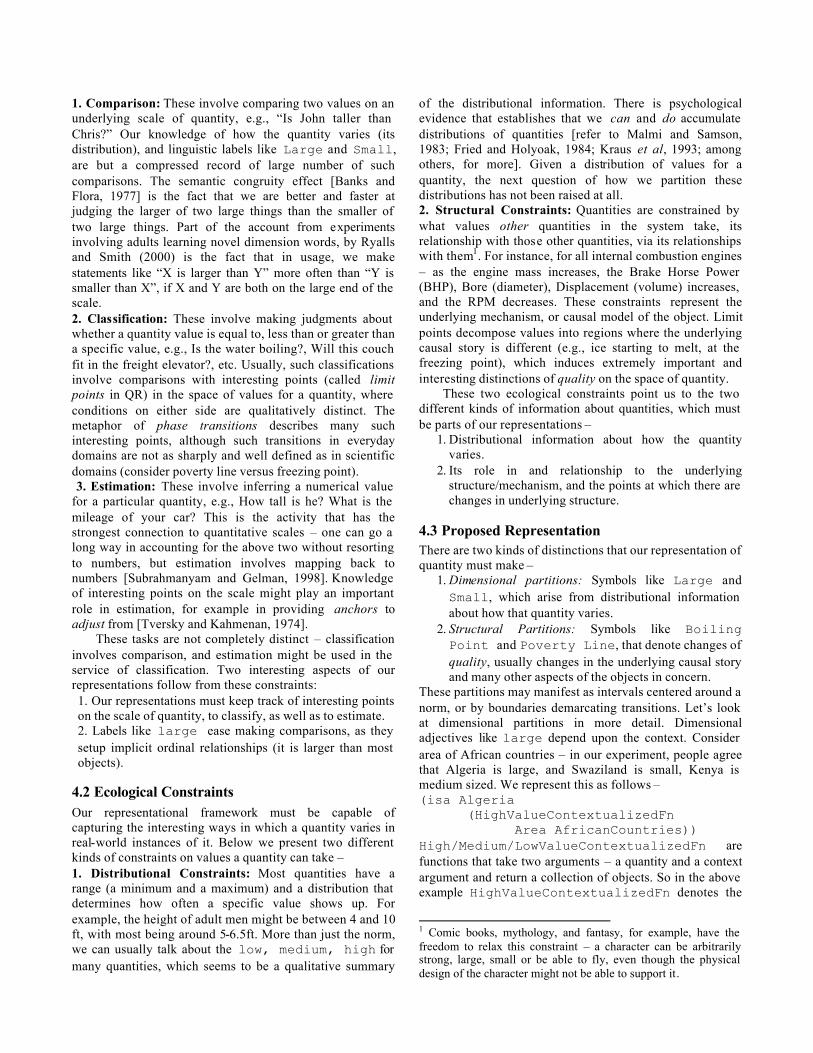
These partitions may manifest as intervals centered around a norm, or by boundaries demarcating transitions. Let’s look at dimensional partitions in more detail. Dimensional adjectives like large depend upon the context. Consider area of African countries – in our experiment, people agree that Algeria is large, and Swaziland is small, Kenya is medium sized. We represent this as follows – (isa Algeria
(HighValueContextualizedFn Area AfricanCountries))
High/Medium/LowValueContextualizedFn are functions that take two arguments – a quantity and a context argument and return a collection of objects. So in the above example HighValueContextualizedFn denotes the
1 Comic books, mythology, and fantasy, for example, have the freedom to relax this constraint – a character can be arbitrarily strong, large, small or be able to fly, even though the physical design of the character might not be able to support it.
collection of large African countries, and the isa statement says that Algeria is an instance of that collection. The LowValueContextualizedFn similarly lets us represent the negative end, for instance small and cheap. 4.3.1 Relationship to Fuzzy Logic The dimensional partitions are reminiscent of linguistic variables in fuzzy logic [Zadeh 1965]. Fuzzy variables can take on values like Large, Medium and Small; and allow us to represent overlapping range of values for these symbols. Fuzzy logic thus provides a framework to represent what Large means. The specific mapping of Large-ness to area of countries, for instance, is a choice of the person building the representation, and is not in the scope of fuzzy logic. Our focus here is that mapping. So dimensional partitions are the answer to the question – what do people mean when they say “a large country,” specifically, what is the mapping between Large and the values of area?
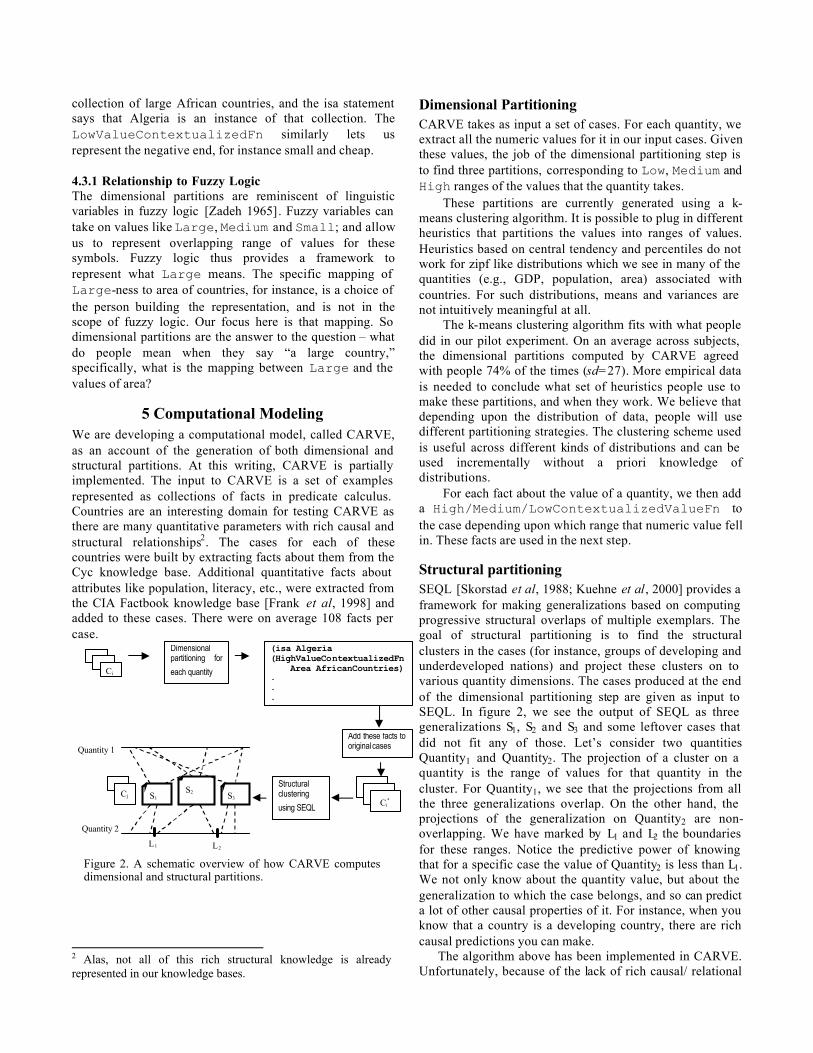
5 Computational Modeling We are developing a computational model, called CARVE, as an account of the generation of both dimensional and structural partitions. At this writing, CARVE is partially implemented. The input to CARVE is a set of examples represented as collections of facts in predicate calculus. Countries are an interesting domain for testing CARVE as there are many quantitative parameters with rich causal and structural relationships2. The cases for each of these countries were built by extracting facts about them from the Cyc knowledge base. Additional quantitative facts about attributes like population, literacy, etc., were extracted from the CIA Factbook knowledge base [Frank et al, 1998] and added to these cases. There were on average 108 facts per case.
Figure 2. A schematic overview of how CARVE computes dimensional and structural partitions.
2 Alas, not all of this rich structural knowledge is already represented in our knowledge bases.
Dimensional Partitioning CARVE takes as input a set of cases. For each quantity, we extract all the numeric values for it in our input cases. Given these values, the job of the dimensional partitioning step is to find three partitions, corresponding to Low, Medium and High ranges of the values that the quantity takes.
These partitions are currently generated using a k-means clustering algorithm. It is possible to plug in different heuristics that partitions the values into ranges of values. Heuristics based on central tendency and percentiles do not work for zipf like distributions which we see in many of the quantities (e.g., GDP, population, area) associated with countries. For such distributions, means and variances are not intuitively meaningful at all.
The k-means clustering algorithm fits with what people did in our pilot experiment. On an average across subjects, the dimensional partitions computed by CARVE agreed with people 74% of the times (sd=27). More empirical data is needed to conclude what set of heuristics people use to make these partitions, and when they work. We believe that depending upon the distribution of data, people will use different partitioning strategies. The clustering scheme used is useful across different kinds of distributions and can be used incrementally without a priori knowledge of distributions.
For each fact about the value of a quantity, we then add a High/Medium/LowContextualizedValueFn to the case depending upon which range that numeric value fell in. These facts are used in the next step.
Structural partitioning SEQL [Skorstad et al, 1988; Kuehne et al, 2000] provides a framework for making generalizations based on computing progressive structural overlaps of multiple exemplars. The goal of structural partitioning is to find the structural clusters in the cases (for instance, groups of developing and underdeveloped nations) and project these clusters on to various quantity dimensions. The cases produced at the end of the dimensional partitioning step are given as input to SEQL. In figure 2, we see the output of SEQL as three generalizations S1, S2 and S3 and some leftover cases that did not fit any of those. Let’s consider two quantities Quantity1 and Quantity2. The projection of a cluster on a quantity is the range of values for that quantity in the cluster. For Quantity1, we see that the projections from all the three generalizations overlap. On the other hand, the projections of the generalization on Quantity2 are non-overlapping. We have marked by L1 and L2 the boundaries for these ranges. Notice the predictive power of knowing that for a specific case the value of Quantity2 is less than L1. We not only know about the quantity value, but about the generalization to which the case belongs, and so can predict a lot of other causal properties of it. For instance, when you know that a country is a developing country, there are rich causal predictions you can make. The algorithm above has been implemented in CARVE. Unfortunately, because of the lack of rich causal/ relational
Dimensional partitioning for
each quantity
(isa Algeria (HighValueContextualizedFn Area AfricanCountries) . . .
Add these facts to original cases
Structural clustering
using SEQL S1
S2 S3 Cj
Ci
Ci*
Quantity 1
L2 L1
Quantity 2
knowledge in the cases, it does not yet find any interesting structural partitions. Structural partitions are a reflection of our deep understanding of the causal and correlational structure of examples. In science, phase transitions, and structural distinctions in socio-economic dimensions were not easily discovered. We hope that by adding more knowledge we will get better structural partitions.
6 Conclusions and Future Work Based on cognitive and linguistic evidence, and arguments from reasoning and ecological constraints, we presented symbolic representations for quantity. We find significant agreement between subjects on dimensional partitions. We presented a computational model for automatically generating these representations.
Currently all the cases are given as input to CARVE. One important way to extend this will be for it to incrementally build and update its representations. Further, we need to create rich structured cases with causal and correlational information and test CARVE.
Acknowledgements This research is supported by the Computer Science Division of the Office of Naval Research. The author would like to thank Ken Forbus, Dedre Gentner, Chris Kennedy, Lance Rips, Jason Jameson, Tom Hinrichs, Sven Kuehne and Julie Saltzman for insightful comments and discussion on the work presented here.
References Ashley, K.D. (1990). Modeling Legal Argument, MIT Press, MA. Banks W. P., and Flora J. (1977). Semantic and Perceptual
Processes in Symbolic Comparisons. Journal of Experimental Psychology: Human Perception and Performance, 3, 278-290.
Bierwish, M. (1967). Some Semantic Universals of German Adjectivals. Foundations of Language, 3, 1-36.
Brown, N. R., & Siegler, R. S. (1993). Metrics and mappings: A framework for understanding real-world quantitative estimation. Psychological Review, 100(3), 511-534.
Cech, C. G. and Shoben, E. J. (1985). Context Effects in Symbolic Magnitude Comparisons. Journal of Experimental Psychology: Learning, Memory and Cognition, 11, 299-315.
Falkenhainer, B., Forbus, K. D., & Gentner, D. (1989). The structure-mapping engine: Algorithm and examples. Artificial Intelligence, 41, 1-63.
Forbus, K. D., Gentner, D., & Law, K. (1995). MAC/FAC: A model of similarity-based retrieval. Cognitive Science, 19(2), 141-205.
Forbus, K. D. (1984). Qualitative process theory. Artificial Intelligence, 24, 85-168.
Fried, L. S., and Holoyak, K. J. (1984). Induction of Category Distributions: A Framework for Classification Learning. Journal of Experimental Psychology: Learning, Memory, and Cognition, 10, 234-257.
Gentner, D. (1983). Structure-mapping: A theoretical framework for analogy. Cognitive Science, 7 , 155-170.
Frank, G.; Farquhar, A.; & Fikes, R. Building a Large Knowledge Base from a Structured Source: The CIA World Fact Book. Knowledge Systems Laboratory, 1998.
Goldstone, R. L. and Rogosky, B. J., (2002). Using relations within conceptual systems to translate across conceptual systems, Cognition, 84, 295-320.
Harnad, S. (1987). Categorical perception. Cambridge: Cambridge University Press.
Holoyak, K. J., and Mah, W. A. (1984). Cognitive Reference Points in Judgments of Symbolic Magnitude. Cognitive Psychology, 14, 328-352.
Holyoak, K. J. and Thagard, P. R. (1989). Analogical Mapping by Constraint Satisfaction, Cognitive Science, 13, 295-355.
Hummel, J.E and Holyoak, K. J. (1997). Distributed representations of structure: a theory of analogical access and mapping, Psychological Review, 104, 427-466.
Kennedy, C. (2003). Towards a Grammar of Vagueness. Presented at the Princeton Semantics Workshop, May 17, 2003
Kraus, S., Ryan, C. S., Judd, C. M., Hastie R., and Park, B. (1993). Use of mental frequency distributions to represent variability among members of social categories. Social Cognition, 11(1), 22-43.
Kuehne, S., Forbus, K., Gentner, D. and Quinn, B.(2000) SEQL: Category learning as progressive abstraction using structure mapping. Proceedings of CogSci 2000.
Leake, D. (Ed.) 1996. Case-based Reasoning: Experiences, Lessons and Future Directions, MIT Press.
Lenat, D. B. and Guha, R. V. (1989). Building large knowledge-based systems: Representation and inference in the Cyc project, Addison-Wesley, Reading, MA.
Malmi, R. A., and Samson, D.J. (1983). Intuitive Averaging of Categorized Numerical Stimuli, Journal of Verbal Learning and Verbal Behavior, 22, 547-559.
Malt, B. and Smith, E. (1984). Correlated Properties in Natural Categories. Journal of Verbal Learning and Verbal Behavior, 23(2), 250-269.
Paritosh, P.K. and Forbus, K.D. (2003). Qualitative Modeling and Similarity in Back of the Envelope Reasoning. In Proceedings of the 25th Cognitive Science Conference.
Ram, A. and Santamaria, J.C. (1997). Continuous case-based reasoning. Artificial Intelligence, 90, 25-77
Rips, L. J., and Turbull, W. (1980) How big is big? Relative and absolute properties in memory. Cognition, 8, 145-174.
Rosch, E. (1975). Cognitive Reference Points. Cognitive Psychology, 7, 532-547.
Ryalls, B. O. and Smith, L. B. (2000). Adults Acquisition of Novel Dimension Words: Creating a Semantic Congruity Effect, Journal of General Psychology, 127(3), 279-326.
Staab, S. and Hahn, U. (1998). Grading on the Fly. In Proceedings of the 20th Annual Meeting of the Cognitive Science Society, Madison, WI.
Tversky, A., and Kahneman, D. (1974). Judgment under uncertainty: Heuristics and biases, Science, 185, pp 1124-1131.
Varzi, A. C. (2003). Vagueness, In Encyclopedia of Cognitive Science, Macmillan and Nature Publishing Group, London.
Zadeh, L. (1965). Fuzzy Sets, Information and Control, 8, 338-353.