Embed Size (px)
Citation preview
Symbol Spotting on Digital Architectural Floor Plans Using a Deep
Learning-based Framework
Alireza Rezvanifar, Melissa Cote, Alexandra Branzan Albu
University of Victoria,
British Columbia, Canada
{arezvani, mcote, aalbu}@uvic.ca
Abstract
This papers focuses on symbol spotting on real-world
digital architectural floor plans with a deep learning (DL)-
based framework. Traditional on-the-fly symbol spotting
methods are unable to address the semantic challenge of
graphical notation variability, i.e. low intra-class symbol
similarity, an issue that is particularly important in ar-
chitectural floor plan analysis. The presence of occlusion
and clutter, characteristic of real-world plans, along with
a varying graphical symbol complexity from almost trivial
to highly complex, also pose challenges to existing spotting
methods. In this paper, we address all of the above issues
by leveraging recent advances in DL and adapting an ob-
ject detection framework based on the You-Only-Look-Once
(YOLO) architecture. We propose a training strategy based
on tiles, avoiding many issues particular to DL-based ob-
ject detection networks related to the relative small size of
symbols compared to entire floor plans, aspect ratios, and
data augmentation. Experiments on real-world floor plans
demonstrate that our method successfully detects architec-
tural symbols with low intra-class similarity and of vari-
able graphical complexity, even in the presence of heavy
occlusion and clutter. Additional experiments on the pub-
lic SESYD dataset confirm that our proposed approach can
deal with various degradation and noise levels and outper-
forms other symbol spotting methods.
1. Introduction
Symbol spotting [32, 37, 38] refers to the retrieval of
graphical symbols embedded in larger images, typically
in the form of a ranked list of regions of interest more
likely to contain the symbols. Unlike symbol recognition,
which aims to automatically label an already isolated sym-
bol, spotting happens in context. It is typically carried out
on the fly; no prior information about the shape of the sym-
bols is known, and therefore machine learning-based meth-
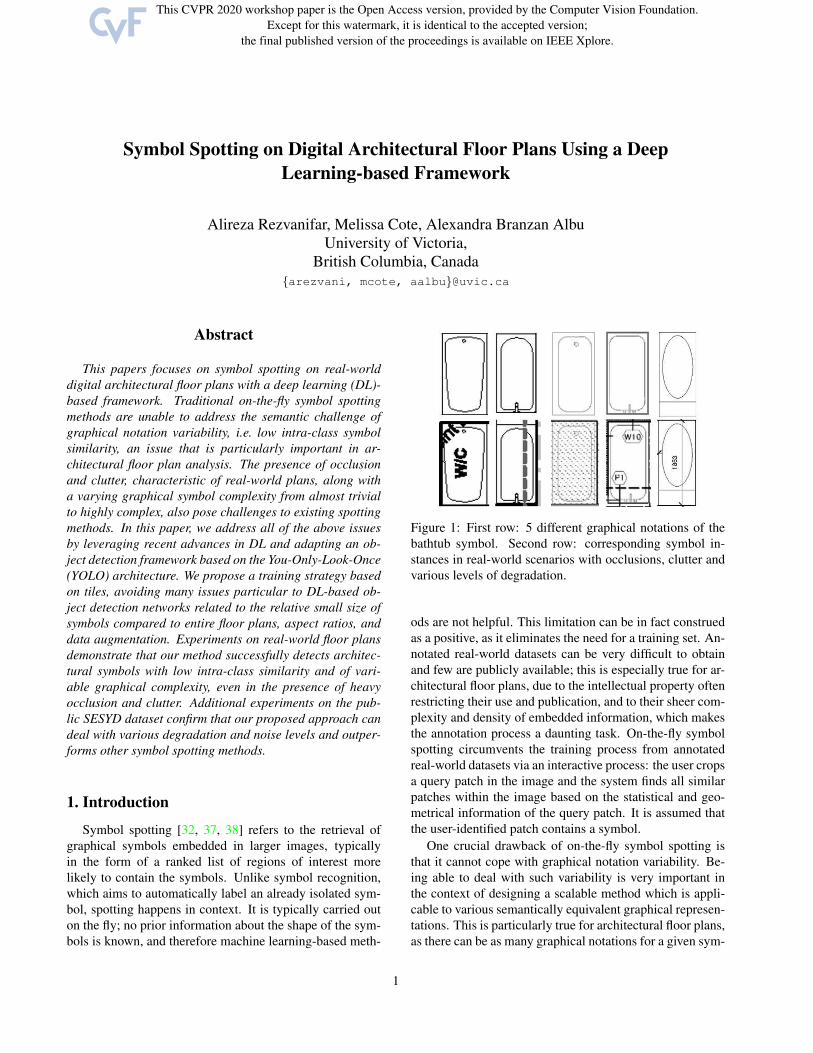
Figure 1: First row: 5 different graphical notations of the
bathtub symbol. Second row: corresponding symbol in-
stances in real-world scenarios with occlusions, clutter and
various levels of degradation.
ods are not helpful. This limitation can be in fact construed
as a positive, as it eliminates the need for a training set. An-
notated real-world datasets can be very difficult to obtain
and few are publicly available; this is especially true for ar-
chitectural floor plans, due to the intellectual property often
restricting their use and publication, and to their sheer com-
plexity and density of embedded information, which makes
the annotation process a daunting task. On-the-fly symbol
spotting circumvents the training process from annotated
real-world datasets via an interactive process: the user crops
a query patch in the image and the system finds all similar
patches within the image based on the statistical and geo-
metrical information of the query patch. It is assumed that
the user-identified patch contains a symbol.
One crucial drawback of on-the-fly symbol spotting is
that it cannot cope with graphical notation variability. Be-
ing able to deal with such variability is very important in
the context of designing a scalable method which is appli-
cable to various semantically equivalent graphical represen-
tations. This is particularly true for architectural floor plans,
as there can be as many graphical notations for a given sym-
1
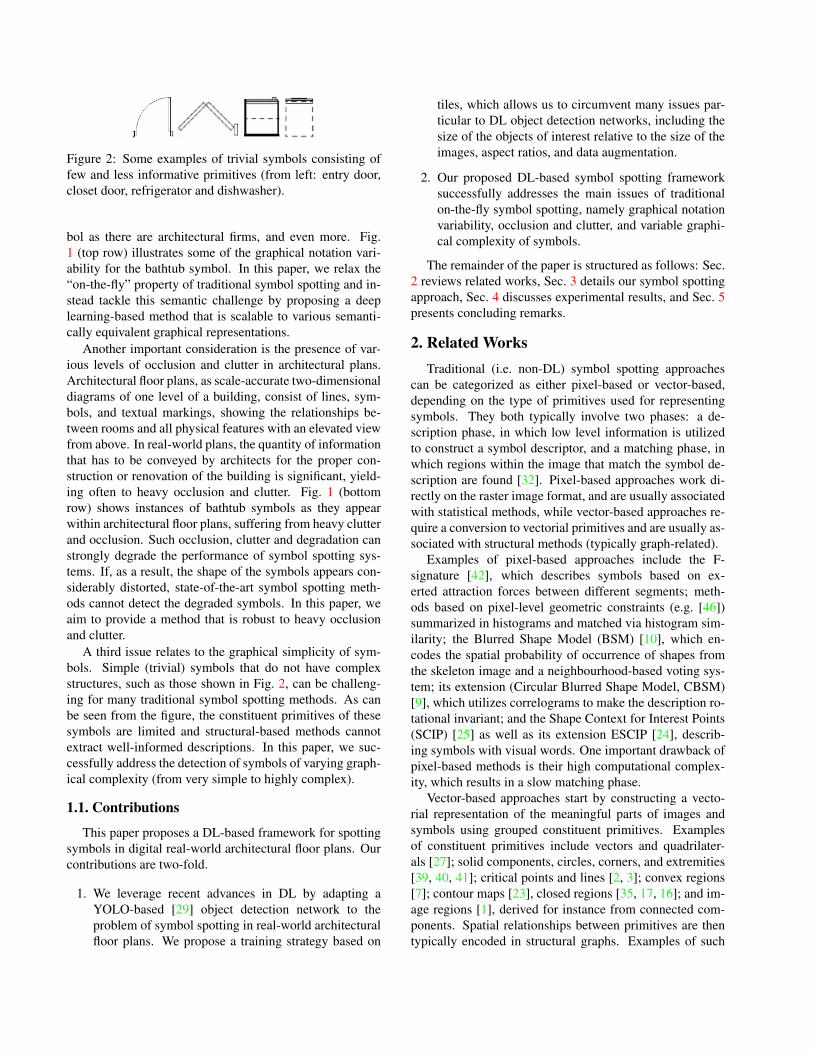
Figure 2: Some examples of trivial symbols consisting of
few and less informative primitives (from left: entry door,
closet door, refrigerator and dishwasher).
bol as there are architectural firms, and even more. Fig.
1 (top row) illustrates some of the graphical notation vari-
ability for the bathtub symbol. In this paper, we relax the
“on-the-fly” property of traditional symbol spotting and in-
stead tackle this semantic challenge by proposing a deep
learning-based method that is scalable to various semanti-
cally equivalent graphical representations.
Another important consideration is the presence of var-
ious levels of occlusion and clutter in architectural plans.
Architectural floor plans, as scale-accurate two-dimensional
diagrams of one level of a building, consist of lines, sym-
bols, and textual markings, showing the relationships be-
tween rooms and all physical features with an elevated view
from above. In real-world plans, the quantity of information
that has to be conveyed by architects for the proper con-
struction or renovation of the building is significant, yield-
ing often to heavy occlusion and clutter. Fig. 1 (bottom
row) shows instances of bathtub symbols as they appear
within architectural floor plans, suffering from heavy clutter
and occlusion. Such occlusion, clutter and degradation can
strongly degrade the performance of symbol spotting sys-
tems. If, as a result, the shape of the symbols appears con-
siderably distorted, state-of-the-art symbol spotting meth-
ods cannot detect the degraded symbols. In this paper, we
aim to provide a method that is robust to heavy occlusion
and clutter.
A third issue relates to the graphical simplicity of sym-
bols. Simple (trivial) symbols that do not have complex
structures, such as those shown in Fig. 2, can be challeng-
ing for many traditional symbol spotting methods. As can
be seen from the figure, the constituent primitives of these
symbols are limited and structural-based methods cannot
extract well-informed descriptions. In this paper, we suc-
cessfully address the detection of symbols of varying graph-
ical complexity (from very simple to highly complex).
1.1. Contributions
This paper proposes a DL-based framework for spotting
symbols in digital real-world architectural floor plans. Our
contributions are two-fold.
1. We leverage recent advances in DL by adapting a
YOLO-based [29] object detection network to the
problem of symbol spotting in real-world architectural
floor plans. We propose a training strategy based on
tiles, which allows us to circumvent many issues par-
ticular to DL object detection networks, including the
size of the objects of interest relative to the size of the
images, aspect ratios, and data augmentation.
2. Our proposed DL-based symbol spotting framework
successfully addresses the main issues of traditional
on-the-fly symbol spotting, namely graphical notation
variability, occlusion and clutter, and variable graphi-
cal complexity of symbols.
The remainder of the paper is structured as follows: Sec.
2 reviews related works, Sec. 3 details our symbol spotting
approach, Sec. 4 discusses experimental results, and Sec. 5
presents concluding remarks.
2. Related Works
Traditional (i.e. non-DL) symbol spotting approaches
can be categorized as either pixel-based or vector-based,
depending on the type of primitives used for representing
symbols. They both typically involve two phases: a de-
scription phase, in which low level information is utilized
to construct a symbol descriptor, and a matching phase, in
which regions within the image that match the symbol de-
scription are found [32]. Pixel-based approaches work di-
rectly on the raster image format, and are usually associated
with statistical methods, while vector-based approaches re-
quire a conversion to vectorial primitives and are usually as-
sociated with structural methods (typically graph-related).
Examples of pixel-based approaches include the F-
signature [42], which describes symbols based on ex-
erted attraction forces between different segments; meth-
ods based on pixel-level geometric constraints (e.g. [46])
summarized in histograms and matched via histogram sim-
ilarity; the Blurred Shape Model (BSM) [10], which en-
codes the spatial probability of occurrence of shapes from
the skeleton image and a neighbourhood-based voting sys-
tem; its extension (Circular Blurred Shape Model, CBSM)
[9], which utilizes correlograms to make the description ro-
tational invariant; and the Shape Context for Interest Points
(SCIP) [25] as well as its extension ESCIP [24], describ-
ing symbols with visual words. One important drawback of
pixel-based methods is their high computational complex-
ity, which results in a slow matching phase.
Vector-based approaches start by constructing a vecto-
rial representation of the meaningful parts of images and
symbols using grouped constituent primitives. Examples
of constituent primitives include vectors and quadrilater-
als [27]; solid components, circles, corners, and extremities
[39, 40, 41]; critical points and lines [2, 3]; convex regions
[7]; contour maps [23], closed regions [35, 17, 16]; and im-
age regions [1], derived for instance from connected com-
ponents. Spatial relationships between primitives are then
typically encoded in structural graphs. Examples of such
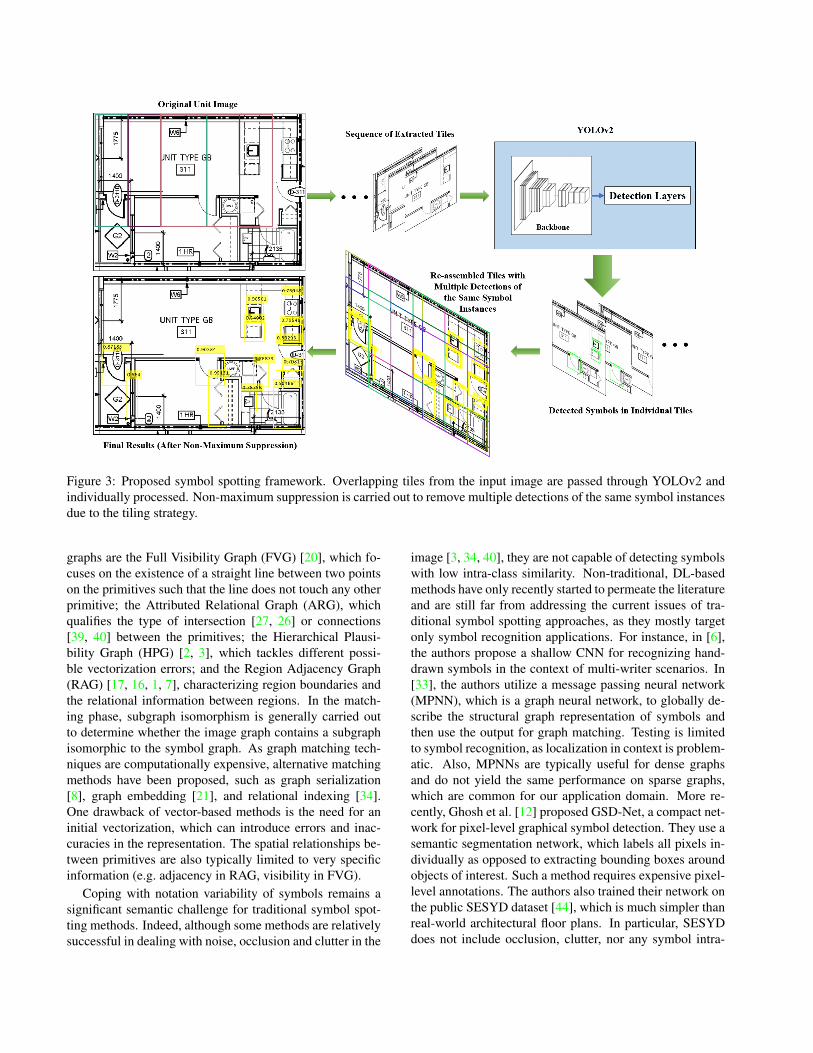
Figure 3: Proposed symbol spotting framework. Overlapping tiles from the input image are passed through YOLOv2 and
individually processed. Non-maximum suppression is carried out to remove multiple detections of the same symbol instances
due to the tiling strategy.
graphs are the Full Visibility Graph (FVG) [20], which fo-
cuses on the existence of a straight line between two points
on the primitives such that the line does not touch any other
primitive; the Attributed Relational Graph (ARG), which
qualifies the type of intersection [27, 26] or connections
[39, 40] between the primitives; the Hierarchical Plausi-
bility Graph (HPG) [2, 3], which tackles different possi-
ble vectorization errors; and the Region Adjacency Graph
(RAG) [17, 16, 1, 7], characterizing region boundaries and
the relational information between regions. In the match-
ing phase, subgraph isomorphism is generally carried out
to determine whether the image graph contains a subgraph
isomorphic to the symbol graph. As graph matching tech-
niques are computationally expensive, alternative matching
methods have been proposed, such as graph serialization
[8], graph embedding [21], and relational indexing [34].
One drawback of vector-based methods is the need for an
initial vectorization, which can introduce errors and inac-
curacies in the representation. The spatial relationships be-
tween primitives are also typically limited to very specific
information (e.g. adjacency in RAG, visibility in FVG).
Coping with notation variability of symbols remains a
significant semantic challenge for traditional symbol spot-
ting methods. Indeed, although some methods are relatively
successful in dealing with noise, occlusion and clutter in the
image [3, 34, 40], they are not capable of detecting symbols
with low intra-class similarity. Non-traditional, DL-based
methods have only recently started to permeate the literature
and are still far from addressing the current issues of tra-
ditional symbol spotting approaches, as they mostly target
only symbol recognition applications. For instance, in [6],
the authors propose a shallow CNN for recognizing hand-
drawn symbols in the context of multi-writer scenarios. In
[33], the authors utilize a message passing neural network
(MPNN), which is a graph neural network, to globally de-
scribe the structural graph representation of symbols and
then use the output for graph matching. Testing is limited
to symbol recognition, as localization in context is problem-
atic. Also, MPNNs are typically useful for dense graphs
and do not yield the same performance on sparse graphs,
which are common for our application domain. More re-
cently, Ghosh et al. [12] proposed GSD-Net, a compact net-
work for pixel-level graphical symbol detection. They use a
semantic segmentation network, which labels all pixels in-
dividually as opposed to extracting bounding boxes around
objects of interest. Such a method requires expensive pixel-
level annotations. The authors also trained their network on
the public SESYD dataset [44], which is much simpler than
real-world architectural floor plans. In particular, SESYD
does not include occlusion, clutter, nor any symbol intra-
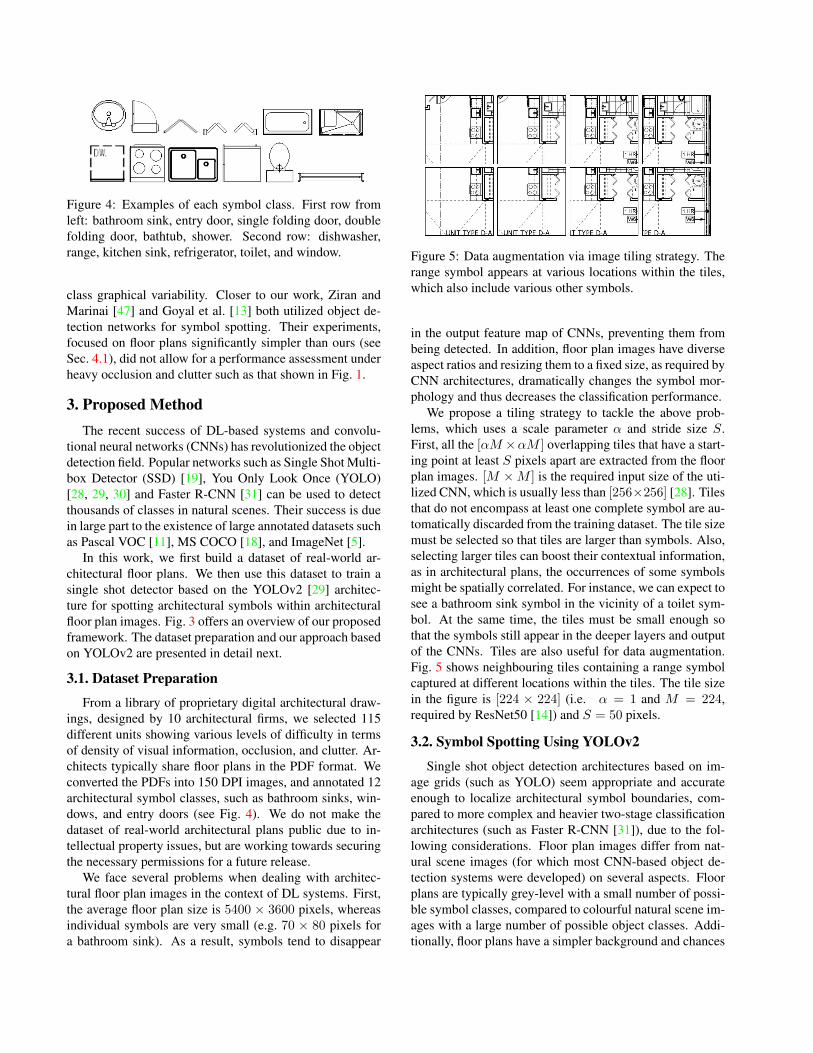
Figure 4: Examples of each symbol class. First row from
left: bathroom sink, entry door, single folding door, double
folding door, bathtub, shower. Second row: dishwasher,
range, kitchen sink, refrigerator, toilet, and window.
class graphical variability. Closer to our work, Ziran and
Marinai [47] and Goyal et al. [13] both utilized object de-
tection networks for symbol spotting. Their experiments,
focused on floor plans significantly simpler than ours (see
Sec. 4.1), did not allow for a performance assessment under
heavy occlusion and clutter such as that shown in Fig. 1.
3. Proposed Method
The recent success of DL-based systems and convolu-
tional neural networks (CNNs) has revolutionized the object
detection field. Popular networks such as Single Shot Multi-
box Detector (SSD) [19], You Only Look Once (YOLO)
[28, 29, 30] and Faster R-CNN [31] can be used to detect
thousands of classes in natural scenes. Their success is due
in large part to the existence of large annotated datasets such
as Pascal VOC [11], MS COCO [18], and ImageNet [5].
In this work, we first build a dataset of real-world ar-
chitectural floor plans. We then use this dataset to train a
single shot detector based on the YOLOv2 [29] architec-
ture for spotting architectural symbols within architectural
floor plan images. Fig. 3 offers an overview of our proposed
framework. The dataset preparation and our approach based
on YOLOv2 are presented in detail next.
3.1. Dataset Preparation
From a library of proprietary digital architectural draw-
ings, designed by 10 architectural firms, we selected 115
different units showing various levels of difficulty in terms
of density of visual information, occlusion, and clutter. Ar-
chitects typically share floor plans in the PDF format. We
converted the PDFs into 150 DPI images, and annotated 12
architectural symbol classes, such as bathroom sinks, win-
dows, and entry doors (see Fig. 4). We do not make the
dataset of real-world architectural plans public due to in-
tellectual property issues, but are working towards securing
the necessary permissions for a future release.
We face several problems when dealing with architec-
tural floor plan images in the context of DL systems. First,
the average floor plan size is 5400 × 3600 pixels, whereas
individual symbols are very small (e.g. 70 × 80 pixels for
a bathroom sink). As a result, symbols tend to disappear
Figure 5: Data augmentation via image tiling strategy. The
range symbol appears at various locations within the tiles,
which also include various other symbols.
in the output feature map of CNNs, preventing them from
being detected. In addition, floor plan images have diverse
aspect ratios and resizing them to a fixed size, as required by
CNN architectures, dramatically changes the symbol mor-
phology and thus decreases the classification performance.
We propose a tiling strategy to tackle the above prob-
lems, which uses a scale parameter α and stride size S.
First, all the [αM ×αM ] overlapping tiles that have a start-
ing point at least S pixels apart are extracted from the floor
plan images. [M ×M ] is the required input size of the uti-
lized CNN, which is usually less than [256×256] [28]. Tiles
that do not encompass at least one complete symbol are au-
tomatically discarded from the training dataset. The tile size
must be selected so that tiles are larger than symbols. Also,
selecting larger tiles can boost their contextual information,
as in architectural plans, the occurrences of some symbols
might be spatially correlated. For instance, we can expect to
see a bathroom sink symbol in the vicinity of a toilet sym-
bol. At the same time, the tiles must be small enough so
that the symbols still appear in the deeper layers and output
of the CNNs. Tiles are also useful for data augmentation.
Fig. 5 shows neighbouring tiles containing a range symbol
captured at different locations within the tiles. The tile size
in the figure is [224 × 224] (i.e. α = 1 and M = 224,
required by ResNet50 [14]) and S = 50 pixels.
3.2. Symbol Spotting Using YOLOv2
Single shot object detection architectures based on im-
age grids (such as YOLO) seem appropriate and accurate
enough to localize architectural symbol boundaries, com-
pared to more complex and heavier two-stage classification
architectures (such as Faster R-CNN [31]), due to the fol-
lowing considerations. Floor plan images differ from nat-
ural scene images (for which most CNN-based object de-
tection systems were developed) on several aspects. Floor
plans are typically grey-level with a small number of possi-
ble symbol classes, compared to colourful natural scene im-
ages with a large number of possible object classes. Addi-
tionally, floor plans have a simpler background and chances
of overlap between symbols is low (this does not apply
of course to other parts of the image such as textual in-
formation and measurements, which may have a consider-
able overlap with symbols). Here, we use YOLOv2 [29]
as a single shot object detection architecture. We selected
YOLOv2 instead of YOLO [28] because of its higher lo-
calization accuracy and recall performance. The improve-
ments of YOLOv3 [30] consist mainly in a prediction across
three scales and a better feature extraction network, but at
the cost of a slower and heavier system. As architectural
symbols have similar sizes and simpler structures compared
to objects in natural scenes, YOLOv3 cannot offer a notice-
able improvement over YOLOv2. In YOLOv2, the input
image is divided into non-overlapping grids. Each grid can
only predict one object. A backbone CNN (e.g. Darknet19)
extracts features and for each grid, a set of prior anchors are
evaluated based on a loss function which penalizes localiza-
tion, confidence and classification errors.
In the training phase, we use the tile dataset described
in Sec. 3.1) to train the network. In the inference phase,
the input image is first broken down into tiles. Each tile is
then passed through the network and symbols are detected.
Fig. 3 shows the inference process. The detected symbols in
the overlapping tiles are shown in the bottom-right image.
As a given instance of a symbol typically appears in several
tiles, it is detected multiple times. To refine and concate-
nate the results, we perform a non-maximum suppression
step as follows. For overlapping detections, we compare all
pairs of bounding boxes. If their overlap is larger than a
threshold (a percentage of the size of the smaller bounding
box), the bounding box with the highest classification score
is retained. In cases of close scores, the larger bounding box
is selected and the smaller one is removed. The bottom-left
image in Fig. 3 shows the final results for a 10% threshold.
4. Results and Discussion
We assess our framework on a real-world floor plan
dataset and on SESYD, a public dataset of synthetic doc-
uments. For both datasets, we evaluate the performance on
individual tiles first, and then assess entire floor plans. We
provide a comparative analysis of our approach with respect
to state-of-the-art symbol spotting methods for SESYD
only, as code implementations of these methods are either
unavailable or not functional on our real world dataset.
4.1. RealWorld Images
From the 115 units of the dataset (see Sec. 3.1), we used
90 units for extracting tiles. The remaining 25 units are used
as a test set for evaluating the framework on entire floor
plans. Given S = 50 and a tile size of [227 × 227], the 90
units generated 4707 tiles containing at least one complete
symbol. We randomly selected 80% of those 4707 tiles for
training the network, with the remaining 20% tiles used for
validation. During training, we employed the Adam opti-
mizer [15] with a mini-batch size of 30, a fixed learning rate
of 10−4, and data augmentation with horizontal and vertical
flipping and rotation and scale changes. Moreover, 10 prior
anchors were calculated from the size of the symbols. We
experimented with three different backbones, the original
Darknet19 [29], as well as ResNet50 [14] and Xception [4].
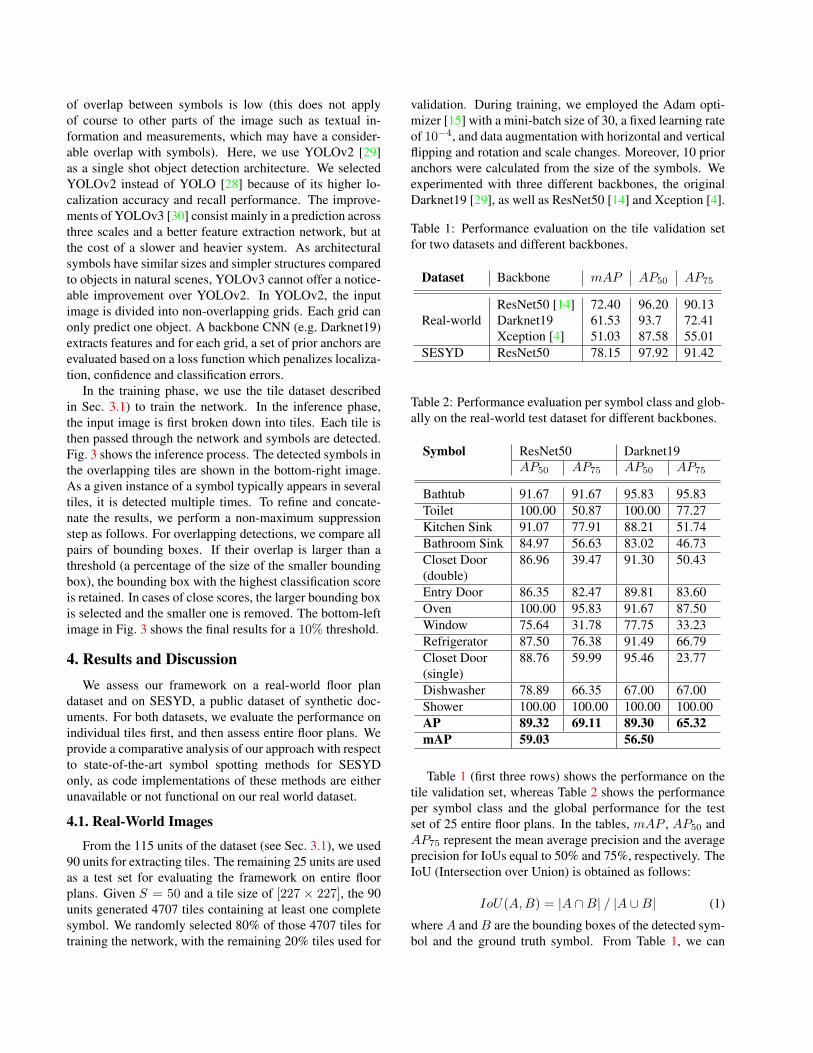
Table 1: Performance evaluation on the tile validation set
for two datasets and different backbones.
Dataset Backbone mAP AP50 AP75
Real-world
ResNet50 [14] 72.40 96.20 90.13
Darknet19 61.53 93.7 72.41
Xception [4] 51.03 87.58 55.01
SESYD ResNet50 78.15 97.92 91.42
Table 2: Performance evaluation per symbol class and glob-
ally on the real-world test dataset for different backbones.
Symbol ResNet50 Darknet19
AP50 AP75 AP50 AP75
Bathtub 91.67 91.67 95.83 95.83
Toilet 100.00 50.87 100.00 77.27
Kitchen Sink 91.07 77.91 88.21 51.74
Bathroom Sink 84.97 56.63 83.02 46.73
Closet Door 86.96 39.47 91.30 50.43
(double)
Entry Door 86.35 82.47 89.81 83.60
Oven 100.00 95.83 91.67 87.50
Window 75.64 31.78 77.75 33.23
Refrigerator 87.50 76.38 91.49 66.79
Closet Door 88.76 59.99 95.46 23.77
(single)
Dishwasher 78.89 66.35 67.00 67.00
Shower 100.00 100.00 100.00 100.00
AP 89.32 69.11 89.30 65.32
mAP 59.03 56.50
Table 1 (first three rows) shows the performance on the
tile validation set, whereas Table 2 shows the performance
per symbol class and the global performance for the test
set of 25 entire floor plans. In the tables, mAP , AP50 and
AP75 represent the mean average precision and the average
precision for IoUs equal to 50% and 75%, respectively. The
IoU (Intersection over Union) is obtained as follows:
IoU(A,B) = |A ∩B| / |A ∪B| (1)
where A and B are the bounding boxes of the detected sym-
bol and the ground truth symbol. From Table 1, we can
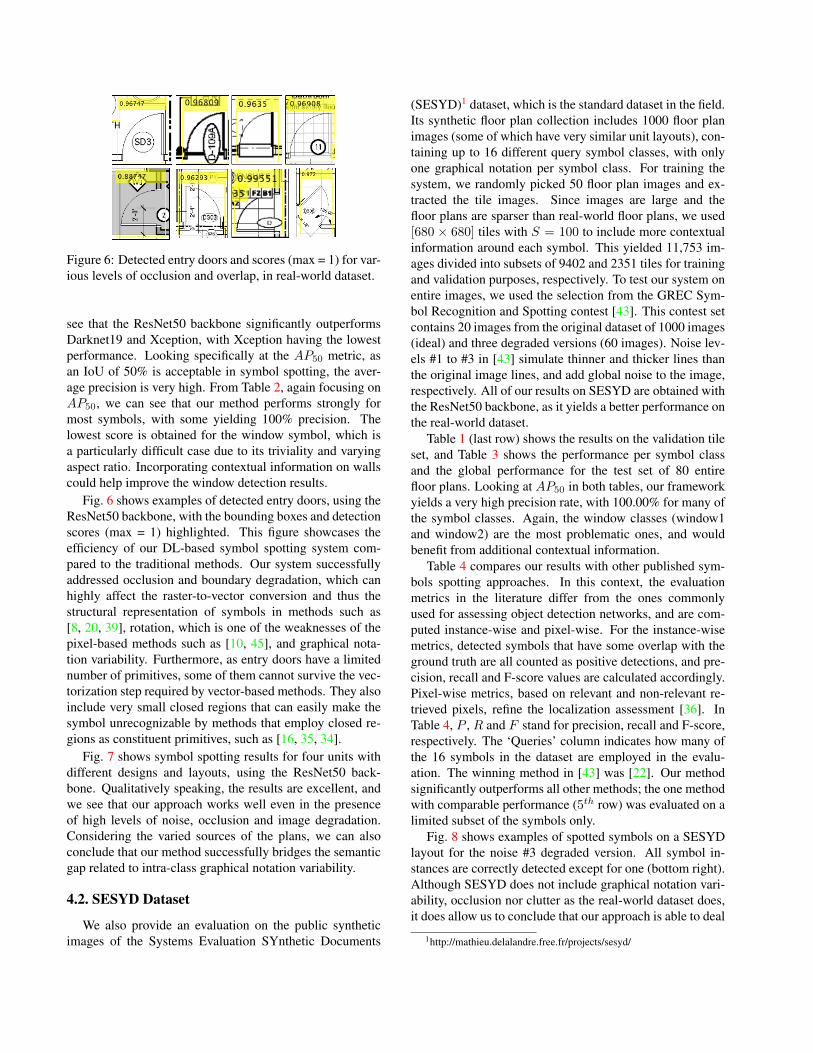
Figure 6: Detected entry doors and scores (max = 1) for var-
ious levels of occlusion and overlap, in real-world dataset.
see that the ResNet50 backbone significantly outperforms
Darknet19 and Xception, with Xception having the lowest
performance. Looking specifically at the AP50 metric, as
an IoU of 50% is acceptable in symbol spotting, the aver-
age precision is very high. From Table 2, again focusing on
AP50, we can see that our method performs strongly for
most symbols, with some yielding 100% precision. The
lowest score is obtained for the window symbol, which is
a particularly difficult case due to its triviality and varying
aspect ratio. Incorporating contextual information on walls
could help improve the window detection results.
Fig. 6 shows examples of detected entry doors, using the
ResNet50 backbone, with the bounding boxes and detection
scores (max = 1) highlighted. This figure showcases the
efficiency of our DL-based symbol spotting system com-
pared to the traditional methods. Our system successfully
addressed occlusion and boundary degradation, which can
highly affect the raster-to-vector conversion and thus the
structural representation of symbols in methods such as
[8, 20, 39], rotation, which is one of the weaknesses of the
pixel-based methods such as [10, 45], and graphical nota-
tion variability. Furthermore, as entry doors have a limited
number of primitives, some of them cannot survive the vec-
torization step required by vector-based methods. They also
include very small closed regions that can easily make the
symbol unrecognizable by methods that employ closed re-
gions as constituent primitives, such as [16, 35, 34].
Fig. 7 shows symbol spotting results for four units with
different designs and layouts, using the ResNet50 back-
bone. Qualitatively speaking, the results are excellent, and
we see that our approach works well even in the presence
of high levels of noise, occlusion and image degradation.
Considering the varied sources of the plans, we can also
conclude that our method successfully bridges the semantic
gap related to intra-class graphical notation variability.
4.2. SESYD Dataset
We also provide an evaluation on the public synthetic
images of the Systems Evaluation SYnthetic Documents
(SESYD)1 dataset, which is the standard dataset in the field.
Its synthetic floor plan collection includes 1000 floor plan
images (some of which have very similar unit layouts), con-
taining up to 16 different query symbol classes, with only
one graphical notation per symbol class. For training the
system, we randomly picked 50 floor plan images and ex-
tracted the tile images. Since images are large and the
floor plans are sparser than real-world floor plans, we used
[680 × 680] tiles with S = 100 to include more contextual
information around each symbol. This yielded 11,753 im-
ages divided into subsets of 9402 and 2351 tiles for training
and validation purposes, respectively. To test our system on
entire images, we used the selection from the GREC Sym-
bol Recognition and Spotting contest [43]. This contest set
contains 20 images from the original dataset of 1000 images
(ideal) and three degraded versions (60 images). Noise lev-
els #1 to #3 in [43] simulate thinner and thicker lines than
the original image lines, and add global noise to the image,
respectively. All of our results on SESYD are obtained with
the ResNet50 backbone, as it yields a better performance on
the real-world dataset.
Table 1 (last row) shows the results on the validation tile
set, and Table 3 shows the performance per symbol class
and the global performance for the test set of 80 entire
floor plans. Looking at AP50 in both tables, our framework
yields a very high precision rate, with 100.00% for many of
the symbol classes. Again, the window classes (window1
and window2) are the most problematic ones, and would
benefit from additional contextual information.
Table 4 compares our results with other published sym-
bols spotting approaches. In this context, the evaluation
metrics in the literature differ from the ones commonly
used for assessing object detection networks, and are com-
puted instance-wise and pixel-wise. For the instance-wise
metrics, detected symbols that have some overlap with the
ground truth are all counted as positive detections, and pre-
cision, recall and F-score values are calculated accordingly.
Pixel-wise metrics, based on relevant and non-relevant re-
trieved pixels, refine the localization assessment [36]. In
Table 4, P , R and F stand for precision, recall and F-score,
respectively. The ‘Queries’ column indicates how many of
the 16 symbols in the dataset are employed in the evalu-
ation. The winning method in [43] was [22]. Our method
significantly outperforms all other methods; the one method
with comparable performance (5th row) was evaluated on a
limited subset of the symbols only.
Fig. 8 shows examples of spotted symbols on a SESYD
layout for the noise #3 degraded version. All symbol in-
stances are correctly detected except for one (bottom right).
Although SESYD does not include graphical notation vari-
ability, occlusion nor clutter as the real-world dataset does,
it does allow us to conclude that our approach is able to deal
1http://mathieu.delalandre.free.fr/projects/sesyd/
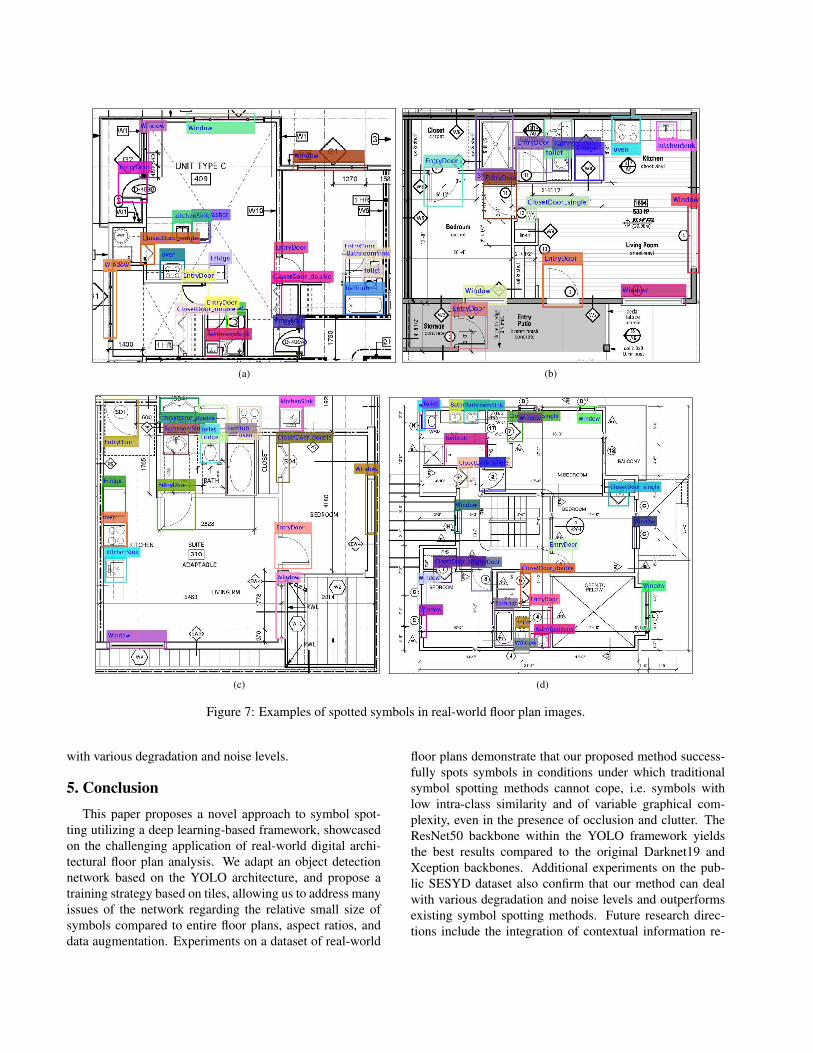
(a) (b)
(c) (d)
Figure 7: Examples of spotted symbols in real-world floor plan images.
with various degradation and noise levels.
5. Conclusion
This paper proposes a novel approach to symbol spot-
ting utilizing a deep learning-based framework, showcased
on the challenging application of real-world digital archi-
tectural floor plan analysis. We adapt an object detection
network based on the YOLO architecture, and propose a
training strategy based on tiles, allowing us to address many
issues of the network regarding the relative small size of
symbols compared to entire floor plans, aspect ratios, and
data augmentation. Experiments on a dataset of real-world
floor plans demonstrate that our proposed method success-
fully spots symbols in conditions under which traditional
symbol spotting methods cannot cope, i.e. symbols with
low intra-class similarity and of variable graphical com-
plexity, even in the presence of occlusion and clutter. The
ResNet50 backbone within the YOLO framework yields
the best results compared to the original Darknet19 and
Xception backbones. Additional experiments on the pub-
lic SESYD dataset also confirm that our method can deal
with various degradation and noise levels and outperforms
existing symbol spotting methods. Future research direc-
tions include the integration of contextual information re-
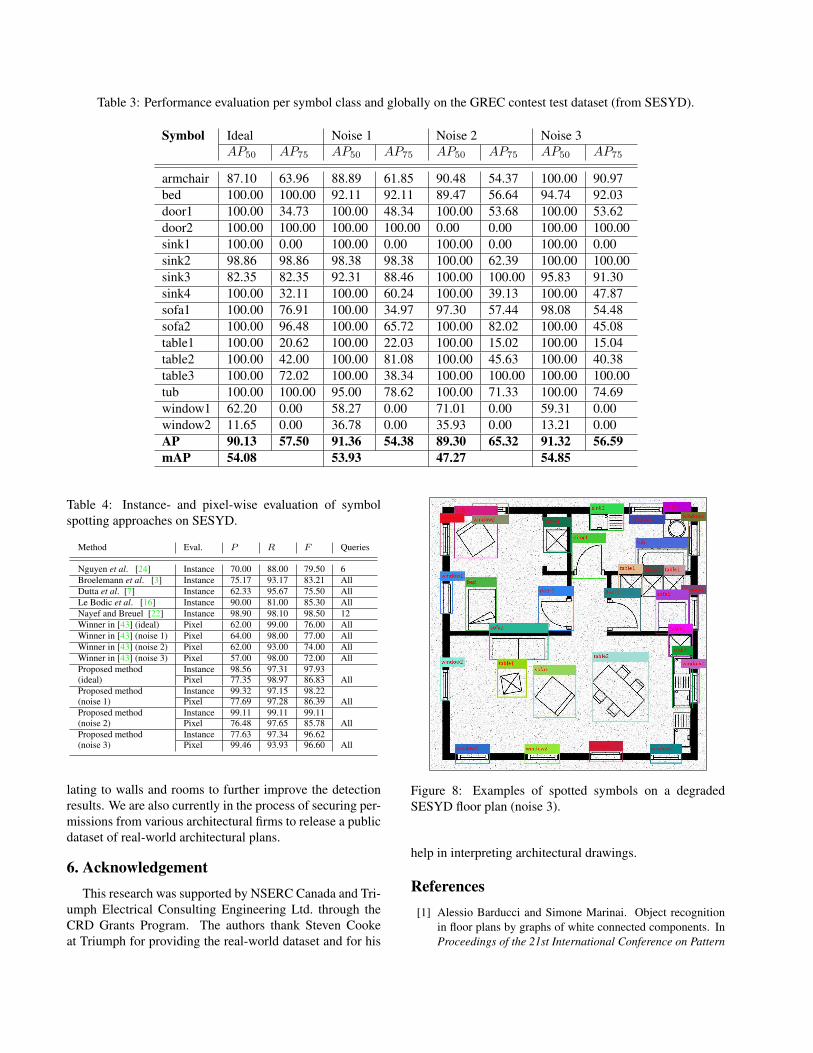
Table 3: Performance evaluation per symbol class and globally on the GREC contest test dataset (from SESYD).
Symbol Ideal Noise 1 Noise 2 Noise 3
AP50 AP75 AP50 AP75 AP50 AP75 AP50 AP75
armchair 87.10 63.96 88.89 61.85 90.48 54.37 100.00 90.97
bed 100.00 100.00 92.11 92.11 89.47 56.64 94.74 92.03
door1 100.00 34.73 100.00 48.34 100.00 53.68 100.00 53.62
door2 100.00 100.00 100.00 100.00 0.00 0.00 100.00 100.00
sink1 100.00 0.00 100.00 0.00 100.00 0.00 100.00 0.00
sink2 98.86 98.86 98.38 98.38 100.00 62.39 100.00 100.00
sink3 82.35 82.35 92.31 88.46 100.00 100.00 95.83 91.30
sink4 100.00 32.11 100.00 60.24 100.00 39.13 100.00 47.87
sofa1 100.00 76.91 100.00 34.97 97.30 57.44 98.08 54.48
sofa2 100.00 96.48 100.00 65.72 100.00 82.02 100.00 45.08
table1 100.00 20.62 100.00 22.03 100.00 15.02 100.00 15.04
table2 100.00 42.00 100.00 81.08 100.00 45.63 100.00 40.38
table3 100.00 72.02 100.00 38.34 100.00 100.00 100.00 100.00
tub 100.00 100.00 95.00 78.62 100.00 71.33 100.00 74.69
window1 62.20 0.00 58.27 0.00 71.01 0.00 59.31 0.00
window2 11.65 0.00 36.78 0.00 35.93 0.00 13.21 0.00
AP 90.13 57.50 91.36 54.38 89.30 65.32 91.32 56.59
mAP 54.08 53.93 47.27 54.85
Table 4: Instance- and pixel-wise evaluation of symbol
spotting approaches on SESYD.
Method Eval. P R F Queries
Nguyen et al. [24] Instance 70.00 88.00 79.50 6
Broelemann et al. [3] Instance 75.17 93.17 83.21 All
Dutta et al. [7] Instance 62.33 95.67 75.50 All
Le Bodic et al. [16] Instance 90.00 81.00 85.30 All
Nayef and Breuel [22] Instance 98.90 98.10 98.50 12
Winner in [43] (ideal) Pixel 62.00 99.00 76.00 All
Winner in [43] (noise 1) Pixel 64.00 98.00 77.00 All
Winner in [43] (noise 2) Pixel 62.00 93.00 74.00 All
Winner in [43] (noise 3) Pixel 57.00 98.00 72.00 All
Proposed method Instance 98.56 97.31 97.93
(ideal) Pixel 77.35 98.97 86.83 All
Proposed method Instance 99.32 97.15 98.22
(noise 1) Pixel 77.69 97.28 86.39 All
Proposed method Instance 99.11 99.11 99.11
(noise 2) Pixel 76.48 97.65 85.78 All
Proposed method Instance 77.63 97.34 96.62
(noise 3) Pixel 99.46 93.93 96.60 All
lating to walls and rooms to further improve the detection
results. We are also currently in the process of securing per-
missions from various architectural firms to release a public
dataset of real-world architectural plans.
6. Acknowledgement
This research was supported by NSERC Canada and Tri-
umph Electrical Consulting Engineering Ltd. through the
CRD Grants Program. The authors thank Steven Cooke
at Triumph for providing the real-world dataset and for his
Figure 8: Examples of spotted symbols on a degraded
SESYD floor plan (noise 3).
help in interpreting architectural drawings.
References
[1] Alessio Barducci and Simone Marinai. Object recognition
in floor plans by graphs of white connected components. In
Proceedings of the 21st International Conference on Pattern
Recognition (ICPR’12), pages 298–301. IEEE, 2012. 2, 3
[2] Klaus Broelemann, Anjan Dutta, Xiaoyi Jiang, and Josep
Llados. Hierarchical graph representation for symbol spot-
ting in graphical document images. Structural, Syntactic,
and Statistical Pattern Recognition, pages 529–538, 2012.
2, 3
[3] Klaus Broelemann, Anjan Dutta, Xiaoyi Jiang, and Josep
Llados. Hierarchical plausibility-graphs for symbol spotting
in graphical documents. In Proceedings of the International
Workshop on Graphics Recognition (GREC’13), pages 25–
37. Springer, 2013. 2, 3, 8
[4] Francois Chollet. Xception: Deep learning with depth-
wise separable convolutions. In Proceedings of the IEEE
Conference on Computer Vision and Pattern Recognition
(CVPR’17), pages 1251–1258, 2017. 5
[5] Jia Deng, Wei Dong, Richard Socher, Li-Jia Li, Kai Li,
and Li Fei-Fei. Imagenet: A large-scale hierarchical im-
age database. In Proceedings of the IEEE Conference on
Computer Vision and Pattern Recognition (CVPR’09), pages
248–255. IEEE, 2009. 4
[6] Sounak Dey, Anjan Dutta, Josep Llados, Alicia Fornes, and
Umapada Pal. Shallow neural network model for hand-
drawn symbol recognition in multi-writer scenario. In Pro-
ceedings of the 14th IAPR International Conference on Doc-
ument Analysis and Recognition (ICDAR’17), volume 2,
pages 31–32. IEEE, 2017. 3
[7] Anjan Dutta, Josep Llados, Horst Bunke, and Umapada Pal.
Near convex region adjacency graph and approximate neigh-
borhood string matching for symbol spotting in graphical
documents. In Proceedings of the 12th International Con-
ference on Document Analysis and Recognition (ICDAR’13),
pages 1078–1082. IEEE, 2013. 2, 3, 8
[8] Anjan Dutta, Josep Llados, and Umapada Pal. A symbol
spotting approach in graphical documents by hashing serial-
ized graphs. Pattern Recognition, 46(3):752–768, 2013. 3,
6
[9] Sergio Escalera, Alicia Fornes, Oriol Pujol, Josep Llados,
and Petia Radeva. Circular blurred shape model for mul-
ticlass symbol recognition. IEEE Transactions on Systems,
Man, and Cybernetics, Part B (Cybernetics), 41(2):497–506,
2011. 2
[10] Sergio Escalera, Alicia Fornes, Oriol Pujol, Petia Radeva,
Gemma Sanchez, and Josep Llados. Blurred shape model for
binary and grey-level symbol recognition. Pattern Recogni-
tion Letters, 30(15):1424–1433, 2009. 2, 6
[11] Mark Everingham, Luc Van Gool, Christopher KI Williams,
John Winn, and Andrew Zisserman. The PASCAL Visual
Object Classes (VOC) challenge. International Journal of
Computer Vision, 88(2):303–338, 2010. 4
[12] Swarnendu Ghosh, Prasenjit Shaw, Nibaran Das, and KC
Santosh. Gsd-net: Compact network for pixel-level graph-
ical symbol detection. In Proceedings of the International
Conference on Document Analysis and Recognition Work-
shops (ICDARW’19), volume 1, pages 68–73. IEEE, 2019.
3
[13] Shreya Goyal, Vishesh Mistry, Chiranjoy Chattopadhyay,
and Gaurav Bhatnagar. BRIDGE: Building Plan Reposi-
tory for Image Description Generation, and Evaluation. In
Proceedings of the International Conference on Document
Analysis and Recognition (ICDAR), pages 1071–1076. IEEE,
2019. 4
[14] Kaiming He, Xiangyu Zhang, Shaoqing Ren, and Jian Sun.
Deep residual learning for image recognition. In Proceed-
ings of the IEEE Conference on Computer Vision and Pattern
Recognition (CVPR’16), pages 770–778, 2016. 4, 5
[15] Diederik P Kingma and Jimmy Ba. Adam: A method for
stochastic optimization. arXiv preprint arXiv:1412.6980,
2014. 5
[16] Pierre Le Bodic, Pierre Heroux, Sebastien Adam, and Yves
Lecourtier. An integer linear program for substitution-
tolerant subgraph isomorphism and its use for symbol
spotting in technical drawings. Pattern Recognition,
45(12):4214–4224, 2012. 2, 3, 6, 8
[17] Pierre Le Bodic, Herve Locteau, Sebastien Adam, Pierre
Heroux, Yves Lecourtier, and Arnaud Knippel. Symbol de-
tection using region adjacency graphs and integer linear pro-
gramming. In Proceedings of the 10th International Confer-
ence on Document Analysis and Recognition (ICDAR’09),
pages 1320–1324. IEEE, 2009. 2, 3
[18] Tsung-Yi Lin, Michael Maire, Serge Belongie, James Hays,
Pietro Perona, Deva Ramanan, Piotr Dollar, and C Lawrence
Zitnick. Microsoft COCO: Common objects in context. In
Proceedings of the European Conference on Computer Vi-
sion (ECCV’14), pages 740–755. Springer, 2014. 4
[19] Wei Liu, Dragomir Anguelov, Dumitru Erhan, Christian
Szegedy, Scott Reed, Cheng-Yang Fu, and Alexander C
Berg. SSD: Single shot multibox detector. In Proceedings of
the European Conference on Computer Vision (ECCV’16),
pages 21–37. Springer, 2016. 4
[20] Herve Locteau, Sebastien Adam, Eric Trupin, Jacques
Labiche, and Pierre Heroux. Symbol spotting using full vis-
ibility graph representation. In Proceedings of the Workshop
on Graphics Recognition, pages 49–50, 2007. 3, 6
[21] Muhammad Muzzamil Luqman, Jean-Yves Ramel, Josep
Llados, and Thierry Brouard. Subgraph spotting through ex-
plicit graph embedding: An application to content spotting
in graphic document images. In Proceedings of the Inter-
national Conference on Document Analysis and Recognition
(ICDAR’11), pages 870–874. IEEE, 2011. 3
[22] Nibal Nayef and Thomas M Breuel. On the use of geometric
matching for both: Isolated symbol recognition and symbol
spotting. In Proceedings of the International Workshop on
Graphics Recognition (GREC’11), pages 36–48. Springer,
2011. 6, 8
[23] Nibal Nayef and Thomas M Breuel. Statistical grouping for
segmenting symbols parts from line drawings, with appli-
cation to symbol spotting. In Proceedings of the Interna-
tional Conference on Document Analysis and Recognition
(ICDAR’11), pages 364–368. IEEE, 2011. 2
[24] Thi-Oanh Nguyen, Salvatore Tabbone, and Alain Boucher.
A symbol spotting approach based on the vector model and
a visual vocabulary. In Proceedings of the 10th Interna-
tional Conference on Document Analysis and Recognition
(ICDAR’09), pages 708–712. IEEE, 2009. 2, 8
[25] Thi Oanh Nguyen, Salvatore Tabbone, and O Ramos Ter-
rades. Symbol descriptor based on shape context and vec-
tor model of information retrieval. In Proceedings of the
Eighth IAPR International Workshop on Document Analysis
Systems (DAS’08), pages 191–197. IEEE, 2008. 2
[26] Rashid Jalal Qureshi, Jean-Yves Ramel, Didier Barret, and
Hubert Cardot. Spotting symbols in line drawing images
using graph representations. In International workshop on
graphics recognition, pages 91–103. Springer, 2007. 3
[27] Jean-Yves Ramel, Nicole Vincent, and Hubert Emptoz. A
structural representation for understanding line-drawing im-
ages. International Journal on Document Analysis and
Recognition (IJDAR), 3(2):58–66, 2000. 2, 3
[28] Joseph Redmon, Santosh Divvala, Ross Girshick, and Ali
Farhadi. You only look once: Unified, real-time object de-
tection. In Proceedings of the IEEE Conference on Computer
Vision and Pattern Recognition (CVPR’16), pages 779–788,
2016. 4, 5
[29] Joseph Redmon and Ali Farhadi. Yolo9000: better, faster,
stronger. In Proceedings of the IEEE Conference on Com-
puter Vision and Pattern Recognition (CVPR’17), pages
7263–7271, 2017. 2, 4, 5
[30] Joseph Redmon and Ali Farhadi. Yolov3: An incremental
improvement. arXiv preprint arXiv:1804.02767, 2018. 4, 5
[31] Shaoqing Ren, Kaiming He, Ross Girshick, and Jian Sun.
Faster R-CNN: Towards real-time object detection with re-
gion proposal networks. In Proceedings of the Advances
in Neural Information Processing Systems (NIPS’15), pages
91–99, 2015. 4
[32] Alireza Rezvanifar, Melissa Cote, and Alexandra Bran-
zan Albu. Symbol spotting for architectural drawings: State-
of-the-art and new industry-driven developments. IPSJ
Transactions on Computer Vision and Applications, 11(1):2,
2019. 1, 2
[33] Pau Riba, Anjan Dutta, Josep Llados, and Alicia Fornes.
Graph-based deep learning for graphics classification. In
Proceedings of the 14th IAPR International Conference on
Document Analysis and Recognition (ICDAR’17), volume 2,
pages 29–30. IEEE, 2017. 3
[34] Marcal Rusinol, Agnes Borras, and Josep Llados. Relational
indexing of vectorial primitives for symbol spotting in line-
drawing images. Pattern Recognition Letters, 31(3):188–
201, 2010. 3, 6
[35] Marcal Rusinol and Josep Llados. A region-based hash-
ing approach for symbol spotting in technical documents.
In Proceedings of the International Workshop on Graphics
Recognition (GREC’07), pages 104–113. Springer, 2007. 2,
6
[36] Marcal Rusinol and Josep Llados. A performance evaluation
protocol for symbol spotting systems in terms of recogni-
tion and location indices. International Journal on Docu-
ment Analysis and Recognition (IJDAR), 12(2):83–96, 2009.
6
[37] Marcal Rusinol and Josep Llados. Symbol Spotting in Digital
Libraries. Springer, 2010. 1
[38] KC Santosh. Document Image Analysis: Current Trends and
Challenges in Graphics Recognition. Springer, 2018. 1
[39] KC Santosh, Bart Lamiroy, and Laurent Wendling. Symbol
recognition using spatial relations. Pattern Recognition Let-
ters, 33(3):331–341, 2012. 2, 3, 6
[40] KC Santosh, Bart Lamiroy, and Laurent Wendling. Integrat-
ing vocabulary clustering with spatial relations for symbol
recognition. International Journal on Document Analysis
and Recognition (IJDAR), 17(1):61–78, 2014. 2, 3
[41] KC Santosh, Laurent Wendling, and Bart Lamiroy. BoR:
Bag-of-relations for symbol retrieval. International Jour-
nal of Pattern Recognition and Artificial Intelligence,
28(06):1450017, 2014. 2
[42] Salvatore Tabbone, Laurent Wendling, and Karl Tombre.
Matching of graphical symbols in line-drawing images us-
ing angular signature information. International Journal on
Document Analysis and Recognition (IJDAR), 6(2):115–125,
2003. 2
[43] Ernest Valveny, Mathieu Delalandre, Romain Raveaux, and
Bart Lamiroy. Report on the symbol recognition and spotting
contest. In Proceedings of the International Workshop on
Graphics Recognition (GREC’11), pages 198–207. Springer,
2011. 6, 8
[44] Ernest Valveny, Mathieu Delalandre, Romain Raveaux, and
Bart Lamiroy. Report on the symbol recognition and spotting
contest. In Proceedings of the International Workshop on
Graphics Recognition (GREC’11), pages 198–207. Springer,
Berlin, 2013. 3
[45] Jonathan Weber and Salvatore Tabbone. Symbol spotting
for technical documents: An efficient template-matching ap-
proach. In Proceedings of the 21st International Conference
on Pattern Recognition (ICPR’12), pages 669–672. IEEE,
2012. 6
[46] Su Yang. Symbol recognition via statistical integration of
pixel-level constraint histograms: A new descriptor. IEEE
Transactions on Pattern Analysis and Machine Intelligence,
27(2):278–281, 2005. 2
[47] Zahra Ziran and Simone Marinai. Object detection in floor
plan images. In IAPR Workshop on Artificial Neural Net-
works in Pattern Recognition (ANNPR), pages 383–394.
Springer, 2018. 4