Embed Size (px)
Citation preview
MARCH 2010SYMBIOSIS IN THE EVOLUTION OF UCITS1988 - 2018 : THREE DECADES OF FUNDS INDUSTRY TRANSFORMATION

2
Ucits as an effective passport for pan-European activity has developed considerable momentum in the past decade and is set to expand further in the coming decade. Fifteen percent of European fund assets are now derived from third-party distributors in ‘foreign’ markets and this figure could more than double by 2020.
The barriers to entry in most foreign markets have fallen or are, at least, passable; penetration by non-domestic groups using the Ucits vehicle now ranges between 5% and 37%. The recent financial crisis resulted in some temporary contraction but cross-border groups have been the primary beneficiaries of the first wave of ‘recovery’ investment.
Luxembourg’s evolution has benefited from recent trends that favour cross-border business as well as moves by industry players to concentrate their manufacturing activity in a single centre of excellence. These trends are likely to deliver a future growth rate of 10.4% for Luxembourg, ahead of the expected European average of 6.8%. This would give Luxembourg a 38% share of all European assets by 2014.
Competition from Dublin and the Dublin/Luxembourg debate has become irrelevant now since the location decisions of most established groups were made some years ago. Newcomers still feature and their location decisions are as likely to be home centered as location in a host centre. Increasingly, domestically-based funds are seeking access to foreign markets. However, Luxembourg’s position as a politically neutral and dedicated centre will remain important.
Luxembourg’s role in neighbouring domestic markets should not be under-estimated. In most major countries the local industry promotes a high percentage of Luxembourg funds alongside home-domiciled product. The weighting of Luxembourg products in countries like Switzerland, Germany, Italy and the Netherlands is in the region of 50% of assets.
EXECUTIVE SUMMARY
3
ABOUT LIPPER FMI
Lipper Fund Market Information (Lipper FMI) is the London-based fund market research and analysis division of Thomson Reuters. It specialises in all aspects of domestic, pan-continental and cross-border mutual fund markets in Europe and Asia.
Against a background of continual change in the mutual fund markets, Lipper FMI’s objectives are to:
• Overcomefragmenteddataandmarketopacityproblems
• Revealthemajorchangestakingplace
• Sharelatestinsightsintomarketplacecomplexities
• Identifycompanieseitherleadingthefieldorsettingthepace.
For further information on the contents of this report, please contact:
ED MOISSON, HEAD OF CONSULTINGLIPPER FMI
THE THOMSON REUTERS BUILDING30 South ColonnadeCanary WharfLondon E14 5EP
Tel: +44 20 7542 2710Web: http://www.lipperfmi.com
© Thomson Reuters. All rights reserved. No part of this publication may be reproduced, stored in a retrieval
system, or transmitted in any form or by any means, electronic, mechanical, photocopying, recording, or
otherwise, without the prior permission of the publishers. No part of this publication may be distributed
externally without the prior permission of the publishers. Whilst great care has been taken in the preparation of
this publication, the publishers make no representation or warranty in respect of the accuracy of any information
given, and readers are advised to make their own enquiries and investigations.

4
The funds landscape has changed inexorably over the past 25 years, and, after more than two decades of Ucits and two severe market crashes, Europe is not only getting closer to the single market dream, but is also a global leader in the international funds industry.
Underpinning the success of Europe in this arena was the introduction of Ucits in 1985. Little did we know then that this legislation would have such an impact on the world of investment, and few would have realised then just what a competitive edge it gave to Europe in the investment funds business. Increasingly the Ucits stamp is seen not just as a European fund passport, but a global one. It is used more and more in Asia, South America, Central and Eastern Europe and the Middle East.
To remain competitive going forward we need to endeavour to offer a regulated and business-friendly environment, to ensure that Europe can continue to cater for changing investor needs. The implementation of Ucits IV in an efficient manner is a key part of this.
Inspired by this challenge, ALFI commissioned Lipper FMI to produce a study on the cross-border funds industry with a particular focus on the evolving distribution structure of Ucits funds and Luxembourg’s role in its growth and future.
Ucits is today a world-wide recognised brand. Europe should be proud of this success but also aware of the responsibility this success brings, a responsibility which we all take very seriously.
We, at Alfi, will continue to work hard towards this common goal.
We hope that you find this report interesting and useful.
Sincerely,
CAMILLE THOMMES CLAUDE KREMER
DIRECTOR GENERAL CHAIRMAN
ALFI Association of the Luxembourg Fund Industry
FOREWORD FROM ALFI
5
EXECUTIVE SUMMARY ...............................................................................................................................2ABOUTLIPPERFMI ............................................................................................................................................3FOREWORDFROMALFI ................................................................................................................................... 4TABLEOFCONTENTS ......................................................................................................................................... 5INTRODUCTION .......................................................................................................................................... 6
A SHORT HISTORY OF THE UCITS REVOLUTION 7
BIRTHOFUCITSANDTHESINGLEMARKETDREAM THEEARLYCROSS-BORDERYEARS ASSETCLASSEVOLUTION NEWDISTRIBUTIONLANDSCAPE
MIGRATION AND CENTRALISED MANUFACTURING HUBS 13 MORERECENTMIGRATIONCASESTUDIES COMPETITIONFORASSETS THEBATTLEFORINSTITUTIONALLIQUIDITYASSETS PULL-BACKFROMDOMESTICMARKETS COMPETITIONFROMOUTSIDEEUROPE
ORGANIC GROWTH FROM THE CROSS-BORDER COMMUNITY 21 EMERGENCEOFTHEPROFESSIONALFUNDBUYER IMPACTONSALESFLOWS PRESSURETODELIVERMOREPRODUCT CHANGINGROLEOFBANKDISTRIBUTORS THENEWMAPOFEUROPE TENFOLDEXPANSIONINFUNDREGISTRATIONS
THE CROSS-BORDER REALITY IN EUROPE 27 GERMANY ITALY SWITZERLAND FRANCE UK SPAIN
NEW MARKETS - UCITS GOES GLOBAL 38 CROSS-BORDERBUSINESS–LOOKINGTHROUGHTHEBLACKHOLE CENTRAL&EASTERNEUROPEANDEVELOPMENTS ASIANMARKETS
PRESENT AND FUTURE 44 SCALEOFFOREIGNMARKETPENETRATION RECENT ACTIVITY INDUSTRY FUTURE OPPORTUNITIESANDTHREATS CONCLUDINGREMARKS METHODOLOGYANDDATA7
METHODOLOGYANDDATA ................................................................................................................. 53
TABLE OF CONTENTS

6
TheoriginalUcitsDirectivewasconceivedandlaunchedin1985–adoptedfirstbyLuxembourgin 1988 - to provide a mechanism to create a single European market for investment funds. In the twenty years since its launch, Ucits has become a brand recognised around the world as a well-regulated investment vehicle suitable for all levels of retail saver. Luxembourg’s role as host to the majority of these funds has become a feature of the landscape but until now scarce effort has been made to measure and assess the real effectiveness of the various Ucits Directives. This report, commissioned by ALFI seeks to address the issue, in this independent study on the globalisation of the European mutual funds business since the implementation of the first Ucits Directive in 1988.
Overthelast20yearsLuxembourghasplayedapivotalroleinrealisingthesuccessoftheUcits Directive in moving towards a single European market. Moreover, it has helped the Ucits framework to become viewed as a suitable regulatory standard for distribution in non-US markets throughout the world. Although the intention of the Ucits Directive was to facilitate the cross-border trade of investment funds in Europe, the outcome has been global with Europe becoming the centre of international investment in mutual funds. Luxembourg, in turn, sits right at the centre of this activity.
Nonetheless, the success of Ucits and the single market has introduced some transparency issues; the scale of cross-border traffic is such that it has become vital to know the volumes sourced by Luxembourg funds from each market. The European fund industry is a complex mixture of local and cross-border, proprietary and third-party business, together with a varying involvement of institutions, corporate and, of course, retail investors. Those stakeholders who have navigated their way to success in this confusing world hold the secrets of that success close to their chests so measurement has been difficult to achieve. An early solution was one that reviewed the number of countries of registration since this, at least, acted as some confirmation of expansionist corporate intention. However, as the Ucits world evolved it became an inadequate tool, particularly since many domestic groups started to use Luxembourg as a hub for both domestic and cross-border business.
The aim of this unique research study is to provide an impartial and independent review of market developments since 1988, focusing particularly on providing verification of the growing geographical reach of cross-border funds in terms of asset gathering and sales flows. A clear assessment and measure of the extent to which Ucits has succeeded in its early aims after 20 years of evolution, necessarily demands a view of development over the next 20 years. This review aims, not only to look through the rear view mirror, but to assess the factors that are likely to affect the future evolution of Ucits and to provide some numeric projections to fuel debate in the coming years.
INTRODUCTION
7
A SHORT HISTORY OF THE UCITS REVOLUTION
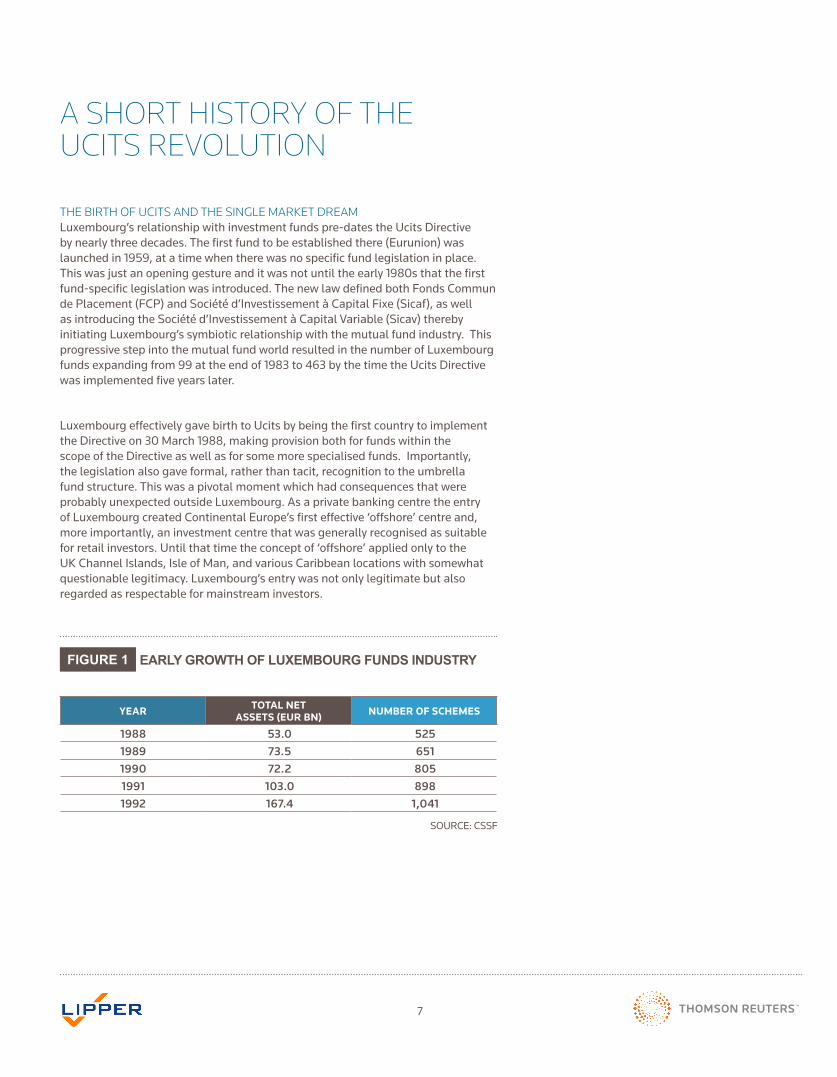
THE BIRTH OF UCITS AND THE SINGLE MARKET DREAMLuxembourg’s relationship with investment funds pre-dates the Ucits Directive by nearly three decades. The first fund to be established there (Eurunion) was launched in 1959, at a time when there was no specific fund legislation in place. This was just an opening gesture and it was not until the early 1980s that the first fund-specific legislation was introduced. The new law defined both Fonds Commun dePlacement(FCP)andSociétéd’InvestissementàCapitalFixe(Sicaf),aswellasintroducingtheSociétéd’InvestissementàCapitalVariable(Sicav)therebyinitiating Luxembourg’s symbiotic relationship with the mutual fund industry. This progressive step into the mutual fund world resulted in the number of Luxembourg funds expanding from 99 at the end of 1983 to 463 by the time the Ucits Directive was implemented five years later.
Luxembourg effectively gave birth to Ucits by being the first country to implement the Directive on 30 March 1988, making provision both for funds within the scope of the Directive as well as for some more specialised funds. Importantly, the legislation also gave formal, rather than tacit, recognition to the umbrella fund structure. This was a pivotal moment which had consequences that were probably unexpected outside Luxembourg. As a private banking centre the entry of Luxembourg created Continental Europe’s first effective ‘offshore’ centre and, more importantly, an investment centre that was generally recognised as suitable for retail investors. Until that time the concept of ‘offshore’ applied only to the UKChannelIslands,IsleofMan,andvariousCaribbeanlocationswithsomewhatquestionable legitimacy. Luxembourg’s entry was not only legitimate but also regarded as respectable for mainstream investors.
SOURCE:CSSF
YEAR TOTAL NET ASSETS (EUR BN) NUMBER OF SCHEMES
1988 53.0 5251989 73.5 6511990 72.2 8051991 103.0 8981992 167.4 1,041
FIGURE 1 EARLY GROWTH OF LUXEMBOURG FUNDS INDUSTRY
8
The aim had been for all European Community member countries to amend national legislation so that foreign funds could be marketed locally and domesticfundssoldabroadby1October1989.InrealityonlyDenmark,theUK,Ireland,SpainandFrance joined Luxembourg in making this deadline but it quickly became clear that, regardless of national regulation, the single market concept would take time to evolve.
With Black Monday and the resulting crash of 1987 preceding the introduction of Ucits and the Gulf War of 1990 following soon afterwards, the birth of the international fund passport was hardly auspicious. Indeed the ‘birth pangs’ were felt keenly within the officesoftheInstitutMonétaireLuxembourgeois(IML), which was suddenly faced with a requirement to register some 150 new funds, as well as re-registering more than 400 funds already in existence. The dust only settled some 18 months later, by which time Dublin had begun to register itself as a potential competitor in the expanding but specialist fund servicing market.
THE EARLY CROSS-BORDER YEARSThe Grand Duchy drew its initial strength from its long-established private banking sector and experience of dealing with high-net-worth individuals’ portfolios, as well as institutional clients in the Eurobond market. Luxembourg’s location has always been a supportive factor for the development of its funds industry, and perhaps never more so than in these early years. With Germany, France and Belgium on the country’s doorstep, there were three accessible markets to target, supported by a multilingual population. Indeed the first and most important cross-border foray was a natural extension of existing business relationships and came in the form of ‘round-tripping’ — the use of Luxembourg as a centre from which to sell back to home country investors (e.g. a German bank selling its Luxembourg-domiciled funds solely to German investors). To this extent those groups that did not wish to cross borders could stretch them into Luxembourg. Its unique advantage was its chameleon-like ability to adapt to the working practices of its neighbours and operate seamlessly with these mutual fund allies.
PROCESSING ADVANTAGES FOR GERMANYEach country exploited different benefits from Luxembourg; in the case of Germany, the registration of new Luxembourg funds was a faster process than that offered to new local products, but an additional boost came in 1993 when the German Government introduced a domestic withholding tax of 30%. This move acted as a trigger for an explosion of German support for Luxembourg funds, which soon went well beyond whether an individual investor was actually eligible to pay the tax. Suddenly owning a Luxembourg fund was not only acceptable, it was also fashionable!
BELGIAN HISTORICAL TIESTurning to Belgium, along with historical and geographic ties, the lack of a domestic fund structure meant that Luxembourg Ucits filled an immediate gap among financial service offerings. Belgian legislation (implemented in 1991) to make locally domiciled open-ended funds with a Ucits label more attractive, showed no evidence of success in this early period. Tax was also an issue here; the Belgian Government’s application of tax laws retroactively had traditionally made Belgium an uncomfortable place to invest and Luxembourg’s offer of products carrying a coupon allowed Belgian nationals to avoid local complex inheritance taxes. The domestic funds industry was therefore slow to develop even after the implementation of Ucits, with Belgian promoters’ Luxembourg assets still three times the size of those at home by the end of 1993.
EU PASSPORT FOR SWITZERLANDSwitzerland, although not an immediate neighbour, swiftly became a third key market for the Luxembourg fund industry. Swiss banks’ continuing interest in an international client base, their acute awareness of being outside the European Economic Area, together with a local 35% withholding tax, meant that Luxembourg became immediately attractive.
With an acceleration of asset transfer from Swiss and German domestic funds to Luxembourg throughout 1992, the importance of these two countries’ fund promoters was such that they managed just under 50% of all Luxembourg-domiciled funds in September 1992. For the Swiss, this growth meant that Luxembourg fund assets exceeded those domiciled domestically: 58% of the total in 1992, compared to
9
39% a year earlier. For Germany, the proportion of fund business attributable to Luxembourg was 33% and reached parity with domestic assets in 1994.
FRENCH INSTITUTIONAL SWITCHING OPPORTUNITIESFrance was less important to the early development of Luxembourg although was a favoured target market due to the high proportion of investors’ savings held in funds. However, Luxembourg Ucits offered no real attraction to French investors over domestic funds, and early on, the only traction came from a small number of French institutional investors that could benefit from switching opportunities within large umbrella fund ranges. The umbrella structure was not available for French local funds.
ROUND-TRIP OR CROSS-BORDER?The early implementation of Ucits clearly fostered round-trippers but what of the cross-border dream? At this early stage of Ucits evolution, it was best described as a pipe dream. Fund companies were far more likely to create a local fund for each market they entered than use a cross-border fund from one domicile.
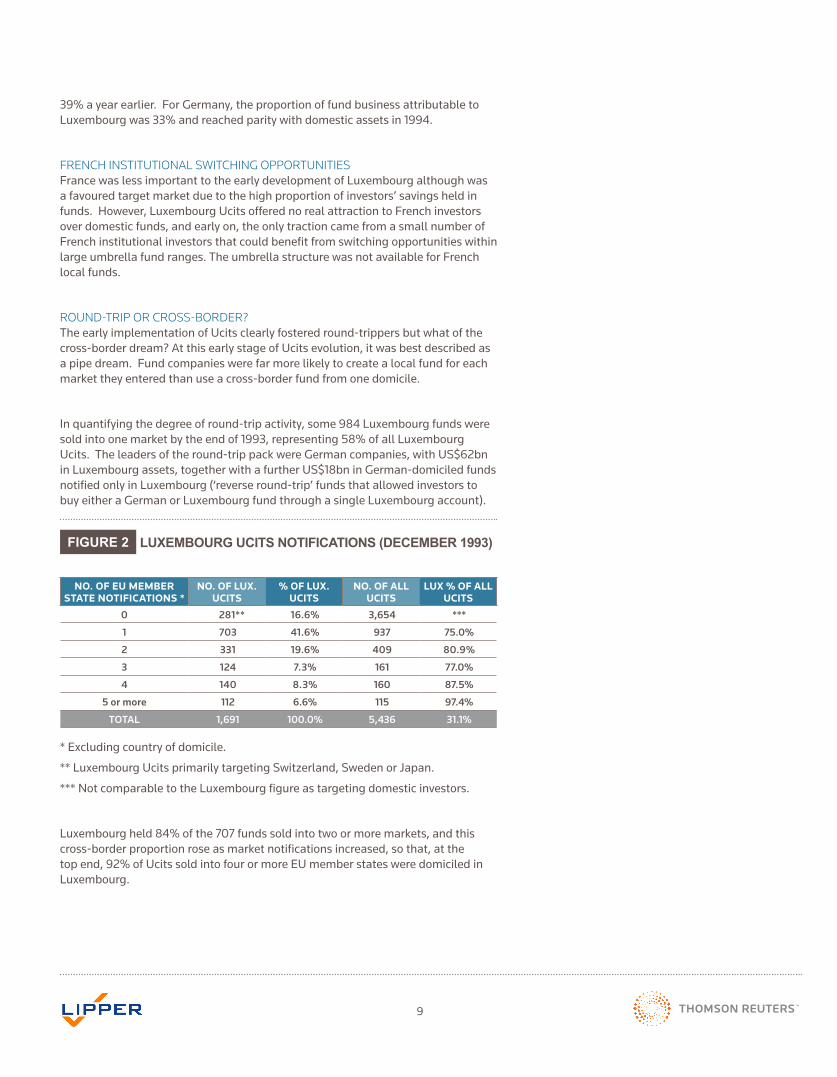
In quantifying the degree of round-trip activity, some 984 Luxembourg funds were sold into one market by the end of 1993, representing 58% of all Luxembourg Ucits. The leaders of the round-trip pack were German companies, with US$62bn in Luxembourg assets, together with a further US$18bn in German-domiciled funds notified only in Luxembourg (‘reverse round-trip’ funds that allowed investors to buy either a German or Luxembourg fund through a single Luxembourg account).
* Excluding country of domicile.
** Luxembourg Ucits primarily targeting Switzerland, Sweden or Japan.
*** Not comparable to the Luxembourg figure as targeting domestic investors.
Luxembourg held 84% of the 707 funds sold into two or more markets, and this cross-border proportion rose as market notifications increased, so that, at the top end, 92% of Ucits sold into four or more EU member states were domiciled in Luxembourg.
NO. OF EU MEMBER STATE NOTIFICATIONS *
NO. OF LUX. UCITS
% OF LUX. UCITS
NO. OF ALL UCITS
LUX % OF ALL UCITS
0 281** 16.6% 3,654 ***
1 703 41.6% 937 75.0%
2 331 19.6% 409 80.9%
3 124 7.3% 161 77.0%
4 140 8.3% 160 87.5%
5 or more 112 6.6% 115 97.4%
TOTAL 1,691 100.0% 5,436 31.1%
FIGURE 2 LUXEMBOURG UCITS NOTIFICATIONS (DECEMBER 1993)

10
Groups with cross-border ambitions had to face the fact that banks, the natural providers of all financial services, were in control of the vast majority of retail clients and the pickings outside this closed structure were slim. Despite these distribution constraints, cross-border groups looking for new business were able to attract attention from private banks, wealth managers and multi-tied sales organisations. Their expectations were low and although the bank structures were off-limits, there was sufficient interest amongst smaller players to encourage continued commitment to the dream. Most argued that further legislative changes were needed in order to create a level playing field and thus enable cross-border sales, but many also recognised that local customs would only change by increasing the acceptance of Luxembourg Ucits and the only way to do this was to go out and sell.
In these early days there was a very clear divide in the approach taken by different groups to Ucits. The battle line was drawn between Continental European banks and Anglo-Saxon providers. The former took a pan-European approach in which their asset management subsidiaries benefited from local operations that were either started or acquired by their parents. Ucits simply supplemented home market products. The Anglo-Saxon community that mainly comprised independent asset management entities could not rely on a bank infrastructure, so their use of the Ucits passport was closer to the original single market concept.
However,nearly50USandUKpromotersmanagedLuxembourg Ucits and this meant that, although total assets under management were dwarfed by those from Germany and Switzerland, many significant Anglo-Saxon promoters viewed a presence in the Grand Duchy as a strategic necessity.
ASSET CLASS EVOLUTION Through the first five years since the inception of Ucits, money market funds could not be bought locally by Swiss and German investors and Luxembourg fund ranges were dominated by this asset class. When interest rate reductions hit money market funds in 1993, rather than leaving Luxembourg, a shift of money to bond funds followed. This pressure on interest rates would last through the decade, with the Eurozone countries passing monetary policy decisions to the European Central Bank in January 1999.
The initial move to bond funds could be seen throughout 1993, as the Luxembourg industry grew by US$83.5bn, with 67% of this growth (US$56bn) coming from new fund launches (343 new funds in total). The bulk (83%) of this new money went into bond funds. This shift was an acid test for Luxembourg, starting at the same time that German funds in Luxembourg suffered outflows of nearly US$10bn (in 1994) when the German authorities took steps to counter the avoidance of withholding tax. Crucially, though, there was no fundamental retreat from the German presence in Luxembourg.
The proactive switch of client assets out of deposit accounts and into funds resulted in the European fund business gathering significant momentum driven, first and foremost, by falling interest rates and the banks’ perception that their asset management subsidiaries would deliver more profitable business opportunities.
While accounting for a small proportion again, this period saw Italian promoters’ Luxembourg assets more than double. Mostly this was the result of advice Italians received to divest themselves of direct bond holdings and to use bond funds instead. It was also the result of Banca Fideuram’s marketing success among retail investors, which saw the bank dominate the Italian presence in Luxembourg.
DOT.COM SHIFT INTO EQUITIESThe cross-border players in particular also offered equity and mixed asset products that enjoyed growth through the decade. However, this was a gradual change until the boom of 1999, when equity assets nearly doubled over the year and increased their share of the Luxembourg funds industry by more than 10%. Exemplifying this boom, funds investing in technology and telecom stocks attracted US$16bn by the end of 1999,upfromamereUS$2.6bnayearearlier.Over40% of these assets came from funds launched in 1999 alone.
The technology-fuelled equity boom that peaked in the middle of 2000 was followed by a severe slump. While Luxembourg assets declined as a result, interestingly this setback did not itself lead to a fundamental retreat from the asset class mix that had been established. With a range of product types, Luxembourg fared better than many other jurisdictions in the early years of the new century.
11
Those US groups in the vanguard of building cross-border rather than round-trip business actually increased market share in this period.
Assessing the broader impact on cross-border business, analysing some 370 management groups in Luxembourg at the end of 1999, 47% had funds registered for sale in three or more countries — a pronounced change from the picture seen at the end of 1993. When looking at which companies were driving this evolution it is important to clarify that US promoters’ growth initially came more from their cross-borderactivityratherthanequitypreferencealone.Ofcourse,asequityproductssoldinincreasingvolumes,USandUKgroupswereabletocapitaliseonthis,butthe two elements should not be seen as one and the same.
It is also worth mentioning that the Luxembourg regulator (which from 1999 was established as the Commission de Surveillance du Secteur Financier, or CSSF) ended the decade by continuing to demonstrate its innovative credentials, for example, approving alternatives to master-feeder structures in the wake of the collapse of Ucits II (a draft directive which was ultimately abandoned when the Council of Ministers could not reach a common position).
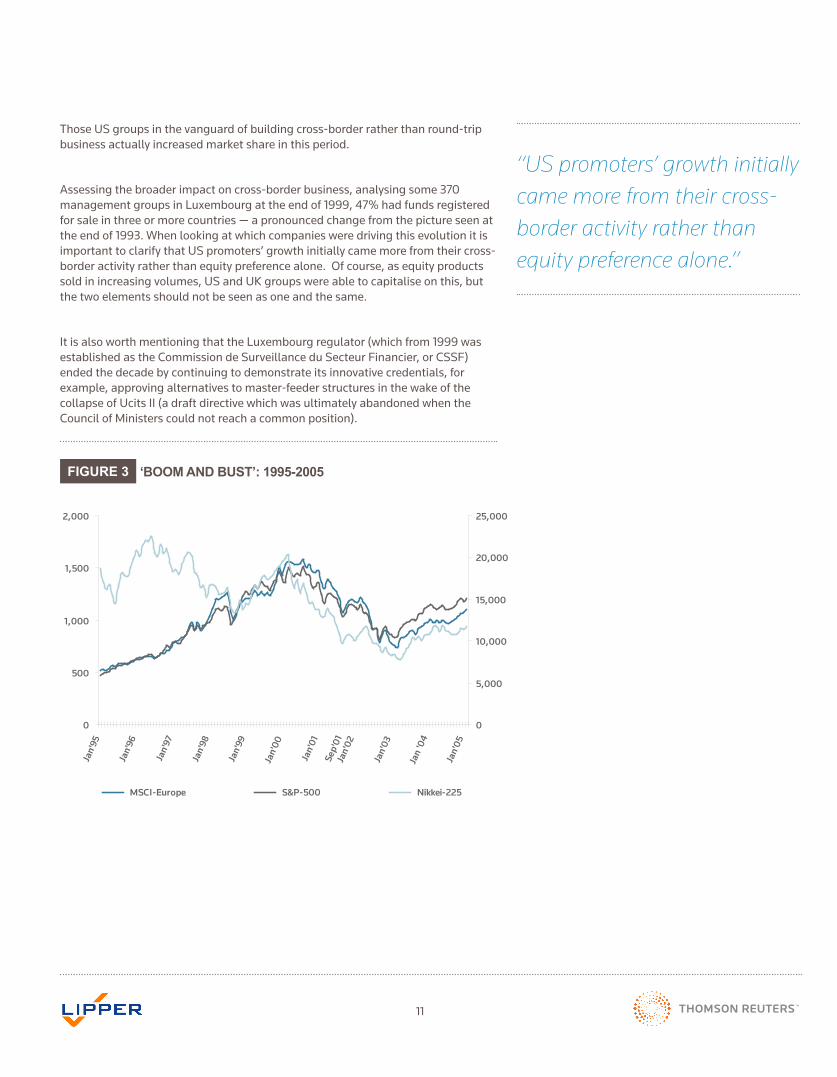
FIGURE 3 ‘BOOM AND BUST’: 1995-2005Figure 3: 'Boom and Bust': 1995-2005
0
500
1,000
1,500
2,000
Jan'
95
Jan'
96
Jan'
97
Jan'
98
Jan'
99
Jan'
00
Jan'
01Se
p'01
Jan'
02
Jan'
03
Jan
'04
Jan'
05
0
5,000
10,000
15,000
20,000
25,000
MSCI-Europe S&P-500 Nikkei-225
“US promoters’ growth initially came more from their cross-border activity rather than equity preference alone.”

12
NEW DISTRIBUTION LANDSCAPE The 2000 stock market crash, in fact, proved to be the detonator of a period of explosive change to European distribution structures. Although open architecture was a subject on the lips of industry commentators in the late 1990s, and appetite for equities had resulted in the launch of discount brokerages offering third-party funds, the real change occurred after the markets started to crash.
The impetus for these came in three forms. While each has an investor-related dimension, it was ultimately the struggle for profitability in the wake of the market turmoil that forced the pace of change. To a greater or lesser extent all the bank distributors participated in these changes.
First, the introduction of ‘guided’ architecture by banks that were both struggling to respond to a disappointed client base and facing the realisation that distribution was a potentially more profitable revenue stream than the manufacture of funds. Guided architecture came in the form of bank distribution platforms with a limited selection of preferred third-party asset management groups, rather than the less practical free for all of pure open architecture.
The second element was the growing client demand for diversification to limit downside risk, which presented the opportunity to package ‘best of the best’ fund concepts within product wrappers, or ‘solutions’, to manage conflicting investor demands and differing risk appetites.
Thirdly there was the emergence of business-to-business (B2B) administrative platforms out of the discount brokerage operations and fund supermarkets that first came on to the scene during the ‘bubble’ years. These offered transfer agency-style services both internally and to non-bank distributors, i.e. consolidators or aggregators.
The distribution structure that emerged from the dot.com upheaval is one of huge complexity. For Luxembourg, this complexity and the increasing role taken by platforms has prompted administrators to develop their own platform infrastructure in order to retain the more profitable transfer agency business. The pressure on developing such infrastructure is building as cross-border managers are looking to their administrators to facilitate their distribution across Europe and beyond. If companies are able to get this right, then they are likely to become indispensable partners where the alternative is multiple relationships in different distribution markets around the world. Such developments have also meant that Luxembourg is increasingly able to grow not just organically through servicing cross-border businesses, but also through the migration of assets from domestic fund centres.
13
The Ucits single market dream, whilst still some way from being realised, has seen its most rapid developmentinitsseconddecade.Outofthecarnageof the technology crash emerged a new dynamic in which third party Ucits funds found new favour amongst wholesalers and retail investors alike. Regulatory and tax barriers that remained in place, disintegrated further and the previously confused roles of manufacturer and distributor became more distinct. In this ‘brave new world’ Luxembourg’s role as a product warehouse or manufacturing hub came clearly into focus.
Such a servicing role seems to echo down the ages with an apt parallel being found in the old motto of Jang de Blannen (John the Blind), Earl of Luxembourg until his deathattheBattleofCrécyin1346.Hismottoof“Ichdien”(“Iserve”)wasadoptedbythePrinceofWales—and is still used today.
With Luxembourg Ucits now an acceptable structure for export to most global markets, asset management growth in the Grand Duchy has come not only from organic product expansion but also from the migration of entire fund families that once operated only at a domestic level. Driven by the powerful scent of cross-border opportunity many of the larger bank-owned fund groups have restructured their multitudinous local operations into centralised cross-border ranges based primarily in Luxembourg. These large umbrella structures are distributed wherever there is appetite and their markets include their domestic investor franchise.
This evolution is reflected in Luxembourg’s business, which has moved from a round-trip emphasis to one that is predominately cross-border. At the end of 2001, 57% of Luxembourg-domiciled funds were classified as ‘International’ 1, which rose to 67% at the end of December 2009. In the equity category the International proportion rose from 68% to 82% over the same timeframe.
Migration has come from a number of European markets, of which Switzerland was really the first. The Swiss decision to remain outside the European Union
had a profound consequence for its asset management industry. Despite all regulatory efforts to introduce Ucits equivalent structures, Swiss-based funds lacked the all-important distribution passport. Access to European and wider global markets was vital to its private bank franchise and the result was a near-wholesalerelocationoftheindustrytoLuxembourg.Ofthe near €430bn in fund assets attributed to the Swiss industry, about 55% is domiciled in Luxembourg2 (even after the effects of redemptions from Swiss banking institutions hit hard by the global financial crisis).
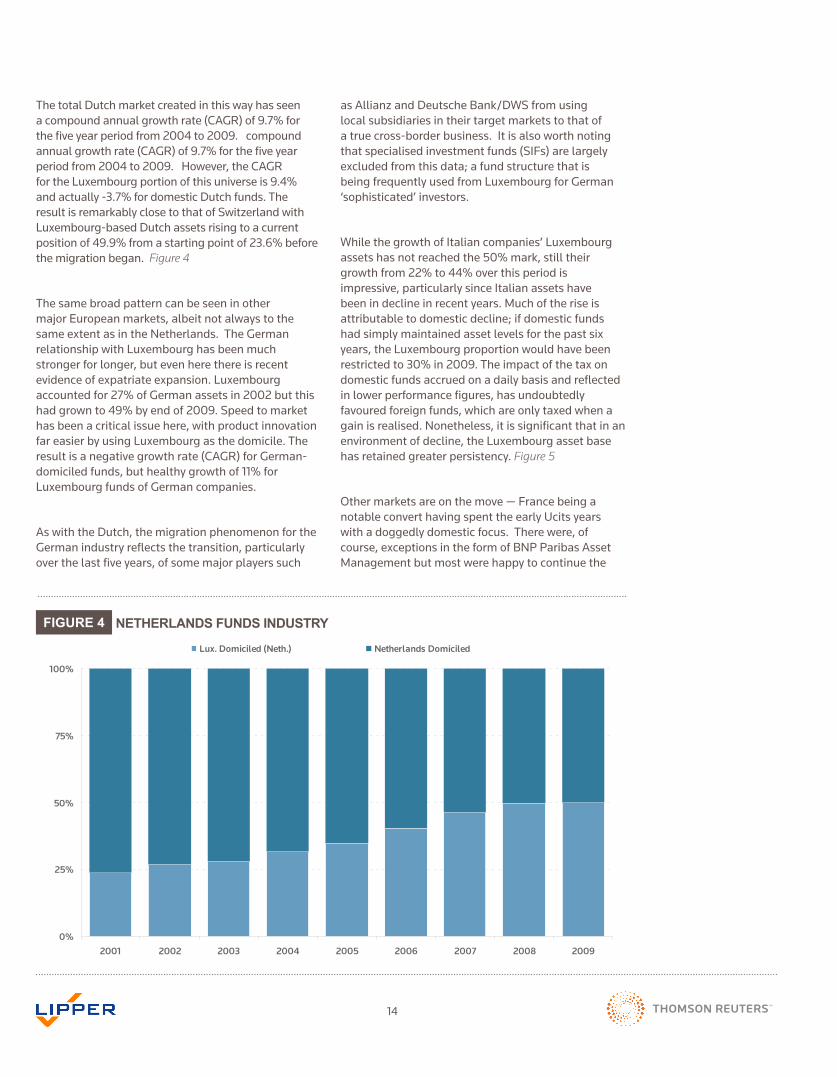
MORE RECENT MIGRATION CASE STUDIESThe Netherlands acts as an important example of the commercial impetus that has developed since the turn of the century. Dutch groups have traditionally been international in their focus but, supported by closed architecture banks, their original approach in Europe was expansion in local markets by acquisition. However, the Dutch banks were also some of the first to open up their distribution channels to third-party funds and this, allied with fiscal changes that removed some barriers to the importation of foreign funds, led to a near-wholesale relocation of the industry to Luxembourg. The impact of this relocation can be seen in figure 4, which compares the total net assets of funds domiciled in the Netherlands with those promoted by Dutch companies and domiciled in Luxembourg3 to give a good ‘home and away’ picture of the Dutch funds industry.
MIGRATION AND CENTRALISED MANUFACTURING HUBS
1 Funds sourcing more than 80% of their assets from more than one market2 Data includes International funds of Swiss provenance and all other funds sourcing the majority of their assets from Switzerland whether to Swiss nationals or to others via Swiss omnibus accounts3 Data excludes funds of funds to avoid double-counting
“Growth in the Grand Duchy has come not only from organic product expansion but also from the migration of entire fund families.”
14
The total Dutch market created in this way has seen a compound annual growth rate (CAGR) of 9.7% for the five year period from 2004 to 2009. compound annual growth rate (CAGR) of 9.7% for the five year period from 2004 to 2009. However, the CAGR for the Luxembourg portion of this universe is 9.4% and actually -3.7% for domestic Dutch funds. The result is remarkably close to that of Switzerland with Luxembourg-based Dutch assets rising to a current position of 49.9% from a starting point of 23.6% before the migration began. Figure 4
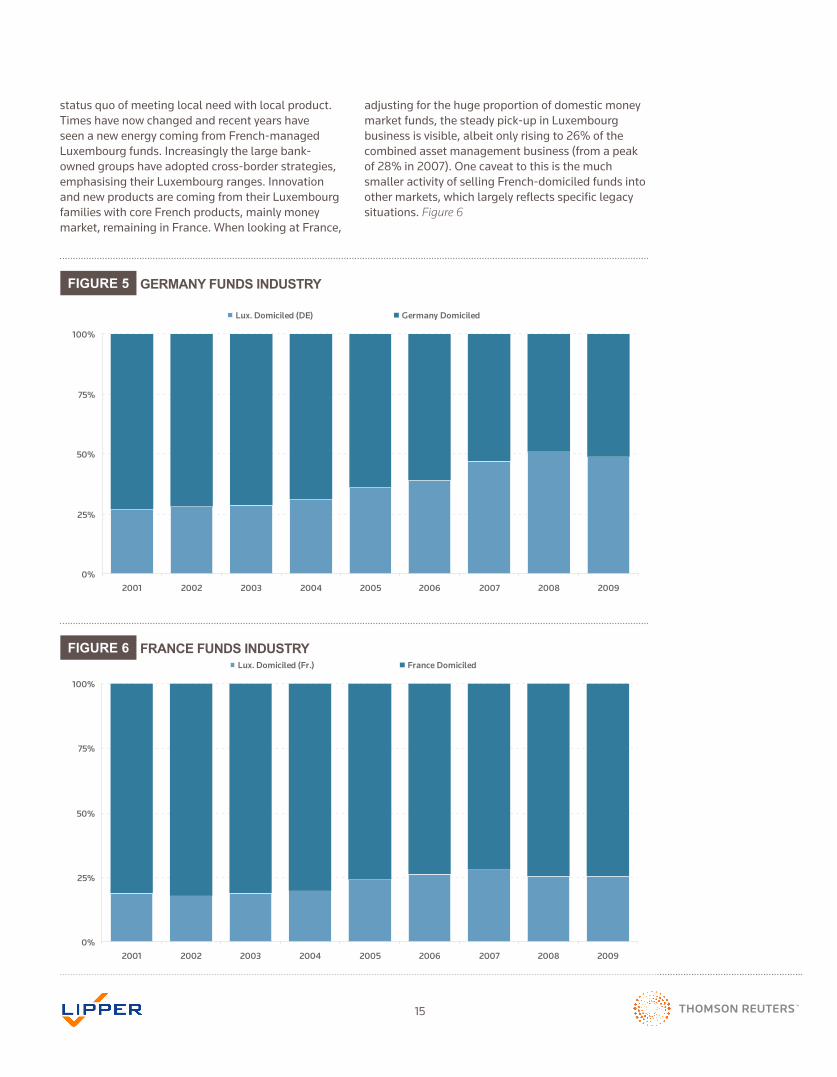
The same broad pattern can be seen in other major European markets, albeit not always to the same extent as in the Netherlands. The German relationship with Luxembourg has been much stronger for longer, but even here there is recent evidence of expatriate expansion. Luxembourg accounted for 27% of German assets in 2002 but this had grown to 49% by end of 2009. Speed to market has been a critical issue here, with product innovation far easier by using Luxembourg as the domicile. The result is a negative growth rate (CAGR) for German-domiciled funds, but healthy growth of 11% for Luxembourg funds of German companies.
As with the Dutch, the migration phenomenon for the German industry reflects the transition, particularly over the last five years, of some major players such
0%
25%
50%
75%
100%
2001 2002 2003 2004 2005 2006 2007 2008 2009
Lux. Domiciled (Neth.) Netherlands Domiciled
FIGURE 4 NETHERLANDS FUNDS INDUSTRY
as Allianz and Deutsche Bank/DWS from using local subsidiaries in their target markets to that of a true cross-border business. It is also worth noting that specialised investment funds (SIFs) are largely excluded from this data; a fund structure that is being frequently used from Luxembourg for German ‘sophisticated’ investors.
While the growth of Italian companies’ Luxembourg assets has not reached the 50% mark, still their growth from 22% to 44% over this period is impressive, particularly since Italian assets have been in decline in recent years. Much of the rise is attributable to domestic decline; if domestic funds had simply maintained asset levels for the past six years, the Luxembourg proportion would have been restricted to 30% in 2009. The impact of the tax on domestic funds accrued on a daily basis and reflected in lower performance figures, has undoubtedly favoured foreign funds, which are only taxed when a gain is realised. Nonetheless, it is significant that in an environment of decline, the Luxembourg asset base has retained greater persistency. Figure 5
Othermarketsareonthemove—Francebeinganotable convert having spent the early Ucits years with a doggedly domestic focus. There were, of course,exceptionsintheformofBNPParibasAssetManagement but most were happy to continue the
15
0%
25%
50%
75%
100%
2001 2002 2003 2004 2005 2006 2007 2008 2009
Lux. Domiciled (DE) Germany Domiciled
0%
25%
50%
75%
100%
2001 2002 2003 2004 2005 2006 2007 2008 2009
Lux. Domiciled (Fr.) France Domiciled
FIGURE 5
FIGURE 6
GERMANY FUNDS INDUSTRY
FRANCE FUNDS INDUSTRY
status quo of meeting local need with local product. Times have now changed and recent years have seen a new energy coming from French-managed Luxembourg funds. Increasingly the large bank-owned groups have adopted cross-border strategies, emphasising their Luxembourg ranges. Innovation and new products are coming from their Luxembourg families with core French products, mainly money market, remaining in France. When looking at France,
adjusting for the huge proportion of domestic money market funds, the steady pick-up in Luxembourg business is visible, albeit only rising to 26% of the combined asset management business (from a peak of28%in2007).Onecaveattothisisthemuchsmaller activity of selling French-domiciled funds into other markets, which largely reflects specific legacy situations. Figure 6
16
FinallytheUKpresentsthelatestexampleofadomesticmarket’sresponsetoforeign success at selling funds into a home territory. Normally regarded as off-limits to foreign funds because of the requirement for funds to register distributor status with the tax authorities, this old order is now changing. The distributor status barriers were relaxed in the 2005 Budget and there has since been a clear escalation in the level of activity coming from fund centre products. In this early stage the impetushascomefromgroupswithastrongUKpresence,whichwouldtraditionallyhavelaunchedaUKfundandmirrorequivalentfornon-UKinvestors.Today,itismore likely that a new launch will be added to an offshore umbrella and imported backtotheUK.ResistancetooffshoreproductsstillpersistsamongstthepowerfulIFA community but this is evolving through international products’ availability on platforms, through funds of funds keen to differentiate themselves (and looking fornon-UKopportunities),throughgrowingawarenessofUcitsIIIproducts,andthrough discretionary wealth managers’ investment net being cast wider.
Migration has proved to be a critical element of Luxembourg’s recent growth. Ofthelargernationalparticipants,theanalysisabovesuggeststhatan‘optimum’ proportion of Luxembourg assets could be 50% (i.e. for Germany and the Netherlands) or edging close to this mark. If one were to speculate a similar pattern of migration from all European countries and apply it to current Luxembourg assets, asset volumes could be boosted by around 30%. But, with success inevitably comes competition not only from other fund centres but also from domestic stakeholders who are reluctant to encourage the relocation of an important investment sector to another country.
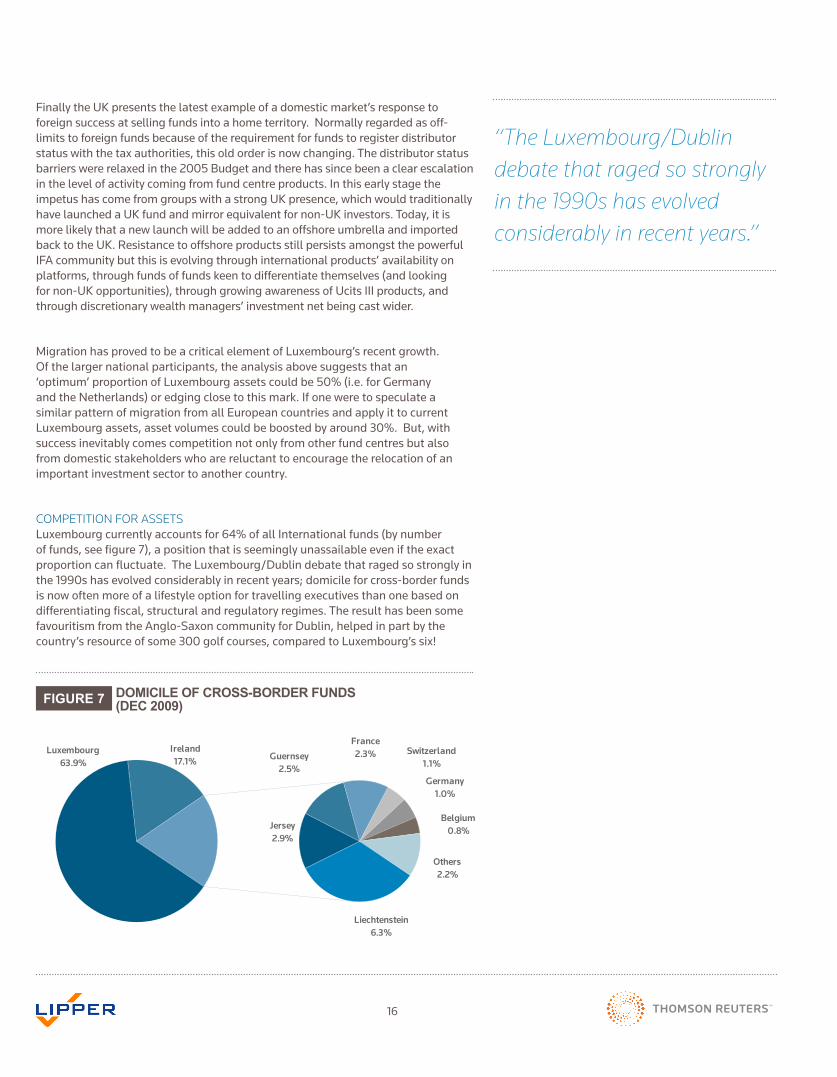
COMPETITION FOR ASSETS Luxembourg currently accounts for 64% of all International funds (by number of funds, see figure 7), a position that is seemingly unassailable even if the exact proportion can fluctuate. The Luxembourg/Dublin debate that raged so strongly in the 1990s has evolved considerably in recent years; domicile for cross-border funds is now often more of a lifestyle option for travelling executives than one based on differentiating fiscal, structural and regulatory regimes. The result has been some favouritism from the Anglo-Saxon community for Dublin, helped in part by the country’s resource of some 300 golf courses, compared to Luxembourg’s six!
Figure 7: Domicile of Cross-Border Funds (Dec 2009)
Others2.2%
Belgium0.8%
Guernsey2.5%
France2.3% Switzerland
1.1%
Germany1.0%
Jersey2.9%
Liechtenstein6.3%
Luxembourg63.9%
Ireland17.1%
FIGURE 7 DOMICILE OF CROSS-BORDER FUNDS (DEC 2009)
“The Luxembourg/Dublin debate that raged so strongly in the 1990s has evolved considerably in recent years.”
17
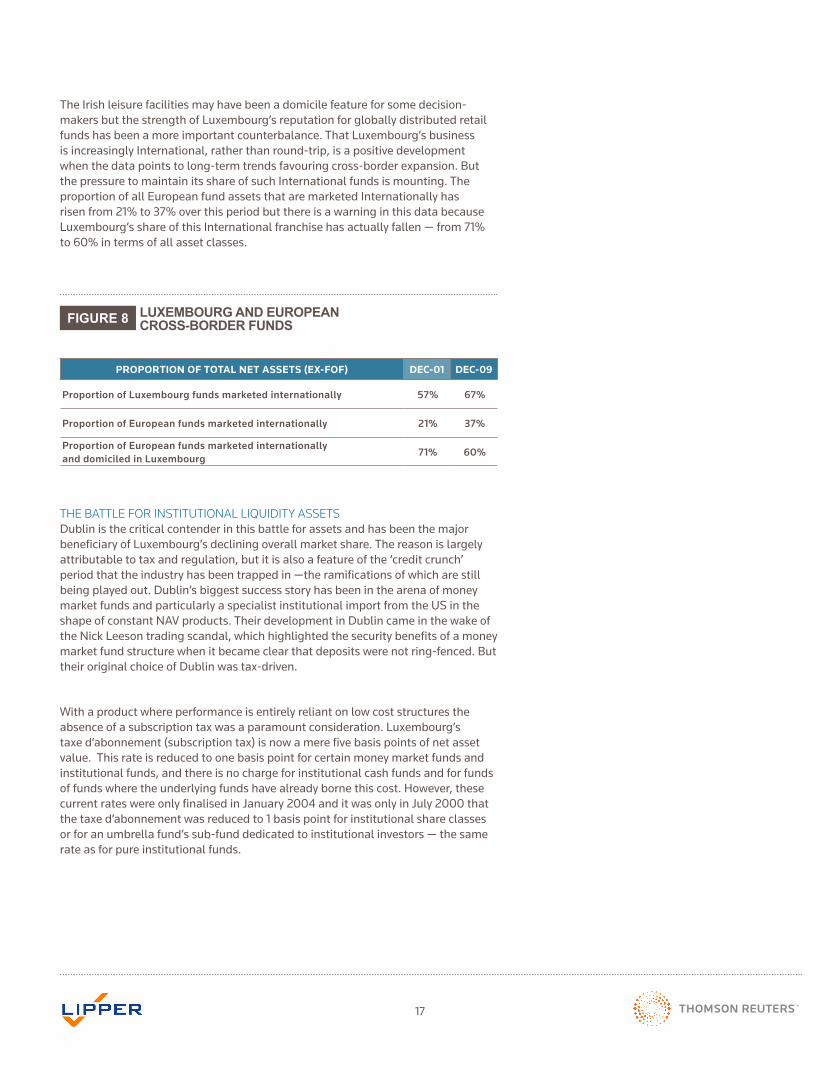
The Irish leisure facilities may have been a domicile feature for some decision-makers but the strength of Luxembourg’s reputation for globally distributed retail funds has been a more important counterbalance. That Luxembourg’s business is increasingly International, rather than round-trip, is a positive development when the data points to long-term trends favouring cross-border expansion. But the pressure to maintain its share of such International funds is mounting. The proportion of all European fund assets that are marketed Internationally has risen from 21% to 37% over this period but there is a warning in this data because Luxembourg’s share of this International franchise has actually fallen — from 71% to 60% in terms of all asset classes.
THE BATTLE FOR INSTITUTIONAL LIQUIDITY ASSETSDublin is the critical contender in this battle for assets and has been the major beneficiary of Luxembourg’s declining overall market share. The reason is largely attributable to tax and regulation, but it is also a feature of the ‘credit crunch’ period that the industry has been trapped in —the ramifications of which are still being played out. Dublin’s biggest success story has been in the arena of money market funds and particularly a specialist institutional import from the US in the shape of constant NAV products. Their development in Dublin came in the wake of the Nick Leeson trading scandal, which highlighted the security benefits of a money market fund structure when it became clear that deposits were not ring-fenced. But their original choice of Dublin was tax-driven.
With a product where performance is entirely reliant on low cost structures the absence of a subscription tax was a paramount consideration. Luxembourg’s taxe d’abonnement (subscription tax) is now a mere five basis points of net asset value. This rate is reduced to one basis point for certain money market funds and institutional funds, and there is no charge for institutional cash funds and for funds of funds where the underlying funds have already borne this cost. However, these current rates were only finalised in January 2004 and it was only in July 2000 that the taxe d’abonnement was reduced to 1 basis point for institutional share classes or for an umbrella fund’s sub-fund dedicated to institutional investors — the same rate as for pure institutional funds.
FIGURE 8 LUXEMBOURG AND EUROPEAN CROSS-BORDER FUNDS
PROPORTION OF TOTAL NET ASSETS (EX-FOF) DEC-01 DEC-09
Proportion of Luxembourg funds marketed internationally 57% 67%
Proportion of European funds marketed internationally 21% 37%
Proportion of European funds marketed internationally and domiciled in Luxembourg
71% 60%
18
The abolition of taxe d’abonnement (for institutional money market products) was an important advance for Luxembourg but arguably it came too late. The market leaders were already positioned in Dublin and their position strengthened with the implementation of MiFID and the second Basel Directive, which effectively allowed corporate treasurers to view money market funds as equivalent to deposit accounts, whereas previously their risk had been equated to equity funds. This led to an explosion of activity, helped more recently by the sub-prime fall-out and the collapse of the enhanced money market segment. With money pouring into the Dublin-based institutional liquidity funds as stock markets plummeted in the wake of the sub-prime scandal, so Dublin’s share of cross-border business expanded.
The institutional money market sector has been a major factor behind Luxembourg’s loss of market share, although it is equally fair to say that the battle for these assets is still alive. The growth rate of equivalent Luxembourg assets has been higher since 2005,thanksparticularlytoJPMorganchoosingtouse Luxembourg for its liquidity products and not just its cross-border retail range. Its assets have more than doubled since 2005 and it has been joined by a number of heavy-hitters from Continental Europe includingDeutscheBank,KBCandBNPParibas.Inevitably, also, investment cycles turn and in the 2009 recovery period money started to come out of the institutional vehicles so Luxembourg’s market share losses have a good chance of being recovered.
PULL-BACK FROM DOMESTIC MARKETSCompetition is also developing from neighbouring domestic markets, many of which fear the impact that a loss of assets will have on their control of retail investment.TheUKisacaseinpoint;herethereisafearthatultimatelyUKgroupswillfollowtheDutch example and operate centralised hubs from aLuxembourgandDublinbase.TheUK’searlierattempttocounterthiscamewiththelaunchofOpenEndedInvestmentCompanies(Oeics)inJanuary1997.ThreadneedleisthebestexampleofaUKcompanyusingthisstructuretotargetnon-UKinvestors,butit has also been used by M&G, Newton (part of BNY Mellon) and First State.
The more recent relaxation of the distributor status barrier was important and has undoubtedly led to increased volumes of business going to so-called offshorefunds(seethesectionontheUKinchapter
7 for data on this evolution). The government debate developed further in July 2008 when HM Treasury announced the launch of three consultation papers on the asset management industry relating to open-ended retail funds, closed-ended retail funds and qualified investor schemes. Each paper dealswithchangesinthetaxtreatmentoftheUKasset management industry in order to maintain its competitiveness internationally. Most recently, inJanuary2010,theUK’sfundsassociation(IMA)welcomed draft regulations from the government toremovethe20%taxfrominvestmentsbyUKauthorised funds into non-reporting offshore funds, levellingUKfundtreatmentwithoffshorefunds.
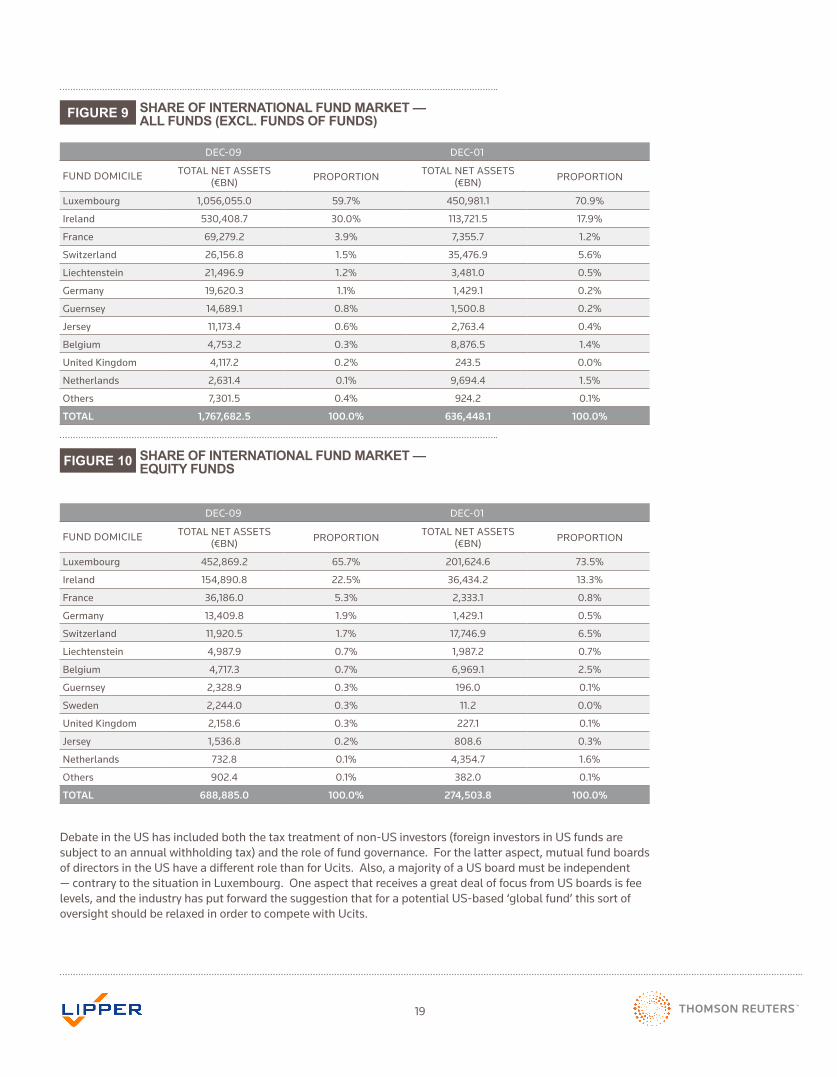
Elsewhere, the migration of assets by some providers has been accompanied by an expansion of cross-border activity from a pre-existing domestic base. Most of the larger and more mature European markets host a number of funds that operate happily on a cross-border basis, as the following tables illustrate. (Figures 9 and 10) All this has whittled further percentage points away from Luxembourg’s share of International assets.
Interestingly, when the totals for Luxembourg and Ireland are combined, their share of international funds in both tables has held up well, at around 90%.
COMPETITION FROM OUTSIDE EUROPELuxembourg’s success has not gone unnoticed outside the European Union and it has become recently fashionable for ever more remote locations to establish financial centres as a way to kick-start diversified economic growth. Most of these emerging centres have yet to gain any real traction as broad-based retail fund centres but some have ambitions in that direction.
Dubai’s focus on Sharia products and its trading agreement with the Malaysian government is just one example. More interesting, perhaps, is the discussion that seemed to be developing in the US to adjust local regulation in order to facilitate the offering of a US-based Ucits (such as the reference in the US Treasury Department’s ‘Blueprint for a modernized financial regulatory structure’). The attraction of targeting Asian investors is one of the key aspects to have prompted such discussions — and therefore awareness of Ucits as a global brand.
19
DEC-09 DEC-01
FUNDDOMICILE TOTALNETASSETS(€BN) PROPORTION TOTALNETASSETS
(€BN) PROPORTION
Luxembourg 1,056,055.0 59.7% 450,981.1 70.9%
Ireland 530,408.7 30.0% 113,721.5 17.9%
France 69,279.2 3.9% 7,355.7 1.2%
Switzerland 26,156.8 1.5% 35,476.9 5.6%
Liechtenstein 21,496.9 1.2% 3,481.0 0.5%
Germany 19,620.3 1.1% 1,429.1 0.2%
Guernsey 14,689.1 0.8% 1,500.8 0.2%
Jersey 11,173.4 0.6% 2,763.4 0.4%
Belgium 4,753.2 0.3% 8,876.5 1.4%
UnitedKingdom 4,117.2 0.2% 243.5 0.0%
Netherlands 2,631.4 0.1% 9,694.4 1.5%
Others 7,301.5 0.4% 924.2 0.1%
TOTAL 1,767,682.5 100.0% 636,448.1 100.0%
DEC-09 DEC-01
FUNDDOMICILE TOTALNETASSETS(€BN) PROPORTION TOTALNETASSETS
(€BN) PROPORTION
Luxembourg 452,869.2 65.7% 201,624.6 73.5%
Ireland 154,890.8 22.5% 36,434.2 13.3%
France 36,186.0 5.3% 2,333.1 0.8%
Germany 13,409.8 1.9% 1,429.1 0.5%
Switzerland 11,920.5 1.7% 17,746.9 6.5%
Liechtenstein 4,987.9 0.7% 1,987.2 0.7%
Belgium 4,717.3 0.7% 6,969.1 2.5%
Guernsey 2,328.9 0.3% 196.0 0.1%
Sweden 2,244.0 0.3% 11.2 0.0%
UnitedKingdom 2,158.6 0.3% 227.1 0.1%
Jersey 1,536.8 0.2% 808.6 0.3%
Netherlands 732.8 0.1% 4,354.7 1.6%
Others 902.4 0.1% 382.0 0.1%
TOTAL 688,885.0 100.0% 274,503.8 100.0%
FIGURE 9
FIGURE 10
SHARE OF INTERNATIONAL FUND MARKET — ALL FUNDS (EXCL. FUNDS OF FUNDS)
SHARE OF INTERNATIONAL FUND MARKET — EQUITY FUNDS
Debate in the US has included both the tax treatment of non-US investors (foreign investors in US funds are subject to an annual withholding tax) and the role of fund governance. For the latter aspect, mutual fund boards of directors in the US have a different role than for Ucits. Also, a majority of a US board must be independent —contrarytothesituationinLuxembourg.OneaspectthatreceivesagreatdealoffocusfromUSboardsisfeelevels, and the industry has put forward the suggestion that for a potential US-based ‘global fund’ this sort of oversight should be relaxed in order to compete with Ucits.

20
Ultimately it is now probably too late for US cross-border companies with well-established European operations to turn back and re-locate their product warehouse to the other side of the Atlantic but the move could contain any further migration by smaller boutique groups that have not yet cast their eyes beyond their home territory.

21
ORGANIC GROWTH FROM THE CROSS-BORDER COMMUNITY
Intermingled with the migration dynamic impacting on Luxembourg’s business has beenthenaturaldevelopmentofthecross-borderfranchise.Originallybasedonasmall handful of independent Anglo-Saxon groups accompanied by a selection of Swiss private banks most fund management entities have now embraced the cross-border opportunity. Luxembourg-based assets of International groups have more than doubled since the turn of the century, growing at a faster compound rate (11%) than Luxembourg’s single market funds (5%).
There are now over 100 independent asset managers with cross-border funds based in Luxembourg competing effectively alongside an equal number of bank-owned asset managers. Most of the bank-owned entities also sell their funds on a third-party basis, particularly outside their home territory, and increasingly have to compete for shelf-space within their own bank distribution platform. Indeed many now complain that they have to fight harder for a position on their own bank shelves than they do for third-party space.
EMERGENCE OF THE PROFESSIONAL FUND BUYERThe growth in cross-border asset management groups has occurred at the same time as the value chain that links these companies with their end consumers is undergoing a process of profound change, moving from one that had no more than one layer of intermediation to one with many layers of intermediation.
There were three primary drivers of this change:
First, the consumer shock that arose from overselling practices (for example, technology funds at the height of the boom), which in turn led to demand for product choice that goes beyond the in-house range.
Second, the expanding presence of foreign groups featuring good performance stories to consumers and offering attractive retrocessions to distributors willing to listen.
Third, increased pressure on bank profitability brought on by a low interest-rate environment, encouraging the development of complex packaged products with more attractive margins and the inclusion of third-party products in the overall mix.
These drivers have led to investors being offered third-party products, either within a wrapper or directly via guided-architecture channels. This, in turn, has led to the emergence of a professional fund-buyer community within Europe.
The sheer impossibility of delivering complete open architecture choice with 5,000 or more funds available in many markets has resulted in fund selection skills attracting a new recognition. Fund buyers are now the gate-keepers and

22
fund selection, rather than asset management capability, has become the boast of the larger distribution franchises. The importance of this development is that the buyer community is increasingly sophisticated, operating in a fashion that is more consistent with that of traditional institutional investors.
IMPACT ON SALES FLOWSThe growing power of professional buyers in the value chain has had a profound effect on the nature of the mutual fund business. Sales flows have become more volatile at a fund and a group level, and there is anecdotal evidence in some quarters of persistent portfolio churning (i.e. of an investor’s range of funds, rather than of a manager’s stock selection). A fund can suffer steep redemptions, regardless of performance, because of a simple shift in the asset allocation model of a large fund buyer.
Such volatility is also exacerbated by the fact that a new story has powerful appeal. In an environment in which fund selection is the ‘unique selling point’ of a distributor, there is considerable mileage in ‘discovering’ a new investment angle. The bulk of this type of business is via proprietary channels but it is nonetheless a factor that encourages product proliferation. Among cross-border players, the proportion is better balanced between new and backlist funds, however, the ability for the major companies to offer a comprehensive range of products is certainly present.
Having said this, more business has gravitated towards a smaller number of ‘brand houses’ and a smaller number of funds, particularly during periods of economic/market uncertainty. Getting a distributor to listen to an asset manager’s story has therefore been easier for these houses.
However, profile and reputation that have been built up over years can turn negative overnight: fund manager departures or corporate disruption can temporarily be extremely damaging. The departure of a fund manager often results in the fund being put immediately on a ‘sell’ list regardless of the likely impact on performance.
In order to weather possible storms and to deliver products to fund buyers regardless of the current fashion, the major cross-border players need to provide consistently good performance, product breadth and high levels of service across all the markets in which their distributor has a presence — aspects that many of the larger players in Europe have been building and developing over ten years or more.
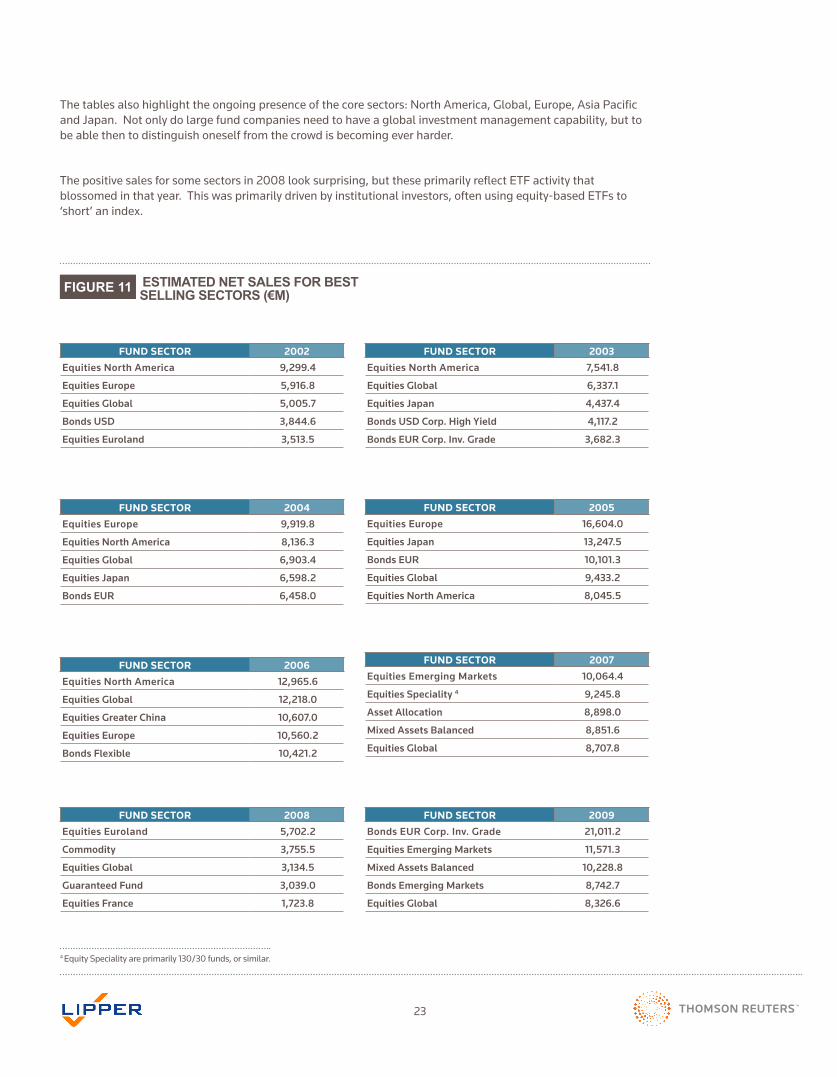
Just how difficult it is to deliver funds that will attract sales on an ongoing basis should not be underestimated. The following tables highlight the best selling sectors for international funds (irrespective of domicile, in order to get the broadest perspective). About half of the sectors featured in these tables have only appeared once, emphasising how difficult it is for fund companies to have a product range that can deliver sales in all market conditions.
“Just how difficult it is to deliver funds that will attract sales on an ongoing basis should not be underestimated.”
23
Thetablesalsohighlighttheongoingpresenceofthecoresectors:NorthAmerica,Global,Europe,AsiaPacificand Japan. Not only do large fund companies need to have a global investment management capability, but to be able then to distinguish oneself from the crowd is becoming ever harder.
The positive sales for some sectors in 2008 look surprising, but these primarily reflect ETF activity that blossomed in that year. This was primarily driven by institutional investors, often using equity-based ETFs to ‘short’ an index.
FUND SECTOR 2002
Equities North America 9,299.4
Equities Europe 5,916.8
Equities Global 5,005.7
Bonds USD 3,844.6
Equities Euroland 3,513.5
FUND SECTOR 2003
Equities North America 7,541.8
Equities Global 6,337.1
Equities Japan 4,437.4
Bonds USD Corp. High Yield 4,117.2
Bonds EUR Corp. Inv. Grade 3,682.3
FUND SECTOR 2004
Equities Europe 9,919.8
Equities North America 8,136.3
Equities Global 6,903.4
Equities Japan 6,598.2
Bonds EUR 6,458.0
FUND SECTOR 2005
Equities Europe 16,604.0
Equities Japan 13,247.5
Bonds EUR 10,101.3
Equities Global 9,433.2
Equities North America 8,045.5
FUND SECTOR 2006
Equities North America 12,965.6
Equities Global 12,218.0
Equities Greater China 10,607.0
Equities Europe 10,560.2
Bonds Flexible 10,421.2
FUND SECTOR 2007
Equities Emerging Markets 10,064.4
Equities Speciality 4 9,245.8
Asset Allocation 8,898.0
Mixed Assets Balanced 8,851.6
Equities Global 8,707.8
FUND SECTOR 2008
Equities Euroland 5,702.2
Commodity 3,755.5
Equities Global 3,134.5
Guaranteed Fund 3,039.0
Equities France 1,723.8
FUND SECTOR 2009
Bonds EUR Corp. Inv. Grade 21,011.2
Equities Emerging Markets 11,571.3
Mixed Assets Balanced 10,228.8
Bonds Emerging Markets 8,742.7
Equities Global 8,326.6
FIGURE 11 ESTIMATED NET SALES FOR BEST SELLING SECTORS (€M)
4 Equity Speciality are primarily 130/30 funds, or similar.
24
-350,000
-250,000
-150,000
-50,000
50,000
150,000
250,000
2002 2003 2004 2005 2006 2007 2008 2009
Net
sal
es (€
m)
New fund launches 'Backlist' funds
-600,000
-500,000
-400,000
-300,000
-200,000
-100,000
0
100,000
200,000
300,000
400,000
2002 2003 2004 2005 2006 2007 2008 2009
Net
sal
es (€
m)
New fund launches 'Backlist' funds
FIGURE 12
FIGURE 13
HOW WELL DOES THE NEW STORY SELL FOR LUXEMBOURG FUNDS?
HOW WELL DOES THE NEW STORY SELL IN EUROPE?
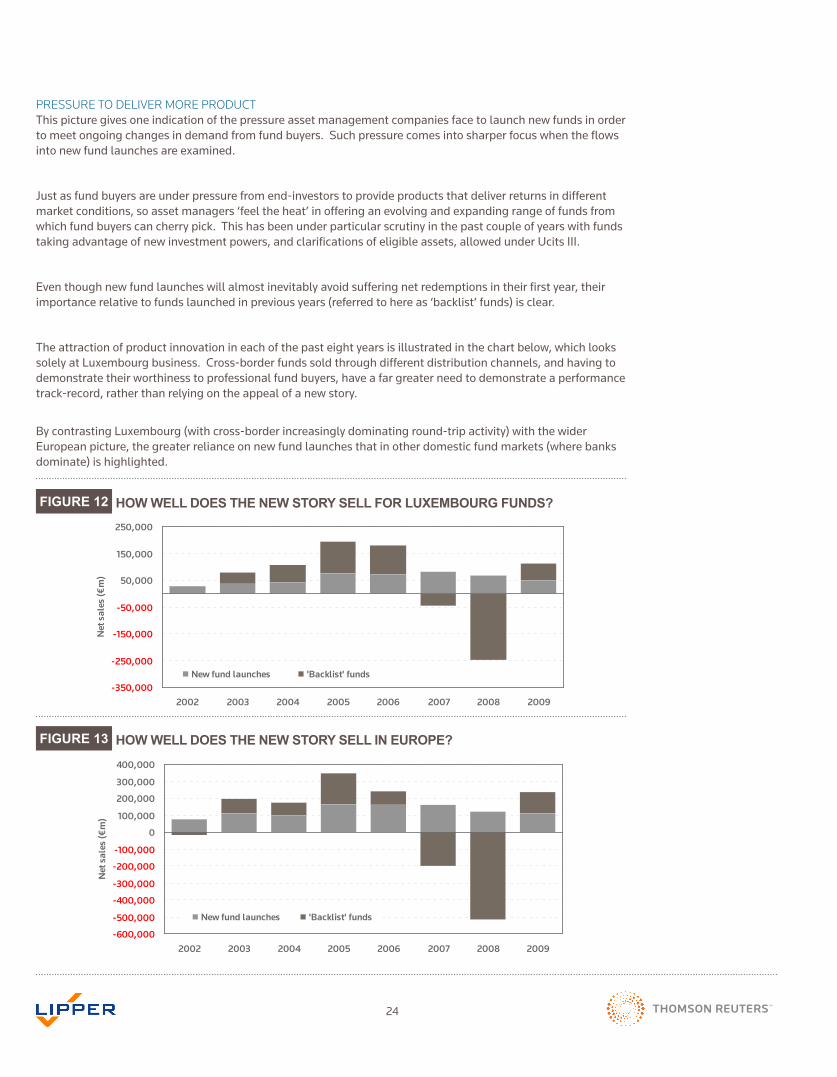
PRESSURE TO DELIVER MORE PRODUCTThis picture gives one indication of the pressure asset management companies face to launch new funds in order to meet ongoing changes in demand from fund buyers. Such pressure comes into sharper focus when the flows into new fund launches are examined.
Just as fund buyers are under pressure from end-investors to provide products that deliver returns in different market conditions, so asset managers ‘feel the heat’ in offering an evolving and expanding range of funds from which fund buyers can cherry pick. This has been under particular scrutiny in the past couple of years with funds taking advantage of new investment powers, and clarifications of eligible assets, allowed under Ucits III.
Even though new fund launches will almost inevitably avoid suffering net redemptions in their first year, their importance relative to funds launched in previous years (referred to here as ‘backlist’ funds) is clear.
The attraction of product innovation in each of the past eight years is illustrated in the chart below, which looks solely at Luxembourg business. Cross-border funds sold through different distribution channels, and having to demonstrate their worthiness to professional fund buyers, have a far greater need to demonstrate a performance track-record, rather than relying on the appeal of a new story.
By contrasting Luxembourg (with cross-border increasingly dominating round-trip activity) with the wider European picture, the greater reliance on new fund launches that in other domestic fund markets (where banks dominate) is highlighted.
25
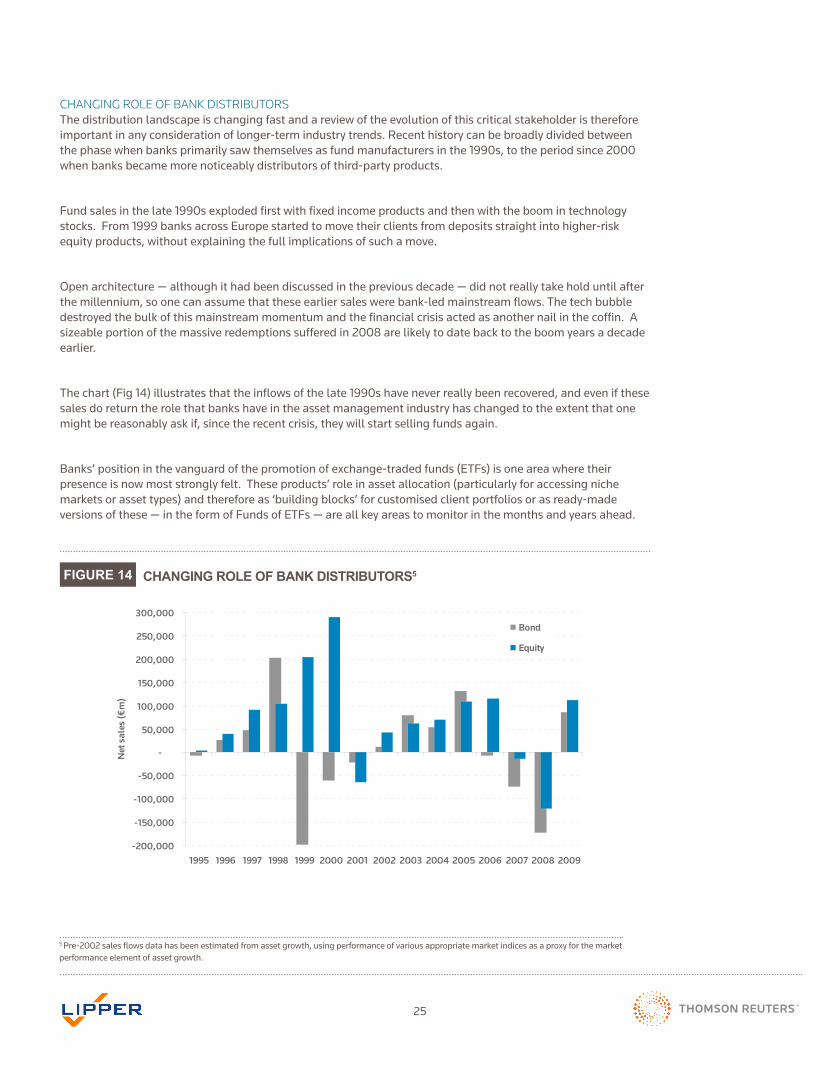
CHANGING ROLE OF BANK DISTRIBUTORSThe distribution landscape is changing fast and a review of the evolution of this critical stakeholder is therefore important in any consideration of longer-term industry trends. Recent history can be broadly divided between the phase when banks primarily saw themselves as fund manufacturers in the 1990s, to the period since 2000 when banks became more noticeably distributors of third-party products.
Fund sales in the late 1990s exploded first with fixed income products and then with the boom in technology stocks. From 1999 banks across Europe started to move their clients from deposits straight into higher-risk equity products, without explaining the full implications of such a move.
Openarchitecture—althoughithadbeendiscussedinthepreviousdecade—didnotreallytakeholduntilafterthe millennium, so one can assume that these earlier sales were bank-led mainstream flows. The tech bubble destroyed the bulk of this mainstream momentum and the financial crisis acted as another nail in the coffin. A sizeable portion of the massive redemptions suffered in 2008 are likely to date back to the boom years a decade earlier.
The chart (Fig 14) illustrates that the inflows of the late 1990s have never really been recovered, and even if these sales do return the role that banks have in the asset management industry has changed to the extent that one might be reasonably ask if, since the recent crisis, they will start selling funds again.
Banks’ position in the vanguard of the promotion of exchange-traded funds (ETFs) is one area where their presence is now most strongly felt. These products’ role in asset allocation (particularly for accessing niche markets or asset types) and therefore as ‘building blocks’ for customised client portfolios or as ready-made versions of these — in the form of Funds of ETFs — are all key areas to monitor in the months and years ahead.
-200,000
-150,000
-100,000
-50,000
-
50,000
100,000
150,000
200,000
250,000
300,000
1995 1996 1997 1998 1999 2000 2001 2002 2003 2004 2005 2006 2007 2008 2009
Net
sal
es (€
m)
Bond
Equity
FIGURE 14 CHANGING ROLE OF BANK DISTRIBUTORS5
5 Pre-2002salesflowsdatahasbeenestimatedfromassetgrowth,usingperformanceofvariousappropriatemarketindicesasaproxyforthemarketperformance element of asset growth.
26
Figure 15: Number of funds by country registrations
0
25
50
75
100
125
150
175
200
225
250
275
300
5 6 7 8 9 10 11 12 13 14 15 16 17 18 19 2 21 22 23 24 25 26 27 28 29 3 31 32 33 34 35 36 37 38 39
Number of country registrations
Num
ber
of fu
nds
THE NEW MAP OF EUROPEThe explosion of cross-border business in recent years has been accompanied by numerous data difficulties. The asset management map of Europe can no longer be defined by its geographical borders nor, indeed, can its pot of assets be assumed to be sourced entirely from European investors. The Ucits concept has come of age and today’s European Ucits are not only available for sale globally but in some Asian markets they represent the bulk oflocalmutualfundbusiness.Ofthe10,407fundscurrentlydomiciledinLuxembourg,half(5,173)source80%or more of their assets from multiple markets ranging from Chile to South Africa, Europe and the Middle East andontoTaiwan,HongKongandotherAsiandestinations.
In terms of assets the bulk of Luxembourg-based cross-border activity remains focussed on Europe, and a small number of key markets in Europe. However, Asia has become an increasingly important component of cross-border group strategy and in some periods net sales flows from non-European markets have been superior. The available data is sparse but it is possible to gauge the development of cross-border business at a number of different levels.
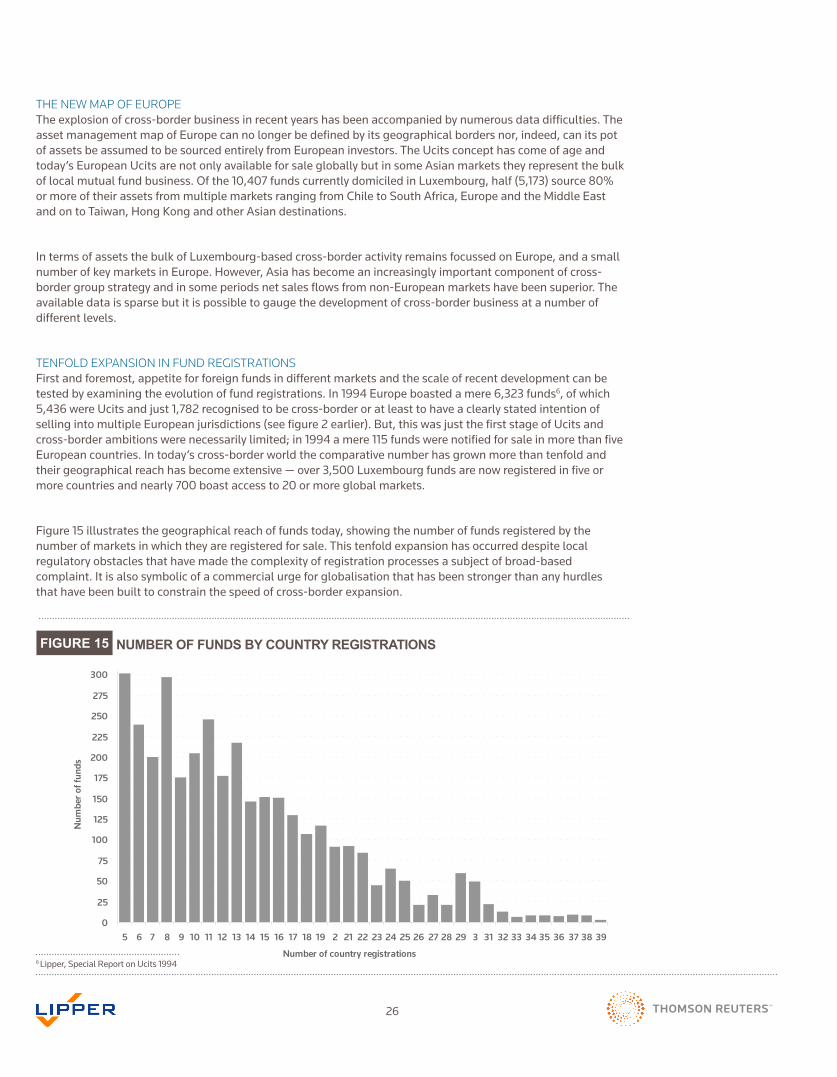
TENFOLD EXPANSION IN FUND REGISTRATIONSFirst and foremost, appetite for foreign funds in different markets and the scale of recent development can be tested by examining the evolution of fund registrations. In 1994 Europe boasted a mere 6,323 funds6, of which 5,436 were Ucits and just 1,782 recognised to be cross-border or at least to have a clearly stated intention of selling into multiple European jurisdictions (see figure 2 earlier). But, this was just the first stage of Ucits and cross-border ambitions were necessarily limited; in 1994 a mere 115 funds were notified for sale in more than five European countries. In today’s cross-border world the comparative number has grown more than tenfold and their geographical reach has become extensive — over 3,500 Luxembourg funds are now registered in five or more countries and nearly 700 boast access to 20 or more global markets.
Figure 15 illustrates the geographical reach of funds today, showing the number of funds registered by the number of markets in which they are registered for sale. This tenfold expansion has occurred despite local regulatory obstacles that have made the complexity of registration processes a subject of broad-based complaint. It is also symbolic of a commercial urge for globalisation that has been stronger than any hurdles that have been built to constrain the speed of cross-border expansion.
FIGURE 15 NUMBER OF FUNDS BY COUNTRY REGISTRATIONS
6 Lipper, Special Report on Ucits 1994
27
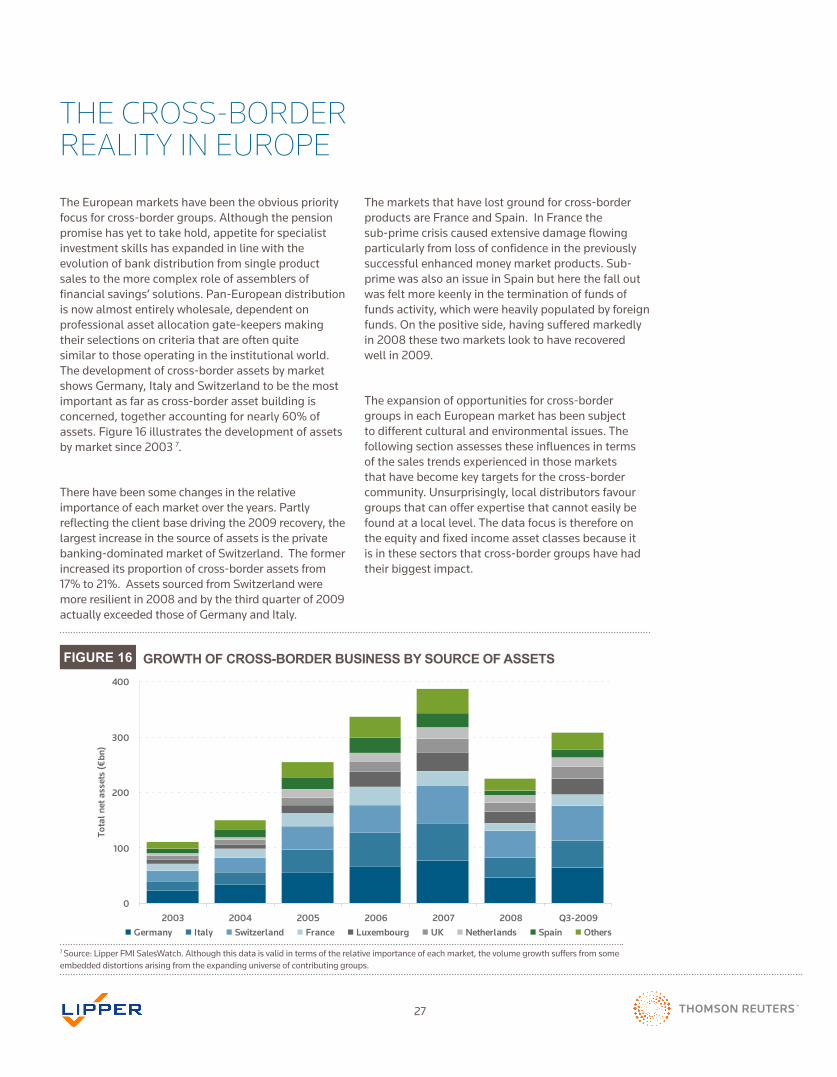
The European markets have been the obvious priority focus for cross-border groups. Although the pension promise has yet to take hold, appetite for specialist investment skills has expanded in line with the evolution of bank distribution from single product sales to the more complex role of assemblers of financialsavings’solutions.Pan-Europeandistributionis now almost entirely wholesale, dependent on professional asset allocation gate-keepers making their selections on criteria that are often quite similar to those operating in the institutional world. The development of cross-border assets by market shows Germany, Italy and Switzerland to be the most important as far as cross-border asset building is concerned, together accounting for nearly 60% of assets. Figure 16 illustrates the development of assets by market since 2003 7.
There have been some changes in the relative importanceofeachmarketovertheyears.Partlyreflecting the client base driving the 2009 recovery, the largest increase in the source of assets is the private banking-dominated market of Switzerland. The former increased its proportion of cross-border assets from 17% to 21%. Assets sourced from Switzerland were more resilient in 2008 and by the third quarter of 2009 actually exceeded those of Germany and Italy.
THE CROSS-BORDER REALITY IN EUROPE
Figure 16: Growth of cross-border business by source of assets
0
100
200
300
400
2003 2004 2005 2006 2007 2008 Q3-2009
Tota
l net
ass
ets
(€bn
)
Germany Italy Switzerland France Luxembourg UK Netherlands Spain Others
The markets that have lost ground for cross-border products are France and Spain. In France the sub-prime crisis caused extensive damage flowing particularly from loss of confidence in the previously successful enhanced money market products. Sub-prime was also an issue in Spain but here the fall out was felt more keenly in the termination of funds of funds activity, which were heavily populated by foreign funds.Onthepositiveside,havingsufferedmarkedlyin 2008 these two markets look to have recovered well in 2009.
The expansion of opportunities for cross-border groups in each European market has been subject to different cultural and environmental issues. The following section assesses these influences in terms of the sales trends experienced in those markets that have become key targets for the cross-border community. Unsurprisingly, local distributors favour groups that can offer expertise that cannot easily be found at a local level. The data focus is therefore on the equity and fixed income asset classes because it is in these sectors that cross-border groups have had their biggest impact.
FIGURE 16 GROWTH OF CROSS-BORDER BUSINESS BY SOURCE OF ASSETS
7 Source: Lipper FMI SalesWatch. Although this data is valid in terms of the relative importance of each market, the volume growth suffers from some embedded distortions arising from the expanding universe of contributing groups.
28
FIGURE 17
FIGURE 18
DOMESTIC V FOREIGN EQUITY ACTIVITY
DOMESTIC V FOREIGN BOND ACTIVITY
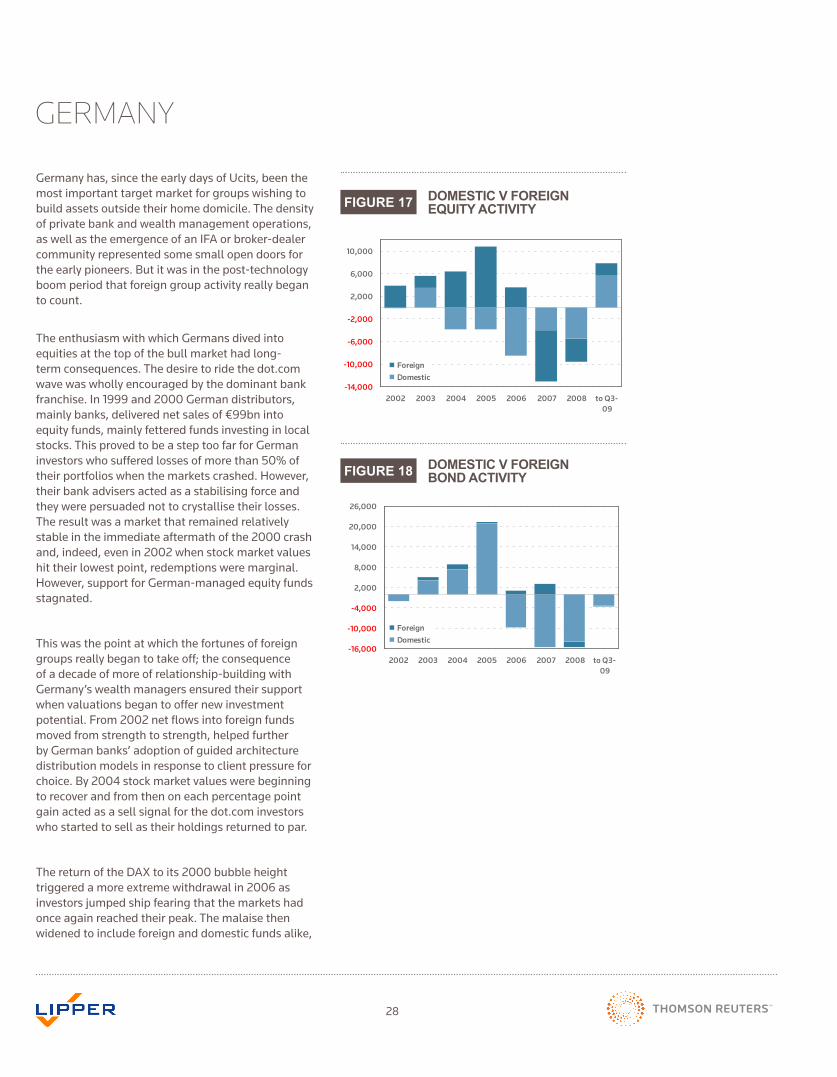
Germany has, since the early days of Ucits, been the most important target market for groups wishing to build assets outside their home domicile. The density of private bank and wealth management operations, as well as the emergence of an IFA or broker-dealer community represented some small open doors for the early pioneers. But it was in the post-technology boom period that foreign group activity really began to count.
The enthusiasm with which Germans dived into equities at the top of the bull market had long-term consequences. The desire to ride the dot.com wave was wholly encouraged by the dominant bank franchise. In 1999 and 2000 German distributors, mainly banks, delivered net sales of €99bn into equity funds, mainly fettered funds investing in local stocks. This proved to be a step too far for German investors who suffered losses of more than 50% of their portfolios when the markets crashed. However, their bank advisers acted as a stabilising force and they were persuaded not to crystallise their losses. The result was a market that remained relatively stable in the immediate aftermath of the 2000 crash and, indeed, even in 2002 when stock market values hit their lowest point, redemptions were marginal. However, support for German-managed equity funds stagnated.
This was the point at which the fortunes of foreign groups really began to take off; the consequence of a decade of more of relationship-building with Germany’s wealth managers ensured their support when valuations began to offer new investment potential. From 2002 net flows into foreign funds moved from strength to strength, helped further by German banks’ adoption of guided architecture distribution models in response to client pressure for choice. By 2004 stock market values were beginning to recover and from then on each percentage point gain acted as a sell signal for the dot.com investors who started to sell as their holdings returned to par.
The return of the DAX to its 2000 bubble height triggered a more extreme withdrawal in 2006 as investors jumped ship fearing that the markets had once again reached their peak. The malaise then widened to include foreign and domestic funds alike,
GERMANY
Fig 17: Domestic v Foreign Equity Activity
-14,000
-10,000
-6,000
-2,000
2,000
6,000
10,000
2002 2003 2004 2005 2006 2007 2008 to Q3-09
ForeignDomestic
Fig 18: Domestic v Foreign Bond Activity
-16,000
-10,000
-4,000
2,000
8,000
14,000
20,000
26,000
2002 2003 2004 2005 2006 2007 2008 to Q3-09
ForeignDomestic
29
exacerbated by the sub-prime scare. In 2007 foreign groups bore the brunt of redemptions as investors took profits rather than wait for them to be wiped out by the stock market falls that accompanied the credit crunch.
A further factor linked to 2007 redemptions was a tax change that encouraged flows into domestic ‘tax-optimised’ money market funds and it was the large German banks that monopolised this sector.
Luxembourg’s specialised investment funds (SIFs), introduced with the law of 13 February 2007 — replacing the law of 19 July 1991 — are designed for professional and qualified investors with a minimum of €125,000 to invest, which can be waived if they have been positively assessed by a credit institution, investment manager or bank. The range of eligible assets is unlimited and the annual tax is one basis point. As a means of managing the tax burden, these fund structures gained traction in Germany in 2007 and 2008, although with the Abgeltungssteuer change at the beginning of 2009 there has been much less interest since then.
The 2009 recovery has been driven by equity, rather than bond products, although in the last months of 2009 flows into corporate investment grade bonds and high-yield products has helped to soften the blow of redemptions from the asset class as a whole. Even on the equity side, a significant slice of activity has come from ETFs, largely as a result of the efforts of Deutsche Bank, Indexchange (bought by Barclays, in turn bought by BlackRock), Deka and Commerzbank.
The boost to fund savings in 2008 on the back of the capital gains tax (Abgeltungssteuer) changes clearly benefited funds of funds (third-party products enjoyed net sales of €10.4bn) and mixed asset funds (€11.1bn in sales) and helped to cushion the blow the market suffered amid the redemptions during the global financial crisis. Under this change (implemented in January 2009) Germans, for the first time, now have to pay tax on any realised capital gains made from their investments.
To make mutual funds more attractive for effective pension savings the BVI continues to pressure for amendments to capital gains tax. Separately, German industry participants are in no doubt that new
regulations for fund distributors are coming soon, with expectations of a tightening of the requirements in the areas of client advisory and transparency of products.
Meanwhile the BVI has gained more clout in lobbying for the funds industry after receiving an endorsement of its efforts from the financial watchdog (BaFin). BaFin said that it would incorporate a code of conduct drawn up by the BVI into its guide to the interpretation of investment law. Moreover, it has launched an educational initiative designed improve knowledge of mutual funds. Better investor understanding can only help mutual fund sales to a wider investor base.
The potential size of mass-affluent investors choosing mutual funds — both domestic and foreign products — continues to mean that sales prospects for this market are positive. The wider savings rate in Germany rose through 2008 (to 11%) and has been forecast to rise again, lending support to this is a country of savers, even if investment horizons are often quite short-term (boosting certificates as a result). This is where Riester pension savings are all the more important, supporting saving in general as well as a longer term outlook.
Onpensionprovisions,theBVIhasbeenactivetoo,pushing for a proportion of long-term mutual fund savings to be deducted from taxable income, as pension savings are. The BVI argues that savings via mutual funds should be viewed as a form of pension provision, even if not wrapped in an insurance policy.
DOMESTIC V FOREIGN EQUITY ACTIVITY
DOMESTIC V FOREIGN BOND ACTIVITY
30
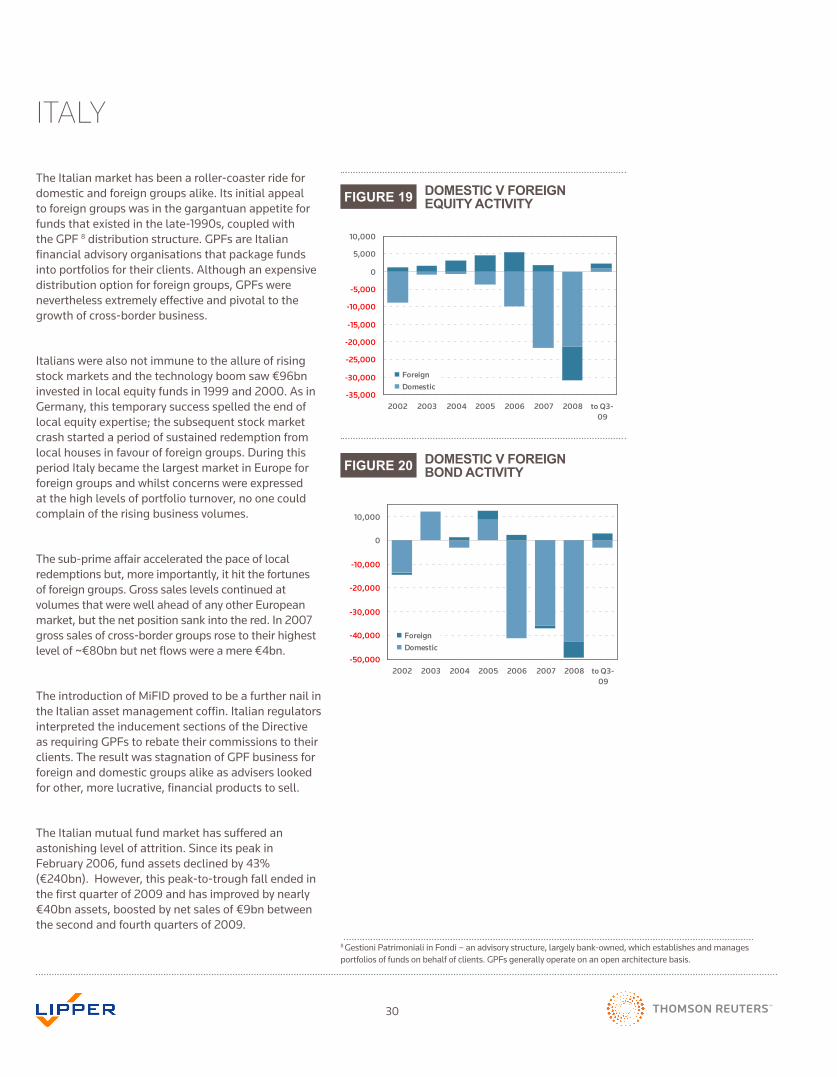
The Italian market has been a roller-coaster ride for domestic and foreign groups alike. Its initial appeal to foreign groups was in the gargantuan appetite for funds that existed in the late-1990s, coupled with theGPF8distributionstructure.GPFsareItalianfinancial advisory organisations that package funds into portfolios for their clients. Although an expensive distributionoptionforforeigngroups,GPFswerenevertheless extremely effective and pivotal to the growth of cross-border business.
Italians were also not immune to the allure of rising stock markets and the technology boom saw €96bn invested in local equity funds in 1999 and 2000. As in Germany, this temporary success spelled the end of local equity expertise; the subsequent stock market crash started a period of sustained redemption from local houses in favour of foreign groups. During this period Italy became the largest market in Europe for foreign groups and whilst concerns were expressed at the high levels of portfolio turnover, no one could complain of the rising business volumes.
The sub-prime affair accelerated the pace of local redemptions but, more importantly, it hit the fortunes of foreign groups. Gross sales levels continued at volumes that were well ahead of any other European market, but the net position sank into the red. In 2007 gross sales of cross-border groups rose to their highest level of ~€80bn but net flows were a mere €4bn.
The introduction of MiFID proved to be a further nail in the Italian asset management coffin. Italian regulators interpreted the inducement sections of the Directive asrequiringGPFstorebatetheircommissionstotheirclients.TheresultwasstagnationofGPFbusinessforforeign and domestic groups alike as advisers looked for other, more lucrative, financial products to sell.
The Italian mutual fund market has suffered an astonishing level of attrition. Since its peak in February 2006, fund assets declined by 43% (€240bn). However, this peak-to-trough fall ended in the first quarter of 2009 and has improved by nearly €40bn assets, boosted by net sales of €9bn between the second and fourth quarters of 2009.
ITALY
FIGURE 19
FIGURE 20
DOMESTIC V FOREIGN EQUITY ACTIVITY
DOMESTIC V FOREIGN BOND ACTIVITY
Fig 19: Domestic v Foreign Equity Activity
-35,000
-30,000
-25,000
-20,000
-15,000
-10,000
-5,000
0
5,000
10,000
2002 2003 2004 2005 2006 2007 2008 to Q3-09
ForeignDomestic
Fig 20: Domestic v Foreign Bond Activity
-50,000
-40,000
-30,000
-20,000
-10,000
0
10,000
2002 2003 2004 2005 2006 2007 2008 to Q3-09
ForeignDomestic
8 GestioniPatrimonialiinFondi–anadvisorystructure,largelybank-owned,whichestablishesandmanagesportfoliosoffundsonbehalfofclients.GPFsgenerallyoperateonanopenarchitecturebasis.
31
Although foreign groups clearly suffered in 2008, the contrast between domestic and foreign equity sales highlighted in figure 19 has meant that foreign groups have remained confident about Italian prospects. 2009 activity (also for domestic products) suggest that this faith was not misplaced, not least with bond sales boosting the total.
While there is optimism for cross-border groups, domestically things are more uncertain. Even the success in the second half of 2009 should not be relied on too much as an indicator of future prospects.
Onthepositiveside,bankshavestartedtodistributemutual funds again but it is clear from the success of certain sectors that the most active segments of the markets have been institutional or high-net-worth investors. Distributors still have work to do in order to convince mainstream retail investors to embrace mutual funds again.
The Italian industry was boosted by a new tax amnestyinOctober2009,whichallowedItalianstorepatriate savings hidden away abroad (and hence not declared to the Italian tax police) subject to a penalty of just 5% of the total. While the government chose the term scudo fiscale, or tax shield, to describe the latest concession, rather than the old term condono (amnesty or pardon) this is mere semantics. While it is difficult to establish with some accuracy how much this amnesty has contributed to the recovery, certainly the Italian asset managers will be grateful to see that ithasbeenextendedtoApril2010.Observersshouldbe aware, then, that the current buoyant activity may take a knock after the first quarter of this year.
Another aspect to be aware of in judging the recovery is that the governor of the Bank of Italy recently reiterated his view that the fund industry is still in the middle of a severe crisis and that structural changes need to be implemented sooner rather than later. Much has been achieved recently: new guidelines on the distribution of all financial products published by the Consob, Bank of Italy recommendations on the severance of ties between manufacturers and distributors of funds, the rise of independent financial advisers and trade association campaigns promoting the benefits of investing in mutual funds. However, one of the thorniest issues, the tax disparity between foreign and locally domiciled funds is still unresolved and to date, the political will to reform this fiscal regime is still lacking.
Most recently, as he announced that he would not be standing for re-election as Chairman of Assogestioni, Marcello Messori suggested that Italian banks treat fund assets as a reservoir that swells when banks have a lot of liquidity and shrinks when they need to raise funds. He admitted that, despite his efforts over the last three years, he had failed to convince his members that this was the central problem with Italy’s asset management industry and that the lack of separation between fund production and distribution was holding the industry back.
DOMESTIC V FOREIGN EQUITY ACTIVITY
DOMESTIC V FOREIGN BOND ACTIVITY
“Foreign groups have remained confident about Italian prospects.”
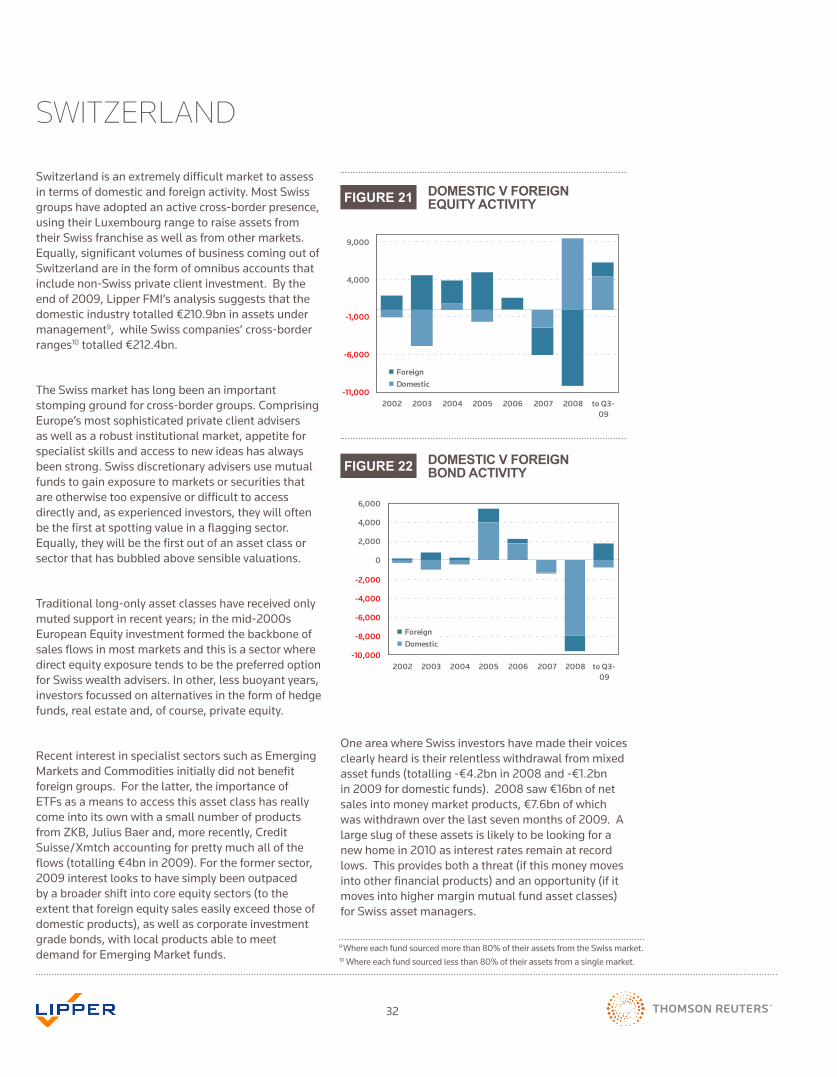
32
Switzerland is an extremely difficult market to assess in terms of domestic and foreign activity. Most Swiss groups have adopted an active cross-border presence, using their Luxembourg range to raise assets from their Swiss franchise as well as from other markets. Equally, significant volumes of business coming out of Switzerland are in the form of omnibus accounts that include non-Swiss private client investment. By the end of 2009, Lipper FMI’s analysis suggests that the domestic industry totalled €210.9bn in assets under management9, while Swiss companies’ cross-border ranges10 totalled €212.4bn.
The Swiss market has long been an important stomping ground for cross-border groups. Comprising Europe’s most sophisticated private client advisers as well as a robust institutional market, appetite for specialist skills and access to new ideas has always been strong. Swiss discretionary advisers use mutual funds to gain exposure to markets or securities that are otherwise too expensive or difficult to access directly and, as experienced investors, they will often be the first at spotting value in a flagging sector. Equally, they will be the first out of an asset class or sector that has bubbled above sensible valuations.
Traditional long-only asset classes have received only muted support in recent years; in the mid-2000s European Equity investment formed the backbone of sales flows in most markets and this is a sector where direct equity exposure tends to be the preferred option for Swiss wealth advisers. In other, less buoyant years, investors focussed on alternatives in the form of hedge funds, real estate and, of course, private equity.
Recent interest in specialist sectors such as Emerging Markets and Commodities initially did not benefit foreign groups. For the latter, the importance of ETFs as a means to access this asset class has really come into its own with a small number of products fromZKB,JuliusBaerand,morerecently,CreditSuisse/Xmtch accounting for pretty much all of the flows (totalling €4bn in 2009). For the former sector, 2009 interest looks to have simply been outpaced by a broader shift into core equity sectors (to the extent that foreign equity sales easily exceed those of domestic products), as well as corporate investment grade bonds, with local products able to meet demand for Emerging Market funds.
SWITZERLAND
FIGURE 21
FIGURE 22
DOMESTIC V FOREIGN EQUITY ACTIVITY
DOMESTIC V FOREIGN BOND ACTIVITY
Fig 21: Domestic v Foreign Equity Activity
-11,000
-6,000
-1,000
4,000
9,000
2002 2003 2004 2005 2006 2007 2008 to Q3-09
ForeignDomestic
Fig 22: Domestic v Foreign Bond Activity
-10,000
-8,000
-6,000
-4,000
-2,000
0
2,000
4,000
6,000
2002 2003 2004 2005 2006 2007 2008 to Q3-09
ForeignDomestic
OneareawhereSwissinvestorshavemadetheirvoicesclearly heard is their relentless withdrawal from mixed asset funds (totalling -€4.2bn in 2008 and -€1.2bn in 2009 for domestic funds). 2008 saw €16bn of net sales into money market products, €7.6bn of which was withdrawn over the last seven months of 2009. A large slug of these assets is likely to be looking for a new home in 2010 as interest rates remain at record lows. This provides both a threat (if this money moves into other financial products) and an opportunity (if it moves into higher margin mutual fund asset classes) for Swiss asset managers.
9 Where each fund sourced more than 80% of their assets from the Swiss market.10 Where each fund sourced less than 80% of their assets from a single market.
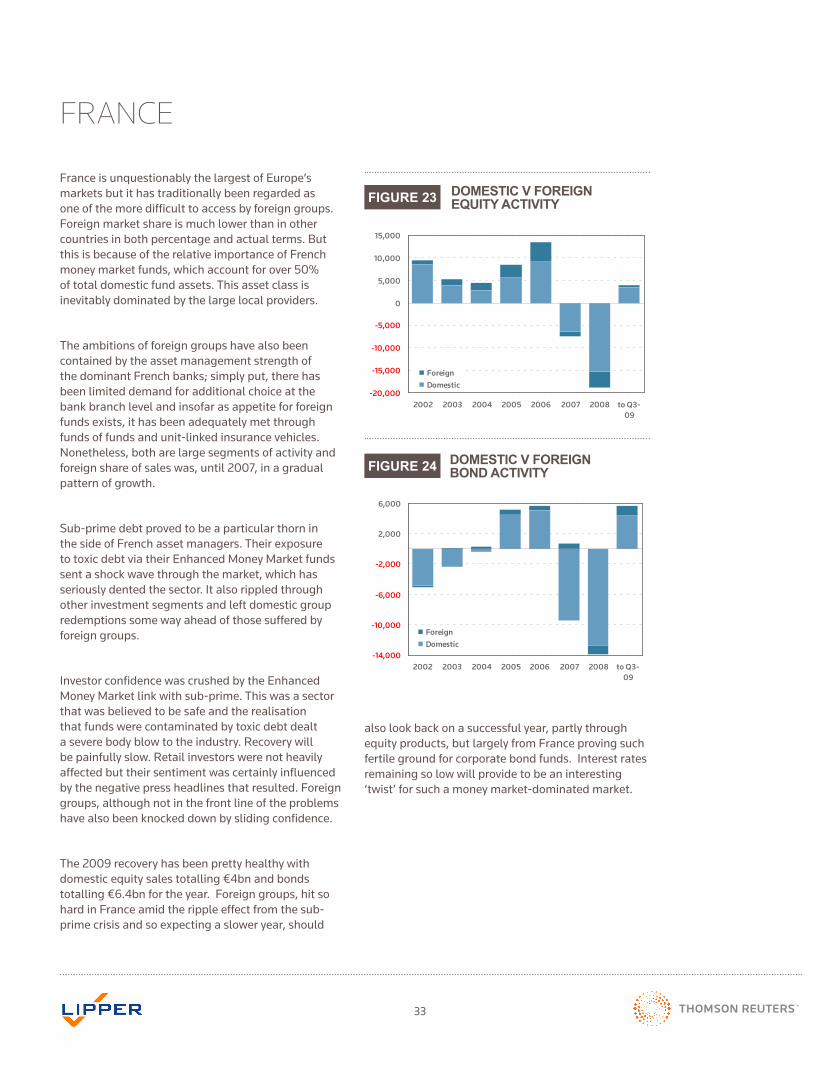
33
France is unquestionably the largest of Europe’s markets but it has traditionally been regarded as one of the more difficult to access by foreign groups. Foreign market share is much lower than in other countries in both percentage and actual terms. But this is because of the relative importance of French money market funds, which account for over 50% of total domestic fund assets. This asset class is inevitably dominated by the large local providers.
The ambitions of foreign groups have also been contained by the asset management strength of the dominant French banks; simply put, there has been limited demand for additional choice at the bank branch level and insofar as appetite for foreign funds exists, it has been adequately met through funds of funds and unit-linked insurance vehicles. Nonetheless, both are large segments of activity and foreign share of sales was, until 2007, in a gradual pattern of growth.
Sub-prime debt proved to be a particular thorn in the side of French asset managers. Their exposure to toxic debt via their Enhanced Money Market funds sent a shock wave through the market, which has seriously dented the sector. It also rippled through other investment segments and left domestic group redemptions some way ahead of those suffered by foreign groups.
Investor confidence was crushed by the Enhanced Money Market link with sub-prime. This was a sector that was believed to be safe and the realisation that funds were contaminated by toxic debt dealt a severe body blow to the industry. Recovery will be painfully slow. Retail investors were not heavily affected but their sentiment was certainly influenced by the negative press headlines that resulted. Foreign groups, although not in the front line of the problems have also been knocked down by sliding confidence.
The 2009 recovery has been pretty healthy with domestic equity sales totalling €4bn and bonds totalling €6.4bn for the year. Foreign groups, hit so hard in France amid the ripple effect from the sub-prime crisis and so expecting a slower year, should
FRANCE
FIGURE 23
FIGURE 24
DOMESTIC V FOREIGN EQUITY ACTIVITY
DOMESTIC V FOREIGN BOND ACTIVITY
Fig 23: Domestic v Foreign Equity Activity
-20,000
-15,000
-10,000
-5,000
0
5,000
10,000
15,000
2002 2003 2004 2005 2006 2007 2008 to Q3-09
ForeignDomestic
Fig 24: Domestic v Foreign Bond Activity
-14,000
-10,000
-6,000
-2,000
2,000
6,000
2002 2003 2004 2005 2006 2007 2008 to Q3-09
ForeignDomestic
also look back on a successful year, partly through equity products, but largely from France proving such fertile ground for corporate bond funds. Interest rates remaining so low will provide to be an interesting ‘twist’ for such a money market-dominated market.
DOMESTIC V FOREIGN EQUITY ACTIVITY
DOMESTIC V FOREIGN BOND ACTIVITY
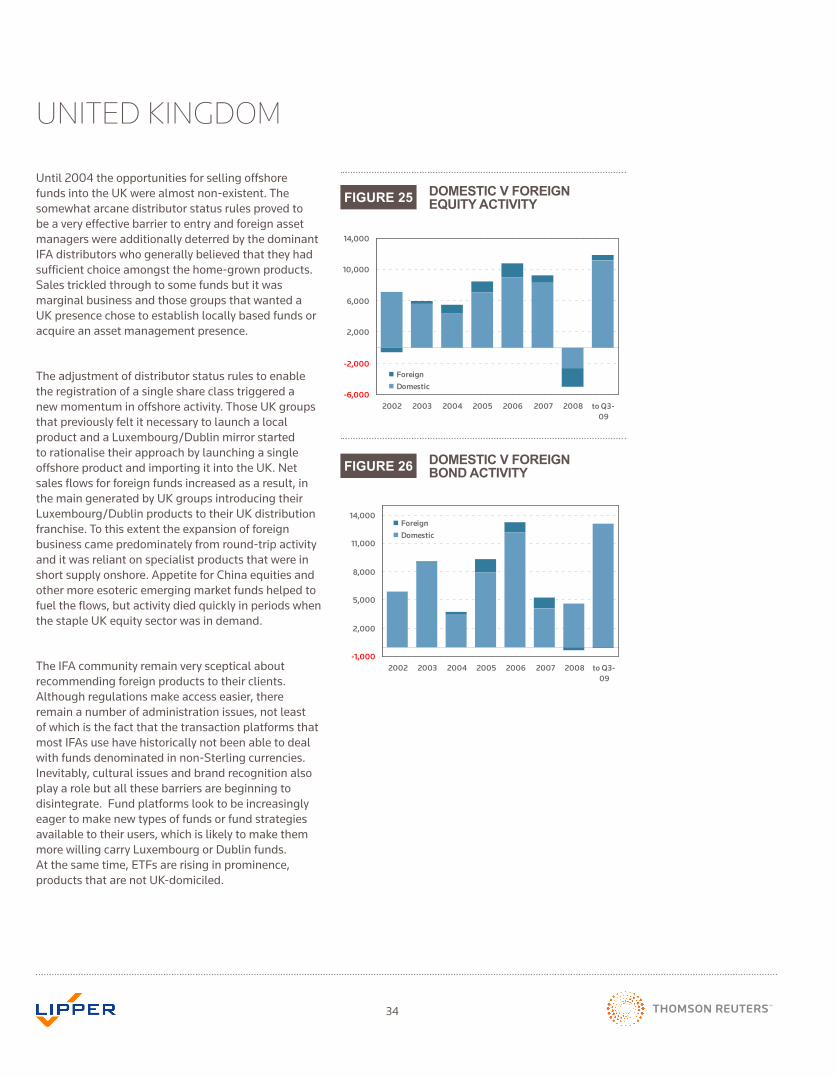
34
Until 2004 the opportunities for selling offshore fundsintotheUKwerealmostnon-existent.Thesomewhat arcane distributor status rules proved to be a very effective barrier to entry and foreign asset managers were additionally deterred by the dominant IFA distributors who generally believed that they had sufficient choice amongst the home-grown products. Sales trickled through to some funds but it was marginal business and those groups that wanted a UKpresencechosetoestablishlocallybasedfundsoracquire an asset management presence.
The adjustment of distributor status rules to enable the registration of a single share class triggered a newmomentuminoffshoreactivity.ThoseUKgroupsthat previously felt it necessary to launch a local product and a Luxembourg/Dublin mirror started to rationalise their approach by launching a single offshoreproductandimportingitintotheUK.Netsales flows for foreign funds increased as a result, in themaingeneratedbyUKgroupsintroducingtheirLuxembourg/DublinproductstotheirUKdistributionfranchise. To this extent the expansion of foreign business came predominately from round-trip activity and it was reliant on specialist products that were in short supply onshore. Appetite for China equities and other more esoteric emerging market funds helped to fuel the flows, but activity died quickly in periods when thestapleUKequitysectorwasindemand.
The IFA community remain very sceptical about recommending foreign products to their clients. Although regulations make access easier, there remain a number of administration issues, not least of which is the fact that the transaction platforms that most IFAs use have historically not been able to deal with funds denominated in non-Sterling currencies. Inevitably, cultural issues and brand recognition also play a role but all these barriers are beginning to disintegrate. Fund platforms look to be increasingly eager to make new types of funds or fund strategies available to their users, which is likely to make them more willing carry Luxembourg or Dublin funds. At the same time, ETFs are rising in prominence, productsthatarenotUK-domiciled.
UNITED KINGDOM
FIGURE 25
FIGURE 26
DOMESTIC V FOREIGN EQUITY ACTIVITY
DOMESTIC V FOREIGN BOND ACTIVITY
Fig 25: Domestic v Foreign Equity Activity
-6,000
-2,000
2,000
6,000
10,000
14,000
2002 2003 2004 2005 2006 2007 2008 to Q3-09
ForeignDomestic
Fig 26: Domestic v Foreign Bond Activity
-1,000
2,000
5,000
8,000
11,000
14,000
2002 2003 2004 2005 2006 2007 2008 to Q3-09
ForeignDomestic
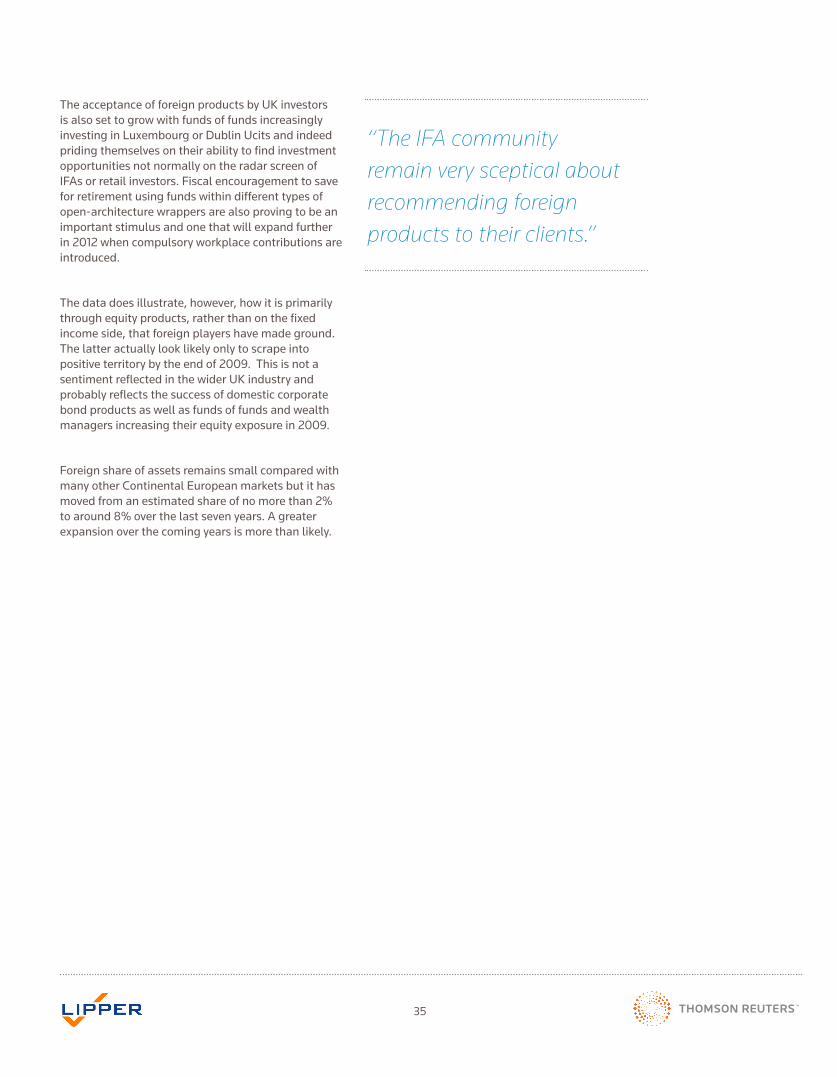
35
TheacceptanceofforeignproductsbyUKinvestorsis also set to grow with funds of funds increasingly investing in Luxembourg or Dublin Ucits and indeed priding themselves on their ability to find investment opportunities not normally on the radar screen of IFAs or retail investors. Fiscal encouragement to save for retirement using funds within different types of open-architecture wrappers are also proving to be an important stimulus and one that will expand further in 2012 when compulsory workplace contributions are introduced.
The data does illustrate, however, how it is primarily through equity products, rather than on the fixed income side, that foreign players have made ground. The latter actually look likely only to scrape into positive territory by the end of 2009. This is not a sentimentreflectedinthewiderUKindustryandprobably reflects the success of domestic corporate bond products as well as funds of funds and wealth managers increasing their equity exposure in 2009.
Foreign share of assets remains small compared with many other Continental European markets but it has moved from an estimated share of no more than 2% to around 8% over the last seven years. A greater expansion over the coming years is more than likely.
DOMESTIC V FOREIGN EQUITY ACTIVITY
DOMESTIC V FOREIGN BOND ACTIVITY
“The IFA community remain very sceptical about recommending foreign products to their clients.”
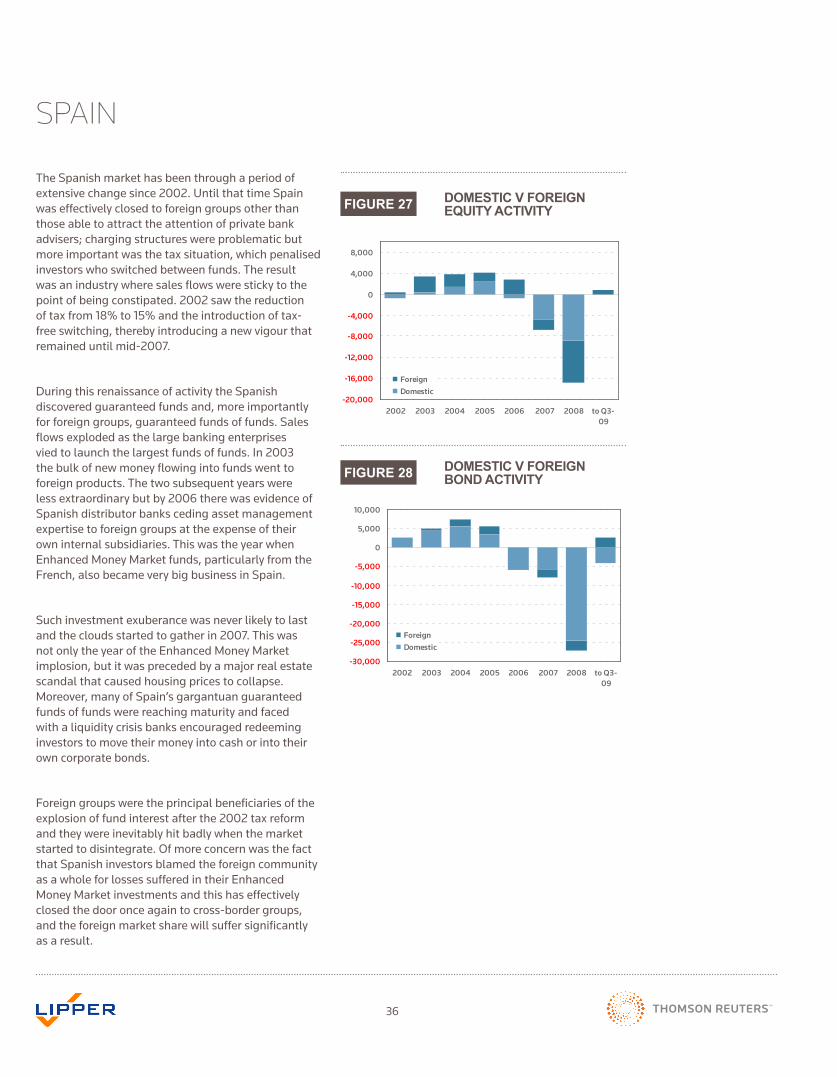
36
The Spanish market has been through a period of extensive change since 2002. Until that time Spain was effectively closed to foreign groups other than those able to attract the attention of private bank advisers; charging structures were problematic but more important was the tax situation, which penalised investors who switched between funds. The result was an industry where sales flows were sticky to the point of being constipated. 2002 saw the reduction of tax from 18% to 15% and the introduction of tax-free switching, thereby introducing a new vigour that remained until mid-2007.
During this renaissance of activity the Spanish discovered guaranteed funds and, more importantly for foreign groups, guaranteed funds of funds. Sales flows exploded as the large banking enterprises vied to launch the largest funds of funds. In 2003 the bulk of new money flowing into funds went to foreign products. The two subsequent years were less extraordinary but by 2006 there was evidence of Spanish distributor banks ceding asset management expertise to foreign groups at the expense of their own internal subsidiaries. This was the year when Enhanced Money Market funds, particularly from the French, also became very big business in Spain.
Such investment exuberance was never likely to last and the clouds started to gather in 2007. This was not only the year of the Enhanced Money Market implosion, but it was preceded by a major real estate scandal that caused housing prices to collapse. Moreover, many of Spain’s gargantuan guaranteed funds of funds were reaching maturity and faced with a liquidity crisis banks encouraged redeeming investors to move their money into cash or into their own corporate bonds.
Foreign groups were the principal beneficiaries of the explosion of fund interest after the 2002 tax reform and they were inevitably hit badly when the market startedtodisintegrate.Ofmoreconcernwasthefactthat Spanish investors blamed the foreign community as a whole for losses suffered in their Enhanced Money Market investments and this has effectively closed the door once again to cross-border groups, and the foreign market share will suffer significantly as a result.
SPAIN
FIGURE 27
FIGURE 28
DOMESTIC V FOREIGN EQUITY ACTIVITY
DOMESTIC V FOREIGN BOND ACTIVITY
Fig 27: Domestic v Foreign Equity Activity
-20,000
-16,000
-12,000
-8,000
-4,000
0
4,000
8,000
2002 2003 2004 2005 2006 2007 2008 to Q3-09
ForeignDomestic
Fig 28: Domestic v Foreign Bond Activity
-30,000
-25,000
-20,000
-15,000
-10,000
-5,000
0
5,000
10,000
2002 2003 2004 2005 2006 2007 2008 to Q3-09
ForeignDomestic

37
That foreign groups have prospered surely runs against expectations of a year ago, but this positive trend could well continue even as domestic products continue in the doldrums. Domestically, bank distribution networks still hold the key and until they return to selling mainstream funds, there is little scope for industry recovery in the near term.
Ontheotherhand,Santander’smergingofitsprivatebankandassetmanagementdivision offers further encouragement to foreign groups. This move is the prelude to an expected shift by the group towards greater specialisation. It will concentrate on products focused on the markets where there is in-house expertise, which apart fromtheIberianPeninsula,covermainlytheUKandLatinAmerica.Thismeansdelegating, more than hitherto, coverage of other geographical areas to third-party products.
More generally, Spain’s ailing economy has duly heightened the local population’s precautionary instincts. The Bank of Spain has recorded a steep rise in the savings rate of Spanish households, from 11% of disposable income in 2008, to 20% in 2009, though much (€38bn) of the cash went into deposits (as against estimated redemptions of over €10bn in mutual funds).
DOMESTIC V FOREIGN EQUITY ACTIVITY
DOMESTIC V FOREIGN BOND ACTIVITY
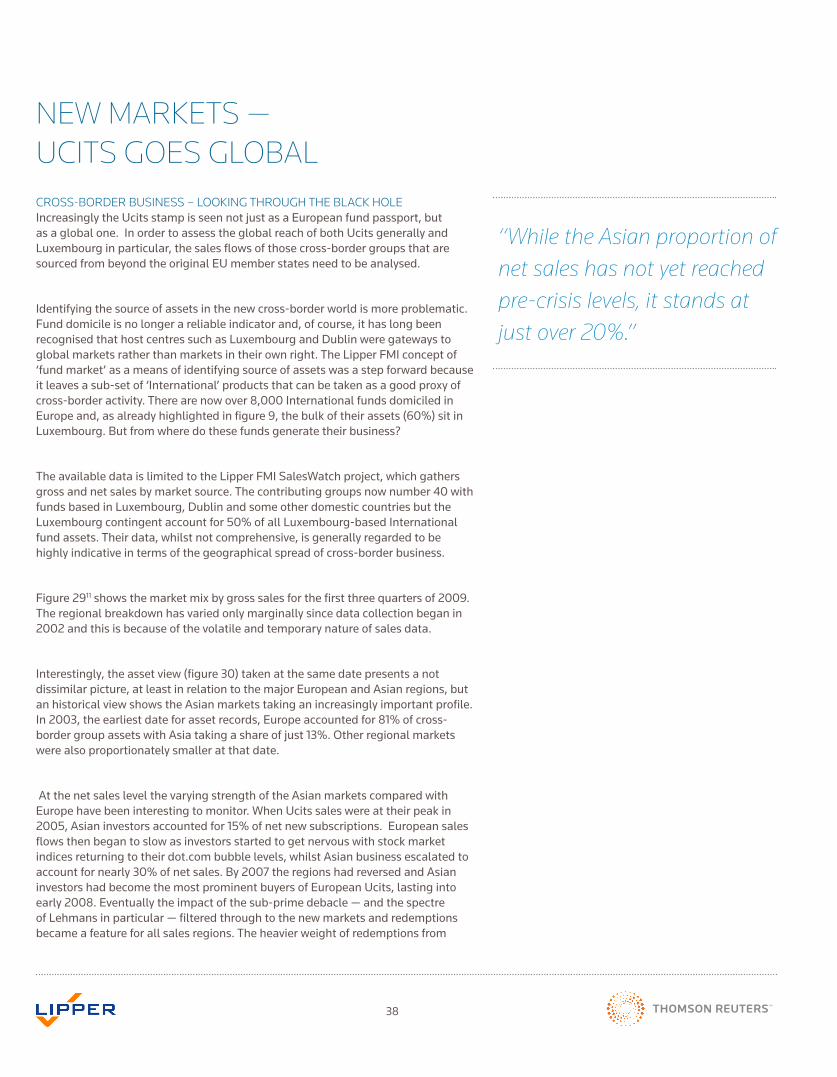
38
CROSS-BORDER BUSINESS – LOOKING THROUGH THE BLACK HOLEIncreasingly the Ucits stamp is seen not just as a European fund passport, but as a global one. In order to assess the global reach of both Ucits generally and Luxembourg in particular, the sales flows of those cross-border groups that are sourced from beyond the original EU member states need to be analysed.
Identifying the source of assets in the new cross-border world is more problematic. Fund domicile is no longer a reliable indicator and, of course, it has long been recognised that host centres such as Luxembourg and Dublin were gateways to global markets rather than markets in their own right. The Lipper FMI concept of ‘fund market’ as a means of identifying source of assets was a step forward because it leaves a sub-set of ‘International’ products that can be taken as a good proxy of cross-border activity. There are now over 8,000 International funds domiciled in Europe and, as already highlighted in figure 9, the bulk of their assets (60%) sit in Luxembourg. But from where do these funds generate their business?
The available data is limited to the Lipper FMI SalesWatch project, which gathers gross and net sales by market source. The contributing groups now number 40 with funds based in Luxembourg, Dublin and some other domestic countries but the Luxembourg contingent account for 50% of all Luxembourg-based International fund assets. Their data, whilst not comprehensive, is generally regarded to be highly indicative in terms of the geographical spread of cross-border business.
Figure 2911 shows the market mix by gross sales for the first three quarters of 2009. The regional breakdown has varied only marginally since data collection began in 2002 and this is because of the volatile and temporary nature of sales data.
Interestingly, the asset view (figure 30) taken at the same date presents a not dissimilar picture, at least in relation to the major European and Asian regions, but an historical view shows the Asian markets taking an increasingly important profile. In 2003, the earliest date for asset records, Europe accounted for 81% of cross-bordergroupassetswithAsiatakingashareofjust13%.Otherregionalmarketswere also proportionately smaller at that date.
At the net sales level the varying strength of the Asian markets compared with Europe have been interesting to monitor. When Ucits sales were at their peak in 2005, Asian investors accounted for 15% of net new subscriptions. European sales flows then began to slow as investors started to get nervous with stock market indices returning to their dot.com bubble levels, whilst Asian business escalated to account for nearly 30% of net sales. By 2007 the regions had reversed and Asian investors had become the most prominent buyers of European Ucits, lasting into early 2008. Eventually the impact of the sub-prime debacle — and the spectre of Lehmans in particular — filtered through to the new markets and redemptions became a feature for all sales regions. The heavier weight of redemptions from
NEW MARKETS — UCITS GOES GLOBAL
“While the Asian proportion of net sales has not yet reached pre-crisis levels, it stands at just over 20%.”
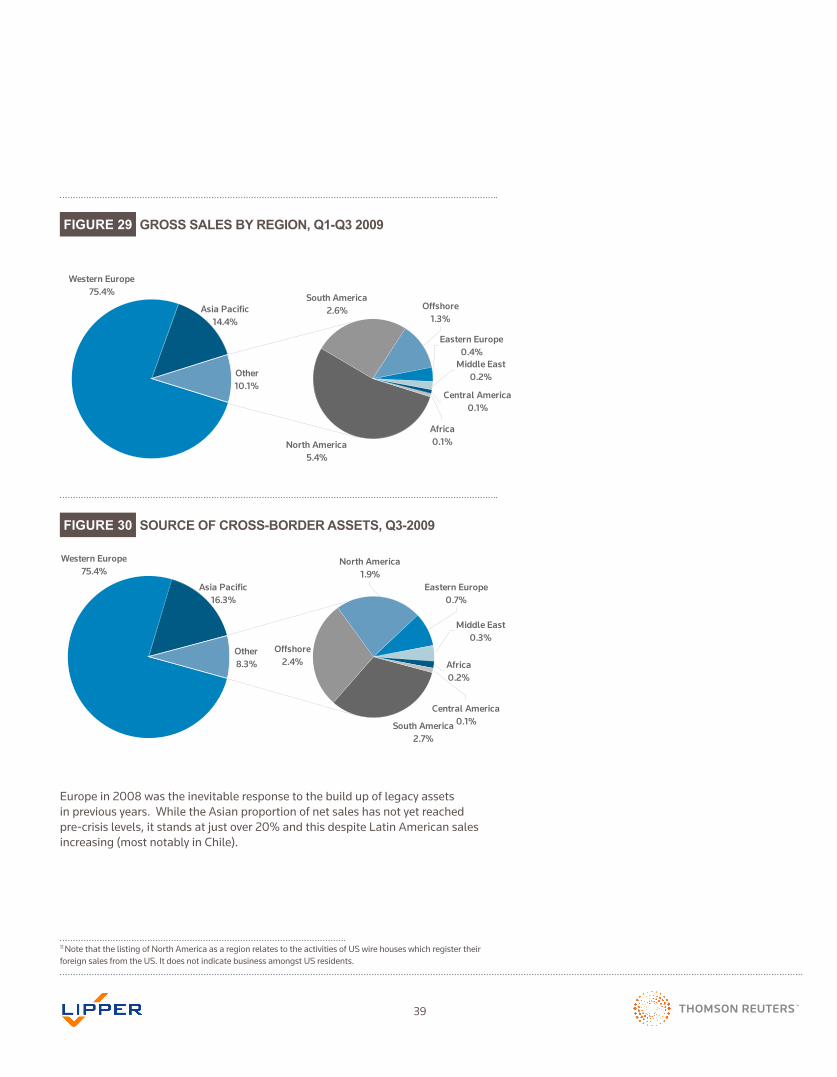
39
Figure 29: Gross sales by region, Q1-Q3 2009
North America5.4%
South America2.6%
Other10.1%
Africa0.1%
Offshore1.3%
Eastern Europe0.4%
Western Europe75.4%
Asia Pacific14.4%
Central America0.1%
Middle East0.2%
Figure 29: Gross sales by region, Q1-Q3 2009
South America2.7%
Offshore2.4%
Other8.3%
Central America0.1%
North America1.9%
Eastern Europe0.7%
Western Europe75.4%
Asia Pacific16.3%
Africa0.2%
Middle East0.3%
FIGURE 29
FIGURE 30
GROSS SALES BY REGION, Q1-Q3 2009
SOURCE OF CROSS-BORDER ASSETS, Q3-2009
Europe in 2008 was the inevitable response to the build up of legacy assets in previous years. While the Asian proportion of net sales has not yet reached pre-crisis levels, it stands at just over 20% and this despite Latin American sales increasing (most notably in Chile).
11 Note that the listing of North America as a region relates to the activities of US wire houses which register their foreign sales from the US. It does not indicate business amongst US residents.
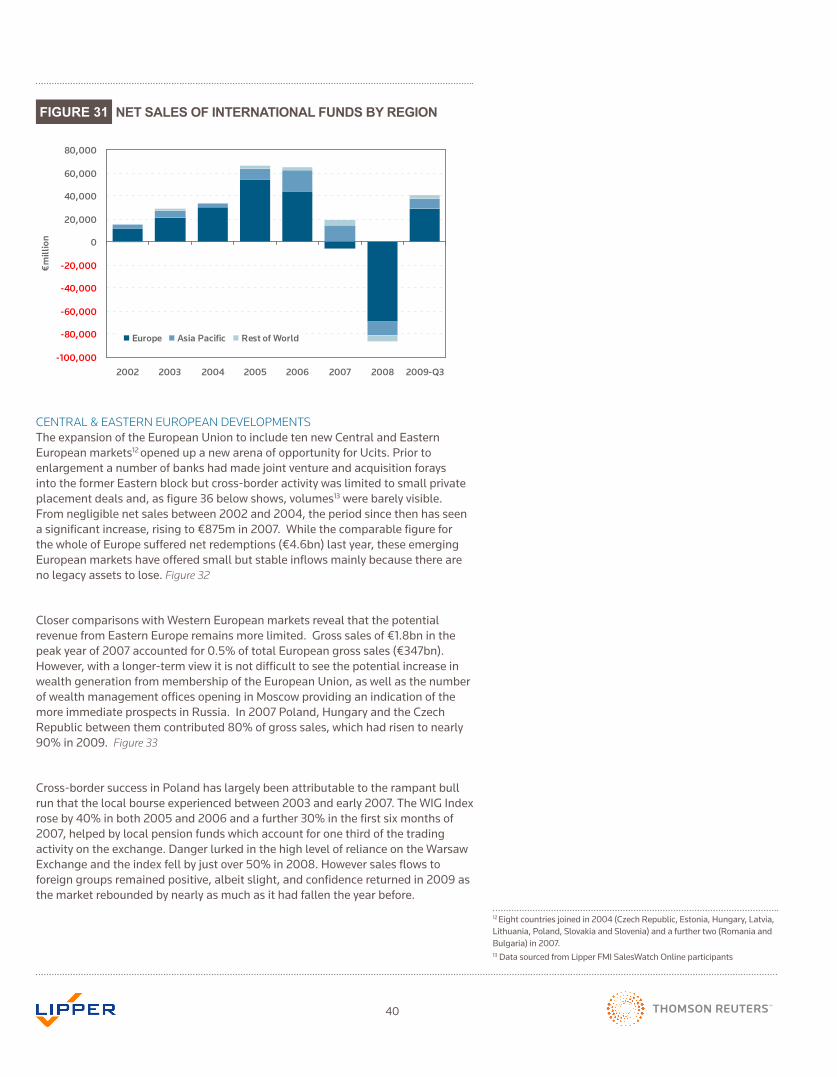
40
CENTRAL & EASTERN EUROPEAN DEVELOPMENTSThe expansion of the European Union to include ten new Central and Eastern European markets12 openedupanewarenaofopportunityforUcits.Priortoenlargement a number of banks had made joint venture and acquisition forays into the former Eastern block but cross-border activity was limited to small private placement deals and, as figure 36 below shows, volumes13 were barely visible. From negligible net sales between 2002 and 2004, the period since then has seen a significant increase, rising to €875m in 2007. While the comparable figure for the whole of Europe suffered net redemptions (€4.6bn) last year, these emerging European markets have offered small but stable inflows mainly because there are no legacy assets to lose. Figure 32
Closer comparisons with Western European markets reveal that the potential revenue from Eastern Europe remains more limited. Gross sales of €1.8bn in the peak year of 2007 accounted for 0.5% of total European gross sales (€347bn). However, with a longer-term view it is not difficult to see the potential increase in wealth generation from membership of the European Union, as well as the number of wealth management offices opening in Moscow providing an indication of the moreimmediateprospectsinRussia.In2007Poland,HungaryandtheCzechRepublic between them contributed 80% of gross sales, which had risen to nearly 90% in 2009. Figure 33
Cross-bordersuccessinPolandhaslargelybeenattributabletotherampantbullrun that the local bourse experienced between 2003 and early 2007. The WIG Index rose by 40% in both 2005 and 2006 and a further 30% in the first six months of 2007, helped by local pension funds which account for one third of the trading activity on the exchange. Danger lurked in the high level of reliance on the Warsaw Exchange and the index fell by just over 50% in 2008. However sales flows to foreign groups remained positive, albeit slight, and confidence returned in 2009 as the market rebounded by nearly as much as it had fallen the year before.
-100,000
-80,000
-60,000
-40,000
-20,000
0
20,000
40,000
60,000
80,000
2002 2003 2004 2005 2006 2007 2008 2009-Q3
€m
illio
n
Europe Asia Pacific Rest of World
FIGURE 31 NET SALES OF INTERNATIONAL FUNDS BY REGION
12 Eight countries joined in 2004 (Czech Republic, Estonia, Hungary, Latvia, Lithuania,Poland,SlovakiaandSlovenia)andafurthertwo(RomaniaandBulgaria) in 2007.13DatasourcedfromLipperFMISalesWatchOnlineparticipants
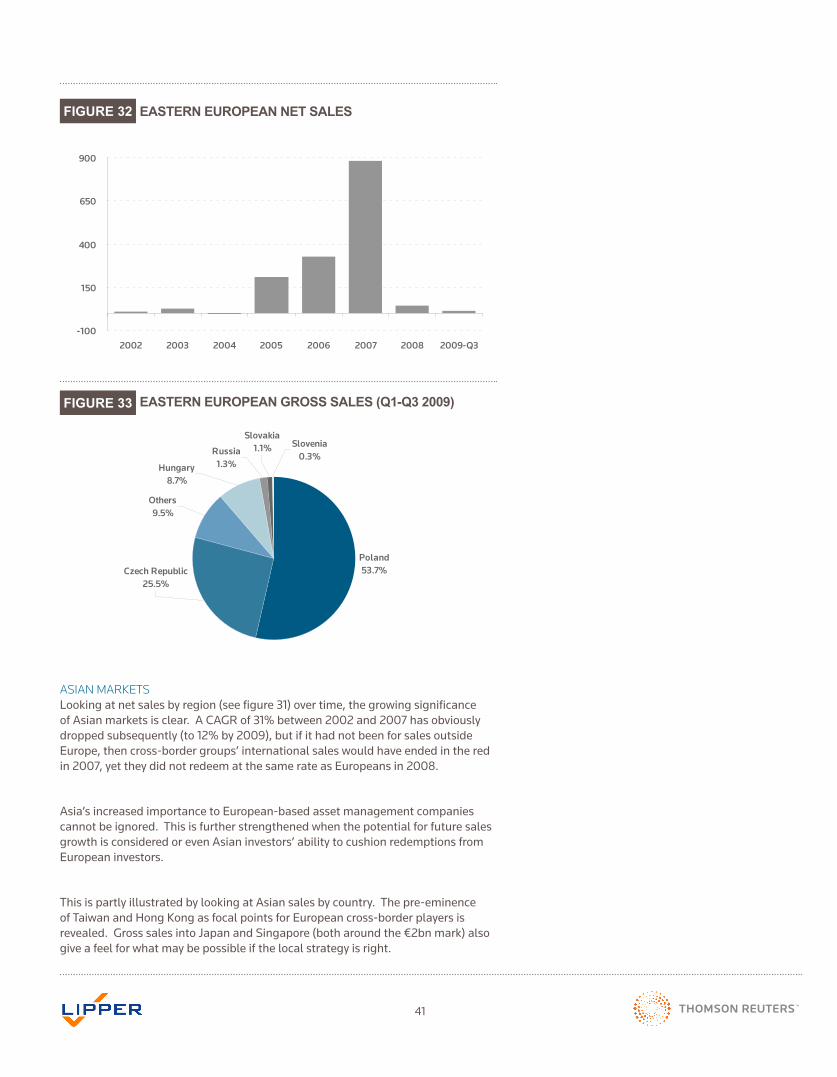
41
Figure 32: Eastern European Net Sales
-100
150
400
650
900
2002 2003 2004 2005 2006 2007 2008 2009-Q3
Figure 33: Eastern European Gross Sales (Q1-Q3 2009)
Others9.5%
Poland53.7%
Hungary8.7%
Slovenia0.3%
Slovakia1.1%Russia
1.3%
Czech Republic25.5%
FIGURE 32
FIGURE 33
EASTERN EUROPEAN NET SALES
EASTERN EUROPEAN GROSS SALES (Q1-Q3 2009)
ASIAN MARKETSLooking at net sales by region (see figure 31) over time, the growing significance of Asian markets is clear. A CAGR of 31% between 2002 and 2007 has obviously dropped subsequently (to 12% by 2009), but if it had not been for sales outside Europe, then cross-border groups’ international sales would have ended in the red in 2007, yet they did not redeem at the same rate as Europeans in 2008.
Asia’s increased importance to European-based asset management companies cannot be ignored. This is further strengthened when the potential for future sales growth is considered or even Asian investors’ ability to cushion redemptions from European investors.
This is partly illustrated by looking at Asian sales by country. The pre-eminence ofTaiwanandHongKongasfocalpointsforEuropeancross-borderplayersisrevealed. Gross sales into Japan and Singapore (both around the €2bn mark) also give a feel for what may be possible if the local strategy is right.
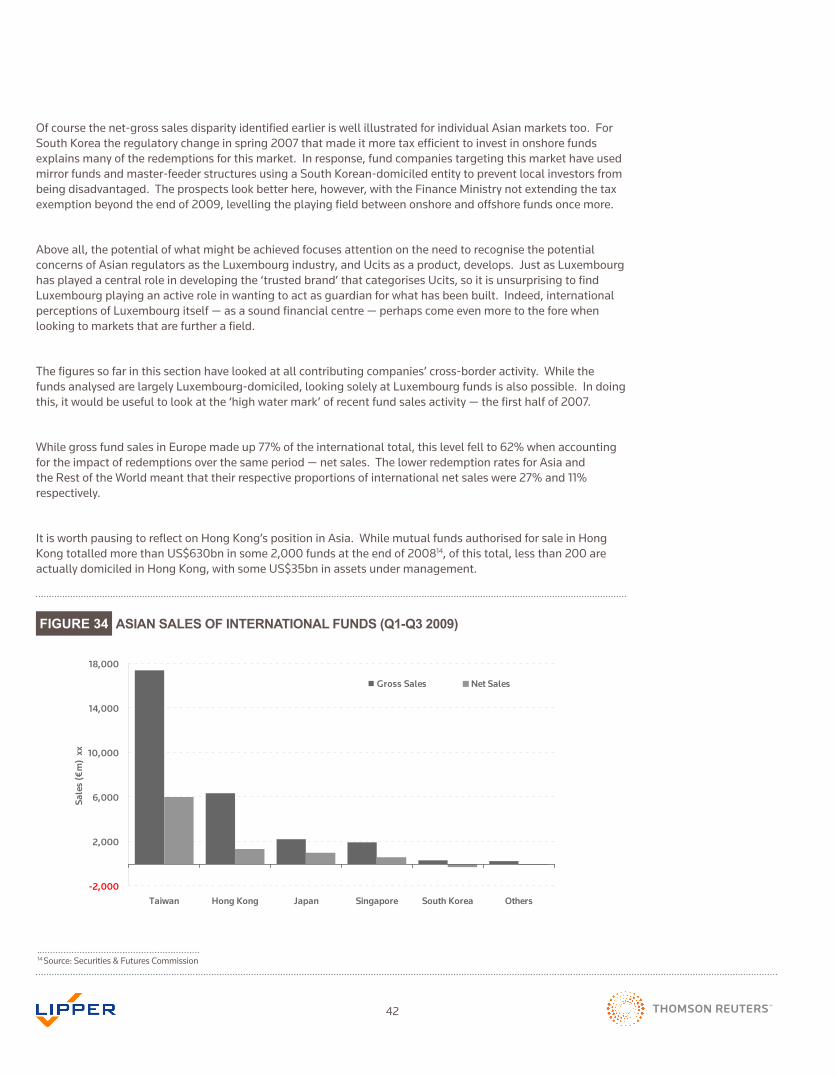
42
FIGURE 34 ASIAN SALES OF INTERNATIONAL FUNDS (Q1-Q3 2009)
-2,000
2,000
6,000
10,000
14,000
18,000
Taiwan Hong Kong Japan Singapore South Korea Others
Sale
s (€
m)
xx
Gross Sales Net Sales
Ofcoursethenet-grosssalesdisparityidentifiedearlieriswellillustratedforindividualAsianmarketstoo.ForSouthKoreatheregulatorychangeinspring2007thatmadeitmoretaxefficienttoinvestinonshorefundsexplains many of the redemptions for this market. In response, fund companies targeting this market have used mirrorfundsandmaster-feederstructuresusingaSouthKorean-domiciledentitytopreventlocalinvestorsfrombeing disadvantaged. The prospects look better here, however, with the Finance Ministry not extending the tax exemption beyond the end of 2009, levelling the playing field between onshore and offshore funds once more.
Above all, the potential of what might be achieved focuses attention on the need to recognise the potential concerns of Asian regulators as the Luxembourg industry, and Ucits as a product, develops. Just as Luxembourg has played a central role in developing the ‘trusted brand’ that categorises Ucits, so it is unsurprising to find Luxembourg playing an active role in wanting to act as guardian for what has been built. Indeed, international perceptions of Luxembourg itself — as a sound financial centre — perhaps come even more to the fore when looking to markets that are further a field.
The figures so far in this section have looked at all contributing companies’ cross-border activity. While the funds analysed are largely Luxembourg-domiciled, looking solely at Luxembourg funds is also possible. In doing this, it would be useful to look at the ‘high water mark’ of recent fund sales activity — the first half of 2007.
While gross fund sales in Europe made up 77% of the international total, this level fell to 62% when accounting for the impact of redemptions over the same period — net sales. The lower redemption rates for Asia and the Rest of the World meant that their respective proportions of international net sales were 27% and 11% respectively.
ItisworthpausingtoreflectonHongKong’spositioninAsia.WhilemutualfundsauthorisedforsaleinHongKongtotalledmorethanUS$630bninsome2,000fundsattheendof200814, of this total, less than 200 are actuallydomiciledinHongKong,withsomeUS$35bninassetsundermanagement.
14 Source: Securities & Futures Commission
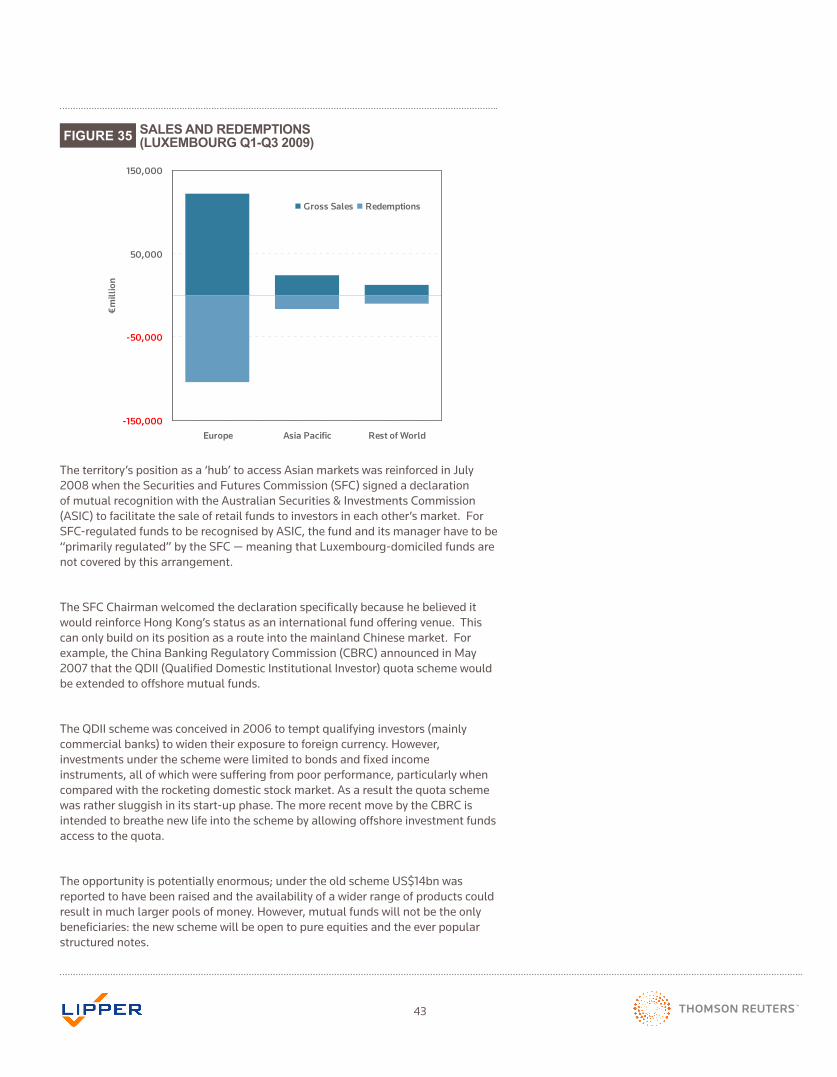
43
-150,000
-50,000
50,000
150,000
Europe Asia Pacific Rest of World
€m
illio
n
Gross Sales Redemptions
FIGURE 35 SALES AND REDEMPTIONS (LUXEMBOURG Q1-Q3 2009)
The territory’s position as a ‘hub’ to access Asian markets was reinforced in July 2008 when the Securities and Futures Commission (SFC) signed a declaration of mutual recognition with the Australian Securities & Investments Commission (ASIC) to facilitate the sale of retail funds to investors in each other’s market. For SFC-regulated funds to be recognised by ASIC, the fund and its manager have to be “primarilyregulated”bytheSFC—meaningthatLuxembourg-domiciledfundsarenot covered by this arrangement.
The SFC Chairman welcomed the declaration specifically because he believed it wouldreinforceHongKong’sstatusasaninternationalfundofferingvenue.Thiscan only build on its position as a route into the mainland Chinese market. For example, the China Banking Regulatory Commission (CBRC) announced in May 2007thattheQDII(QualifiedDomesticInstitutionalInvestor)quotaschemewouldbe extended to offshore mutual funds.
TheQDIIschemewasconceivedin2006totemptqualifyinginvestors(mainlycommercial banks) to widen their exposure to foreign currency. However, investments under the scheme were limited to bonds and fixed income instruments, all of which were suffering from poor performance, particularly when compared with the rocketing domestic stock market. As a result the quota scheme was rather sluggish in its start-up phase. The more recent move by the CBRC is intended to breathe new life into the scheme by allowing offshore investment funds access to the quota.
The opportunity is potentially enormous; under the old scheme US$14bn was reported to have been raised and the availability of a wider range of products could result in much larger pools of money. However, mutual funds will not be the only beneficiaries: the new scheme will be open to pure equities and the ever popular structured notes.
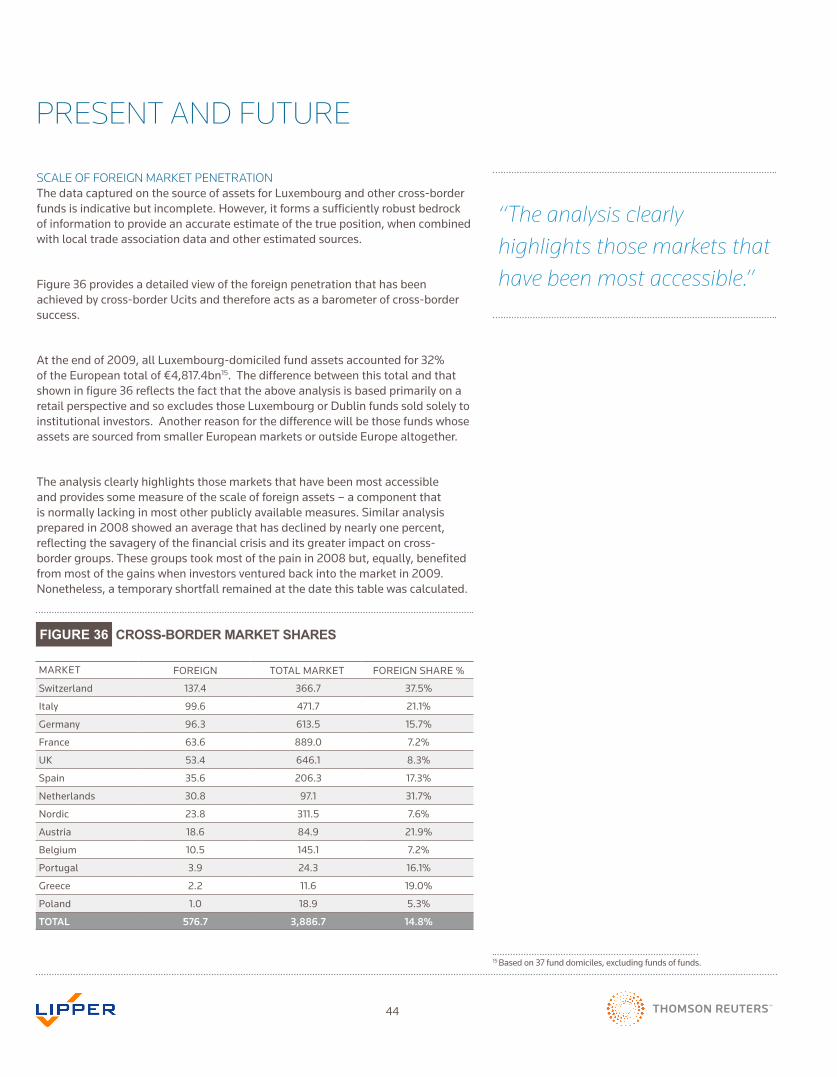
44
PRESENT AND FUTURE
SCALE OF FOREIGN MARKET PENETRATIONThe data captured on the source of assets for Luxembourg and other cross-border funds is indicative but incomplete. However, it forms a sufficiently robust bedrock of information to provide an accurate estimate of the true position, when combined with local trade association data and other estimated sources.
Figure 36 provides a detailed view of the foreign penetration that has been achieved by cross-border Ucits and therefore acts as a barometer of cross-border success.
At the end of 2009, all Luxembourg-domiciled fund assets accounted for 32% of the European total of €4,817.4bn15. The difference between this total and that shown in figure 36 reflects the fact that the above analysis is based primarily on a retail perspective and so excludes those Luxembourg or Dublin funds sold solely to institutional investors. Another reason for the difference will be those funds whose assets are sourced from smaller European markets or outside Europe altogether.
The analysis clearly highlights those markets that have been most accessible andprovidessomemeasureofthescaleofforeignassets–acomponentthatis normally lacking in most other publicly available measures. Similar analysis prepared in 2008 showed an average that has declined by nearly one percent, reflecting the savagery of the financial crisis and its greater impact on cross-border groups. These groups took most of the pain in 2008 but, equally, benefited from most of the gains when investors ventured back into the market in 2009. Nonetheless, a temporary shortfall remained at the date this table was calculated.
MARKET FOREIGN TOTALMARKET FOREIGNSHARE%
Switzerland 137.4 366.7 37.5%
Italy 99.6 471.7 21.1%
Germany 96.3 613.5 15.7%
France 63.6 889.0 7.2%
UK 53.4 646.1 8.3%
Spain 35.6 206.3 17.3%
Netherlands 30.8 97.1 31.7%
Nordic 23.8 311.5 7.6%
Austria 18.6 84.9 21.9%
Belgium 10.5 145.1 7.2%
Portugal 3.9 24.3 16.1%
Greece 2.2 11.6 19.0%
Poland 1.0 18.9 5.3%
TOTAL 576.7 3,886.7 14.8%
FIGURE 36 CROSS-BORDER MARKET SHARES
15 Based on 37 fund domiciles, excluding funds of funds.
“The analysis clearly highlights those markets that have been most accessible.”
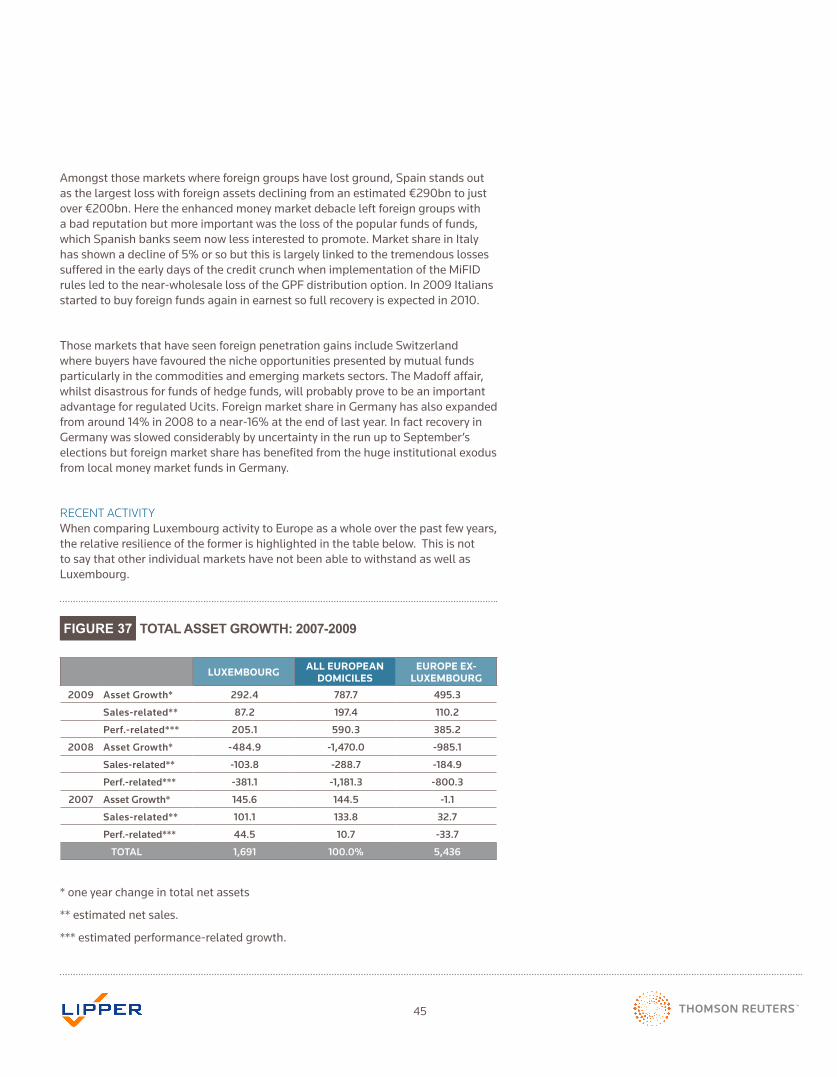
45
FIGURE 37 TOTAL ASSET GROWTH: 2007-2009
Amongst those markets where foreign groups have lost ground, Spain stands out as the largest loss with foreign assets declining from an estimated €290bn to just over €200bn. Here the enhanced money market debacle left foreign groups with a bad reputation but more important was the loss of the popular funds of funds, which Spanish banks seem now less interested to promote. Market share in Italy has shown a decline of 5% or so but this is largely linked to the tremendous losses suffered in the early days of the credit crunch when implementation of the MiFID rulesledtothenear-wholesalelossoftheGPFdistributionoption.In2009Italiansstarted to buy foreign funds again in earnest so full recovery is expected in 2010.
Those markets that have seen foreign penetration gains include Switzerland where buyers have favoured the niche opportunities presented by mutual funds particularly in the commodities and emerging markets sectors. The Madoff affair, whilst disastrous for funds of hedge funds, will probably prove to be an important advantage for regulated Ucits. Foreign market share in Germany has also expanded from around 14% in 2008 to a near-16% at the end of last year. In fact recovery in Germany was slowed considerably by uncertainty in the run up to September’s elections but foreign market share has benefited from the huge institutional exodus from local money market funds in Germany.
RECENT ACTIVITYWhen comparing Luxembourg activity to Europe as a whole over the past few years, the relative resilience of the former is highlighted in the table below. This is not to say that other individual markets have not been able to withstand as well as Luxembourg.
LUXEMBOURG ALL EUROPEAN DOMICILES
EUROPE EX-LUXEMBOURG
2009 Asset Growth* 292.4 787.7 495.3
Sales-related** 87.2 197.4 110.2
Perf.-related*** 205.1 590.3 385.2
2008 Asset Growth* -484.9 -1,470.0 -985.1
Sales-related** -103.8 -288.7 -184.9
Perf.-related*** -381.1 -1,181.3 -800.3
2007 Asset Growth* 145.6 144.5 -1.1
Sales-related** 101.1 133.8 32.7
Perf.-related*** 44.5 10.7 -33.7
TOTAL 1,691 100.0% 5,436
* one year change in total net assets
** estimated net sales.
*** estimated performance-related growth.
46
Luxembourg-domiciled funds enjoyed positive asset growth in 2007, despite the outflows that hit the industry over the second half of the year. The tsunami that hit the industry in 2008 inevitably affected those groups reliant on third-party distribution more heavily than those with fettered funds. The latter were able to benefit from some transfer to money market sectors. Inevitably Luxembourg, with its heavy weighting of cross-border assets, took a disproportionately large hit of withdrawals. However, the pendulum has started to swing back again and in 2009 Luxembourg funds were, once again, on the rise.
The revival in 2009 saw Luxembourg taking 44% of Europe-wide net sales and 37% of the total growth in assets. Just as the largest European asset management companies have to be able to offer a wide product range in order to service a wide range of client types in different market conditions, so Luxembourg’s international client base of asset managers — from the largest international cross-border players, to boutiques with a handful of funds, to banks using Luxembourg as a domicile for ‘round-trip’ funds to a local market — are likely to be susceptible to all manner of changing winds.
The first of the key themes in 2009 has been the unprecedented flows into corporate investment grade bond funds (greater than the previous five years combined) even as the previous European staple diet ofgovernmentbondsremainedinnetoutflow.Ontheequity side, the boom in emerging markets resulted in net sales into these products contributing 39% to the European equity sales total. While this is clearly high, perhaps even more interesting is the fact that the equivalent proportion in 2003 was 16%, when the industry was last building a recovery.
Underpinning this activity have been High-net-worth investors, reflected both in the product choices and the fact that it has been the cross-border groups that have been most successful (boosting the numbers posted for Luxembourg). In addition to this, just as institutional money market funds softened the blow of redemptions from long-term asset classes in 2008, so the re-allocation of this money in a low interest-rate environment has meant that institutional investors have been active again.
So while the ripple effects from the financial crisis
are still being felt, even as many companies in the industry have enjoyed a very profitable year there are a range of issues that the European industry will need to address as it re-builds for the future. Sitting at the heart of Europe and as the largest domicile for Ucits, Luxembourg is likely to have felt the effects of this crisis, and its ramifications, most keenly.
INDUSTRY FUTUREWhat then are the prospects for Luxembourg in the coming years? Charting the compound annual growth rates (CAGR) since 2001 16 for Luxembourg and Europe respectively reveals the Grand Duchy to have grown at a superior rate of 8.9%, while Europe as a whole grew at 6.1%. Estimations for future growth is a precarious business, particularly now when all commonly used reference points reflect extreme market events. The most recent ten years, for example, tracks between the top of the bull market to the lows of the financial crisis. A similar tendency exists over the more recent five-year calculation.
Having said this, it is fair to assume that the most dynamic phase of Ucits growth (i.e. the 1990s early Ucits phase) is unlikely to be repeated unless there is a significant new development in the form of, say, the introduction of a pan-European defined contribution scheme based on managed fund investment. This is not an impossible prospect but is probably too remote to be factored into a realistic forecast. Thus, a period of recovery, which is likely to be pitted with periodic setbacks as Europe emerges from its debt crisis, is the most realistic scenario for the next five years.
Lipper FMI’s latest estimates for this forthcoming period show a cautious estimated CAGR of 6.8% for Europe over the next five years17. This represents a substantial slow down when compared with the 12% growth rate achieved since the early 1990s. However, the industry is now considerably larger and therefore likely to develop at a slower rate and the additional burden of weak economic fundamentals in the foreseeable future will also act as a brake. Nonetheless, this growth rate will result in an industry with assets under management of €6.8trn by 2014 and, with a good wind, an upper range of €8trn.
16 Full Lipper FMI history to end of 2009. 17 As published in Lipper FMI’s Data Digest 2010.
47
Luxembourg’s progress is likely to be considerably faster with an estimated growth rate of 10.4%, resulting in assets of €2.6trn by 2014. This gives a growth in Luxembourg assets of €1trn over a five-year period.
OnthisbasisLuxembourgwillincreaseitsshareofEuropean assets from 32% (currently) to 38% (in 2014). This is consistent with the migration trends seen among some markets such as the Netherlands. We anticipate that this trend will continue, affecting particularly:
France, where large bank players have already been in the process of migrating all but pure French activity to Luxembourg; Germany, where the financial crisis has hit the mutual funds industry hard, but the underlying acceptance of Luxembourg funds and the strong savings culture remain, together with the risingprominenceofETFs;UK,althoughsomeofthismigration is very likely also to benefit Dublin.
In our forecast model Luxembourg funds of German andUKprovenanceshowthelargestpercentagegrowth (15% CAGR), while growth from French, Spanish and Italian groups is smaller at 5% to 6%.
US involvement in Luxembourg will continue to develop (CAGR of over 11% anticipated for US groups’ Luxembourg ranges) not least because of the growth potential of non-European markets e.g. Asia and Latin America. This promise is bringing a new wave of smaller specialist groups into Europe, although for many of these Dublin is a strong domicile option. Luxembourg is also expected to be an important beneficiary of the move to regulate hedge funds and the conversion of hedge funds into so-called ‘Newcits’.
Forecasting five years into the future is difficult enough, but ten years may seem almost foolhardy, as new issues beyond those outlined above come into play. However, it is not difficult to see the European funds industry exceeding €9trn by 2018 (with a 5% compound annual growth rate) and Luxembourg’s share of this potentially rising above the 40% mark.
OPPORTUNITIES AND THREATS The following issues are current and likely to have an influence, positive or negative on future asset growth. The extent to which they will influence the numbers is a matter of debate and readers may take their own view.
ASIA Recent years have demonstrated the importance of non-European investors to Ucits and this looks very likelytoincreaseovertime.Ofcourse,itisessentialto understand the array of different Asian markets with different attitudes to foreign funds and different distribution channels — much as in Europe. South Koreahasdemonstratedhowlocalfiscalchangescan severely hamper Ucits activity (although in this country’s particular case 2010 may well show a revival of foreign sales). More fundamentally, Asian regulators’ occasional signs of nervousness over the development of Ucits (such as the changes in eligible assets) need to be borne in mind. If an argument is to be made that ‘traditional’ Ucits should be separated from the alternative strategies enabled through Ucits III (or more clearly labelled as such), then the needs or demands of Asian regulators will form a persuasive part of such an argument.
LATIN AMERICA Activity relating to the Chilean pension system is driving activity in this region, but both Argentina and Brazil have been showing more receptiveness to Ucits in recent years. It looks likely that the proportion of Ucits sales into the region will hit an all-time high in 2009.
INSTITUTIONAL MONEY MARKET FUNDS The value of institutional money market funds for the wider industry (notably in Dublin and Luxembourg) was well demonstrated in 2008, softening the damage caused by the sheer scale of redemptions and plummeting stock markets. The evolution of such products, and their use by corporate treasurers rather than bank deposits, could fuel further growth in the years ahead. More generally, while Ucits is often seen as a ‘retail’ product, the benefits of servicing institutional and more specialist clients has become all the more apparent in recent years (for example, SIFs).
EXCHANGE-TRADED FUNDS German groups’ use of Luxembourg to domicile their ETFs has helped bring the Grand Duchy’s ETF assets to €38bn (23% of European ETF assets), which is equivalent to the
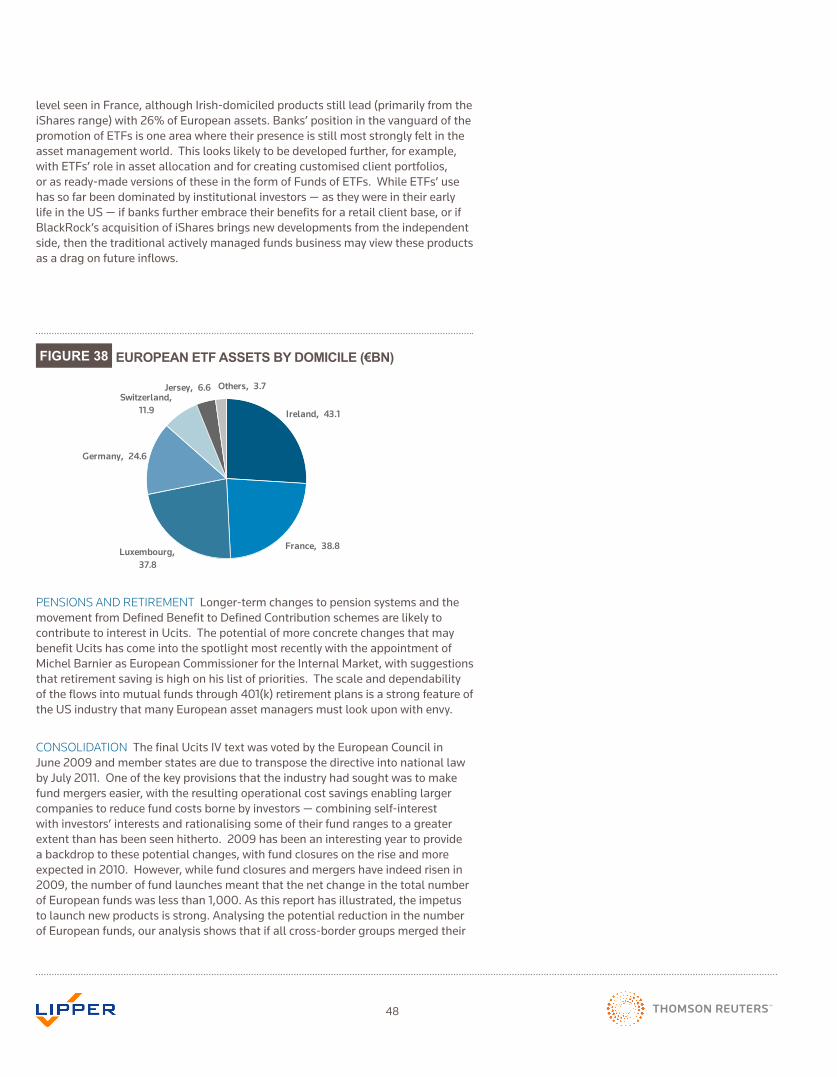
48
level seen in France, although Irish-domiciled products still lead (primarily from the iShares range) with 26% of European assets. Banks’ position in the vanguard of the promotion of ETFs is one area where their presence is still most strongly felt in the asset management world. This looks likely to be developed further, for example, with ETFs’ role in asset allocation and for creating customised client portfolios, or as ready-made versions of these in the form of Funds of ETFs. While ETFs’ use has so far been dominated by institutional investors — as they were in their early life in the US — if banks further embrace their benefits for a retail client base, or if BlackRock’s acquisition of iShares brings new developments from the independent side, then the traditional actively managed funds business may view these products as a drag on future inflows.
Ireland, 43.1
France, 38.8 Luxembourg,
37.8
Germany, 24.6
Jersey, 6.6 Others, 3.7 Switzerland,
11.9
PENSIONS AND RETIREMENT Longer-term changes to pension systems and the movement from Defined Benefit to Defined Contribution schemes are likely to contribute to interest in Ucits. The potential of more concrete changes that may benefit Ucits has come into the spotlight most recently with the appointment of Michel Barnier as European Commissioner for the Internal Market, with suggestions that retirement saving is high on his list of priorities. The scale and dependability of the flows into mutual funds through 401(k) retirement plans is a strong feature of the US industry that many European asset managers must look upon with envy.
CONSOLIDATION The final Ucits IV text was voted by the European Council in June 2009 and member states are due to transpose the directive into national law byJuly2011.Oneofthekeyprovisionsthattheindustryhadsoughtwastomakefund mergers easier, with the resulting operational cost savings enabling larger companies to reduce fund costs borne by investors — combining self-interest with investors’ interests and rationalising some of their fund ranges to a greater extent than has been seen hitherto. 2009 has been an interesting year to provide a backdrop to these potential changes, with fund closures on the rise and more expected in 2010. However, while fund closures and mergers have indeed risen in 2009, the number of fund launches meant that the net change in the total number of European funds was less than 1,000. As this report has illustrated, the impetus to launch new products is strong. Analysing the potential reduction in the number of European funds, our analysis shows that if all cross-border groups merged their
FIGURE 38 EUROPEAN ETF ASSETS BY DOMICILE (€BN)
49
domestic European funds (excluding guaranteed funds) into their cross-border ranges, numbers could reduce by 6,500 funds, i.e. 25% of the European funds universe. This extreme result will not take place, but it does offer a useful guide to the maximum reductions.
MASTER/FEEDER STRUCTURES The pooling provisions within Ucits IV could turn out to be the most quickly embraced, enabling easier distribution of different funds to different markets. It may be that this will actually result in an increase in the number of subfunds even as the number of share classes might be more effectively managed. Needless to say, fund servicing/distribution centres such as Luxembourg and Dublin should be well placed to take advantage of this change, although entrenching local activities may also result for some companies, preserving the status quo.
MANAGEMENT COMPANY PASSPORT Not all of the major asset management players in the European industry will undergo a ‘root and branch’ review of their activities to establish which activities can best be carried out in which countries under this provision of Ucits IV. However, with some of Europe’s largest cross-border companies having set up activities in Luxembourg twenty years ago the attraction of maintaining such well-established operations is plain. At one stage this element of Ucits IV prompted a pretty hot debate and certainly many eyes will be fixed on ensuring that some Ucits do not become ‘empty shells’, leading to a potential threat to investor protection.
WITHHOLDING TAX Luxembourg previously opted to charge a withholding tax instead of disclosing client data to home fiscal authorities. However, the EU Savings Directive requires a tax that will gradually increase to 35% from 1 July 2011. This has not acted as a barrier, but if EU regulations were to change to the enforcement of disclosure (rather than currently considering withholding tax as equivalent to the exchange of information) then this could become a threat. More generally,localfiscalmeasures(suchasthoseseeninSouthKorea)stillhavethepotential to slow the future growth of cross-border funds.
OTHER CROSS-BORDER CENTRES There has always been the potential for other European countries to act as fund distribution ‘hubs’ in the way that Luxembourg andIrelandhavedone.Forexample,open-endedinvestmentcompanies(Oeics)intheUK.However,thisreporthashighlighted(seefigures9and10)thelimitedsize of fund assets that are distributed cross-border from other centres, the largest beingFrance.Onecanaddtothisdiscussionthepotentialfora‘globalfund’,domiciled in the US, as suggested by the US Treasury Department, although this is not an imminent threat, not least because many of the pre-eminent cross-border players in Europe are ultimately owned by US parent companies that must be very aware of the cost and time it will have taken to develop effective European operations.
SALES VOLATILITY Higher sales volatility becomes an inevitable feature of an open architecture landscape. This means that International groups — and therefore many Luxembourg fund ranges — have had to build their business knowing that marketconditionschange,andflowsinandoutoffundscanberapid.Oneofthefeatures of the 2009 growth for cross-border players has been that the redemption rate18 has fallen to below 50%, lower than the ‘boom’ year of 2005. At their peak during different points in 2007 and 2008, redemption rates exceeded 100%. This contrasts sharply with the US mutual funds industry where the steadiness of sales
“If all cross-border groups merged their domestic European funds into their cross-border ranges, numbers could reduce by 6,500 funds.”
50
flows is reflected in a redemption rate that ranged from 25% to 35% between 2005 and 2009. This analysis also has implications for the way in which funds are sold (see figures 12 and 13) and whether fund investments are really being made for the longer term, or just following the latest fashion. ETFs are addressed elsewhere in this section but, marketed for their liquidity, there is also the potential for a rapid turnover of fund holdings — perhaps taking a short-term ‘bet’ on a sector — that could also be a feature of their further development.
THE MADOFF FRAUD While much of the focus of the early European fall-out from Bernard Madoff’s fraudulent activities was on Luxembourg, the wider implications of this scandal look to be a Europe-wide discussion on the depositary function as well as the alternativeinvestmentmanagementindustry.Oneof the knock-on effects has been as a contributing factor to the continued outflows from European funds of hedge funds into 2009 (which had already begun in 2008), not only in Luxembourg, but also France, Guernsey, Ireland, Italy and Switzerland. Damage to the reputation of Ucits is difficult to assess, for while 2009 has seen healthy sales activity, this has not been driven by ‘mainstream’ investors. Having said this, such investors are far less likely to consider such alternative investment strategies, if they were to meet the minimum investment thresholds. Certainly one would expect there to have been a rise in funds of hedge funds’ willingness to demonstrate the robustness of their due diligence procedures over the last year.
‘NEWCITS’ The investment powers enabled under Ucits III (and clarified with the Eligible Assets Directive of March 2007) has seen a flurry of discussions relating to the current size and growth potential of a ‘new breed’ of Ucits. While some have seen these new regulations as a means for hedge fund managers to expand distribution, there has been very little evidence of this being translated into sales flows. Instead the more immediate pick-up seems likely to have been driven by existing hedge fund clients wanting the reassurance of the trusted Ucits brand — a kite mark, as it were — and therefore not fundamentally changing the overall investment preferences or appetite of European investors or their advisers. This is not to deny that some funds that have embraced these newer investment strategies have indeed attracted significant inflows, but this does not mean that the funds landscape as a whole haschanged,asyet.Onefootnoteworthmakingis
the use of the term ‘absolute return’. Even before 2008, questions were being asked about this label, how well understood it is, and the way in which it is used when marketing to retail investors.
STRUCTURED PRODUCTS The threat posed by these financial products to mutual funds remains at the forefront of the minds of many in the asset management industry and their lobbying efforts to ensure a level playing field. Addressing this, the benefits of mutual funds for retail investors — such as transparency and the ring-fencing of assets — are being actively promoted in some countries (funds associations’ activities in Germany and Switzerland being good examples) and as part of efforts to educate investors into the need for longer-term savings.Ofcourse,notallcompanieswillviewthis ‘threat’ in the same way, with some offering both products — just as some offer both ETFs and traditional mutual funds. The ability to offer an investor a defined outcome clearly has attractions for retail investors, and this remains a challenge with which the fund management industry is grappling.
WORKFORCE At the end of June 2008 there were some 2,000 vacancies in Luxembourg’s mutual fundsindustry.Ofcourse,thispicturewillsincehavechanged, but the challenge over the longer term remains to find sufficiently qualified candidates to support an industry that continues to expand and evolve each year. As Luxembourg borders three European countries, this has always ensured a multinational workforce, which suggests that this aspect might be considered a driver for growth. Either way, for both Luxembourg City and Dublin logistical issues have been to the fore as these industries have developed and expanded beyond the cities’ walls (such as Esch-sur-Alzette in the former, or Galway in the latter, among others).
DISTRIBUTION REVIEWS The most obvious example of a national regulator working to shake-up distribution is the Financial Services Authority’s (FSA) RetailDistributionReview(RDR)intheUK.Herethecost of advice will have to be paid for by a fee, rather than imbedded in the product through commission, if an adviser is to be allowed to describe himself as ‘independent’. The FSA has stated one of its aims as being to ‘reduce the conflicts of interest inherent in remuneration practices and improve transparency ofthecostofalladvisoryservices’.CurrentlytheUKis dominated by IFAs (unlike the rest of Europe), so
18 Redemptions expressed as a proportion of a fund’s average net assets.
51
the FSA’s activities certainly have the potential to completely change the way in which mutual funds aredistributed.PreciselybecausetheUKdistributionlandscape is so different from continental Europe, one might expect that the RDR will be of limited interest outsidetheUK.However,revisionstoMiFIDortheEuropeanCommission’sreviewprocessforPackagedRetailInvestmentProducts(PRIPs)maymeanthattheUKisnotaloneintacklingpotentialconflictsofinterest of commission-based sales.
GUILT BY ASSOCIATION? Mutual funds suffered during the global financial crisis due partly to being linked to the problems faced by investment banks, for example, UBS and Credit Suisse’s asset management divisions suffering mutual fund outflows when a separate division (investment banking) made poor decisions related to US sub-prime activities. While 2009 has seen a significant upturn in industry assets, for Europe as a whole banks are not yet moving their retail clients into mutual funds, so it is difficult to differentiate investor nervousness with financial institutions from other factors. Efforts to educate investors on the benefits of mutual funds and retirement provision are relevant here too.
INVESTOR BASE ThepresenceoftheKeyInformationDocument(KID)withinUcitsIVservesasausefulreminder that the investor should lie at the heart of the mutual fund structure. This report has commented on the fact that much of the industry inflows in 2009 came from high-net-worth investors. While such activity has clearly been profitable for asset managers — most notably independent groups driving cross-border business — a question remains as to how sustainable this is as a mainstay of industry flows, particularly with the rate of redemptions currently low. It may well be that groups will understandably focus their business activities on the client base and distribution channels that has brought them recent success. But this activity alone will not take European fund sales back to the boom years at the end of the 1990s (see figure 14), although those historic levels of inflows were certainly open to the accusation of over-selling. Historical comparisons also bring banks into the picture as it was primarily these groups that delivered the scale of retail investor interest in mutual funds ten years ago not seen in subsequently. Banks’ attitudes to mutual funds (including ETFs) in the years ahead will be a crucial element affecting the growth of the industry as a whole and widening the investor base. Developments specifically in Luxembourg and Dublin on fund governance offer another approach to providing
investor protection — and so offering reassurance and potentially assistance to retail investors. While not taking the same shape as boards of directors in the US (a majority of whom must be independent), the roleofConductingOfficerscontinuestogaingreaterfocus, for example with ALFI’s Code of Conduct to provide directors with a framework of principles and best practice recommendations for the governance of Luxembourg funds.
CONCLUDING REMARKSThe map of Europe has undergone remarkable change in terms of asset management topography. After two decades or more of Ucits and two severe market crashes, Europe is no longer a collection of disparate and self-sufficient industries. The barometer of cross-border business set out in Fig 36 clearly illustrates the extent of cross-border penetration in the individual European markets despite the recent market fracture. The assets of cross-border groups are accumulating at a faster rate than those operating in just a single market. Lipper FMI data also isolates those funds that source their assets from a multiple of jurisdictions and therefore cannot be identified in terms of one specific country or nationality. These funds now account for 37% of all European assets compared with 21% at the start of the decade. The cross-border promise is becoming a reality and, in the coming years it will become increasingly difficult to attach a nationality to an asset management group in any meaningful way.
The cross-border evolution, once almost entirely a Luxembourg story, now includes non-domestic expansion from funds that previously only addressed local market appetite; borders have become blurred and in most countries fund buyers are agnostic about where their funds are based as long as they carry the Ucits brand.
The drive for efficiencies has already spurred many groups to consolidate their fund ranges into a single manufacturing centre and although some groups - those that are just beginning to venture abroad - will choose to utilise their existing structures, most of the more mature groups have gravitated towards Luxembourg where their original cross-border funds were based. This development has helped to expand Luxembourg’s role in the fund industry and it is this feature of consolidation and convenience that will prove important as competition for assets builds in the future.

52
The introduction of the Ucits passport gave Luxembourg an opportunity to build a uniqueinfrastructure–afundcentrethatwasahostforregulatedretailproducts.Such a concept did not exist before Ucits. Ucits gave new life to Luxembourg but the relationship has been symbiotic and, arguably, over the years, Luxembourg has breathed life into Ucits. By providing a fund centre that is dedicated to the asset management industry it has offered a home that is politically neutral and therefore attractive to those looking to develop a long-term presence in the European savings’ market. This is at the root of Luxembourg’s success but it is also a critical factor in the evolution of Ucits and the single market dream.
__________________________

53
Lipper FMI’s research makes use of the transparent data set contained in its FundFile database, covering the monthly assets and estimated net sales of over 35,000 funds across 37 European domiciles, with sales history generally going back to January 2002.
This data is complemented by the unique cross-border sales benchmarking service, SalesWatch. In practice this is a neutral collection point used by over 40 cross-border groups to pool all their international gross and net sales data by country of sale. The funds included in SalesWatch are predominantly domiciled in LuxembourgandDublin,butsomeUK-basedOeicsarealsoinvolved.LipperFMIestimates that the universe of current members accounts for around 80% of all Ucits cross-border business. As this data is strictly confidential, only aggregated data that is over six months old can be used for the current research study.
The Data used in this report is primarily set at the end of December 2009 unless otherwise noted. This data therefore reflects a full year of the funds industry’s recovery after the global financial crisis that impacted on activity in 2007 and 2008.
SalesWatch data — enabling analysis of the source of sales for cross-border funds — is at the end of the third quarter 2009 and is based on third party retail business only, unless otherwise stated.
All data excludes funds of funds unless otherwise stated. This is to avoid the risk of double-counting.
ACCREDITATIONThanks are offered to all the groups that contribute their data to the Lipper FMI SalesWatch project, who have kindly consented to the incorporation of their aggregate data in this report.
This report is an independent study and the opinions and comments are those of the authors.
METHODOLOGY AND DATA

54
Within this report a number of terms have a specific meaning. The following list explains these terms:
CAGR: Compound Annual Growth Rate.
IFA: Independent Financial Adviser.
MARKET: In order to identify, as closely as possible, the source of the assets in a fund, each fund is identified not only by the country in which it is legally based (its domicile) but also by its ‘Market’. The fund’s Market is the country in which 80% or more of its assets are sourced. Therefore, a fund may be domiciled in Luxembourg but if 80% of its assets are sourced from Germany it will be categorised as being a German Market fund. Any fund that sources less than 80% of its assets from more than one market is identified as an International fund. These are the global/cross-border funds and many will also source assets from non-European markets. For these funds it is not possible to identify the source of assets since this data is generally regarded as proprietary by the groups concerned. However the indicative data produced for this report from the SalesWatch benchmarking project seeks to address this gap.
MASTER GROUP: A Lipper FMI term to denote the parent company of the asset management groups that are located in various European domiciles. Since a single entity can have a presence in a number of domiciles, it is important that the activities of all these subsidiaries can be aggregated up to the final corporate entity or Master Group. The pan-European and market ranking tables within the report are based data at the Master Group level. The tables within the data sections of the report, since they operate at the fund level, denote both local group, or Fund Company, and Master Group.
MIFID: The European Directive acronym that stands for Markets in Financial Instruments Directive. This Directive effectively replaced the Investment Services Directive and it therefore impacts the distribution end of the value chain. For the asset management community its main impact has been the requirement for distributors to disclose incentives to their clients at point of sale (article 26, Inducements).
SALESWATCH CONTRIBUTORS: The number of contributors to the SalesWatch service has increased since it began in 2002 (from 22 to 40 in 2009). This is reflected in those sales figures presented in the current report that use this underlying data.
UCITS AND UCITS III: European Directive for the Undertakings for Collective Investments in Transferable Securities. The first Ucits Directive was introduced in 1985 and implemented by the European Union markets over the subsequent five years. In the early 1990s proposals were developed to enhance the effectiveness of the harmonisation of Ucits throughout Europe. These discussions led to the draft Ucits II directive which was ultimately abandoned when the Council of Ministers could not reach a common position. Ucits III was introduced in 2001 and broadened the categories of fund that could be passported to include money market funds, funds of funds and, more importantly, it permitted the use of derivatives within a portfolio over and above that required for efficient portfolio management.
TERMS AND DEFINITIONS