Embed Size (px)
Citation preview

RESEARCH
SYDNEY INDUSTRIAL Market Overview
HIGHLIGHTS • The majority of leasing demand continues to be driven by transport and logistics with the bulk of
enquiries seeking prime grade facilities. This trend was evident with 62% of gross absorption in the six months to April being accounted for by prime leases. However after three years of below average supply, prime vacancies are relatively scarce, accounting for only 23% of vacancies as at April.
• After a subdued 2011, pre-lease enquiry has started to re-enter the market. D&C projects will continue to drive supply, which is forecast to total 574,186m² for calendar year 2012. Speculative projects remain limited despite reasonably successful leasing outcomes to date.
• These dynamics are yet to flow through to rental growth, which has been relatively modest. In the 12 months to April 2012, average A-grade net face rents recorded sub CPI growth of 0.9%.
• Core market yields have remained steady when evaluated on the basis of a five year WALE and average 8.00% to 8.75% for prime assts. However prime assets with WALEs in excess of 10 years have displayed circa 25bps of tightening in the six months to April. This has been a result of limited offerings combined with a greater depth of interest from investors for this type of product.

MAY 2012
SYDNEY INDUSTRIAL Market Overview
2
Economic Snapshot Expectations for economic growth close to trend in 2011 did not fully materialise with GDP growth of 2.3% posted for the calendar year. The RBA forecasts growth to increase to 3.0% in 2012, however with large mining related capital expenditure to drive this growth, the NSW economy is likely to expand at a rate below that of the national average.
In May, the RBA lowered the cash rate by 50bps to 3.75%, while interest rate markets have priced in round 75 to 100bps of further easing over 2012. Such monetary stimulus is likely to be of particular benefit to NSW given the softness in interest rate sensitive parts of the NSW economy such as retail spending and housing construction. Providing scope for further cuts is inflation, which at close to 2% is at the lower end of the target band. Furthermore, the recent Budget announcement aiming for a $1.5 billion surplus in 2012/13 involves a significant fiscal turnaround. Although the majority of forecasts suggest this turnaround will subtract only around one percentage point from GDP growth, it will nevertheless likely necessitate the RBA providing some monetary policy easing to offset the impact.
Unemployment remains relatively low measuring 4.9% for both NSW and Australia as at April. However in line with some moderation in job advertisements, national employment growth remains below long run average levels. In NSW, employment growth is trending flat and suggests some further increases in unemployment may be recorded over 2012. These conditions are commensurate with the NAB April Business Survey that indicated some moderation in business conditions and capacity utilisation. However the survey also recorded an increase in business confidence, which indicates activity should improve from here.
Although the value of the $AUD has recently softened to slightly below parity with the $USD, it remains favourable for import volumes. This is reflected in Sydney Ports data that showed full container imports for YTD March 2011/12 increased 2.4% compared with the same period last year. Conversely, exports were down 1.3%. While this is a positive for industrial property that facilitates transport and warehousing functions, conditions for traditional industrial manufacturing related industrial property remains soft. Competition from imports given the high $AUD remains a constraint on manufacturing activity with the latest PMI figures (April 2012) measured 43.9, indicating
the second consecutive month where manufacturing activity declined.
On a cautionary note, offshore risks could have a flow on effect and slow the Australian economy. Despite some recent increased concerns over European sovereign debt issues and the US posting below consensus GDP growth in the first quarter of 2012, China remains of key importance to Australia. Current indicators are that policy initiatives have appropriately slowed the economy to a more sustainable level with March quarter GDP figures indicating annual growth of 8.1%.
Figure 1
Economic Growth NSW vs Australia – 2011 to 2014
Source: Deloitte Access Economics
0.0
0.5
1.0
1.5
2.0
2.5
3.0
3.5
4.0
2011 2012 (f) 2013 (f) 2014 (f)
Aust GDP NSW GSP
Table 1
Sydney Industrial Market Indicators April 2012 Precinct Avg Prime Rent Avg Secondary Rent Core Market Yields Avg Land Value
$/m² net
(%p.a)
$/m² net
(%p.a) Prime
% Secondary
% <5,000m² 1 - 5 ha
$/m² (%p.a) $/m² (%p.a) Outer West 103 1.3% 93 1.1% 8.00 - 8.75 9.00 - 10.00 350 0.0% 250 0.0%
Inner/Central West 113 1.1% 101 0.4% 8.00 - 8.75 9.00 - 10.00 509 0.0% 296 0.0%
South West 93 0.5% 80 0.0% 8.25 - 9.00 9.25 - 10.00 306 0.0% 215 0.0%
North 161 0.8% 135 0.6% 8.75 - 9.25 9.25 - 10.00 580 0.0% 465 2.2%
South 141 0.8% 124 0.7% 7.88 - 8.63 8.63 - 9.50 1,050 0.0% 800 0.0%
Sydney Average 122 0.9% 107 0.6% 8.00 - 8.75 9.00 - 9.75 388* 0.0% 254* 0.0%
Source: Knight Frank *Average Outer West, Inner/Central West and South West Prime: Asset with modern design, good condition & utility with an office component 10-30%. Located in an established industrial precinct with good access. Secondary: Asset with an older design, in reasonable/poor condition, inferior to prime stock, with an office component between 10%-20%. Core Market Yield: The percentage return/yield analysed when the assessed fully leased market income is divided by the adopted value/price which has been adjusted to account for property specific issues (ie rental reversions, rental downtime for imminent expiries, capital expenditure, current vacancies, incentives, etc)
INDUSTRIAL OVERVIEW

www.knightfrank.com.au
3
Industrial Overview
Take up of leasing space has been reasonably steady with gross absorption of 5,000m²+ facilities in the 12 months to April 2012 totalling 375,028m² (excluding D&Cs). This take up amount has been split relatively evenly between prime and secondary, which is a likely reflection of the lack of prime leasing options available for tenants.
However the last six months have seen the majority of absorption occur in prime assets. This trend is in line with the majority of logistic related briefs in the market for which well located, modern high clearance facilities of A-grade standard are the minimum requirements. Illustrating the scarcity of larger prime assets, as at April 2012, only two prime vacancies in excess of 15,000m² existed, with one reportedly under offer. As a result, enquiries in the pre-lease market have started to show some renewed vigour with approximately 250,000m² of provisional enquiry in the market.
Although these leasing conditions are predominantly favourable for speculative projects, development finance hurdles remain a constraint on project progression. As a
result the speculative pipeline remains soft and limited to larger developers with available land inventory and adequate capital structures. Similarly, this has also seen land sales remain scarce with the lack of buyer depth holding back any change in land values.
Figure 2
Sydney Industrial Land Values Avg value serviced lots by precinct ($/m²)
Source: Knight Frank
Nevertheless, the relative shortage of prime leasing options is yet to be significant enough to drive a meaningful increase to average net rents with the general holding pattern demonstrated over the past three
years continuing. Average prime net face rents recorded a modest 0.9% rise to $122/m² in the 12 months to April 2012.
Figure 3
Sydney Industrial Rents $/m² net rent by precinct – April 2012
Source: Knight Frank
Average prime yields range from 8.0% to 8.75%. While this reflects a relatively steady environment for yields, it is noted that the range is based on a five year WALE. However buyer depth for prime assets with WALEs in excess of 10 years has seen around 25bps of tightening for prime assets of this nature with the potential for select assets to reflect yields in the order of 7.5% to 8.0%.
0
200
400
600
800
1000
1200
South
North
Inner/CentralW
est
Outer W
est
South West
<5,000m² 1-5 ha
0
20
40
60
80
100
120
140
160
180
North
South
Inner/CentralW
est
Outer W
est
South West
Prime Secondary

MAY 2012
SYDNEY INDUSTRIAL Market Overview
4
Occupier demand continues to predominantly be driven by the transport and logistics sector. While the increasing trend towards internet sales continues to drive increased freight volumes, the importance of supply chain efficiencies is also having a considerable impact. Some recent softening in business conditions and profitability has increased this area of focus given its direct impact on operating costs. The Outer West market, and in particular markets in close proximity to the M4/M7 interchange, have been a key beneficiary of this trend with the region accounting for almost two thirds of gross take up (excluding D&Cs) in the 12 months to April.
Leasing demand has been firmer for prime options and this has been reflected in the take up figures. In the six months to April, 62% of gross take up (excluding D&Cs) was made up of leases on prime assets. These take up figures have included the relatively strong absorption of speculative stock, which has benefitted from the lack of alternative prime vacancies available in existing buildings. Knight Frank estimate that 66,000m² of speculative stock has been leased since October 2011. Examples include DEXUS leasing 21,143m² to Schenker at Erskine Park, while Goodman have leased
8,504m² at Erskine Park to ACR Supply Partners and 6,010m² at Eastern Creek. While the larger portions of speculative projects have been absorbed relatively quickly, smaller residual components have taken longer to lease. However following OneSteel leasing the 6,420m² of residual speculative space from Australand, only two completed speculative projects are yet to be absorbed. These include 7,662m² adjacent to the QLS development at Eastern Creek and 12,600m² at Quarry at Greystanes, however this is believed to be under final negotiations.
Consistent with the steady growth being recorded in imported container traffic through Port Botany, leasing demand in the South Sydney Industrial market continues to be driven by transport and logistics companies, in particular the air freight industry. Most leasing requirements from these users are for A-grade facilities with three enquires in excess of 10,000m² presently in the market. However the market remains challenged by relatively tight leasing conditions, which is exemplified by only two A-grade vacancies in excess of 5,000m² currently in the market. However one of these (29,907m² at 33-41 Military Road, Matraville) is believed to be under offer and should this lease be finalised, the A-grade vacancy will drop significantly.
Secondary options are also relatively scarce with only four options in excess of 5,000m² currently vacant. The majority of leasing activity has constituted sitting tenants exercising options and extending lease terms. Nevertheless, a number of new leases have recently been recorded (refer Table 2) with tenants such as Direct Couriers and Toll demonstrating the strong demand from logistics users.
The prevalence of prime leasing activity is driving a tighter prime leasing market such that secondary vacancies now outweigh prime vacancies by a factor of three to one. However rents are yet to demonstrate this relativity and although gross rents have shown some growth over the last two years, this has largely stemmed from rises in outgoings. On a net basis, however, rents have remained relatively steady. In the 12 months to April 2012, average Sydney A-grade net face rents recorded some very modest sub CPI growth of around 0.9%. Average secondary growth was 0.6%. However the lack of large A-grade options now favours landlords with larger prime assets, where net rents are anticipated to start recording rental growth over the coming 12 months.
Table 2
Major Industrial Leasing Transactions Sydney Region Address Region Net Rent Area Term Lease type Tenant Date ($/m²) (m²) (yrs)
Quarry at Greystanes OW Conf 5,437 7 Pre-comm UPS P/C Quarry at Greystanes OW Conf 13,310 10 Pre-comm Brady Australia P/C
Unit 2, 33-41 Military Road, Matraville S 140 20,899 5 Renewal DHL Sep-12 56 Anzac Street, Chullora ICW 104 9,600 Conf Existing Australia Post May-12
1/25 Wonderland Drive, Eastern Creek OW Conf 6,420 3 Speculative OneSteel May-12
146 Warren Road, Smithfield OW 111 10,346 1.3 Renewal DHL Apr-12 Westpark Industrial Estate, Erskine Park OW 108.5 20,600 5 Pre-comm DHL Mar-12
Portside Distribution Centre, 2-8 McPherson Street, Banksmeadow
S 140 6,265 7 Existing Direct Couriers Feb-12
Lenore & Tyrone, Erskine Park, Erskine Park OW Conf 21,143 7 Speculative Schenker Feb-12 1 Hale Street, Botany S 130 8,174 2 Existing Toll Paper Jan-12
13 Bessemer Street, Blacktown OW 102.5 7,000 7 Existing Nilfisk Advance Sep-11
Source: Knight Frank OW Outer West SW South West ICW Inner Central West N North S South Conf refers to confidential
OCCUPIER DEMAND & RENTS

www.knightfrank.com.au
5
A steady increase in gross supply completions has been recorded since the 2010 trough in the supply cycle. 2012 gross supply of industrial projects (in excess of 5,000m²) is forecast to measure 574,186m². It is noted, however, that one third of this figure is underpinned by two large pre-lease developments, namely Mirvac’s Hoxton Park development (132,231m² completed in March) and Goodman’s 82,000m² Huntingwood development for Metcash. Nevertheless, despite the growing pipeline, new supply remains below the annual average gross completion rate of 743,986m² that was recorded in the five years to 2008.
Figure 4
Sydney Industrial Development Annual Gross Supply* (000s m²)
Source: Cordell Connect/Knight Frank * includes developments with industrial floor area >5,000m² and excludes deferred/abandoned projects
A number of recent pre-lease deals have occurred in the market, which is a positive change given the slowdown in pre-lease enquiry that was experienced over 2011. Examples have included DEXUS pre-leasing a
5,437m² facility to UPS for completion in July 2012 and a 13,310m² facility for Brady Australia with both projects located at the Quarry site at Greystanes. Altis Property Partners have achieved a pre-lease with BagTrans to develop a 6,000m² cross dock facility on their 2.7ha land parcel in Brabham Drive, Huntingwood. Australand have also had success with some large deals at Gibbon Road in Winston Hills securing pre-lease deals with GME (16,000m²) and another undisclosed tenant for a further 19,600m². While Altis are developing their project on land they acquired in December, the other developments will proceed on existing inventory.
Further pre-lease development is likely to progress from here in response to a number of enquiries currently in the market. Some large examples include Bunnings and Super Retail Group who are both seeking facilities in the range of 40,000m² to 50,000m². Further enquiries amounting to around 150,000m² are also present in the market.
Despite the strong platform set by successful leasing to date of speculative projects, the speculative pipeline remains reasonably benign. The only project currently under construction is a small private development in Smeaton Grange of 5,430m². At Eastern Creek, Goodman has commenced ground works for a 22,000m² project at Reedy Creek that is expected to add to the pipeline of speculative stock under construction.
With conditions in the leasing market somewhat favourable for developers wishing to progress developments, it was anticipated that 2012 would see improved demand for
land sales. However, with development finance still relatively limited, particularly for riskier projects, this has yet to transpire. As a result, the majority of projects are being developed from existing inventory. The absence of any substantial buyer depth has seen a number of land parcels remain on the market for extended periods of time, particularly in the South West region. Subsequently, this has seen virtually no change in land values recorded for the past two years. Nevertheless, one positive to emerge has been demand for large land parcels as larger developers look to re-stock development inventory. This has included Australand acquiring 32ha at Eastern Creek, while a second large confidential land transaction is also imminent. It is now anticipated that large land parcels are very close to, if not at, the bottom of the cycle. However, land values for sub 10ha land parcels are expected to remain flat.
Figure 5
Sydney Industrial Land Values* Avg. value serviced lots – April 2012 ($/m²)
Source: Knight Frank * Average Outer West, Inner/Central West and South West
0
100
200
300
400
500
600
700
800
900
1,000
2004 2005 2006 2007 2008 2009 2010 2011 2012
Total South North
Inner West South West Outer West
0
100
200
300
400
500
600
Apr-05
Apr-06
Apr-07
Apr-08
Apr-09
Apr-10
Apr-11
Apr-12
< 5000 1-5 ha
Table 3
Major Land / Development Sales Activity Sydney Region
Address Region Price ($ m)
Area (m²)
$/m² of site area
Vendor Purchaser Date
15 Long Street, Smithfield OW 16.00 119,000 135* Transgrid Charter Hall (CPIF) May-12
Brabham Drive, Huntingwood West OW 4.70 26,958 174 Private Altis Property Partners Dec-11 Tesrol site, Eastern Creek OW Conf 322,768 Conf Tesrol Australand Conf
61 Roberts Rd, Greenacre SW 10.53 36,500 288 Mirvac Group Private Jun-11 Source: Knight Frank Conf refers to confidential *Based on gross site area with a small portion of the site lost to an easement. OW Outer West SW South West ICW Inner Central West N North S South
DEVELOPMENT & LAND VALUES

MAY 2012
SYDNEY INDUSTRIAL Market Overview
6
The start of 2012 sees a number sales in either due diligence or final negotiations, however as yet only a limited number of sales have reached the settlement stage. The major sale in 2012 thus far has been Stockland selling their 55% share in the Defence National Storage and Distribution Centre at Moorebank for a reported price of $123 million. Qube Logistics agreed to purchase the unitholding, however QR National were able to exercise a pre-emptive right such that each party participated in the sale on a commensurate basis to ownership weighting (refer Table 4 for details). Although the site is planned to be developed into an intermodal connection to Port Botany via the proposed Southern Sydney freight rail line, the current premises reflected a reported passing yield of 8.0%.
The Inner Central West has experienced very few major sales recently, however in December 2011, 21 Worth Street, Chullora was sold for $32 million. The sale marked the first Inner Central West sale in excess of $20 million since 2010. Primo Smallgoods, who are an adjoining land owner, purchased the asset that is 100% leased to PaperlinX
Australia. Although the core yield equated to 9.45%, the relatively high passing rent reflected an initial yield of 10.3%, largely reflecting the perceived covenant risk at the property.
Other major sales that have been completed or are in train have been made up of portfolio sales. In November, Altis Property Partners were able to finalise the purchase of seven assets from PGA Group, which included the Sydney assets of 39 Britton Street, Smithfield and 34 Airds Road, Minto. Although table 4 indicates the particulars of the sale, it is noted that as the assets were part of a larger portfolio sale that involved certain value apportionments, the sale price and yields are therefore considered skewed and reflect the final value apportionments.
Mirvac have also announced that in addition to the 50% sell down of Hoxton Distribution Park to Aviva Investors Australian Logistics Property Trust (‘AIALT’), they had also entered into formal Heads of Agreement to sell four non-aligned industrial assets. However, it is believed that this sale involves a delayed settlement, which is yet to transpire. Singapore’s listed property group Mapletree
has also been widely reported to be undertaking due diligence on a portfolio of Stockland assets, however details are not yet available.
Figure 6 Average Prime Core Market Yields Sydney Industrial Regions
Source: Knight Frank
While the recent volume of larger sales has been relatively quiet, there has been a steady flow of smaller sales. Predominantly these have consisted of sales in the range of $5 million to $12 million, with private buyers,
6.0%
6.5%
7.0%
7.5%
8.0%
8.5%
9.0%
9.5%
Apr-05
Apr-06
Apr-07
Apr-08
Apr-09
Apr-10
Apr-11
Apr-12
Outer West Inner Central West
South West North
South
Table 4
Major Improved Sales Activity Sydney Region
Address Region Price ($ m)
Bld Area (m²)
Core Mkt Yield (%)
WALE (yrs)
Vendor Purchaser Date
Defence National Storage and Distribution Centre, Moorebank
SW 123.00‡ 238,876 8.00* 1.0 Stockland Qube Logistics† / QR National#
Mar-12
97 Williamson Rd, Ingleburn SW 11.73 9,972 N/A≥ 0.5 Private Kong's Century P/L Feb-12 21 Worth St, Chullora ICW 32.00 24,864 9.45 5.0 PPS Nominees Primo Smallgoods
(Colonial First State) Dec-11
25-27 Sirius Road, Lane Cove˧ N 10.66 8,693 10.00 2.3 Private Private Nov-11
34 Airds Rd, Minto SW 15.50 24,095 10.04 VP PGA Group Altis Property Partners Nov-11
39 Britton St, Smithfield OW 13.25 13,390 10.22 8.6 PGA Group Altis Property Partners Nov-11 Hoxton Distribution Park SW 97.40^ 132,231 7.50* 23.4 Mirvac AIALT› Sep-11~
Sir Joseph Banks Corporate Park, Botany
S 76.83 31,658 8.10» 2.9 Grosvenor Int’l DEXUS Sep-11
St Leonards Corporate Centre N 86.75 35,502 9.20 3.8 Orchard Property
Altis Property Partners Sep-11
Source: Knight Frank ‡ 55% share * reported passing yield † increased interest from 30% to 67% # increased interest from 15% to 33% ^ 50% share ~ March 2012 settlement date › Aviva Investors Australian Logistics Property Trust ≥ Purchased for owner occupation » analysed on a 36 month horizon ˧ 48% office/ 52% warehouse VP refers vacant possession OW Outer West SW South West ICW Inner Central West N North S South
SALES & INVESTMENT YIELDS
www.knightfrank.com.au
7
(often in an owner occupier capacity), the active parties. One such example includes Kong’s Australia, who acquired 97 Williamson Road, Ingleburn for $11.73 million in February. Although sold with a short term lease in place, the purchaser was already located in an adjacent property and acquired the asset in an off market transaction. 25-27 Sirius Road, Lane Cove West was an example of a private purchase in this range for investment purposes with the asset selling for $10.66 million at a core market yield of 10.0%. It is noted that the asset composed 48% office and 52% warehouse.
PRIME ASSETS WITH LONGER LEASE EXPIRIES ARE BEING FAR MORE HEAVILY CONTESTED
Across Sydney, five year prime yields are estimated to average between 8.00% and 8.75%. However, prime assets for sale with longer average lease expiries of between 10 and 15 years are currently being far more heavily contested amongst investors and have therefore started to exhibit some tightening that is yet to flow through to yields on assets circa five year WALEs. For example in the Outer West, where the average range for yields is 8.0% to 8.75%, a new D&C asset with a 15 plus year WALE would likely reflect a core market yield in the range of 7.5% to 8.0%.
With competition amongst buyers stronger for well tenanted, prime assets, the yield premium between prime and secondary, that increased sharply during the GFC, remains at a level not seen for 14 years (refer Figure 8). Secondary core market yields are estimated to average between 9.0% and 9.75%. This range implies a yield spread between prime and secondary of 88bps compared to the 10 year average of 70bps.
OUTLOOK Although consumer spending continues to be constrained by conservative households maintaining high savings rates, the structural changes within the retail industry will continue to be the key driver of demand for industrial property. In fact it has been this propensity to save that has prompted many consumers to take advantage of online savings and the high $AUD. IBISWorld forecast revenue growth for Australia’s online retail industry of 7.2% over the next five years. This is expected to contribute to the strong outlook for imports, with imports forecast to increase by an average of 8.25% per annum over 2012 and 2013 (Deloitte Access Economics).
These drivers will benefit well located, modern warehouse and distribution type facilities. However it is this type of asset that there is a current shortage of. As at April Knight Frank vacancy data showed that ten large vacancies in excess of 15,000m² existed in the Sydney market, of which only two were prime grade. This compared to 52 vacant options between 5,000m² and 15,000m². These factors suggest that larger, prime assets will be the first asset types to start demonstrating material rental growth, which is expected to start emerging over the coming 12 months.
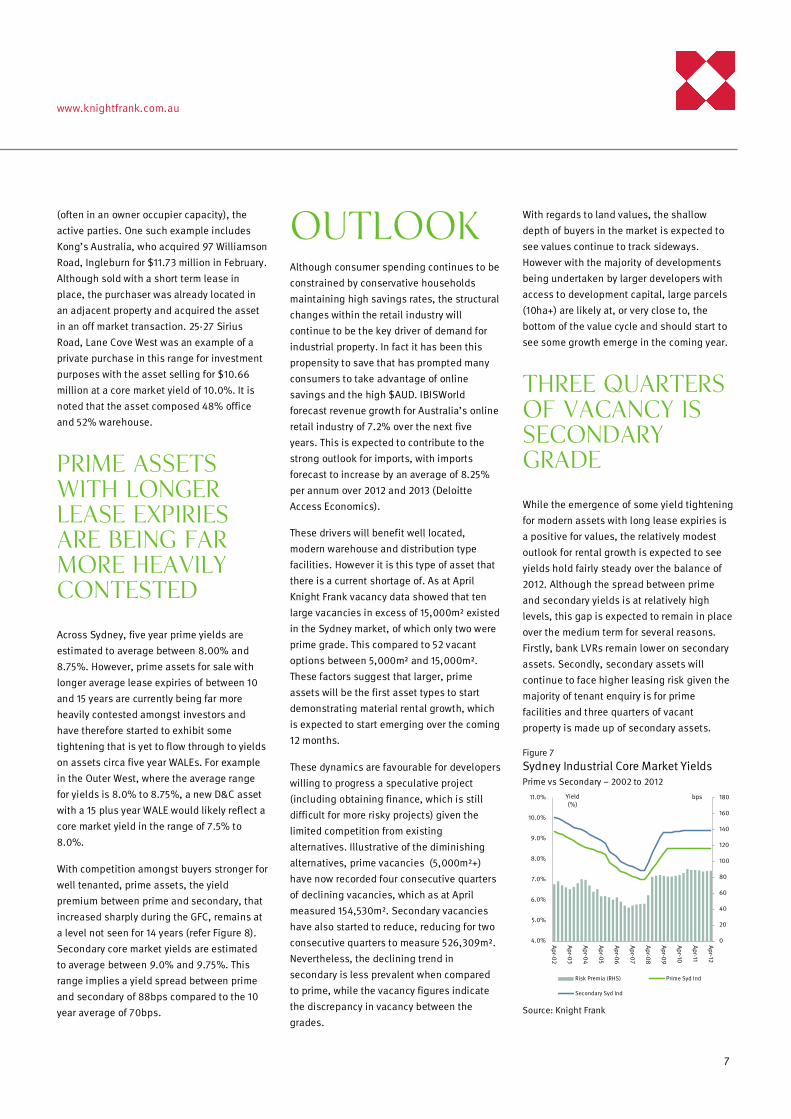
These dynamics are favourable for developers willing to progress a speculative project (including obtaining finance, which is still difficult for more risky projects) given the limited competition from existing alternatives. Illustrative of the diminishing alternatives, prime vacancies (5,000m²+) have now recorded four consecutive quarters of declining vacancies, which as at April measured 154,530m². Secondary vacancies have also started to reduce, reducing for two consecutive quarters to measure 526,309m². Nevertheless, the declining trend in secondary is less prevalent when compared to prime, while the vacancy figures indicate the discrepancy in vacancy between the grades.
With regards to land values, the shallow depth of buyers in the market is expected to see values continue to track sideways. However with the majority of developments being undertaken by larger developers with access to development capital, large parcels (10ha+) are likely at, or very close to, the bottom of the value cycle and should start to see some growth emerge in the coming year.
THREE QUARTERS OF VACANCY IS SECONDARY GRADE
While the emergence of some yield tightening for modern assets with long lease expiries is a positive for values, the relatively modest outlook for rental growth is expected to see yields hold fairly steady over the balance of 2012. Although the spread between prime and secondary yields is at relatively high levels, this gap is expected to remain in place over the medium term for several reasons. Firstly, bank LVRs remain lower on secondary assets. Secondly, secondary assets will continue to face higher leasing risk given the majority of tenant enquiry is for prime facilities and three quarters of vacant property is made up of secondary assets.
Figure 7
Sydney Industrial Core Market Yields Prime vs Secondary – 2002 to 2012
Source: Knight Frank
0
20
40
60
80
100
120
140
160
180
4.0%
5.0%
6.0%
7.0%
8.0%
9.0%
10.0%
11.0%
Apr-02
Apr-03
Apr-04
Apr-05
Apr-06
Apr-07
Apr-08
Apr-09
Apr-10
Apr-11
Apr-12
Risk Premia (RHS) Prime Syd Ind
Secondary Syd Ind
Yield(%)
bps

8
RESEARCH
Americas USA Bermuda Brazil Canada Caribbean Chile
Australasia Australia New Zealand
Europe UK Belgium Czech Republic France Germany Hungary Ireland Italy Monaco Poland Portugal Romania Russia Spain The Netherlands Ukraine
Africa Botswana Kenya Malawi Nigeria South Africa Tanzania Uganda Zambia Zimbabwe
Asia Cambodia China Hong Kong India Indonesia Macau Malaysia Singapore South Korea Thailand Vietnam
The Gulf Bahrain Abu Dhabi, UAE
Knight Frank Research Nick Hoskins Research Manager - NSW +61 2 9036 6766 [email protected] Matt Whitby National Director Head of Research and Consultancy +61 2 9036 6616 [email protected] Knight Frank Valuations Mark Harrison Associate Director, Sydney +61 2 9036 6781 [email protected] Tom Phelan Divisional Director, North Sydney +61 2 9028 1131 [email protected] Lachlan Graham Divisional Director, North Sydney +61 2 9028 1132 [email protected] Anthony Alford Divisional Director, Parramatta +61 2 9761 1872 [email protected]
Industrial Agency Contacts Derek Erwin Managing Director Parramatta +61 2 9761 1836 [email protected] Tony Gargaro Managing Director Parramatta +61 2 9761 1835 [email protected] Peter Hanzis Associate Director, Industrial +61 2 9761 1811 [email protected] Michael Bovill Director, Industrial South Sydney +61 2 9036 6797 [email protected] Eugene Evgenikos National Director, Industrial +61 2 9036 6769 [email protected]
Knight Frank Research provide strategic advice, consultancy services and forecasting to a wide range of clients worldwide including developers, investors, financial and corporate institutions. All recognise the need for the provision of expert independent advice customised to their specific needs. Knight Frank Research reports are also available at www.knightfrank.com.au © Knight Frank 2012 This report is published for general information only. Although high standards have been used in the preparation of the information, analysis, views and projections presented in this report, no legal responsibility can be accepted by Knight Frank Research or Knight Frank for any loss or damage resultant from the contents of this document. As a general report, this material does not necessarily represent the view of Knight Frank in relation to particular properties or projects. Reproduction of this report in whole or in part is not permitted without prior consent of, and proper reference to Knight Frank Research.