Embed Size (px)
Citation preview

Syddansk Universitet
Does physically demanding work hinder a physically active lifestyle in lowsocioeconomic workers? A compositional data analysis based on accelerometer data
Rasmussen, Charlotte Lund; Palarea-Albaladejo, Javier; Bauman, Adrian; Gupta, Nidhi;Nabe-Nielsen, Kirsten; Jørgensen, Marie Birk; Holtermann, AndreasPublished in:International Journal of Environmental Research and Public Health
DOI:10.3390/ijerph15071306
Publication date:2018
Document versionPublisher's PDF, also known as Version of record
Document licenseCC BY
Citation for pulished version (APA):Rasmussen, C. L., Palarea-Albaladejo, J., Bauman, A., Gupta, N., Nabe-Nielsen, K., Jørgensen, M. B., &Holtermann, A. (2018). Does physically demanding work hinder a physically active lifestyle in low socioeconomicworkers? A compositional data analysis based on accelerometer data. International Journal of EnvironmentalResearch and Public Health, 15(7), [1306]. DOI: 10.3390/ijerph15071306
General rightsCopyright and moral rights for the publications made accessible in the public portal are retained by the authors and/or other copyright ownersand it is a condition of accessing publications that users recognise and abide by the legal requirements associated with these rights.
• Users may download and print one copy of any publication from the public portal for the purpose of private study or research. • You may not further distribute the material or use it for any profit-making activity or commercial gain • You may freely distribute the URL identifying the publication in the public portal ?
Take down policyIf you believe that this document breaches copyright please contact us providing details, and we will remove access to the work immediatelyand investigate your claim.
Download date: 26. Jul. 2018
brought to you by COREView metadata, citation and similar papers at core.ac.uk
provided by University of Southern Denmark Research Output

International Journal of
Environmental Research
and Public Health
Article
Does Physically Demanding Work Hinder aPhysically Active Lifestyle in Low SocioeconomicWorkers? A Compositional Data Analysis Based onAccelerometer Data
Charlotte Lund Rasmussen 1,2,* ID , Javier Palarea-Albaladejo 3 ID , Adrian Bauman 4,Nidhi Gupta 1, Kirsten Nabe-Nielsen 1,2, Marie Birk Jørgensen 5 and Andreas Holtermann 1,6
1 National Research Centre for the Working Environment, 2100 Copenhagen, Denmark; [email protected] (N.G.);[email protected] (K.N.-N.); [email protected] (A.H.)
2 Department of Public Health, Section of Social Medicine, University of Copenhagen,2100 Copenhagen, Denmark
3 Biomathematics and Statistics Scotland, Edinburgh EH9 3FD, UK; [email protected] Prevention Research Collaboration, School of Public Health, University of Sydney,
Sydney 2006, Australia; [email protected] Department of Forensic Science, University of Copenhagen, 2100 Copenhagen, Denmark;
[email protected] Department of Sports Science and Clinical Biomechanics, University of Southern Denmark,
5230 Odense, Denmark* Correspondence: [email protected]; Tel.: +45-3916-5237
Received: 18 May 2018; Accepted: 19 June 2018; Published: 21 June 2018�����������������
Abstract: Leisure time physical activity (LTPA) is strongly associated with socioeconomic position(SEP). Few studies have investigated if demanding occupational physical activity (OPA) could impedea physically active lifestyle in low SEP groups. The aim of this study was to investigate the associationbetween OPA and LTPA among low SEP men and women. We used cross-sectional data from 895 lowSEP workers who wore accelerometers for 1–5 consecutive workdays. The associations betweenthe relative importance of activities performed during work and leisure time were assessed usingcompositional regression models stratified on sex. Compositional isotemporal substitution modelswere used to assess the implication of increasing occupational walking, standing, or sitting on LTPA.We found dissimilarity in LTPA between the sexes, with men spending more waking leisure timesedentary than women (men ~67%, women ~61%), suggesting women performed more householdtasks. In men, the associations between OPA and LTPA were weak. In women, the strongestassociation was observed between the relative importance of occupational walking and leisure timestanding (β = −0.16; p = 0.01), where reallocating 15 min work time to occupational walking showedan expected decrease in leisure time standing of 7 min. If this time was spent on additional sedentaryleisure time, it could have adverse health consequences.
Keywords: physical activity; leisure time; blue-collar; low status occupation; work-life balance;time-use epidemiology
1. Introduction
Leisure time physical activity (LTPA) is a strong protective factor for several non-communicablediseases and all-cause mortality [1–3]. However, LTPA is also socially disproportionally distributed:the lower the socioeconomic position (SEP), the worse the health and likelihood of engaging in
Int. J. Environ. Res. Public Health 2018, 15, 1306; doi:10.3390/ijerph15071306 www.mdpi.com/journal/ijerph

Int. J. Environ. Res. Public Health 2018, 15, 1306 2 of 23
LTPA [4–6]. Accordingly, public health strategies aim to increase LTPA in this high-risk population [7,8].To succeed, modifiable determinants of LTPA among low SEP groups need to be identified.
Several individual determinants of LTPA among low SEP groups are well established,including age, sex and overall health status [9,10]. By contrast, structural factors are the leastunderstood but an important class of determinants in low SEP groups by not relying on individualknowledge, motivation or resources [11,12]. One modifiable structural factor suggested as a barrierfor LTPA among low SEP groups is demanding occupational physical activities (OPA), being highlyprevalent in this group [11].
Low position occupations often include job tasks requiring stationary and monotonous behaviors,such as stationary standing and extensive walking [13,14]. Stationary standing requires sustainedmuscle contraction, causing increased intramuscular pressure periods and thereby decreasing bloodflow to the muscles [15]. Consequently, the muscles receive less oxygen, leading to muscle fatiguewhich can persist up to 24 h after the end of the work period [15,16]. Furthermore, prolonged exposureto working whilst upright, i.e., walking or stepping, has been found to induce pain in lowerextremities [14,17]. Accordingly, high levels of OPA could exhaust workers, leaving little energyfor being physically active during leisure time. Furthermore, workers with manual jobs might believethat they obtain the recommended level of daily physical activity during work hours and thus,lack motivation to engage in LTPA [18].
The potential adverse influence of OPA on LTPA is understudied and unclear [11]. Studies reportthat individuals with high levels of OPA compensate by spending less leisure time on physicalactivities [19–21]. Other studies find individuals with physically active jobs being more likelyto perform physical activity during leisure time [22–24]. These discrepancies could be caused bymethodological inconsistency. Some studies have used self-reported information on physical activitylevels [19,20,22,23], which are prone to issues of recall- and response-bias [25]. Accordingly, the use oftechnical measurements for assessing OPA and LTPA has been recommended [25,26]. Another reasonfor the inconsistent findings could be differences in study populations. The majority of studies are basedon samples strongly dominated by middle or higher SEP groups [19,21–24,27]. However, having lowerSEP groups underrepresented in study samples hinders inferences on the effect of OPA and LTPA inthis high-risk population.
Finally, no study investigating the unfavorable influence of OPA on LTPA among low SEPindividuals has taken the full 24 h day into account. Time spent on physical activities and sleepare exhaustive parts of a finite whole (24 h day) [28,29]. Hence, the portions of time spent on eachactivity throughout the day represent relative information and are co-dependent and collinear [30].The statistical analysis of such constrained data (known as compositional data) requires a specialmethodology; log-ratio analysis [30–32]. Accordingly, the aim of this study was to investigate theassociation between OPA and LTPA in a group of low SEP men and women, using compositionaldata analysis.
2. Materials and Methods
This was a cross-sectional study based on baseline data from two Danish studies: the DanishPHysical ACTivity cohort with Objective measurements (DPhacto) [33] and the New Method forObjective Measurements of Physical Activity in Daily Living (NOMAD) study [34]. DPhacto andNOMAD were identical in data procedures and collection, which facilitated merging the data. Details ofthe studies have been described previously [33,34].
The study population consisted of workers with low SEP recruited from Danish workplaceswithin cleaning, transportation, manufacturing, construction, road maintenance, garbage disposal,assembly, mobile plant operator, and health care [33,34]. Eligible workers were employed in one ofthe mentioned sectors for at least 20 h/week; between 18–65 years old; and had given voluntaryconsent to participate. Workers were excluded if they were pregnant, had fever on the day of testing,or band-aid allergy.

Int. J. Environ. Res. Public Health 2018, 15, 1306 3 of 23
The DPhacto and NOMAD studies were approved by the local Ethics Committee (file numberH-2-2012-011 [33] and file number H-2-2011-047 [34], respectively). Both studies were conductedaccording to the Helsinki declaration and all data were anonymized in relation to individualsand workplaces.
2.1. Data Collection
Data were collected over four consecutive days and included questionnaires, health checks,and accelerometer-based measurements [33,34]. On day one, eligible workers were invited to completea questionnaire and to participate in a health check, which consisted of anthropometric measurementsand a physical health examination. Participants were asked to wear accelerometers for a minimum oftwo consecutive workdays and to complete a diary reporting time at work, time in bed at night andnon-wear time.
2.2. Measurements
2.2.1. Accelerometer Measurements of Physical Activity
Physical activity at work and leisure time was assessed using data from two tri-axial ActiGraphGT3X+ accelerometers (Actigraph, Pensacola, FL, USA). The accelerometers were fixed using doublesided adhesive tape (3 M, Hair-Set, St. Paul, MN, USA) and Fixomull (Fixomull BSN medicalGmbH, Hamburg, Germany) and placed on the upper back and right thigh. Accelerometer data weredownloaded using Actilife Software version 5.5 (Actigraph, Pensacola, FL, USA) [35] and analyzedusing the custom-made MATLAB program Acti4 (The National Research Centre for the WorkingEnvironment, Copenhagen, Denmark) [36]. The Acti4 program has been shown to separate physicalactivity types with high sensitivity and specificity under semi-standardized [36] and non-standardizedconditions [37]. Classification of physical activity types using Acti4 has been described previously [36].In brief, physical activity types (i.e., cycling, stair climbing, running, walking, standing, sitting andlying) were classified based on an algorithm using angles from the accelerometers axis and standarddeviation of mean acceleration [36].
Daily work hours, leisure time and time in bed were defined from the participants’ self-reporteddiary information. Only workers with at least one day of valid accelerometer measurements of workand leisure time periods were included. A valid day consisted of ≥4 h of accelerometer-derived workand leisure time or ≥75% of the individual’s average work and leisure time. For workers with morethan one valid day of accelerometer measurements, an average of daily time-use on occupational andleisure time physical activity was calculated. Average time in bed was based on accelerometer-derivedperiods of ≥4 h in bed at night.
Time-use of OPA and LTPA was treated as two subcompositions of activities performed within a24 h day. OPA was defined as a 4-part subcomposition, consisting of time spent on walking, standing,sitting, and high intensity activities (HiPA: stair climbing, running and cycling). The parts of the OPAsubcomposition were closed to a total time length of 480 min, corresponding to the workers’ averagedaily work hours. LTPA was defined as a 5-part subcomposition, consisting of time spent on sedentarybehavior (sitting and lying), walking, standing, HiPA, and time in bed (TIB). The parts of the LTPAsubcomposition were closed to a total time length of 960 min, equivalent to the workers’ average dailyleisure time.
2.2.2. Covariates
Sex and age of the workers were determined from each worker’s unique Danish civil registrationnumber (CPR-number). BMI (Body Mass Index) was calculated as weight (kg) divided by height (m)squared (kg/m2). Information on shift work was assessed using the question: “At what time(s) ofthe day do you usually work in your main occupation?” with 3 response categories: fixed daywork; night/varying work hours with night; and other. The variable was dichotomized into

Int. J. Environ. Res. Public Health 2018, 15, 1306 4 of 23
workers with fixed day work and workers with not fixed day work (including shift work and other).Information about pain in lower back, knees and feet/ankles was obtained by the questions: “Have youhad any pain or trouble in the last 7 days in: lower back; knees; feet/ankles?” The answers werecategorized into four categories for measurement of multi-site pain (no pain; pain in one body region;pain in two body regions; or pain in three body regions). Information on whether the worker wasskilled was obtained by the question: “Are you skilled or unskilled?”. Missing data were not imputed.
2.3. Statistical Analysis
We used compositional data analysis to assess the association between OPA and LTPA. All analyseswere performed using R Version 1.1.3 (RStudio, Boston, MA, USA) [38] using the “compositions” [39]and “robCompositions” packages [40].
Compositional mean, total variance, and variation matrix of the activities were calculated asdescriptive data summaries [31,32]. In brief, the composition mean represents the central tendencyfor time-use of OPA and LTPA. Total variances were calculated for OPA and LTPA subcompositionsfrom the respective sums of all log-ratio variances as a global measure of spread. Absolute andpercentage contribution of each part to the total variance were calculated. The variation matrixmeasures co-dependence between activities in terms of proportionality with values close to 0 indicatingthat two parts are highly co-dependent.
2.3.1. Ilr-Coordinates and Compositional Linear Regression Models
Following Chastin et al. and Hron et al., we used an isometric log-ratio (ilr) coordinate system toexpress the workers’ time-use for the OPA and LTPA subcompositions [30,41]. This system consistedof three and four ilr-coordinates for the OPA and LTPA subcompositions, respectively (the numberof original parts, D, minus 1). Using this ilr representation, the first ilr-coordinate is given by thelog-ratio of the part placed in the first position of the composition to the geometric mean of theremaining part within the composition. This way, all the information about the relative importanceof that first part in the time-use distribution (with respect to the geometric average of the remainingparts) was contained in the first ilr-coordinate. The relative importance of the remaining parts of theOPA and LTPA subcompositions was subsequently isolated in the first ilr-coordinate by sequentiallyrearranging parts within the subcomposition, so that each part was put at the first position once.Hence, we obtained a number of alternative, although equivalent, ilr representations of the samesubcomposition, which enabled investigation of associations between OPA and LTPA by regressionanalysis. In the following, we use the term relative importance to emphasize that time-use on oneactivity was assessed relative to time-use on the remaining activities.
Compositional linear regression models were used to estimate the direction and strength of theassociations between activities performed at work and leisure time as represented by their relativeimportance in ilr-coordinates. In all models, the ilr-coordinates of the workers’ LTPA subcompositionacted as outcome variables, and the ilr-coordinates for the workers’ OPA subcomposition actedas exposure variables. This resulted in a total of 16 models fitted, each time rotating the set ofilr-coordinates used for outcome and exposure. See Appendix A (Tables A1 and A2) of ilr-coordinaterepresentation of the OPA and LTPA subcompositions and regression model fitting.
Potential confounders were chosen based on previous literature and theoretical assumptionsconcerning their possible influence on occupational and leisure time physical activity. The regressionmodels were adjusted for the following covariates: age, BMI, shift work (not fixed day work vs. fixedday work (reference)), average work hours, and pain within the last 7 days in lower back and/or kneesand/or feet/ankles (reference: no pain). Average work hours were calculated using the logarithm ofthe geometric mean of time spent on each part of the OPA subcomposition multiplied by
√D =√
4,as recommended in Pawlowsky-Glahn et al. [42]. Regression beta coefficients ((β1)) and standarderrors were estimated for the 16 models. A MANOVA test on ilr-coordinates showed significantdifferences in the compositional mean of OPA and LTPA for men and women. Therefore, the regression

Int. J. Environ. Res. Public Health 2018, 15, 1306 5 of 23
models were stratified on sex. The assumptions of normality and homoscedasticity of the residualswere fulfilled for all models by visual inspection of plots of residuals versus predicted values andquantile-quantile plots.
2.3.2. Isotemporal Substitution Models
The first regression coefficients ((β1)) and 2-sided p-values for each model were used to determineif the relative importance of an occupational activity was statistically significantly associated with therelative importance of an activity during leisure time. p-values < 0.05 were considered statisticallysignificant. Isotemporal substitution models were used to examine the effect size of reallocating timefrom one occupational activity to another, following the method proposed by Dumuid et al. [43].HiPA was not considered for this analysis as less than 1% of the workers had values above 15 min ofHiPA during work (data not shown). Consequently, results based on reallocating more than 15 min ofwork HiPA would not be reliable.
The isotemporal substitution analyses were conducted in multiple steps. Firstly, an expectedLTPA composition was estimated based on the workers’ mean OPA composition. Secondly, new OPAcompositions were made by reallocating time between the work activities (from 15 min to 60 minin 15-min increments). New LTPA subcompositions were estimated for each new OPA composition.Finally, expected changes in LTPA compositions were derived by taking the ilr-inverse of the LTPAilr-coordinates estimated by the reference and new OPA compositions and then calculating change inleisure time activities. Thus, effect size was expressed as expected change in leisure time activities inminutes. An example of the procedure for obtaining change matrices is given in Appendix B.
2.3.3. Sensitivity Analysis
It is possible that the effect of sex on the association between OPA and LTPA could be sectordependent. Therefore, sensitivity analyses were conducted in which only workers within manufacturingwere included in a compositional linear regression analysis using same procedure as the primaryanalyses by adjusting for the same covariates and stratifying by sex.
3. Results
3.1. Study Population Characteristics
Figure 1 show the flowchart of workers included in the analyses. Initially, 391 and 2107 workersfrom the NOMAD and DPhacto studies were invited to participate, respectively. A total of 1200 eligibleworkers answered the baseline questionnaire and/or participated in the physical health check. Of theseworkers, 37 were excluded due to sickness on the day of testing; pregnancy; being students ordepartment leaders; or for unknown reasons. Forty-seven workers were excluded from the analysisbecause they did not have accelerometer measurements on a workday and 213 workers were excludeddue to non-valid accelerometer measurements. Therefore, a total of 895 workers were included in theanalyses (495 men and 400 women).
3.2. Descriptive Statistics
Table 1 shows the baseline characteristics of the study population stratified by sex. Among men,the mean age was 46.6 (SD = 10.6); mean BMI was 27.1 (SD = 4.4); 74% had fixed day job; 32% weresmokers; and the majority worked in manufacturing (67%). Among women, the mean age was46.5 (SD = 8.8); mean BMI was 27.2 (SD = 0.7); 78% had a fixed day job; 34% were smokers; and mostof the women worked in manufacturing (51%).

Int. J. Environ. Res. Public Health 2018, 15, 1306 6 of 23
Int. J. Environ. Res. Public Health 2018, 15, x 6 of 24
Figure 1. Flowchart of participants in the NOMAD and DPhacto study included in the current paper. NOMAD: New Method for Objective Measurements of Physical Activity in Daily Living; DPhacto: Danish PHysical ACTivity cohort with Objective measurements.
Table 1. Baseline characteristics of the study population, stratified on sex.
Variables Men (N = 495) Women (N = 400)
N % Mean (SD) Range N % Mean (SD) Range Age in years 495 100 46.6 (10.6) [18.0; 68.0] 400 100 46.5 (8.8) [21.0; 68.0]
Seniority in years 475 96 13.6 (10.8) [0.0; 45.1] 376 94 12.5 (9.9) [0.1; 48.0] Overall health (1–5) A 483 98 2.2 (0.7) [1.0; 5.0] 393 98 2.3 (0.7) [1.0; 5.0]
BMI in kg/m2 486 98 27.1 (4.4) [18.7; 45.1] 394 99 27.2 (5.5) [16.2; 43.8] Aerobic capacity (mL O2/min/kg) 392 79 33.7 (9.1) [13.9; 70.8] 276 69 29.8 (8.7) [13.6; 8.9]
Alcohol consumption (units/week) 490 99 4.8 (6.1) [0.0; 40.0] 394 99 1.6 (2.4) [0.0; 18.0] Accelerometer-derived measured days 495 100 2.6 (1.0) [1.0; 5.0] 400 100 2.5 (0.9) [1.0; 5.0]
Fixed day job 368 74 310 78 Smokers 157 32 136 34
Skilled workers 253 51 131 33 Cohort
NOMAD 125 25 95 24 DPhacto 370 75 305 76
Working sector Cleaning 20 4 142 35
Manufacturing 330 67 204 51 Transportation 58 12 2 1 Health Service 0 0 17 4
Assemblers 4 1 28 7 Construction 38 8 0 0
Garbage Collectors 21 4 0 0
Figure 1. Flowchart of participants in the NOMAD and DPhacto study included in the current paper.NOMAD: New Method for Objective Measurements of Physical Activity in Daily Living; DPhacto:Danish PHysical ACTivity cohort with Objective measurements.
Table 1. Baseline characteristics of the study population, stratified on sex.
VariablesMen (N = 495) Women (N = 400)
N % Mean (SD) Range N % Mean (SD) Range
Age in years 495 100 46.6 (10.6) [18.0; 68.0] 400 100 46.5 (8.8) [21.0; 68.0]Seniority in years 475 96 13.6 (10.8) [0.0; 45.1] 376 94 12.5 (9.9) [0.1; 48.0]
Overall health (1–5) A 483 98 2.2 (0.7) [1.0; 5.0] 393 98 2.3 (0.7) [1.0; 5.0]BMI in kg/m2 486 98 27.1 (4.4) [18.7; 45.1] 394 99 27.2 (5.5) [16.2; 43.8]
Aerobic capacity (mL O2/min/kg) 392 79 33.7 (9.1) [13.9; 70.8] 276 69 29.8 (8.7) [13.6; 8.9]Alcohol consumption (units/week) 490 99 4.8 (6.1) [0.0; 40.0] 394 99 1.6 (2.4) [0.0; 18.0]
Accelerometer-derived measured days 495 100 2.6 (1.0) [1.0; 5.0] 400 100 2.5 (0.9) [1.0; 5.0]Fixed day job 368 74 310 78
Smokers 157 32 136 34Skilled workers 253 51 131 33
Cohort
NOMAD 125 25 95 24DPhacto 370 75 305 76
Working sector
Cleaning 20 4 142 35Manufacturing 330 67 204 51Transportation 58 12 2 1Health Service 0 0 17 4
Assemblers 4 1 28 7Construction 38 8 0 0
Garbage Collectors 21 4 0 0Mobile Plant Operators 11 2 0 0
Other B 13 2 7 2

Int. J. Environ. Res. Public Health 2018, 15, 1306 7 of 23
Table 1. Cont.
VariablesMen (N = 495) Women (N = 400)
N % Mean (SD) Range N % Mean (SD) Range
Multisite pain the last 7 days C
No pain 172 35 149 38Pain in one body region 203 41 148 37
Pain in two body regions 80 16 79 20Pain in three body regions 37 8 21 5
SD = standard deviation. BMI = body mass index. A High scores indicate high self-reported health. B Includesgeneral office clerks and other elementary workers. C Body regions are lower back, knees and feet/ankles.
Compositional Descriptive Statistics
The compositional means showed that the majority of work time was spent standing for bothmen and women (Table 2). Most leisure time was spent in bed for both sexes, followed by sedentarybehavior. There was a statistically significant difference between sexes in mean relative time spent onactivities during work (p < 0.001) and leisure time (p < 0.001).
Table 2. Compositional mean for occupational physical activities and leisure time physical activities(in min/day and %).
Physical Activity Men (N = 495) Women (N = 400) F-Test Statistic p-Value
OPA (CM)
Min/day % Min/day %
Walking 87 18 87 18
18.901 <0.001Standing 212 44 258 53
Sitting 177 37 132 28HiPA 4 1 3 1
LTPA (CM)
Min/day % Min/day %
SB 350 36 322 33
14.616 <0.001Walking 42 4 50 5Standing 126 13 150 16
HiPA 3 1 4 1TIB 439 46 434 45
HiPA = high intensity physical activities (stair climbing, running and cycling). OPA = occupational physical activity.LTPA = leisure time physical activity. SB = sedentary behavior (sitting and lying). TIB = time in bed. Difference inOPA and LTPA subcomposition between sexes tested with MANOVA. Time-use of OPA was closed to the workers’average daily work hours (480 min). Time-use of LTPA was closed to workers’ average daily leisure time (960 min).
The compositional variation matrix in Table 3 shows the proportionality associations betweenwork and leisure time activities. For example, for both men and women, standing and walkingduring work were the most associated activities (log-ratio variances τ = 0.23 and τ = 0.19, respectively).The contribution of each activity to the total variance of the subcompositions is shown in Table 3.For example, leisure time HiPA contributed to the highest variation for men (61%) and women (62%),suggesting that leisure time spent on HiPA varied substantially.
3.3. Primary Results
3.3.1. Men
There was a statistically significant positive association between the relative importance of walkingat work and walking at leisure time (β = 0.24, p < 0.01; Table 4) in men. Significant negative associationswere observed between the relative importance of work time spent either standing or on HiPA andleisure time spent walking (β = −0.18, p < 0.01; and β = −0.08, p < 0.01; respectively).

Int. J. Environ. Res. Public Health 2018, 15, 1306 8 of 23
Table 3. Compositional variation matrix for time spent on occupational physical activities and leisure time physical activities.
Compositional Variation Matrix for OPA
Men (N = 495) Women (N = 400)
Walking Standing Sitting HiPA Var-clr (%) Walking Standing Sitting HiPA Var-clr (%)
Walking 0.00 0.35 (22%) 0.00 0.19 (12%)Standing 0.23 0.00 0.13 (8%) 0.19 0.00 0.13 (9%)
Sitting 0.99 1.55 0.00 0.51 (33%) 1.19 1.24 0.00 0.69 (45%)HiPA 0.65 1.23 1.35 0.00 0.57 (37%) 0.70 0.93 1.77 0.00 0.53 (34%)
Total var 1.56 (100%) 1.54 (100%)
Compositional Variation Matrix for LTPA
Men (N = 495) Women (N = 400)
SB Walking Standing HiPA TIB Var-clr (%) SB Walking Standing HiPA TIB Var-clr (%)
SB 0.00 0.21 (13%) 0.00 0.19 (13%)Walking 0.30 0.00 0.13 (8%) 0.25 0.00 0.11 (8%)Standing 0.31 0.16 0.00 0.13 (8%) 0.29 0.12 0.00 0.11 (8%)
HiPA 1.56 1.21 1.25 0.00 1.01 (61%) 1.69 1.31 1.24 0.00 0.88 (62%)TIB 0.12 0.23 0.23 1.52 0.00 0.16 (10%) 0.10 0.19 0.20 1.52 0.00 0.13 (9%)
Total var 1.64 (100%) 1.42 (100%)
HiPA = high intensity physical activities (stair climbing, running and cycling). OPA = occupational physical activity. LTPA = leisure time physical activity. SB = sedentary behavior (sittingand lying). TIB = time in bed. Total var = total variance of the subcomposition; Var-clr (%) = absolute and percentage (%) contribution of each part to the total variance. Values close to 0indicate that two parts are nearly proportional (highly co-dependent) and thus, their log-ratio is nearly constant.
Table 4. Compositional analysis of the association between ilr-coordinates of OPA and LTPA subcompositions among men (N = 495).
OPA
LTPA
ilr(y1)αln (SB: Walk, Stand, HiPA & TIB)
ilr(y1)αln (Walk: Stand, HiPA, SB & TIB)
ilr(y1)αln (Stand: HiPA, SB, Walk & TIB)
ilr(y1)αln (HiPA: SB, Walk, Stand & TIB)
^β1
SE p-Value ^β1
SE p-Value ^β1
SE p-Value ^β1
SE p-Value
ilr(z1)αln (walk: stand, sit & HiPA) −0.06 0.06 0.33 0.24 0.05 <0.01 0.01 0.05 0.81 −0.05 0.15 0.72
ilr(z1)αln (stand: sit, walk & HiPA) 0.03 0.05 0.49 −0.18 0.04 <0.01 −0.01 0.04 0.68 0.05 0.12 0.66
ilr(z1)αln (sit: walk, stand & HiPA) −0.01 0.04 0.75 0.02 0.03 0.58 0.02 0.03 0.56 −0.03 0.09 0.74

Int. J. Environ. Res. Public Health 2018, 15, 1306 9 of 23
Table 4. Cont.
OPA
LTPA
ilr(y1)αln (SB: Walk, Stand, HiPA & TIB)
ilr(y1)αln (Walk: Stand, HiPA, SB & TIB)
ilr(y1)αln (Stand: HiPA, SB, Walk & TIB)
ilr(y1)αln (HiPA: SB, Walk, Stand & TIB)
^β1
SE p-Value ^β1
SE p-Value ^β1
SE p-Value ^β1
SE p-Value
ilr(z1)αln (HiPA: walk, stand & sit) 0.04 0.03 0.14 −0.08 0.02 <0.01 −0.01 0.02 0.53 0.03 0.07 0.61
HiPA = high intensity physical activities (stair climbing, running and cycling). OPA = occupational physical activity. LTPA = leisure time physical activity. SB = sedentary behavior (sittingand lying). SE = standard error. TIB = time in bed. z1 = first ilr-coordinate of the OPA subcomposition. y1 = first ilr-coordinate of the LTPA subcomposition. β1 = beta-coefficient associatedto the first ilr-coordinate of the OPA subcomposition. Models adjusted for age, BMI, shiftwork, pain in back and/or knee and/or hip (multisite pain) and work hours.

Int. J. Environ. Res. Public Health 2018, 15, 1306 10 of 23
The compositional isotemporal substitution analysis revealed that reallocating 15 min of worktime to walking would be associated with an expected increase in leisure time walking of 2 min(Table 5). In contrast, increasing work time spent standing by 15 min would result in an expecteddecrease in leisure time walking of 1 min.
Table 5. Expected difference in LTPA following reallocation between occupational physical activitiesamong men (N = 495).
LTPASB Walk Stand HiPA TIB
min ∆ min ∆ min ∆ min ∆ min ∆
Increasing Occupational Walking
Original OPA composition 251 34 111 5 559+15 min walk 252 1 36 ** 2 113 2 5 0 553 −4+30 min walk 253 2 37 ** 3 115 4 5 0 551 −8+45 min walk 253 2 39 ** 5 116 5 5 0 547 −12+60 min walk 254 3 40 ** 6 117 6 5 0 544 −15
Increasing Occupational Standing
Original OPA composition 251 34 111 5 559+15 min stand 250 −1 33 ** −1 111 0 5 0 562 3+30 min stand 250 −1 32 ** −2 110 −1 5 0 564 5+45 min stand 249 −2 31 ** −3 109 −2 5 0 567 8+60 min stand 248 −3 31 ** −3 108 −3 5 0 569 10
Increasing Occupational Sitting
Original OPA composition 251 34 111 5 559+15 min sit 251 0 34 0 112 1 5 0 559 0+30 min sit 250 −1 34 0 112 1 5 0 559 0+45 min sit 250 −1 34 0 112 1 4 −1 560 1+60 min sit 250 −1 34 0 112 1 4 −1 560 1
HiPA = high intensity physical activities (stair climbing, running and cycling). LTPA = leisure time physicalactivity. OPA = occupational physical activity. SB = sedentary behavior (sitting and lying). TIB = time in bed.Models adjusted for age, BMI, smoking-status, shiftwork, pain in back and/or knee and/or hip (multisite pain) andwork hours. ** p-value < 0.01.
3.3.2. Women
Among women, there was a statistically significant positive association between the relativeimportance of walking during work and the relative importance of sedentary behavior (β = 0.16,p = 0.03; Table 6) and walking (β = 0.12, p = 0.03) at leisure time (Table 6). The relative importance oftime spent standing at leisure time was negatively associated with the relative importance of worktime spent walking (β = −0.16, p = 0.01) and positively associated with the relative importance of worktime spent standing (β = 0.15, p < 0.01). The relative importance of HiPA at work was significantlynegatively associated with the relative importance of sedentary behavior (β = −0.12, p < 0.01) andpositively associated with the relative importance of HiPA (β = 0.28, p < 0.01) during leisure time.
Results of the compositional isotemporal substitution analysis revealed that reallocating 15 minof work time spent walking would be associated with an expected increase in leisure time walking of1 min; an expected increase in leisure time sedentary behavior of 4 min; and an expected decrease inleisure time standing of 7 min (Table 7).
3.4. Sensitivity Analysis
When only including workers within manufacturing in compositional regression analyses,the results were in accordance with those from the primary analysis. This indicates that the sexdifferences observed in associations between OPA and LTPA were not related to occupational sectordifferences in physical activity levels (results shown in Supplementary Tables S1 and S2).

Int. J. Environ. Res. Public Health 2018, 15, 1306 11 of 23
Table 6. Compositional analysis of the association between ilr-coordinates of OPA and LTPA subcompositions among women (N = 400).
OPALTPA
ilr(y1)αln (SB: Walk, Stand, HiPA & TIB)
ilr(y1)αln (Walk: Stand, HiPA, SB & TIB)
ilr(y1)αln (Stand: HiPA, SB, walk & TIB)
ilr(y1)αln (HiPA: SB, Walk, Stand & TIB)
^β1
SE p-Value ^β1
SE p-Value ^β1
SE p-Value ^β1
SE p-Value
ilr(z1)αln (walk: stand, sit & HiPA) 0.16 0.07 0.03 0.12 0.06 0.03 −0.16 0.06 0.01 −0.21 0.16 0.20
ilr(z1)αln (stand: sit, walk & HiPA) −0.05 0.06 0.41 −0.04 0.06 0.52 0.15 0.05 <0.01 −0.03 0.14 0.85
ilr(z1)αln(sit: walk, stand & HiPA) 0.01 0.04 0.86 <0.01 0.03 0.92 0.02 0.03 0.39 −0.05 0.08 0.55
ilr(z1)αln(HiPA: walk, stand & sit) −0.12 0.03 <0.01 −0.04 0.02 0.09 −0.01 0.02 0.59 0.28 0.07 <0.01
HiPA = high intensity physical activities (stair climbing, running and cycling). OPA = occupational physical activity. LTPA = leisure time physical activity. SB = sedentary behavior (sittingand lying). SE = standard error. TIB = time in bed. z1 = first ilr-coordinate of the OPA subcomposition. y1 = first ilr-coordinate of the LTPA subcomposition. β1 = beta-coefficient associatedto the first ilr-coordinate of the OPA subcomposition. Models adjusted for age, BMI, shiftwork, pain in back and/or knee and/or hip (multisite pain) and work hours.
Table 7. Expected difference in LTPA following reallocation between occupational physical activities among women (N = 400).
LTPASB Walk Stand HiPA TIB
min ∆ min ∆ min ∆ min ∆ min ∆
Increasing occupational walking
Original OPA composition 215 63 218 13 450+15 min walk 219 * 4 64 * 1 211 * −7 12 −1 453 3+30 min walk 222 * 7 64 * 1 205 * −13 12 0 456 6+45 min walk 225 * 10 65 * 2 200 * −18 12 0 458 8+60 min walk 228 * 13 66 * 3 195 * −23 11 −1 460 10
Increasing occupational standing
Original OPA composition 215 63 218 13 450+15 min stand 214 −1 62 −1 221 ** 3 13 0 450 0+30 min stand 212 −3 62 −1 224 ** 6 13 0 449 −1+45 min stand 210 −5 61 −2 227 ** 9 13 0 449 −1+60 min stand 209 −6 61 −2 230 ** 12 13 0 448 −2

Int. J. Environ. Res. Public Health 2018, 15, 1306 12 of 23
Table 7. Cont.
LTPASB Walk Stand HiPA TIB
min ∆ min ∆ min ∆ min ∆ min ∆
Increasing occupational sitting
Original OPA composition 215 63 218 13 450+15 min sit 215 0 63 0 219 1 13 0 451 1+30 min sit 215 0 63 0 219 1 13 0 451 1+45 min sit 215 0 63 0 219 1 13 0 451 1+60 min sit 214 −1 63 0 219 1 13 0 451 1
HiPA = high intensity physical activities (stair climbing, running and cycling). LTPA = leisure time physical activity. OPA = occupational physical activity. SB = sedentary behavior(sitting and lying). TIB = time in bed. Models adjusted for age, BMI, smoking-status, shiftwork, pain in back and/or knee and/or hip (multisite pain) and work hours. * p-value < 0.05,** p-value < 0.01.

Int. J. Environ. Res. Public Health 2018, 15, 1306 13 of 23
4. Discussion
In this study, we investigated the association between OPA and LTPA among low SEP men andwomen. Overall, we found statistically significant associations between activities performed duringwork and leisure time for both sexes. However, the expected effect sizes were small. The largest effectswere observed in women, for whom increasing work time walking by 15 min was associated with anincrease in sedentary leisure time of 4 min and a decrease in leisure time standing of 7 min.
A 4 min and 7 min change in sedentary and standing leisure time, respectively, might appear small.However, these changes should be considered in relation to the women’s overall leisure time activities.The elevated risks of cardiovascular and all-cause mortality associated with sedentary behavior aremost pronounced among inactive adults [44–46]. This population of women spent more than half oftheir waking leisure time being sedentary (~61%, Table 2). Consequently, the found combination ofadditional sedentary and reduced standing leisure time could have long-term health implications,potentially increasing the women’s mortality risk [47].
Extensive occupational walking can induce lower-extremity muscular fatigue and pain [15],which is likely to increase the workers’ need to compensate with an inactive leisure time. This wassupported by the observed positive association between occupational walking and sedentary leisuretime in women. Likewise, a study using accelerometer measurements from 445 workers reportedthat those performing more light intensity physical activity during work were less active duringleisure time [21]. However, essential differences in study populations and methodology hinder directcomparison between the current study and Gay et al. [21].
For women, we found a statistically significant positive relationship between relative workand leisure time spent on HiPA (i.e., stair climbing, running and cycling, Table 6). This findingindicates a favorable association between high intensity OPA and LTPA in women. A possibleexplanation is that engaging in small amounts of high intensity physical activities throughoutthe workday does not generate the same level of fatigue as extensive light-intensity occupationalactivity, such as walking. Similarly, a study among 233 workers observed that for every 6 minadditional moderate-to-vigorous physical activity (MVPA) during work, leisure time MVPA increasedby 1 min [24]. However, the beneficial association between HiPA at work and leisure time is possibly aresult of selection, with physically active workers being assigned to the most physically demandingwork tasks. Unfortunately, our regression models showed a poor fit as less than 1% of the workersengaged in more than 15 min work HiPA (data not shown). Therefore, the findings regarding HiPAshould be interpreted with caution.
We found no associations between relative time spent sitting at work and activities performedat leisure time for both sexes (Tables 4 and 6). This did not match with our expectation thatincreasing occupational sitting in workers with manual jobs could be beneficial for fatigue andrecovery, thereby facilitating an active leisure time. Similarly, two studies reported no difference inleisure time sitting or walking between blue-collar workers with high and low occupational sittingtime [23,48]. Nevertheless, the potential of increasing occupational sitting to enhance recovery andenergy for engaging in LTPA in workers with manual jobs needs to be investigated further.
Interestingly, we found dissimilar associations between OPA and LTPA in men and women.In men, OPA was only associated with relative leisure time walking (Table 4) whereas in women,OPA was associated with relative leisure time spent on sedentary behavior, walking and standing(Table 6). To assess if the sex differences in associations between OPA and LTPA were related tooccupational sector, we conducted sensitivity analyses with only manufacturing workers included.These analyses showed results similar to those in our primary analyses, indicating that thediscrepancies in associations between OPA and LTPA in men and women were not related tooccupational sector (results shown in Supplementary Tables S1 and S2). Nevertheless, it is possiblethat the differences by sex in associations between OPA and LTPA are influenced by other factorsrelated to occupation or biological dissimilarities [49–51]. Identifying potential mediators of the effect

Int. J. Environ. Res. Public Health 2018, 15, 1306 14 of 23
of OPA on LTPA is an important next step for determining factors which influence LTPA in low SEPmen and women.
Men and women differed in mean work and leisure time activity profiles (Table 2). Men tendedto spend more relative work time sitting compared with women. By contrast, men tended to spendless relative leisure time walking and standing compared with women. The differences in OPA couldbe related to men and women within the same job category performing different work tasks [52].The dissimilarities in LTPA are possibly reflecting women performing more domestic work, such ascleaning and caring for children. This is in line with previous studies, reporting an unequal distributionof domestic tasks, with the majority being the women’s responsibility [53,54]. Hence, the pattern anddeterminants of OPA and LTPA in low SEP men and women is complex, possibly affected by a networkof conditions and responsibilities at work and leisure.
Strength and Limitations
A major methodological strength of this study was the use of a novel compositional data analysisapproach. Using compositional regression models enabled assessment of the association betweenspecific activities performed during work and leisure time, while accounting for the effects of otheractivities. Moreover, we obtained measurements of physical activities by means of accelerometer and acustom-made Acti4 program, with high sensitivity and specificity [36]. This study population showedphysical activity patterns similar to other low SEP populations [6,55,56]. Accordingly, with somecaution we consider our findings to be generalizable to other groups of low SEP workers within thesame occupations. Finally, OPA and LTPA are closely related to SEP level [6]. Thus, our large studypopulation of low SEP workers limits the possibility of socioeconomic confounding on the associationbetween OPA and LTPA.
A limitation in this study was the low variation in LTPA, which could have attenuated theestimated associations between OPA and LTPA [57]. Accordingly, women in our dataset had alarger variation in both OPA and LTPA compared with men, which could explain that we found thelargest effect sizes in women. Moreover, educational level is a potential confounder of the associationbetween OPA and LTPA in this population of low SEP workers [6]. However, taken the distribution ofskilled/unskilled workers into account did not alter the results (data not shown). Finally, this wasa cross-sectional study and therefore the estimates and predictions found between OPA and LTPAshould be interpreted with care. As with all cross-sectional studies, causal inference is limited and theestimated effect might reflect associations rather than actual causal effects.
5. Conclusions
In this study, we found weak relationships between OPA and LTPA in men. Among women,we found that reallocating 15 min of walking time at work was expected to increase sedentary leisuretime by 4 min and decrease standing leisure time by 7 min. As this group of women engaged in littleLTPA, any additional sedentary leisure time could have severe health implications. Our findings addnew insight to the relationship between physical activities during work and leisure time. Future studiesshould investigate strategies for ensuring work conditions that facilitate a physically active leisuretime in women with manual jobs, for example, breaking up long periods of work time on feet.Moreover, studies assessing potential moderating factors of the association between OPA and LTPA,such as age or physical capacity, are warranted for understanding factors which influence LTPA in lowSEP groups.
Supplementary Materials: The following are available online at http://www.mdpi.com/1660-4601/15/7/1306/s1,Table S1, Compositional linear regression analysis of the association between ilr-coordinates of occupational physicalactivity (OPA) and leisure time physical activity (LTPA) subcompositions among male manufacturers (N = 330),Table S2. Compositional linear regression analysis of the association between ilr-coordinates of occupationalphysical activity (OPA) and leisure time physical activity (LTPA) subcompositions among female manufacturers(N = 204).

Int. J. Environ. Res. Public Health 2018, 15, 1306 15 of 23
Author Contributions: C.L.R. conceived the research idea of the study, conducted the analyses and wasresponsible for interpretation of the results and drafting of the manuscript. J.P.-A. helped plan the study’sanalytic strategy and prepare the method section, tables and supplementary files. A.H. and M.B.J. were principalinvestigators and are responsible for the dataset used in this paper. N.G., A.B., K.N.-N., M.B.J. and A.H. helpedprepare the introduction and discussion sections of the manuscript. All authors have read and commented on thedraft version and approved the final version of the entire manuscript.
Funding: This work was supported by a grant from the Danish government (Satspulje) and by The DanishWorking Environment Research Fund (grant number 20175100213). J. Palarea-Albaladejo was partly supported bythe Scottish Government’s Rural and Environment Science and Analytical Services Division (RESAS) and by theSpanish Ministry of Economy and Competitiveness under the project CODA-RETOS MTM2015-65016-C2-1(2)-R.
Conflicts of Interest: The authors declare no conflict of interest.
Appendix A
The associations between physical activities at work and leisure time were analyzed bymultivariate linear regression models on isometric log-ratio (ilr) coordinates of the 4-part OPA and5-part LTPA subcompositions of low socioeconomic workers.
Following [30,41], for a D − part composition x = (x1, . . . , xD) we can obtain a real vectorz = (z1, z2, . . . , zD−1) of D− 1 ilr-coordinates, where
zj=
√D− j
D− j + 1ln
xj
D−j√
∏Dk=j+1 xk
, j = 1, . . . , D− 1 (A1)
This is a particular choice of ilr-coordinates, recently called pivot coordinates [58], by which allrelative information about the first part of the composition (x1) is included in the first ilr-coordinate(z1). The remaining ilr-coordinates (z2, z3, . . . , zD) contain no information about the first part of thecomposition. This way, z1 represents the relative importance or dominance of the part x1 with respectto an (geometric) average of the remaining parts in the composition. Note that an infinite numberof ilr coordinate systems can be defined; however, they are just geometric rotations from each other.This is a useful property in statistical analysis as it enables to use an arbitrary choice of ilr coordinatesto obtain the required output.
Accordingly, with the objective of investigating the associations between parts of the OPA andLTPA subcompositions, the parts were sequentially rearranged (permuted) within the respectivecompositions to place each one of them at the first position before ilr transformation usingEquation (A1).
For example, for the regression model 1a below, the ilr-coordinates of the 4-part OPAsubcomposition were computed as
z∗1 =√
34 ln(
walkworki3√
standworki∗sitworki
∗HiPAworki
)z∗2 =
√23 ln(
standworki2√
sitworki∗HiPAworki
)z∗3 =
√12 ln(
sitworkiHiPAworki
)
Giving rise to an OPA ilr-coordinate vector ilr(Z) =
z∗1z∗2z∗3
.

Int. J. Environ. Res. Public Health 2018, 15, 1306 16 of 23
The ilr-coordinates of the 5-part LTPA composition for model 1a were computed as
y∗1 =√
45 ln(
SBleisi4√
walkleisi∗standleisi
∗HiPAleisi∗TIBi
)y∗2 =
√34 ln(
walkleisi3√
standleisi∗HiPAleisi
∗TIBi
)y∗3 =
√23 ln(
standleisi2√
HiPAleisi∗TIBi i
)y∗4 =
√12 ln(
HiPAleisiTIBi
)
Giving rise to a LTPA ilr-coordinate vector ilr(Y) =
y∗1y∗2y∗3y∗4
.
The generic compositional linear regression model was then defined as
ilr(Y) = β0 + β′ilr(Z) + covariates + ε = β0 + β1z∗1 + β2z∗2 + β3z∗3 + covariates + ε (A2)
Like in ordinary regression, β0 represents the model intercept; whereas β1, β2 and β3 are theregression coefficients associated to each OPA ilr-coordinate in ilr(Z).
Based on Equation (A2), a total of 16 compositional linear regression models were constructedand fitted as described above, sequentially rearranging the first part of either the OPA or LTPAsubcompositions (note that a model with dominance of LTPA time in bed, TIB, as response variablewas not considered). Thus, permuting the OPA parts we defined models 1 to 4:
Model 1
ilr(Y) = β0 + β1
√34 ln(
walkworki3√
standworki∗sitworki
∗HiPAworki
)+ β2
√23 ln(
standworki2√sitworki∗HiPAworki
)+ β3
√12 ln(
sitworkiHiPAworki
)+ covariates+ ε.
Model 2
ilr(Y) = β0 + β1
√34 ln(
standworki3√
walkworki∗sitworki
∗HiPAworki
)+ β2
√23 ln(
walkworki2√sitworki∗HiPAworki
)+ β3
√12 ln(
sitworkiHiPAworki
)+ covariates+ ε
Model 3
ilr(Y) = β0 + β1
√34 ln(
sitworki3√
walkworki∗standworki
∗HiPAworki
)+ β2
√23 ln(
walkworki2√
standworki∗HiPAworki
)+ β3
√12 ln(
standworkiHiPAworki
)+ covariates + ε
Model 4
ilr(Y) = β0 + β1
√34 ln(
HiPAwork3√
walkworki∗standworki
∗sitworki
)+ β2
√23 ln(
walkworki2√
standworki∗sitworki
)+ β3
√12 ln(
standworkisitworki
)+ covariates + ε
By then re-arranging LTPA parts for each model we obtained versions a, b, c and d:
1. Models 1a, 2a, 3a and 4a used ilr(y∗1)=√
45 ln(
SBleis i4√
walkleis i∗standleis i∗HiPAleis i∗TIBi
).
2. Models 1b, 2b, 3b and 4b used ilr(y∗1)=√
45 ln(
walkleis i4√
standleis i∗HiPAleis i∗SBleis i∗TIBi
).
Int. J. Environ. Res. Public Health 2018, 15, 1306 17 of 23
3. Models 1c, 2c, 3c and 4c used ilr(y∗1)=√
45 ln(
standleis i4√
HiPAleis i∗SBleis i∗walkleis i∗TIBi
).
4. Models 1d, 2d, 3d and 4d used ilr(y∗1)=√
45 ln(
HiPAleis i4√
SBleis i∗walkleis i∗standleis i∗TIBi
).
For each model, the most relevant statistical significance test for our purposes was then performedon the β1 coefficient of the regression models, which accounts for the association between the firstilr-coordinates of the OPA and LTPA subcompositions after accounting for all the other covariates.Importantly, although we focus on β1, all the other ilr-coordinates must be included in the model toaccount for the intrinsic inter-dependences between parts of the respective compositions.
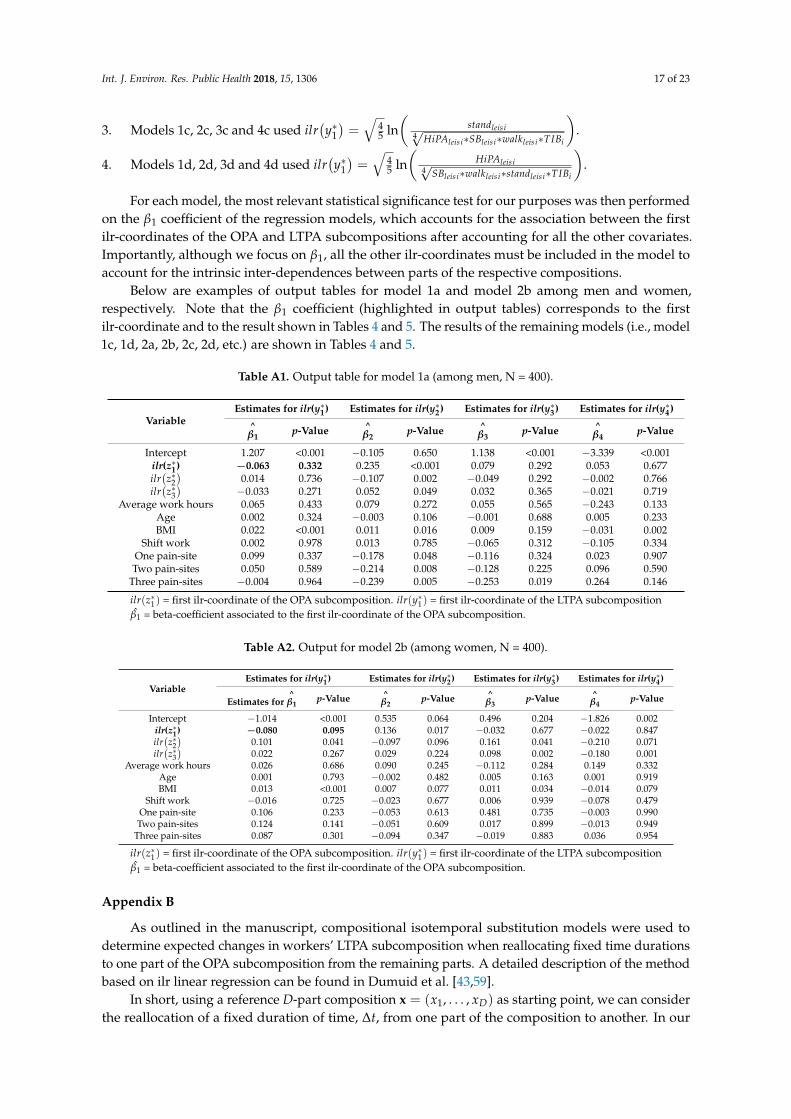
Below are examples of output tables for model 1a and model 2b among men and women,respectively. Note that the β1 coefficient (highlighted in output tables) corresponds to the firstilr-coordinate and to the result shown in Tables 4 and 5. The results of the remaining models (i.e., model1c, 1d, 2a, 2b, 2c, 2d, etc.) are shown in Tables 4 and 5.
Table A1. Output table for model 1a (among men, N = 400).
VariableEstimates for ilr(y∗1) Estimates for ilr(y∗2) Estimates for ilr(y∗3) Estimates for ilr(y∗4)
^β1
p-Value ^β2
p-Value ^β3
p-Value ^β4
p-Value
Intercept 1.207 <0.001 −0.105 0.650 1.138 <0.001 −3.339 <0.001ilr(z∗1) −0.063 0.332 0.235 <0.001 0.079 0.292 0.053 0.677ilr(z∗2)
0.014 0.736 −0.107 0.002 −0.049 0.292 −0.002 0.766ilr(z∗3)
−0.033 0.271 0.052 0.049 0.032 0.365 −0.021 0.719Average work hours 0.065 0.433 0.079 0.272 0.055 0.565 −0.243 0.133
Age 0.002 0.324 −0.003 0.106 −0.001 0.688 0.005 0.233BMI 0.022 <0.001 0.011 0.016 0.009 0.159 −0.031 0.002
Shift work 0.002 0.978 0.013 0.785 −0.065 0.312 −0.105 0.334One pain-site 0.099 0.337 −0.178 0.048 −0.116 0.324 0.023 0.907Two pain-sites 0.050 0.589 −0.214 0.008 −0.128 0.225 0.096 0.590
Three pain-sites −0.004 0.964 −0.239 0.005 −0.253 0.019 0.264 0.146
ilr(z∗1) = first ilr-coordinate of the OPA subcomposition. ilr(y∗1) = first ilr-coordinate of the LTPA subcompositionβ1 = beta-coefficient associated to the first ilr-coordinate of the OPA subcomposition.
Table A2. Output for model 2b (among women, N = 400).
VariableEstimates for ilr(y∗1) Estimates for ilr(y∗2) Estimates for ilr(y∗3) Estimates for ilr(y∗4)
Estimates for^
β1p-Value ^
β2p-Value ^
β3p-Value ^
β4p-Value
Intercept −1.014 <0.001 0.535 0.064 0.496 0.204 −1.826 0.002ilr(z∗1) −0.080 0.095 0.136 0.017 −0.032 0.677 −0.022 0.847ilr(z∗2)
0.101 0.041 −0.097 0.096 0.161 0.041 −0.210 0.071ilr(z∗3)
0.022 0.267 0.029 0.224 0.098 0.002 −0.180 0.001Average work hours 0.026 0.686 0.090 0.245 −0.112 0.284 0.149 0.332
Age 0.001 0.793 −0.002 0.482 0.005 0.163 0.001 0.919BMI 0.013 <0.001 0.007 0.077 0.011 0.034 −0.014 0.079
Shift work −0.016 0.725 −0.023 0.677 0.006 0.939 −0.078 0.479One pain-site 0.106 0.233 −0.053 0.613 0.481 0.735 −0.003 0.990Two pain-sites 0.124 0.141 −0.051 0.609 0.017 0.899 −0.013 0.949
Three pain-sites 0.087 0.301 −0.094 0.347 −0.019 0.883 0.036 0.954
ilr(z∗1) = first ilr-coordinate of the OPA subcomposition. ilr(y∗1) = first ilr-coordinate of the LTPA subcompositionβ1 = beta-coefficient associated to the first ilr-coordinate of the OPA subcomposition.
Appendix B
As outlined in the manuscript, compositional isotemporal substitution models were used todetermine expected changes in workers’ LTPA subcomposition when reallocating fixed time durationsto one part of the OPA subcomposition from the remaining parts. A detailed description of the methodbased on ilr linear regression can be found in Dumuid et al. [43,59].
In short, using a reference D-part composition x = (x1, . . . , xD) as starting point, we can considerthe reallocation of a fixed duration of time, ∆t, from one part of the composition to another. In our

Int. J. Environ. Res. Public Health 2018, 15, 1306 18 of 23
case, the reference composition was equal to the compositional geometric mean of the workers’OPA subcomposition. It was closed to sum up to 1 and hence expressed in proportions to facilitatemanipulations. We can then consider a relative increase in x1 by a factor 1 + r with −1 < r < 1−x1
x1.
To maintain a total sum of 1 when multiplying the first compositional part by the constant (1 + r),the remaining parts were reduced using a factor (1− s), calculated as
s = rx1
1− x1(A3)
Modifying the parameters r and s we can use compositional linear regression models to estimatethe expected LTPA subcomposition from a change in workers’ daily OPA subcomposition.
Example: Expected Change in Leisure Time Sedentary Behavior when Increasing Occupational Walking
The compositional geometric mean of daily activities during work for men (closed to 480 min)was (walking = 87 min; standing = 212 min; sitting = 177 min; HiPA = 4 min).
After closing to 1, this corresponded to the set of proportions [0.181; 0.443; 0.368; 0.008].As proportion walking during work was equal to 0.181, the complementary part of the OPA
subcomposition was equal to 1 − 0.181. The time reallocated to the first part of the compositions mustbe expressed as proportion. Thus, to relatively increase occupational walking by 15 min, we compute
r =15
480x1
=15
4800.181
= 0.172
Using Formula (A3) we obtain
s = 0.1720.181
1− 0.181= 0.038
Multiplying the first part of the OPA subcomposition (i.e., walking) by r = 0.172 and the remainingOPA parts by s = 0.038, we obtained a new OPA subcomposition. This corresponded to OPA timeproportions [0.215; 0.431; 0.339; 0.014]. By closing it to 480 min, we obtained [walking = 102 min;standing = 204 min; sitting = 170 min; HiPA = 4 min].
Then, ilr-coordinates were calculated from this new OPA subcomposition including a 15-minrelocation to occupational walking.
To investigate the effect on LTPA of this move from the reference to the new OPA subcomposition,we first estimated the LTPA subcomposition based on the reference OPA subcomposition using thefollowing ilr multivariate regression model Equation (A3):
ilr(Y) = β0 + β1
√34 ln(
walkworki3√
standworki∗sitworki
∗HiPAworki
)+β2
√23 ln(
standworki2√sitworki∗HiPAworki
)+
β3
√12 ln(
sitworkiHiPAworki
)+ covariates + ε
(A4)
Int. J. Environ. Res. Public Health 2018, 15, 1306 19 of 23
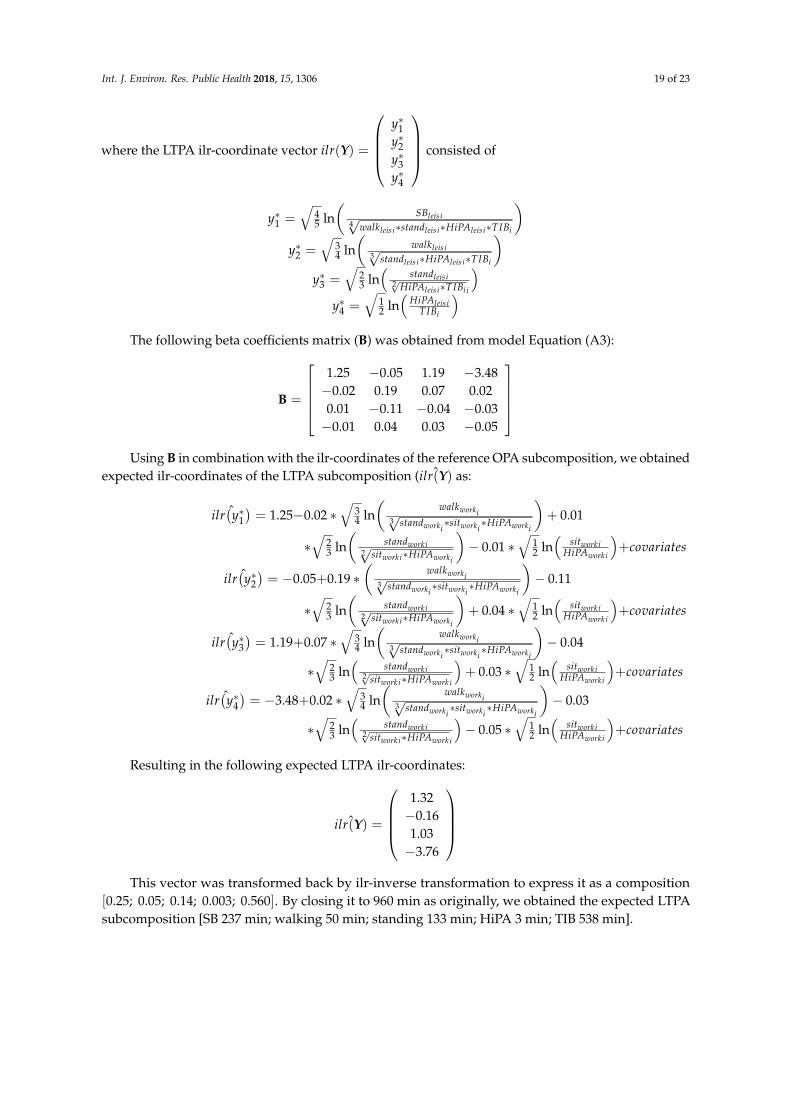
where the LTPA ilr-coordinate vector ilr(Y) =
y∗1y∗2y∗3y∗4
consisted of
y∗1 =√
45 ln(
SBleis i4√
walkleis i∗standleis i∗HiPAleis i∗TIBi
)y∗2 =
√34 ln(
walkleis i3√
standleis i∗HiPAleis i∗TIBi
)y∗3 =
√23 ln(
standleis i2√HiPAleis i∗TIBi i
)y∗4 =
√12 ln(
HiPAleis iTIBi
)The following beta coefficients matrix (B) was obtained from model Equation (A3):
B =
1.25 −0.05 1.19 −3.48−0.02 0.19 0.07 0.020.01 −0.11 −0.04 −0.03−0.01 0.04 0.03 −0.05
Using B in combination with the ilr-coordinates of the reference OPA subcomposition, we obtained
expected ilr-coordinates of the LTPA subcomposition ( ˆilr(Y) as:
ˆilr(y∗1)= 1.25−0.02 ∗
√34 ln(
walkworki3√
standworki∗sitworki
∗HiPAworki
)+ 0.01
∗√
23 ln(
standworki2√
sitworki∗HiPAworki
)− 0.01 ∗
√12 ln(
sitworkiHiPAworki
)+covariates
ˆilr(y∗2)= −0.05+0.19 ∗
(walkworki
3√
standworki∗sitworki
∗HiPAworki
)− 0.11
∗√
23 ln(
standworki2√
sitworki∗HiPAworki
)+ 0.04 ∗
√12 ln(
sitworkiHiPAworki
)+covariates
ˆilr(y∗3)= 1.19+0.07 ∗
√34 ln(
walkworki3√
standworki∗sitworki
∗HiPAworki
)− 0.04
∗√
23 ln(
standworki2√sitworki∗HiPAworki
)+ 0.03 ∗
√12 ln(
sitworkiHiPAworki
)+covariates
ˆilr(y∗4)= −3.48+0.02 ∗
√34 ln(
walkworki3√
standworki∗sitworki
∗HiPAworki
)− 0.03
∗√
23 ln(
standworki2√sitworki∗HiPAworki
)− 0.05 ∗
√12 ln(
sitworkiHiPAworki
)+covariates
Resulting in the following expected LTPA ilr-coordinates:
ˆilr(Y) =
1.32−0.161.03−3.76
This vector was transformed back by ilr-inverse transformation to express it as a composition
[0.25; 0.05; 0.14; 0.003; 0.560]. By closing it to 960 min as originally, we obtained the expected LTPAsubcomposition [SB 237 min; walking 50 min; standing 133 min; HiPA 3 min; TIB 538 min].
Int. J. Environ. Res. Public Health 2018, 15, 1306 20 of 23
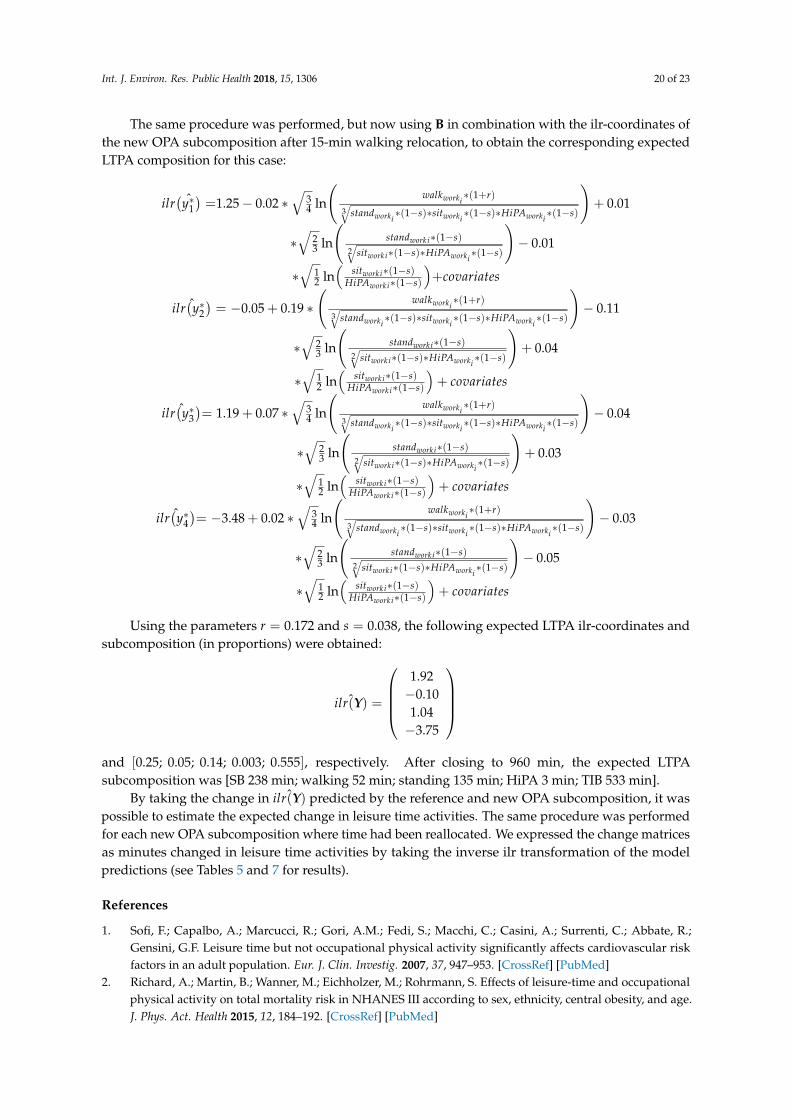
The same procedure was performed, but now using B in combination with the ilr-coordinates ofthe new OPA subcomposition after 15-min walking relocation, to obtain the corresponding expectedLTPA composition for this case:
ˆilr(y∗1)=1.25− 0.02 ∗
√34 ln
(walkworki
∗(1+r)
3√
standworki∗(1−s)∗sitworki
∗(1−s)∗HiPAworki∗(1−s)
)+ 0.01
∗√
23 ln
(standworki∗(1−s)
2√
sitworki∗(1−s)∗HiPAworki∗(1−s)
)− 0.01
∗√
12 ln(
sitworki∗(1−s)HiPAworki∗(1−s)
)+covariates
ˆilr(y∗2)= −0.05 + 0.19 ∗
(walkworki
∗(1+r)
3√
standworki∗(1−s)∗sitworki
∗(1−s)∗HiPAworki∗(1−s)
)− 0.11
∗√
23 ln
(standworki∗(1−s)
2√
sitworki∗(1−s)∗HiPAworki∗(1−s)
)+ 0.04
∗√
12 ln(
sitworki∗(1−s)HiPAworki∗(1−s)
)+ covariates
ˆilr(y∗3)= 1.19 + 0.07 ∗
√34 ln
(walkworki
∗(1+r)
3√
standworki∗(1−s)∗sitworki
∗(1−s)∗HiPAworki∗(1−s)
)− 0.04
∗√
23 ln
(standworki∗(1−s)
2√
sitworki∗(1−s)∗HiPAworki∗(1−s)
)+ 0.03
∗√
12 ln(
sitworki∗(1−s)HiPAworki∗(1−s)
)+ covariates
ˆilr(y∗4)= −3.48 + 0.02 ∗
√34 ln
(walkworki
∗(1+r)
3√
standworki∗(1−s)∗sitworki
∗(1−s)∗HiPAworki∗(1−s)
)− 0.03
∗√
23 ln
(standworki∗(1−s)
2√
sitworki∗(1−s)∗HiPAworki∗(1−s)
)− 0.05
∗√
12 ln(
sitworki∗(1−s)HiPAworki∗(1−s)
)+ covariates
Using the parameters r = 0.172 and s = 0.038, the following expected LTPA ilr-coordinates andsubcomposition (in proportions) were obtained:
ˆilr(Y) =
1.92−0.101.04−3.75
and [0.25; 0.05; 0.14; 0.003; 0.555], respectively. After closing to 960 min, the expected LTPAsubcomposition was [SB 238 min; walking 52 min; standing 135 min; HiPA 3 min; TIB 533 min].
By taking the change in ˆilr(Y) predicted by the reference and new OPA subcomposition, it waspossible to estimate the expected change in leisure time activities. The same procedure was performedfor each new OPA subcomposition where time had been reallocated. We expressed the change matricesas minutes changed in leisure time activities by taking the inverse ilr transformation of the modelpredictions (see Tables 5 and 7 for results).
References
1. Sofi, F.; Capalbo, A.; Marcucci, R.; Gori, A.M.; Fedi, S.; Macchi, C.; Casini, A.; Surrenti, C.; Abbate, R.;Gensini, G.F. Leisure time but not occupational physical activity significantly affects cardiovascular riskfactors in an adult population. Eur. J. Clin. Investig. 2007, 37, 947–953. [CrossRef] [PubMed]
2. Richard, A.; Martin, B.; Wanner, M.; Eichholzer, M.; Rohrmann, S. Effects of leisure-time and occupationalphysical activity on total mortality risk in NHANES III according to sex, ethnicity, central obesity, and age.J. Phys. Act. Health 2015, 12, 184–192. [CrossRef] [PubMed]

Int. J. Environ. Res. Public Health 2018, 15, 1306 21 of 23
3. Smith, A.D.; Crippa, A.; Woodcock, J.; Brage, S. Physical activity and incident type 2 diabetes mellitus:A systematic review and dose-response meta-analysis of prospective cohort studies. Diabetologia 2016, 59,2527–2545. [CrossRef] [PubMed]
4. Mackenbach, J.P.; Stirbu, I.; Roskam, A.-J.R.; Schaap, M.M.; Menvielle, G.; Leinsalu, M.; Kunst, A.E.European Union Working Group on Socioeconomic Inequalities in Health Socioeconomic inequalitiesin health in 22 European countries. N. Engl. J. Med. 2008, 358, 2468–2481. [CrossRef] [PubMed]
5. Marmot, M.; Friel, S.; Bell, R.; Houweling, T.A.; Taylor, S. Closing the gap in a generation: Health equitythrough action on the social determinants of health. Lancet 2008, 372, 1661–1669. [CrossRef]
6. Beenackers, M.A.; Kamphuis, C.B.; Giskes, K.; Brug, J.; Kunst, A.E.; Burdorf, A.; van Lenthe, F.J.Socioeconomic inequalities in occupational, leisure-time, and transport related physical activity amongEuropean adults: A systematic review. J. Behav. Nutr. Phys. Act. 2012. [CrossRef] [PubMed]
7. Owen, N.; Leslie, E.; Salmon, J.; Fotheringham, M.J. Environmental determinants of physical activity andsedentary behavior. Exerc. Sport Sci. Rev. 2000, 28, 153–158. [PubMed]
8. Kohl, H.W.; Craig, C.L.; Lambert, E.V.; Inoue, S.; Alkandari, J.R.; Leetongin, G.; Kahlmeier, S. The pandemicof physical inactivity: Global action for public health. Lancet 2012, 380, 294–305. [CrossRef]
9. Bauman, A.E.; Reis, R.S.; Sallis, J.F.; Wells, J.C.; Loos, R.J.; Martin, B.W. Correlates of physical activity:Why are some people physically active and others not? Lancet 2012, 380, 258–271. [CrossRef]
10. O’Donoghue, G.; Perchoux, C.; Mensah, K.; Lakerveld, J.; van der Ploeg, H.; Bernaards, C.; Chastin, S.F.M.;Simon, C.; OGorman, D.; Nazare, J.-A. A systematic review of correlates of sedentary behaviour in adultsaged 18–65 years: A socio-ecological approach. BMC Public Health 2016, 16, 163. [CrossRef] [PubMed]
11. Kirk, M.A.; Rhodes, R.E. Occupation correlates of adults’ participation in leisure-time physical activity:A systematic review. J. Prev. Med. 2011, 40, 476–485. [CrossRef] [PubMed]
12. Ball, K.; Carver, A.; Downing, K.; Jackson, M.; O’Rourke, K. Addressing the social determinants of inequitiesin physical activity and sedentary behaviours. Health Promot. Int. 2015, 30 (Suppl. 2), ii8–ii19. [CrossRef][PubMed]
13. Smith, L.; McCourt, O.; Sawyer, A.; Ucci, M.; Marmot, A.; Wardle, J.; Fisher, A. A review of occupationalphysical activity and sedentary behaviour correlates. Occup. Med. 2016, 66, 185–192. [CrossRef] [PubMed]
14. Messing, K.; Tissot, F.; Stock, S. Distal Lower-Extremity Pain and Work Postures in the Quebec Population.Am. J. Public Health 2008, 98, 705–713. [CrossRef] [PubMed]
15. Garcia, M.-G.; Wall, R.; Steinhilber, B.; Läubli, T.; Martin, B.J. Long-Lasting Changes in Muscle Twitch ForceDuring Simulated Work While Standing or Walking. Hum. Factors 2016, 58, 1117–1127. [CrossRef] [PubMed]
16. Søgaard, K.; Blangsted, A.K.; Jørgensen, L.V.; Madeleine, P.; Sjøgaard, G. Evidence of long term muscle fatiguefollowing prolonged intermittent contractions based on mechano- and electromyograms. J. Electromyogr. Kinesiol.2003, 13, 441–450. [CrossRef]
17. Yoshino, K.; Motoshige, T.; Araki, T.; Matsuoka, K. Effect of prolonged free-walking fatigue on gait andphysiological rhythm. J. Biomech. 2004, 37, 1271–1280. [CrossRef] [PubMed]
18. Brownson, R.C.; Baker, E.A.; Housemann, R.A.; Brennan, L.K.; Bacak, S.J. Environmental and PolicyDeterminants of Physical Activity in the United States. Am. J. Public Health 2001, 91, 1995–2003. [CrossRef][PubMed]
19. Morassaei, S.; Smith, P.M. Examining the relationship between psychosocial working conditions, physicalwork demands, and leisure time physical activity in Canada. J. Occup. Environ. Med. 2011, 53, 1099–1105.[CrossRef] [PubMed]
20. Chau, J.Y.; van der Ploeg, H.P.; Merom, D.; Chey, T.; Bauman, A.E. Cross-sectional associations betweenoccupational and leisure-time sitting, physical activity and obesity in working adults. Prev. Med. 2012, 54,195–200. [CrossRef] [PubMed]
21. Gay, J.L.; Buchner, D.M.; Smith, J.; He, C. An examination of compensation effects in accelerometer-measuredoccupational and non-occupational physical activity. Prev. Med. Rep. 2017, 8, 55–59. [CrossRef] [PubMed]
22. Kruger, J.; Yore, M.M.; Ainsworth, B.E.; Macera, C.A. Is participation in occupational physical activityassociated with lifestyle physical activity levels? J. Occup. Environ. Med. 2006, 48, 1143–1148. [CrossRef][PubMed]
23. Vandelanotte, C.; Duncan, M.J.; Short, C.; Rockloff, M.; Ronan, K.; Happell, B.; Di Milia, L. Associations betweenoccupational indicators and total, work-based and leisure-time sitting: A cross-sectional study. BMC Public Health2013, 13, 1110. [CrossRef] [PubMed]

Int. J. Environ. Res. Public Health 2018, 15, 1306 22 of 23
24. JaKa, M.M.; Haapala, J.L.; Wolfson, J.; French, S.A. Describing the relationship between occupational andnon-occupational physical activity using objective measurement. Prev. Med. Rep. 2015, 2, 213–217. [CrossRef][PubMed]
25. Prince, S.A.; Adamo, K.B.; Hamel, M.E.; Hardt, J.; Gorber, S.C.; Tremblay, M. A comparison of direct versusself-report measures for assessing physical activity in adults: A systematic review. Int. J. Behav. Nutr. Phys. Act.2008, 5, 56. [CrossRef] [PubMed]
26. Berntsen, S.; Hageberg, R.; Aandstad, A.; Mowinckel, P.; Anderssen, S.A.; Carlsen, K.-H.; Andersen, L.B.Validity of physical activity monitors in adults participating in free-living activities. Br. J. Sports Med. 2010, 44,657–664. [CrossRef] [PubMed]
27. Chau, J.Y. Cross-sectional associations of total sitting and leisure screen time with cardiometabolic risk inadults. Results from the HUNT Study, Norway. J. Sci. Med. Sport 2014, 17, 78–84. [CrossRef] [PubMed]
28. Pedišic, Ž. Measurement issues and poor adjustments for physical activity and sleep undermine sedentarybehaviour research—The focus should shift to the balance between sleep, sedentary behaviour, standing andactivity. Kinesiology 2014, 46, 135–146.
29. Pedišic, Ž.; Dumuid, D.; Olds, T.S. Integrating sleep, sedentary behaviour, and physical activity researchin the emerging field of time-use epidemiology: Definitions, concepts, statistical methods, theoreticalframework, and future directions. Kinesiol. Int. J. Fundam. Appl. Kinesiol. 2017, 49, 252–269.
30. Chastin, S.F.M.; Palarea-Albaladejo, J.; Dontje, M.L.; Skelton, D.A. Combined Effects of Time Spent inPhysical Activity, Sedentary Behaviors and Sleep on Obesity and Cardio-Metabolic Health Markers: A NovelCompositional Data Analysis Approach. PLoS ONE 2015, 10, e0139984. [CrossRef] [PubMed]
31. Aitchson, J. The Statistical Analysis of Compositional Data; Chapman and Hall: London, UK, 1986;ISBN 978-0-412-28060-3.
32. Pawlowsky-Glahn, V.; Egozcue, J.J.; Tolosana-Delgado, R. Modeling and Analysis of Compositional Data;John Wiley & Sons: Hoboken, NJ, USA, 2015; ISBN 978-1-119-00313-7.
33. Jørgensen, M.B.; Korshøj, M.; Lagersted-Olsen, J.; Villumsen, M.; Mortensen, O.S.; Skotte, J.; Søgaard, K.;Madeleine, P.; Thomsen, B.L.; Holtermann, A. Physical activities at work and risk of musculoskeletalpain and its consequences: Protocol for a study with objective field measures among blue-collar workers.BMC Musculoskelet. Disord. 2013, 14, 213. [CrossRef] [PubMed]
34. Gupta, N.; Jensen, B.S.; Søgaard, K.; Carneiro, I.G.; Christiansen, C.S.; Hanisch, C.; Holtermann, A.Face Validity of the Single Work Ability Item: Comparison with Objectively Measured Heart Rate Reserveover Several Days. Int. J. Environ. Res. Public Health 2014, 11, 5333–5348. [CrossRef] [PubMed]
35. Software|ActiGraph. Available online: http://actigraphcorp.com/support/software/ (accessed on20 December 2016).
36. Skotte, J.; Korshøj, M.; Kristiansen, J.; Hanisch, C.; Holtermann, A. Detection of physical activity types usingtriaxial accelerometers. J. Phys. Act. Health 2014, 11, 76–84. [CrossRef] [PubMed]
37. Stemland, I.; Ingebrigtsen, J.; Christiansen, C.S.; Jensen, B.R.; Hanisch, C.; Skotte, J.; Holtermann, A. Validity ofthe Acti4 method for detection of physical activity types in free-living settings: Comparison with video analysis.Ergonomics 2015, 58, 953–965. [CrossRef] [PubMed]
38. R Core Team. R: A Language and Environment for Statistical Computing; R Foundation for Statistical Computing:Vienna, Austria, 2017.
39. Van den Boogaart, K.G.; Tolosana-Delgado, R. “compositions”: A unified R package to analyze compositionaldata. Comput. Geosci. 2008, 34, 320–338. [CrossRef]
40. Templ, M.; Hron, K.; Filzmoser, P. robCompositions: An R-package for Robust Statistical Analysis ofCompositional Data. In Compositional Data Analysis; Pawlowsky-Glahn, V., Buccianti, A., Eds.; John Wiley &Sons, Ltd.: Hoboken, NJ, USA, 2011; pp. 341–355, ISBN 978-1-119-97646-2.
41. Hron, K.; Filzmoser, P.; Thompson, K. Linear regression with compositional explanatory variables. J. Appl. Stat.2012, 39, 1115–1128. [CrossRef]
42. Pawlowsky-Glahn, V.; Egozcue, J.J.; Lovell, D. Tools for compositional data with a total. Stat. Model. 2015, 15,175–190. [CrossRef]
43. Dumuid, D.; Pedišic, Ž.; Stanford, T.E.; Martín-Fernández, J.-A.; Hron, K.; Maher, C.A.; Lewis, L.K.; Olds, T.The compositional isotemporal substitution model: A method for estimating changes in a health outcomefor reallocation of time between sleep, physical activity and sedentary behaviour. Stat. Methods Med. Res.2017. [CrossRef] [PubMed]

Int. J. Environ. Res. Public Health 2018, 15, 1306 23 of 23
44. Matthews, C.E.; Moore, S.C.; Sampson, J.; Blair, A.; Xiao, Q.; Keadle, S.K.; Hollenbeck, A.; Park, Y. MortalityBenefits for Replacing Sitting Time with Different Physical Activities. Med. Sci. Sports Exerc. 2015, 47, 1833–1840.[CrossRef] [PubMed]
45. Stamatakis, E.; Rogers, K.; Ding, D.; Berrigan, D.; Chau, J.; Hamer, M.; Bauman, A. All-cause mortality effectsof replacing sedentary time with physical activity and sleeping using an isotemporal substitution model:A prospective study of 201,129 mid-aged and older adults. Int. J. Behav. Nutr. Phys. Act. 2015, 12, 121. [CrossRef][PubMed]
46. Ekelund, U.; Steene-Johannessen, J.; Brown, W.J.; Fagerland, M.W.; Owen, N.; Powell, K.E.; Bauman, A.;Lee, I.-M. Does physical activity attenuate, or even eliminate, the detrimental association of sitting time withmortality? A harmonised meta-analysis of data from more than 1 million men and women. Lancet 2016, 388,1302–1310. [CrossRef]
47. Villablanca, P.A.; Alegria, J.R.; Mookadam, F.; Holmes, D.R.; Wright, R.S.; Levine, J.A. Nonexercise ActivityThermogenesis in Obesity Management. Mayo Clin. Proc. 2015, 90, 509–519. [CrossRef] [PubMed]
48. Tigbe, W.W.; Lean, M.E.J.; Granat, M.H. A physically active occupation does not result in compensatoryinactivity during out-of-work hours. Prev. Med. 2011, 53, 48–52. [CrossRef] [PubMed]
49. Nordander, C.; Ohlsson, K.; Balogh, I.; Hansson, G.-A.; Axmon, A.; Persson, R.; Skerfving, S. Genderdifferences in workers with identical repetitive industrial tasks: Exposure and musculoskeletal disorders.Int. Arch. Occup. Environ. Health 2008, 81, 939–947. [CrossRef] [PubMed]
50. Côté, J.N. A critical review on physical factors and functional characteristics that may explain a sex/genderdifference in work-related neck/shoulder disorders. Ergonomics 2012, 55, 173–182. [CrossRef] [PubMed]
51. Makinen, T.; Kestila, L.; Borodulin, K.; Martelin, T.; Rahkonen, O.; Leino-Arjas, P.; Prattala, R. Occupationalclass differences in leisure-time physical inactivity—Contribution of past and current physical workload andother working conditions. Scand. J. Work Environ. Health 2010, 36, 62–70. [CrossRef] [PubMed]
52. Eng, A.; Mannetje, A.; McLean, D.; Ellison-Loschmann, L.; Cheng, S.; Pearce, N. Gender differences inoccupational exposure patterns. Occup. Environ. Med. 2011, 68, 888–894. [CrossRef] [PubMed]
53. Chu, A.H.Y.; Moy, F.M. Associations of occupational, transportation, household and leisure-time physicalactivity patterns with metabolic risk factors among middle-aged adults in a middle-income country.Prev. Med. 2013, 57, S14–S17. [CrossRef] [PubMed]
54. Huerta, J.M.; Chirlaque, M.D.; Tormo, M.J.; Buckland, G.; Ardanaz, E.; Arriola, L.; Gavrila, D.; Salmerón, D.;Cirera, L.; Carpe, B.; et al. Work, household, and leisure-time physical activity and risk of mortality in theEPIC-Spain cohort. Prev. Med. 2016, 85, 106–112. [CrossRef] [PubMed]
55. Steeves, J.A.; Tudor-Locke, C.; Murphy, R.A.; King, G.A.; Fitzhugh, E.C.; Harris, T.B. Classification ofoccupational activity categories using accelerometry: NHANES 2003–2004. Int. J. Behav. Nutr. Phys. Act.2015, 12, 89. [CrossRef] [PubMed]
56. Saidj, M.; Menai, M.; Charreire, H.; Weber, C.; Enaux, C.; Aadahl, M.; Kesse-Guyot, E.; Hercberg, S.; Simon, C.;Oppert, J.-M. Descriptive study of sedentary behaviours in 35,444 French working adults: Cross-sectionalfindings from the ACTI-Cités study. BMC Public Health 2015, 15, 379. [CrossRef] [PubMed]
57. Riazi, A.M. The Routledge Encyclopedia of Research Methods in Applied Linguistics; Routledge: London, UK,2016; ISBN 978-1-317-32603-8.
58. Hron, K.; Filzmoser, P.; de Caritat, P.; Fišerová, E.; Gardlo, A. Weighted Pivot Coordinates for CompositionalData and Their Application to Geochemical Mapping. Math. Geosci. 2017, 49, 797–814. [CrossRef]
59. Dumuid, D.; Stanford, T.E.; Martin-Fernández, J.-A.; Pedišic, Ž.; Maher, C.A.; Lewis, L.K.; Hron, K.;Katzmarzyk, P.T.; Chaput, J.-P.; Fogelholm, M.; et al. Compositional data analysis for physical activity,sedentary time and sleep research. Stat. Methods Med. Res. 2017. [CrossRef] [PubMed]
© 2018 by the authors. Licensee MDPI, Basel, Switzerland. This article is an open accessarticle distributed under the terms and conditions of the Creative Commons Attribution(CC BY) license (http://creativecommons.org/licenses/by/4.0/).