Embed Size (px)
Citation preview
40F I S C A L 2 0 1 2 A N N U A L R E P O R T A N D 1 0 - K
Forty
Years
and
Just
Getting
iStarted
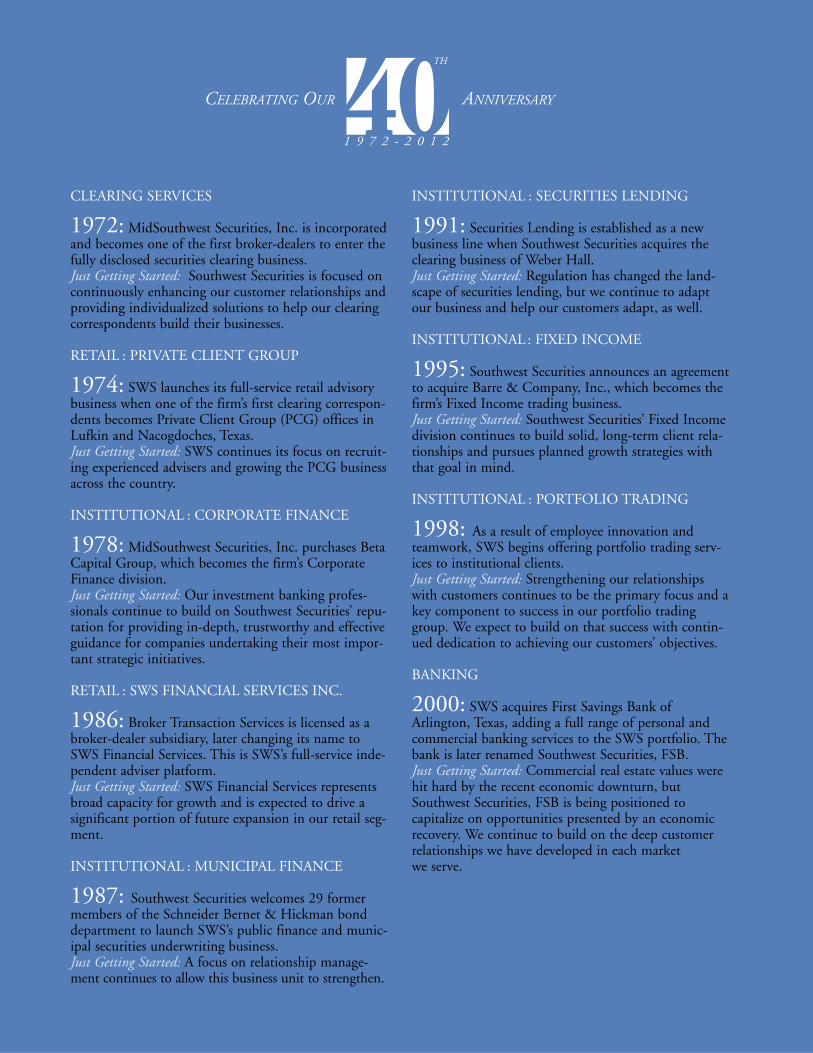
CLEARING SERVICES
1972: MidSouthwest Securities, Inc. is incorporatedand becomes one of the first broker-dealers to enter thefully disclosed securities clearing business.Just Getting Started: Southwest Securities is focused oncontinuously enhancing our customer relationships andproviding individualized solutions to help our clearingcorrespondents build their businesses.
RETAIL : PRIVATE CLIENT GROUP
1974: SWS launches its full-service retail advisorybusiness when one of the firm’s first clearing correspon-dents becomes Private Client Group (PCG) offices inLufkin and Nacogdoches, Texas.Just Getting Started: SWS continues its focus on recruit-ing experienced advisers and growing the PCG businessacross the country.
INSTITUTIONAL : CORPORATE FINANCE
1978: MidSouthwest Securities, Inc. purchases BetaCapital Group, which becomes the firm’s CorporateFinance division.Just Getting Started: Our investment banking profes-sionals continue to build on Southwest Securities’ repu-tation for providing in-depth, trustworthy and effectiveguidance for companies undertaking their most impor-tant strategic initiatives.
RETAIL : SWS FINANCIAL SERVICES INC.
1986: Broker Transaction Services is licensed as abroker-dealer subsidiary, later changing its name toSWS Financial Services. This is SWS’s full-service inde-pendent adviser platform.Just Getting Started: SWS Financial Services representsbroad capacity for growth and is expected to drive asignificant portion of future expansion in our retail seg-ment.
INSTITUTIONAL : MUNICIPAL FINANCE
1987: Southwest Securities welcomes 29 formermembers of the Schneider Bernet & Hickman bonddepartment to launch SWS’s public finance and munic-ipal securities underwriting business.Just Getting Started: A focus on relationship manage-ment continues to allow this business unit to strengthen.
INSTITUTIONAL : SECURITIES LENDING
1991: Securities Lending is established as a newbusiness line when Southwest Securities acquires theclearing business of Weber Hall.Just Getting Started: Regulation has changed the land-scape of securities lending, but we continue to adaptour business and help our customers adapt, as well.
INSTITUTIONAL : FIXED INCOME
1995: Southwest Securities announces an agreementto acquire Barre & Company, Inc., which becomes thefirm’s Fixed Income trading business.Just Getting Started: Southwest Securities’ Fixed Incomedivision continues to build solid, long-term client rela-tionships and pursues planned growth strategies withthat goal in mind.
INSTITUTIONAL : PORTFOLIO TRADING
1998: As a result of employee innovation andteamwork, SWS begins offering portfolio trading serv-ices to institutional clients.Just Getting Started: Strengthening our relationshipswith customers continues to be the primary focus and akey component to success in our portfolio tradinggroup. We expect to build on that success with contin-ued dedication to achieving our customers’ objectives.
BANKING
2000: SWS acquires First Savings Bank ofArlington, Texas, adding a full range of personal andcommercial banking services to the SWS portfolio. Thebank is later renamed Southwest Securities, FSB.Just Getting Started: Commercial real estate values werehit hard by the recent economic downturn, butSouthwest Securities, FSB is being positioned to capitalize on opportunities presented by an economicrecovery. We continue to build on the deep customerrelationships we have developed in each market we serve.
CELEBRATING OUR ANNIVERSARY
1 9 7 2 - 2 0 1 2
TH
F I N A N C I A L H I G H L I G H T S
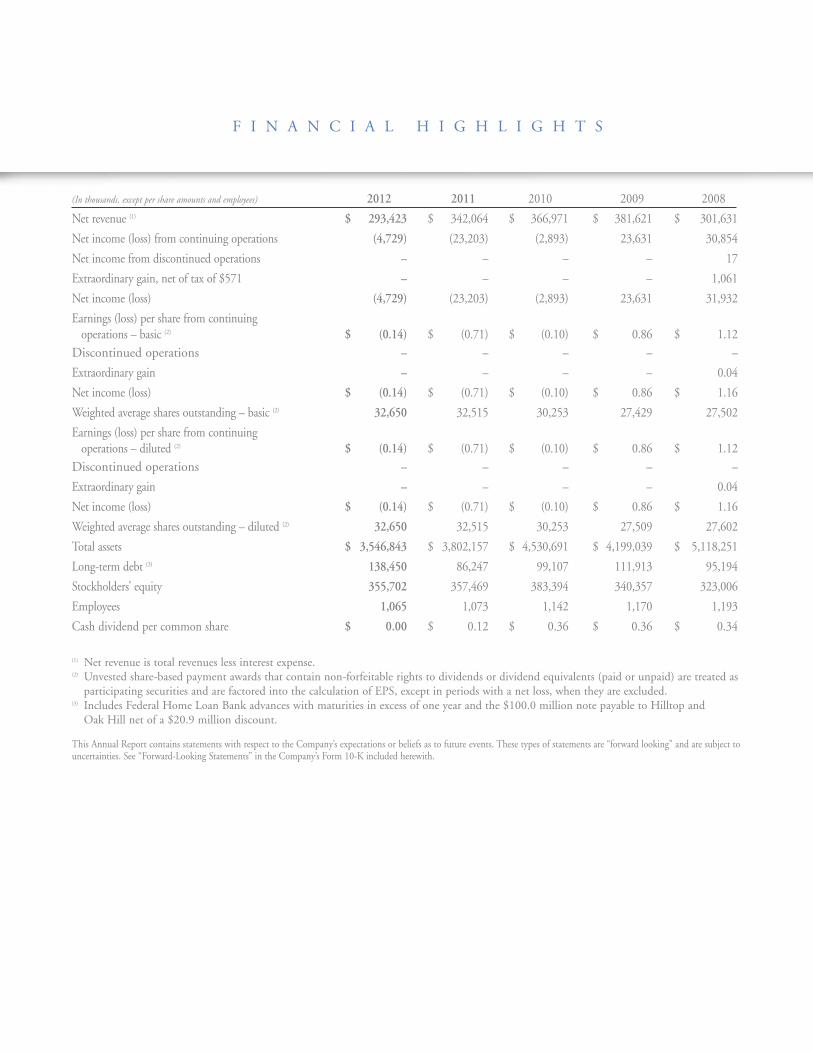
(In thousands, except per share amounts and employees) 2012 2011 2010 2009 2008
Net revenue (1) $ 293,423 $ 342,064 $ 366,971 $ 381,621 $ 301,631
Net income (loss) from continuing operations (4,729) (23,203) (2,893) 23,631 30,854
Net income from discontinued operations – – – – 17
Extraordinary gain, net of tax of $571 – – – – 1,061
Net income (loss) (4,729) (23,203) (2,893) 23,631 31,932
Earnings (loss) per share from continuing operations – basic (2) $ (0.14) $ (0.71) $ (0.10) $ 0.86 $ 1.12
Discontinued operations – – – – –
Extraordinary gain – – – – 0.04
Net income (loss) $ (0.14) $ (0.71) $ (0.10) $ 0.86 $ 1.16
Weighted average shares outstanding – basic (2) 32,650 32,515 30,253 27,429 27,502
Earnings (loss) per share from continuing operations – diluted (2) $ (0.14) $ (0.71) $ (0.10) $ 0.86 $ 1.12
Discontinued operations – – – – –
Extraordinary gain – – – – 0.04
Net income (loss) $ (0.14) $ (0.71) $ (0.10) $ 0.86 $ 1.16
Weighted average shares outstanding – diluted (2) 32,650 32,515 30,253 27,509 27,602
Total assets $ 3,546,843 $ 3,802,157 $ 4,530,691 $ 4,199,039 $ 5,118,251
Long-term debt (3) 138,450 86,247 99,107 111,913 95,194
Stockholders’ equity 355,702 357,469 383,394 340,357 323,006
Employees 1,065 1,073 1,142 1,170 1,193
Cash dividend per common share $ 0.00 $ 0.12 $ 0.36 $ 0.36 $ 0.34
(1) Net revenue is total revenues less interest expense.(2) Unvested share-based payment awards that contain non-forfeitable rights to dividends or dividend equivalents (paid or unpaid) are treated as
participating securities and are factored into the calculation of EPS, except in periods with a net loss, when they are excluded.(3) Includes Federal Home Loan Bank advances with maturities in excess of one year and the $100.0 million note payable to Hilltop and
Oak Hill net of a $20.9 million discount.
This Annual Report contains statements with respect to the Company’s expectations or beliefs as to future events. These types of statements are “forward looking” and are subject touncertainties. See “Forward-Looking Statements” in the Company’s Form 10-K included herewith.
During fiscal 2012, we proudly celebrat-
ed SWS Group’s 40th anniversary and we did
so with our eyes clearly focused on the
opportunities that lie ahead. In many ways,
we are just getting started. There is no better
way to honor the past than by looking to the
future and charting new paths to success.
While this year was a time to remember
where we have been, it was also a time to
take the next step as a thriving regional
financial services firm.
We ended the 2012 fiscal year with
$293.4 million in net revenues and reported
a net loss of $4.7 million, or 14 cents per
diluted share, compared to a net loss of
$23.2 million, or 71 cents per diluted
share, on net revenues of $342.1 million in
fiscal 2011.
We are encouraged by the improvement
in our financial performance in spite of the
challenging market conditions that persisted
throughout the year. At a time of national
unemployment above 8 percent and sluggish
economic growth, we were still able to take
important steps to position SWS Group for
long-term growth. While it is important to
acknowledge the progress we have made in
strengthening both our banking and broker-
dealer operations, we also recognize that
much work remains to be done.
In the years since the firm was founded,
there have been countless changes at SWS
Group. Yet through each challenge, accom-
plishment and fluctuating market cycle, one
thing has never changed. Our commitment
to building long-term customer relationships
based upon trust and service remains at the
core of everything we do and is as strong
today as it was 40 years ago. The strength of
SWS’s diverse business model allows us to
adapt to market conditions and deploy effec-
tive strategies to best serve our customers.
The leadership and guidance of SWS
Group’s Board of Directors has been crucial
as we develop and execute the firm’s strategic
plan for the future. Gerald J. Ford and J.
Taylor Crandall joined the Board in the first
quarter of fiscal 2012 following the comple-
tion of our $100 million capital raise. In
November 2011, long-time Director
Frederick R. Meyer was elected Chairman of
the Board and we also welcomed two new
Directors, Christie S. Flanagan and Tyree
B. “Ty” Miller. This brought our total
number of Directors to 11, eight of whom
are independent.
The talented business leaders and
employees of SWS Group are the driving
Taking the Next Step
L E T T E R T O O U R S H A R E H O L D E R S

force behind our success, and their continued
hard work and innovation are opening new
doors for our firm and clients. Because of
them, we are uniquely positioned to capital-
ize on opportunities in both new and existing
markets.
Robert Chereck joined Southwest
Securities, FSB as Executive Chairman and
President in fiscal 2012 and brings over
40 years of experience to the role. We also
welcomed banking veteran Lacy Newman as
Chief Credit Officer to focus on coordinat-
ing the people, processes and procedures that
will drive the Bank’s future success. Under
the new management team’s leadership,
Southwest Securities, FSB has made signifi-
cant progress in reducing the level of classi-
fied assets and is now actively working to
expand its lending efforts throughout the
markets we serve.
We are also focused on growing our
Broker-Dealer business units and saw
renewed traction in both Retail and
Institutional recruiting during fiscal 2012.
We have an accomplished, experienced
leadership team in place to oversee each of
our segments and they will be working to
increase efficiency and build momentum
across all of our business lines in the
coming year.
We can look back on our 40th anniver-
sary with tremendous pride in the progress
we have made and the positive changes with-
in the firm during fiscal 2012. We continue
to build on our strengths and the solid
reputation we have earned over our first four
decades as a reliable and responsive financial
services provider. By remaining true to our
core values and keeping our focus on the
future, SWS Group is poised to thrive for the
next 40 years and beyond.
James H. Ross
President & Chief Executive Officer
RETAIL:
Our retail segment’s ardent commitment
to the adviser and client experience is our top
differentiator. Retail combines the energy and
talents of the Private
Client Group, SWS
Financial Services,
Strategic Asset Group,
Investment
Management Group
and Southwest
Insurance Agency. In
fiscal 2012, these
business units devel-
oped a unified message
and vision drawn from
our experiences over the past 40 years. This
vision is focused on accelerated growth
opportunities for our advisers, clients and our
communities.
PRIVATE CLIENT GROUP (PCG) pursues
every opportunity to strengthen the markets
we serve. The managers of each PCG office
are SWS ambassadors and serve as communi-
ty and business leaders. The successful,
experienced financial advisers located in each
market demonstrate our managers’ effective
leadership. This unique environment pro-
vides a thriving office atmosphere that allows
clients to focus on building what they value.
PCG offices are located in California,
Nevada, Oklahoma and Texas.
SWS FINANCIAL SERVICES provides a full-
service platform for independent advisers.
The advisers are located in cities and towns
across the country where they focus on
building relationships with clients most
likely to benefit from their approach to
financial planning.
Through our STRATEGIC ASSET GROUP,
SWS’s retail clients have the opportunity to
diversify their portfolios through futures,
managed futures, commodities, precious
metals and other alternative investments.
INVESTMENT MANAGEMENT GROUP is the
investment advisory division of the firm. This
group administers and markets the managed
account platform for both PCG and SWS
Financial Services, and also provides adminis-
trative services for many of our clearing
correspondent firms.
SOUTHWEST INSURANCE AGENCY (SWIA)
is the liaison between insurance providers
and our retail advisers. SWIA assists advisers
by closely reviewing individual clients’
circumstances to provide them with a broad
range of insurance products to meet their
investment objectives.
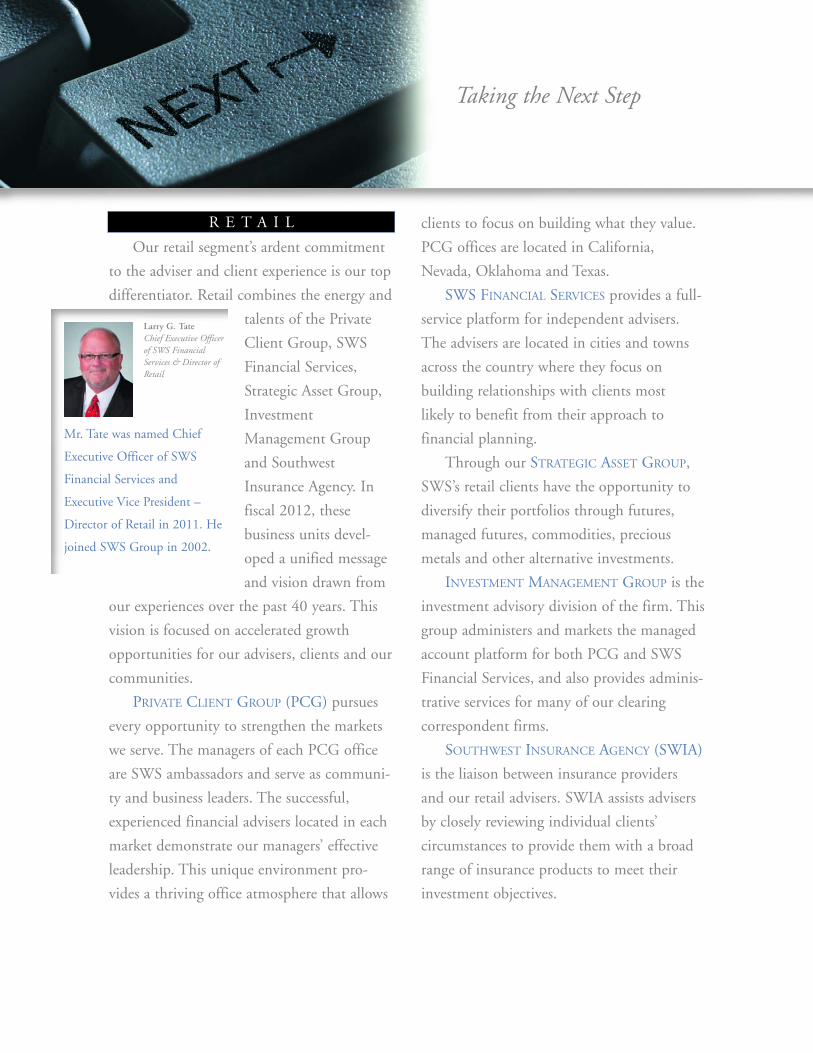
R E T A I L
Larry G. TateChief Executive Officerof SWS FinancialServices & Director ofRetail
Mr. Tate was named Chief
Executive Officer of SWS
Financial Services and
Executive Vice President –
Director of Retail in 2011. He
joined SWS Group in 2002.
Taking the Next Step

We continue to excel in building value
for our clients by providing innovative
products, services, and technology. By
strengthening existing relationships with
advisers and clients, and starting new
conversations in each of our markets, we look
forward to growing all areas of our Retail
Brokerage segment in the coming year.
When Southwest Securities was founded
in 1972, the firm became a pioneer in the
fully-disclosed securities clearing business.
As we celebrate our 40th anniversary,
Clearing Services remains a key part of what
we do today.
Throughout the years, we have built deep
client relationships with our correspondent
broker-dealers and we pride ourselves on
delivering the responsive personal service
they need to help them best manage and
grow their businesses. The strength of these
relationships – many going back decades –
has allowed us to retain business that might
otherwise have been lost as brokers and
correspondents exited the industry or transi-
tioned to new firms during recent turbulent
market conditions.
Southwest Securities is actively working
to build on this loyal customer base, whether
through recruiting new correspondents, or
through targeted acquisitions should the
right opportunity present itself. In fiscal
2012, we welcomed several new correspon-
dents and plan to continue this record of
success in the year ahead.
At the same time, we
have taken steps to boost
efficiency by expanding
our use of internal
business intelligence and
analysis. This allows us to
pinpoint areas where we
can work more closely
with our correspondents
to mutually enhance our
business.
We continue to actively seek input from
our customers in order to best provide them
with the products and services they need in
order to succeed. By cultivating open com-
munication and sharing business intelligence,
we are able to continue to deliver the level of
service that has defined Southwest Securities’
Clearing Services over the past 40 years.
C L E A R I N G
Anton BerendsSenior VicePresident – Head ofClearing Services
Mr. Berends was named Head
of Clearing Services in 2012,
where he also oversees the
securities lending business. He
joined SWS Group in 1999.

Our TAXABLE FIXED INCOME business
continues to add seasoned personnel in its
offices across the
country, while also
expanding its extensive
product offering.
Southwest Securities
is an active participant
in underwriting, sales
and trading of a broad
range of fixed income
securities including
corporate bonds,
mortgage-backed and asset-backed securities,
U.S. government agency securities and
structured products.
We remain on the forefront of new
technology and are extremely active in
employing electronic trading, utilizing both
institutional and retail platforms.
Some of fiscal 2012’s most robust growth
occurred in our New York office, where we
expanded our rates desk, adding dealer sales,
and hired experienced senior management to
drive future growth in all areas. We also
opened a new office in Austin, Texas and
plan to continue our successful push to
recruit talented sales people and traders
nationwide. In addition to Texas and New
York, we have locations in California,
Colorado, Connecticut, Florida, Illinois,
and New Jersey.
Our taxable fixed income division is also
expanding the products offered through its
retail platform to provide new opportunities
for SWS’s retail advisers and clients. These
products include unit investment trusts,
certificates of deposit, preferred securities and
closed-end funds.
Our MUNICIPAL FINANCE division
remains one of the firm’s most important
business lines. During this fiscal year, more
than 25,000 of our
customer accounts held
municipal securities val-
ued at nearly $9 billion.
Texas and California are
our lead states.
Secondary market
makers at the firm han-
dled more than 497,000
trades with 41,000
accounts valued at
$101 billion.
Municipal new issue
financings handled by
the firm during the last
three years now exceeds $150 billion in more
than 1,600 separate transactions including
500 as financial adviser. Our financial
advisory practice in the Southwest and
I N S T I T U T I O N A L
Richard H. LittonExecutive VicePresident –Manager ofMunicipal Finance
Mr. Litton joined SWS as an
Executive Vice President and
Manager of Municipal Finance
in 1995. He is an industry
veteran who has served as
manager of, or assisted in,
more than 2,000 financings
with a par amount in excess
of $100 billion.
Daniel R. LelandExecutive VicePresident – Head ofTaxable FixedIncome
Mr. Leland joined the firm
in 1995 as Executive Vice
President in the firm’s Fixed
Income Division. He has
30 years of experience in
the industry.
Taking the Next Step

Southeast was significantly impacted in
January of 2012 with the addition of staff in
South Carolina and Kentucky solidifying the
national ranking of SWS in this particular
arena. Indeed, 40 years and running!
The highly-skilled personnel in
Southwest Securities’ AGENCY TRADING
department provide support for equity and
options trading. While most trades are fully
automated, the team is also able to deliver
the specialized service required for larger and
more complex orders. All processes are
regularly monitored to ensure smooth order
flow and best execution through a diverse
group of market centers.
Southwest Securities’ PORTFOLIO
TRADING department utilizes a customizable,
algorithmic-based trading platform backed by
a highly experienced trading staff to ensure
reliable personal service when executing
trades for institutional clients. We are actively
expanding our customer base and remain
focused on building long-term, value-added
client relationships.
The experienced team in our SECURITIES
LENDING department continues to strengthen
client relationships and apply new automa-
tion to grow this business. While we trade in
a large range of equities, we specialize in
hard-to-borrow securities and closely monitor
available inventory to maximize efficiency,
build supply and increase revenue. Securities
Lending promises to remain an important
core business for SWS with solid growth
potential as the interest rate environment
improves.
Southwest Securities’ CORPORATE
FINANCE team continues to build its
reputation as one of the premier advisory
firms serving publicly traded and privately
held middle market
companies across a
broad range of indus-
tries within Texas and
the Southwest.
Our highly-skilled
investment bankers are
dedicated to developing
long-term client rela-
tionships by delivering a
rare level of personal
service. With decades of
combined experience,
they understand the unique challenges of the
businesses we serve, providing hands-on
experience and advice with each client
engagement.
Our Corporate Finance business has
enjoyed solid growth and built strong
momentum in recent years in all of its areas
of expertise, including mergers and acquisi-
tions, debt and equity financings and other
Jeffrey J. SingerExecutive VicePresident - Head of CorporateFinance
Mr. Singer joined SWS Group
in 2008 as Executive Vice
President and Head of
Corporate Finance, managing
the group’s strategic direction
and providing operational
oversight.
financial advisory services. During fiscal
2012, the team continued this progress,
increasing its client base and transaction
volume. As each successful assignment opens
new doors for this business, we look forward
to additional success in the years ahead.
BANKING:
Our banking subsidiary, SOUTHWEST
SECURITIES, FSB (the Bank), provides a
broad range of commercial and consumer
lending solutions and treasury management
services to customers throughout Texas and
New Mexico. We are
particularly focused on
multifamily lending
and middle market
commercial and indus-
trial loans.
Furthermore, the
Bank is designated as
a Small Business
Association (SBA)
Preferred Lender, which
allows us to expedite the approval and
processing of SBA loans. In addition, the
Bank’s mortgage purchase department offers
warehouse lending services to mortgage
bankers across the nation.
Under the leadership of our experienced
new management team, Southwest Securities,
FSB has made consistent progress over the
past year in reducing classified assets while
maintaining strong capital ratios well in
excess of regulatory requirements. For
example, the Bank’s ratio of classified assets
to capital and reserves has been reduced by
more than 60 percent over this period.
During fiscal 2012, the Bank successfully
transitioned to a new regulator, the Office of
the Comptroller of the Currency (OCC) and
also began actively working to expand our
lending efforts in the communities we serve
throughout Texas and New Mexico. In a
single six-month period, we added a dozen
experienced bankers with proven track
records to drive our growth strategy through-
out the markets we serve.
Southwest Securities, FSB has a strong
base of core deposits provided by SWS bro-
kerage customer balances that allows us to
focus on building long-term relationships
with our commercial customers. Our bankers
are focused on delivering the highest level of
personal service combined with the broad
resources of a full-service financial services
firm. We plan to build on these strengths and
continue the past year’s positive momentum
to position Southwest Securities, FSB for
future strength and profitability.
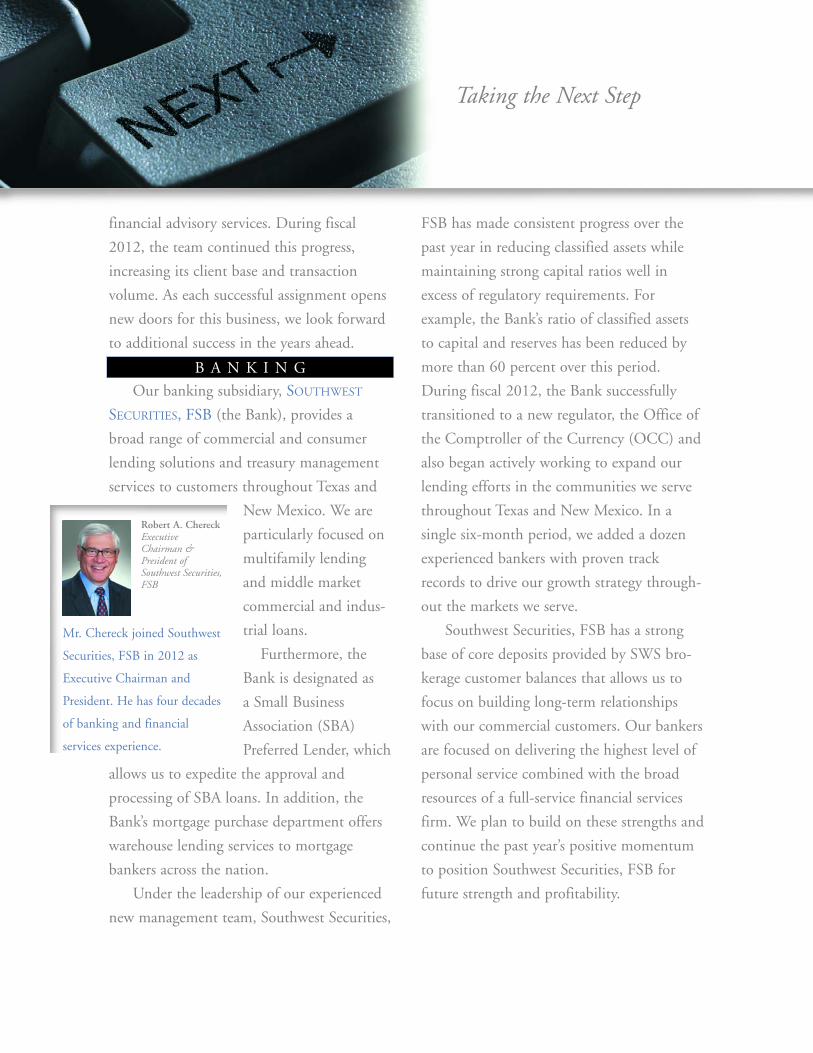
B A N K I N G
Robert A. ChereckExecutiveChairman &President ofSouthwest Securities,FSB
Mr. Chereck joined Southwest
Securities, FSB in 2012 as
Executive Chairman and
President. He has four decades
of banking and financial
services experience.
Taking the Next Step
UNITED STATESSECURITIES AND EXCHANGE COMMISSION
WASHINGTON, D.C. 20549
FORM 10-K(Mark One)[ X ] ANNUAL REPORT PURSUANT TO SECTION 13 OR 15(d) OF THE SECURITIES EXCHANGE ACT OF 1934
For the fiscal year ended June 29, 2012
OR
[ ] TRANSITION REPORT PURSUANT TO SECTION 13 OR 15(d) OF THE SECURITIES EXCHANGE ACT OF 1934
For the transition period from ______ to ______
Commission file number 000-19483
SWS GROUP, INC.(Exact name of registrant as specified in its charter)
Delaware 75-2040825(State or other jurisdiction of (I.R.S. Employerincorporation or organization) Identification No.)
1201 Elm Street, Suite 3500, Dallas, Texas 75270(Address of principal executive offices) (Zip Code)
Registrant’s telephone number, including area code (214) 859-1800
Securities registered pursuant to Section 12(b) of the Act:
Title of Each Class Name of Each Exchange on Which RegisteredCommon Stock, par value $0.10 per share New York Stock Exchange
Securities registered pursuant to Section 12(g) of the Act: None
Indicate by check mark if the registrant is a well-known seasoned issuer, as defined in Rule 405 of the Securities Act. Yes No X
Indicate by check mark if the registrant is not required to file reports pursuant to Section 13 or Section 15(d) of the Act. Yes No X
Indicate by check mark whether the registrant (1) has filed all reports required to be filed by Section 13 or 15(d) of the SecuritiesExchange Act of 1934 during the preceding 12 months (or for such shorter period that the registrant was required to file such reports),and (2) has been subject to such filing requirements for the past 90 days. Yes X No
Indicate by check mark whether the registrant has submitted electronically and posted on its corporate Web site, if any, every InteractiveData File required to be submitted and posted pursuant to Rule 405 of Regulation S-T (§232.405 of this chapter) during the preceding 12 months (or for such shorter period that the registrant was required to submit and post such files). Yes X No
Indicate by check mark if disclosure of delinquent filers pursuant to Item 405 of Regulation S-K (§229.405 of this chapter) is notcontained herein, and will not be contained, to the best of registrant’s knowledge, in definitive proxy or information statementsincorporated by reference in Part III of this Form 10-K or any amendment to this Form 10-K.

Indicate by check mark whether the registrant is a large accelerated filer, an accelerated filer, a non-accelerated filer or a smaller reportingcompany. See the definitions of “large accelerated filer,” “accelerated filer” and “smaller reporting company” in Rule 12b-2 of theExchange Act. (Check one):
Large accelerated filer Accelerated filer X Non-accelerated filer (Do not check if a smaller reporting company) Smaller reporting company ______
Indicate by check mark whether the registrant is a shell company (as defined in Rule 12b-2 of the Act). Yes No X
The aggregate market value of voting and non-voting common equity held by non-affiliates on December 30, 2011 was $250,923,672based on the closing price of the registrant’s common stock, $6.87 per share, reported on the New York Stock Exchange on December 30,2011. For purposes of this computation, all officers, directors and 10% beneficial owners of the registrant are deemed to be affiliates.Such determination should not be deemed an admission that such officers, directors or 10% beneficial owners are, in fact, affiliates of theregistrant.
As of August 30, 2012, there were 32,877,467 shares of the registrant’s common stock, $0.10 par value, outstanding.

DOCUMENTS INCORPORATED BY REFERENCE
Portions of the Proxy Statement to be used in connection with the solicitation of proxies to be voted at the Registrant’s Annual Meeting ofStockholders to be held November 15, 2012 are incorporated by reference into Part III of this Annual Report on Form 10-K.
SWS GROUP, INC. AND SUBSIDIARIES
INDEX TO 2012 ANNUAL REPORT ON FORM 10-K
PART IForward-Looking Statements . . . . . . . . . . . . . . . . . . . . . . . . . . . . . . . . . . . . . . . . . . . . . . . .1
Item 1. Business . . . . . . . . . . . . . . . . . . . . . . . . . . . . . . . . . . . . . . . . . . . . . . . . . . . . . . . . . . . . . . . .2Item 1A. Risk Factors . . . . . . . . . . . . . . . . . . . . . . . . . . . . . . . . . . . . . . . . . . . . . . . . . . . . . . . . . . . .17Item 1B. Unresolved Staff Comments . . . . . . . . . . . . . . . . . . . . . . . . . . . . . . . . . . . . . . . . . . . . . . . .24Item 2. Properties . . . . . . . . . . . . . . . . . . . . . . . . . . . . . . . . . . . . . . . . . . . . . . . . . . . . . . . . . . . . . .24Item 3. Legal Proceedings . . . . . . . . . . . . . . . . . . . . . . . . . . . . . . . . . . . . . . . . . . . . . . . . . . . . . . . .25Item 4. Mine Safety Disclosures . . . . . . . . . . . . . . . . . . . . . . . . . . . . . . . . . . . . . . . . . . . . . . . . . . .25
PART IIItem 5. Market for Registrant’s Common Equity, Related Stockholder Matters and Issuer
Purchases of Equity Securities . . . . . . . . . . . . . . . . . . . . . . . . . . . . . . . . . . . . . . . . . . . .25Item 6. Selected Financial Data . . . . . . . . . . . . . . . . . . . . . . . . . . . . . . . . . . . . . . . . . . . . . . . . . . .28Item 7. Management’s Discussion and Analysis of Financial Condition and Results of
Operations . . . . . . . . . . . . . . . . . . . . . . . . . . . . . . . . . . . . . . . . . . . . . . . . . . . . . . . . . . . .29Item 7A. Quantitative and Qualitative Disclosures About Market Risk . . . . . . . . . . . . . . . . . . . . . .63Item 8. Financial Statements and Supplementary Data . . . . . . . . . . . . . . . . . . . . . . . . . . . . . . . . .63Item 9. Changes in and Disagreements With Accountants on Accounting and Financial
Disclosure . . . . . . . . . . . . . . . . . . . . . . . . . . . . . . . . . . . . . . . . . . . . . . . . . . . . . . . . . . . .64Item 9A. Controls and Procedures . . . . . . . . . . . . . . . . . . . . . . . . . . . . . . . . . . . . . . . . . . . . . . . . . . .64Item 9B. Other Information . . . . . . . . . . . . . . . . . . . . . . . . . . . . . . . . . . . . . . . . . . . . . . . . . . . . . . . .65
PART IIIItem 10. Directors, Executive Officers and Corporate Governance . . . . . . . . . . . . . . . . . . . . . . . . .65Item 11. Executive Compensation . . . . . . . . . . . . . . . . . . . . . . . . . . . . . . . . . . . . . . . . . . . . . . . . . .66Item 12. Security Ownership of Certain Beneficial Owners and Management and Related
Stockholder Matters . . . . . . . . . . . . . . . . . . . . . . . . . . . . . . . . . . . . . . . . . . . . . . . . . . . .66Item 13. Certain Relationships and Related Transactions, and Director Independence . . . . . . . . .66Item 14. Principal Accountant Fees and Services . . . . . . . . . . . . . . . . . . . . . . . . . . . . . . . . . . . . . . .66
PART IVItem 15. Exhibits and Financial Statement Schedules . . . . . . . . . . . . . . . . . . . . . . . . . . . . . . . . . . .67
SIGNATURES . . . . . . . . . . . . . . . . . . . . . . . . . . . . . . . . . . . . . . . . . . . . . . . . . . . . . . . . . . . . . . . . . . . . . . . . . .69
INDEX TO FINANCIAL STATEMENTS . . . . . . . . . . . . . . . . . . . . . . . . . . . . . . . . . . . . . . . . . . . . . . . . . .F-1

FORWARD-LOOKING STATEMENTS
From time to time, we make statements (including some contained in this report) that predict or forecast future events, dependon future events for their accuracy, or otherwise contain “forward-looking” information and constitute “forward-looking statements”within the meaning of applicable U.S. securities legislation. Such statements are generally identifiable by the terminology used such as“plans,” “expects,” “estimates,” “budgets,” “intends,” “anticipates,” “believes,” “projects,” “indicates,” “targets,” “objective,” “could,”“should,” “may” or other similar words. By their very nature, forward-looking statements require us to make assumptions that may notmaterialize or that may not be accurate. Readers should not place undue reliance on any forward-looking statement and should recognizethat the statements are predictions of future results, which may not occur as anticipated. Actual results may differ materially as a result ofvarious factors, some of which are outside of our control, including:
• the interest rate environment;
• the volume of trading in securities;
• the liquidity in capital markets;
• the volatility and general level of securities prices and interest rates;
• the ability to meet regulatory capital requirements administered by federal agencies, including without limitation, thoseestablished by the Order to Cease and Desist, Order No. WN-11-003, effective on February 4, 2011 (the “Order”) with theOffice of Thrift Supervision (“OTS”); the Order is now being enforced by the Office of the Comptroller of the Currency(“OCC”);
• the level of customer margin loan activity and the size of customer account balances;
• the demand for real estate in Texas, New Mexico and the national market;
• the credit-worthiness of our correspondents, counterparties in securities lending transactions and of our banking and margincustomers;
• the demand for investment banking services;
• general economic conditions, especially in Texas and New Mexico, and investor sentiment and confidence;
• the value of collateral securing the loans we hold;
• competitive conditions in each of our business segments;
• changes in accounting, tax and regulatory compliance requirements;
• changes in federal, state and local tax rates;
• the ability to attract and retain key personnel;
• the availability of credit lines;
• the potential misconduct or errors by our employees or by entities with whom we conduct business;
• the ability of borrowers to meet their contractual obligations and the adequacy of our allowance for loan losses; and
• the potential for litigation and other regulatory liability.
1
Our future operating results also depend on our operating expenses, which are subject to fluctuation due to:
• variations in the level of compensation expense incurred as a result of changes in the number of total employees, competitivefactors, or other market variables;
• variations in expenses and capital costs, including depreciation, amortization and other non-cash charges incurred to maintainour infrastructure; and
• unanticipated costs which may be incurred from time to time in connection with litigation, regulation and compliance, loananalyses and modifications or other contingencies.
Other factors, risks and uncertainties that could cause actual results to differ materially from our expectations discussed in thisreport include those factors described in the sections titled Item 1. “Business,” Item 1A. “Risk Factors,” Item 7. “Management’sDiscussion and Analysis of Financial Condition and Results of Operations - Overview,” “-Risk Management,” and “-Critical AccountingPolicies and Estimates” and those discussed in our other reports filed with and available from the Securities and Exchange Commission(the “SEC”). Our forward-looking statements are based on current beliefs, assumptions and expectations, taking into account informationthat we reasonably believe to be reliable. All forward-looking statements we make speak only as of the date on which they are made and,except as required by law, we expressly disclaim any obligation or undertaking to disseminate any updates or revisions to any forward-looking statements contained herein to reflect any change in our expectations with regard thereto or any change in events, conditions orcircumstances upon which any statement is based.
PART I
ITEM 1. BUSINESS
We are a diversified financial services holding company focused on delivering a broad range of investment banking,commercial banking and related financial services to individual, corporate and institutional investors, broker/dealers, governmentalentities and financial intermediaries. We are the largest full-service brokerage firm headquartered in the Southwestern United States(based on the number of financial advisors).
For purposes of this report, references to “we,” “us,” “our,” “SWS” and the “company” mean SWS Group, Inc. collectively withall of our subsidiaries, and references to “SWS Group” mean solely SWS Group, Inc. as a single entity.
SWS Group is a Delaware corporation and was incorporated in 1972, and its common stock is listed on the New York StockExchange (“NYSE”). Our principal executive offices are located at 1201 Elm Street, Suite 3500, Dallas, Texas 75270. Our telephonenumber is (214) 859-1800 and our website is www.swsgroupinc.com. We do not intend for information contained on our website to bepart of this Form 10-K. We file annual, quarterly and current reports, proxy statements and other information with the SEC. You may readand copy any document we file with the SEC at the SEC’s public reference room at 100 F Street, N.E., Washington, DC 20549. Pleasecall the SEC at 1-800-SEC-0330 for information on the public reference room.
The SEC also maintains an Internet site that contains annual, quarterly and current reports, proxy and information statementsand other information that we (together with other issuers) file electronically. The SEC’s Internet site is www.sec.gov. We make availablefree of charge on or through our website our annual, quarterly and current reports and amendments to those reports as soon as reasonablypracticable after we electronically file such material with or furnish it to the SEC. Additionally, we will provide electronic or paper copiesof our filings free of charge upon request.
Our principal brokerage subsidiary, Southwest Securities, Inc. (“Southwest Securities”), is a registered broker/dealer and amember of the NYSE. It is also a member of the Financial Industry Regulatory Authority (“FINRA”), Securities Investor ProtectionCorporation (“SIPC”), and other regulatory and trade organizations.
Southwest Securities provides integrated trade execution, clearing and client account processing to over 150 financial serviceorganizations, which includes correspondent broker/dealers and registered investment advisors in 30 states and Canada. SouthwestSecurities serves individual investors through its private client group offices in Texas, California, Nevada and Oklahoma and institutionalinvestors nationwide. Southwest Securities also extends margin credit and lends securities and manages and participates in underwriting
2
equity and fixed income securities. For the fiscal year ended June 29, 2012, revenues from Southwest Securities accounted forapproximately 74% of our consolidated revenues.
We also operate SWS Financial Services, Inc. (“SWS Financial”), a broker/dealer subsidiary that is also registered withFINRA. SWS Financial contracts with more than 300 individual registered representatives (who are FINRA licensed salespersons) for theadministration of their securities business. While these registered representatives must conduct all of their securities business throughSWS Financial, they may conduct insurance, real estate brokerage or other business for others or for their own accounts. The registeredrepresentatives are responsible for all of their direct expenses and are paid higher commission rates than Southwest Securities’ registeredrepresentatives to compensate them for their added expenses. SWS Financial is a correspondent of Southwest Securities.
We offer full-service, traditional and Internet banking through Southwest Securities, FSB (the “Bank”). The Bank is a federallychartered savings bank, organized and existing under the laws of the United States and regulated since July 21, 2011 by the OCC. Prior toJuly 21, 2011, the Bank was regulated by the OTS. As of July 21, 2011, the Federal Reserve Board (“FRB”) began supervising andregulating SWS Group and SWS Banc Holdings, Inc. (“SWS Banc”). The Bank conducts business from its main operating facilities andheadquarters in Dallas, Texas and 12 banking center locations in Texas and New Mexico. In 2003, SWS Banc was incorporated as awholly-owned subsidiary of SWS Group in the state of Delaware and became the sole stockholder of the Bank in 2004.
The annual consolidated financial statements of SWS are prepared as of the close of business on the last Friday in June. TheBank’s annual financial statements are prepared as of June 30th.
PRODUCTS AND SERVICES
In fiscal 2012, we operated through four business segments grouped primarily by products, services and customer base:clearing, retail, institutional and banking. The segments are managed separately based on the types of products and services offered andtheir related client bases and are consistent with how we manage our resources and assess our performance. For more information abouteach of these business segments, see Item 7. “Management’s Discussion and Analysis of Financial Condition and Results of Operations,”below. See also Note 24 in the Notes to the Consolidated Financial Statements for the fiscal years ended June 29, 2012, June 24, 2011and June 25, 2010 included under Item 8. “Financial Statements and Supplementary Data” for information regarding the revenues,income (loss) and total assets of each of our business segments.
Clearing. We provide clearing and execution services for other broker/dealers (predominantly on a fully disclosed basis). Our clienteleincludes general securities broker/dealers and firms specializing in high-volume trading.
In a fully disclosed clearing transaction, the identity of the clearing client’s (“correspondent”) customer is known to us and wephysically maintain the client’s account and perform a variety of services as agent for the correspondent. Revenues in this segment aregenerated primarily through transaction charges to our correspondent firms for clearing their trades according to a contractual schedule.
In addition to clearing trades, we tailor our services to meet the specific needs of our clients and offer such products andservices as recordkeeping, trade reporting, accounting, general back-office support, securities and margin lending, reorganizationassistance and custody of securities.
We currently support a wide range of clearing clients, including discount and full-service brokerage firms, direct access firms,registered investment advisors and institutional firms. High-volume trading firms trade actively on a proprietary basis or provide servicesto those customers who trade actively on a daily basis. As of June 29, 2012, Southwest Securities provided clearing services for threehigh-volume trading firms. The nature of services provided to the customers of high-volume trading firms and the internal costs necessaryto support them are substantially lower than the standard correspondent costs and services. Accordingly, fees for services to thesecorrespondents, on a per trade basis, are discounted substantially from the fees normally charged to other customers.
The terms of our agreements with our correspondents define the allocation of financial, operational and regulatoryresponsibility arising from the clearing relationship. To the extent that the correspondent has available financial resources, we areprotected against claims by customers of the correspondent arising from actions by the correspondent; however, if the correspondent isunable to meet its financial obligations, dissatisfied customers may attempt to recover from us.
Retail. The Retail segment includes the sale of retail securities, insurance products and managed accounts. This segment generatesrevenue primarily through commissions charged on securities transactions, fees from managed accounts and the sale of insuranceproducts as well as net interest income from retail customer account balances.
3
Retail Securities. We act as securities broker for retail investors in the purchase and sale of securities, options, commodities andfutures contracts that are traded on various exchanges or in the over-the-counter market through our employee registered representativesor our independent contractor arrangements. As a securities broker, we extend margin credit on a secured basis to our retail customers inorder to facilitate securities transactions. Through our insurance subsidiaries, we hold insurance licenses in 44 states in order to facilitatethe sale of insurance and annuity products by our financial advisors to retail clients. In most cases, we charge commissions to our clientsin accordance with our established commission schedule. In certain instances, discounts varying from the schedule are given, generallybased upon the client’s level of business, the trade size and other relevant factors. Some of our registered representatives also maintainlicenses to sell certain insurance products. Southwest Securities is registered with the Commodity Futures Trading Commission (“CFTC”)as a non-guaranteed introducing broker and is a member of the National Futures Association (“NFA”). Southwest Securities is also a fullydisclosed client of two of the largest futures commodity merchants in the United States.
Our financial advisors work with their individual clients to create investment portfolios based on the client’s specific financialgoals and tolerance for risk. We provide access to fee-based platforms and a wide array of products and services including access toinvestment management programs that can be tailored to the individual client relationship to enhance the financial advisor’s business andbenefit his or her clients.
At June 29, 2012, Southwest Securities employed 166 registered representatives in 19 retail brokerage offices (two located inHouston and one located in each of Austin, Dallas, Georgetown, Longview, Lufkin, Plano, San Antonio and Southlake, Texas; one locatedin each of Oklahoma City and Norman, Oklahoma; one located in each of Beverly Hills, Monterey, Rancho Bernardo, Sacramento, SanDiego and San Francisco, California and one located in Las Vegas, Nevada). (The employees located in the Rancho Bernardo officerelocated to the San Diego office on June 29, 2012. The lease on the Rancho Bernardo office expired on June 30, 2012 and the lease wasnot renewed.) In addition, at June 29, 2012, SWS Financial had contracts with 310 independent retail representatives for theadministration of their securities business.
Insurance. Southwest Financial Insurance Agency, Inc. and Southwest Insurance Agency, Inc., together with its subsidiary,Southwest Insurance Agency of Alabama, Inc., (collectively, “SWS Insurance”) hold insurance agency licenses in 44 states for thepurpose of facilitating the sale of insurance and annuity products for our registered representatives to their retail customers. We retain nounderwriting risk related to the insurance and annuity products that SWS Insurance sells.
Managed Accounts. Through the Investment Management Group of Southwest Securities, we provide seven advisory programsthat offer advisors a wide array of products and services to enhance and grow their advisory business. Programs available include thefollowing:
• The Partner Program – this program can be tailored to the individual client relationship and provides the flexibility that webelieve is key to an advisor’s success.
• The Premier Advisors Program – this program gives an investor access to approximately 300 of the world’s leading institutionalmoney managers at competitive rates.
• The Advantage Program – this program offers an advisory service designed to assist investors with identifying a strategic assetallocation strategy using mutual funds and exchange traded funds (“ETF”) and developing a plan to work toward their long-term financial goals.
• The Global Tactical Allocation (“GTA”) Program – this program uses ETFs and mutual funds to develop a tactical strategy thatactively adjusts a portfolio’s allocation mix based on a view of the markets over the next 12 months by over/underweightingunderlying asset classes to determine the appropriate asset allocation mix in consideration of current market conditions.
• The Russell Strategies Program – this program uses only mutual funds from Russell Investments, and the models and funds thatare used within each model are provided by Russell Investments and provide investors with well balanced and diversifiedportfolios.
• The United Managed Account (“UMA”) – this program is a professionally managed private investment account that isrebalanced regularly and can encompass every investment vehicle (e.g. mutual funds, stocks, bonds and exchange traded funds)in an investor’s portfolio, all in a single account.
4
• The Direct Access Program – this program is an investment management program utilizing non-proprietary professional moneymanagers employing many different investment styles.
Margin Lending. We extend credit on a secured basis directly to our customers, the customers of correspondent firms and thecorrespondent firms themselves in order to facilitate securities transactions. This credit, which generates interest income, is known as“margin lending” and is conducted primarily in our clearing and retail segments. We extend margin credit to correspondent firms only tothe extent that such firms pledge their own (“proprietary”) assets as collateral. Our correspondents indemnify us against margin losses intheir customers’ accounts. Since we must rely on the guarantees and general creditworthiness of our correspondents, we may be exposedto significant risk of loss if they are unable to meet their financial commitments should there be a substantial adverse change in the valueof margined securities.
In customer margin transactions, the client borrows money from us to purchase securities or for other purposes. The loan iscollateralized by the securities purchased or by other securities owned by the client. Interest is charged to clients on the amount borrowedto finance margin transactions at a floating rate. The rate charged is dependent on the average net debit balance in the client’s accounts,the activity level in the accounts and the applicable cost of funds. The amount of the loan is subject to the margin regulations(“Regulation T”) of the Board of Governors of the Federal Reserve System, FINRA margin requirements and our internal policies. Inmost transactions, Regulation T limits the amount loaned to a customer for the purchase of securities to 50% of the purchase price.Furthermore, in the event of a decline in the value of the collateral, FINRA requirements regulate the percentage of client cash orsecurities that must be on deposit as collateral for the loans.
In permitting clients to purchase on margin, we are subject to the risk that the value of our collateral could fall below theamount of that client’s indebtedness. Agreements with margin account clients permit us to liquidate the clients’ securities with or withoutprior notice in the event of an insufficient amount of margin collateral. Despite those agreements, we may be unable to liquidate theclients’ securities for various reasons including, but not limited to, a thin trading market, an excessive concentration or the issuance of atrading halt.
The primary source of funds to finance client margin account balances is credit balances in the client’s account. We generallypay interest to clients on these credit balances at a rate determined periodically. SEC regulations restrict the use of client funds to thefinancing of client activities including margin account balances. Excess customer credit balances, as defined by SEC regulations, areinvested in short-term securities segregated for the exclusive benefit of customers as required by SEC regulations. We generate net interestincome when there is a positive interest rate spread between the rate earned from margin lending and segregated short-term investmentsand the rate paid on customer credit balances.
Institutional. The Institutional segment is comprised of businesses serving institutional customers in the areas of securities borrowing andlending, municipal finance, investment banking, fixed income sales and equity trading. Revenues in the institutional segment are derivedfrom the net interest spread on stock loan transactions, commission and trading income from fixed income and equity products andinvestment banking fees from corporate and municipal securities transactions.
Securities Lending Activities. Our securities lending business includes borrowing and lending securities for otherbroker/dealers, lending institutions and our own clearing and retail operations. These activities involve borrowing securities to cover shortsales and to complete transactions in which clients have failed to deliver securities by the required settlement date and lending securitiesto other broker/dealers for similar purposes.
When borrowing securities, we are required to deposit cash or other collateral or to post a letter of credit with the lender, andwe generally receive a rebate (based on the amount of cash deposited) or a fee calculated to yield a negotiated rate of return. Whenlending securities, we receive cash or similar collateral and generally pay interest (based on the amount of cash deposited) to the otherparty to the transaction. Generally, we earn net interest income based on the spread between the interest rate on cash or similar collateralwe deposit and the interest rate paid on cash or similar collateral we receive.
Securities borrowing and lending transactions are executed pursuant to written agreements with counterparties that generallyrequire securities borrowed and loaned to be marked-to-market on a daily basis, excess collateral to be refunded, and deficit collateral tobe furnished. Collateral adjustments are made on a daily basis through the facilities of various clearinghouses. We are a principal in thesesecurities borrowing and lending transactions and are liable for losses in the event of a failure of any other party to honor its contractualobligation. Our management sets credit limits with each counterparty and reviews these limits regularly to monitor the risk level witheach counterparty. The securities lending business is conducted primarily from Southwest Securities’ New Jersey office using a highlyspecialized sales force.
5
Investment Banking and Municipal Finance. Our investment banking and municipal finance businesses earn investmentbanking revenues by assisting corporate and public entity clients in meeting their financial needs and advising them on the mostadvantageous means of raising capital. Our municipal finance professionals assist public bodies in originating, syndicating anddistributing securities of municipalities and political subdivisions. Our corporate finance professionals arrange and evaluate mergers andacquisitions, conduct private placements and participate in public offerings of securities with institutional and individual investors, assistclients with raising capital and provide other consulting and advisory services.
Our syndicate department coordinates the distribution of managed and co-managed corporate equity underwritings, acceptsinvitations to participate in competitive or negotiated underwritings managed by other investment banking firms and allocates and marketsour selling allotments to institutional clients and to other broker/dealers.
Southwest Securities maintains a corporate finance branch office in Dallas, Texas and municipal finance branch offices inAustin, Dallas, Longview, Allen and San Antonio, Texas; Irvine and Cardiff, California; Hillsdale, New York; Albuquerque, New Mexico;Charlotte, North Carolina; Lexington, Kentucky; Columbia, South Carolina and Monroe, Louisiana.
Participation in firm commitment corporate and municipal underwritings can expose us to material risk due to the possibilitythat the securities we have committed to purchase may not be sold at the initial offering price. In addition, Federal and state securitieslaws and regulations also affect the activities of underwriters and impose substantial potential liabilities for violations in connection withsales of securities by underwriters to the public.
Fixed Income Sales and Equity Trading. Our fixed income sales and trading group specializes in trading and underwritingU.S. government and agency bonds, corporate bonds, municipal bonds, mortgage-backed, asset-backed and commercial mortgage-backedsecurities and structured products. The clients of our fixed income group include corporations, insurance companies, banks, mutual funds,money managers and other institutions. Southwest Securities has fixed income offices in Austin and Dallas, Texas; Chicago, Illinois; Ft.Lauderdale and Palm Beach Gardens, Florida; Encino, Irvine and San Francisco, California; Canton and Westport, Connecticut;Evergreen, Colorado; Bloomfield, New Jersey; Memphis, Tennessee and New York, New York.
Our equity trading department focuses on providing best execution for equity and option orders for clients. We also executeinstitutional portfolio trades and are a market maker in a limited number of listed securities.
Banking. We offer traditional banking products and services through 12 full-service banking centers with 10 banking centers located inTexas, two located in Arlington and one located in each of Austin, Benbrook, Dallas, El Paso, Granbury, Houston, Southlake andWaxahachie, and two located in New Mexico with one each located in Albuquerque and Ruidoso. We specialize in two primary areas:business banking and mortgage purchase. Our focus in business banking includes small business (“SBA”) lending. We originate themajority of our loans internally, and we believe this business model helps us build more valuable relationships with our customers. Ourbanking operations are currently restricted by, and subject to, the Order with the OCC. See additional discussion of the Order in Note 29in the Notes to the Consolidated Financial Statements for the fiscal years ended June 29, 2012, June 24, 2011 and June 25, 2010 includedunder Item 8. “Financial Statements and Supplementary Data”.
The Bank offers a full array of deposit products, including checking, savings, money market and certificates of deposit. As afull-service lender, the Bank offers competitive rates and terms on business loans, as well as a full line of consumer loans. Customershave access to comprehensive Internet banking services and online bill payment. The Bank offers commercial and commercial realestate loans as well as residential mortgage loans, primarily in Texas and New Mexico. In prior years, the Bank also provided interimconstruction lending to builders throughout the North Texas market.
Our mortgage purchase division purchases participations and sub-participations in newly originated residential loans (1-4family), from various mortgage bankers nationwide. In the fourth quarter of fiscal 2012, the Bank signed a sub-participation agreementwith a non-affiliate bank to sub-participate in this bank’s mortgage purchase program. We have made a maximum total commitment of$50.0 million pursuant to this agreement. As of June 30, 2012, 12% of the $294.3 million purchased mortgage loans held for investmentbalance was from this sub-participation agreement. The loans are pre-committed for sale by the mortgage company to secondaryinvestors. The purchased mortgage loans held for investment are held by the Bank on average for 25 days or less. Approximately 95% ofthe loans conform to the standards of Fannie Mae, Freddie Mac or Ginnie Mae, and the rest are “A” credit jumbo loans. As of the date ofthis report, the Bank had approximately 60 customer/originators across the nation. Although the Bank is exposed to credit risk before theloans are sold by the mortgage company, there is no recourse to the Bank after the mortgage company sells the loan to the secondaryinvestor.
6
The Bank earns substantially all of its revenues on the spread between the rates charged to customers on loans and the ratespaid to depositors.
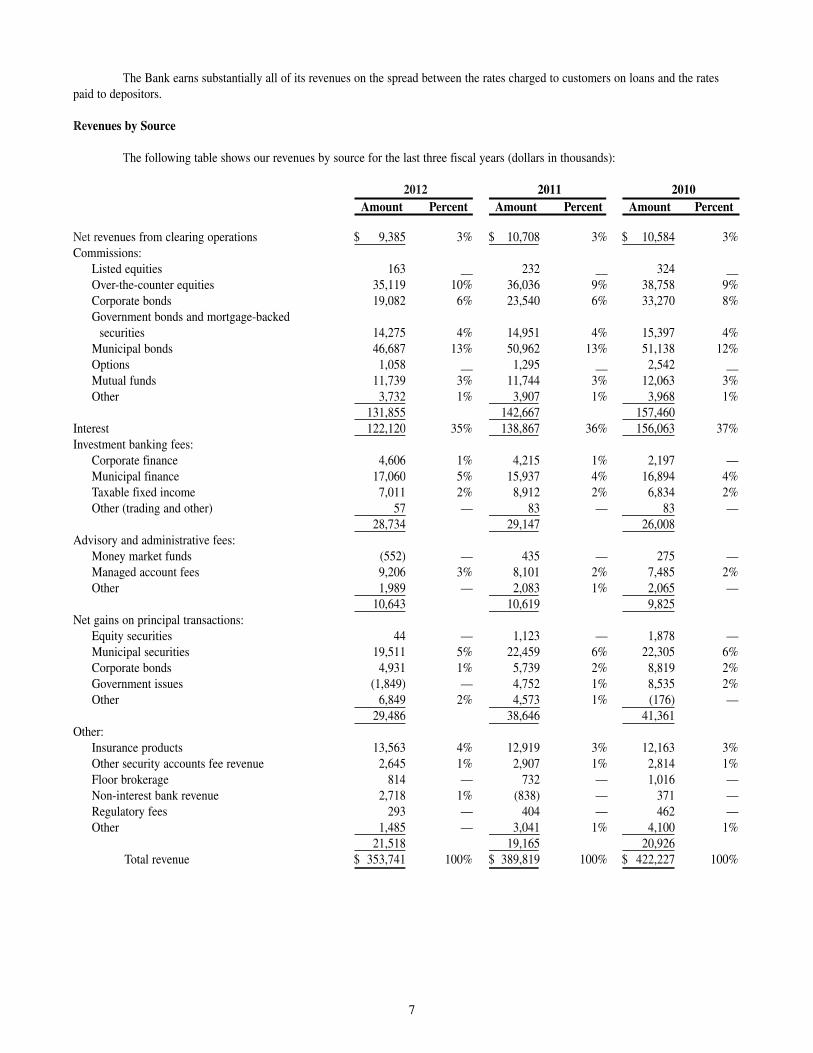
Revenues by Source
The following table shows our revenues by source for the last three fiscal years (dollars in thousands):
2012 2011 2010Amount Percent Amount Percent Amount Percent
Net revenues from clearing operations $ 9,385 3% $ 10,708 3% $ 10,584 3%Commissions:
Listed equities 163 __ 232 __ 324 __Over-the-counter equities 35,119 10% 36,036 9% 38,758 9%Corporate bonds 19,082 6% 23,540 6% 33,270 8%Government bonds and mortgage-backed
securities 14,275 4% 14,951 4% 15,397 4%Municipal bonds 46,687 13% 50,962 13% 51,138 12%Options 1,058 __ 1,295 __ 2,542 __Mutual funds 11,739 3% 11,744 3% 12,063 3%Other 3,732 1% 3,907 1% 3,968 1%
131,855 142,667 157,460Interest 122,120 35% 138,867 36% 156,063 37%Investment banking fees:
Corporate finance 4,606 1% 4,215 1% 2,197 —Municipal finance 17,060 5% 15,937 4% 16,894 4%Taxable fixed income 7,011 2% 8,912 2% 6,834 2%Other (trading and other) 57 — 83 — 83 —
28,734 29,147 26,008Advisory and administrative fees:
Money market funds (552) — 435 — 275 —Managed account fees 9,206 3% 8,101 2% 7,485 2%Other 1,989 — 2,083 1% 2,065 —
10,643 10,619 9,825Net gains on principal transactions:
Equity securities 44 — 1,123 — 1,878 — Municipal securities 19,511 5% 22,459 6% 22,305 6%Corporate bonds 4,931 1% 5,739 2% 8,819 2%Government issues (1,849) — 4,752 1% 8,535 2%Other 6,849 2% 4,573 1% (176) —
29,486 38,646 41,361Other:
Insurance products 13,563 4% 12,919 3% 12,163 3%Other security accounts fee revenue 2,645 1% 2,907 1% 2,814 1%Floor brokerage 814 — 732 — 1,016 —Non-interest bank revenue 2,718 1% (838) — 371 — Regulatory fees 293 — 404 — 462 —Other 1,485 — 3,041 1% 4,100 1%
21,518 19,165 20,926Total revenue $ 353,741 100% $ 389,819 100% $ 422,227 100%
7
COMPETITION
We encounter intense competition in our businesses. We compete directly with securities firms and banks, many of which havesubstantially greater capital and other resources than we have. We also encounter competition from insurance companies and financialinstitutions in many elements of our businesses.
The brokerage entities compete principally on the basis of service, product selection, price, location and reputation. We operateat a price disadvantage to discount brokerage firms that do not offer equivalent services. We compete for the correspondent clearingbusiness on the basis of service, reputation, financial strength, price, technology and product selection.
Competition for successful securities traders, stock loan professionals and investment bankers among securities firms and othercompetitors is intense, as is competition for experienced financial advisors. We recognize the importance of hiring and retaining skilledprofessionals so we invest heavily in the recruiting process. The failure to attract and retain skilled professionals could have a materialadverse effect on our business and on our performance.
The Bank also operates in an intensely competitive environment. This environment includes other banks, credit unions,nonbank lenders and insurance companies. The competition ranges from small community banks to trillion dollar commercial banks. Aswith the securities industry, the ability to attract and retain skilled professionals is critical to the Bank’s success. To enhance theseactivities the Bank utilizes SWS for assistance in recruiting and educational programs. The Bank competes for community bankingcustomers locally based on reputation, service, location and price. The Bank also competes nationally through its mortgage purchaseddivision.
REGULATION
We operate in the financial services industry as, among other things, a securities broker/dealer, a registered investment advisorand a bank. As a result, our businesses are highly regulated by U.S. federal and state regulatory agencies, self-regulatory organizationsand securities exchanges and, to a lesser extent, by foreign governmental agencies and financial regulatory bodies. As a matter of publicpolicy, regulatory bodies in the U.S. are charged with, among other things, safeguarding the integrity of the securities and other financialmarkets and with protecting the interests of customers, including depositors, the Federal Deposit Insurance Fund (“DIF”), and thebanking system as a whole, not with protecting the interests of creditors or the stockholders of regulated entities.
Significant elements of the laws and regulations applicable to us are described below. The description is qualified in its entiretyby reference to the full text of the statutes, regulations and policies that are described. Also, such statutes, regulations and policies arecontinually under review by Congress and state legislatures and federal and state regulatory agencies.
We are under the jurisdiction of the SEC and are subject to the disclosure and regulatory requirements of the Securities Act of1933, as amended, and the Securities Exchange Act of 1934, as amended (the “Exchange Act”), as administered by the SEC. As a publiccompany whose common stock is listed on the NYSE, we are subject to corporate governance requirements established by the SEC andNYSE, as well as federal and state law. Under the Sarbanes-Oxley Act, we are required to meet certain requirements regarding businessdealings with members of our Board of Directors, the structure of our Audit Committee and ethical standards for our senior financialofficers. Also, under Section 404 of the Sarbanes-Oxley Act, we are required to assess the effectiveness of our internal controls overfinancial reporting and to obtain an opinion from our independent auditors regarding the effectiveness of our internal controls overfinancial reporting. Under SEC and NYSE rules, we are required to comply with other standards of corporate governance, includinghaving a majority of independent directors serve on our Board of Directors, and the establishment of independent audit, compensationand corporate governance committees.
We are a legal entity separate and distinct from our banking and non-banking subsidiaries. Our principal sources of funds arecash dividends paid by our subsidiaries, capital contributions from the sale of our securities, investment income, and borrowings.Normally, federal laws limit the amount of dividends or other capital distributions that a banking institution can pay, and the Bank mustobtain prior approval from the OCC before it can pay dividends to us. On February 4, 2011, the Board of Directors of the Bank agreed toa Stipulation and Consent to Issuance of Order to Cease and Desist and the OTS issued the Order. The Order is now enforced by theOCC. The Order provides that, among other things, the Bank cannot declare or pay dividends or make any other capital distributionswithout the prior approval of the OCC after 30 days prior notice to the OCC. See also Note 29 in the Notes to the Consolidated FinancialStatements for the fiscal years ended June 29, 2012, June 24, 2011 and June 25, 2010 included under Item 8. “Financial Statements andSupplementary Data.”
Due to the recent financial economic crisis, many new regulations and statutes have been proposed or enacted over the pastseveral years that contain wide-ranging proposals for altering the structures, regulations and competitive relationships of financial
8
institutions operating and doing business in the United States. Most notably, on July 21, 2010, the Dodd-Frank Wall Street Reform andConsumer Protection Act (the “Dodd-Frank Act”) was enacted.
The Dodd-Frank Act seeks to restore responsibility and accountability to the U.S. financial system by significantly altering theregulation of financial institutions and the financial services industry. Most of the provisions contained in the Dodd-Frank Act havedelayed effective dates, and full implementation will require many new rules to be issued by federal regulatory agencies over the nextseveral years. While we continue to closely monitor the implementation of the Dodd-Frank Act, including new and proposed regulations,the full impact of the new rules on our business is still uncertain.
Among other things, the Dodd-Frank Act:
• Established the Consumer Financial Protection Bureau (the “Bureau”), an independent organization within the FederalReserve dedicated to protecting consumers through education, promulgating regulations that implement specified consumerprotection laws applicable to all entities offering consumer financial products or services and enforcing those regulations.
• Established the Financial Stability Oversight Council, tasked with the authority to identify and monitor institutions andsystems which pose a systemic risk to the financial system, and to impose standards regarding capital, leverage, liquidity,risk management and other requirements for financial firms.
• Abolished the OTS and transferred its functions to other federal banking agencies on July 21, 2011 as follows:o Functions, powers, authorities, rights and duties of the OTS related to the supervision of savings and loan holding
companies and their subsidiaries (other than depository institutions) was transferred to the FRB;
o Functions, powers, authorities, rights and duties of the OTS related to federal savings associations was transferred to theOCC; and
o Functions, powers, authorities, rights and duties of the OTS related to state savings associations was transferred to theFederal Deposit Insurance Corporation (“FDIC”).
• Required establishment of minimum capital requirements to depository institution holding companies.
• Changed the base for FDIC insurance assessments.
• Increased the minimum reserve ratio for the DIF from 1.15% to 1.35%.
• Permanently increased the deposit insurance coverage amount from $100,000 to $250,000.
• Directed the Federal Reserve to establish interchange fees for debit cards pursuant to a restrictive “reasonable andproportional cost” per transaction standard.
• Limited the ability of banking organizations to sponsor or invest in private equity and hedge funds and to engage inproprietary trading.
• Granted the U.S. government authority to liquidate or take emergency measures with respect to troubled nonbank financialcompanies historically fell outside the existing resolution authority of the FDIC, including the establishment of an orderlyliquidation fund.
• Increased regulation of asset-backed securities, including a requirement that issuers of asset-backed securities retain at least5% of the risk of the asset-backed securities.
• Increased regulation of consumer protections regarding mortgage originations, including originator compensation, minimumrepayment standards and prepayment consideration.
• Established new disclosure and other requirements relating to executive compensation and corporate governance.
• Increased transparency of non-hedging derivative trading activity, with the goal of limiting speculation and increasingaccountability in the commodities and derivatives (including swaps) market.
9
• Removed the prohibition on paying interest on demand deposit accounts.
From time to time, various legislative and regulatory initiatives are introduced in Congress and state legislatures, as well as byregulatory agencies. These initiatives may include proposals to expand or contract the powers of holding companies and depositoryinstitutions or proposals to substantially change the financial institution regulatory system. Such legislation could change banking andbrokerage statutes and our operating environment in substantial and unpredictable ways. If enacted, such legislation could increase ordecrease our cost of doing business, limit or expand permissible activities or affect the competitive balance among banks, savingsassociations, credit unions, and other financial institutions. We cannot predict whether any such legislation will be enacted, and, ifenacted, the impact that it, and any implementing regulations, would have on our financial condition or results of operations. Any changein statutes, regulations or regulatory policies applicable to us or any of our subsidiaries could have a material effect on our business.
Regulation of SWS Group. SWS Group is regulated under the Savings and Loan Holding Company Act, as amended (the“SLHC Act”), and its subsidiaries that are not functionally regulated are subject to inspection, examination and supervision by the FRB.
The FRB has the power to order any savings and loan holding company or its subsidiaries to terminate any activity or toterminate its ownership or control of any subsidiary when the FRB has reasonable grounds to believe that continuation of such activity orsuch ownership or control constitutes a serious risk to the financial soundness, safety or stability of any bank subsidiary of the holdingcompany.
The Dodd-Frank Act requires the federal financial regulatory agencies to adopt rules that prohibit banks and their affiliates fromengaging in proprietary trading and investing in and sponsoring certain unregistered investment companies (defined as hedge funds andprivate equity funds). This provision is commonly called the “Volcker Rule”. In October 2011, federal regulators proposed rules toimplement the Volcker Rule. The proposed rules are highly complex, and many aspects of their application remain uncertain.
FRB policy has historically required bank holding companies to act as a source of financial and managerial strength to theirsubsidiary banks. The Dodd-Frank Act codified this policy as a statutory requirement for savings and loan holding companies, such asSWS Group. Under this requirement, we are expected to commit resources to support the Bank, including at times when we may not bein a financial position to provide such resources. Any capital loans by a holding company to any of its subsidiary banks are subordinate inright of payment to depositors and to certain other indebtedness of such subsidiary banks. In the event of a holding company’sbankruptcy, any commitment by the holding company to a federal bank regulatory agency to maintain the capital of a subsidiary bank willbe assumed by the bankruptcy trustee and entitled to priority of payment.
Regulation of the Securities Business. The securities industry in the United States is subject to extensive regulation underfederal and state laws and regulations. Our U.S. broker/dealer subsidiaries are registered as such with the SEC and FINRA. Self-regulatory organizations such as FINRA have also enacted rules (which are subject to approval by the SEC) for governing the industry.Securities firms are subject to regulation by state securities commissions in the states in which they conduct business. SouthwestSecurities and SWS Financial are registered in all 50 states and the District of Columbia. Southwest Securities is also registered in theU.S. Virgin Islands. Federal and state authorities, as well as state regulatory authorities, have the power to undertake periodicexaminations of our securities broker/dealer operations for the purpose of assuring our compliance with the applicable rules andregulations.
The regulations to which broker/dealers are subject cover all aspects of the securities business, including the manner in whichsecurities transactions are effected, net capital requirements, recordkeeping and reporting procedures, relationships and conflicts withcustomers, the handling of cash and margin accounts, sales methods and conduct, experience and training requirements for certainemployees, the conduct of investment banking and research activities and the manner in which we prevent and detect money-launderingactivities. Legislation and changes in rules promulgated by the SEC and by self-regulatory organizations or changes in the interpretationor enforcement of existing laws and rules often directly affect the method of operation and profitability of broker/dealers. The SEC andself-regulatory organizations may conduct administrative proceedings that can result in censure, fine, suspension or expulsion of abroker/dealer firm, its officers or employees.
Our broker/dealer subsidiaries are subject to the SEC’s net capital rule (Exchange Act Rule 15c3-1). Generally, abroker/dealer’s net capital is equal to its net worth plus qualified subordinated debt less deductions for non-allowable (or non-liquid)assets and other operational charges. The SEC and FINRA impose rules that require notification when net capital falls below certainpredefined criteria. These rules also dictate the ratio of debt-to-equity in the regulatory capital composition of a broker/dealer andconstrain the ability of a broker/dealer to expand its business under certain circumstances. If a firm fails to maintain the required netcapital, it may be subject to suspension or revocation of registration by the applicable regulatory agency, and suspension or expulsion bythese regulators could ultimately lead to the firm’s liquidation.
10
Compliance with the net capital requirements may limit our operations, requiring the intensive use of capital. Such rules requirethat a certain percentage of our assets be maintained in relatively liquid form and therefore act to restrict our ability to withdraw capitalfrom our broker/dealer subsidiaries, which in turn may limit our ability to pay dividends, repay debt or redeem or purchase shares of ouroutstanding common stock. Any change in such rules or the imposition of new rules affecting the scope, coverage, calculation or amountof capital requirements, or a significant operating loss or any unusually large charge against capital, could adversely affect our ability topay dividends, meet our debt covenant requirements or to expand or maintain present business levels. In addition, such rules may requireus to make substantial capital contributions into one or more of our broker/dealer subsidiaries in order for such subsidiaries to complywith such rules, either in the form of cash or subordinated loans made in accordance with the requirements of the SEC’s net capital rule.As of June 29, 2012, Southwest Securities had regulatory net capital, as defined by Exchange Act Rule 15c3-1, of $150.3 million, whichexceeded the amounts required by $143.6 million. However, the amount of net excess capital can change dramatically within a shortperiod of time.
Our broker/dealer subsidiaries are required by federal law to belong to the SIPC, whose primary function is to provide financialprotection for the customers of failing brokerage firms. SIPC provides protection for clients’ cash and securities up to $500,000 percustomer account, of which a maximum of $250,000 may be in cash.
Our broker/dealer subsidiaries must also comply with the USA PATRIOT Act and other rules and regulations designed to fightinternational money laundering and to block terrorist access to the U.S. financial system. We are required to have systems and proceduresto ensure compliance with such laws and regulations.
Certain activities of some SWS subsidiaries are regulated by the CFTC and various commodity exchanges. The CFTC also hasnet capital regulations (CFTC Rule 1.17) that must be satisfied. Our futures business is also regulated by the NFA, a registered futuresassociation. Violation of the rules of the CFTC, the NFA or the commodity exchanges could result in remedial actions including fines,registration restrictions or terminations, trading prohibitions or revocations of commodity exchange memberships.
Banking Regulations. We are subject to the extensive regulatory framework applicable to savings and loan holding companiesas well as federal savings associations.
As a savings and loan holding company, we are subject to regulation and examination by the FRB. The Bank is subject toregulation and examination by the OCC (its primary federal regulator). The banking regulators, including the OCC, FDIC and FRB havebroad and, in some cases, overlapping, authority to prohibit activities of holding companies, federal savings banks, their non-bankingsubsidiaries, directors, officers and other institution affiliated parties (such as attorneys and accountants) that represent unsafe andunsound banking practices or that constitute violations of laws or regulations. The OCC can assess civil money penalties for violations oflaw, OTS/OCC orders, written conditions or written agreements with the OCC, as well as certain activities conducted on a “knowing andreckless” basis, if those activities caused a substantial loss to a depository institution. The penalties can be as high as $1.375 million foreach day the activities continue.
The Dodd-Frank Act transferred the functions of the OTS (other than consumer protection) as they relate to the Bank to theOCC, and as they relate to SWS Group, to the FRB on July 21, 2011 (“Transfer Date”). Eventually, we will be required to comply withcapital and activity requirements similar to those currently applicable to bank holding companies. In addition, the Dodd-Frank Actenacted new minimum capital requirements for depository institution holding companies and the federal banking agencies have proposedrules implementing these statutory provisions. The OCC published a final rule on the Transfer Date clarifying the application of its rulesto federal savings banks in certain areas, including assessments, preemption of state law, visitorial powers and other clarifyingadministrative matters.
The Dodd-Frank Act also requires the FRB to mandate that any bank holding company or savings and loan holding companyserve as a “source of financial strength” for any subsidiary that is a depository institution. The Dodd-Frank Act gave the federal bankingagencies one year after the Transfer Date to issue joint final rules related to the source of financial strength requirement, however, theserules have not been proposed. “source of financial strength” is defined as the ability of a company that directly or indirectly owns orcontrols an insured depository institution to provide financial assistance to such insured depository institution in the event of the financialdistress of the insured depository institution. Once these rules are finalized, as a savings and loan holding company, we will be required tobe a “source of financial strength” for the Bank.
In July 2010, the FDIC voted to revise its existing Memorandum of Understanding with the primary federal regulators toenhance the FDIC’s existing backup authorities over insured depository institutions that the FDIC does not directly supervise. As a result,the Bank may be subject to increased supervision by the FDIC.
11
With very limited exceptions, we may not be acquired by any company or by any individual without the approval of agoverning bank regulatory agency. That agency must complete an application review, and generally the public must have an opportunityto comment on any proposed acquisition. Without prior approval from the FRB, we may not acquire more than five percent of the votingstock of any savings institution or bank. The Dodd-Frank Act restricts a bank that is the subject of a formal enforcement action or amemorandum of understanding with respect to a significant supervisory matter from converting its charter, subject to certain exceptions.
The Bank is currently subject to OCC capital requirements. Federal statutes and OCC regulations have established four ratiosfor measuring an institution’s capital adequacy: a “Tier I (core) capital” ratio — the ratio of an institution’s Tier I capital to adjustedtangible assets; a “Tier I risk-based capital” ratio — an institution’s adjusted Tier I capital as a percentage of total risk-weighted assets; a“total risk-based capital” ratio — the percentage of total risk-based capital to total risk-weighted assets; and a “tangible equity” ratio —the ratio of tangible capital to total tangible assets.
Federal statutes and OCC regulations have established five capital categories for federal savings banks: well-capitalized,adequately capitalized, undercapitalized, significantly undercapitalized and critically undercapitalized. The federal banking agencies havejointly specified by regulation the relevant capital level for each category. An institution is defined as well-capitalized when its total risk-based capital ratio is at least 10.00%, its Tier I risk-based capital ratio is at least 6.00%, its Tier I (core) capital ratio is at least 5.00%, andit is not subject to any federal supervisory order or directive to meet a specific capital level. On February 4, 2011, the Board of Directorsof the Bank agreed to the Stipulation and Consent to Issuance of Order to Cease and Desist and the Order was issued. As a result of theissuance of the Order, effective February 4, 2011, the Bank was deemed to be “adequately capitalized” and no longer meets the definitionof “well capitalized” under federal statutes and OCC regulations even though its capital ratios meet or exceed all applicable requirementsunder Federal law, OCC regulations and the Order. See also Note 29 in the Notes to the Consolidated Financial Statements for the fiscalyears ended June 29, 2012, June 24, 2011 and June 25, 2010 included under Item 8. “Financial Statements and Supplementary Data.”
In December 2010, the Basel Committee on Banking Supervision (the “Basel Committee”) released in December 2010 revisedfinal frameworks for the regulation of capital and liquidity of internationally active banking organizations. These new frameworks aregenerally referred to as “Basel III”. On August 30, 2012, the Federal Reserve, the FDIC and the OCC published three proposed rules thatwould substantially amend the regulatory risk-based capital rules applicable to SWS Group and the Bank. The proposed rules implementthe Basel III regulatory capital reforms and changes required by the Dodd-Frank Act. Public comments on the proposed rules arerequested by October 22, 2012. After the comment period closes, the bank regulators will review the comments and publish final rules,which may vary substantially from the proposed rules.
The Basel III capital framework as adopted in the United States in the future will apply to SWS on a consolidated basis and tothe Bank and will establish substantially higher capital requirements than currently apply. The proposed rules would require the followingin regard to capital ratios:
• Common Equity Tier 1 capital to risk-weighted assets ratio of at least 4.5% (plus a 2.5% “capital conservation buffer” that isphased in, resulting in a fully phased in ratio of 7.0%);
• Tier 1 capital to risk-weighted assets ratio of 6% (plus the capital conservation buffer, resulting in a fully phased in ratio of8.5%);
• Total capital ratio of 8% of total risk-weighted assets (plus the capital conservation buffer, resulting in a fully phased in ratio of10.5%); and
• Tier 1 leverage ratio of 4%.
The proposed effective date for this new capital framework is January 1, 2013 with a six-year phase in period. Under theproposed rules, in order to avoid limitations on capital distributions (including dividend payments, discretionary payments on Tier 1instruments and share buybacks) and certain discretionary bonus payments, a banking organization would need to hold a specific amountof Common Equity Tier 1 capital in excess of their minimum risk based capital ratios. The fully phased-in buffer amount would be equalto 2.5% of risk-weighted assets.
Bank regulators are required to take “prompt corrective action” to resolve problems associated with insured depositoryinstitutions whose capital declines below certain levels. Federal banking agencies are required to take various mandatory supervisoryactions and are authorized to take other discretionary actions with respect to institutions that are “undercapitalized,” “significantlyundercapitalized” or “critically undercapitalized.” The severity of the action depends upon the capital category in which the institution isplaced. Generally, subject to a narrow exception, the banking regulator must appoint a receiver or conservator for an institution that iscritically undercapitalized.
12
In the event an institution becomes “undercapitalized,” it must submit an acceptable capital restoration plan. The capitalrestoration plan will not be accepted by the regulators unless, among other requirements, each company having control of theundercapitalized institution guarantees the subsidiary’s compliance with the capital restoration plan up to a certain specified amount. Anysuch guarantee from a depository institution’s holding company is entitled to a priority of payment in bankruptcy.
The aggregate liability of the holding company of an undercapitalized depository institution is limited to the lesser of 5% of theinstitution’s assets at the time it became undercapitalized or the amount necessary to cause the institution to be “adequately capitalized.”The bank regulators have greater power in situations where an institution becomes “significantly” or “critically” undercapitalized or failsto submit a capital restoration plan. However, the guarantee can be limited for a holding company that is a “functionally regulatedaffiliate” of the depository institution, such as a holding company that is a broker/dealer registered with the SEC, if the functionalregulator of the affiliate objects. For example, the FRB could require an SEC registered broker/dealer holding company for anundercapitalized federal savings bank to guarantee the bank’s capital restoration plan, subject to the limitations summarized above andsubject to an objection from the holding company’s functional regulator, the SEC.
An undercapitalized institution is also generally prohibited from increasing its average total assets, making acquisitions,establishing branches or engaging in any new line of business, except under an accepted capital restoration plan or with FDIC approval.The prompt corrective action regulations also establish procedures for downgrading an institution to a lower capital category based onsupervisory factors other than capital.
The FDIC insures the deposits of the Bank up to the applicable maximum in each account, or up to $250,000 per account.FDIC deposit insurance is backed by the full faith and credit of the United States government. The Dodd-Frank Act, as amended,provided unlimited FDIC deposit insurance on noninterest-bearing transaction accounts held at all insured depository institutions for theperiod from January 1, 2011 through December 31, 2012. This temporary unlimited coverage is separate from, and in addition to, thecoverage provided to depositors for other accounts at an insured depository institution. At this time, it is unclear whether this temporaryunlimited coverage will be extended beyond December 31, 2012.
On November 12, 2009, the FDIC Board of Directors voted to require insured depository institutions to prepay their estimatedquarterly risk-based insurance assessments for the fourth quarter of 2009, and for all of 2010, 2011 and 2012. The prepaid assessment,along with the Bank’s regular third quarter assessment, was paid on December 30, 2009. For the purposes of estimating the Bank’sassessments for the fourth quarter of 2009, and for all of 2010, 2011, and 2012, and calculating the amount that the Bank prepaid onDecember 30, 2009, the Bank’s assessment rate was its total base assessment rate in effect on September 30, 2009. The FDIC Board ofDirectors also increased the annual assessment rates uniformly by 3 basis points beginning in 2011. As a result, the Bank’s totalassessment rate for purposes of estimating its assessments for 2011 and 2012 was increased by an annualized 3 basis points beginning in2011. The Bank’s total base assessment rate in effect on September 30, 2009 was 15.54 basis points and its prepayment amount was $8.2million. Unlike the special assessment, which the FDIC collected on September 30, 2009, the prepayment was recorded as a prepaidexpense and did not immediately affect the Bank’s earnings. Finally, the FDIC Board of Directors also voted to extend the DIF restorationperiod from seven to eight years.
In addition, all FDIC insured institutions are required to pay assessments to the FDIC at an annual rate of approximately 1.14basis points of insured deposits to fund interest payments on bonds issued by the Financing Corporation, an agency of the federalgovernment established to recapitalize the predecessor to the Savings Association Insurance Fund. These assessments will continue untilthe Financing Corporation bonds mature in 2017 through 2019.
Under the Dodd-Frank Act, the FDIC was given much greater discretion to manage the DIF, including where to set thedesignated reserve ratio (“DRR”). The Dodd-Frank Act increased the DRR from 1.15 percent to 1.35 percent and left unchanged therequirement that the FDIC Board set the DRR annually. The FDIC Board must set the DRR according to the following factors: (i) risk ofloss to the insurance fund; (ii) economic conditions affecting the banking industry; (iii) preventing sharp swings in the assessment ratesand (iv) any other factors it deems important. Based on those factors, the FDIC Board decided to set the DRR at 2.00 percent based on ahistorical analysis of losses to the DIF. The analysis showed in order to maintain a positive fund balance and steady, predictableassessment rates, the DRR must be at least 2.00 percent as a long-term, minimum goal. The DRR increase may increase FDIC depositinsurance assessments in the future.
Numerous regulations promulgated by the federal banking agencies, including the Bureau, as amended from time to time, affectthe business operations of the Bank. These include regulations relating to holding company regulation, equal credit opportunity, electronicfund transfers, fair credit reporting, fair debt collection, service members civil relief, collection of checks, insider lending, lending limits,
13
truth in lending, truth in savings, home ownership and equity protection, transactions with affiliates and availability of funds. Under FRBregulations, the Bank is required to maintain a reserve against its transaction accounts (primarily interest-bearing and noninterest-bearingchecking accounts). Because reserves must generally be maintained in cash or in noninterest-bearing accounts, the historical effect of thereserve requirements is to increase the Bank’s cost of funds. The Financial Services Regulatory Relief Act of 2006 authorized the FederalReserve banks to pay interest on reserves, subject to regulations of the FRB, effective October 1, 2011. However, the EmergencyEconomic Stabilization Act of 2008 changed the effective date for this authority to October 1, 2008.
The Bank is subject to regulation by the Bureau, established by the Dodd-Frank Act as an independent entity within the FederalReserve, which has the authority to promulgate consumer protection regulations applicable to all entities offering consumer financialservices or products, including banks. The Bureau has broad rule-making authority for a wide range of consumer protection laws,including but not limited to, laws relating to alternative mortgage transaction parity, consumer leasing, electronic fund transfers, equalcredit opportunity, fair credit billing, fair credit reporting, home owners protection, fair debt collection practices, lack of depositinsurance, consumer financial privacy, home mortgage disclosure, home ownership and equity protection, real estate settlementprocedures, mortgage licensing, truth in lending and truth in savings, among other laws. The Bureau also has the authority to prohibit“unfair, deceptive or abusive” acts and practices related to offering consumer financial services or products. Because the Bank has lessthan $10 billion in total assets, the primary federal regulator with examination authority over the Bank for compliance with consumerfinancial protection laws is the OCC.
The Gramm-Leach-Bliley Act (“GLBA”) includes provisions that give consumers protections regarding the transfer and use oftheir nonpublic personal information by financial institutions. In addition, states are permitted under the GLBA to have their own privacylaws, which may offer greater protection to consumers than the GLBA. Numerous states in which the Bank does business have enactedsuch laws.
The Bank Secrecy Act, the USA PATRIOT Act and rules and regulation of the Office of Foreign Assets Control (“OFACRules”) include numerous provisions designed to fight international money laundering and to block terrorist access to the U.S. financialsystem. We have established policies and procedures to ensure compliance with the provisions of the Bank Secrecy Act, the USAPATRIOT Act and the OFAC Rules.
The Community Reinvestment Act of 1977 (“CRA”) requires deposit institutions to assist in meeting the credit needs of theirmarket areas consistent with safe and sound banking practice. Under the CRA, each depository institution is required to help meet thecredit needs of its market areas by, among other things, providing credit to low- and moderate-income individuals and communities.Depository institutions are periodically examined for compliance with the CRA and are assigned ratings. The primary federal regulatoryagency assigns one of four possible ratings to an institution’s CRA performance and is required to make public an institution’s rating andwritten evaluation. The four possible ratings of meeting community credit needs are outstanding, satisfactory, needs to improve andsubstantial non-compliance. In the most recent examination, we received a “Satisfactory” CRA rating from the OTS. In the future, theOCC will examine the Bank for CRA compliance. The Bank has committed $8.0 million to three investments in limited partnershipequity funds as a cost effective way of meeting its obligations under the CRA. As of June 30, 2012, the Bank had invested $2.4 million ofits aggregate commitment to the three funds. These investments are subject to the Volcker Rule provisions of the Dodd-Frank Act, whichlimits the Bank’s ownership interest to 3% in any private equity funds and the federal agencies that will enforce the rule guaranteed that itwill become effective July 21, 2014. Thereafter, financial institutions can request up to three additional one year extensions from theFRB, and the FRB can grant up to a five year extension for investments in illiquid funds made on or before May 21, 2010, and funds thatare “designed primarily to promote the public welfare” are not subject to the rule as proposed. The Bank’s ownership percentage in two ofthe limited partnership equity funds are greater than 3% and would qualify as illiquid funds. In addition, these limited partnership equityfunds may qualify as “designed primarily to promote the public welfare” as the Bank invests in these funds as a cost effective way ofmeeting its obligations under the CRA. The Bank’s ownership percentage in the other limited partnership equity fund is less than 3%.
Transactions between the Bank and its nonbanking affiliates, including us, are subject to Section 23A of the Federal ReserveAct. In general, Section 23A imposes limits on the amount of such transactions, and also requires certain levels of collateral for loans toaffiliated parties. Affiliate transactions are also subject to Section 23B of the Federal Reserve Act, which generally requires that certaintransactions between the Bank and its affiliates be on terms substantially the same, or at least as favorable to the Bank, as those prevailingat the time for comparable transactions with or involving other nonaffiliated persons. The FRB’s Regulation W implements Section 23Aand 23B of the Federal Reserve Act and codifies prior interpretive guidance with respect to affiliate transactions. The Dodd-Frank Actamends the definition of “affiliate” in Section 23A of the Federal Reserve Act to include “any investment fund with respect to which amember bank or an affiliate thereof is an investment advisor.” This amendment became effective on July 21, 2012.
14
The restrictions on loans to directors, executive officers, principal stockholders and their related interests (collectively referredto herein as “insiders”) contained in the Federal Reserve Act and Regulation O apply to all insured depository institutions, theirsubsidiaries and holding companies. These restrictions include limits on loans to one borrower and conditions that must be met beforesuch a loan can be made. There is also an aggregate limitation on all loans to insiders and their related interests. These loans cannotexceed the institution’s total unimpaired capital and surplus, and the OCC may determine that a lesser amount is appropriate. Insiders aresubject to enforcement actions for knowingly accepting loans in violation of applicable restrictions. The Dodd-Frank Act amends thestatutes placing limitations on loans to insiders by including credit exposures to the person arising from a derivatives transaction,repurchase agreement, reverse repurchase agreement, securities lending transaction or securities borrowing transaction between themember bank and the person within the definition of an extension of credit to an insider. This amendment became effective on July 21,2012.
Subject to various exceptions, savings and loan holding companies and their affiliates are generally prohibited from tying theprovision of certain services, such as extensions of credit, to certain other services offered by a holding company or its affiliates.
We are subject to the requirements of the Secure and Fair Enforcement for Mortgage Licensing Act of 2008, or SAFE Act. TheSAFE Act requires mortgage loan originators who are employees of regulated institutions (including banks and certain of theirsubsidiaries) to be registered with the Nationwide Mortgage Licensing System and Registry (the “Registry”), a database established bythe Conference of State Bank Supervisors and the American Association of Residential Mortgage Regulators to support the licensing ofmortgage loan originators by each state. As part of this registration process, mortgage loan originators must furnish the Registry withbackground information and fingerprints for a background check. The SAFE Act generally prohibits employees of a regulated financialinstitution from originating residential mortgage loans without first registering with the Registry and maintaining that registration.Financial institutions must also adopt policies and procedures to ensure compliance with the SAFE Act.
Although our lending activities expose us to some risk of liability for environmental hazards, we do not currently have anysignificant liabilities for environmental matters.
INSURANCE Our broker/dealer subsidiaries are required by federal law to belong to the SIPC. SIPC provides protection for clients up to
$500,000 each with a limitation of $250,000 for claims for cash balances for all of our broker/dealers. Southwest Securities purchasesinsurance which, when combined with the SIPC insurance, provides coverage for Southwest Securities and SWS Financial in certaincircumstances for securities held in clients’ accounts with a $100 million aggregate limit.
The Bank’s deposits are insured by the DIF, which is administered by the FDIC, up to applicable limits for each depositor. TheFDIC’s DIF is funded by assessments on insured depository institutions, which depend on the risk category of an institution and theamount of insured deposits that it holds. The FDIC may increase or decrease the assessment rate schedule on a semi-annual basis.
EMPLOYEESAt June 29, 2012, we employed 1,065 individuals. Southwest Securities, SWS Financial and SWS Insurance employed 882 of
these individuals, 166 of whom were full-time registered representatives, and the Bank employed 183 individuals. In addition, 310registered representatives were affiliated with SWS Financial as independent contractors.
CUSTOMERSAs of the date of this report, we provided full-service securities brokerage to approximately 35,000 client accounts and clearing
services to approximately 130,000 additional client accounts. No single client accounts for a material percentage of our total business.
As of the date of this report, we provided deposit and loan services to approximately 93,000 customers through the Bank andits subsidiaries, which included approximately 89,000 Southwest Securities’ customer accounts. No single customer constitutes a materialpercentage of the Bank’s total business.
TRADEMARKSWe own various registered trademarks and service marks, including “Southwest Securities,” “SWS,” “SWS Financial,”
“Southwest Securities, FSB,” and “SWS Group,” which are not material to our business. We also own various design marks related tologos for various business segments.
15
EXECUTIVE OFFICERS OF THE REGISTRANT
The following table lists our executive officers and their respective ages and positions at September 6, 2012, followed by a briefdescription of their business experience over the past five years. Each listed person has been appointed to the indicated office by ourBoard of Directors.
Name Age Position
James H. Ross 62 Director, President and Chief Executive OfficerStacy M. Hodges 49 Executive Vice President, Chief Financial Officer and TreasurerDaniel R. Leland 51 Executive Vice PresidentRichard H. Litton 65 Executive Vice PresidentJeffrey J. Singer 43 Executive Vice PresidentW. Norman Thompson 56 Executive Vice President and Chief Information OfficerAllen R. Tubb 58 Executive Vice President, General Counsel and Secretary
James H. Ross was named President, Chief Executive Officer and a member of the Board of Directors of SWS Group on October 28,2010. Prior to October 28, 2010, Mr. Ross had served as interim CEO and member of the Board since August 18, 2010. He previouslyserved as Executive Vice President since November 2004 and, in September 2007, was elected President and Chief Executive Officer ofSouthwest Securities. Mr. Ross served as the Director of the Private Client Group at Southwest Securities from March 2004 to March2008. He served as Chief Executive Officer of SWS Financial from September 2004 to April 2011. Mr. Ross came to SouthwestSecurities in 2004 to head the Private Client Group’s brokerage office in Dallas, Texas. Prior to coming to Southwest Securities, Mr. Rosswas with UBS Paine Webber, where, from April 1991 to December 2003, Mr. Ross held various positions from financial advisor tobranch manager. He began his securities industry career in 1975.
Stacy M. Hodges was named Chief Financial Officer and Treasurer on August 25, 2011 and prior to August 25, 2011, had served asinterim Chief Financial Officer and Treasurer since October 12, 2010. She has served as Executive Vice President since February 1999.She previously served as Treasurer and Chief Financial Officer from August 1998 to August 2002. Ms. Hodges was Controller fromNovember 1994 to August 1998. Ms. Hodges served as Director of Southwest Securities from June 1997 to August 2002 and fromJanuary 2012 to the present and served as Chief Financial Officer of Southwest Securities from June 1997 to December 2011. Prior tojoining Southwest Securities, Ms. Hodges was a Senior Audit Manager in the Financial Services division of KPMG LLP. Ms. Hodgesserves as a trustee on the board of SIFMA’s Securities Industry Institute as well as a member of the Baylor University AccountingAdvisory Council. Ms. Hodges is a member of the American Institute of Certified Public Accountants and the Texas Society of CPAs.
Daniel R. Leland has served as Executive Vice President since May 2007. Mr. Leland was also Executive Vice President from February1999 to September 2004. He served as President and Chief Executive Officer of Southwest Securities from August 2002 to September2004. He also served as Executive Vice President of Southwest Securities from July 1995 to August 2002 and was re-elected in February2006. Mr. Leland began his career at Barre & Company in June 1983 where he was employed in various capacities in fixed income salesand trading before becoming President of Barre & Company in 1993. Mr. Leland has been an arbitrator for the National Association ofSecurities Dealers (NASD) and is a past Vice Chairman of the District 6 Business Conduct Committee. He is a past board member of theBond Dealers of America and currently serves as the chair of the Taxable Committee.
Richard H. Litton has served as Executive Vice President and Executive Vice President of Southwest Securities for the Public FinanceDivision since July 1995. Beginning in September 2006, he became primarily responsible for the entire municipal securities product areaof Southwest Securities. Previously, Mr. Litton was President of a regional investment bank and headed the Municipal Group in theSouthwest for Merrill Lynch. Mr. Litton served on various advisory committees for the Texas House of Representatives’ FinancialInstitutions Committee, is a past member and director of the Municipal Advisory Council of Texas and currently serves on the MunicipalExecutive Committee and the Municipal Legal Advisory Committee of the Securities Industry and Financial Markets Association(SIFMA).
Jeffrey J. Singer was elected Executive Vice President in November 2008. He is also an Executive Vice President of SouthwestSecurities and heads its corporate finance business. From 2005 to 2008, Mr. Singer was President of Levantina USA, Inc., the NorthAmerican subsidiary of Spain’s Grupo Levantina, the largest global producer of granite and marble materials. Prior to joining LevantinaUSA, Inc. in 2005, Mr. Singer spent his entire career working in the corporate finance sector for major investment banking firms such asDonaldson, Lufkin & Jenrette, Citigroup’s investment bank and Dillon Read (now part of UBS, Inc.).
16
W. Norman Thompson has served as Executive Vice President and Chief Information Officer since January 1995. Mr. Thompson wasassociated with Kenneth Leventhal & Co. (now a part of Ernst & Young LLP) in various capacities ranging from Audit Manager to SeniorConsulting Manager from 1987 to 1994. Previously, Mr. Thompson was an auditor with KPMG LLP from 1981 to 1987. In the capacitieshe held with both Kenneth Leventhal & Co. and KPMG LLP, he was heavily involved in information technology auditing and consulting.
Allen R. Tubb was elected Vice President, General Counsel and Secretary in August 2002 and Executive Vice President in November2011. He joined SWS as Corporate Counsel and Secretary in October 1999. From 1979 to 1999, Mr. Tubb was employed with OryxEnergy Company and its predecessor Sun Exploration and Production Company in various capacities including Chief Counsel,Worldwide Exploration and Production. Mr. Tubb is a member of the Texas Bar Association.
ITEM 1A. RISK FACTORS
Our business, reputation, financial condition, operating results and cash flows can be impacted by a number of factors. Many ofthese factors are beyond our control and may increase during periods of market volatility or reduced liquidity. The potential harm fromany one of these risks, or others, could cause our actual results to vary materially from recent results or from anticipated future results.Some risks may adversely impact not only our own operations, but the banking or securities industry in general which could also producemarked swings in the trading price of our securities.
RISKS SPECIFIC TO OUR INDUSTRIES
Recently enacted regulatory reform legislation will impose additional regulatory requirements on us. Compliance with suchregulation may increase our costs and limit our ability to pursue business opportunities. On July 21, 2010, the President of theUnited States signed into law the Dodd-Frank Act. The ultimate effect of the Dodd-Frank Act and its implementing regulations on thefinancial services industry in general, and on us in particular, is uncertain at this time. SWS Group and the Bank will be subject tosignificant additional regulatory requirements, which may have a material impact on each or both of them, or SWS as a whole. The keyeffects of the Dodd-Frank Act on our business include:
• changes to the supervisory structure for SWS Group and the Bank;• changes to regulatory capital requirements applicable to SWS Group and the Bank;• establishment of the Bureau with broad authority to implement new consumer protection regulations; • increases in the minimum reserve ratio for the deposit insurance fund of the FDIC to 2.00% and a change in the base for FDIC
insurance assessments; and• proposed prohibitions on “proprietary trading” and proposed limitations with respect to the sponsorship of, and investment in,
hedge funds and private equity.
As a result of the Dodd-Frank Act, the OTS was abolished and, on July 21, 2011, the OCC took over supervision and regulationof federal thrifts, such as the Bank, and the FRB took over supervision and regulation of savings and loan holding companies, includingSWS Group. As a result, we expect to become subject to regulatory capital and activity requirements similar to those currently imposedon bank holding companies regulated by the FRB. The Dodd-Frank Act requires that SWS Group serve as a “source of strength” for theBank and will eventually result in new minimum capital requirements for depository institution holding companies.
The Dodd-Frank Act also created a new independent regulatory body, the Bureau, which has been given broad rulemakingauthority to implement the consumer protection laws that apply to banks and thrifts and to prohibit “unfair, deceptive or abusive” acts andpractices. The Dodd-Frank Act permits states to adopt consumer protection laws and regulations that are stricter than those regulationspromulgated by this new independent regulatory body.
Full implementation of the Dodd-Frank Act will require many new rules to be issued by numerous federal regulatory agenciesover the next several years. Given the significance of the changes and the additional regulatory action required for many of the newprovisions, we cannot predict all of the ways or the degree to which our business, financial condition and results of operations may beaffected by the Dodd-Frank Act once it is fully implemented. We expect, at a minimum, that our compliance costs will increase.
We may be adversely affected by increased governmental and regulatory scrutiny or negative publicity. Governmental scrutinyfrom regulators, legislative bodies and law enforcement agencies with respect to matters relating to compensation, our business practices,our past actions and other matters has increased dramatically in the past several years. The financial crisis and the current political andpublic sentiment regarding financial institutions has resulted in a significant amount of adverse press coverage, as well as adversestatements or charges by regulators or other government officials. Press coverage and other public statements that assert some form of
17
wrongdoing often result in some type of investigation by regulators, legislators and law enforcement officials or in lawsuits. Respondingto these investigations and lawsuits, regardless of the ultimate outcome of the proceeding, is time consuming and expensive and can divertthe time and effort of our senior management from our business. Penalties and fines sought by regulatory authorities have increasedsubstantially over the last several years, and certain regulators have been more likely in recent years to commence enforcement actions orto advance or support legislation targeted at the financial services industry. Adverse publicity, governmental scrutiny and legal andenforcement proceedings can also have a negative impact on our reputation and on the morale and performance of our employees, whichcould adversely affect our businesses and results of operations.
Failure to comply with the extensive state and federal laws governing our securities and banking operations, or the regulationsadopted by several self-regulatory agencies having jurisdiction over us, could have material adverse consequences for us.Broker/dealers and banks are subject to regulation in almost every facet of their operations. Our ability to comply with these regulationsdepends largely on the establishment and maintenance of an effective compliance system as well as our ability to attract and retainqualified compliance personnel. We could be subject to disciplinary or other actions due to claimed non-compliance with these laws orregulations or possibly for the claimed non-compliance of our correspondents. If a claim of non-compliance is made by a regulatoryauthority, the efforts of our management could be diverted to responding to such claim and we could be subject to a range of possibleconsequences, including the payment of fines and the suspension of one or more portions of our business. Our clearing contractsgenerally include automatic termination provisions that are triggered in the event we are suspended from any of the national exchanges ofwhich we are a member for failure to comply with the rules or regulations thereof. Failure to comply with these laws and regulationscould have a material adverse effect on our business, financial condition, results of operations and cash flow.
Our business has been and may continue to be materially and adversely affected by financial market conditions and economicconditions generally. Our business is affected by conditions in the financial markets and economic conditions generally around theworld. The financial services industry and the securities markets generally are materially and adversely affected by recessionaryenvironments which can cause significant declines in the values of nearly all asset classes. Concerns about financial institutionprofitability and solvency as a result of general market conditions, particularly in the credit markets, may cause our clients to reduce thelevel of business that they do with us. Declines in asset values, the lack of liquidity, general uncertainty about economic and marketactivity and a lack of consumer and investor confidence have negatively impacted, and may continue to negatively impact, our business.
Our financial performance is highly dependent on the business environment in which we operate. A favorable businessenvironment is generally characterized by, among other factors, high global gross domestic product growth, stable geopolitical conditions,transparent and efficient capital markets, liquid markets with active investors, low inflation, high business and consumer confidence,active new issuance markets for fixed income and equity securities and strong business earnings. Slowing growth, contraction of credit,increasing energy prices, declines in business or investor confidence or risk tolerance, increases in inflation, higher unemployment,outbreaks of hostilities or other geopolitical instability, corporate, political or other scandals that reduce investor confidence in capitalmarkets and natural disasters, among other things, can affect the global financial markets. In addition, economic or political pressures in acountry or region may cause local market disruptions and currency devaluations, which may also affect markets generally. In the event ofchanges in market conditions, such as interest or foreign exchange rates, equity, fixed income, commodity or real estate valuations,liquidity, availability of credit or volatility, our business could be adversely affected in many ways.
Overall, the business environment since 2008 has been extremely adverse. While many economists believe the recession endedin June 2009, unemployment and tight credit markets along with problems in Europe continue to create a fragile economic environment,and there is no guarantee that conditions will not worsen again leading to further decline in economic and market conditions. On August5, 2011, Standard & Poor’s lowered its long term sovereign credit rating on the United States of America from AAA to AA+. Creditagencies have also reduced the credit ratings of various sovereign nations in recent months. While the ultimate impact of such action isinherently unpredictable, these downgrades could have a material adverse impact on financial markets and economic conditionsthroughout the world, including, specifically, the United States. Moreover, the market’s anticipation of these impacts could have amaterial adverse effect on our business, financial condition and liquidity. Although Texas was largely insulated from severe job loss andreal estate market deterioration at the start of the recession, it has now experienced distress in residential and commercial real estatevalues as well as elevated unemployment. These conditions have had, and will continue to have, a direct and material impact on ourresults of operations and financial condition because performance in the financial services industry is heavily influenced by the overallstrength of economic conditions and financial market activity.
Our ability to access capital markets is dependent on market conditions and our credit standing, which could change unfavorably.Factors that are significant to the determination of our credit worthiness or otherwise affect our ability to raise financing include the leveland volatility of our earnings and whether we have net losses; our relative competitive position in the markets in which we operate; ourproduct diversification; our ability to retain key personnel; our risk profile; our risk management policies; our cash liquidity; our capitaladequacy; our corporate lending credit risk and legal and regulatory developments. Additionally, market conditions can be unfavorable for
18
our industry causing banks and other liquidity providers to reduce or limit credit to our industry. This could limit the availability of, andthus our access to, capital and/or increase the cost of funding new or existing businesses.
Our revenues may decrease if securities transaction volumes decline. Our securities business depends upon the general volume oftrading in the U.S. securities markets. If the volume of securities transactions should decline, revenues from our securities brokerage,securities lending and clearing businesses would decrease and our business, financial condition, results of operations and cash flow wouldbe materially and adversely impacted.
Market fluctuations could adversely impact our securities business. We are subject to risks as a result of fluctuations in the securitiesmarkets. Our securities trading, market-making and underwriting activities involve the purchase and sale of securities as a principal,which subjects our capital to significant risks. Market conditions could limit our ability to sell securities purchased or to purchasesecurities sold in such transactions. If price levels for equity securities decline generally, the market value of equity securities that we holdin our inventory could decrease and trading volumes could decline. In addition, if interest rates increase, the value of debt securities wehold in our inventory would decrease. Rapid or significant market fluctuations could adversely affect our business, financial condition,results of operations and cash flow.
In addition, during periods of market disruption, it may be difficult to value certain assets if comparable sales become lessfrequent or market data becomes less observable. Certain classes of assets or loan collateral that were in active markets with significantobservable data may become illiquid due to the current financial environment. In such cases, asset valuations may require more estimationand subjective judgment. The rapidly changing real estate market conditions could materially impact the valuation of assets and loancollateral as reported within our financial statements and changes in estimated values could vary significantly from one period to the next.Decreases in value may have a material adverse impact on our future financial condition or operating results.
The soundness of other financial institutions could adversely affect us. Our ability to engage in routine funding transactions could beadversely affected by the actions and commercial soundness of other financial institutions. Financial services institutions are interrelatedas a result of trading, clearing, counterparty or other relationships. We have exposure to many different counterparties and we routinelyexecute transactions with counterparties in the financial services industry, including brokers and dealers, commercial banks, investmentbanks, mutual and hedge funds, and other institutional clients. As a result, defaults by, or even speculation about, one or more financialservices institutions, or the financial services industry generally, have led to market wide liquidity problems and could lead to losses ordefaults by us or by other institutions. Many of these transactions expose us to credit risk in the event of default of our counterparty orclient. In addition, our credit risk may be exacerbated when the collateral held by us cannot be realized or is liquidated at prices notsufficient to recover the full amount of the receivable due us. Any such losses could be material and could materially and adversely affectour business, financial condition, results of operations and cash flow.
RISKS RELATED TO OUR COMPANY
The Bank is currently subject to a Cease and Desist Order that may adversely affect our business. On February 4, 2011, the Bankentered into a Stipulation and Consent to Issuance of an Order to Cease and Desist with the OTS whereby the Bank consented to theissuance of the Order.
The Order and the March 16, 2012 modification (“Modified Order”) as discussed in Note 29 in the Notes to the ConsolidatedFinancial Statements for the fiscal years ended June 29, 2012, June 24, 2011 and June 25, 2010 included under Item 8. “FinancialStatements and Supplementary Data,” requires that the Bank maintain a Tier I (core) capital ratio equal to or greater than 8 percent and atotal risk-based capital ratio equal to or greater than 12 percent. The Modified Order restricts lending by the Bank but allowed for relieffrom certain operating and growth restrictions required under the Order. These restrictions may reduce earnings and growth of the Bank.Depending on the decrease in total assets held by the Bank, if any, and satisfaction of other aspects of the Order, the OCC (as successor tothe OTS) can institute other corrective measures and has broad enforcement powers to impose additional restrictions on our operations.
Deteriorating credit quality, particularly in commercial, construction and real estate loans, has adversely impacted the Bank andmay continue to adversely impact the Bank. Beginning in fiscal 2009, the Bank began to experience a downturn in the overall creditperformance of its real estate loans held for investment, as well as acceleration in the deterioration of general economic conditions inTexas and other areas of the United States. This deterioration, as well as increases in Texas unemployment levels, worsened in the thirdquarter of fiscal 2010. These conditions have caused increased financial stress on many of the Bank’s borrowers and have negativelyimpacted their ability to repay their loans. Classified and non-performing assets increased significantly in fiscal 2010 and 2011 and realestate collateral values continued to decline in both fiscal 2010 and 2011. Due to these factors, the Bank significantly increased its loanloss reserves in fiscal 2010 and 2011.
19
Although both classified and non-performing assets have improved throughout fiscal 2012, the Bank expects credit quality toremain challenging and at elevated levels of risk at least through June 30, 2013. Continued deterioration in the credit quality of the Bank’sreal estate loan portfolio could significantly increase non-performing loans, require additional increases in loan loss reserves and elevatecharge-off levels. The occurrence of any of these events could have a material adverse effect on the Bank’s capital, financial condition andresults of operations and increase the risk of additional regulatory action.
The Bank is subject to regulatory capital requirements that may limit its operations and potential growth. The Bank is a federalsavings bank that is subject to comprehensive supervision and regulation of the OCC, including risk-based, leverage and tangible capitalratio requirements. Capital requirements may rise above normal levels when the Bank experiences deteriorating earnings and creditquality, and the OCC may increase the Bank’s capital requirements based on general economic conditions and the Bank’s particularcondition, risk profile and growth plans. Our Order with the OCC provides that the Bank will maintain a total Tier I (core) capital ratio of8% and risk-based capital ratio of 12%. Compliance with capital requirements may limit the Bank’s operations that require the intensiveuse of capital and could adversely affect the Bank’s ability to expand or maintain present business levels.
Failure to achieve and maintain effective internal controls could result in a misstatement of our financial statements. Pursuant toSection 404 of the Sarbanes-Oxley Act of 2002, we are required to furnish an annual report by our management assessing theeffectiveness of our internal control over financial reporting. This assessment must include disclosure of any material weaknesses in ourinternal control over financial reporting identified by management. A material weakness is a control deficiency, or a combination ofdeficiencies, that results in more than a remote likelihood that a material misstatement of our annual or interim financial statements willnot be prevented or detected.
Ineffective internal controls could adversely impact our ability to provide timely and accurate financial information. If we areunsuccessful in maintaining effective internal controls, we may be unable to report financial information timely and accurately or tomaintain effective disclosure controls and procedures. Any such failure in the future could also adversely affect the results of periodicmanagement evaluations and annual auditor attestation reports regarding disclosure controls and effectiveness of our internal control overfinancial reporting required under Section 404 of the Sarbanes-Oxley Act of 2002 and the rules promulgated thereunder. If we are unableto report financial information in a timely and accurate manner or to maintain effective disclosure controls and procedures, we could be indefault under our Credit Agreement or be subject to, among other things, investigations or regulatory or enforcement actions by the SEC,the Federal Reserve, the FDIC, the OCC or other governmental authorities.
In addition, any failure to maintain effective internal controls could cause investors to lose confidence in the accuracy andcompleteness of our financial reports, which in turn could cause our stock price to decline.
Risk management processes may not fully mitigate exposure to the various risks that we face, including market, liquidity andcredit risk. We continue to refine our risk management techniques, strategies and assessment methods on an ongoing basis. However, riskmanagement techniques and strategies, both ours and those available to the market generally, may not be fully effective in mitigating ourrisk exposure in all economic market environments or against all types of risk. For example, we might fail to identify or anticipateparticular risks that our systems are capable of identifying, or the systems that we use, and that are used within the industry generally,may not be capable of identifying certain risks. Some of our strategies for managing risk are based upon our use of observed historicalmarket behavior. We apply statistical and other tools to these observations to quantify our risk exposure. Any failures in our riskmanagement techniques and strategies to accurately quantify our risk exposure could limit our ability to manage risks. In addition, anyrisk management failures could cause our losses to be significantly greater than the historical measures indicate. Further, our quantifiedmodeling does not take all risks into account. As a result, we also take a qualitative approach in reducing our risk. Our more qualitativeapproach to managing those risks could prove insufficient, exposing us to material unanticipated losses.
Our business is significantly dependent on net interest margins. The profitability of our margin and stock lending businesses dependsto a great extent on the difference between interest income earned on loans and investments of customer cash balances and the interestexpense paid on customer cash balances and borrowings. The earnings and cash flows of the Bank are also dependent upon the differencebetween interest income earned on interest-earning assets such as loans and securities and interest expense paid on interest-bearingliabilities such as deposits and borrowed funds.
Interest rates are sensitive to many factors that are beyond our control, including general economic conditions and policies ofvarious governmental and regulatory agencies and, in particular, the Board of Governors of the Federal Reserve System. Changes inmonetary policy, including changes in interest rates, could affect the interest we receive on loans and securities and the amount of interestwe pay on deposits and borrowings. Such changes could also affect our ability to originate loans and obtain deposits and the fair value ofour financial assets and liabilities. If the interest rates paid on deposits and other borrowings increase at a faster rate than the interest ratesreceived on loans and other investments, our net interest income, and therefore our earnings, could be adversely affected. Earnings could
20
also be adversely affected if the interest rates received on loans and other investments fall more quickly than the interest rates paid ondeposits and other borrowings.
Our net interest margins may decrease based on the mix of assets in the Bank’s portfolio and our investment strategy. In recentyears, interest rates have declined to levels that have negatively impacted the net interest margin at the Bank. Additionally, as wereposition the Bank’s balance sheet to include a portfolio of conservative investment securities, the net interest margin on these assets islikely to be less than we have historically earned on our loan portfolio. Our earnings and results of operations could be adversely affectedby any reduction in our net interest margin due to our investment policies or market dynamics.
We may not be able to reduce our operating expenses as a way to reduce operating losses. To the extent our net interest incomedeclines or we face other declines in revenues, we may look to reduce our operating expenses where possible. However, we have limitedcontrol over certain costs, and in particular, the cost of meeting regulatory requirements and our cost to access capital or financing, ifneeded. If we are unable to reduce our operating expenses, our results of operations could be adversely affected.
Our margin lending, stock lending, securities trading and execution, bank lending and mortgage purchase businesses are allsubject to credit risk. Credit risk in all areas of our business increases if securities prices decline rapidly because the value of ourcollateral could fall below the amount of indebtedness it secures. In rapidly appreciating markets, credit risk increases due to shortpositions. Our securities lending business as well as our securities trading and execution businesses subject us to credit risk if acounterparty fails to perform or if collateral securing its obligations is insufficient. In securities transactions, we are subject to credit riskduring the period between the execution of a trade and the settlement by the customer.
In addition, the Bank is exposed to the risk that its loan customers may not repay their loans in accordance with their terms, thecollateral securing the loans may be insufficient, or its loan loss reserve may be inadequate to fully compensate the Bank for theoutstanding balance of the loan plus the costs to dispose of the collateral. Our mortgage warehousing activities subject us to credit riskduring the period between funding by the Bank and when the mortgage company sells the loan to a secondary investor.
Significant failures by our customers, including correspondents, or clients to honor their obligations, together with insufficientcollateral and reserves, could have a material adverse affect on our business, financial condition, results of operations and cash flow.
The Bank’s allowance for loan losses may not be sufficient to cover actual loan losses. The Bank’s borrowers may fail to repay theirloans according to the loan terms, and the collateral securing the payment of these loans may be insufficient to assure repayment. Suchloan losses could have a material adverse effect on our operating results. We make various assumptions, estimates and judgments aboutthe collectibility of the Bank’s loan portfolio, including the creditworthiness of the borrowers and the value of the real estate and otherassets serving as collateral for the loans. In determining the amount of the allowance for loan losses, the Bank relies on a number offactors, including its experience and evaluation of economic conditions. If the Bank’s assumptions prove to be incorrect, its allowance forloan losses may not be sufficient to cover losses inherent in its loan portfolio, and adjustments may be necessary that would have amaterial adverse effect on our operating results.
The Bank’s commercial real estate, commercial and mortgage lending businesses are dependent on the general health of the Texasand New Mexico economies. The downturn in these economies has adversely affected these lines of business, and consequently ourfinancial condition, results of operations and cash flow. Any further deterioration in the economies of Texas or New Mexico could have anadverse impact on our financial condition, results of operations and cash flow.
Our business and prospects, including our ability to attract and retain clients and employees, may be adversely affected if ourreputation is harmed. Our business is subject to significant reputational risks. If we fail, or appear to fail, to deal appropriately withvarious legal, regulatory or business issues, our reputation, business and prospects, including our ability to attract and retain clients andemployees, could be seriously harmed. This could be the case not only in situations involving actual violations of law but also incircumstances where no laws have been violated. Our reputation could be harmed in many different ways, including as a result ofperceived or actual failure to address conflicts of interest or ethical issues; failure to comply with legal or regulatory requirements;allegations of money laundering; violation of privacy policies; failure to properly maintain client and employee personal information;failure to maintain adequate or accurate records; allegations of unfair sales and trading practices; and improper identification of the legal,reputational, credit, liquidity and market risks inherent in our products. Publicity of a failure to appropriately address these issues couldresult in litigation claims or subject us to enforcement actions, fines and penalties and cause us to incur related costs and expenses. Legalliability or regulatory actions as a result of negative publicity could in turn cause significant additional reputational harm.
We depend on the highly skilled, and often specialized, individuals we employ. Competition for the services of personnel in our loanproduction, private client group, securities lending and trading businesses is intense, and we may not be able to retain them. We generally
21
do not enter into employment agreements or noncompetition agreements with our employees. Our business, financial condition, operatingresults and cash flow could be materially impacted if we were to lose the services of certain of our loan production, private client group,securities lending or trading professionals. In particular, in our retail and institutional securities brokerage business we depend on thebrokers and financial advisors that advise our clients, certain of whom generate significant income for us.
We depend on our computer and communications systems and an interruption in service would negatively affect our business.Our businesses rely on electronic data processing and communications systems. The effective use of technology allows us to better serveclients, increases efficiency and enables firms to reduce costs. Our continued success will depend, in part, upon our ability to successfullymaintain, secure and upgrade the capability of our systems, our ability to address the needs of our clients by using technology to provideproducts and services that satisfy their demands and our ability to retain skilled information technology employees. Significantmalfunctions or failures of our computer systems, computer security or any other systems in the trading process (e.g., record retention anddata processing functions performed by third parties, and third party software, such as Internet browsers) could cause delays in customertrading activity. Such delays could cause substantial losses for customers and could subject us to claims from customers for losses,including litigation claiming fraud or negligence. In addition, if our computer and communications systems fail to operate properly,regulations would restrict our ability to conduct business. Any such failure could prevent us from collecting funds relating to customertransactions, which would materially impact our cash flow. Any computer or communications system failure or decrease in computersystem performance that causes interruptions in our operations could have a material adverse effect on our business, financial condition,results of operations and cash flow.
The financial services industry is continually undergoing rapid technological change with frequent introductions of newtechnology-driven products and services. The effective use of technology increases efficiency and enables financial institutions to betterserve customers and to reduce costs. Our future success depends, in part, upon our ability to address the needs of our customers by usingtechnology to provide products and services that will satisfy customer demands, as well as to create additional efficiencies in ouroperations. Many of our competitors have substantially greater resources to invest in technological improvements. We may not be able toeffectively implement new technology-driven products and services or be successful in marketing these products and services to ourcustomers. Failure to successfully keep pace with technological change affecting the financial services industry could have a materialadverse impact on our business and, in turn, our financial condition and results of operations.
Our computer systems and network infrastructure could be vulnerable to security problems. Hackers may attempt to penetrate ournetwork security which could have a material adverse effect on our business. A party who is able to penetrate our network security couldmisappropriate proprietary information. We rely on encryption and authentication technology licensed from third parties to provide thesecurity and authentication necessary to effect secure transmission of confidential information. Advances in computer capabilities,discoveries in the field of cryptography and other discoveries, events or developments could lead to a compromise or breach of thealgorithms that our licensed encryption and authentication technology uses to protect such confidential information. We may be requiredto expend significant capital and resources and engage the services of third parties to protect against the threat of such security,encryption and authentication technology breaches or to alleviate problems caused by such breaches. Security breaches or the inadvertenttransmission of computer viruses could expose us to a risk of loss or litigation and possible liability which could have a material adverseaffect on our business, financial condition, results of operations and cash flow.
Our Credit Agreement contains restrictions and covenants that impact our business and expose us to risks that could adverselyaffect our liquidity and financial condition. On July 29, 2011, we entered into a $100.0 million Credit Agreement with HilltopHoldings, Inc. (“Hilltop”) and Oak Hill Capital Partners III, L.P. (“OHCP”) and Oak Hill Capital Management Partners III, L.P.(collectively with OHCP, “Oak Hill”). The Credit Agreement contains customary covenants, which require us to, among other things:
• maintain a tangible net worth at least equal to the sum of $275.0 million and 20% of cumulative consolidated net income(as defined in the Credit Agreement) for each fiscal quarter for which consolidated net income is positive;
• maintain a minimum unrestricted cash balance (as defined in the Credit Agreement) of at least $4.0 million;• maintain an excess net capital balance at Southwest Securities of at least $100.0 million as of the end of each calendar
month; and• adhere to the requirements of the Order.
In addition, certain of these covenants limit our and certain of our subsidiaries’ ability to, among other things:
• incur additional indebtedness;• dispose of or acquire certain assets;• pay dividends on our capital stock;
22
• make investments, including acquisitions; and• enter into transactions with affiliates.
If we are unable to generate sufficient cash flow or otherwise obtain the funds necessary to make required payments under theCredit Agreement, or we fail to comply with the requirements of our indebtedness, we could default under the Credit Agreement. Anydefault that is not cured or waived could result in the acceleration of the obligations under the Credit Agreement. Any such default whichactually causes an acceleration of obligations could have a material adverse effect on our liquidity and financial condition. Additionally,the covenants in such agreement or future debt agreements may restrict the conduct of our business, which could adversely affect ourbusiness by, among other things, limiting our ability to take advantage of financings, mergers, acquisitions and other corporateopportunities that may be beneficial to our business.
Misconduct or errors by our employees or entities with which we do business could harm us and are difficult to detect andprevent. There have been a number of highly publicized cases involving fraud or other misconduct by employees in the financial servicesindustry in recent years, and we run the risk that employee misconduct or employee error could occur at our company. For example,misconduct could involve the improper use or disclosure of confidential information, and error could involve the failure to follow orimplement procedures, either of which could result in regulatory sanctions and serious reputational or financial harm. It is not alwayspossible to deter misconduct or errors and the precautions we take to detect and prevent this activity may not be effective in all cases. Ourability to detect and prevent misconduct or errors by entities with which we do business may be even more limited. We may sufferreputational harm for any misconduct or errors by our employees or those entities with which we do business.
We face liquidity risk, which is the potential inability to repay short-term borrowings with new borrowings or assets that can bequickly converted into cash while meeting other obligations and continuing to operate as a going concern. Our liquidity may beimpaired due to circumstances that we may be unable to control, such as general market disruptions or an operational problem that affectsour trading clients, depositors, third parties or ourselves. Our ability to sell assets may also be impaired by regulatory constraints or ifother market participants are seeking to sell similar assets at the same time. Our inability to borrow funds or sell assets to meet maturingobligations would have an adverse effect on our business, financial condition, results of operations and cash flow.
In addition, if our customers decide not to invest with us, our liquidity could be adversely affected. If our retail banking andsecurities clients withdraw their deposits or our institutional customers withdraw their trading lines with us, our liquidity would beimpaired. Furthermore, we currently have access to advances from the Federal Home Loan Bank (“FHLB”). If we become subject toregulatory actions, we may not have access to these advances and our liquidity could be impaired.
Our securities business is subject to numerous operational risks. Our securities business must be able to consistently and reliablyobtain securities pricing information and accurately assess loan values, process transactions and provide reports and other customerservice. Any failure to keep current and accurate books and records can render us liable to disciplinary action by governmental and self-regulatory authorities, as well as to claims by our clients. If any of our financial, portfolio accounting or other data processing systems donot operate properly or are disabled, or if there are other shortcomings or failures in our internal processes, people or systems, we couldsuffer an impairment to our liquidity, a financial loss, a disruption of our businesses, liability to our customers and clients, regulatoryproblems or damage to our reputation. These systems may fail to operate properly or become disabled as a result of events that are whollyor partially beyond our control, including a disruption of electrical or communications services or our inability to occupy one or more ofour buildings. In addition, our operations are dependent upon information from, and communications with, third parties, and operationalproblems at third parties may adversely affect our ability to carry on our business.
We are subject to risks relating to litigation and potential securities law liabilities. Many aspects of our business involve substantialrisks of liability. In the normal course of our business, we have been subject to claims by clients alleging unauthorized trading, churning,mismanagement, suitability of investments, breach of fiduciary duty or other alleged misconduct by our employees or brokers. We aresometimes brought into lawsuits based on allegations concerning our correspondents. As underwriters, we are subject to substantialpotential liability for material misstatements and omissions in prospectuses and other communications with respect to underwrittenofferings of securities. Prolonged litigation producing significant legal expenses or a substantial settlement or adverse judgment couldhave a material adverse effect on our business, financial condition, results of operations and cash flow.
We face strong competition from larger firms. The financial services business is intensely competitive and we expect it to remain so.We compete on the basis of a number of factors, including client relationships, reputation, the abilities of our professionals, market focusand the relative quality and price of our services and products. Many of our competitors have a broader range of products and services,greater financial and marketing resources, larger customer bases, greater name recognition, more professionals to serve their clients’ needsand better established relationships with clients than we have. These larger competitors may be better able to respond to industry change,compete for skilled professionals, finance acquisitions, fund internal growth and compete for market share generally.
23

Our portfolio trading business is highly price competitive and serves a very limited market. Our portfolio trading business servesone small component of the portfolio trading execution market with a small customer base and a high service model, chargingcompetitive commission rates. Consequently, growing or maintaining market share is very price sensitive. We rely upon a high level ofcustomer service and product customization to maintain our market share; however, should prevailing market prices fall, or the size of ourmarket segment or customer base decline, our profitability would be adversely impacted. In addition, in our portfolio trading business, wepurchase securities as principal, which subjects our capital to significant risks. Further, the business may be materially impacted. See “–Market fluctuations could adversely impact our securities business.”
Our existing correspondents may choose to perform their own clearing services, move their clearing business to one of ourcompetitors or exit the business. As our correspondents’ operations grow, they often consider the option of performing clearingfunctions themselves, in a process referred to as “self-clearing.” The option to convert to self-clearing operations may be attractive due tothe fact that as the transaction volume of a broker/dealer grows, the cost of implementing the necessary infrastructure for self-clearingmay eventually be offset by the elimination of per transaction processing fees that would otherwise be paid to a clearing firm.Additionally, performing their own clearing services allows self-clearing broker/dealers to retain their customers’ margin balances, freecredit balances and securities for use in margin lending activities. Furthermore, our correspondents’ may decide to use the clearingservices of one of our competitors or exit the business. Significant losses to self-clearing could have a material adverse affect on ourbusiness, financial condition, results of operations and cash flow.
Several of our product lines rely on favorable tax treatment and changes in federal tax law could impact the attractiveness ofthese products to our customers. We offer a variety of services and products, such as Individual Retirement Accounts and municipalbonds that rely on favorable federal income tax treatment to be attractive to our customers. Should favorable tax treatment of theseproducts be eliminated or reduced, sales of these products could be materially impacted, which could have a material adverse effect onour business, financial condition, results of operations and cash flow.
We may not be able to realize the value of our deferred tax asset. We recognize deferred tax assets and liabilities based on differencesbetween the financial statement carrying amounts and the tax basis of assets and liabilities. As of June 29, 2012, our net deferred taxassets were approximately $23.7 million. We regularly review our deferred tax assets for recoverability based on our history of earnings,expectations for future earnings and expected timing of reversals of temporary differences. Realization of deferred tax assets ultimatelydepends on the existence of sufficient taxable income, including taxable income in prior carry-back years, as well as future taxableincome.
Rising insurance costs and regulations could adversely affect our business. Our operations and financial results are subject to risksand uncertainties associated with the increasing costs and regulations related to our use of a combination of insurance, self-insuredretention and self-insurance for a number of risks, including, without limitation, property and casualty, workers’ compensation, generalliability, and the company-funded portion of employee-related health care benefits. While the nature and scope of increasing costs andregulatory changes cannot be predicted, they could have a material adverse effect on our business, financial condition, results ofoperations and cash flow.
Strategic investments or acquisitions may result in additional risks and uncertainties in our business. We intend to grow our corebusinesses through both internal expansion and through strategic investments and acquisitions. To the extent we make strategicinvestments or acquisitions, we face numerous risks and uncertainties combining or integrating the relevant businesses and systems,including the need to combine accounting and data processing systems and management controls, and to integrate relationships withclients, vendors, and business partners. Acquisitions pose the risk that any business we acquire may lose clients or employees or couldunder-perform relative to expectations.
ITEM 1B. UNRESOLVED STAFF COMMENTSNone.
ITEM 2. PROPERTIES
Our executive offices and primary broker/dealer and banking operations are located in approximately 192,000 square-feet ofleased space in an office building in Dallas, Texas. The lease expires in 2020. Our other office locations are leased and generally do notexceed 28,000 square feet of space. We conduct our clearing operations primarily at our Dallas headquarters, and our securities lendingactivities are conducted from our offices in Old Bridge, New Jersey and New York, New York.
We have 19 retail brokerage offices with 10 in Texas, six in California, two in Oklahoma and one in Nevada. The lease on the
24
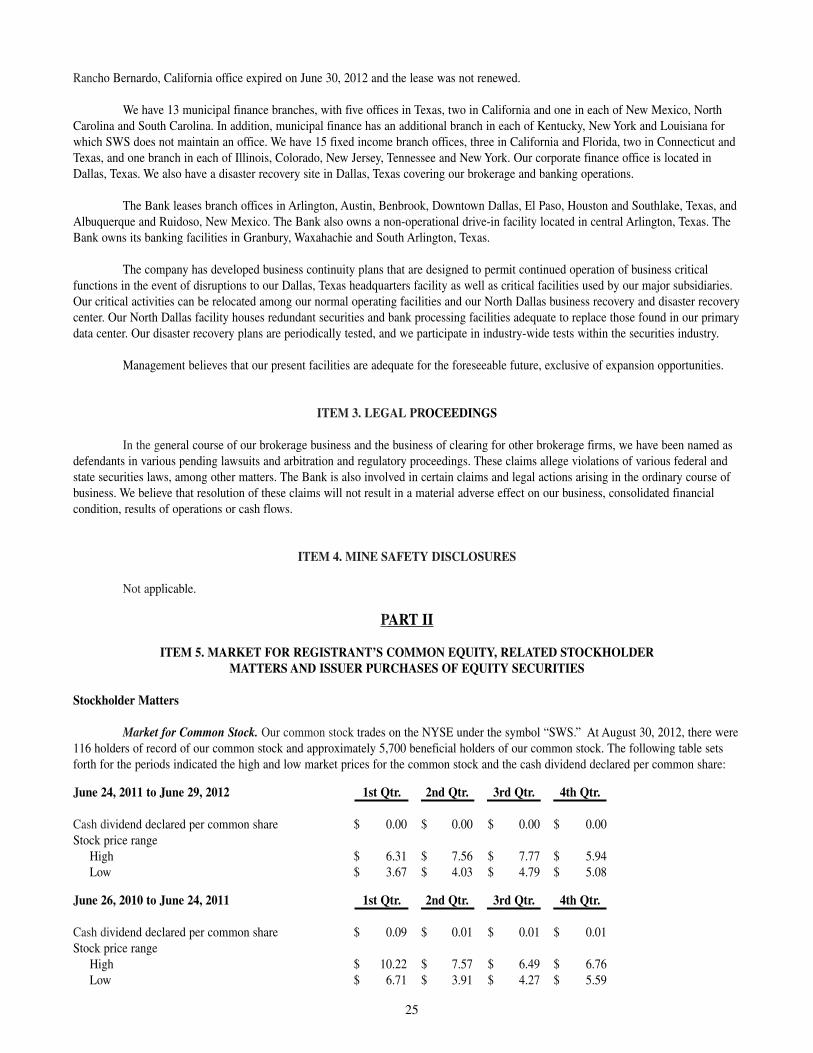
Rancho Bernardo, California office expired on June 30, 2012 and the lease was not renewed.
We have 13 municipal finance branches, with five offices in Texas, two in California and one in each of New Mexico, NorthCarolina and South Carolina. In addition, municipal finance has an additional branch in each of Kentucky, New York and Louisiana forwhich SWS does not maintain an office. We have 15 fixed income branch offices, three in California and Florida, two in Connecticut andTexas, and one branch in each of Illinois, Colorado, New Jersey, Tennessee and New York. Our corporate finance office is located inDallas, Texas. We also have a disaster recovery site in Dallas, Texas covering our brokerage and banking operations.
The Bank leases branch offices in Arlington, Austin, Benbrook, Downtown Dallas, El Paso, Houston and Southlake, Texas, andAlbuquerque and Ruidoso, New Mexico. The Bank also owns a non-operational drive-in facility located in central Arlington, Texas. TheBank owns its banking facilities in Granbury, Waxahachie and South Arlington, Texas.
The company has developed business continuity plans that are designed to permit continued operation of business criticalfunctions in the event of disruptions to our Dallas, Texas headquarters facility as well as critical facilities used by our major subsidiaries.Our critical activities can be relocated among our normal operating facilities and our North Dallas business recovery and disaster recoverycenter. Our North Dallas facility houses redundant securities and bank processing facilities adequate to replace those found in our primarydata center. Our disaster recovery plans are periodically tested, and we participate in industry-wide tests within the securities industry.
Management believes that our present facilities are adequate for the foreseeable future, exclusive of expansion opportunities.
ITEM 3. LEGAL PROCEEDINGS
In the general course of our brokerage business and the business of clearing for other brokerage firms, we have been named asdefendants in various pending lawsuits and arbitration and regulatory proceedings. These claims allege violations of various federal andstate securities laws, among other matters. The Bank is also involved in certain claims and legal actions arising in the ordinary course ofbusiness. We believe that resolution of these claims will not result in a material adverse effect on our business, consolidated financialcondition, results of operations or cash flows.
ITEM 4. MINE SAFETY DISCLOSURES
Not applicable.
PART II
ITEM 5. MARKET FOR REGISTRANT’S COMMON EQUITY, RELATED STOCKHOLDER MATTERS AND ISSUER PURCHASES OF EQUITY SECURITIES
Stockholder Matters
Market for Common Stock. Our common stock trades on the NYSE under the symbol “SWS.” At August 30, 2012, there were116 holders of record of our common stock and approximately 5,700 beneficial holders of our common stock. The following table setsforth for the periods indicated the high and low market prices for the common stock and the cash dividend declared per common share:
June 24, 2011 to June 29, 2012 1st Qtr. 2nd Qtr. 3rd Qtr. 4th Qtr.
Cash dividend declared per common share $ 0.00 $ 0.00 $ 0.00 $ 0.00Stock price range
High $ 6.31 $ 7.56 $ 7.77 $ 5.94 Low $ 3.67 $ 4.03 $ 4.79 $ 5.08
June 26, 2010 to June 24, 2011 1st Qtr. 2nd Qtr. 3rd Qtr. 4th Qtr.
Cash dividend declared per common share $ 0.09 $ 0.01 $ 0.01 $ 0.01Stock price range
High $ 10.22 $ 7.57 $ 6.49 $ 6.76 Low $ 6.71 $ 3.91 $ 4.27 $ 5.59
25
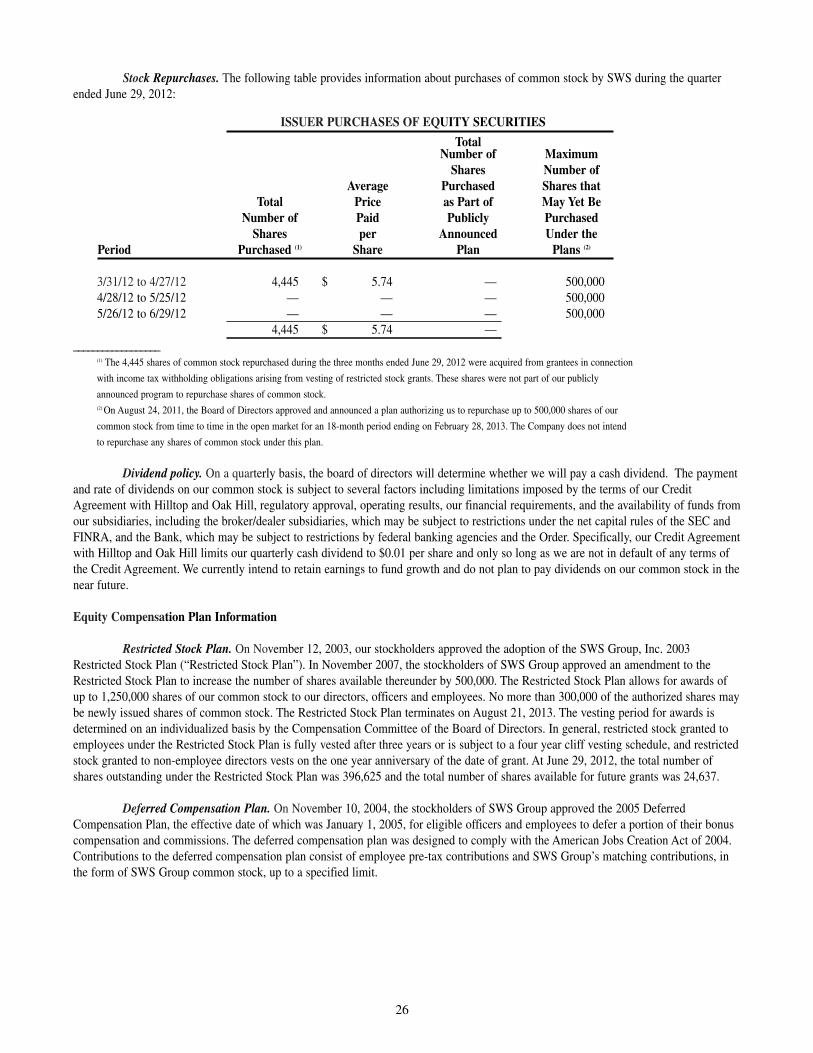
Stock Repurchases. The following table provides information about purchases of common stock by SWS during the quarterended June 29, 2012:
ISSUER PURCHASES OF EQUITY SECURITIES
TotalNumber of Maximum
Shares Number ofAverage Purchased Shares that
Total Price as Part of May Yet BeNumber of Paid Publicly Purchased
Shares per Announced Under thePeriod Purchased (1) Share Plan Plans (2)
3/31/12 to 4/27/12 4,445 $ 5.74 — 500,0004/28/12 to 5/25/12 — — — 500,0005/26/12 to 6/29/12 — — — 500,000
4,445 $ 5.74 —__________________
(1) The 4,445 shares of common stock repurchased during the three months ended June 29, 2012 were acquired from grantees in connection
with income tax withholding obligations arising from vesting of restricted stock grants. These shares were not part of our publicly
announced program to repurchase shares of common stock.(2) On August 24, 2011, the Board of Directors approved and announced a plan authorizing us to repurchase up to 500,000 shares of our
common stock from time to time in the open market for an 18-month period ending on February 28, 2013. The Company does not intend
to repurchase any shares of common stock under this plan.
Dividend policy. On a quarterly basis, the board of directors will determine whether we will pay a cash dividend. The paymentand rate of dividends on our common stock is subject to several factors including limitations imposed by the terms of our CreditAgreement with Hilltop and Oak Hill, regulatory approval, operating results, our financial requirements, and the availability of funds fromour subsidiaries, including the broker/dealer subsidiaries, which may be subject to restrictions under the net capital rules of the SEC andFINRA, and the Bank, which may be subject to restrictions by federal banking agencies and the Order. Specifically, our Credit Agreementwith Hilltop and Oak Hill limits our quarterly cash dividend to $0.01 per share and only so long as we are not in default of any terms ofthe Credit Agreement. We currently intend to retain earnings to fund growth and do not plan to pay dividends on our common stock in thenear future.
Equity Compensation Plan Information
Restricted Stock Plan. On November 12, 2003, our stockholders approved the adoption of the SWS Group, Inc. 2003Restricted Stock Plan (“Restricted Stock Plan”). In November 2007, the stockholders of SWS Group approved an amendment to theRestricted Stock Plan to increase the number of shares available thereunder by 500,000. The Restricted Stock Plan allows for awards ofup to 1,250,000 shares of our common stock to our directors, officers and employees. No more than 300,000 of the authorized shares maybe newly issued shares of common stock. The Restricted Stock Plan terminates on August 21, 2013. The vesting period for awards isdetermined on an individualized basis by the Compensation Committee of the Board of Directors. In general, restricted stock granted toemployees under the Restricted Stock Plan is fully vested after three years or is subject to a four year cliff vesting schedule, and restrictedstock granted to non-employee directors vests on the one year anniversary of the date of grant. At June 29, 2012, the total number ofshares outstanding under the Restricted Stock Plan was 396,625 and the total number of shares available for future grants was 24,637.
Deferred Compensation Plan. On November 10, 2004, the stockholders of SWS Group approved the 2005 DeferredCompensation Plan, the effective date of which was January 1, 2005, for eligible officers and employees to defer a portion of their bonuscompensation and commissions. The deferred compensation plan was designed to comply with the American Jobs Creation Act of 2004.Contributions to the deferred compensation plan consist of employee pre-tax contributions and SWS Group’s matching contributions, inthe form of SWS Group common stock, up to a specified limit.
26
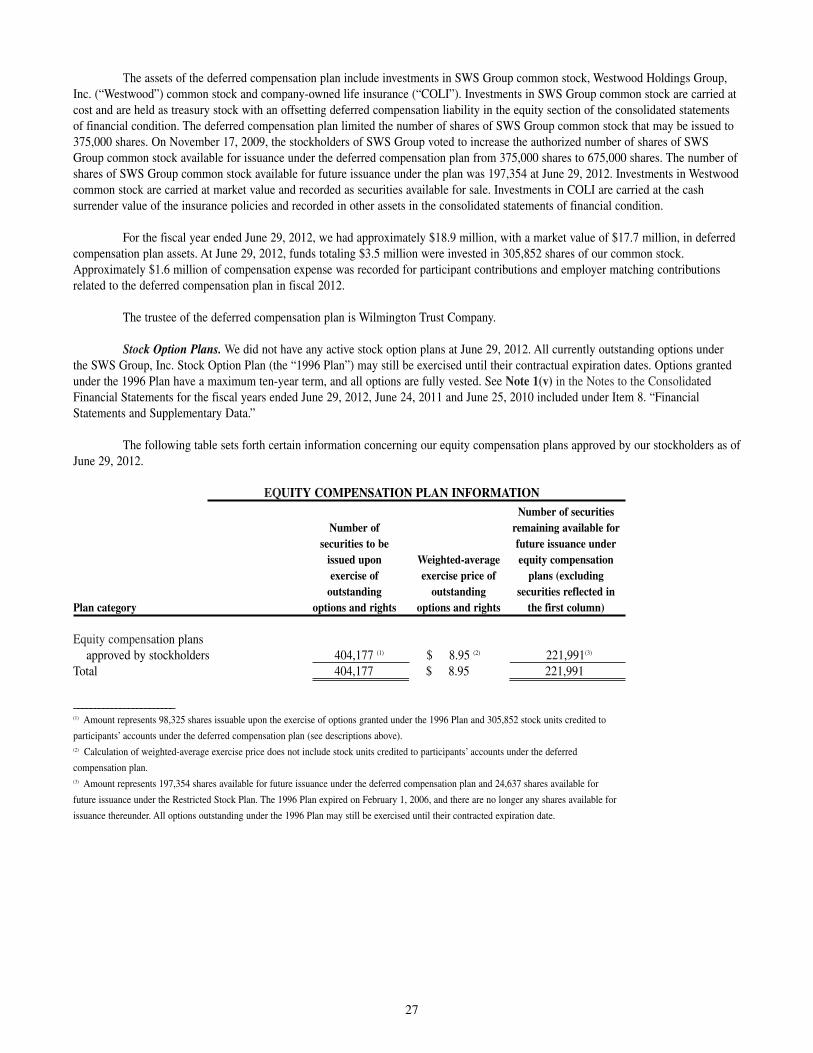
The assets of the deferred compensation plan include investments in SWS Group common stock, Westwood Holdings Group,Inc. (“Westwood”) common stock and company-owned life insurance (“COLI”). Investments in SWS Group common stock are carried atcost and are held as treasury stock with an offsetting deferred compensation liability in the equity section of the consolidated statementsof financial condition. The deferred compensation plan limited the number of shares of SWS Group common stock that may be issued to375,000 shares. On November 17, 2009, the stockholders of SWS Group voted to increase the authorized number of shares of SWSGroup common stock available for issuance under the deferred compensation plan from 375,000 shares to 675,000 shares. The number ofshares of SWS Group common stock available for future issuance under the plan was 197,354 at June 29, 2012. Investments in Westwoodcommon stock are carried at market value and recorded as securities available for sale. Investments in COLI are carried at the cashsurrender value of the insurance policies and recorded in other assets in the consolidated statements of financial condition.
For the fiscal year ended June 29, 2012, we had approximately $18.9 million, with a market value of $17.7 million, in deferredcompensation plan assets. At June 29, 2012, funds totaling $3.5 million were invested in 305,852 shares of our common stock.Approximately $1.6 million of compensation expense was recorded for participant contributions and employer matching contributionsrelated to the deferred compensation plan in fiscal 2012.
The trustee of the deferred compensation plan is Wilmington Trust Company.
Stock Option Plans. We did not have any active stock option plans at June 29, 2012. All currently outstanding options underthe SWS Group, Inc. Stock Option Plan (the “1996 Plan”) may still be exercised until their contractual expiration dates. Options grantedunder the 1996 Plan have a maximum ten-year term, and all options are fully vested. See Note 1(v) in the Notes to the ConsolidatedFinancial Statements for the fiscal years ended June 29, 2012, June 24, 2011 and June 25, 2010 included under Item 8. “FinancialStatements and Supplementary Data.”
The following table sets forth certain information concerning our equity compensation plans approved by our stockholders as ofJune 29, 2012.
EQUITY COMPENSATION PLAN INFORMATION Number of securities
Number of remaining available forsecurities to be future issuance under
issued upon Weighted-average equity compensationexercise of exercise price of plans (excluding
outstanding outstanding securities reflected inPlan category options and rights options and rights the first column)
Equity compensation plansapproved by stockholders 404,177 (1) $ 8.95 (2) 221,991(3)
Total 404,177 $ 8.95 221,991
________________________(1) Amount represents 98,325 shares issuable upon the exercise of options granted under the 1996 Plan and 305,852 stock units credited to
participants’ accounts under the deferred compensation plan (see descriptions above).(2) Calculation of weighted-average exercise price does not include stock units credited to participants’ accounts under the deferred
compensation plan.(3) Amount represents 197,354 shares available for future issuance under the deferred compensation plan and 24,637 shares available for
future issuance under the Restricted Stock Plan. The 1996 Plan expired on February 1, 2006, and there are no longer any shares available for
issuance thereunder. All options outstanding under the 1996 Plan may still be exercised until their contracted expiration date.
27
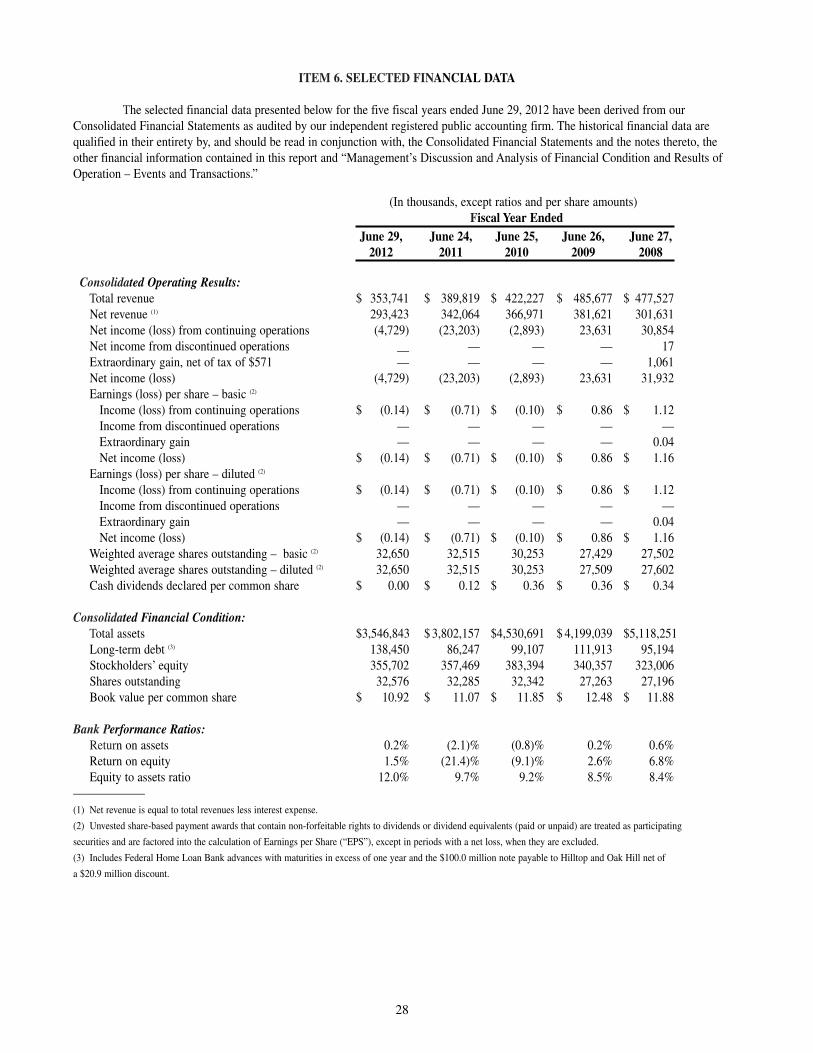
ITEM 6. SELECTED FINANCIAL DATA
The selected financial data presented below for the five fiscal years ended June 29, 2012 have been derived from ourConsolidated Financial Statements as audited by our independent registered public accounting firm. The historical financial data arequalified in their entirety by, and should be read in conjunction with, the Consolidated Financial Statements and the notes thereto, theother financial information contained in this report and “Management’s Discussion and Analysis of Financial Condition and Results ofOperation – Events and Transactions.”
(In thousands, except ratios and per share amounts)Fiscal Year Ended
June 29, June 24, June 25, June 26, June 27,2012 2011 2010 2009 2008
Consolidated Operating Results:Total revenue $ 353,741 $ 389,819 $ 422,227 $ 485,677 $ 477,527 Net revenue (1) 293,423 342,064 366,971 381,621 301,631Net income (loss) from continuing operations (4,729) (23,203) (2,893) 23,631 30,854Net income from discontinued operations __ — — — 17Extraordinary gain, net of tax of $571 — — — — 1,061Net income (loss) (4,729) (23,203) (2,893) 23,631 31,932Earnings (loss) per share – basic (2)
Income (loss) from continuing operations $ (0.14) $ (0.71) $ (0.10) $ 0.86 $ 1.12Income from discontinued operations — — — — —Extraordinary gain — — — — 0.04Net income (loss) $ (0.14) $ (0.71) $ (0.10) $ 0.86 $ 1.16
Earnings (loss) per share – diluted (2)
Income (loss) from continuing operations $ (0.14) $ (0.71) $ (0.10) $ 0.86 $ 1.12 Income from discontinued operations — — — — —Extraordinary gain — — — — 0.04Net income (loss) $ (0.14) $ (0.71) $ (0.10) $ 0.86 $ 1.16
Weighted average shares outstanding – basic (2) 32,650 32,515 30,253 27,429 27,502Weighted average shares outstanding – diluted (2) 32,650 32,515 30,253 27,509 27,602Cash dividends declared per common share $ 0.00 $ 0.12 $ 0.36 $ 0.36 $ 0.34
Consolidated Financial Condition:Total assets $3,546,843 $ 3,802,157 $4,530,691 $ 4,199,039 $5,118,251Long-term debt (3) 138,450 86,247 99,107 111,913 95,194Stockholders’ equity 355,702 357,469 383,394 340,357 323,006Shares outstanding 32,576 32,285 32,342 27,263 27,196Book value per common share $ 10.92 $ 11.07 $ 11.85 $ 12.48 $ 11.88
Bank Performance Ratios:Return on assets 0.2% (2.1)% (0.8)% 0.2% 0.6%Return on equity 1.5% (21.4)% (9.1)% 2.6% 6.8%Equity to assets ratio 12.0% 9.7% 9.2% 8.5% 8.4%
——————(1) Net revenue is equal to total revenues less interest expense.
(2) Unvested share-based payment awards that contain non-forfeitable rights to dividends or dividend equivalents (paid or unpaid) are treated as participating
securities and are factored into the calculation of Earnings per Share (“EPS”), except in periods with a net loss, when they are excluded.
(3) Includes Federal Home Loan Bank advances with maturities in excess of one year and the $100.0 million note payable to Hilltop and Oak Hill net of
a $20.9 million discount.
28
ITEM 7. MANAGEMENT’S DISCUSSION AND ANALYSIS OF FINANCIAL CONDITION AND RESULTS OF OPERATIONS
OVERVIEW
We are engaged in full-service securities brokerage and full-service commercial banking. During the twelve-months ended June29, 2012, 85% of our total revenues were generated by our full-service brokerage business and 15% of our total revenues were generatedby our commercial banking business. While brokerage and banking revenues are dependent upon trading volumes and interest rates,which may fluctuate significantly, a large portion of our expenses remain fixed. Consequently, net operating results can vary significantlyfrom period to period.
Our business is also subject to substantial governmental regulation and changes in legal, regulatory, accounting, tax andcompliance requirements, which may have a substantial impact on our business and results of operations. We also face substantialcompetition in each of our lines of business. See “Forward-Looking Statements, “ Item 1. “Business-Competition,” Item 1. “-Regulation”and Item 1A. “Risk Factors.”
We operate through four segments grouped primarily by products, services and customer base: clearing, retail, institutional andbanking.
Clearing. We provide clearing and execution services for other broker/dealers (predominantly on a fully disclosed basis). Ourclientele includes general securities broker/dealers and firms specializing in high-volume trading. We currently support a widerange of clearing clients, including discount and full-service brokerage firms, direct access firms, registered investment advisorsand institutional firms. In addition to clearing trades, we tailor our services to meet the specific needs of our clearing clients(“correspondents”) and offer such products and services as recordkeeping, trade reporting, accounting, general back-officesupport, securities and margin lending, reorganization assistance and custody of securities.
Revenues in this segment are generated primarily through transaction charges to our correspondent firms for clearing theirtrades. Revenue is also earned from various fees and other processing charges as well as through net interest earnings oncorrespondent customer balances.
Retail. We offer retail securities products and services (equities, mutual funds and fixed income products), insurance productsand managed accounts through the activities of our employee registered representatives and our independent contractors. As asecurities broker, we extend margin credit on a secured basis to our retail customers in order to facilitate securities transactions.This segment generates revenue primarily through commissions charged on securities transactions, fees from managed accountsand the sale of insurance products as well as net interest income from retail customer balances.
Institutional. We serve institutional customers in the areas of securities borrowing and lending, public finance, municipal salesand underwriting, investment banking, fixed income sales and equity trading. Our securities lending business includesborrowing and lending securities for other broker/dealers, lending institutions, and our own clearing and retail operations. Ourmunicipal finance operations assist public bodies in originating, syndicating and distributing securities of municipalities andpolitical subdivisions. Our corporate finance professionals arrange and evaluate mergers and acquisitions, conduct privateplacements and participate in public offerings of securities with institutional and individual investors, assist clients with raisingcapital, and provide other consulting and advisory services.
Our fixed income sales and trading group specializes in trading and underwriting U.S. government and government agencybonds, corporate bonds, mortgage-backed, asset-backed and commercial mortgage-backed securities and structured products.The clients of our fixed income group include corporations, insurance companies, banks, mutual funds, money managers andother institutions. Our equity trading department focuses on providing the best execution for equity and option orders forclients. We also execute institutional portfolio trades and are a market maker in a limited number of listed securities.
Revenues in the institutional segment are derived from the net interest spread on stock loan transactions, commission andtrading income from fixed income and equity products and investment banking fees from corporate and municipal securitiestransactions.
29
Banking. We offer traditional banking products and services. We specialize in two primary areas, business banking andmortgage purchase. Our focus in business banking includes small business lending. We originate the majority of our loansinternally and we believe this business model helps us build more valuable relationships with our customers. Our mortgagepurchase division purchases participations and sub-participations in newly originated residential loans from various mortgagebankers nationwide. In the fourth quarter of fiscal 2012, the Bank signed a sub-participation agreement with a non-affiliatebank to sub-participate in this bank’s mortgage purchase program. The Bank has made a maximum total commitment of $50.0million pursuant to the agreement.
The Bank earns substantially all of its revenues on the spread between the rates charged to customers on loans and the ratespaid to depositors. Our banking operations are currently restricted by and subject to the Order with the OCC. On March 16,2012, the Bank was notified in a letter from the OCC that the OCC will allow relief from certain operating and growthrestrictions required under the Order. The OCC stated that it has no supervisory objection to any future extensions of SmallBusiness Administration program 504 loans, commercial real estate owner-occupied loans, or mechanics lien residential 1-4family construction loans provided that prior to funding the Bank’s Board of Directors or designated committee approves andcertifies it complies with internal policies, accounting principles generally accepted in the United States (“GAAP”), regulatoryguidance, and safe and sound association practices. The OCC also stated that it has no supervisory objection to a futureconservative growth plan for the Bank’s balance sheet provided the Bank maintains capital ratios above the requirements of theOrder and concentration levels within policy guidelines.
The “other” category includes SWS Group, corporate administration and SWS Capital Corporation. SWS Capital Corporationis a dormant entity. SWS Group is a holding company that owns various investments, including common stock of U.S. Home Systems,Inc. (“USHS”).
Loan from Hilltop and Oak Hill
In March 2011, we entered into a Funding Agreement with Hilltop and Oak Hill. On July 29, 2011, after receipt of stockholderand regulatory approval, we completed the following transactions contemplated by the Funding Agreement:
• entered into a $100.0 million, five year, unsecured loan with an 8% interest rate from Hilltop and Oak Hill under the terms of acredit agreement;
• issued warrants to Hilltop and Oak Hill allowing each to purchase up to 8,695,652 shares of our common stock at an exerciseprice of $5.75 per share (subject to anti-dilution adjustments), representing approximately 17% of the common stock of ourcompany per warrant (assuming each exercises its warrant in full); and
• granted Hilltop and Oak Hill certain rights, including certain registration rights, preemptive rights, and the right for each toappoint one person to our Board of Directors for so long as each owns 9.9% or more of all of the outstanding shares of ourcommon stock or securities convertible into at least 9.9% of our outstanding common stock. Mr. Gerald J. Ford and Mr. J.Taylor Crandall were elected as directors of SWS Group by our Board of Directors on July 29, 2011 pursuant to this right.
We entered into this transaction to ensure that the Bank would maintain adequate capital ratios under the Order and couldcontinue to reduce classified assets in a strategic and efficient manner, as well as to ensure that the broker/dealer business lines wouldoperate without disruption. See also Note 16 in the Notes to the Consolidated Financial Statements for the fiscal years ended June 29,2012, June 24, 2011 and June 25, 2010 included under Item 8. “Financial Statements and Supplementary Data” for additional discussionon the loan from Hilltop and Oak Hill.
The funds received from Hilltop and Oak Hill upon completion of the transaction were recorded on our consolidated statementsof financial condition as restricted cash. We are required to keep these funds in a restricted account until our Board of Directors, Hilltopand Oak Hill determine the amount(s) to be distributed to our subsidiaries. Upon approval of the Board of Directors, Hilltop and Oak Hill,SWS Group contributed $20.0 million of this cash to the Bank in December 2011, loaned Southwest Securities $20.0 million to use ingeneral operations by reducing Southwest Securities’ use of short-term borrowings for the financing of the Company’s day-to-day cashmanagement needs, paid $20.0 million toward its intercompany payable to Southwest Securities and contributed $10.0 million toSouthwest Securities. The remaining $30.0 million remains at SWS Group to be used for general corporate purposes subject to approvalby the Board of Directors, Hilltop and Oak Hill.
Business Environment
Performance in the financial services industry in which we operate is highly correlated to the overall strength of the economyand financial market activity. Overall market conditions are a product of many factors, which are beyond our control and can be
30
unpredictable. These factors may affect the financial decisions made by investors, including their level of participation in the financialmarkets. In turn, these decisions may affect our business results. With respect to financial market activity, our profitability is sensitive to avariety of factors, including the demand for investment banking services, as reflected by the number and size of equity and debtfinancings and merger and acquisition transactions, the volatility of the equity and fixed income markets, the level and shape of variousyield curves, the volume and value of trading in securities, the value of our customers’ assets under management, the demand for loansand the value of real estate in our markets.
As of June 29, 2012, equity market indices reflected an average increase from a year ago with the Dow Jones IndustrialAverage (the “DJIA”) up 8%, the Standard & Poor’s 500 Index (“S&P 500”) up 7% and the NASDAQ Composite Index (“NASDAQ”) up11%. The DJIA closed at 12,880.09 on June 29, 2012 up from 11,934.58 and 10,143.81 on June 24, 2011 and June 25, 2010, respectively.The indexes showed improvement and reached closing prices that haven’t been seen since 2008. However, the market remains volatile dueto the slow recovery in the United States and the uncertainty in Europe. The average daily volume on the NYSE declined during our fiscal2012, decreasing 10% over the same period in fiscal 2011. The continuing uncertainty in the economic environment domestically and inEurope contributed to uncertainty and volatility during our fiscal 2012.
Economic and regulatory uncertainty created a challenging operating environment for us in fiscal 2012. The nationalunemployment rate, which was approximately 8.2% at the end of June 2012, was down from a high of 10.0% at the end of December2009, and 9.0% at the end of June 2011, but remains at historically high levels. The FRB reduced the federal funds target rate to 0 -0.25% on December 16, 2008 and announced in January 2012 and reemphasized in their July 2012 meeting that rates were unlikely toincrease before late 2014.
The disruptions and developments in the world economy and the credit markets over the past three years have resulted in arange of actions by the U.S. and foreign governments to attempt to bring liquidity and order to the financial markets and to prevent a longrecession in the world economy. For more details regarding some of the actions taken by U.S. and foreign governments, see thediscussion under Item 1. “Business-Regulation.”
Unemployment and tight credit markets continue to create a fragile economic environment. In addition to the August 2011downgrade of the United States’ credit rating and the June 2012 Moody’s Investor Services downgrade of the 15 largest financialinstitutions including Bank of America Corp., Citigroup Inc. Goldman Sachs and JP Morgan Chase, global equity markets have beenvolatile primarily due to debt problems in Europe.
Texas has experienced distress in residential and commercial real estate values as well as elevated unemployment rates since thelast quarter of calendar 2010. These factors, while improving, have had, and will continue to have, a negative impact on our banking andbrokerage operations.
Impact of Economic Environment
Brokerage: On the brokerage side of the business, volatility in the U.S. credit and mortgage markets, low interest rates and reducedvolume in the U.S. stock markets continue to have an adverse impact on several aspects of our business, including depressed net interestmargins, reduced liquidity and lower securities valuations.
Exposure to European Sovereign DebtWe have no exposure to European sovereign debt or direct exposure to European banks. However, we do participate insecurities lending with U.S. subsidiaries of several European banks. Receivables from securities lending are secured bycollateral equal to 102% of the market value of the securities, and the collateral is adjusted daily to maintain the 102% margin.
Net Interest MarginsHistorically, the profitability of our brokerage business has been dependent upon net interest income. We earn net interestincome on the spread between the rates earned and paid on customer and correspondent balances as well as from our securitieslending business. With interest rates at historically low levels, the spread we are able to earn is reduced, primarily from theextremely low yields on our assets segregated for regulatory purposes portfolio. Additionally, the spread in our securitieslending business has declined. Lastly, because the yields on money market funds have declined significantly, revenue sharingarrangements with our primary money market fund providers have been substantially reduced. We do not expect any significantchanges in these dynamics until short-term interest rates rise.
We have taken actions to mitigate the impact of this margin contraction by renegotiating arrangements with our clearingcustomers, changing the mix of our assets segregated for regulatory purposes and developing new business in our securities
31
lending portfolio. Despite these actions, profits from net interest remain below historical levels.
LiquidityDislocation in the credit markets has led to increased liquidity risk. All but $45.0 million of our borrowing arrangements areuncommitted lines of credit and, as such, can be reduced or eliminated at any time by the banks extending the credit. While wehave not experienced any reductions in our uncommitted borrowing capacity, our lenders have previously taken actions thatindicate their concerns regarding liquidity in the marketplace. These actions have included reduced advance rates for certainsecurity types, more stringent requirements for collateral eligibility and higher interest rates. Should our lenders or investorstake any actions that could negatively impact the terms of our lending arrangements, the cost of conducting our business willincrease and our volume of business would be limited.
The volatility in the U.S. stock markets is also impacting our liquidity through increased margin requirements at our clearinghouses. These margin requirements are determined through a combination of risk factors including volume of business andvolatility in the U.S. stock markets. To the extent we are required to post cash or other collateral to meet these requirements, wewill have less borrowing capacity to finance our other businesses.
Valuation of SecuritiesWe trade mortgage, asset-backed and other types of fixed income securities on a regular basis. We monitor our trading limitsdaily to ensure that these securities are maintained at levels we consider prudent given current market conditions. We pricethese securities using a third-party pricing service and we review the prices monthly to ensure reasonable valuations. At June29, 2012, we held mortgage and asset-backed securities of approximately $32.9 million included in securities owned, at fairvalue on the consolidated statements of financial condition.
Investment in Auction Rate SecuritiesAt June 29, 2012, we held $21.0 million of auction rate municipal bonds, which represented one security and 18% of ourmunicipal portfolio. This security is an investment grade credit, was valued at 95.7% of par as of June 29, 2012 and wasyielding less than 1% per year for the period. We currently have the ability to hold this investment until maturity. While weexpect the issuer of this bond to refinance its debt when London Interbank Offered Rates (LIBOR) rise, there can be nocertainty that this refinancing will occur. We review this position on a quarterly basis and believe valuation of this bond at95.7% of par at June 29, 2012 reflects an appropriate discount for the current lack of liquidity in this investment.
Bank: With a $20.0 million capital contribution to the Bank in December 2011, the Bank prepared and filed a new capital plan with itsregulator in June 2012. We believe the $20.0 million contribution and access to additional capital from SWS Group provides the Bankwith a sound foundation for future earnings, as well as the flexibility to accelerate the reduction of classified assets.
The Bank has maintained compliance with the terms of the Order since the Bank signed it on February 4, 2011. The diligentefforts by the Bank’s Board of Directors, management and employees to adhere to the terms of the Order and plans filed with regulatorshave resulted in substantial improvements in credit quality, loan concentration levels and capital ratios. As a result, on March 16, 2012,the Bank was notified in a letter from the OCC that the OCC will allow relief from certain operating and growth restrictions requiredunder the Order. See additional discussion in Note 29 in the Notes to the Consolidated Financial Statements for the fiscal years endedJune 29, 2012, June 24, 2011 and June 25, 2010 included under Item 8. “Financial Statements and Supplementary Data” for additionalinformation on the Order and discussion above under “Overview” regarding the relief from certain operating and growth restrictionsrequired under the Order.
While the economic environment remains challenging, the Bank continued to make significant progress in addressing the issuesthat led to the issuance of the Order. Classified assets were $110.7 million at June 30, 2012, down $117.8 million from $228.5 million atJune 30, 2011. Classified assets as a percentage of total capital plus the allowance for loan losses was 58.0% at June 30, 2012, 120.5% atJune 30, 2011 and 100.9% at June 30, 2010. Non-performing assets (a subset of classified assets) decreased to $72.7 million at June 30,2012 down from $89.5 million at June 30, 2011 and $93.7 million at June 30, 2010. Though the Bank continues to work diligently toreduce classified assets and improve performance, the volatility of the economic environment remains a significant risk. Should theeconomic environment worsen, improvement in classified asset reduction could slow and additional migration of loans to problem statuscould increase.
The Bank’s loan loss allowance at June 30, 2012 was $22.4 million, or 4.0% of loans held for investment, excluding purchasedmortgage loans held for investment, as compared to $44.4 million, or 5.0% of loans held for investment, excluding purchased mortgageloans held for investment, at June 30, 2011.
32
The Bank’s capital ratios have strengthened significantly and remain well above the Order’s required levels with a Tier 1 coreratio of 12.6% and a total risk-based capital ratio of 19.2% at June 30, 2012 compared to 9.9% and 15.6%, respectively, at June 30, 2011.With the stability of these capital ratios and the $20.0 million capital contribution from SWS Group, the Bank’s management has focusedon diversifying the balance sheet by reducing loan concentrations and building an investment portfolio.
With the relief granted by the OCC in March 2012, the Bank has been actively filling open lending positions in our marketareas. New lenders have been added in Houston, Austin, Dallas and Arlington, Texas as well as in Albuquerque, New Mexico.Additionally, the Bank has hired a Chief Credit Officer, a manager of Special Assets, a manager of Credit Administration, a new CreditManager for Commercial and Industrial Lending and a new Credit Manager for mortgage purchase lending. Given the economicenvironment and the lag in the process of hiring lenders and actual production, the Bank anticipates loan balances to begin a modestgrowth rate through fiscal 2013. The Bank anticipates that additional growth will come from building out its investment portfolio. TheBank’s available for sale portfolio was $304.0 million at June 30, 2012. The Bank also anticipates growth in its mortgage purchaseprogram which continues to perform well despite the current economic environment. Though there is uncertainty in the market, there arealso opportunities. With mortgage rates at historical lows, finance and re-finance opportunities are significant for qualified borrowers. AtJune 30, 2012, the balance of the mortgage purchase program loans was $294.3 million. These loans are held for investment on averagefor 25 days or less, which substantially limits credit risk. We believe the funding for the Bank’s balance sheet growth will come fromdeposits, primarily from Southwest Securities brokerage customers. These core deposits provide the Bank with a stable and low costfunding source. At June 30, 2012, the Bank had $930.7 million in funds on deposit from customers of Southwest Securities, representingapproximately 87.6% of the Bank’s total deposits.
Events and Transactions
A description of material events and transactions impacting our results of operations in the periods presented are discussedbelow:
Transaction with Hilltop and Oak Hill. On March 20, 2011, we entered into a Funding Agreement with Hilltop and Oak Hill.On July 29, 2011, after receipt of stockholder and regulatory approval, the Company completed the following transactions contemplatedby the Funding Agreement:
• a $100.0 million, five year, unsecured loan with an 8% interest rate from Hilltop and Oak Hill under the terms of a creditagreement; and
• issuance of warrants to each investor allowing such investor to purchase up to 8,695,652 shares of our common stock at anexercise price of $5.75 per share (subject to anti-dilution adjustments), representing approximately 17% of the common stockof our company per warrant (assuming each investor exercises its warrant in full).
Total interest expense recorded on this loan for fiscal 2012 was $11.0 million.
Warrant valuation. The warrants issued to Hilltop and Oak Hill are presented as liabilities carried at fair value on theconsolidated statement of financial condition. During fiscal 2012, the value of these warrants increased due to increased stock pricevolatility from our initial valuation from 39.9% to 52.4%, partially offset by the passage of time and a decrease in our stock price from$5.45 at July 29, 2011, the issuance date of the warrants, to $5.33 at June 29, 2012. The increase in value resulted in an unrealized pre-tax loss of $3.7 million for fiscal 2012.
Change in provision for loan losses. The provision for loan loss decreased $48.5 million during fiscal 2012 and increased $5.8million during fiscal 2011, resulting in an allowance for loan loss of $22.4 million at June 30, 2012 and $44.4 million at June 30, 2011.See discussion above under “Overview—Business Environment—Impact of Economic Environment—Bank”, “Financial Condition –Loan and Allowance for Probable Loan Losses” and Note 6 in the Notes to the Consolidated Financial Statements for fiscal years June29, 2012, June 24, 2011, and June 25, 2010 included in Item 8 “Financial Statements and Supplementary Data.”
Sale of 5,000,001 shares of our common stock. On October 16, 2009, we filed a shelf registration statement with the SECproviding for the sale of up to $150.0 million of securities. On December 9, 2009, we closed a public offering of 4,347,827 shares of ourcommon stock at a price of $11.50 per share. On December 16, 2009, the underwriters for the public offering exercised their option topurchase 652,174 additional shares of our common stock to cover over-allotments. We generated net proceeds, after deductingunderwriting discounts and commissions, from the offerings of approximately $54.4 million. We invested $47.5 million of the netproceeds as a $20.0 million capital contribution to the Bank and a $27.5 million capital contribution to Southwest Securities. Theremaining funds were used for general corporate purposes.
33
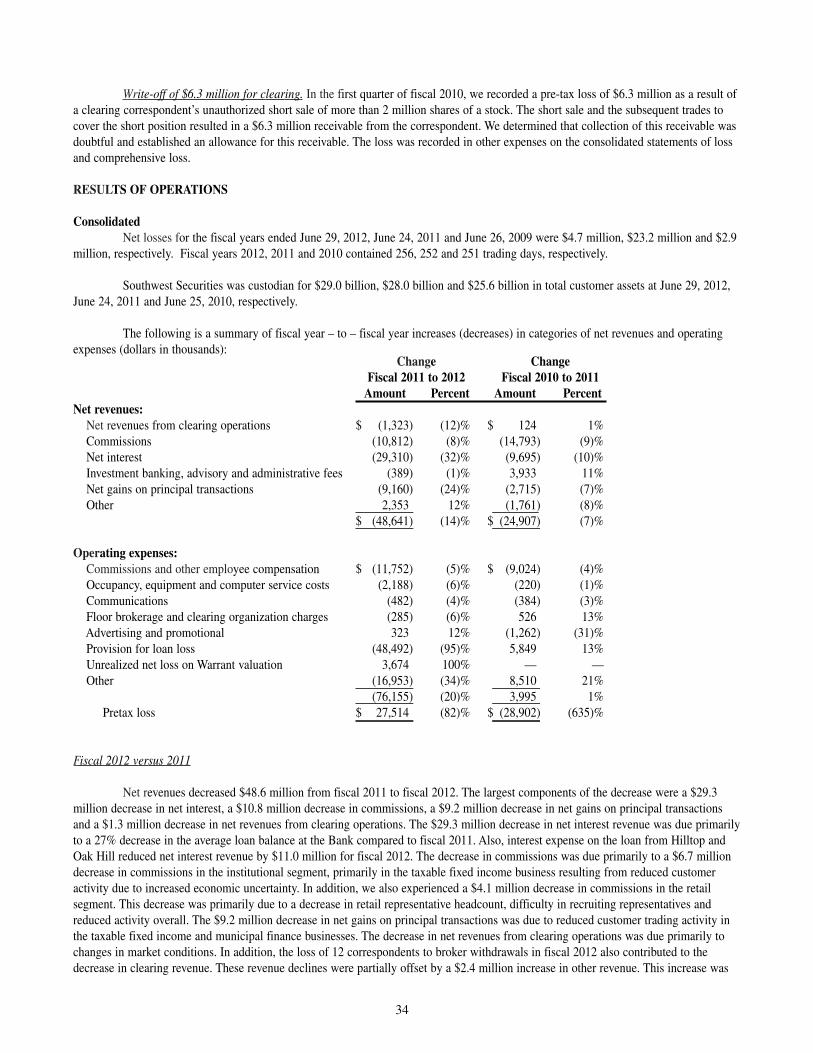
Write-off of $6.3 million for clearing. In the first quarter of fiscal 2010, we recorded a pre-tax loss of $6.3 million as a result ofa clearing correspondent’s unauthorized short sale of more than 2 million shares of a stock. The short sale and the subsequent trades tocover the short position resulted in a $6.3 million receivable from the correspondent. We determined that collection of this receivable wasdoubtful and established an allowance for this receivable. The loss was recorded in other expenses on the consolidated statements of lossand comprehensive loss.
RESULTS OF OPERATIONS
ConsolidatedNet losses for the fiscal years ended June 29, 2012, June 24, 2011 and June 26, 2009 were $4.7 million, $23.2 million and $2.9
million, respectively. Fiscal years 2012, 2011 and 2010 contained 256, 252 and 251 trading days, respectively.
Southwest Securities was custodian for $29.0 billion, $28.0 billion and $25.6 billion in total customer assets at June 29, 2012,June 24, 2011 and June 25, 2010, respectively.
The following is a summary of fiscal year – to – fiscal year increases (decreases) in categories of net revenues and operatingexpenses (dollars in thousands):
Change ChangeFiscal 2011 to 2012 Fiscal 2010 to 2011
Amount Percent Amount PercentNet revenues:
Net revenues from clearing operations $ (1,323) (12)% $ 124 1%Commissions (10,812) (8)% (14,793) (9)%Net interest (29,310) (32)% (9,695) (10)%Investment banking, advisory and administrative fees (389) (1)% 3,933 11%Net gains on principal transactions (9,160) (24)% (2,715) (7)%Other 2,353 12% (1,761) (8)%
$ (48,641) (14)% $ (24,907) (7)%
Operating expenses:Commissions and other employee compensation $ (11,752) (5)% $ (9,024) (4)%Occupancy, equipment and computer service costs (2,188) (6)% (220) (1)%Communications (482) (4)% (384) (3)%Floor brokerage and clearing organization charges (285) (6)% 526 13%Advertising and promotional 323 12% (1,262) (31)%Provision for loan loss (48,492) (95)% 5,849 13%Unrealized net loss on Warrant valuation 3,674 100% — —Other (16,953) (34)% 8,510 21%
(76,155) (20)% 3,995 1%Pretax loss $ 27,514 (82)% $ (28,902) (635)%
Fiscal 2012 versus 2011
Net revenues decreased $48.6 million from fiscal 2011 to fiscal 2012. The largest components of the decrease were a $29.3million decrease in net interest, a $10.8 million decrease in commissions, a $9.2 million decrease in net gains on principal transactionsand a $1.3 million decrease in net revenues from clearing operations. The $29.3 million decrease in net interest revenue was due primarilyto a 27% decrease in the average loan balance at the Bank compared to fiscal 2011. Also, interest expense on the loan from Hilltop andOak Hill reduced net interest revenue by $11.0 million for fiscal 2012. The decrease in commissions was due primarily to a $6.7 milliondecrease in commissions in the institutional segment, primarily in the taxable fixed income business resulting from reduced customeractivity due to increased economic uncertainty. In addition, we also experienced a $4.1 million decrease in commissions in the retailsegment. This decrease was primarily due to a decrease in retail representative headcount, difficulty in recruiting representatives andreduced activity overall. The $9.2 million decrease in net gains on principal transactions was due to reduced customer trading activity inthe taxable fixed income and municipal finance businesses. The decrease in net revenues from clearing operations was due primarily tochanges in market conditions. In addition, the loss of 12 correspondents to broker withdrawals in fiscal 2012 also contributed to thedecrease in clearing revenue. These revenue declines were partially offset by a $2.4 million increase in other revenue. This increase was
34
made up of a $3.1 million decrease in net losses on the sale of real estate owned (“REO”) from the prior fiscal year, a $0.8 millionincrease in earnings on equity investments, a $0.6 million increase in insurance product sales and a $0.5 million decrease on losses on thesale of loans offset by a $1.6 million decrease in the value of the investments in our deferred compensation plan and a $0.6 milliondecrease in the gain on sale of securities.
Operating expenses decreased $76.2 million for fiscal 2012 as compared to fiscal 2011. The largest decreases were the $48.5million decrease in the provision for loan loss, the $17.0 million decrease in other expense, the $11.8 million decrease in commissionsand other employee compensation and the $2.2 million decrease in occupancy, equipment and computer service costs. The decrease in theBank’s loan loss provision is discussed above under “Overview-Business Environment-Impact of Economic Environment-Bank.” Thedecrease in other expenses was due primarily to a $13.0 million decrease in the Bank’s REO loss provision, a $1.4 million decrease inthird-party loan services, a $1.1 million decrease in the Bank’s fee assessments from regulatory agencies, a $1.1 million decrease in theBank’s real estate related expenses and a $0.7 million decrease in legal expenses. The $11.8 million decrease in commissions and otheremployee compensation was primarily due to an $8.4 million decrease in commission expense related to a decrease in productionrevenues, commissions and investment banking, advisory and administrative fees and a $3.5 million decrease in salaries expense primarilyrelated to the decrease in our headcount. The decrease in occupancy, equipment and computer service costs was due to a $0.8 milliondecrease in amortization expense related to a customer relationship intangible that was fully amortized in July 2011, a $0.6 milliondecrease in depreciation expense for equipment that became fully depreciated in fiscal 2012 that has not been replaced and a $0.6 milliondecrease in rental expense due to closing three banking center locations during fiscal 2012. These decreases in other expenses were offsetby the $3.7 million unrealized loss on Warrant valuation as discussed above under “Overview-Events and Transactions-WarrantValuation.”
Fiscal 2011 versus 2010
Net revenues decreased $24.9 million from fiscal 2010 to fiscal 2011. The largest components of the decrease were a $14.8million decrease in commissions, a $2.7 million decrease in net gains on principal transactions and a $9.7 million decrease in net interest.The decrease in commissions and net gains on principal transactions was due primarily to reduced commissions and trading profits in thetaxable fixed income business, as a result of tighter spreads and reduced volatility. The decrease in net interest revenue was primarily dueto a decrease in the average balance of loans held for investment at the Bank as compared to the same period in the prior fiscal year.These revenue declines were partially offset by a $3.9 million increase in investment banking and advisory fees due to an increase in unitinvestment trust underwritings in the taxable fixed income business as well as an increase in fees generated from advisory services in ourcorporate finance business unit.
Operating expenses increased $4.0 million for fiscal 2011 as compared to fiscal 2010. The largest increases were the $5.8million increase in the provision for loan loss and the $8.5 million increase in other expense. The increase in the Bank’s loan lossprovision is discussed in “Overview-Business Environment-Impact of Economic Environment-Bank.” The increase in other expenses wasdue to an $8.7 million increase in the Bank’s REO write-downs, a $2.4 million increase in professional services and fees at the Bank andan increase in legal expenses of $3.2 million. In addition, in fiscal 2010, there was a one time $875,000 reversal of an accrual from thepurchase of M.L. Stern & Co., LLC. These increases in other expenses were offset by the $6.3 million loss incurred in the first quarter offiscal 2010 on a correspondent’s short sale of securities.
These increases in other expenses and the provision for loan loss were partially offset by a $9.0 million decrease in commissionand other employee compensation and a $1.3 million decrease in advertising and promotional expenses. Commissions and other employeecompensation expense declined primarily due to a decrease in variable compensation and a $2.4 million decrease in salaries and deferredcompensation expenses related to our restricted stock plan offset by a $1.5 million increase in health insurance expense.
Net Interest Income
We generate net interest income from our brokerage segments and our banking segment. Net interest income from thebrokerage segments is dependent upon the level of customer and stock loan balances as well as the spread between the rates we earn onthose assets compared with the cost of funds. Net interest is the primary source of income for the Bank and represents the amount bywhich interest and fees generated by earning assets exceed the cost of funds. The Bank’s cost of funds consists primarily of interest paid
35
to the Bank’s depositors on interest-bearing accounts and long-term borrowings with the FHLB. Net interest income from our brokerage,corporate and banking segments were as follows for the fiscal years 2012, 2011 and 2010 (in thousands):
2012 2011 2010
Brokerage $ 25,547 $ 25,965 $ 24,769Bank (1) 47,228 65,147 76,038SWS Group (2) (10,973) — —
Net interest $ 61,802 $ 91,112 $ 100,807 —————(1) The net interest reported for the Bank is for the periods ended June 30, 2012, 2011 and 2010.(2) Consists primarily of interest expense on the loan from Hilltop and Oak Hill.
Average balances of interest earning assets and interest-bearing liabilities in our brokerage operations were as follows for thefiscal years ended June 29, 2012, June 24, 2011 and June 25, 2010 (in thousands):
2012 2011 2010
Average interest-earning assets:Customer margin balances $ 231,269 $ 215,672 $ 172,690 Assets segregated for regulatory purposes 218,193 254,025 342,431Stock borrowed 1,636,000 2,061,000 1,859,000
Average interest-bearing liabilities:Customer funds on deposit, including short credits 344,828 350,955 378,846Stock loaned 1,611,000 2,036,000 1,804,000
Net interest revenue generated by each segment is reviewed in detail in the segment analysis below.
Income Tax Expense
For fiscal 2012, income tax benefit (effective rate of 20.4%) differed from the amount that would have otherwise beencalculated by applying the federal corporate tax rate (35%) to loss before income tax benefit due to state income taxes and otherpermanently excluded items, such as tax exempt interest and compensation. See further discussion regarding reconciliation of theeffective tax rate and the federal corporate tax rate in Note 17 in the Notes to the Consolidated Financial Statements for the fiscal yearsended June 29, 2012, June 24, 2011 and June 25, 2010 included under Item 8. “Financial Statements and Supplementary Data”
For fiscal 2011, income tax benefit (effective rate of 30.6%) differed from the amount that would have otherwise beencalculated by applying the federal corporate tax rate (35%) to loss before income tax benefit due to state income taxes and otherpermanently excluded items, such as tax exempt interest, meals and entertainment, compensation and increases in the value of company-owned life insurance (“COLI”).
For fiscal 2010, income tax benefit (effective rate of 36.4%) differed from the amount that would otherwise have beencalculated by applying the federal corporate tax rate (35%) to loss before income tax benefit due to state income taxes and otherpermanently excluded items, such as tax exempt interest, meals and entertainment and increases in the value of COLI.
We have certain deferred tax assets that were derived from capital losses. To use the deferred tax assets, we must havesufficient capital gain income within the carry-back and carry-forward period available under the tax law. Our deferred tax assets as ofJune 29, 2012 and June 24, 2011 included $872,000 and $844,000, respectively, which reflected the benefit of capital losses associatedwith our investments in certain partnership assets. In the first quarter of fiscal 2011, we established an $844,000 valuation allowanceagainst these deferred tax assets because we did not believe it was more likely than not that sufficient capital gain income would begenerated to offset these capital losses during the applicable carry-back and carry-forward period. In fiscal year 2012, we increased thevaluation allowance by $28,000 to $872,000 as a result of receiving additional valuation information about these investments. See alsoNote 17 in the Notes to the Consolidated Financial Statements for the fiscal years ended June 29, 2012, June 24, 2011 and June 25, 2010included under Item 8. “Financial Statements and Supplementary Data.”
36
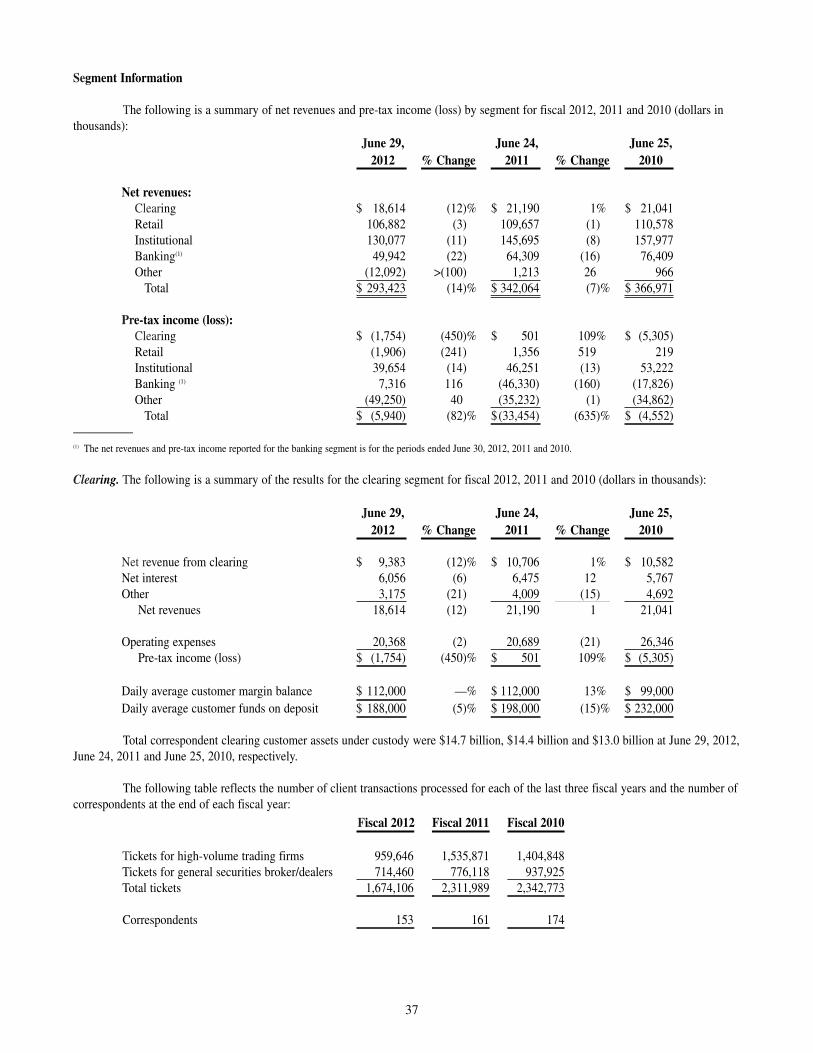
Segment Information
The following is a summary of net revenues and pre-tax income (loss) by segment for fiscal 2012, 2011 and 2010 (dollars inthousands):
June 29, June 24, June 25,2012 % Change 2011 % Change 2010
Net revenues:Clearing $ 18,614 (12)% $ 21,190 1% $ 21,041Retail 106,882 (3) 109,657 (1) 110,578Institutional 130,077 (11) 145,695 (8) 157,977Banking(1) 49,942 (22) 64,309 (16) 76,409Other (12,092) >(100) 1,213 26 966
Total $ 293,423 (14)% $ 342,064 (7)% $ 366,971
Pre-tax income (loss):Clearing $ (1,754) (450)% $ 501 109% $ (5,305)Retail (1,906) (241) 1,356 519 219Institutional 39,654 (14) 46,251 (13) 53,222Banking (1) 7,316 116 (46,330) (160) (17,826)Other (49,250) 40 (35,232) (1) (34,862)
Total $ (5,940) (82)% $(33,454) (635)% $ (4,552)—————(1) The net revenues and pre-tax income reported for the banking segment is for the periods ended June 30, 2012, 2011 and 2010.
Clearing. The following is a summary of the results for the clearing segment for fiscal 2012, 2011 and 2010 (dollars in thousands):
June 29, June 24, June 25,2012 % Change 2011 % Change 2010
Net revenue from clearing $ 9,383 (12)% $ 10,706 1% $ 10,582Net interest 6,056 (6) 6,475 12 5,767Other 3,175 (21) 4,009 (15) 4,692
Net revenues 18,614 (12) 21,190 1 21,041
Operating expenses 20,368 (2) 20,689 (21) 26,346Pre-tax income (loss) $ (1,754) (450)% $ 501 109% $ (5,305)
Daily average customer margin balance $ 112,000 —% $ 112,000 13% $ 99,000Daily average customer funds on deposit $ 188,000 (5)% $ 198,000 (15)% $ 232,000
Total correspondent clearing customer assets under custody were $14.7 billion, $14.4 billion and $13.0 billion at June 29, 2012,June 24, 2011 and June 25, 2010, respectively.
The following table reflects the number of client transactions processed for each of the last three fiscal years and the number ofcorrespondents at the end of each fiscal year:
Fiscal 2012 Fiscal 2011 Fiscal 2010
Tickets for high-volume trading firms 959,646 1,535,871 1,404,848Tickets for general securities broker/dealers 714,460 776,118 937,925Total tickets 1,674,106 2,311,989 2,342,773
Correspondents 153 161 174
37
Fiscal 2012 versus 2011
For fiscal 2012, net revenues and clearing fee revenue in the clearing segment both decreased 12% from fiscal 2011. Inaddition, other revenue decreased 21% from fiscal 2011 to fiscal 2012 primarily due to a 25% decline in administrative fee income fromrevenue sharing with money market fund providers.
The decrease in clearing revenue was due primarily to changes in market conditions. In addition, the loss of 12 correspondentsto broker withdrawals in fiscal 2012 also contributed to the decrease in clearing revenue.
Also, for fiscal 2012 as compared to fiscal 2011, tickets processed for high-volume trading firms decreased 38% while ticketsprocessed for general securities broker/dealers decreased by 8%. Revenue per ticket increased approximately 29% from $4.35 for fiscal2011 to $5.61 for fiscal 2012. The change in the mix of tickets processed led to an increase in revenue per ticket as fees charged to high-volume trading firms are discounted substantially from the fees charged to general securities broker/dealers. A four day increase in thenumber of trading days in fiscal 2012 compared to the prior fiscal year partially offset the decrease in ticket volume. There were 256trading days in fiscal 2012 and 252 in fiscal 2011.
Operating expenses for fiscal 2012 decreased $0.3 million, or 2%, from fiscal 2011 due primarily to a $0.4 million decrease inoccupancy, equipment and computer service costs, primarily due to a $0.8 million decrease in amortization expense related to a customerrelationship intangible that was fully amortized in July 2011. This decrease was offset by a $0.3 million increase in informationtechnology costs.
Fiscal 2011 versus 2010
The clearing segment posted a 1% increase in net revenues and a 109% increase in pre-tax income for fiscal 2011 as comparedto fiscal 2010.
Other revenue decreased 15% for fiscal 2011 as compared to fiscal 2010. The decrease was due to a decrease in net revenueearned on correspondent customer balances. This decrease was partially offset by a 3% increase in administrative fee income earned bythe clearing segment from money market providers on higher revenue sharing with various money market funds.
In fiscal 2011, tickets processed for high-volume trading firms increased 9% while tickets processed for general securitiesbroker/dealers decreased by 17% due to a loss of two general securities correspondents in the third quarter of fiscal 2011 as well as anoverall decline in volume. In addition, revenue per ticket decreased approximately 4% from $4.52 for fiscal 2010 to $4.35 for fiscal 2011due to a change in the mix of trades from general securities trades to day trading trades. The fees charged to the day trading firms arediscounted substantially from the fees charged to general securities broker/dealers.
Operating expenses for fiscal 2011 decreased $5.7 million, or 21%, from fiscal 2010 due primarily to a $6.1 million decrease inother expenses, which included a $6.3 million loss incurred on a correspondent’s short sale of securities in the first quarter of fiscal 2010as well as a decrease in legal expenses of $1.0 million. This decrease was partially offset by a $882,000 increase in operations andinformation technology expenses and a $320,000 increase in professional services and licenses and fees from fiscal 2010 to fiscal 2011.
38
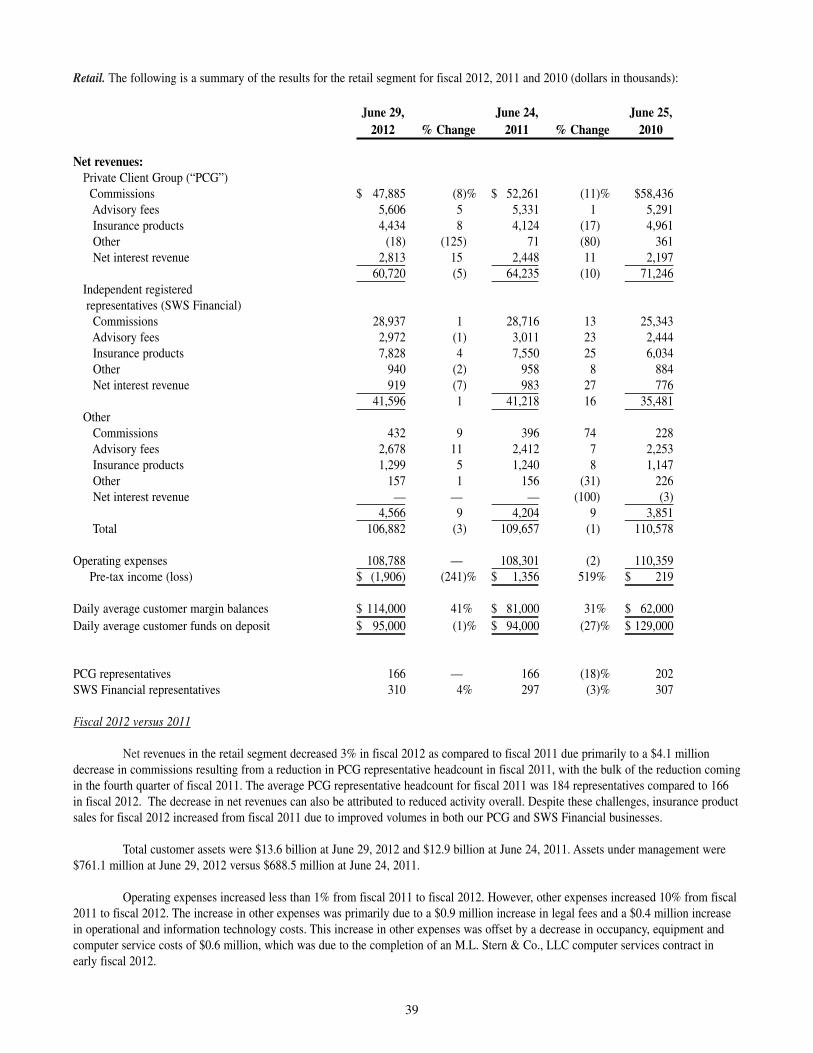
Retail. The following is a summary of the results for the retail segment for fiscal 2012, 2011 and 2010 (dollars in thousands):
June 29, June 24, June 25,2012 % Change 2011 % Change 2010
Net revenues:Private Client Group (“PCG”)
Commissions $ 47,885 (8)% $ 52,261 (11)% $58,436Advisory fees 5,606 5 5,331 1 5,291Insurance products 4,434 8 4,124 (17) 4,961Other (18) (125) 71 (80) 361Net interest revenue 2,813 15 2,448 11 2,197
60,720 (5) 64,235 (10) 71,246Independent registered representatives (SWS Financial)
Commissions 28,937 1 28,716 13 25,343 Advisory fees 2,972 (1) 3,011 23 2,444Insurance products 7,828 4 7,550 25 6,034Other 940 (2) 958 8 884Net interest revenue 919 (7) 983 27 776
41,596 1 41,218 16 35,481Other
Commissions 432 9 396 74 228Advisory fees 2,678 11 2,412 7 2,253Insurance products 1,299 5 1,240 8 1,147Other 157 1 156 (31) 226Net interest revenue — — — (100) (3)
4,566 9 4,204 9 3,851Total 106,882 (3) 109,657 (1) 110,578
Operating expenses 108,788 — 108,301 (2) 110,359Pre-tax income (loss) $ (1,906) (241)% $ 1,356 519% $ 219
Daily average customer margin balances $ 114,000 41% $ 81,000 31% $ 62,000Daily average customer funds on deposit $ 95,000 (1)% $ 94,000 (27)% $ 129,000
PCG representatives 166 — 166 (18)% 202SWS Financial representatives 310 4% 297 (3)% 307
Fiscal 2012 versus 2011
Net revenues in the retail segment decreased 3% in fiscal 2012 as compared to fiscal 2011 due primarily to a $4.1 milliondecrease in commissions resulting from a reduction in PCG representative headcount in fiscal 2011, with the bulk of the reduction comingin the fourth quarter of fiscal 2011. The average PCG representative headcount for fiscal 2011 was 184 representatives compared to 166in fiscal 2012. The decrease in net revenues can also be attributed to reduced activity overall. Despite these challenges, insurance productsales for fiscal 2012 increased from fiscal 2011 due to improved volumes in both our PCG and SWS Financial businesses.
Total customer assets were $13.6 billion at June 29, 2012 and $12.9 billion at June 24, 2011. Assets under management were$761.1 million at June 29, 2012 versus $688.5 million at June 24, 2011.
Operating expenses increased less than 1% from fiscal 2011 to fiscal 2012. However, other expenses increased 10% from fiscal2011 to fiscal 2012. The increase in other expenses was primarily due to a $0.9 million increase in legal fees and a $0.4 million increasein operational and information technology costs. This increase in other expenses was offset by a decrease in occupancy, equipment andcomputer service costs of $0.6 million, which was due to the completion of an M.L. Stern & Co., LLC computer services contract inearly fiscal 2012.
39
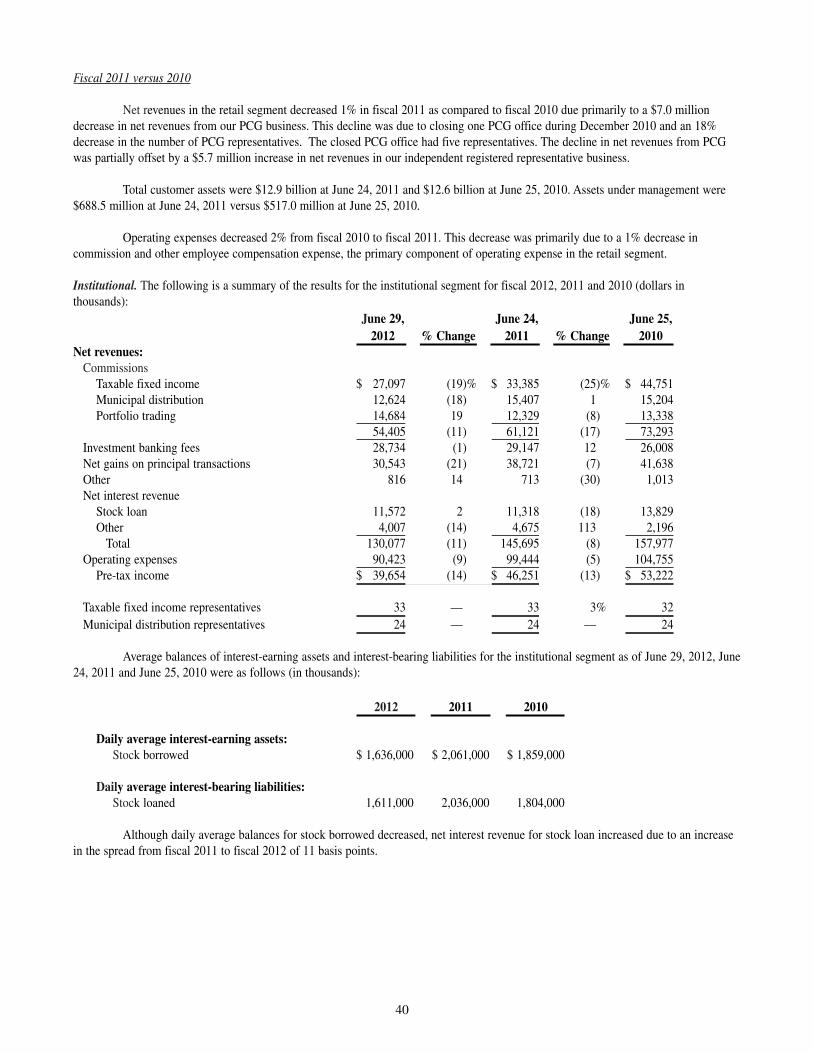
Fiscal 2011 versus 2010
Net revenues in the retail segment decreased 1% in fiscal 2011 as compared to fiscal 2010 due primarily to a $7.0 milliondecrease in net revenues from our PCG business. This decline was due to closing one PCG office during December 2010 and an 18%decrease in the number of PCG representatives. The closed PCG office had five representatives. The decline in net revenues from PCGwas partially offset by a $5.7 million increase in net revenues in our independent registered representative business.
Total customer assets were $12.9 billion at June 24, 2011 and $12.6 billion at June 25, 2010. Assets under management were$688.5 million at June 24, 2011 versus $517.0 million at June 25, 2010.
Operating expenses decreased 2% from fiscal 2010 to fiscal 2011. This decrease was primarily due to a 1% decrease incommission and other employee compensation expense, the primary component of operating expense in the retail segment.
Institutional. The following is a summary of the results for the institutional segment for fiscal 2012, 2011 and 2010 (dollars inthousands):
June 29, June 24, June 25,2012 % Change 2011 % Change 2010
Net revenues:Commissions
Taxable fixed income $ 27,097 (19)% $ 33,385 (25)% $ 44,751Municipal distribution 12,624 (18) 15,407 1 15,204Portfolio trading 14,684 19 12,329 (8) 13,338
54,405 (11) 61,121 (17) 73,293Investment banking fees 28,734 (1) 29,147 12 26,008Net gains on principal transactions 30,543 (21) 38,721 (7) 41,638Other 816 14 713 (30) 1,013Net interest revenue
Stock loan 11,572 2 11,318 (18) 13,829Other 4,007 (14) 4,675 113 2,196
Total 130,077 (11) 145,695 (8) 157,977Operating expenses 90,423 (9) 99,444 (5) 104,755
Pre-tax income $ 39,654 (14) $ 46,251 (13) $ 53,222
Taxable fixed income representatives 33 — 33 3% 32Municipal distribution representatives 24 — 24 — 24
Average balances of interest-earning assets and interest-bearing liabilities for the institutional segment as of June 29, 2012, June24, 2011 and June 25, 2010 were as follows (in thousands):
2012 2011 2010
Daily average interest-earning assets:Stock borrowed $ 1,636,000 $ 2,061,000 $ 1,859,000
Daily average interest-bearing liabilities:Stock loaned 1,611,000 2,036,000 1,804,000
Although daily average balances for stock borrowed decreased, net interest revenue for stock loan increased due to an increasein the spread from fiscal 2011 to fiscal 2012 of 11 basis points.
40
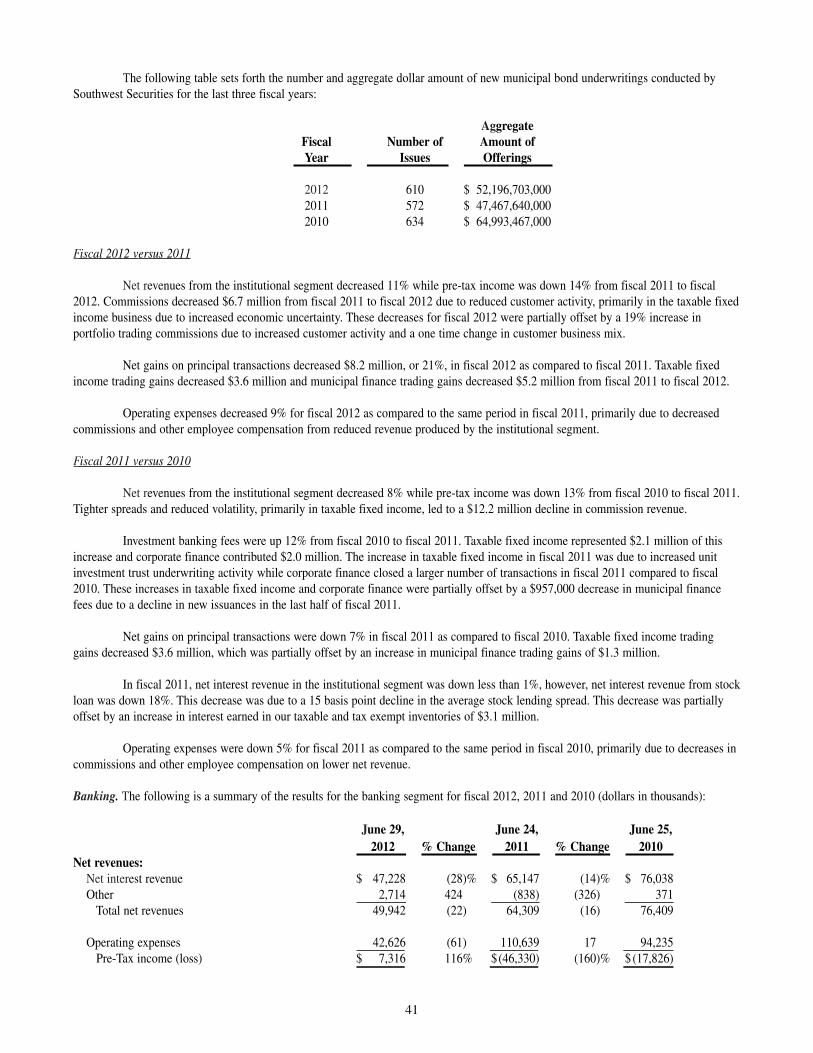
The following table sets forth the number and aggregate dollar amount of new municipal bond underwritings conducted bySouthwest Securities for the last three fiscal years:
AggregateFiscal Number of Amount ofYear Issues Offerings
2012 610 $ 52,196,703,0002011 572 $ 47,467,640,0002010 634 $ 64,993,467,000
Fiscal 2012 versus 2011
Net revenues from the institutional segment decreased 11% while pre-tax income was down 14% from fiscal 2011 to fiscal2012. Commissions decreased $6.7 million from fiscal 2011 to fiscal 2012 due to reduced customer activity, primarily in the taxable fixedincome business due to increased economic uncertainty. These decreases for fiscal 2012 were partially offset by a 19% increase inportfolio trading commissions due to increased customer activity and a one time change in customer business mix.
Net gains on principal transactions decreased $8.2 million, or 21%, in fiscal 2012 as compared to fiscal 2011. Taxable fixedincome trading gains decreased $3.6 million and municipal finance trading gains decreased $5.2 million from fiscal 2011 to fiscal 2012.
Operating expenses decreased 9% for fiscal 2012 as compared to the same period in fiscal 2011, primarily due to decreasedcommissions and other employee compensation from reduced revenue produced by the institutional segment.
Fiscal 2011 versus 2010
Net revenues from the institutional segment decreased 8% while pre-tax income was down 13% from fiscal 2010 to fiscal 2011.Tighter spreads and reduced volatility, primarily in taxable fixed income, led to a $12.2 million decline in commission revenue.
Investment banking fees were up 12% from fiscal 2010 to fiscal 2011. Taxable fixed income represented $2.1 million of thisincrease and corporate finance contributed $2.0 million. The increase in taxable fixed income in fiscal 2011 was due to increased unitinvestment trust underwriting activity while corporate finance closed a larger number of transactions in fiscal 2011 compared to fiscal2010. These increases in taxable fixed income and corporate finance were partially offset by a $957,000 decrease in municipal financefees due to a decline in new issuances in the last half of fiscal 2011.
Net gains on principal transactions were down 7% in fiscal 2011 as compared to fiscal 2010. Taxable fixed income tradinggains decreased $3.6 million, which was partially offset by an increase in municipal finance trading gains of $1.3 million.
In fiscal 2011, net interest revenue in the institutional segment was down less than 1%, however, net interest revenue from stockloan was down 18%. This decrease was due to a 15 basis point decline in the average stock lending spread. This decrease was partiallyoffset by an increase in interest earned in our taxable and tax exempt inventories of $3.1 million.
Operating expenses were down 5% for fiscal 2011 as compared to the same period in fiscal 2010, primarily due to decreases incommissions and other employee compensation on lower net revenue.
Banking. The following is a summary of the results for the banking segment for fiscal 2012, 2011 and 2010 (dollars in thousands):
June 29, June 24, June 25,2012 % Change 2011 % Change 2010
Net revenues:Net interest revenue $ 47,228 (28)% $ 65,147 (14)% $ 76,038Other 2,714 424 (838) (326) 371
Total net revenues 49,942 (22) 64,309 (16) 76,409
Operating expenses 42,626 (61) 110,639 17 94,235Pre-Tax income (loss) $ 7,316 116% $(46,330) (160)% $ (17,826)
41
Fiscal 2012 versus 2011
For fiscal 2012 as compared to fiscal 2011, the Bank’s net revenues decreased 22%, but the Bank posted pre-tax income of $7.3million, up from a pre-tax loss of $46.3 million. The decrease in net interest revenue at the Bank for fiscal 2012 as compared to the priorfiscal year was due primarily to a 27% decrease in average loan balances, as well as a decrease in the net yield on interest-earning assetsof 70 basis points. Other revenue increased $3.6 million for fiscal 2012 as compared to the prior fiscal year. This increase was primarilydue to a $3.1 million decrease in net losses on the sale of REO, a $1.2 million increase in earnings on equity investments and a $0.5million net decrease in losses on the sale of loans. These increases were offset by a decrease on the gain of sale of securities of $0.6million and a $0.5 million decrease in miscellaneous revenue.
The Bank’s operating expenses decreased 61% for fiscal 2012 compared to fiscal 2011. This decrease was due primarily to a$48.5 million decrease in the Bank’s loan loss provision and a $17.1 million decrease in other expenses, which included the following:(i) a $13.0 million decrease in the Bank’s REO loss provision; (ii) a $1.4 million decrease in third-party loan review services; (iii) a $1.1million decrease in the Bank’s fee assessments from regulatory agencies; (iv) a $0.7 million decrease in real estate related and other loanrelated expense and (v) a $0.2 million decrease in legal expenses. The decrease in the Bank’s loan loss provision was due to greaterstability in the rate of decline of commercial real estate values and a reduction in size of the Bank’s loan portfolio. The allowancecomputation is discussed in detail under “-Financial Condition-Loans and Allowance for Probable Loan Loss” below.
Fiscal 2011 versus 2010
For fiscal 2011 as compared to fiscal 2010, the Bank’s net revenues decreased 16%. The Bank posted a pre-tax loss of $46.3million for fiscal 2011, up from a $17.8 million pre-tax loss reported in fiscal 2010. The decrease in net interest revenue at the Bank wasdue primarily to a decrease in the net yield on earning assets from 4.8% at June 30, 2010 to 4.3% at June 30, 2011, as well as a decline inthe average outstanding balance of loans of 13%. Other revenue for the Bank decreased more than 100% for fiscal 2011 as compared tothe same period in fiscal 2010. This decrease was primarily due to a $688,000 increase in net losses on the sale of REO property, a $1.4million increase on the loss on loans held for sale and a $471,000 decrease in gains on the sale of SBA loans. These decreases werepartially offset by a $1.2 million gain on the sale/redemption of securities.
The Bank’s operating expenses were up 17% for fiscal 2011 over the same period in fiscal 2010. This increase was dueprimarily to a $5.8 million increase in the Bank’s loan loss provision, an $8.7 million increase in the Bank’s REO write-downs, a $1.3million increase in outside loan and real estate related services and fees, a $1.1 million increase in legal fees and a $1.2 million increasein fee assessments from regulatory agencies. The increase in the Bank’s loan loss provision was due to continued deterioration in the realestate market and the Bank’s commercial real estate loan portfolio as well as the continuing uncertainty in the U.S. economy, in particularthe Texas economy. The allowance computation is discussed in detail in “-Financial Condition-Loans and Allowance for Probable LoanLoss” below.
42
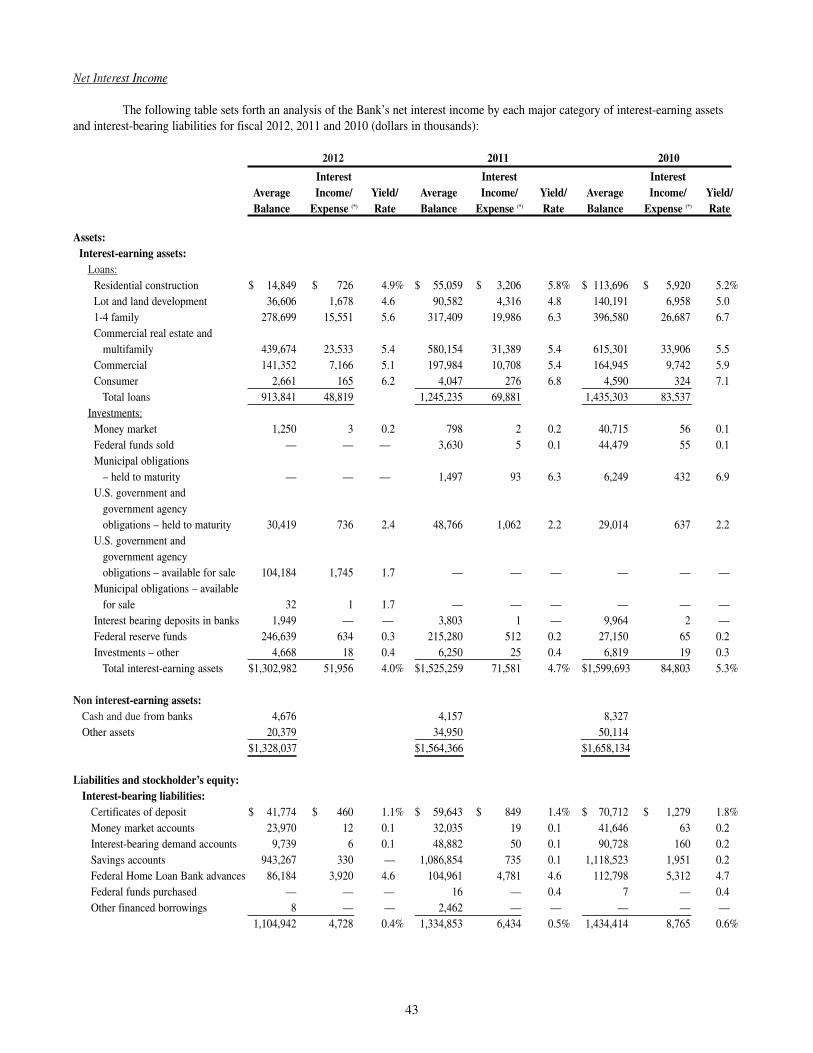
Net Interest Income
The following table sets forth an analysis of the Bank’s net interest income by each major category of interest-earning assetsand interest-bearing liabilities for fiscal 2012, 2011 and 2010 (dollars in thousands):
2012 2011 2010
Interest Interest InterestAverage Income/ Yield/ Average Income/ Yield/ Average Income/ Yield/Balance Expense (*) Rate Balance Expense (*) Rate Balance Expense (*) Rate
Assets:Interest-earning assets:
Loans:Residential construction $ 14,849 $ 726 4.9% $ 55,059 $ 3,206 5.8% $ 113,696 $ 5,920 5.2% Lot and land development 36,606 1,678 4.6 90,582 4,316 4.8 140,191 6,958 5.01-4 family 278,699 15,551 5.6 317,409 19,986 6.3 396,580 26,687 6.7Commercial real estate and
multifamily 439,674 23,533 5.4 580,154 31,389 5.4 615,301 33,906 5.5Commercial 141,352 7,166 5.1 197,984 10,708 5.4 164,945 9,742 5.9Consumer 2,661 165 6.2 4,047 276 6.8 4,590 324 7.1
Total loans 913,841 48,819 1,245,235 69,881 1,435,303 83,537Investments:
Money market 1,250 3 0.2 798 2 0.2 40,715 56 0.1Federal funds sold — — — 3,630 5 0.1 44,479 55 0.1Municipal obligations
– held to maturity — — — 1,497 93 6.3 6,249 432 6.9U.S. government and
government agency obligations – held to maturity 30,419 736 2.4 48,766 1,062 2.2 29,014 637 2.2
U.S. government and government agency obligations – available for sale 104,184 1,745 1.7 — — — — — —
Municipal obligations – available for sale 32 1 1.7 — — — — — —
Interest bearing deposits in banks 1,949 — — 3,803 1 — 9,964 2 —Federal reserve funds 246,639 634 0.3 215,280 512 0.2 27,150 65 0.2Investments – other 4,668 18 0.4 6,250 25 0.4 6,819 19 0.3
Total interest-earning assets $1,302,982 51,956 4.0% $1,525,259 71,581 4.7% $1,599,693 84,803 5.3%
Non interest-earning assets:Cash and due from banks 4,676 4,157 8,327Other assets 20,379 34,950 50,114
$1,328,037 $1,564,366 $1,658,134
Liabilities and stockholder’s equity:Interest-bearing liabilities:
Certificates of deposit $ 41,774 $ 460 1.1% $ 59,643 $ 849 1.4% $ 70,712 $ 1,279 1.8%Money market accounts 23,970 12 0.1 32,035 19 0.1 41,646 63 0.2Interest-bearing demand accounts 9,739 6 0.1 48,882 50 0.1 90,728 160 0.2Savings accounts 943,267 330 — 1,086,854 735 0.1 1,118,523 1,951 0.2Federal Home Loan Bank advances 86,184 3,920 4.6 104,961 4,781 4.6 112,798 5,312 4.7Federal funds purchased — — — 16 — 0.4 7 — 0.4Other financed borrowings 8 — — 2,462 — — — — —
1,104,942 4,728 0.4% 1,334,853 6,434 0.5% 1,434,414 8,765 0.6%
43
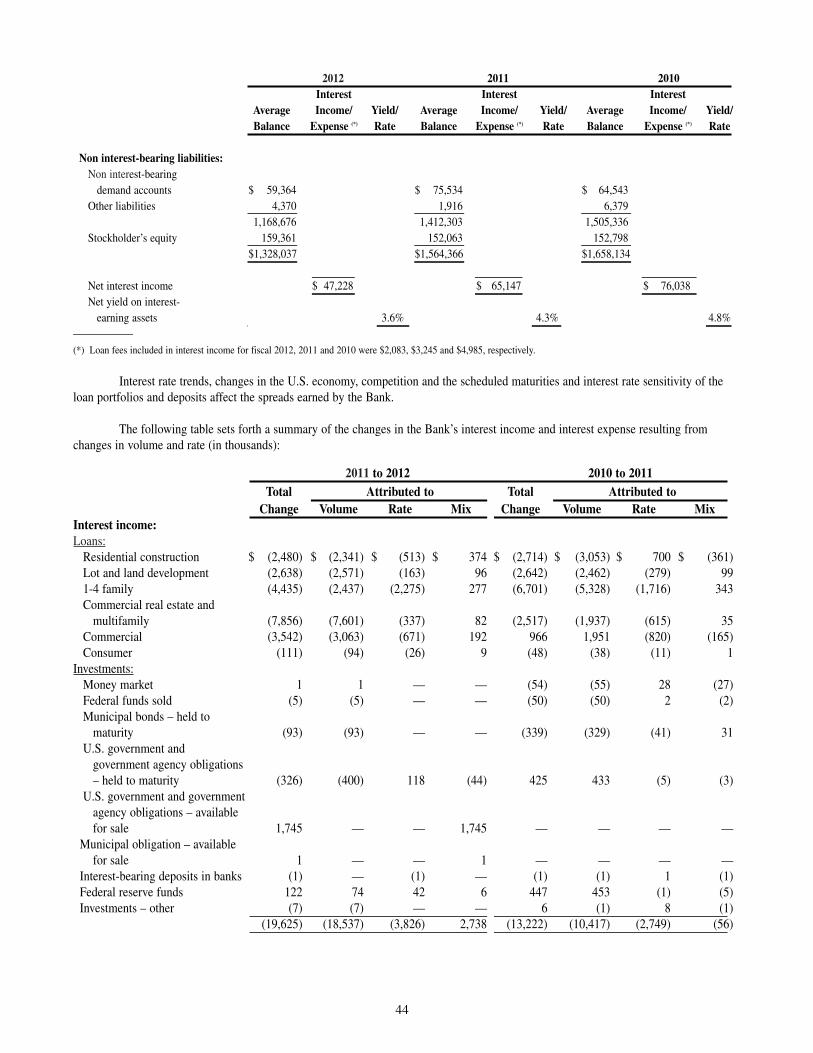
2012 2011 2010Interest Interest Interest
Average Income/ Yield/ Average Income/ Yield/ Average Income/ Yield/Balance Expense (*) Rate Balance Expense (*) Rate Balance Expense (*) Rate
Non interest-bearing liabilities:Non interest-bearing
demand accounts $ 59,364 $ 75,534 $ 64,543Other liabilities 4,370 1,916 6,379
1,168,676 1,412,303 1,505,336Stockholder’s equity 159,361 152,063 152,798
$1,328,037 $1,564,366 $1,658,134
Net interest income $ 47,228 $ 65,147 $ 76,038 Net yield on interest-
earning assets 3.6% 4.3% 4.8%—————(*) Loan fees included in interest income for fiscal 2012, 2011 and 2010 were $2,083, $3,245 and $4,985, respectively.
Interest rate trends, changes in the U.S. economy, competition and the scheduled maturities and interest rate sensitivity of theloan portfolios and deposits affect the spreads earned by the Bank.
The following table sets forth a summary of the changes in the Bank’s interest income and interest expense resulting fromchanges in volume and rate (in thousands):
2011 to 2012 2010 to 2011Total Attributed to Total Attributed to
Change Volume Rate Mix Change Volume Rate MixInterest income:Loans:
Residential construction $ (2,480) $ (2,341) $ (513) $ 374 $ (2,714) $ (3,053) $ 700 $ (361)Lot and land development (2,638) (2,571) (163) 96 (2,642) (2,462) (279) 991-4 family (4,435) (2,437) (2,275) 277 (6,701) (5,328) (1,716) 343 Commercial real estate and
multifamily (7,856) (7,601) (337) 82 (2,517) (1,937) (615) 35Commercial (3,542) (3,063) (671) 192 966 1,951 (820) (165)Consumer (111) (94) (26) 9 (48) (38) (11) 1
Investments:Money market 1 1 — — (54) (55) 28 (27)Federal funds sold (5) (5) — — (50) (50) 2 (2)Municipal bonds – held to
maturity (93) (93) — — (339) (329) (41) 31U.S. government and
government agency obligations – held to maturity (326) (400) 118 (44) 425 433 (5) (3)
U.S. government and government agency obligations – available for sale 1,745 — — 1,745 — — — —
Municipal obligation – available for sale 1 — — 1 — — — —
Interest-bearing deposits in banks (1) — (1) — (1) (1) 1 (1)Federal reserve funds 122 74 42 6 447 453 (1) (5)Investments – other (7) (7) — — 6 (1) 8 (1)
(19,625) (18,537) (3,826) 2,738 (13,222) (10,417) (2,749) (56)
44
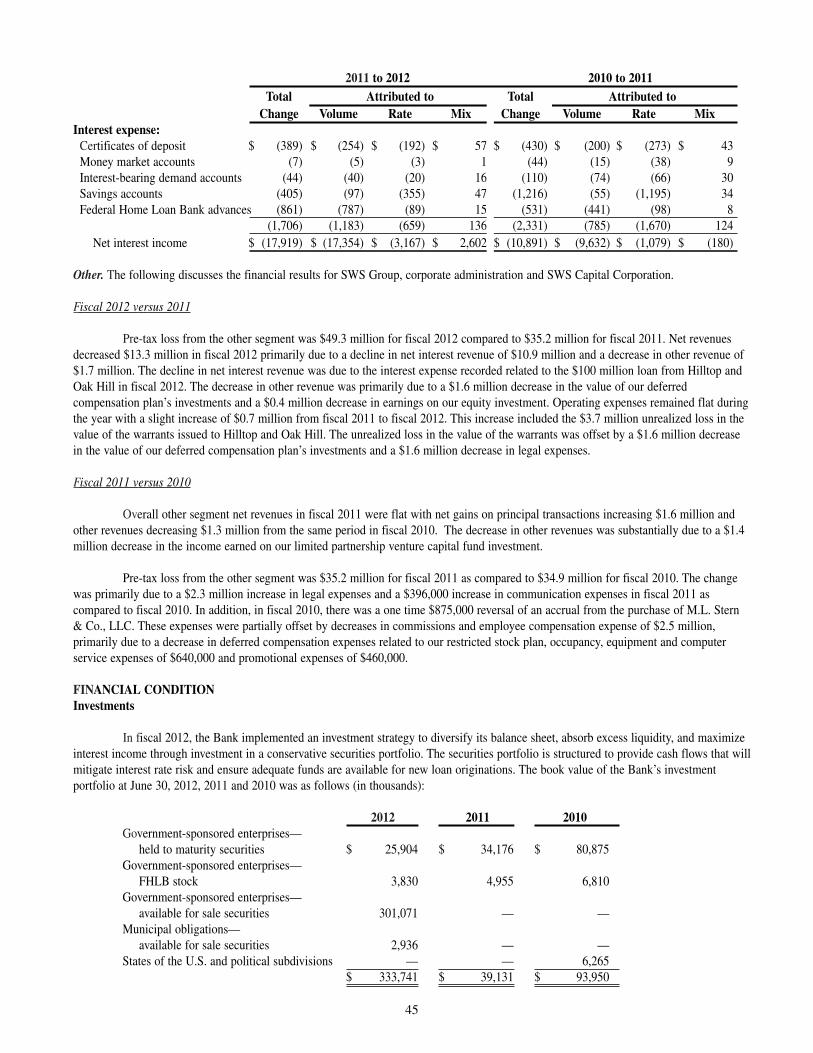
2011 to 2012 2010 to 2011Total Attributed to Total Attributed to
Change Volume Rate Mix Change Volume Rate MixInterest expense:
Certificates of deposit $ (389) $ (254) $ (192) $ 57 $ (430) $ (200) $ (273) $ 43Money market accounts (7) (5) (3) 1 (44) (15) (38) 9Interest-bearing demand accounts (44) (40) (20) 16 (110) (74) (66) 30Savings accounts (405) (97) (355) 47 (1,216) (55) (1,195) 34Federal Home Loan Bank advances (861) (787) (89) 15 (531) (441) (98) 8
(1,706) (1,183) (659) 136 (2,331) (785) (1,670) 124Net interest income $ (17,919) $ (17,354) $ (3,167) $ 2,602 $ (10,891) $ (9,632) $ (1,079) $ (180)
Other. The following discusses the financial results for SWS Group, corporate administration and SWS Capital Corporation.
Fiscal 2012 versus 2011
Pre-tax loss from the other segment was $49.3 million for fiscal 2012 compared to $35.2 million for fiscal 2011. Net revenuesdecreased $13.3 million in fiscal 2012 primarily due to a decline in net interest revenue of $10.9 million and a decrease in other revenue of$1.7 million. The decline in net interest revenue was due to the interest expense recorded related to the $100 million loan from Hilltop andOak Hill in fiscal 2012. The decrease in other revenue was primarily due to a $1.6 million decrease in the value of our deferredcompensation plan’s investments and a $0.4 million decrease in earnings on our equity investment. Operating expenses remained flat duringthe year with a slight increase of $0.7 million from fiscal 2011 to fiscal 2012. This increase included the $3.7 million unrealized loss in thevalue of the warrants issued to Hilltop and Oak Hill. The unrealized loss in the value of the warrants was offset by a $1.6 million decreasein the value of our deferred compensation plan’s investments and a $1.6 million decrease in legal expenses.
Fiscal 2011 versus 2010
Overall other segment net revenues in fiscal 2011 were flat with net gains on principal transactions increasing $1.6 million andother revenues decreasing $1.3 million from the same period in fiscal 2010. The decrease in other revenues was substantially due to a $1.4million decrease in the income earned on our limited partnership venture capital fund investment.
Pre-tax loss from the other segment was $35.2 million for fiscal 2011 as compared to $34.9 million for fiscal 2010. The changewas primarily due to a $2.3 million increase in legal expenses and a $396,000 increase in communication expenses in fiscal 2011 ascompared to fiscal 2010. In addition, in fiscal 2010, there was a one time $875,000 reversal of an accrual from the purchase of M.L. Stern& Co., LLC. These expenses were partially offset by decreases in commissions and employee compensation expense of $2.5 million,primarily due to a decrease in deferred compensation expenses related to our restricted stock plan, occupancy, equipment and computerservice expenses of $640,000 and promotional expenses of $460,000.
FINANCIAL CONDITIONInvestments
In fiscal 2012, the Bank implemented an investment strategy to diversify its balance sheet, absorb excess liquidity, and maximizeinterest income through investment in a conservative securities portfolio. The securities portfolio is structured to provide cash flows that willmitigate interest rate risk and ensure adequate funds are available for new loan originations. The book value of the Bank’s investmentportfolio at June 30, 2012, 2011 and 2010 was as follows (in thousands):
2012 2011 2010Government-sponsored enterprises—
held to maturity securities $ 25,904 $ 34,176 $ 80,875 Government-sponsored enterprises—
FHLB stock 3,830 4,955 6,810Government-sponsored enterprises—
available for sale securities 301,071 — —Municipal obligations—
available for sale securities 2,936 — —States of the U.S. and political subdivisions — — 6,265
$ 333,741 $ 39,131 $ 93,950
45
Loans and Allowance for Probable Loan Losses
The Bank grants loans to customers primarily within Texas and New Mexico. In the ordinary course of business, the Bank alsopurchases mortgage loans that have been originated in various areas of the United States. Although the Bank has a diversified loanportfolio, a substantial portion of its debtors’ ability to honor their loan terms is dependent upon the general economic conditions in Texasand New Mexico. Substantially all of the Bank’s loans are collateralized with real estate.
The allowance for loan losses is maintained to absorb management’s estimate of probable loan losses inherent in the loanportfolio at each reporting date. The allowance for loan losses is established as losses are estimated to have occurred through a provisionfor loan losses charged to earnings. Loan losses are charged against the allowance when management determines the collection ofprincipal is remote. Subsequent recoveries are recorded through the allowance. The determination of an adequate allowance is inherentlysubjective, as it requires estimates that are susceptible to significant revision as additional information becomes available or circumstanceschange.
The allowance for loan losses consists of a specific and a general allowance component.
The specific component provides for estimated probable losses for loans identified as impaired. A loan is considered impairedwhen, based on current information and events, it is probable that the Bank will be unable to collect all amounts of principal and interestwhen due according to the contractual terms of the loan agreement. Management considers the borrower’s financial condition, paymentstatus, historical payment record and any adverse situations affecting the borrower’s ability to repay when evaluating whether a loan isdeemed impaired. Loans that experience insignificant payment delays and shortfalls generally are not classified as impaired. Managementdetermines the significance of payment delays and shortfalls on a case-by-case basis taking into consideration all circumstancessurrounding the loan and the borrower, including the length of delay, the reasons for the delay, the borrower’s prior payment record and theamount of shortfall in relation to the principal and interest outstanding.
A specific reserve is recorded when and to the extent the present value of expected future cash flows discounted at the loan’soriginal effective rate, fair value of collateral if the loan is collateral-dependent or observable market price of the impaired loan is lowerthan its recorded investment. If the fair value of collateral is used to measure impairment of a collateral-dependent loan and repayment isdependent on the sale of the collateral, the fair value is adjusted to incorporate estimated costs to sell. Impaired loans that are collateral-dependent are primarily measured for impairment using the fair value of the collateral as determined by third party appraisals using theincome approach, recent comparable sales data or a combination thereof. In certain instances it is necessary for management to adjust theappraised value, less estimated costs to sell, to reflect changes in fair value occurring subsequent to the appraisal date. Managementconsiders a guarantor’s capacity and willingness to perform, when appropriate, and the borrower’s resources available for repayment whenmeasuring impairment.
The general allowance provides for estimated and probable losses inherent in the remainder of the Bank’s loan portfolio. Thegeneral allowance is determined through a statistical calculation based on the Bank’s historical loss experience adjusted for certainqualitative factors as deemed appropriate by management. The statistical calculation is conducted on a disaggregated basis for groups ofhomogeneous loans with similar risk characteristics (product types). The historical loss element is calculated as the average ratio ofcharge-offs, net of recoveries, to the average recorded investment for the current and previous three quarters. Management adjusts thehistorical loss rates to reflect deterioration in the real estate market, significant concentrations of product types, trends in portfolio volumeand the credit quality of the loan portfolio to capture additional risk of loss associated with concentrations of criticized and classified loansin the total loan portfolio. Prevailing economic conditions and specific industry trends are taken into consideration when establishing theadjustments to historical loss rates.
Certain types of loans, such as option ARM products, junior lien mortgages, high loan-to-value ratio mortgages, single familyinterest only loans, sub-prime loans, and loans with initial “teaser” rates, can have a greater risk of non-collection than other loans. At June30, 2012, the Bank had $12.3 million in junior lien mortgages. These loans represented less than 2% of total loans at June 30, 2012. AtJune 30, 2012, the Bank did not have any exposure to sub-prime loans or loans with initial teaser rates. At June 30, 2012, the Bank had$2.0 million of single family interest only loans.
At June 30, 2012, the Bank’s loan portfolio included a total of $5.4 million in loans with high loan-to-value ratios. High loan-to-value ratios are defined by regulation and range from 75%-90% depending on the type of loan. At June 30, 2012, approximately 24% ofthese loans were 1-4 single family or lot loans to home builders in North Texas. We addressed the additional risk in these loans in ourallowance calculation primarily through our review of the real estate market deterioration adjustment to the historical loss ratio.
46
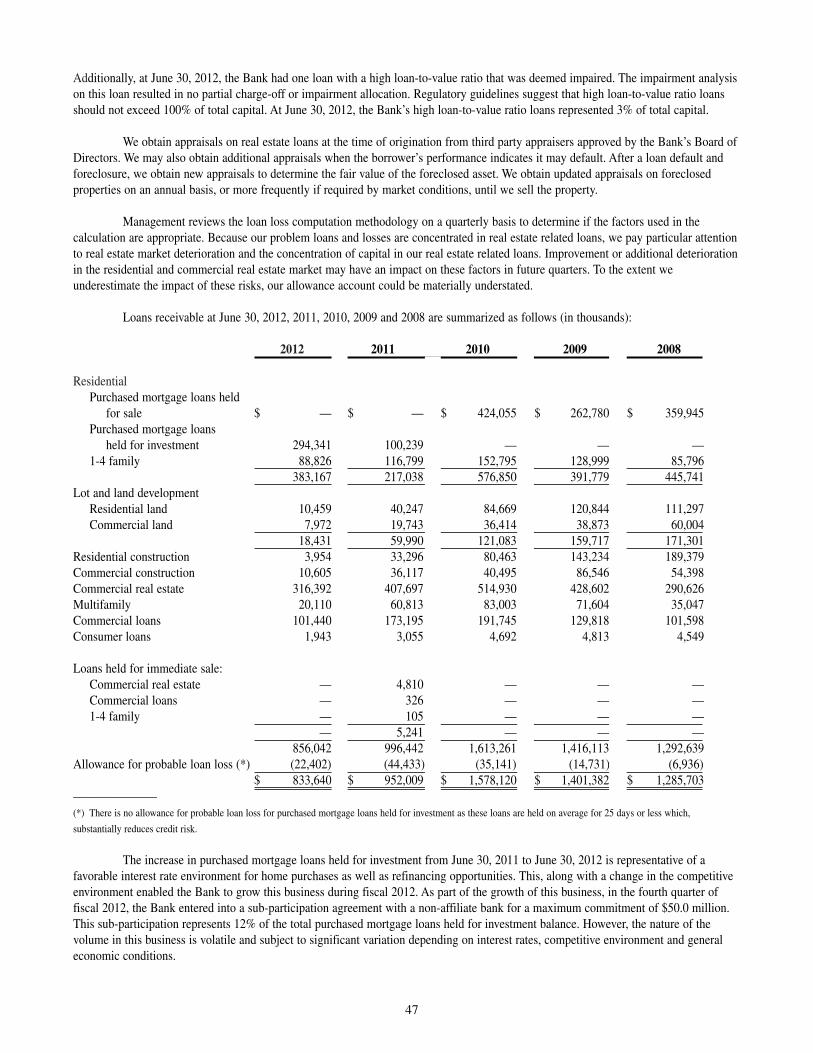
Additionally, at June 30, 2012, the Bank had one loan with a high loan-to-value ratio that was deemed impaired. The impairment analysison this loan resulted in no partial charge-off or impairment allocation. Regulatory guidelines suggest that high loan-to-value ratio loansshould not exceed 100% of total capital. At June 30, 2012, the Bank’s high loan-to-value ratio loans represented 3% of total capital.
We obtain appraisals on real estate loans at the time of origination from third party appraisers approved by the Bank’s Board ofDirectors. We may also obtain additional appraisals when the borrower’s performance indicates it may default. After a loan default andforeclosure, we obtain new appraisals to determine the fair value of the foreclosed asset. We obtain updated appraisals on foreclosedproperties on an annual basis, or more frequently if required by market conditions, until we sell the property.
Management reviews the loan loss computation methodology on a quarterly basis to determine if the factors used in thecalculation are appropriate. Because our problem loans and losses are concentrated in real estate related loans, we pay particular attentionto real estate market deterioration and the concentration of capital in our real estate related loans. Improvement or additional deteriorationin the residential and commercial real estate market may have an impact on these factors in future quarters. To the extent weunderestimate the impact of these risks, our allowance account could be materially understated.
Loans receivable at June 30, 2012, 2011, 2010, 2009 and 2008 are summarized as follows (in thousands):
2012 2011 2010 2009 2008
ResidentialPurchased mortgage loans held
for sale $ — $ — $ 424,055 $ 262,780 $ 359,945Purchased mortgage loans
held for investment 294,341 100,239 — — —1-4 family 88,826 116,799 152,795 128,999 85,796
383,167 217,038 576,850 391,779 445,741Lot and land development
Residential land 10,459 40,247 84,669 120,844 111,297Commercial land 7,972 19,743 36,414 38,873 60,004
18,431 59,990 121,083 159,717 171,301Residential construction 3,954 33,296 80,463 143,234 189,379Commercial construction 10,605 36,117 40,495 86,546 54,398Commercial real estate 316,392 407,697 514,930 428,602 290,626Multifamily 20,110 60,813 83,003 71,604 35,047Commercial loans 101,440 173,195 191,745 129,818 101,598Consumer loans 1,943 3,055 4,692 4,813 4,549
Loans held for immediate sale:Commercial real estate — 4,810 — — —Commercial loans — 326 — — —1-4 family — 105 — — —
— 5,241 — — —856,042 996,442 1,613,261 1,416,113 1,292,639
Allowance for probable loan loss (*) (22,402) (44,433) (35,141) (14,731) (6,936)$ 833,640 $ 952,009 $ 1,578,120 $ 1,401,382 $ 1,285,703
———————(*) There is no allowance for probable loan loss for purchased mortgage loans held for investment as these loans are held on average for 25 days or less which,
substantially reduces credit risk.
The increase in purchased mortgage loans held for investment from June 30, 2011 to June 30, 2012 is representative of afavorable interest rate environment for home purchases as well as refinancing opportunities. This, along with a change in the competitiveenvironment enabled the Bank to grow this business during fiscal 2012. As part of the growth of this business, in the fourth quarter offiscal 2012, the Bank entered into a sub-participation agreement with a non-affiliate bank for a maximum commitment of $50.0 million.This sub-participation represents 12% of the total purchased mortgage loans held for investment balance. However, the nature of thevolume in this business is volatile and subject to significant variation depending on interest rates, competitive environment and generaleconomic conditions.
47
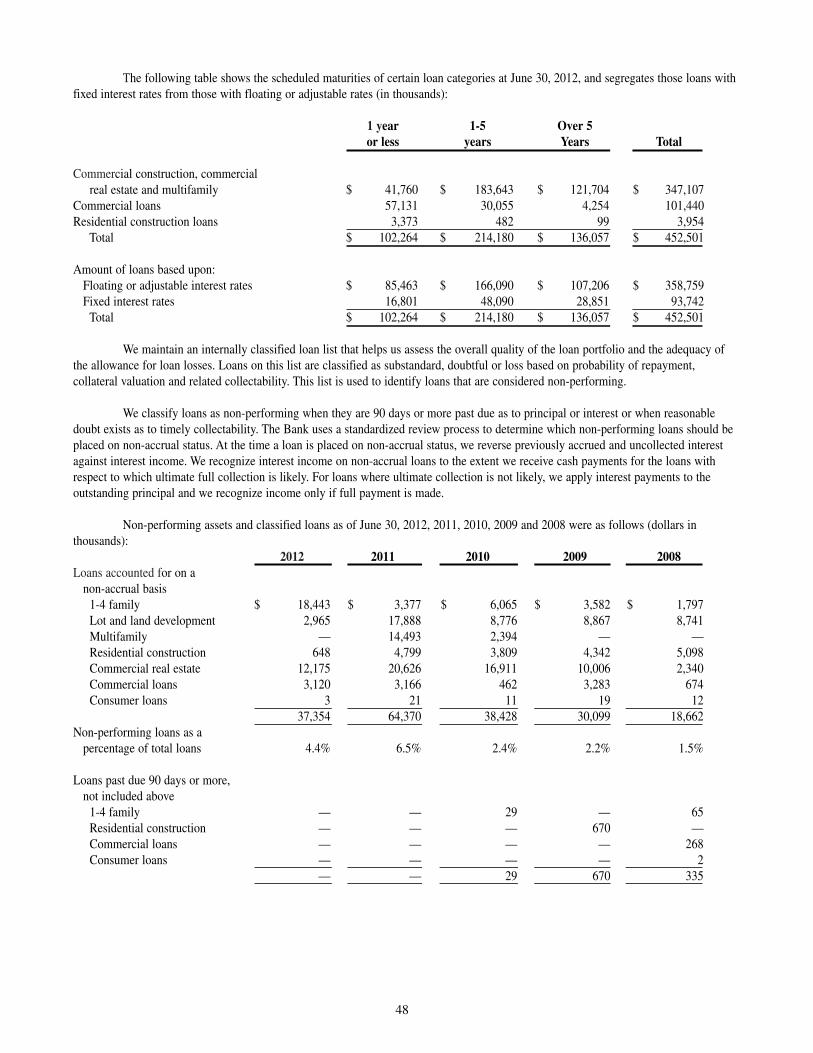
The following table shows the scheduled maturities of certain loan categories at June 30, 2012, and segregates those loans withfixed interest rates from those with floating or adjustable rates (in thousands):
1 year 1-5 Over 5or less years Years Total
Commercial construction, commercial real estate and multifamily $ 41,760 $ 183,643 $ 121,704 $ 347,107
Commercial loans 57,131 30,055 4,254 101,440 Residential construction loans 3,373 482 99 3,954
Total $ 102,264 $ 214,180 $ 136,057 $ 452,501
Amount of loans based upon:Floating or adjustable interest rates $ 85,463 $ 166,090 $ 107,206 $ 358,759 Fixed interest rates 16,801 48,090 28,851 93,742
Total $ 102,264 $ 214,180 $ 136,057 $ 452,501
We maintain an internally classified loan list that helps us assess the overall quality of the loan portfolio and the adequacy ofthe allowance for loan losses. Loans on this list are classified as substandard, doubtful or loss based on probability of repayment,collateral valuation and related collectability. This list is used to identify loans that are considered non-performing.
We classify loans as non-performing when they are 90 days or more past due as to principal or interest or when reasonabledoubt exists as to timely collectability. The Bank uses a standardized review process to determine which non-performing loans should beplaced on non-accrual status. At the time a loan is placed on non-accrual status, we reverse previously accrued and uncollected interestagainst interest income. We recognize interest income on non-accrual loans to the extent we receive cash payments for the loans withrespect to which ultimate full collection is likely. For loans where ultimate collection is not likely, we apply interest payments to theoutstanding principal and we recognize income only if full payment is made.
Non-performing assets and classified loans as of June 30, 2012, 2011, 2010, 2009 and 2008 were as follows (dollars inthousands):
2012 2011 2010 2009 2008Loans accounted for on a
non-accrual basis1-4 family $ 18,443 $ 3,377 $ 6,065 $ 3,582 $ 1,797Lot and land development 2,965 17,888 8,776 8,867 8,741Multifamily — 14,493 2,394 — —Residential construction 648 4,799 3,809 4,342 5,098Commercial real estate 12,175 20,626 16,911 10,006 2,340Commercial loans 3,120 3,166 462 3,283 674Consumer loans 3 21 11 19 12
37,354 64,370 38,428 30,099 18,662Non-performing loans as a
percentage of total loans 4.4% 6.5% 2.4% 2.2% 1.5%
Loans past due 90 days or more,not included above
1-4 family — — 29 — 65Residential construction — — — 670 —Commercial loans — — — — 268Consumer loans — — — — 2
— — 29 670 335
48
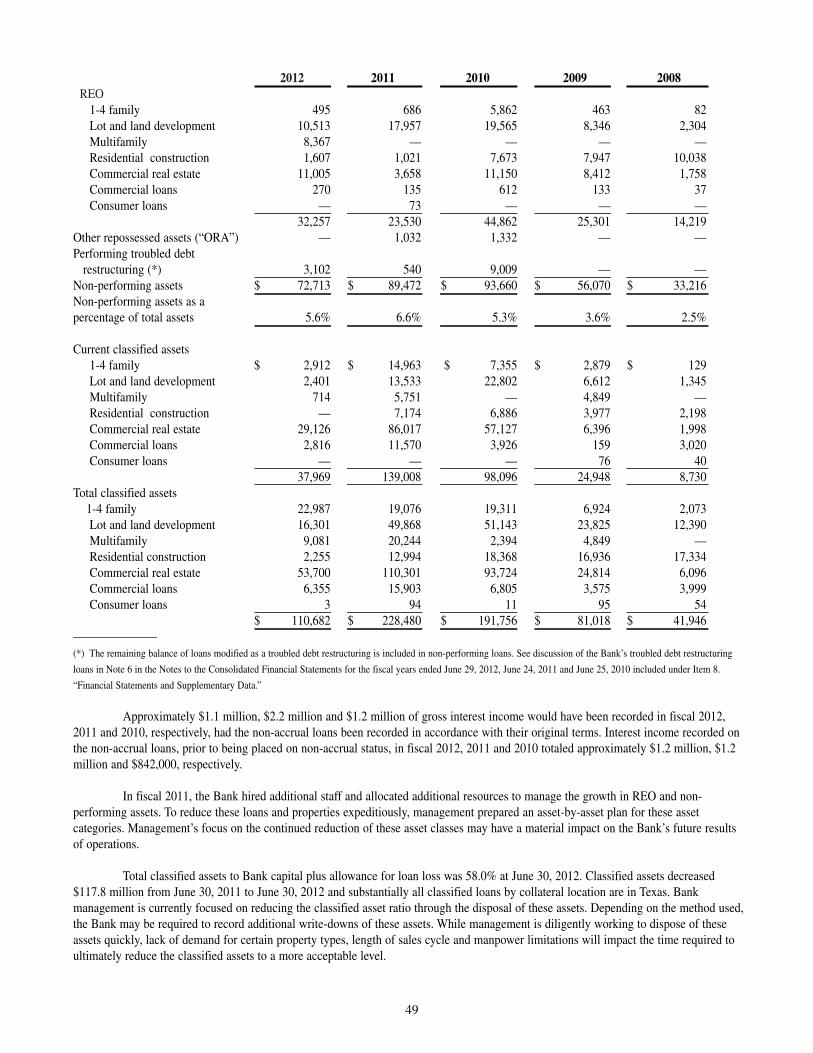
2012 2011 2010 2009 2008REO
1-4 family 495 686 5,862 463 82Lot and land development 10,513 17,957 19,565 8,346 2,304Multifamily 8,367 — — — —Residential construction 1,607 1,021 7,673 7,947 10,038Commercial real estate 11,005 3,658 11,150 8,412 1,758Commercial loans 270 135 612 133 37Consumer loans — 73 — — —
32,257 23,530 44,862 25,301 14,219Other repossessed assets (“ORA”) — 1,032 1,332 — —Performing troubled debt
restructuring (*) 3,102 540 9,009 — —Non-performing assets $ 72,713 $ 89,472 $ 93,660 $ 56,070 $ 33,216Non-performing assets as a percentage of total assets 5.6% 6.6% 5.3% 3.6% 2.5%
Current classified assets1-4 family $ 2,912 $ 14,963 $ 7,355 $ 2,879 $ 129Lot and land development 2,401 13,533 22,802 6,612 1,345Multifamily 714 5,751 — 4,849 —Residential construction — 7,174 6,886 3,977 2,198Commercial real estate 29,126 86,017 57,127 6,396 1,998Commercial loans 2,816 11,570 3,926 159 3,020Consumer loans — — — 76 40
37,969 139,008 98,096 24,948 8,730Total classified assets
1-4 family 22,987 19,076 19,311 6,924 2,073Lot and land development 16,301 49,868 51,143 23,825 12,390Multifamily 9,081 20,244 2,394 4,849 —Residential construction 2,255 12,994 18,368 16,936 17,334Commercial real estate 53,700 110,301 93,724 24,814 6,096Commercial loans 6,355 15,903 6,805 3,575 3,999Consumer loans 3 94 11 95 54
$ 110,682 $ 228,480 $ 191,756 $ 81,018 $ 41,946———————(*) The remaining balance of loans modified as a troubled debt restructuring is included in non-performing loans. See discussion of the Bank’s troubled debt restructuring
loans in Note 6 in the Notes to the Consolidated Financial Statements for the fiscal years ended June 29, 2012, June 24, 2011 and June 25, 2010 included under Item 8.
“Financial Statements and Supplementary Data.”
Approximately $1.1 million, $2.2 million and $1.2 million of gross interest income would have been recorded in fiscal 2012,2011 and 2010, respectively, had the non-accrual loans been recorded in accordance with their original terms. Interest income recorded onthe non-accrual loans, prior to being placed on non-accrual status, in fiscal 2012, 2011 and 2010 totaled approximately $1.2 million, $1.2million and $842,000, respectively.
In fiscal 2011, the Bank hired additional staff and allocated additional resources to manage the growth in REO and non-performing assets. To reduce these loans and properties expeditiously, management prepared an asset-by-asset plan for these assetcategories. Management’s focus on the continued reduction of these asset classes may have a material impact on the Bank’s future resultsof operations.
Total classified assets to Bank capital plus allowance for loan loss was 58.0% at June 30, 2012. Classified assets decreased$117.8 million from June 30, 2011 to June 30, 2012 and substantially all classified loans by collateral location are in Texas. Bankmanagement is currently focused on reducing the classified asset ratio through the disposal of these assets. Depending on the method used,the Bank may be required to record additional write-downs of these assets. While management is diligently working to dispose of theseassets quickly, lack of demand for certain property types, length of sales cycle and manpower limitations will impact the time required toultimately reduce the classified assets to a more acceptable level.
49
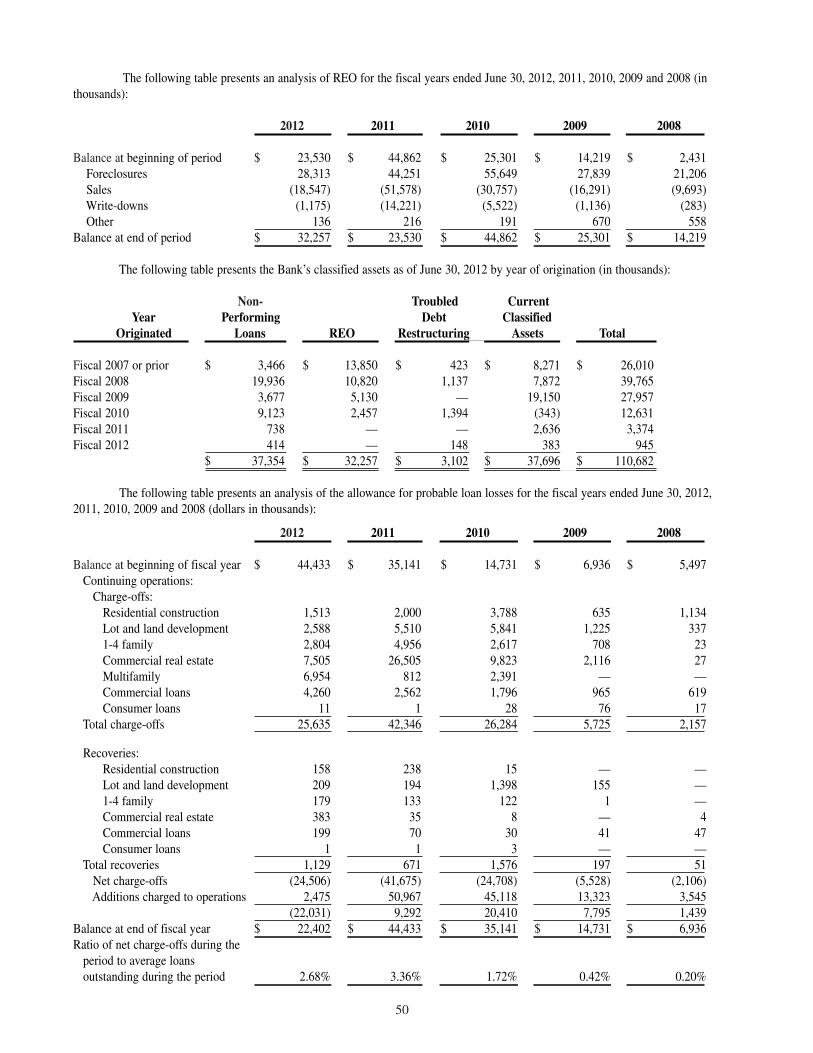
50
The following table presents an analysis of REO for the fiscal years ended June 30, 2012, 2011, 2010, 2009 and 2008 (inthousands):
2012 2011 2010 2009 2008
Balance at beginning of period $ 23,530 $ 44,862 $ 25,301 $ 14,219 $ 2,431 Foreclosures 28,313 44,251 55,649 27,839 21,206Sales (18,547) (51,578) (30,757) (16,291) (9,693)Write-downs (1,175) (14,221) (5,522) (1,136) (283)Other 136 216 191 670 558
Balance at end of period $ 32,257 $ 23,530 $ 44,862 $ 25,301 $ 14,219
The following table presents the Bank’s classified assets as of June 30, 2012 by year of origination (in thousands):
Non- Troubled CurrentYear Performing Debt Classified
Originated Loans REO Restructuring Assets Total
Fiscal 2007 or prior $ 3,466 $ 13,850 $ 423 $ 8,271 $ 26,010Fiscal 2008 19,936 10,820 1,137 7,872 39,765Fiscal 2009 3,677 5,130 — 19,150 27,957Fiscal 2010 9,123 2,457 1,394 (343) 12,631Fiscal 2011 738 — — 2,636 3,374Fiscal 2012 414 — 148 383 945
$ 37,354 $ 32,257 $ 3,102 $ 37,696 $ 110,682
The following table presents an analysis of the allowance for probable loan losses for the fiscal years ended June 30, 2012,2011, 2010, 2009 and 2008 (dollars in thousands):
2012 2011 2010 2009 2008
Balance at beginning of fiscal year $ 44,433 $ 35,141 $ 14,731 $ 6,936 $ 5,497 Continuing operations:
Charge-offs:Residential construction 1,513 2,000 3,788 635 1,134Lot and land development 2,588 5,510 5,841 1,225 3371-4 family 2,804 4,956 2,617 708 23Commercial real estate 7,505 26,505 9,823 2,116 27Multifamily 6,954 812 2,391 — —Commercial loans 4,260 2,562 1,796 965 619Consumer loans 11 1 28 76 17
Total charge-offs 25,635 42,346 26,284 5,725 2,157
Recoveries:Residential construction 158 238 15 — —Lot and land development 209 194 1,398 155 —1-4 family 179 133 122 1 —Commercial real estate 383 35 8 — 4Commercial loans 199 70 30 41 47Consumer loans 1 1 3 — —
Total recoveries 1,129 671 1,576 197 51Net charge-offs (24,506) (41,675) (24,708) (5,528) (2,106)Additions charged to operations 2,475 50,967 45,118 13,323 3,545
(22,031) 9,292 20,410 7,795 1,439Balance at end of fiscal year $ 22,402 $ 44,433 $ 35,141 $ 14,731 $ 6,936 Ratio of net charge-offs during the
period to average loans outstanding during the period 2.68% 3.36% 1.72% 0.42% 0.20%
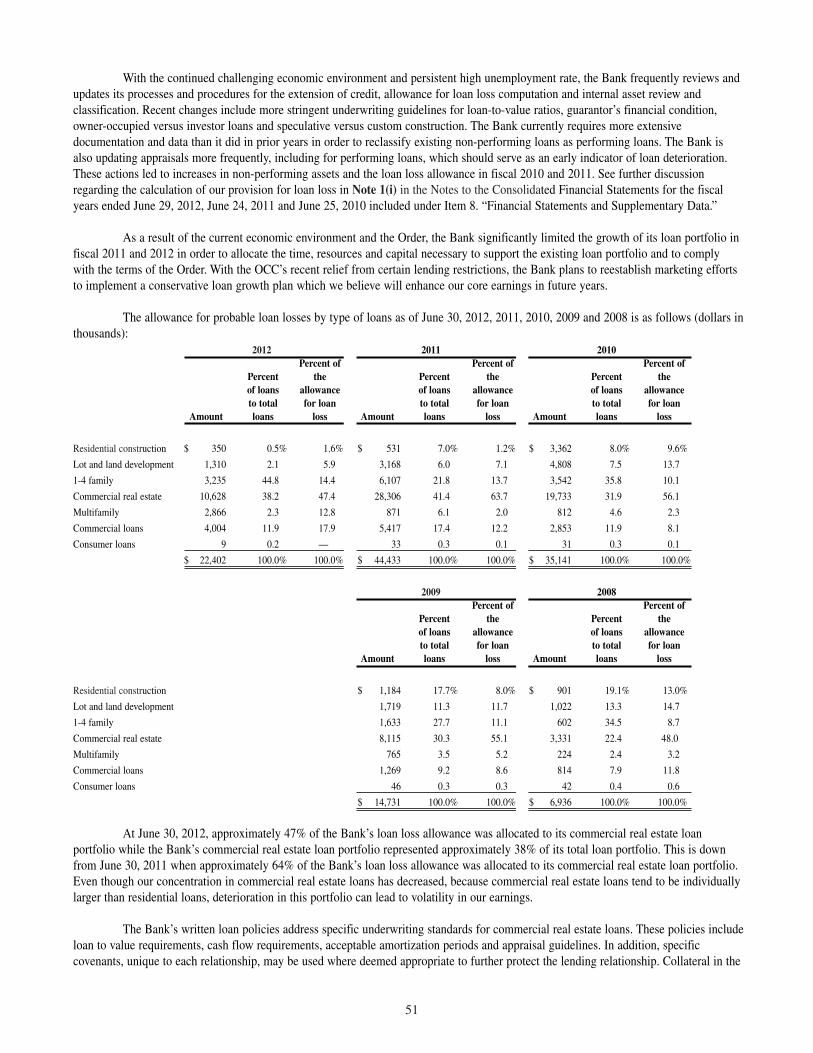
51
With the continued challenging economic environment and persistent high unemployment rate, the Bank frequently reviews andupdates its processes and procedures for the extension of credit, allowance for loan loss computation and internal asset review andclassification. Recent changes include more stringent underwriting guidelines for loan-to-value ratios, guarantor’s financial condition,owner-occupied versus investor loans and speculative versus custom construction. The Bank currently requires more extensivedocumentation and data than it did in prior years in order to reclassify existing non-performing loans as performing loans. The Bank isalso updating appraisals more frequently, including for performing loans, which should serve as an early indicator of loan deterioration.These actions led to increases in non-performing assets and the loan loss allowance in fiscal 2010 and 2011. See further discussionregarding the calculation of our provision for loan loss in Note 1(i) in the Notes to the Consolidated Financial Statements for the fiscalyears ended June 29, 2012, June 24, 2011 and June 25, 2010 included under Item 8. “Financial Statements and Supplementary Data.”
As a result of the current economic environment and the Order, the Bank significantly limited the growth of its loan portfolio infiscal 2011 and 2012 in order to allocate the time, resources and capital necessary to support the existing loan portfolio and to complywith the terms of the Order. With the OCC’s recent relief from certain lending restrictions, the Bank plans to reestablish marketing effortsto implement a conservative loan growth plan which we believe will enhance our core earnings in future years.
The allowance for probable loan losses by type of loans as of June 30, 2012, 2011, 2010, 2009 and 2008 is as follows (dollars inthousands):
2012 2011 2010Percent of Percent of Percent of
Percent the Percent the Percent theof loans allowance of loans allowance of loans allowanceto total for loan to total for loan to total for loan
Amount loans loss Amount loans loss Amount loans loss
Residential construction $ 350 0.5% 1.6% $ 531 7.0% 1.2% $ 3,362 8.0% 9.6%
Lot and land development 1,310 2.1 5.9 3,168 6.0 7.1 4,808 7.5 13.7
1-4 family 3,235 44.8 14.4 6,107 21.8 13.7 3,542 35.8 10.1
Commercial real estate 10,628 38.2 47.4 28,306 41.4 63.7 19,733 31.9 56.1
Multifamily 2,866 2.3 12.8 871 6.1 2.0 812 4.6 2.3
Commercial loans 4,004 11.9 17.9 5,417 17.4 12.2 2,853 11.9 8.1
Consumer loans 9 0.2 — 33 0.3 0.1 31 0.3 0.1
$ 22,402 100.0% 100.0% $ 44,433 100.0% 100.0% $ 35,141 100.0% 100.0%
2009 2008Percent of Percent of
Percent the Percent theof loans allowance of loans allowanceto total for loan to total for loan
Amount loans loss Amount loans loss
Residential construction $ 1,184 17.7% 8.0% $ 901 19.1% 13.0%
Lot and land development 1,719 11.3 11.7 1,022 13.3 14.7
1-4 family 1,633 27.7 11.1 602 34.5 8.7
Commercial real estate 8,115 30.3 55.1 3,331 22.4 48.0
Multifamily 765 3.5 5.2 224 2.4 3.2
Commercial loans 1,269 9.2 8.6 814 7.9 11.8
Consumer loans 46 0.3 0.3 42 0.4 0.6
$ 14,731 100.0% 100.0% $ 6,936 100.0% 100.0%
At June 30, 2012, approximately 47% of the Bank’s loan loss allowance was allocated to its commercial real estate loanportfolio while the Bank’s commercial real estate loan portfolio represented approximately 38% of its total loan portfolio. This is downfrom June 30, 2011 when approximately 64% of the Bank’s loan loss allowance was allocated to its commercial real estate loan portfolio.Even though our concentration in commercial real estate loans has decreased, because commercial real estate loans tend to be individuallylarger than residential loans, deterioration in this portfolio can lead to volatility in our earnings.
The Bank’s written loan policies address specific underwriting standards for commercial real estate loans. These policies includeloan to value requirements, cash flow requirements, acceptable amortization periods and appraisal guidelines. In addition, specificcovenants, unique to each relationship, may be used where deemed appropriate to further protect the lending relationship. Collateral in the
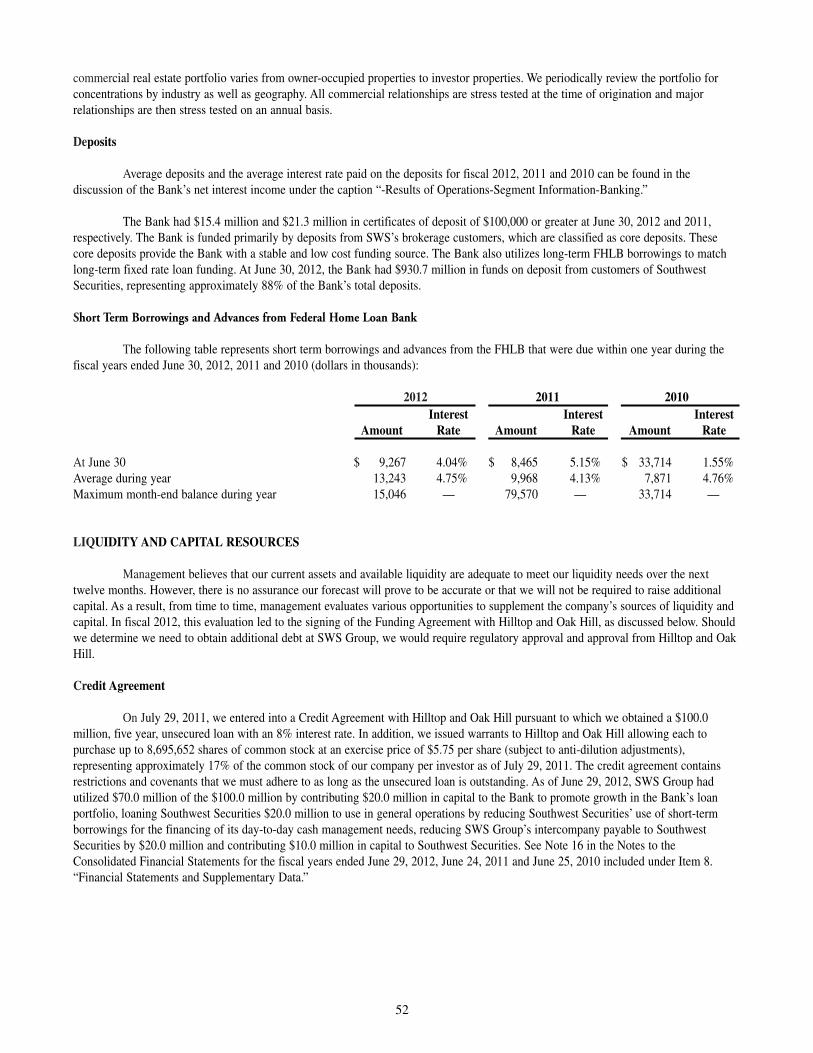
commercial real estate portfolio varies from owner-occupied properties to investor properties. We periodically review the portfolio forconcentrations by industry as well as geography. All commercial relationships are stress tested at the time of origination and majorrelationships are then stress tested on an annual basis.
Deposits
Average deposits and the average interest rate paid on the deposits for fiscal 2012, 2011 and 2010 can be found in thediscussion of the Bank’s net interest income under the caption “-Results of Operations-Segment Information-Banking.”
The Bank had $15.4 million and $21.3 million in certificates of deposit of $100,000 or greater at June 30, 2012 and 2011,respectively. The Bank is funded primarily by deposits from SWS’s brokerage customers, which are classified as core deposits. Thesecore deposits provide the Bank with a stable and low cost funding source. The Bank also utilizes long-term FHLB borrowings to matchlong-term fixed rate loan funding. At June 30, 2012, the Bank had $930.7 million in funds on deposit from customers of SouthwestSecurities, representing approximately 88% of the Bank’s total deposits.
Short Term Borrowings and Advances from Federal Home Loan Bank
The following table represents short term borrowings and advances from the FHLB that were due within one year during thefiscal years ended June 30, 2012, 2011 and 2010 (dollars in thousands):
2012 2011 2010Interest Interest Interest
Amount Rate Amount Rate Amount Rate
At June 30 $ 9,267 4.04% $ 8,465 5.15% $ 33,714 1.55%Average during year 13,243 4.75% 9,968 4.13% 7,871 4.76%Maximum month-end balance during year 15,046 — 79,570 — 33,714 —
LIQUIDITY AND CAPITAL RESOURCES
Management believes that our current assets and available liquidity are adequate to meet our liquidity needs over the nexttwelve months. However, there is no assurance our forecast will prove to be accurate or that we will not be required to raise additionalcapital. As a result, from time to time, management evaluates various opportunities to supplement the company’s sources of liquidity andcapital. In fiscal 2012, this evaluation led to the signing of the Funding Agreement with Hilltop and Oak Hill, as discussed below. Shouldwe determine we need to obtain additional debt at SWS Group, we would require regulatory approval and approval from Hilltop and OakHill.
Credit Agreement
On July 29, 2011, we entered into a Credit Agreement with Hilltop and Oak Hill pursuant to which we obtained a $100.0million, five year, unsecured loan with an 8% interest rate. In addition, we issued warrants to Hilltop and Oak Hill allowing each topurchase up to 8,695,652 shares of common stock at an exercise price of $5.75 per share (subject to anti-dilution adjustments),representing approximately 17% of the common stock of our company per investor as of July 29, 2011. The credit agreement containsrestrictions and covenants that we must adhere to as long as the unsecured loan is outstanding. As of June 29, 2012, SWS Group hadutilized $70.0 million of the $100.0 million by contributing $20.0 million in capital to the Bank to promote growth in the Bank’s loanportfolio, loaning Southwest Securities $20.0 million to use in general operations by reducing Southwest Securities’ use of short-termborrowings for the financing of its day-to-day cash management needs, reducing SWS Group’s intercompany payable to SouthwestSecurities by $20.0 million and contributing $10.0 million in capital to Southwest Securities. See Note 16 in the Notes to theConsolidated Financial Statements for the fiscal years ended June 29, 2012, June 24, 2011 and June 25, 2010 included under Item 8.“Financial Statements and Supplementary Data.”
52
Secondary Offering
On October 16, 2009, we filed a shelf registration statement with the SEC providing for the sale of $150.0 million of oursecurities. On December 9, 2009, we closed a public offering of 4,347,827 shares of common stock at a price of $11.50 per share. OnDecember 16, 2009, the underwriters for the public offering exercised their option to purchase 652,174 additional shares of our commonstock to cover over-allotments. We generated net proceeds, after deducting underwriting discounts and commissions, of approximately$54.4 million from these offerings.
Brokerage
A substantial portion of our assets are highly liquid in nature and consist mainly of cash or assets readily convertible into cash.Our equity capital, short-term bank borrowings, interest bearing and non-interest bearing client credit balances, correspondent depositsand other payables finance these assets. We maintain an allowance for doubtful accounts that represents amounts that are necessary in thejudgment of management to adequately absorb losses from known and inherent risks in receivables from clients, clients of correspondentsand correspondents. The highly liquid nature of our assets provides us with flexibility in financing and managing our anticipatedoperating needs. Management believes that the brokerage business’ present liquidity position is adequate to meet its needs over the nexttwelve months.
Short-Term Borrowings. At June 29, 2012, we had short-term borrowing availability under broker loan lines, a $20.0 millionunsecured line of credit, an irrevocable letter of credit agreement, a $45.0 million revolving committed credit facility, and a $75.0 millionrevolving uncommitted credit facility each of which is described below.
Broker Loan Lines. At June 29, 2012, we had uncommitted broker loan lines of up to $300.0 million. These lines of credit areused primarily to finance securities owned, securities held for correspondent broker/dealer accounts and receivables in customers’ marginaccounts. These lines may also be used to release pledged collateral against day loans. These credit arrangements are provided on an “asoffered” basis, are not committed lines of credit and can be terminated at any time by the lender. Any outstanding balances under thesecredit arrangements are due on demand and bear interest at rates indexed to the federal funds rate. At June 29, 2012, the amountoutstanding under these secured arrangements was $22.5 million, which was collateralized by securities held for firm accounts valued at$80.1 million. Our ability to borrow additional funds is limited by our eligible collateral. See additional discussion under Item 1A. “RiskFactors.”
Unsecured Line of Credit. We also have a $20.0 million unsecured line of credit that is due on demand and bears interest atrates indexed to the federal funds rate. This credit arrangement is provided on an “as offered” basis and is not a committed line of credit.The total amount of borrowings available under this line of credit is reduced by the amount outstanding under any unsecured letters ofcredit at the time of borrowing. At June 29, 2012, we had no outstanding unsecured letters of credit. At June 29, 2012, there were noamounts outstanding on this line, and we had $20.0 million available for borrowing under this line of credit.
Letter of Credit Agreement. At June 29, 2012, we had an irrevocable letter of credit agreement aggregating $75.0 millionpledged to support our open options positions with an options clearing organization. Until drawn, the letter of credit bears interest of0.5% per annum. If drawn, the letter of credit bears interest at a rate of 0.5% per annum plus a fee. The letter of credit agreement isrenewable semi-annually. This letter of credit is fully collateralized by marketable securities held in client and non-client margin accountswith a value of $86.1 million at June 29, 2012.
Revolving Credit Facility. On January 28, 2011, Southwest Securities entered into an agreement with an unaffiliated bank for a$45.0 million committed revolving credit facility. The commitment fee is 37.5 basis points per annum and, when drawn, the interest rateis equal to the federal funds rate plus 125 basis points. The agreement requires Southwest Securities to maintain tangible net worth of$150.0 million. As of June 29, 2012, there was $45.0 million outstanding under this credit facility. The $45.0 million of securedborrowings was collateralized by securities with a value of $71.3 million at June 29, 2012.
On June 29, 2012, Southwest Securities entered into an agreement with an unaffiliated bank for a $75.0 million secured,uncommitted revolving credit facility that is due on demand and bears interest at a rate mutually agreed upon at the time of borrowing.All or a portion of the loans may be available for intra-day loan purposes (“Day Loans”). All Day Loans are payable on the day they aremade. Interest is payable monthly and computed on the basis of 360 days for the actual number of days elapsed. One day of interest willaccrue on Day Loans on the day they are made at a per annum rate of 1% per annum.
53
Net Capital Requirements. Our broker/dealer subsidiaries are subject to the requirements of the SEC relating to liquidity,capital standards and the use of client funds and securities. The amount of the broker/dealer subsidiaries’ net assets that may bedistributed to the parent of the broker/dealer is subject to restrictions under applicable net capital rules. Historically, we have operated inexcess of the minimum net capital requirements. See Note 18 in the Notes to the Consolidated Financial Statements for the fiscal yearsended June 29, 2012, June 24, 2011 and June 25, 2010 included under Item 8. “Financial Statements and Supplementary Data.”
Secured Borrowings. We participate in transactions involving securities sold under repurchase agreements (“repos”), which aresecured borrowings that we record in our statement of financial condition as other liabilities. These securities generally mature within oneto four days from the transaction date. Securities sold under repurchase agreements are reflected at the amount of cash received inconnection with the transactions. We may be required to provide additional collateral based on the fair value of the underlying securities.
Banking
Liquidity is monitored daily to ensure the Bank’s ability to meet deposit withdrawals, maintain reserve requirements andotherwise sustain operations. The Bank’s liquidity is maintained in the form of readily marketable loans and investment securities,balances with the FHLB, Federal Reserve Bank of Dallas, federal funds sold to correspondent banks and vault cash. At June 30, 2012, theBank had net borrowing capacity from the FHLB of $313.6 million. In addition, at June 30, 2012, the Bank had the ability to borrow upto $62.0 million in funds from the Federal Reserve Bank of Dallas under its secondary credit program.
In the second quarter of fiscal 2010, the Bank entered into a secured line of credit agreement with the Federal Reserve Bank ofDallas. This line of credit is secured by the Bank’s commercial loan portfolio. This line is due on demand and bears interest at a rate 100basis points over the federal funds target rate. This line is used to support short-term liquidity needs, and at June 30, 2012, there were noamounts outstanding.
The Bank’s asset and liability management policy is intended to manage interest rate risk. The Bank accomplishes this throughmanagement of the periodic repricing of its interest-earning assets and its interest-bearing liabilities. Overall interest rate risk is monitoredthrough reports showing both sensitivity ratios, a simulation model, and existing “GAP” data. (See the Bank’s GAP analysis in “-RiskManagement-Market Risk-Interest Rate Risk-Banking.”) At June 30, 2012, $930.7 million of the Bank’s deposits were from the brokeragecustomers of Southwest Securities. Current events in the securities markets could impact the amount of these funds available to the Bank.
Capital Requirements. The Bank is subject to various regulatory capital requirements administered by federal agencies.Quantitative measures, established by regulation to ensure capital adequacy, require maintaining minimum amounts and ratios of total andTier I capital (as defined in 12 CFR 165 and 12 CFR 167) to risk-weighted assets (as defined) and of Tier I (core) capital (as defined) toadjusted assets (as defined). At June 30, 2012, the Bank had a total risk-based capital ratio of 19.2%, which resulted in excess capital of$65.8 million over the Order’s total risk-based capital requirement of $110.0 million, and the Bank had a Tier I (core) capital ratio of12.6% or $60.1 million over the Order’s Tier I (core) capital requirement of $104.2 million. At June 30, 2012, the Bank had a Tier I risk-based capital ratio of 17.9%. Under federal law, the OCC may require the Bank to apply another measure of risk-weight or capital ratiothat the OCC deems appropriate.
The Bank has historically met all of its capital adequacy requirements. As of June 30, 2012, the Bank met all capitalrequirements to which it was subject and satisfied the requirements to be defined as a “well-capitalized institution.” However, as a resultof the issuance of the Order, the Bank is deemed to be “adequately capitalized” and no longer meets the definition of “well capitalized”under federal statutes and OCC regulations even though its capital ratios meet or exceed all applicable requirements under Federal law,OCC regulations and the Order. See Note 29 in the Notes to the Consolidated Financial Statements for the fiscal years ended June 29,2012, June 24, 2011 and June 25, 2010 included under Item 8. “Financial Statements and Supplementary Data.” Should the Bank notmeet these requirements, certain mandatory and discretionary supervisory actions (as defined in 12 CFR 165.6) could be applicable.
Off-Balance Sheet Arrangements
We generally do not enter into off-balance sheet arrangements, as defined by the SEC. However, our broker/dealer subsidiariesenter into transactions in the normal course of business that expose us to off-balance sheet risk. See Note 28 in the Notes to theConsolidated Financial Statements for the fiscal years ended June 29, 2012, June 24, 2011 and June 25, 2010 included under Item 8.“Financial Statements and Supplementary Data.”
54
Contractual Obligations and Contingent PaymentsPayment Due
Less than More than(in thousands) Total 1 year 1-3 years 3-5 years 5 years Other (5)
Long-term debt (1) $ 159,374 $ — $ 26,491 $ 106,721 $ 26,162 $ —Interest on long-term debt (2) 73,205 15,406 30,638 18,704 8,457 —Certificates of deposit 37,100 26,240 9,836 1,024 — —Uncertain tax positions 1,125 — — — — 1,125Other leases (3) 40,960 8,801 13,124 8,609 10,426 —Investment commitments 5,400 5,400 — — — —Purchase obligations 16,975 13,062 3,913 — — —Deferred compensation (4) 6,631 2,098 1,702 1,040 1,791 —Purchase mortgage loan
sub-participations 50,000 — — — — 50,000Scholarship endowment 500 — — — — 500
Total $ 391,270 $ 71,007 $ 85,704 $ 136,098 $ 46,836 $ 51,625
——————————(1) Long-term debt is comprised of advances from the FHLB with maturities greater than one year and the credit agreement with Hilltop and Oak Hill.(2) Amount of interest payable includes the advances from the FHLB based on rates ranging from 2.6% to 6.8% and the credit agreement with Hilltop and Oak Hill based on
an effective interest rate of 15%. (3) Of the $40,960 in lease commitments, no amounts are reserved for impairment.(4) We have commitments to our employees for deferred compensation in the amount of $6,631 that become payable in future fiscal years as defined by the plan and
determined by participants who have formally requested payment of their plan balances. See Note 19 in the Notes to the Consolidated Financial Statements for the fiscal
years ended June 29, 2012, June 24, 2011 and June 25, 2010 included under Item 8. “Financial Statements and Supplementary Data.”(5) Due date cannot be estimated. See Note 1(t), Note 17 and Note 25 in the Notes to the Consolidated Financial Statements for the fiscal years ended June 29, 2012, June
24, 2011 and June 25, 2010 included under Item 8. “Financial Statements and Supplementary Data.”
Cash Flow
Net cash used in operating activities totaled $1.5 million and $259.5 million in fiscal 2012 and fiscal 2010, respectively. Infiscal 2011, cash provided by operating activities totaled $490.0 million. The decrease from fiscal 2011 to fiscal 2012 and the increasefrom fiscal 2010 to fiscal 2011 in net cash provided by (used in) operating activities was primarily due to the change in cash flowclassification of the Bank’s purchased mortgage program loans. In fiscal 2010, the cash flow from these loans were classified as operatingcash flows, while in fiscal 2011, the cash flows were presented as investing cash flows.
Net cash used in investing activities was $219.8 million and $172.4 million in fiscal 2012 and fiscal 2010, respectively, whilenet cash provided by investing activities was $208.5 million in fiscal 2011. The primary reason for the decrease in cash provided byinvesting activities in fiscal 2012 as compared to fiscal 2011 was a $349.2 million increase in investment securities at the Bank, a $42.2million decrease in proceeds received from the sale of loans, the investment of $30.0 million of proceeds from the credit agreement withHilltop and Oak Hill, a $23.4 million increase in the net amount invested in loans at the Bank, and a $15.4 million decrease in proceedsfrom the sale/redemption of investment securities. The primary reason for the increase in cash provided by investing activities from fiscal2010 to 2011 was a $178.9 million decrease in the net amount invested in loans at the Bank.
Net cash provided by financing activities totaled $4.3 million and $362.9 million for fiscal 2012 and 2010, respectively. Netcash used in financing activities was $426.8 million for fiscal 2011. The primary reason for the increase in the cash provided by financingactivities was the $100.0 million loan from Oak Hill and Hilltop in July 2011 and a reduction in deposits of $44.2 million in fiscal 2012versus a reduction in deposits of $382.3 million for fiscal 2011. Offsetting this increase in cash provided by financing activities in fiscal2012 was a decrease in net short-term borrowings. The primary reason for the decrease in cash provided by financing activities fromfiscal 2010 to fiscal 2011 was a decrease in deposits at the Bank.
We expect that cash flows provided by operating activities and short-term borrowings will be the primary source of workingcapital for the next fiscal year.
55
Treasury Stock
Periodically, we repurchase our shares of common stock under a plan approved by our Board of Directors. In August 2011, theBoard of Directors of SWS Group approved a plan authorizing us to purchase up to 500,000 shares of common stock from time to time inthe open market for an 18-month period ending on February 28, 2013. During fiscal 2012, no shares of common stock were purchasedunder this program. We do not intend to repurchase any shares of common stock under this plan and would require Hilltop, Oak Hill andregulatory approval to repurchase shares under this plan.
On November 17, 2009, the stockholders of SWS Group voted to increase the authorized number of shares of common stockavailable for issuance under our deferred compensation plan from 375,000 shares to 675,000 shares. The trustee under our deferredcompensation plan periodically purchases shares of our common stock in the open market in accordance with the terms of the plan. Thisstock is classified as treasury stock in our consolidated financial statements, but participates in future dividends declared by us. Duringfiscal year 2012, the plan purchased approximately 58,000 shares of common stock at a cost of approximately $329,000, or $5.63 pershare, and approximately 15,000 shares were sold or distributed to participants pursuant to the plan. See Item 5. “Market for Registrant’sCommon Equity, Related Stockholder Matters and Issuer Purchases of Equity Securities.”
As restricted stock grants vest, grantees may sell a portion of their vested shares to us to cover the tax liabilities arising fromvesting. As a result, in fiscal 2012, we repurchased approximately 13,000 shares of common stock with a market value of approximately$62,000, or an average of $4.79 per share, to cover tax liabilities.
Inflation
Our financial statements included herein have been prepared in accordance with GAAP. GAAP requires us to measure financialposition and operating results primarily in terms of historic dollars. Changes in the relative value of money due to inflation or recessionare generally not considered under GAAP. Our assets are primarily monetary, consisting of cash, securities inventory and receivables fromcustomers and broker/dealers. These monetary assets are generally liquid and turn over rapidly and, consequently, are not significantlyaffected by inflation. The rate of inflation affects various expenses of the company, such as employee compensation and benefits,communications, and occupancy and equipment, which may not be readily recoverable in the price of our services. The rate of inflationcan also have a significant impact on securities prices and on investment preferences by our customers, generally. In management’sopinion, changes in interest rates affect the financial condition of a financial services firm to a greater degree than changes in the inflationrate. While interest rates are greatly influenced by changes in the inflation rate, they do not necessarily change at the same rate or in thesame magnitude as the inflation rate. Interest rates are highly sensitive to many factors that are beyond our control, including changes inthe expected rate of inflation, the influence of general and local economic conditions and the monetary and fiscal policies of the UnitedStates government, its agencies and various other governmental regulatory authorities among other things. See Item 1A, “Risk Factors -Risks Specific to Our Industries.”
RISK MANAGEMENT
In an effort to assist the Company in managing enterprise risk, in 2010 and at the Board of Director’s request, the Companyengaged a firm to perform an analysis of the Company’s enterprise risk management process. During fiscal 2011, based on the Board ofDirector’s recommendations, we initiated an enterprise risk management program and committee. Enterprise risk is viewed as the threatfrom an event, action of loss of opportunity that, if it occurs or has occurred, may adversely affect any, or any combination of, ourcompany objectives, business strategies, business model, regulatory compliance, reputation and existence. The committee works with ourvarious departments and committees to manage our enterprise risk management program and reports the results of this work to the AuditCommittee of the Board of Directors on a quarterly basis. During fiscal 2012, we continued to use consulting services to improve riskmanagement processes, procedures and reporting.
We manage risk exposure through the involvement of various levels of management. We establish, maintain and regularlymonitor maximum positions by industry and issuer in both trading and inventory accounts. Current and proposed underwriting, bankingand other commitments are subject to due diligence reviews by senior management, as well as professionals in the appropriate businessand support units involved. The Bank seeks to reduce the risk of significant adverse effects of market rate fluctuations by minimizing thedifference between rate-sensitive assets and liabilities, referred to as “GAP,” and maintaining an interest rate sensitivity position within aparticular timeframe. Credit risk related to various financing activities is reduced by the industry practice of obtaining and maintainingcollateral. We monitor our exposure to counterparty risk through the use of credit information, the monitoring of collateral values and theestablishment of credit limits. We have established various risk management committees that are responsible for reviewing and managingrisk related to interest rates, trading positions, margin and other credit risk and risks from capital market transactions.
56
Credit Risk
A description of the credit risk for our brokerage and banking segments is as follows:
Brokerage. Credit risk arises from the potential nonperformance by counterparties, customers or debt security issuers. We areexposed to credit risk as a trading counterparty and as a stock loan counterparty to dealers and customers, as a holder of securities and asa member of clearing organizations. We have established credit risk committees to review our credit exposure in various business units.These committees are composed of senior management of the company. Credit exposure is also associated with customer marginaccounts, which are monitored daily. We monitor exposure to individual securities and perform sensitivity analysis on a regular basis inconnection with our margin lending activities. We adjust our margin requirements if we believe our risk exposure is not appropriate basedon market conditions.
Banking. Credit risk is the possibility that a borrower or counterparty will fail to meet its obligations in accordance with agreedterms and is inherent in all types of lending. The Bank has developed and continues to enhance its policies and procedures to provide aprocess for managing credit risk. These policies and procedures include underwriting guidelines, credit and collateral tracking anddetailed loan approval procedures which include officer and director loan committees. The Bank also maintains a detailed loan reviewprocess to monitor the quality of its loan portfolio. The Bank grants loans to customers primarily within Texas and New Mexico. TheBank also purchases mortgage loans, which have been originated in other areas of the United States. Although the Bank has a diversifiedloan portfolio, a substantial portion of its debtors’ ability to honor their contracts is dependent upon the general economic conditions inTexas and New Mexico. Policies and procedures, which are in place to manage credit risk, are designed to be responsive to changes inthese economic conditions.
Operational Risk
Operational risk refers generally to risk of loss resulting from our operations, including but not limited to, improper orunauthorized execution and processing of transactions, deficiencies in our operating systems, and inadequacies or breaches in our controlprocesses. We operate in diverse markets and rely on the ability of our employees and systems to process large numbers of transactions.In order to mitigate and control operational risk, we have developed and continue to enhance specific policies and procedures that aredesigned to identify and manage operational risk at appropriate levels. We also use periodic self-assessments and internal auditexaminations as further review of the effectiveness of our controls and procedures in mitigating our operational risk.
Legal Risk
Legal risk includes the risk of non-compliance with applicable legal and regulatory requirements. We are subject to extensiveregulation in the different jurisdictions in which we conduct business. We have established procedures based on legal and regulatoryrequirements that are designed to reasonably ensure compliance with applicable statutory and regulatory requirements. We also haveestablished procedures that are designed to ensure that executive management’s policies relating to conduct, ethics and business practicesare followed. In connection with our business, we have various procedures addressing significant issues such as regulatory capitalrequirements, sales and trading practices, new products, use and safekeeping of customer funds and securities, granting credit, collectionactivities, money laundering, privacy and record keeping.
Market Risk
Market risk generally represents the risk of loss that may result from the potential change in value of a financial instrument as aresult of fluctuations in interest rates, market prices, investor expectations and changes in credit ratings of the issuer. Our exposure tomarket risk is directly related to our role as a financial intermediary in customer-related transactions and to our proprietary tradingactivities and securities lending activities.
Interest Rate Risk. A description of the interest rate risk for our brokerage and banking segments are as follows:
Brokerage. Interest rate risk is a consequence of maintaining inventory positions and trading in interest rate sensitive financialinstruments and maintaining a matched stock loan book. Our fixed income activities also expose us to the risk of loss related to changesin credit spreads. Credit spread risk arises from the potential that changes in an issuer’s credit rating or credit perception could affect thevalue of financial instruments.
57
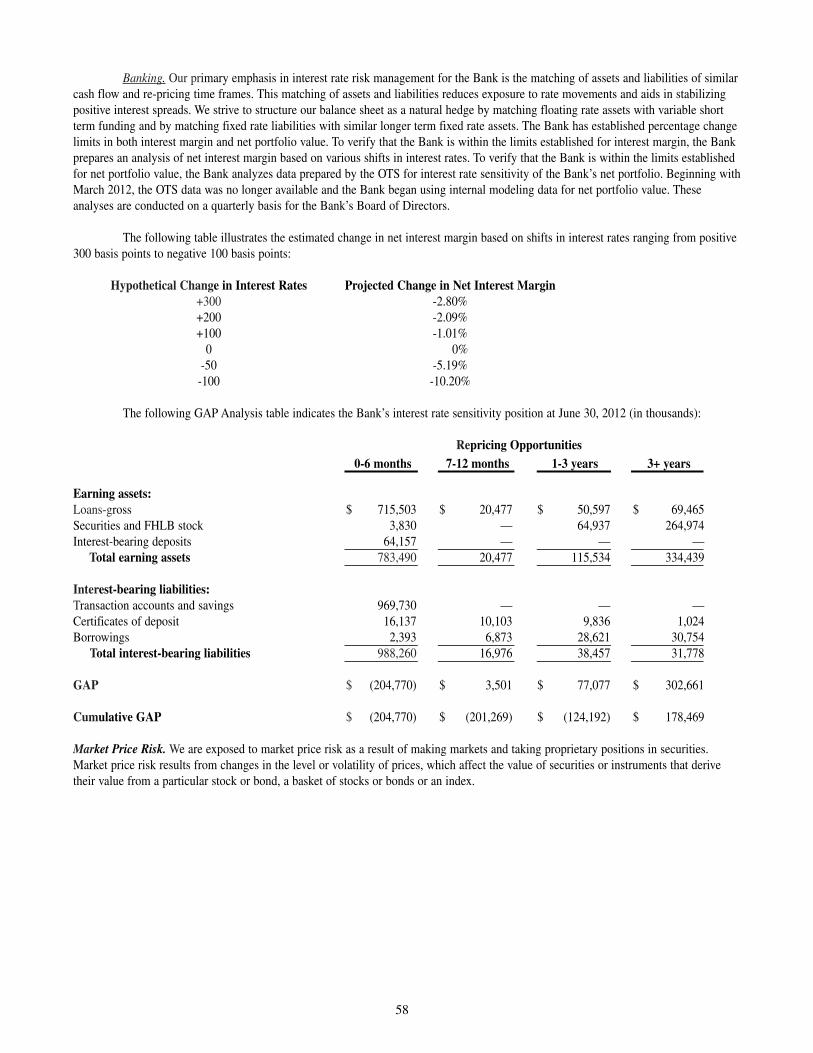
Banking. Our primary emphasis in interest rate risk management for the Bank is the matching of assets and liabilities of similarcash flow and re-pricing time frames. This matching of assets and liabilities reduces exposure to rate movements and aids in stabilizingpositive interest spreads. We strive to structure our balance sheet as a natural hedge by matching floating rate assets with variable shortterm funding and by matching fixed rate liabilities with similar longer term fixed rate assets. The Bank has established percentage changelimits in both interest margin and net portfolio value. To verify that the Bank is within the limits established for interest margin, the Bankprepares an analysis of net interest margin based on various shifts in interest rates. To verify that the Bank is within the limits establishedfor net portfolio value, the Bank analyzes data prepared by the OTS for interest rate sensitivity of the Bank’s net portfolio. Beginning withMarch 2012, the OTS data was no longer available and the Bank began using internal modeling data for net portfolio value. Theseanalyses are conducted on a quarterly basis for the Bank’s Board of Directors.
The following table illustrates the estimated change in net interest margin based on shifts in interest rates ranging from positive300 basis points to negative 100 basis points:
Hypothetical Change in Interest Rates Projected Change in Net Interest Margin+300 -2.80%+200 -2.09%+100 -1.01%
0 0%-50 -5.19%-100 -10.20%
The following GAP Analysis table indicates the Bank’s interest rate sensitivity position at June 30, 2012 (in thousands):
Repricing Opportunities0-6 months 7-12 months 1-3 years 3+ years
Earning assets:Loans-gross $ 715,503 $ 20,477 $ 50,597 $ 69,465Securities and FHLB stock 3,830 — 64,937 264,974Interest-bearing deposits 64,157 — — —
Total earning assets 783,490 20,477 115,534 334,439
Interest-bearing liabilities:Transaction accounts and savings 969,730 — — —Certificates of deposit 16,137 10,103 9,836 1,024Borrowings 2,393 6,873 28,621 30,754
Total interest-bearing liabilities 988,260 16,976 38,457 31,778
GAP $ (204,770) $ 3,501 $ 77,077 $ 302,661
Cumulative GAP $ (204,770) $ (201,269) $ (124,192) $ 178,469
Market Price Risk. We are exposed to market price risk as a result of making markets and taking proprietary positions in securities.Market price risk results from changes in the level or volatility of prices, which affect the value of securities or instruments that derivetheir value from a particular stock or bond, a basket of stocks or bonds or an index.
58
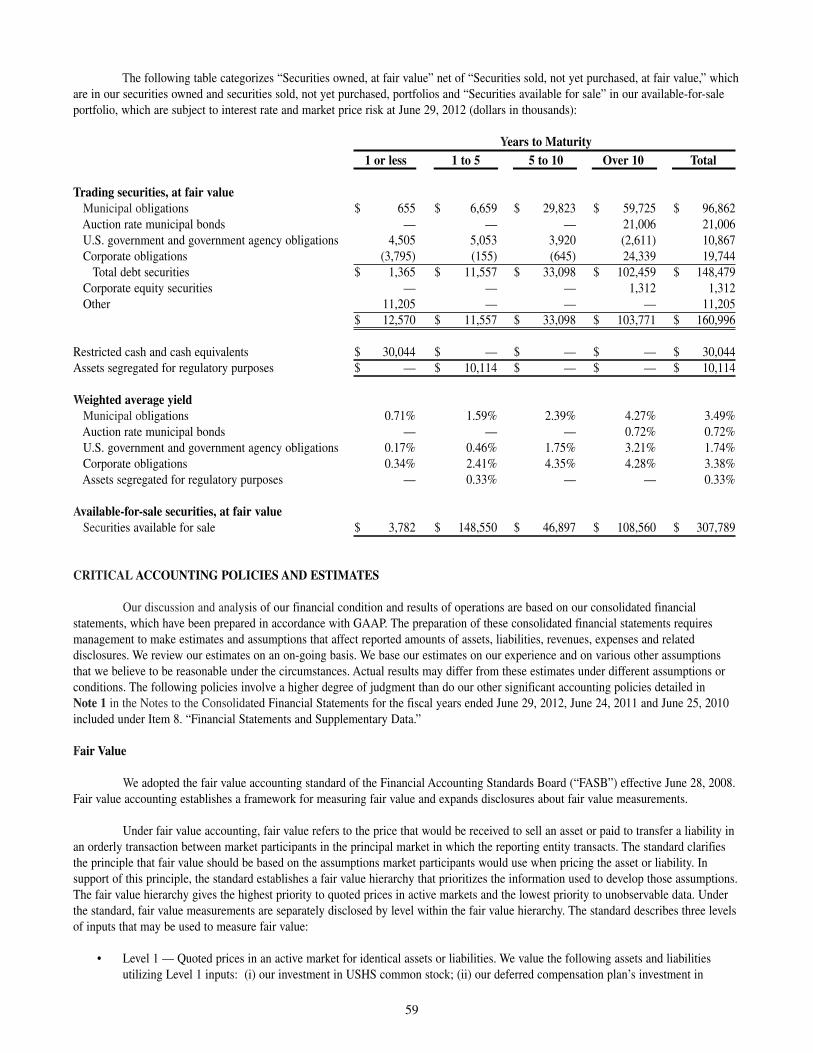
The following table categorizes “Securities owned, at fair value” net of “Securities sold, not yet purchased, at fair value,” whichare in our securities owned and securities sold, not yet purchased, portfolios and “Securities available for sale” in our available-for-saleportfolio, which are subject to interest rate and market price risk at June 29, 2012 (dollars in thousands):
Years to Maturity1 or less 1 to 5 5 to 10 Over 10 Total
Trading securities, at fair valueMunicipal obligations $ 655 $ 6,659 $ 29,823 $ 59,725 $ 96,862 Auction rate municipal bonds — — — 21,006 21,006 U.S. government and government agency obligations 4,505 5,053 3,920 (2,611) 10,867Corporate obligations (3,795) (155) (645) 24,339 19,744
Total debt securities $ 1,365 $ 11,557 $ 33,098 $ 102,459 $ 148,479Corporate equity securities — — — 1,312 1,312Other 11,205 — — — 11,205
$ 12,570 $ 11,557 $ 33,098 $ 103,771 $ 160,996
Restricted cash and cash equivalents $ 30,044 $ — $ — $ — $ 30,044Assets segregated for regulatory purposes $ — $ 10,114 $ — $ — $ 10,114
Weighted average yieldMunicipal obligations 0.71% 1.59% 2.39% 4.27% 3.49%Auction rate municipal bonds — — — 0.72% 0.72%U.S. government and government agency obligations 0.17% 0.46% 1.75% 3.21% 1.74%Corporate obligations 0.34% 2.41% 4.35% 4.28% 3.38%Assets segregated for regulatory purposes — 0.33% — — 0.33%
Available-for-sale securities, at fair valueSecurities available for sale $ 3,782 $ 148,550 $ 46,897 $ 108,560 $ 307,789
CRITICAL ACCOUNTING POLICIES AND ESTIMATES
Our discussion and analysis of our financial condition and results of operations are based on our consolidated financialstatements, which have been prepared in accordance with GAAP. The preparation of these consolidated financial statements requiresmanagement to make estimates and assumptions that affect reported amounts of assets, liabilities, revenues, expenses and relateddisclosures. We review our estimates on an on-going basis. We base our estimates on our experience and on various other assumptionsthat we believe to be reasonable under the circumstances. Actual results may differ from these estimates under different assumptions orconditions. The following policies involve a higher degree of judgment than do our other significant accounting policies detailed in Note 1 in the Notes to the Consolidated Financial Statements for the fiscal years ended June 29, 2012, June 24, 2011 and June 25, 2010included under Item 8. “Financial Statements and Supplementary Data.”
Fair Value
We adopted the fair value accounting standard of the Financial Accounting Standards Board (“FASB”) effective June 28, 2008.Fair value accounting establishes a framework for measuring fair value and expands disclosures about fair value measurements.
Under fair value accounting, fair value refers to the price that would be received to sell an asset or paid to transfer a liability inan orderly transaction between market participants in the principal market in which the reporting entity transacts. The standard clarifiesthe principle that fair value should be based on the assumptions market participants would use when pricing the asset or liability. Insupport of this principle, the standard establishes a fair value hierarchy that prioritizes the information used to develop those assumptions.The fair value hierarchy gives the highest priority to quoted prices in active markets and the lowest priority to unobservable data. Underthe standard, fair value measurements are separately disclosed by level within the fair value hierarchy. The standard describes three levelsof inputs that may be used to measure fair value:
• Level 1 — Quoted prices in an active market for identical assets or liabilities. We value the following assets and liabilitiesutilizing Level 1 inputs: (i) our investment in USHS common stock; (ii) our deferred compensation plan’s investment in
59
Westwood common stock; (iii) our investment in government guaranteed bonds purchased under the Temporary LiquidityGuarantee Program (“TLGP”); and (iv) certain inventories held in our securities owned and securities sold, not yet purchasedportfolio. Valuation of these instruments does not require a high degree of judgment as the valuations are based on quotedprices in active markets that are readily available.
• Level 2 — Observable inputs other than Level 1 prices, such as quoted prices for similar assets or liabilities; quoted prices inmarkets that are not active; or other inputs that are observable or can be corroborated by observable market data forsubstantially the full term of the assets or liabilities. We value the following assets and liabilities utilizing Level 2 inputs: (i)certain inventories held in our securities owned and securities sold, not yet purchased portfolio and (ii) securities in ouravailable for sale portfolio. These financial instruments are valued by quoted prices that are less frequent than those in activemarkets or by models that use various assumptions that are derived from or supported by data that is generally observable in themarketplace. Valuations in this category are inherently less reliable than quoted market prices due to the degree of subjectivityinvolved in determining appropriate methodologies and the applicable observable market underlying assumptions.
• Level 3 — Unobservable inputs that are supported by little or no market activity and that are significant to the fair value of theassets and liabilities. We value the following assets and liabilities utilizing Level 3 inputs: (i) certain inventories held in oursecurities owned portfolio and (ii) the stock purchase warrants issued to Hilltop and Oak Hill. These financial instruments havesignificant inputs that cannot be validated by readily determinable market data and generally involve considerable judgment bymanagement. Our Level 3 assets represented 4% of our total assets measured at fair value at June 29, 2012 and 97% of ourLevel 3 assets consisted of one auction rate security bond. Our Level 3 liabilities represented 28% of our total liabilitiesmeasured at fair value at June 29, 2012. All of our Level 3 liabilities consist of the stock purchase warrants issued to Hilltopand Oak Hill.
The availability of observable inputs can vary for different assets. Fair value is a market-based measure; therefore, when marketobservable inputs are not available, our judgment is applied to reflect those judgments that we believe a market participant would use invaluing the same asset or liability. We use prices and inputs that are current as of the measurement date even in periods of marketdisruption or illiquidity. Greater judgment in valuation is required when inputs are less observable or unobservable in the marketplace andjudgment must be applied in determining the appropriateness of available prices, particularly in assessing whether available data reflectscurrent prices and/or reflects the results of recent market transactions. The valuation of financial instruments classified in Level 3 of thefair value hierarchy involves the greatest amount of management judgment.
Valuation Process for Financial Instruments. Financial instruments are valued at quoted market prices, if available. Forfinancial instruments that do not have readily determinable fair values through quoted market prices, the determination of fair value isbased upon consideration of available information including current financial information, fair values of underlying financial instrumentsand quotations for similar instruments. Certain financial instruments have bid and ask prices that can be observed in the marketplace. Forfinancial instruments whose inputs are based on bid-ask prices, mid-market pricing is applied and adjusted to the point within the bid-askrange that meets our best estimate of fair value.
The valuation process for financial instruments may include the use of valuation models and other techniques. Managementmakes adjustments to valuations derived from valuation models based on a number of factors, including but not limited to, the size of theposition in the financial instrument in a an inactive market, the features of the financial instrument such as its complexity, the market inwhich the financial instrument is traded or if a financial instrument is subject to sales restrictions that would result in a price less than thequoted market price. Adjustments from the price derived from a valuation model reflect management’s judgment that other participants inthe market for the financial instrument would consider the same factors in valuing the financial instrument.
Management makes assumptions about risk, uncertainties and market conditions in preparing adjustments to prices derivedfrom a valuation model. Results from valuation models and valuation techniques in one period may not be indicative of future period fairvalue measurements.
Certain financial instruments and other assets trade infrequently and therefore have outdated market prices. As a result, we mayuse alternative valuation models as methods for determining fair value of these assets. When using alternative valuation techniques orvaluation models, the following techniques are applied to different financial instrument classes:
• Municipal auction rate securities are valued using an internal methodology based on projected cash flows discounted for lack ofliquidity for the securities taking into consideration the quality of the underlying loans, any related secondary market activityand expectations regarding future interest rate movements; and
60
• Non-agency mortgage-backed and other asset-backed securities are valued by benchmarking to yields from market prices forcomparable securities and calibrated based on expected cash flow characteristics of the underlying assets.
The following is a description of the valuation methodologies used for instruments measured at fair value on a recurring basisand recognized in the accompanying statement of financial condition, as well as the general classification of such instruments pursuant tothe valuation hierarchy.
Assets Segregated for Regulatory Purposes. Because quoted market prices are available in an active market, these securitiesare classified within Level 1 of the valuation hierarchy. These securities include government guaranteed bonds purchased underthe TLGP.
Securities Available for Sale. Because quoted market prices are available in an active market, our investment in USHS commonstock and our deferred compensation plan’s investment in Westwood common stock are classified within Level 1 of thevaluation hierarchy. Our investments in U.S. government and government agency obligations and municipal obligations held bythe Bank as available for sale are valued in a similar manner to our Level 2 securities owned and securities sold, not yetpurchased portfolio, noted below.
Securities Owned and Securities Sold, Not Yet Purchased Portfolio. Securities classified as Level 1 securities primarily consistof financial instruments whose value is based on quoted market prices such as corporate equity securities and U.S. governmentand government agency obligations, primarily U.S. treasury securities.
Securities classified as Level 2 securities include financial instruments that are valued using models or other valuationmethodologies. These models are primarily industry standard models that consider various assumptions, including time value,yield curve, volatility factors, current market and contractual prices for the underlying financial instruments, as well as otherrelevant economic measures. Substantially all of these assumptions are observable in the marketplace, can be derived fromobservable data or are supported by observable levels at which transactions are executed in the marketplace. Securities in thiscategory include corporate obligations, U.S. government and government agency obligations and municipal obligations.
Securities classified as Level 3 securities are securities whose fair value is estimated based on internally developed models ormethodologies, including discounted cash flow, utilizing significant inputs that are generally less readily observable. Themodels and methodologies considered the quality of the underlying loans, any related secondary market activity andexpectations regarding future interest rate movements. Included in this category are certain corporate equity securities andmunicipal auction rate securities.
At June 29, 2012, certain corporate equity securities, valued at $0.7 million, were categorized as Level 3 as these securitieswere valued based on an inactive market for which there were no observable inputs. These positions were not material to ourtotal portfolio. At June 29, 2012, we had one auction rate bond position categorized as a Level 3 security for which there wasnot an active trading market. This position was valued at 95.7% of par, which management believes is representative of theprice market participants would pay. Management believes that a valuation of this position is indicative of fair market value dueto auction failures and the current lack of liquidity in this investment. Also, our internal discounted cash flow and third-partyvaluations supported a valuation at 95.7% of par. At June 29, 2012, this position had a calculated rate of return of 1% perannum. Based on discussions with the issuer of the bonds, it is our understanding that the entity plans to refinance its debt onceinterest rates rise. However, there can be no certainty that this refinancing will occur. As such, we expect to receive full valueon these bonds.
Stock purchase warrants. The stock purchase warrants held by Hilltop and Oak Hill are valued quarterly using a binomialmodel. The model considers the following variables: price and volatility of our common stock, treasury yield, annual dividend,and the remaining life of the warrants. The derived volatility estimate considers both the historical and implied forwardvolatility of our common stock. All else being equal, the warrants will lose time value as they near maturity. Other thanremaining life, the primary drivers of value are the price and volatility of our common stock. As the volatility and/or stock priceincrease, the value of the warrants increase as well. The movement of these two variables will amplify or offset one anotherdepending on the direction and velocity of their movements. These securities are classified as Level 3.
We had unrealized gains of $15.8 million and unrealized losses of $19.4 million for these stock purchase warrants in fiscal2012.
61
Contingencies
Accounting for contingencies requires the use of judgment and estimates in assessing the magnitude of the exposure and thelikely outcome of the situation. In many cases, the outcome will be determined by third parties, which may include governmental orjudicial bodies. The provisions made in our consolidated financial statements, as well as the related disclosures, represent management’sbest estimates of the current status of such matters and their potential outcome based on a review of the facts and, when warranted, inconsultation with outside legal counsel. Management evaluates and revises its estimates on a quarterly basis. Adverse legal or arbitrationjudgments, inability to collect receivables, sudden declines in the fair value of securities held in margin accounts or other actions couldresult in material changes to the estimates recorded in these financial statements. Resolution of these matters in amounts different fromwhat has been accrued in the consolidated financial statements could materially impact our financial position and results of operations.
Long-Lived Assets and Goodwill
Our long-lived assets are subject to impairment testing if specific events warrant the review. We test goodwill for impairment atleast annually. The impairment test is based on determining the fair value of the specified reporting units. Judgment is required inassessing the effects of external factors, including market conditions, and projecting future operating results. These judgments andassumptions could materially change the value of the specified reporting units and, therefore, could materially impact our consolidatedfinancial statements. If actual external conditions and future operating results differ from management’s judgments, impairment chargesmay be necessary to reduce the carrying value of these assets to the appropriate fair value. See additional discussion in Note 1(m) in theNotes to the Consolidated Financial Statements for the fiscal years ended June 29, 2012, June 24, 2011 and June 25, 2010 included underItem 8. “Financial Statements and Supplementary Data”
Allowance for Probable Loan Losses
We provide an allowance for probable loan losses. The allowance for loan losses is established as losses are estimated to haveoccurred through a provision for loan losses charged to earnings. Loan losses are charged against the allowance when managementbelieves the uncollectability of a loan balance is confirmed. Subsequent recoveries, if any, are credited to the allowance. Should actuallosses differ from management’s estimates, our consolidated financial statements could be materially impacted.
The allowance for loan losses is evaluated on a regular basis by management and is based upon management’s periodic reviewof the collectability of the loans in light of historical experience, the nature and volume of the loan portfolio, adverse situations that mayaffect the borrower’s ability to repay, estimated value of any underlying collateral and prevailing economic conditions. This evaluation isinherently subjective, as it requires estimates that are susceptible to significant revision as more information becomes available.
The allowance consists of specific and general components. The specific component relates to loans that are classified asdoubtful, substandard or special mention. For such loans that are also classified as impaired, an allowance is established when thecollateral value (or discounted cash flows or observable market price) of the impaired loan is lower than the carrying value of that loan.The general component covers all loans and is based on historical loss experience adjusted for qualitative factors. These factors includethe following: concentrations of risk in the portfolio, estimated changes in the value of underlying collateral, credit quality of the portfolioand changes in the volume and growth in the portfolio.
Impaired loans are accounted for at the fair value of the collateral if the loan is collateral dependent, the net present value ofexpected future cash flows discounted at the loan’s effective interest rate or at the observable market price of the loan.
A loan is considered impaired when, based on current information and events, it is probable that the Bank will be unable tocollect the scheduled payments of principal or interest when due according to the contractual terms of the loan agreement. Factorsconsidered by management in determining impairment include payment status, collateral value, and the probability of collectingscheduled principal and interest payments when due. Loans that experience insignificant payment delays and payment shortfalls generallyare not classified as impaired. Management determines the significance of payment delays and payment shortfalls on a case-by-case basis,taking into consideration all of the circumstances surrounding the loan and the borrower, including the length of the delay, the reasons forthe delay, the borrower’s prior payment record, and the amount of the shortfall in relation to the principal and interest owed.
Income Tax Accrual and Allowance for Deferred Tax Assets
We operate in multiple taxing jurisdictions, and as a result, accruals for tax contingencies require us to make estimates andjudgments with respect to the ultimate tax liability in any given fiscal year. Actual results could vary from these estimates. Changes in taxlaws, new tax rulings, or results of tax audits could cause management’s estimates to change. In our opinion, adequate provisions forincome taxes have been made for all fiscal years.
62
We have certain deferred tax assets that are derived from capital losses. Our ability to use these deferred tax assets depends onus having sufficient capital gain income within the carryback and carryforward period available under the tax law. At June 29, 2012, ourdeferred tax assets included $872,000 related to capital losses from our investments in certain partnership assets. We have established an$872,000 valuation allowance against this deferred tax asset because we did not believe it was more likely than not that sufficient capitalgain income would be generated to offset these capital losses.
RECENT ACCOUNTING PRONOUNCEMENTS
See Note 1(z) in the Notes to the Consolidated Financial Statements for the fiscal years ended June 29, 2012, June 24, 2011and June 25, 2010 included under Item 8. “Financial Statements and Supplementary Data” for information regarding the effect of newaccounting pronouncements on our consolidated financial statements.
ITEM 7A. QUANTITATIVE AND QUALITATIVE DISCLOSURES ABOUT MARKET RISK
The information required by this item is incorporated herein by reference to Item 7. “Management’s Discussion and Analysis ofFinancial Condition and Results of Operations-Market Risk.”
ITEM 8. FINANCIAL STATEMENTS AND SUPPLEMENTARY DATA
The company’s consolidated financial statements and supplementary data are included in pages F-2 through F-48 of this AnnualReport on Form 10-K. See accompanying Item 15. “Exhibits and Financial Statement Schedules” and “Index to the Financial Statements”on page F-1.
UNAUDITED QUARTERLY FINANCIAL INFORMATION (In thousands, except per share amounts)
2012 1st Qtr. 2nd Qtr. 3rd Qtr. 4th Qtr.
Revenues $ 92,597 $ 83,496 $ 91,557 $ 86,091Net income (loss) 1,652 (14,340) 8,262 (303)Comprehensive income (loss) 1,574 (13,734) 8,952 459Earnings (loss) per share – basic
Net income (loss) $ 0.05 $ (0.44) $ 0.25 $ (0.01)Earnings (loss) per share – diluted
Net income (loss) $ 0.05 $ (0.44) $ 0.04 $ (0.01)Cash dividend declared per common share $ 0.00 $ 0.00 $ 0.00 $ 0.00Stock price range
High $ 6.31 $ 7.56 $ 7.77 $ 5.94 Low $ 3.67 $ 4.03 $ 4.79 $ 5.08
2011
Revenues $ 109,350 $ 102,233 $ 89,493 $ 88,743Net income (loss) (20,748) (330) (2,147) 22Comprehensive income (loss) (20,814) 179 (2,257) 150Earnings (loss) per share – basic
Net income (loss) $ (0.64) $ (0.01) $ (0.07) $ 0.00Earnings (loss) per share – diluted
Net income (loss) $ (0.64) $ (0.01) $ (0.07) $ 0.00Cash dividend declared per common share $ 0.09 $ 0.01 $ 0.01 $ 0.01Stock price range
High $ 10.22 $ 7.57 $ 6.49 $ 6.76 Low $ 6.71 $ 3.91 $ 4.27 $ 5.59
63
ITEM 9. CHANGES IN AND DISAGREEMENTS WITH ACCOUNTANTSON ACCOUNTING AND FINANCIAL DISCLOSURE
None.
ITEM 9A. CONTROLS AND PROCEDURES
Evaluation of Disclosure Controls and Procedures.
Our management, including the principal executive officer and principal financial officer, has evaluated the effectiveness of thedesign and operation of our disclosure controls and procedures (as defined in Rule 13a-15(e) under the Exchange Act) as of June 29,2012. Based on such evaluation, our management, including the principal executive officer and principal financial officer has concludedthat as of June 29, 2012, our disclosure controls and procedures were effective for the purpose of ensuring that information required to bedisclosed by us in the reports that we file or submit under the Exchange Act is recorded, processed, summarized and reported, within theperiods specified in the SEC’s rules and forms.
Changes in Internal Control Over Financial Reporting.
There have not been any changes in our internal control over financial reporting (as defined in Rule 13a-15(f) under theExchange Act) during the quarter ended June 29, 2012 that have materially affected or are reasonably likely to materially affect ourinternal control over financial reporting.
Management’s Report on Internal Control Over Financial Reporting.
Our management is responsible for establishing and maintaining adequate internal control over financial reporting as defined byRules 13a-15(f) and 15d-15(f) under the Exchange Act. Our internal control over financial reporting is designed to provide reasonableassurance regarding the reliability of financial reporting and the preparation of financial statements for external purposes in accordancewith GAAP. Because of its inherent limitations, internal control over financial reporting may not prevent or detect misstatements. Also,projections of any evaluation of effectiveness to future periods are subject to the risk that controls may become inadequate because ofchanges in conditions, or that the degree of compliance with the policies or procedures may deteriorate.
Our management assessed the effectiveness of our internal control over financial reporting as of June 29, 2012. In making thisassessment, we used the criteria set forth by the Committee of Sponsoring Organization of the Treadway Commission (COSO) in InternalControl-Integrated Framework. Based on our assessment and those criteria, our management concluded that we have maintained effectiveinternal control over financial reporting as of June 29, 2012.
Our independent registered public accounting firm has audited the effectiveness of our internal control over financial reportingas of June 29, 2012 as stated in their report, dated September 7, 2012, which appears herein.
Inherent limitation of the effectiveness of internal control.
A control system, no matter how well conceived, implemented and operated, can provide only reasonable, not absolute,assurance that the objectives of the internal control system are met. Because of such inherent limitations, no evaluation of controls canprovide absolute assurance that all control issues, if any, within a company have been detected.
64
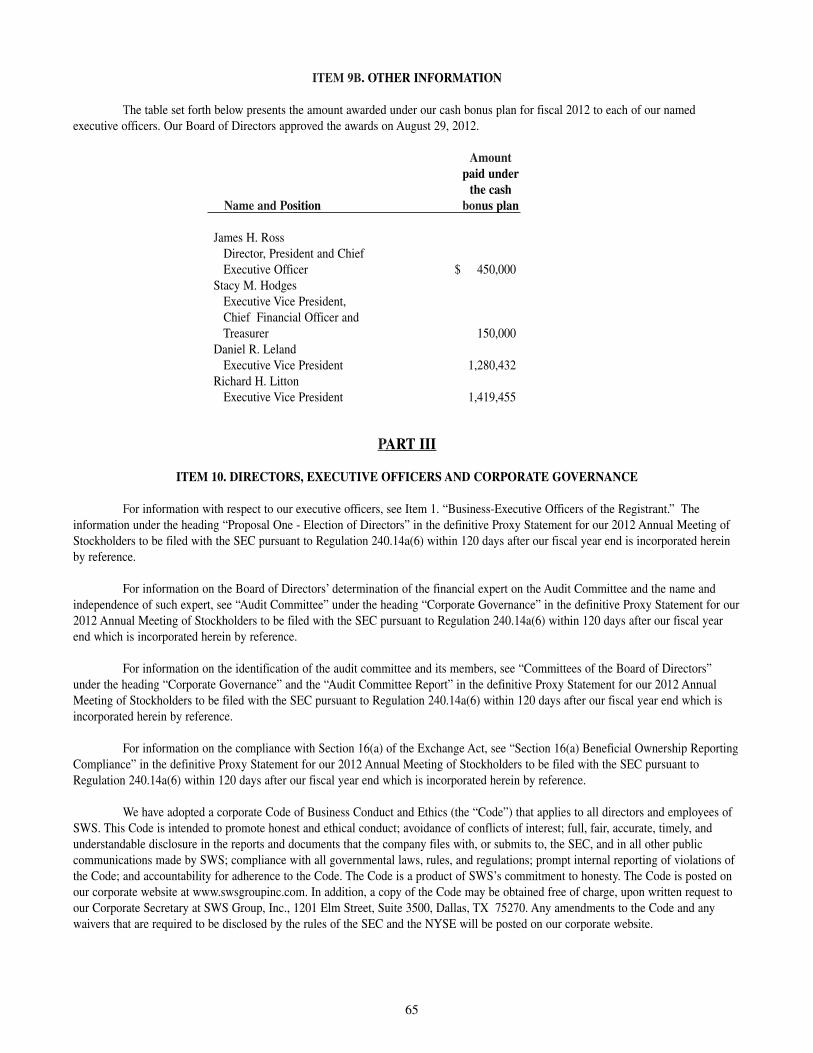
ITEM 9B. OTHER INFORMATION
The table set forth below presents the amount awarded under our cash bonus plan for fiscal 2012 to each of our namedexecutive officers. Our Board of Directors approved the awards on August 29, 2012.
Amountpaid under
the cashName and Position bonus plan
James H. Ross Director, President and Chief Executive Officer $ 450,000
Stacy M. HodgesExecutive Vice President,Chief Financial Officer andTreasurer 150,000
Daniel R. LelandExecutive Vice President 1,280,432
Richard H. Litton Executive Vice President 1,419,455
PART III
ITEM 10. DIRECTORS, EXECUTIVE OFFICERS AND CORPORATE GOVERNANCE
For information with respect to our executive officers, see Item 1. “Business-Executive Officers of the Registrant.” Theinformation under the heading “Proposal One - Election of Directors” in the definitive Proxy Statement for our 2012 Annual Meeting ofStockholders to be filed with the SEC pursuant to Regulation 240.14a(6) within 120 days after our fiscal year end is incorporated hereinby reference.
For information on the Board of Directors’ determination of the financial expert on the Audit Committee and the name andindependence of such expert, see “Audit Committee” under the heading “Corporate Governance” in the definitive Proxy Statement for our2012 Annual Meeting of Stockholders to be filed with the SEC pursuant to Regulation 240.14a(6) within 120 days after our fiscal yearend which is incorporated herein by reference.
For information on the identification of the audit committee and its members, see “Committees of the Board of Directors”under the heading “Corporate Governance” and the “Audit Committee Report” in the definitive Proxy Statement for our 2012 AnnualMeeting of Stockholders to be filed with the SEC pursuant to Regulation 240.14a(6) within 120 days after our fiscal year end which isincorporated herein by reference.
For information on the compliance with Section 16(a) of the Exchange Act, see “Section 16(a) Beneficial Ownership ReportingCompliance” in the definitive Proxy Statement for our 2012 Annual Meeting of Stockholders to be filed with the SEC pursuant toRegulation 240.14a(6) within 120 days after our fiscal year end which is incorporated herein by reference.
We have adopted a corporate Code of Business Conduct and Ethics (the “Code”) that applies to all directors and employees ofSWS. This Code is intended to promote honest and ethical conduct; avoidance of conflicts of interest; full, fair, accurate, timely, andunderstandable disclosure in the reports and documents that the company files with, or submits to, the SEC, and in all other publiccommunications made by SWS; compliance with all governmental laws, rules, and regulations; prompt internal reporting of violations ofthe Code; and accountability for adherence to the Code. The Code is a product of SWS’s commitment to honesty. The Code is posted onour corporate website at www.swsgroupinc.com. In addition, a copy of the Code may be obtained free of charge, upon written request toour Corporate Secretary at SWS Group, Inc., 1201 Elm Street, Suite 3500, Dallas, TX 75270. Any amendments to the Code and anywaivers that are required to be disclosed by the rules of the SEC and the NYSE will be posted on our corporate website.
65

ITEM 11. EXECUTIVE COMPENSATION
The information under the heading “Executive Compensation” in the definitive Proxy Statement for our 2012 Annual Meetingof Stockholders to be filed with the SEC pursuant to Regulation 240.14a(6) within 120 days after our fiscal year end is incorporatedherein by reference.
ITEM 12. SECURITY OWNERSHIP OF CERTAIN BENEFICIAL OWNERS AND MANAGEMENTAND RELATED STOCKHOLDER MATTERS
The information under the heading “Stock Ownership of Principal Stockholders and Management” in the definitive ProxyStatement for our 2012 Annual Meeting of Stockholders to be filed with the SEC pursuant to Regulation 240.14a(6) within 120 days afterour fiscal year end is incorporated herein by reference.
ITEM 13. CERTAIN RELATIONSHIPS AND RELATED TRANSACTIONS, AND DIRECTOR INDEPENDENCE
The information under the heading “Certain Relationships and Related Transactions” and “Director Independence” in thedefinitive Proxy Statement for our 2012 Annual Meeting of Stockholders to be filed with the SEC pursuant to Regulation 240.14a(6)within 120 days after our fiscal year end is incorporated herein by reference.
ITEM 14. PRINCIPAL ACCOUNTANT FEES AND SERVICES
The information under the subheadings “Fees Paid to Independent Registered Public Accounting Firm” and “Pre-approval ofIndependent Accounting Services” under the heading “Independent Registered Public Accounting Firm” in the definitive Proxy Statementfor our 2012 Annual Meeting of Stockholders to be filed with the SEC pursuant to Regulation 240.14a(6) within 120 days after our fiscalyear end is incorporated herein by reference.
66
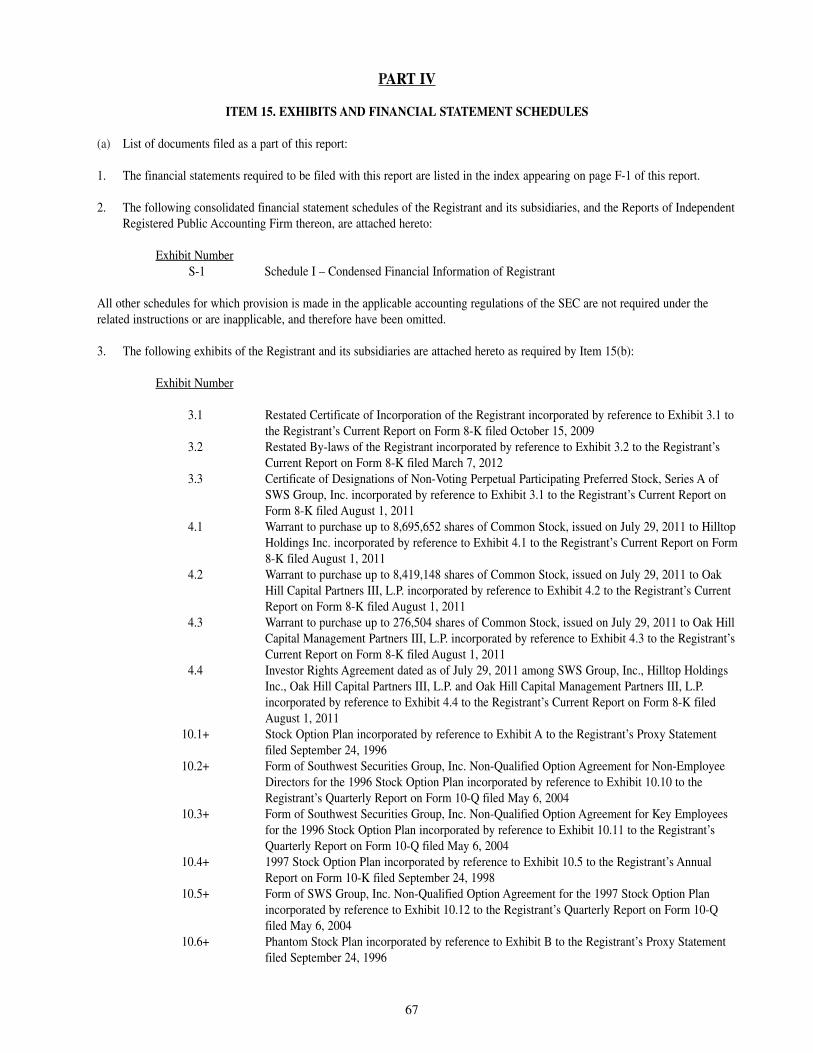
PART IV
ITEM 15. EXHIBITS AND FINANCIAL STATEMENT SCHEDULES
(a) List of documents filed as a part of this report:
1. The financial statements required to be filed with this report are listed in the index appearing on page F-1 of this report.
2. The following consolidated financial statement schedules of the Registrant and its subsidiaries, and the Reports of IndependentRegistered Public Accounting Firm thereon, are attached hereto:
Exhibit NumberS-1 Schedule I – Condensed Financial Information of Registrant
All other schedules for which provision is made in the applicable accounting regulations of the SEC are not required under therelated instructions or are inapplicable, and therefore have been omitted.
3. The following exhibits of the Registrant and its subsidiaries are attached hereto as required by Item 15(b):
Exhibit Number
3.1 Restated Certificate of Incorporation of the Registrant incorporated by reference to Exhibit 3.1 tothe Registrant’s Current Report on Form 8-K filed October 15, 2009
3.2 Restated By-laws of the Registrant incorporated by reference to Exhibit 3.2 to the Registrant’sCurrent Report on Form 8-K filed March 7, 2012
3.3 Certificate of Designations of Non-Voting Perpetual Participating Preferred Stock, Series A ofSWS Group, Inc. incorporated by reference to Exhibit 3.1 to the Registrant’s Current Report onForm 8-K filed August 1, 2011
4.1 Warrant to purchase up to 8,695,652 shares of Common Stock, issued on July 29, 2011 to HilltopHoldings Inc. incorporated by reference to Exhibit 4.1 to the Registrant’s Current Report on Form8-K filed August 1, 2011
4.2 Warrant to purchase up to 8,419,148 shares of Common Stock, issued on July 29, 2011 to OakHill Capital Partners III, L.P. incorporated by reference to Exhibit 4.2 to the Registrant’s CurrentReport on Form 8-K filed August 1, 2011
4.3 Warrant to purchase up to 276,504 shares of Common Stock, issued on July 29, 2011 to Oak HillCapital Management Partners III, L.P. incorporated by reference to Exhibit 4.3 to the Registrant’sCurrent Report on Form 8-K filed August 1, 2011
4.4 Investor Rights Agreement dated as of July 29, 2011 among SWS Group, Inc., Hilltop HoldingsInc., Oak Hill Capital Partners III, L.P. and Oak Hill Capital Management Partners III, L.P.incorporated by reference to Exhibit 4.4 to the Registrant’s Current Report on Form 8-K filedAugust 1, 2011
10.1+ Stock Option Plan incorporated by reference to Exhibit A to the Registrant’s Proxy Statementfiled September 24, 1996
10.2+ Form of Southwest Securities Group, Inc. Non-Qualified Option Agreement for Non-EmployeeDirectors for the 1996 Stock Option Plan incorporated by reference to Exhibit 10.10 to theRegistrant’s Quarterly Report on Form 10-Q filed May 6, 2004
10.3+ Form of Southwest Securities Group, Inc. Non-Qualified Option Agreement for Key Employeesfor the 1996 Stock Option Plan incorporated by reference to Exhibit 10.11 to the Registrant’sQuarterly Report on Form 10-Q filed May 6, 2004
10.4+ 1997 Stock Option Plan incorporated by reference to Exhibit 10.5 to the Registrant’s AnnualReport on Form 10-K filed September 24, 1998
10.5+ Form of SWS Group, Inc. Non-Qualified Option Agreement for the 1997 Stock Option Planincorporated by reference to Exhibit 10.12 to the Registrant’s Quarterly Report on Form 10-Qfiled May 6, 2004
10.6+ Phantom Stock Plan incorporated by reference to Exhibit B to the Registrant’s Proxy Statementfiled September 24, 1996
67
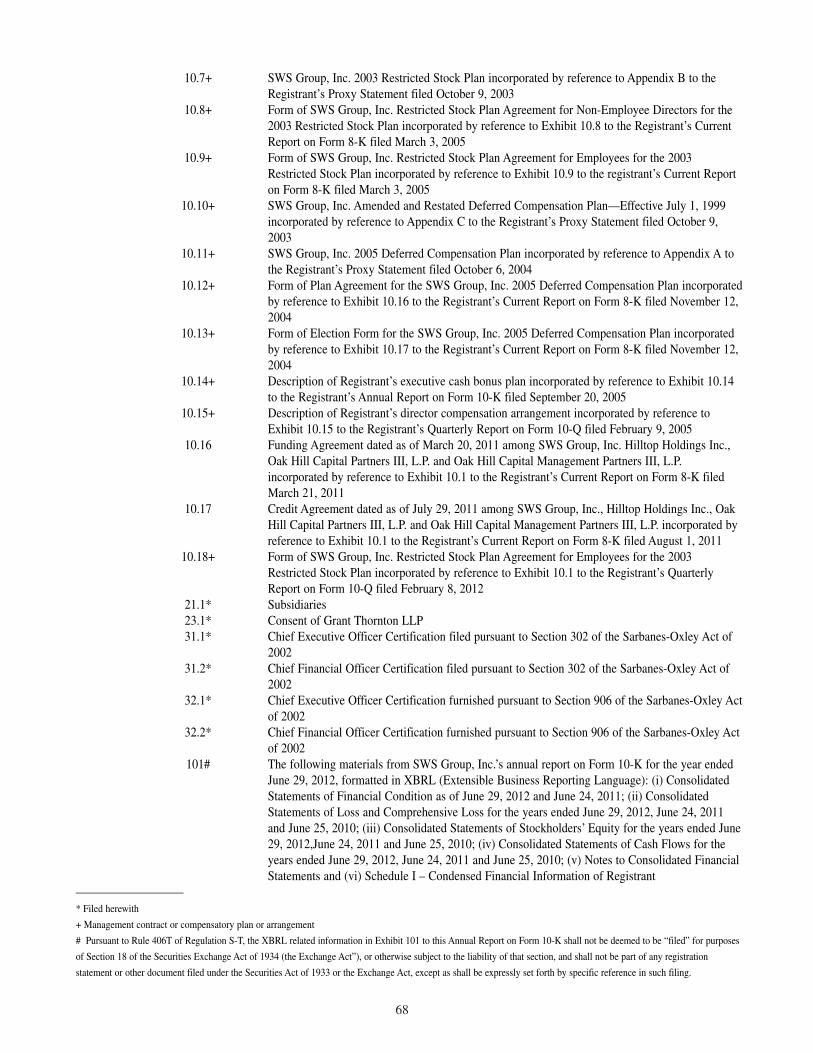
68
10.7+ SWS Group, Inc. 2003 Restricted Stock Plan incorporated by reference to Appendix B to theRegistrant’s Proxy Statement filed October 9, 2003
10.8+ Form of SWS Group, Inc. Restricted Stock Plan Agreement for Non-Employee Directors for the2003 Restricted Stock Plan incorporated by reference to Exhibit 10.8 to the Registrant’s CurrentReport on Form 8-K filed March 3, 2005
10.9+ Form of SWS Group, Inc. Restricted Stock Plan Agreement for Employees for the 2003Restricted Stock Plan incorporated by reference to Exhibit 10.9 to the registrant’s Current Reporton Form 8-K filed March 3, 2005
10.10+ SWS Group, Inc. Amended and Restated Deferred Compensation Plan—Effective July 1, 1999incorporated by reference to Appendix C to the Registrant’s Proxy Statement filed October 9,2003
10.11+ SWS Group, Inc. 2005 Deferred Compensation Plan incorporated by reference to Appendix A tothe Registrant’s Proxy Statement filed October 6, 2004
10.12+ Form of Plan Agreement for the SWS Group, Inc. 2005 Deferred Compensation Plan incorporatedby reference to Exhibit 10.16 to the Registrant’s Current Report on Form 8-K filed November 12,2004
10.13+ Form of Election Form for the SWS Group, Inc. 2005 Deferred Compensation Plan incorporatedby reference to Exhibit 10.17 to the Registrant’s Current Report on Form 8-K filed November 12,2004
10.14+ Description of Registrant’s executive cash bonus plan incorporated by reference to Exhibit 10.14to the Registrant’s Annual Report on Form 10-K filed September 20, 2005
10.15+ Description of Registrant’s director compensation arrangement incorporated by reference toExhibit 10.15 to the Registrant’s Quarterly Report on Form 10-Q filed February 9, 2005
10.16 Funding Agreement dated as of March 20, 2011 among SWS Group, Inc. Hilltop Holdings Inc.,Oak Hill Capital Partners III, L.P. and Oak Hill Capital Management Partners III, L.P.incorporated by reference to Exhibit 10.1 to the Registrant’s Current Report on Form 8-K filedMarch 21, 2011
10.17 Credit Agreement dated as of July 29, 2011 among SWS Group, Inc., Hilltop Holdings Inc., OakHill Capital Partners III, L.P. and Oak Hill Capital Management Partners III, L.P. incorporated byreference to Exhibit 10.1 to the Registrant’s Current Report on Form 8-K filed August 1, 2011
10.18+ Form of SWS Group, Inc. Restricted Stock Plan Agreement for Employees for the 2003Restricted Stock Plan incorporated by reference to Exhibit 10.1 to the Registrant’s QuarterlyReport on Form 10-Q filed February 8, 2012
21.1* Subsidiaries23.1* Consent of Grant Thornton LLP31.1* Chief Executive Officer Certification filed pursuant to Section 302 of the Sarbanes-Oxley Act of
200231.2* Chief Financial Officer Certification filed pursuant to Section 302 of the Sarbanes-Oxley Act of
200232.1* Chief Executive Officer Certification furnished pursuant to Section 906 of the Sarbanes-Oxley Act
of 200232.2* Chief Financial Officer Certification furnished pursuant to Section 906 of the Sarbanes-Oxley Act
of 2002101# The following materials from SWS Group, Inc.’s annual report on Form 10-K for the year ended
June 29, 2012, formatted in XBRL (Extensible Business Reporting Language): (i) ConsolidatedStatements of Financial Condition as of June 29, 2012 and June 24, 2011; (ii) ConsolidatedStatements of Loss and Comprehensive Loss for the years ended June 29, 2012, June 24, 2011and June 25, 2010; (iii) Consolidated Statements of Stockholders’ Equity for the years ended June29, 2012,June 24, 2011 and June 25, 2010; (iv) Consolidated Statements of Cash Flows for theyears ended June 29, 2012, June 24, 2011 and June 25, 2010; (v) Notes to Consolidated FinancialStatements and (vi) Schedule I – Condensed Financial Information of Registrant
—————————* Filed herewith
+ Management contract or compensatory plan or arrangement
# Pursuant to Rule 406T of Regulation S-T, the XBRL related information in Exhibit 101 to this Annual Report on Form 10-K shall not be deemed to be “filed” for purposes
of Section 18 of the Securities Exchange Act of 1934 (the Exchange Act”), or otherwise subject to the liability of that section, and shall not be part of any registration
statement or other document filed under the Securities Act of 1933 or the Exchange Act, except as shall be expressly set forth by specific reference in such filing.
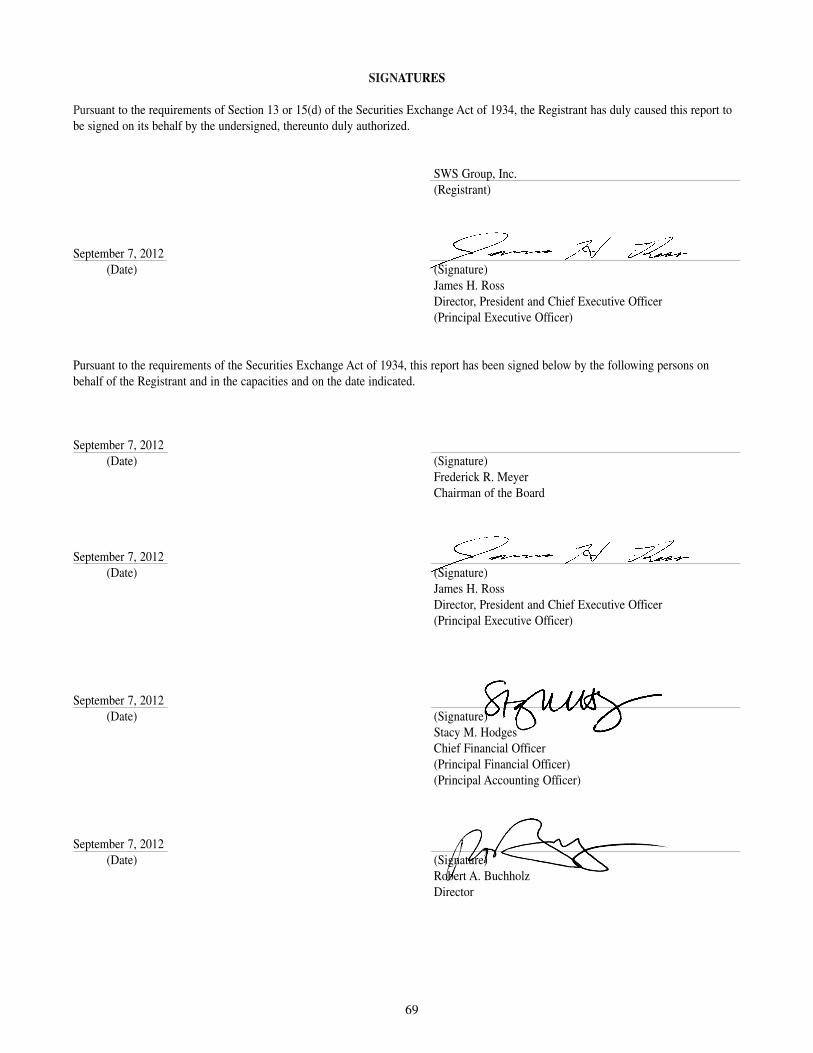
SIGNATURES
Pursuant to the requirements of Section 13 or 15(d) of the Securities Exchange Act of 1934, the Registrant has duly caused this report tobe signed on its behalf by the undersigned, thereunto duly authorized.
SWS Group, Inc.(Registrant)
September 7, 2012(Date) (Signature)
James H. RossDirector, President and Chief Executive Officer(Principal Executive Officer)
Pursuant to the requirements of the Securities Exchange Act of 1934, this report has been signed below by the following persons onbehalf of the Registrant and in the capacities and on the date indicated.
September 7, 2012(Date) (Signature)
Frederick R. MeyerChairman of the Board
September 7, 2012(Date) (Signature)
James H. RossDirector, President and Chief Executive Officer(Principal Executive Officer)
September 7, 2012(Date) (Signature)
Stacy M. HodgesChief Financial Officer(Principal Financial Officer)(Principal Accounting Officer)
September 7, 2012(Date) (Signature)
Robert A. BuchholzDirector
69

70
September 7, 2012(Date) (Signature)
Brodie L. CobbDirector
September 7, 2012(Date) (Signature)
J. Taylor CrandallDirector
September 7, 2012(Date) (Signature)
Christie S. FlanaganDirector
September 7, 2012(Date) (Signature)
Gerald J. FordDirector
September 7, 2012 _(Date) (Signature)
Larry A. JobeDirector
September 7, 2012 _(Date) (Signature)
Tyree B. MillerDirector
September 7, 2012(Date) (Signature)
Mike Moses, Ed.D.Director
September 7, 2012(Date) (Signature)
Joel T. Williams IIIDirector
SWS GROUP, INC. AND SUBSIDIARIESINDEX TO FINANCIAL STATEMENTS
FINANCIAL STATEMENTS PAGE(S)
Consolidated Statements of Financial Conditionas of June 29, 2012 and June 24, 2011 F-2
Consolidated Statements of Loss and Comprehensive Lossfor the years ended June 29, 2012, June 24, 2011 and June 25, 2010 F-3
Consolidated Statements of Stockholders’ Equity for the years ended June 29, 2012, June 24, 2011 and June 25, 2010 F-4
Consolidated Statements of Cash Flows for the years ended June 29, 2012, June 24, 2011 and June 25, 2010 F-5
Notes to Consolidated Financial Statements F-7
Report of Independent Registered Public Accounting Firm F-49
Report of Independent Registered Public Accounting Firm F-50
Schedule I – Condensed Financial Information of Registrant S-1
F-1
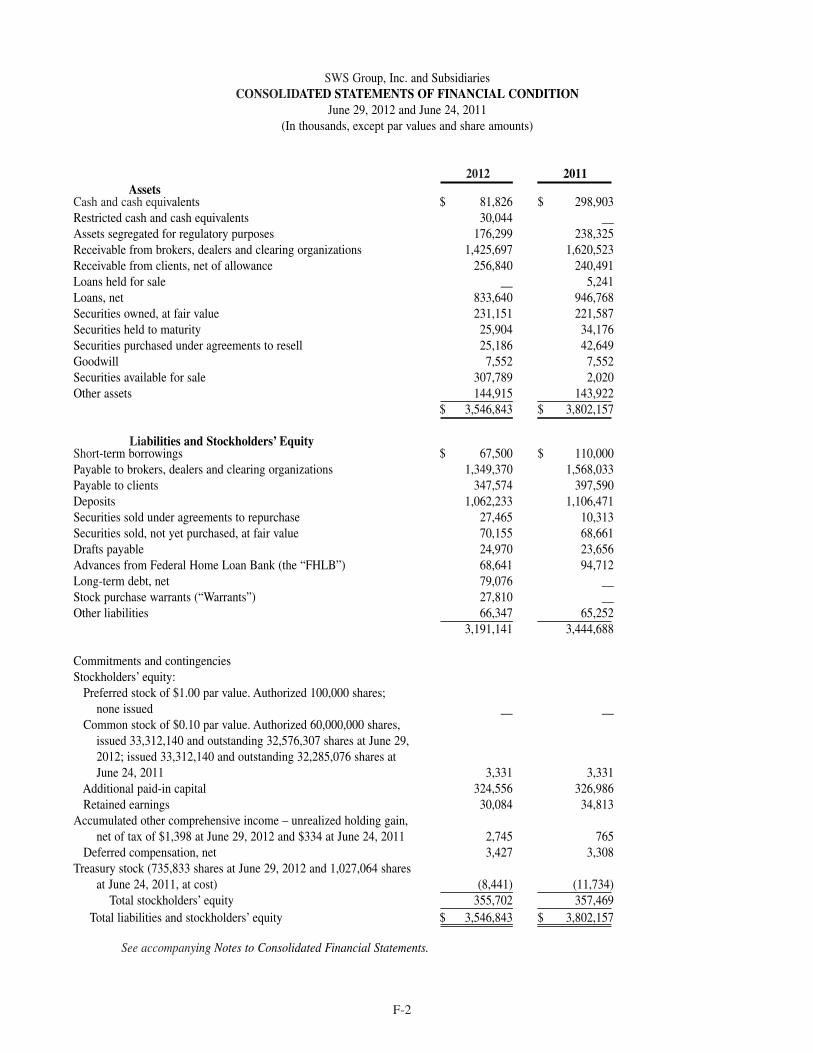
SWS Group, Inc. and SubsidiariesCONSOLIDATED STATEMENTS OF FINANCIAL CONDITION
June 29, 2012 and June 24, 2011(In thousands, except par values and share amounts)
2012 2011 Assets
Cash and cash equivalents $ 81,826 $ 298,903 Restricted cash and cash equivalents 30,044 __Assets segregated for regulatory purposes 176,299 238,325Receivable from brokers, dealers and clearing organizations 1,425,697 1,620,523Receivable from clients, net of allowance 256,840 240,491Loans held for sale __ 5,241Loans, net 833,640 946,768Securities owned, at fair value 231,151 221,587Securities held to maturity 25,904 34,176Securities purchased under agreements to resell 25,186 42,649Goodwill 7,552 7,552Securities available for sale 307,789 2,020Other assets 144,915 143,922
$ 3,546,843 $ 3,802,157
Liabilities and Stockholders’ EquityShort-term borrowings $ 67,500 $ 110,000Payable to brokers, dealers and clearing organizations 1,349,370 1,568,033 Payable to clients 347,574 397,590Deposits 1,062,233 1,106,471Securities sold under agreements to repurchase 27,465 10,313Securities sold, not yet purchased, at fair value 70,155 68,661Drafts payable 24,970 23,656Advances from Federal Home Loan Bank (the “FHLB”) 68,641 94,712Long-term debt, net 79,076 __Stock purchase warrants (“Warrants”) 27,810 __Other liabilities 66,347 65,252
3,191,141 3,444,688
Commitments and contingencies Stockholders’ equity:
Preferred stock of $1.00 par value. Authorized 100,000 shares;none issued __ __
Common stock of $0.10 par value. Authorized 60,000,000 shares,issued 33,312,140 and outstanding 32,576,307 shares at June 29,2012; issued 33,312,140 and outstanding 32,285,076 shares atJune 24, 2011 3,331 3,331
Additional paid-in capital 324,556 326,986Retained earnings 30,084 34,813
Accumulated other comprehensive income – unrealized holding gain,net of tax of $1,398 at June 29, 2012 and $334 at June 24, 2011 2,745 765
Deferred compensation, net 3,427 3,308Treasury stock (735,833 shares at June 29, 2012 and 1,027,064 shares
at June 24, 2011, at cost) (8,441) (11,734)Total stockholders’ equity 355,702 357,469
Total liabilities and stockholders’ equity $ 3,546,843 $ 3,802,157
See accompanying Notes to Consolidated Financial Statements.
F-2
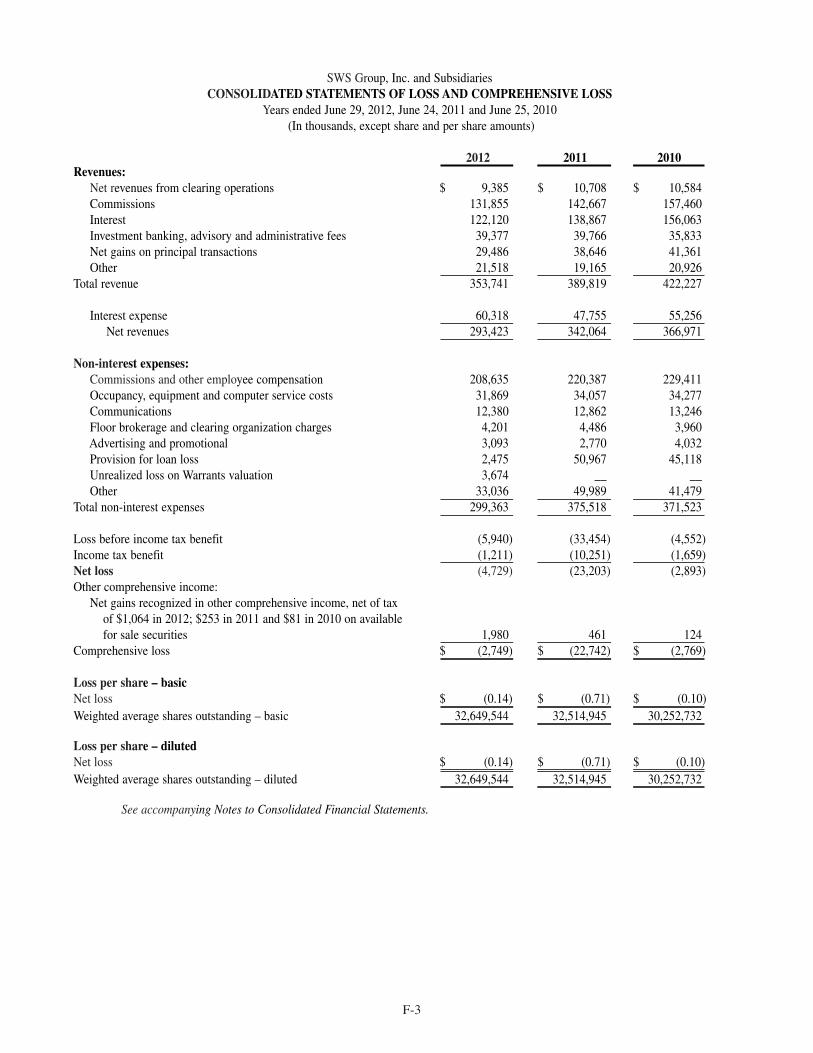
SWS Group, Inc. and SubsidiariesCONSOLIDATED STATEMENTS OF LOSS AND COMPREHENSIVE LOSS
Years ended June 29, 2012, June 24, 2011 and June 25, 2010(In thousands, except share and per share amounts)
2012 2011 2010Revenues:
Net revenues from clearing operations $ 9,385 $ 10,708 $ 10,584 Commissions 131,855 142,667 157,460Interest 122,120 138,867 156,063Investment banking, advisory and administrative fees 39,377 39,766 35,833Net gains on principal transactions 29,486 38,646 41,361Other 21,518 19,165 20,926
Total revenue 353,741 389,819 422,227
Interest expense 60,318 47,755 55,256Net revenues 293,423 342,064 366,971
Non-interest expenses:Commissions and other employee compensation 208,635 220,387 229,411Occupancy, equipment and computer service costs 31,869 34,057 34,277Communications 12,380 12,862 13,246Floor brokerage and clearing organization charges 4,201 4,486 3,960Advertising and promotional 3,093 2,770 4,032Provision for loan loss 2,475 50,967 45,118Unrealized loss on Warrants valuation 3,674 __ __Other 33,036 49,989 41,479
Total non-interest expenses 299,363 375,518 371,523
Loss before income tax benefit (5,940) (33,454) (4,552)Income tax benefit (1,211) (10,251) (1,659)Net loss (4,729) (23,203) (2,893)Other comprehensive income:
Net gains recognized in other comprehensive income, net of tax of $1,064 in 2012; $253 in 2011 and $81 in 2010 on available for sale securities 1,980 461 124
Comprehensive loss $ (2,749) $ (22,742) $ (2,769)
Loss per share – basicNet loss $ (0.14) $ (0.71) $ (0.10) Weighted average shares outstanding – basic 32,649,544 32,514,945 30,252,732
Loss per share – dilutedNet loss $ (0.14) $ (0.71) $ (0.10) Weighted average shares outstanding – diluted 32,649,544 32,514,945 30,252,732
See accompanying Notes to Consolidated Financial Statements.
F-3
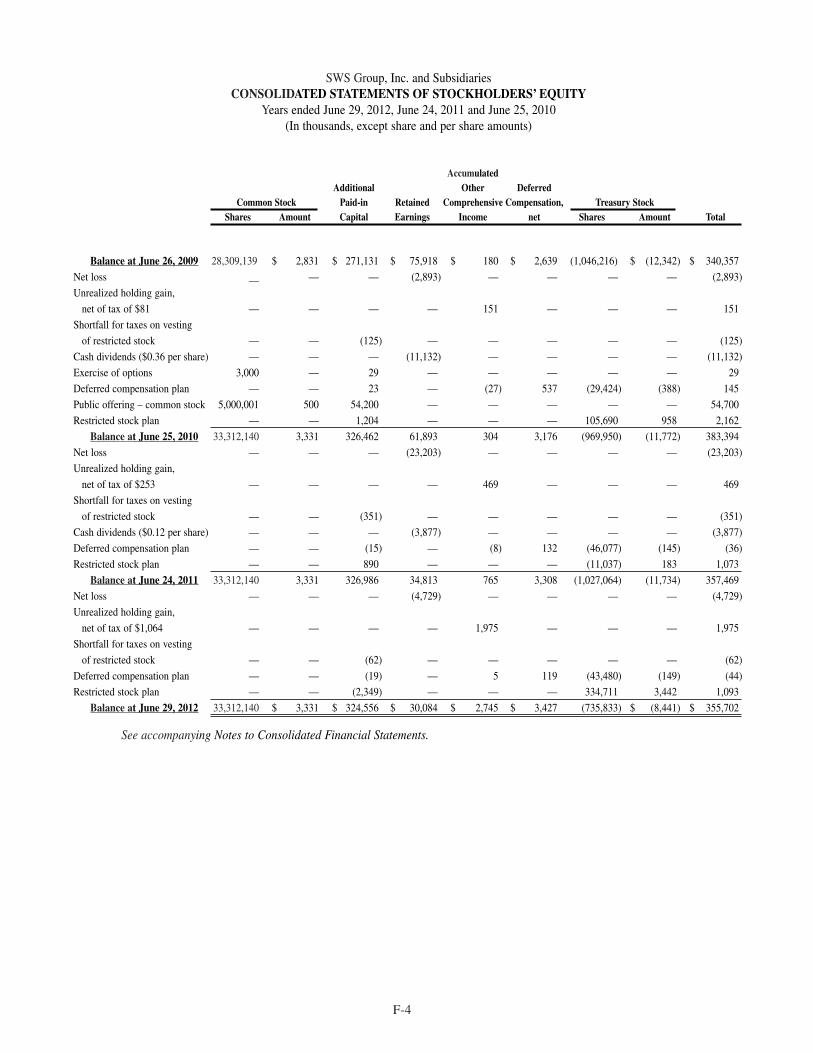
SWS Group, Inc. and SubsidiariesCONSOLIDATED STATEMENTS OF STOCKHOLDERS’ EQUITY
Years ended June 29, 2012, June 24, 2011 and June 25, 2010(In thousands, except share and per share amounts)
AccumulatedAdditional Other Deferred
Common Stock Paid-in Retained Comprehensive Compensation, Treasury Stock Shares Amount Capital Earnings Income net Shares Amount Total
Balance at June 26, 2009 28,309,139 $ 2,831 $ 271,131 $ 75,918 $ 180 $ 2,639 (1,046,216) $ (12,342) $ 340,357
Net loss __ — — (2,893) — — — — (2,893)
Unrealized holding gain,
net of tax of $81 — — — — 151 — — — 151
Shortfall for taxes on vesting
of restricted stock — — (125) — — — — — (125)
Cash dividends ($0.36 per share) — — — (11,132) — — — — (11,132)
Exercise of options 3,000 — 29 — — — — — 29
Deferred compensation plan — — 23 — (27) 537 (29,424) (388) 145
Public offering – common stock 5,000,001 500 54,200 — — — — — 54,700
Restricted stock plan — — 1,204 — — — 105,690 958 2,162
Balance at June 25, 2010 33,312,140 3,331 326,462 61,893 304 3,176 (969,950) (11,772) 383,394
Net loss — — — (23,203) — — — — (23,203)
Unrealized holding gain,
net of tax of $253 — — — — 469 — — — 469
Shortfall for taxes on vesting
of restricted stock — — (351) — — — — — (351)
Cash dividends ($0.12 per share) — — — (3,877) — — — — (3,877)
Deferred compensation plan — — (15) — (8) 132 (46,077) (145) (36)
Restricted stock plan — — 890 — — — (11,037) 183 1,073
Balance at June 24, 2011 33,312,140 3,331 326,986 34,813 765 3,308 (1,027,064) (11,734) 357,469
Net loss — — — (4,729) — — — — (4,729)
Unrealized holding gain,
net of tax of $1,064 — — — — 1,975 — — — 1,975
Shortfall for taxes on vesting
of restricted stock — — (62) — — — — — (62)
Deferred compensation plan — — (19) — 5 119 (43,480) (149) (44)
Restricted stock plan — — (2,349) — — — 334,711 3,442 1,093
Balance at June 29, 2012 33,312,140 $ 3,331 $ 324,556 $ 30,084 $ 2,745 $ 3,427 (735,833) $ (8,441) $ 355,702
See accompanying Notes to Consolidated Financial Statements.
F-4
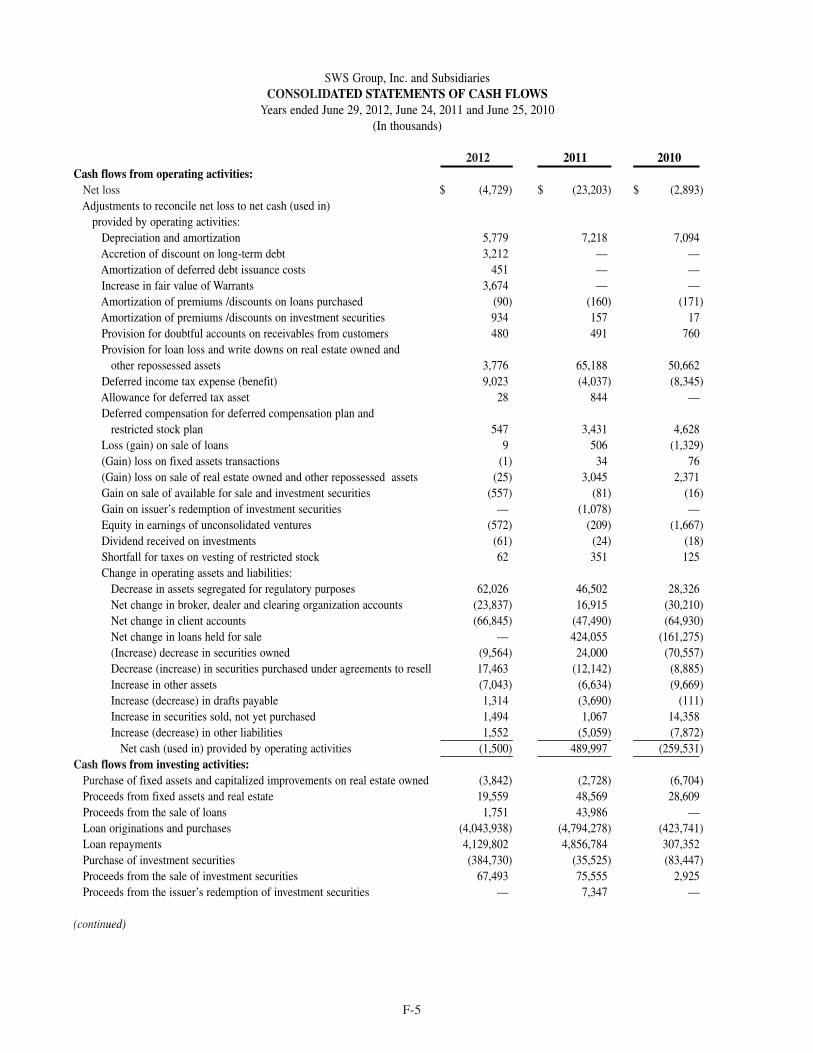
SWS Group, Inc. and SubsidiariesCONSOLIDATED STATEMENTS OF CASH FLOWS
Years ended June 29, 2012, June 24, 2011 and June 25, 2010(In thousands)
2012 2011 2010Cash flows from operating activities:
Net loss $ (4,729) $ (23,203) $ (2,893) Adjustments to reconcile net loss to net cash (used in)
provided by operating activities:Depreciation and amortization 5,779 7,218 7,094Accretion of discount on long-term debt 3,212 — —Amortization of deferred debt issuance costs 451 — —Increase in fair value of Warrants 3,674 — —Amortization of premiums /discounts on loans purchased (90) (160) (171)Amortization of premiums /discounts on investment securities 934 157 17Provision for doubtful accounts on receivables from customers 480 491 760Provision for loan loss and write downs on real estate owned and
other repossessed assets 3,776 65,188 50,662Deferred income tax expense (benefit) 9,023 (4,037) (8,345)Allowance for deferred tax asset 28 844 —Deferred compensation for deferred compensation plan and
restricted stock plan 547 3,431 4,628Loss (gain) on sale of loans 9 506 (1,329)(Gain) loss on fixed assets transactions (1) 34 76(Gain) loss on sale of real estate owned and other repossessed assets (25) 3,045 2,371Gain on sale of available for sale and investment securities (557) (81) (16)Gain on issuer’s redemption of investment securities — (1,078) —Equity in earnings of unconsolidated ventures (572) (209) (1,667)Dividend received on investments (61) (24) (18)Shortfall for taxes on vesting of restricted stock 62 351 125Change in operating assets and liabilities:
Decrease in assets segregated for regulatory purposes 62,026 46,502 28,326Net change in broker, dealer and clearing organization accounts (23,837) 16,915 (30,210)Net change in client accounts (66,845) (47,490) (64,930)Net change in loans held for sale — 424,055 (161,275)(Increase) decrease in securities owned (9,564) 24,000 (70,557)Decrease (increase) in securities purchased under agreements to resell 17,463 (12,142) (8,885)Increase in other assets (7,043) (6,634) (9,669)Increase (decrease) in drafts payable 1,314 (3,690) (111)Increase in securities sold, not yet purchased 1,494 1,067 14,358Increase (decrease) in other liabilities 1,552 (5,059) (7,872)
Net cash (used in) provided by operating activities (1,500) 489,997 (259,531)Cash flows from investing activities:
Purchase of fixed assets and capitalized improvements on real estate owned (3,842) (2,728) (6,704)Proceeds from fixed assets and real estate 19,559 48,569 28,609Proceeds from the sale of loans 1,751 43,986 —Loan originations and purchases (4,043,938) (4,794,278) (423,741)Loan repayments 4,129,802 4,856,784 307,352Purchase of investment securities (384,730) (35,525) (83,447)Proceeds from the sale of investment securities 67,493 75,555 2,925Proceeds from the issuer’s redemption of investment securities — 7,347 —
(continued)
F-5
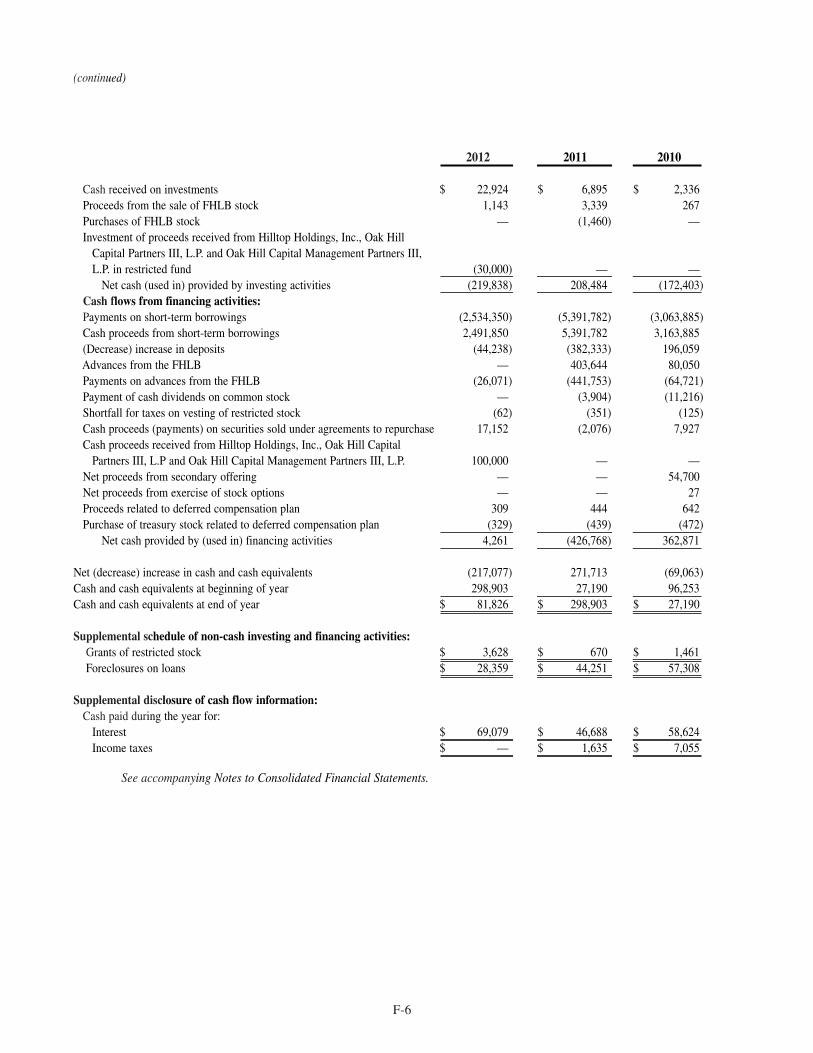
(continued)
2012 2011 2010
Cash received on investments $ 22,924 $ 6,895 $ 2,336Proceeds from the sale of FHLB stock 1,143 3,339 267Purchases of FHLB stock — (1,460) —Investment of proceeds received from Hilltop Holdings, Inc., Oak Hill
Capital Partners III, L.P. and Oak Hill Capital Management Partners III,L.P. in restricted fund (30,000) — —
Net cash (used in) provided by investing activities (219,838) 208,484 (172,403)Cash flows from financing activities:Payments on short-term borrowings (2,534,350) (5,391,782) (3,063,885)Cash proceeds from short-term borrowings 2,491,850 5,391,782 3,163,885(Decrease) increase in deposits (44,238) (382,333) 196,059Advances from the FHLB — 403,644 80,050Payments on advances from the FHLB (26,071) (441,753) (64,721)Payment of cash dividends on common stock — (3,904) (11,216)Shortfall for taxes on vesting of restricted stock (62) (351) (125)Cash proceeds (payments) on securities sold under agreements to repurchase 17,152 (2,076) 7,927Cash proceeds received from Hilltop Holdings, Inc., Oak Hill Capital
Partners III, L.P and Oak Hill Capital Management Partners III, L.P. 100,000 — —Net proceeds from secondary offering — — 54,700Net proceeds from exercise of stock options — — 27Proceeds related to deferred compensation plan 309 444 642Purchase of treasury stock related to deferred compensation plan (329) (439) (472)
Net cash provided by (used in) financing activities 4,261 (426,768) 362,871
Net (decrease) increase in cash and cash equivalents (217,077) 271,713 (69,063)Cash and cash equivalents at beginning of year 298,903 27,190 96,253Cash and cash equivalents at end of year $ 81,826 $ 298,903 $ 27,190
Supplemental schedule of non-cash investing and financing activities:Grants of restricted stock $ 3,628 $ 670 $ 1,461Foreclosures on loans $ 28,359 $ 44,251 $ 57,308
Supplemental disclosure of cash flow information:Cash paid during the year for:
Interest $ 69,079 $ 46,688 $ 58,624 Income taxes $ — $ 1,635 $ 7,055
See accompanying Notes to Consolidated Financial Statements.
F-6
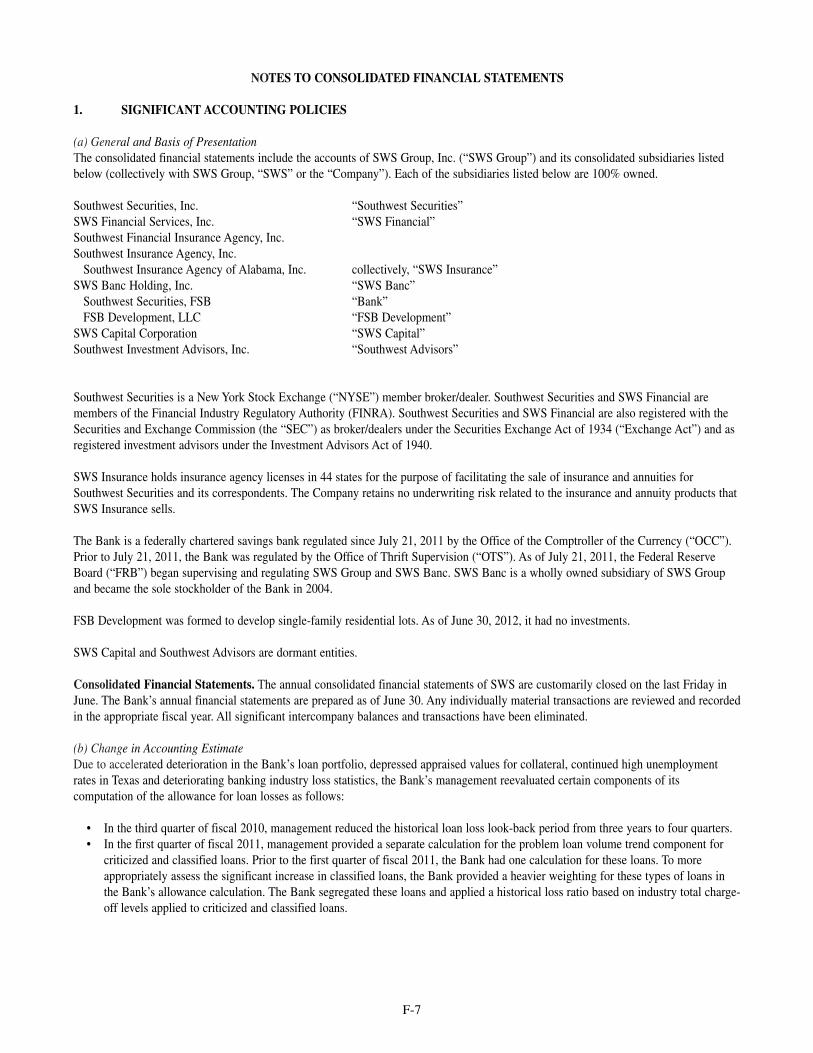
NOTES TO CONSOLIDATED FINANCIAL STATEMENTS
1. SIGNIFICANT ACCOUNTING POLICIES
(a) General and Basis of PresentationThe consolidated financial statements include the accounts of SWS Group, Inc. (“SWS Group”) and its consolidated subsidiaries listedbelow (collectively with SWS Group, “SWS” or the “Company”). Each of the subsidiaries listed below are 100% owned.
Southwest Securities, Inc. “Southwest Securities”SWS Financial Services, Inc. “SWS Financial”Southwest Financial Insurance Agency, Inc.Southwest Insurance Agency, Inc.
Southwest Insurance Agency of Alabama, Inc. collectively, “SWS Insurance”SWS Banc Holding, Inc. “SWS Banc”
Southwest Securities, FSB “Bank”FSB Development, LLC “FSB Development”
SWS Capital Corporation “SWS Capital”Southwest Investment Advisors, Inc. “Southwest Advisors”
Southwest Securities is a New York Stock Exchange (“NYSE”) member broker/dealer. Southwest Securities and SWS Financial aremembers of the Financial Industry Regulatory Authority (FINRA). Southwest Securities and SWS Financial are also registered with theSecurities and Exchange Commission (the “SEC”) as broker/dealers under the Securities Exchange Act of 1934 (“Exchange Act”) and asregistered investment advisors under the Investment Advisors Act of 1940.
SWS Insurance holds insurance agency licenses in 44 states for the purpose of facilitating the sale of insurance and annuities forSouthwest Securities and its correspondents. The Company retains no underwriting risk related to the insurance and annuity products thatSWS Insurance sells.
The Bank is a federally chartered savings bank regulated since July 21, 2011 by the Office of the Comptroller of the Currency (“OCC”).Prior to July 21, 2011, the Bank was regulated by the Office of Thrift Supervision (“OTS”). As of July 21, 2011, the Federal ReserveBoard (“FRB”) began supervising and regulating SWS Group and SWS Banc. SWS Banc is a wholly owned subsidiary of SWS Groupand became the sole stockholder of the Bank in 2004.
FSB Development was formed to develop single-family residential lots. As of June 30, 2012, it had no investments.
SWS Capital and Southwest Advisors are dormant entities.
Consolidated Financial Statements. The annual consolidated financial statements of SWS are customarily closed on the last Friday inJune. The Bank’s annual financial statements are prepared as of June 30. Any individually material transactions are reviewed and recordedin the appropriate fiscal year. All significant intercompany balances and transactions have been eliminated.
(b) Change in Accounting EstimateDue to accelerated deterioration in the Bank’s loan portfolio, depressed appraised values for collateral, continued high unemploymentrates in Texas and deteriorating banking industry loss statistics, the Bank’s management reevaluated certain components of itscomputation of the allowance for loan losses as follows:
• In the third quarter of fiscal 2010, management reduced the historical loan loss look-back period from three years to four quarters. • In the first quarter of fiscal 2011, management provided a separate calculation for the problem loan volume trend component for
criticized and classified loans. Prior to the first quarter of fiscal 2011, the Bank had one calculation for these loans. To moreappropriately assess the significant increase in classified loans, the Bank provided a heavier weighting for these types of loans inthe Bank’s allowance calculation. The Bank segregated these loans and applied a historical loss ratio based on industry total charge-off levels applied to criticized and classified loans.
F-7
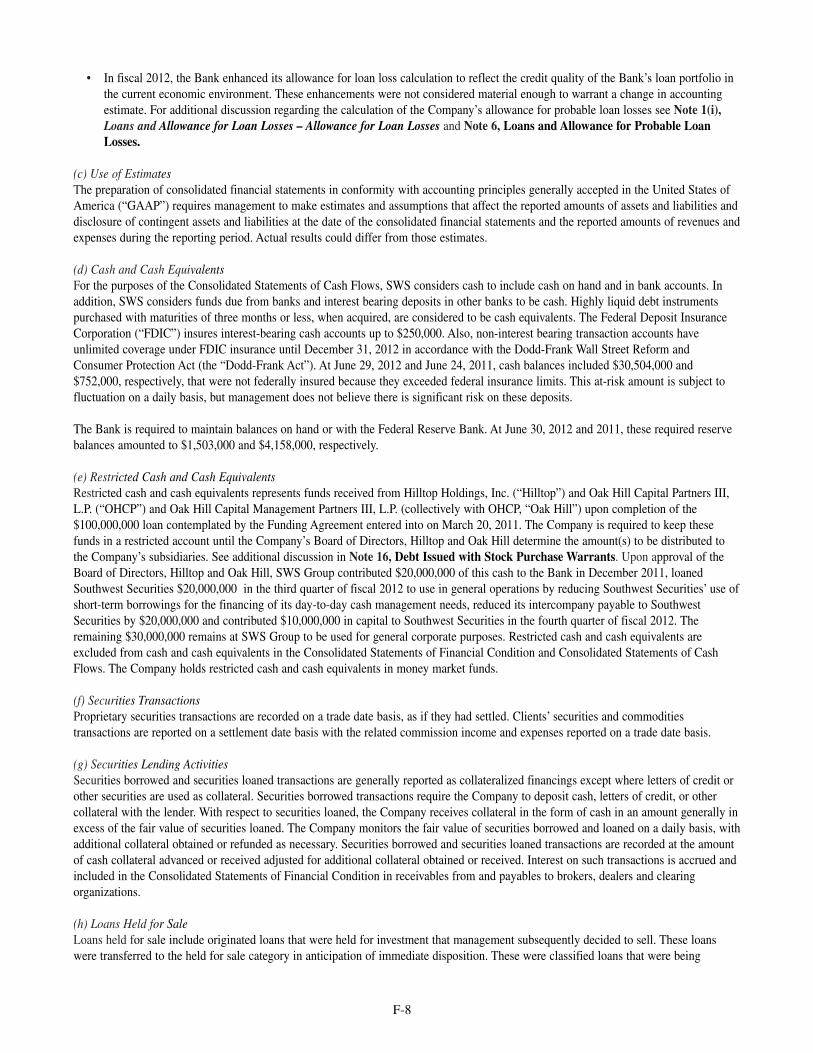
• In fiscal 2012, the Bank enhanced its allowance for loan loss calculation to reflect the credit quality of the Bank’s loan portfolio inthe current economic environment. These enhancements were not considered material enough to warrant a change in accountingestimate. For additional discussion regarding the calculation of the Company’s allowance for probable loan losses see Note 1(i),Loans and Allowance for Loan Losses – Allowance for Loan Losses and Note 6, Loans and Allowance for Probable LoanLosses.
(c) Use of EstimatesThe preparation of consolidated financial statements in conformity with accounting principles generally accepted in the United States ofAmerica (“GAAP”) requires management to make estimates and assumptions that affect the reported amounts of assets and liabilities anddisclosure of contingent assets and liabilities at the date of the consolidated financial statements and the reported amounts of revenues andexpenses during the reporting period. Actual results could differ from those estimates.
(d) Cash and Cash EquivalentsFor the purposes of the Consolidated Statements of Cash Flows, SWS considers cash to include cash on hand and in bank accounts. Inaddition, SWS considers funds due from banks and interest bearing deposits in other banks to be cash. Highly liquid debt instrumentspurchased with maturities of three months or less, when acquired, are considered to be cash equivalents. The Federal Deposit InsuranceCorporation (“FDIC”) insures interest-bearing cash accounts up to $250,000. Also, non-interest bearing transaction accounts haveunlimited coverage under FDIC insurance until December 31, 2012 in accordance with the Dodd-Frank Wall Street Reform andConsumer Protection Act (the “Dodd-Frank Act”). At June 29, 2012 and June 24, 2011, cash balances included $30,504,000 and$752,000, respectively, that were not federally insured because they exceeded federal insurance limits. This at-risk amount is subject tofluctuation on a daily basis, but management does not believe there is significant risk on these deposits.
The Bank is required to maintain balances on hand or with the Federal Reserve Bank. At June 30, 2012 and 2011, these required reservebalances amounted to $1,503,000 and $4,158,000, respectively.
(e) Restricted Cash and Cash EquivalentsRestricted cash and cash equivalents represents funds received from Hilltop Holdings, Inc. (“Hilltop”) and Oak Hill Capital Partners III,L.P. (“OHCP”) and Oak Hill Capital Management Partners III, L.P. (collectively with OHCP, “Oak Hill”) upon completion of the$100,000,000 loan contemplated by the Funding Agreement entered into on March 20, 2011. The Company is required to keep thesefunds in a restricted account until the Company’s Board of Directors, Hilltop and Oak Hill determine the amount(s) to be distributed tothe Company’s subsidiaries. See additional discussion in Note 16, Debt Issued with Stock Purchase Warrants. Upon approval of theBoard of Directors, Hilltop and Oak Hill, SWS Group contributed $20,000,000 of this cash to the Bank in December 2011, loanedSouthwest Securities $20,000,000 in the third quarter of fiscal 2012 to use in general operations by reducing Southwest Securities’ use ofshort-term borrowings for the financing of its day-to-day cash management needs, reduced its intercompany payable to SouthwestSecurities by $20,000,000 and contributed $10,000,000 in capital to Southwest Securities in the fourth quarter of fiscal 2012. Theremaining $30,000,000 remains at SWS Group to be used for general corporate purposes. Restricted cash and cash equivalents areexcluded from cash and cash equivalents in the Consolidated Statements of Financial Condition and Consolidated Statements of CashFlows. The Company holds restricted cash and cash equivalents in money market funds.
(f) Securities TransactionsProprietary securities transactions are recorded on a trade date basis, as if they had settled. Clients’ securities and commoditiestransactions are reported on a settlement date basis with the related commission income and expenses reported on a trade date basis.
(g) Securities Lending ActivitiesSecurities borrowed and securities loaned transactions are generally reported as collateralized financings except where letters of credit orother securities are used as collateral. Securities borrowed transactions require the Company to deposit cash, letters of credit, or othercollateral with the lender. With respect to securities loaned, the Company receives collateral in the form of cash in an amount generally inexcess of the fair value of securities loaned. The Company monitors the fair value of securities borrowed and loaned on a daily basis, withadditional collateral obtained or refunded as necessary. Securities borrowed and securities loaned transactions are recorded at the amountof cash collateral advanced or received adjusted for additional collateral obtained or received. Interest on such transactions is accrued andincluded in the Consolidated Statements of Financial Condition in receivables from and payables to brokers, dealers and clearingorganizations.
(h) Loans Held for SaleLoans held for sale include originated loans that were held for investment that management subsequently decided to sell. These loanswere transferred to the held for sale category in anticipation of immediate disposition. These were classified loans that were being
F-8
marketed through an international marketing campaign. Upon transfer, the fair value of these loans was determined using a discountedcash flow model to reflect the return required for immediate disposition of a distressed loan.
Subsequent to the transfer of these loans to held for sale, the loans were valued at the lower of cost or fair value as determined by thenegotiated sales price or, if no sales price is yet determined, at an agreed upon acceptance price as determined by third party valuation andmanagement.
(i) Loans and Allowance for Loan LossesLoans that management has the intent and ability to hold for the foreseeable future or until maturity or pay-off are reported at theiroutstanding principal balance adjusted for any charge-offs, the allowance for probable loan losses, and any deferred fees or costs onoriginated loans and unamortized premiums or discounts on purchased loans. Interest income is accrued on the unpaid principal balance.
Loan origination and commitment fees and certain related direct costs are deferred and amortized to interest income, generally over thecontractual lives of the loans, using the interest method. Discounts on first mortgage, consumer and other loans are amortized to incomeusing the interest method over the remaining period to contractual maturity.
The accrual of interest on impaired loans is discontinued when, in management’s opinion, the borrower may be unable to meet paymentsas they become due. When interest accrual is discontinued, all unpaid accrued interest is reversed. Interest income is subsequentlyrecognized to the extent cash payments are received for loans where ultimate full collection is likely. For loans where ultimate collectionis not likely, interest payments are applied to the outstanding principal and income is only recognized if full payment is made. Loans arereturned to accrual status when all the principal and interest amounts contractually due are brought current and future payments arereasonably assured.
Purchased Mortgage Loans Held for Investment. Loan participations and sub-participations in the Bank’s mortgage purchase program areacquired from various mortgage companies and valued at amortized cost. These loans are pre-sold by the mortgage company to secondaryinvestors who have been approved by the Bank. The purchased mortgage loans held for investment are held on average for 25 days orless.
Allowance for Loan Losses. The allowance for loan losses is maintained to absorb management’s estimate of probable loan lossesinherent in the Bank’s loan portfolio at each reporting date. The allowance for loan losses is established as losses are estimated to haveoccurred through a provision for loan losses charged to earnings. Loan losses are charged against the allowance when managementconfirms the uncollectibility of the principal loan balance. Subsequent recoveries, if any, are recorded through the allowance. Thedetermination of an adequate allowance is inherently subjective, as it requires estimates that are susceptible to significant revision asadditional information becomes available or circumstances change.
The allowance for loan losses is evaluated on a regular basis by management and is based upon management’s periodic review of thecollectibility of the loans in light of historical experience, the nature and volume of the loan portfolio, adverse situations that may affectthe borrower’s ability to repay, estimated value of any underlying collateral and prevailing economic conditions. The allowance for loanlosses consists of a specific and a general allowance component.
The specific allowance component provides for estimated probable losses for loans identified as impaired. A loan is considered impairedwhen, based on current information and events, it is probable that the Bank will be unable to collect all amounts of principal and interestwhen due according to the contractual terms of the loan agreement. Management considers the borrower’s financial condition, paymentstatus, historical payment record, and any adverse situations affecting the borrower’s ability to repay when evaluating whether a loan isdeemed impaired. Loans that experience insignificant payment delays and shortfalls generally are not classified as impaired. Managementdetermines the significance of payment delays and shortfalls on a case-by-case basis taking into consideration all circumstancessurrounding the loan and the borrower, including the length of delay, the reasons for the delay, the borrower’s prior payment record, andthe amount of shortfall in relation to the principal and interest outstanding.
A specific reserve is recorded when and to the extent the recorded value of the loan is greater than (1) the present value of expected futurecash flows discounted at the loan’s original effective rate, (2) fair value of collateral if the loan is collateral-dependent or (3) observablemarket price of the impaired loan. If the fair value of collateral is used to measure impairment of a collateral-dependent loan andrepayment is dependent on the sale of the collateral, the fair value is adjusted to incorporate estimated costs to sell the collateral. Impairedloans that are collateral-dependent are primarily measured for impairment using the fair value of the collateral as determined by thirdparty appraisals using the income approach, recent comparable sales data, or a combination thereof. In certain instances it is necessary formanagement to adjust the appraised value, less estimated costs to sell the collateral, to reflect changes in fair value occurring subsequentto the appraisal date. Management considers a guarantor’s capacity and willingness to perform, when appropriate, and the borrower’sresources available for repayment when measuring impairment.
F-9
The general allowance provides for estimated and probable losses inherent in the remainder of the Bank’s loan portfolio. The generalallowance is determined through a statistical calculation based on the Bank’s historical loss experience adjusted for certain qualitativefactors as deemed appropriate by management. The statistical calculation is conducted on a disaggregated basis for groups ofhomogeneous loans with similar risk characteristics (product types). The historical loss element is calculated as the average ratio ofcharge-offs, net of recoveries, to the average recorded investment for the current and previous three quarters. Management may adjust thehistorical loss rates to reflect other circumstances, such as deterioration in the real estate market, significant concentrations of producttypes, trends in portfolio volume, and the credit quality of the loan portfolio. In addition, prevailing economic conditions and specificindustry trends are taken into consideration when establishing the adjustments to historical loss rates.
(j) Securities OwnedMarketable securities are carried at fair value. The increase or decrease in net unrealized appreciation or depreciation of securities ownedis credited or charged to operations and is included in net gains on principal transactions in the Consolidated Statements of Loss andComprehensive Loss. SWS records the fair value of securities owned on a trade date basis. See Note 1(y) and Note 27, Fair Value ofFinancial Instruments.
(k) Securities Held to MaturityBonds and notes for which the Company has the intent and ability to hold to maturity are reported at cost, adjusted for premiums anddiscounts that are recognized in interest income using the interest method over the period to maturity.
(l) Securities Purchased Under Agreements to Resell and Securities Sold Under Agreements to RepurchaseTransactions involving purchases of securities under agreements to resell (reverse repurchase agreements or reverse repos) or sales ofsecurities under agreements to repurchase (repurchase agreements or repos) are accounted for as collateralized financings except wherethe Company does not have an agreement to sell (or purchase) the same or substantially the same securities before maturity at a fixed ordeterminable price. It is the policy of the Company to obtain possession of collateral with a fair value equal to or in excess of theprincipal amount loaned under resale agreements. Collateral is valued daily, and the Company may require counterparties to depositadditional collateral or return collateral pledged when appropriate. Interest payable on these amounts is included in the ConsolidatedStatements of Financial Condition in other liabilities.
(m) GoodwillThe Company implemented the concepts outlined in Accounting Standards Update (“ASU”) 2011-08 regarding its annual goodwillassessment of fair value. The ASU highlights that an entity is no longer required to calculate the fair value of a reporting unit unless theentity determines, based on a qualitative assessment, that it is more likely than not that a reporting unit’s fair value is less than its carryingamount.
Based on the results of its assessment, SWS’s goodwill balance was not impaired. SWS based its assessment of the fair value of thebusiness units with goodwill on a weighted average of a discounted cash flow model estimate of fair value and a market multipleapproach to fair value.
SWS has two reporting units with goodwill: Clearing with $4,254,000 and Institutional Brokerage with $3,298,000, both of which arepart of Southwest Securities. There were no changes in the carrying value of goodwill during the fiscal years ended June 29, 2012, June24, 2011 and June 25, 2010.
(n) InvestmentsLimited partnership investments are accounted for under the equity method of accounting in accordance with Accounting StandardsCodification (“ASC”) 323, “Investments-Equity Method and Joint Ventures.”
(o) Real Estate Owned (“REO”) and Other Repossessed AssetsREO and other repossessed assets are valued at the lower of cost or market, less a selling discount and are included in other assets in theConsolidated Statements of Financial Condition. For those investments where the REO is valued at market, the value is determined bythird party appraisals or if the REO is being sold in an auction, by the accepted bid amount. For those REO assets that are in an auctionand a bid has not been accepted, a fair value estimate is derived by utilizing market data, including appraised value discounted for sellingthe asset in a distressed sale. In addition, in certain circumstances, the Bank adjusts appraised values to more accurately reflect theeconomic conditions of the area at the time of valuation or to reflect changes in market value occurring subsequent to the appraisal date.Included in other repossessed assets are land leases which are valued using a discounted cash flow analysis. The amount of additionalwrite-downs required to reflect current fair value was $1,301,000, $14,221,000 and $5,544,000 for fiscal years 2012, 2011 and 2010,respectively.
F-10
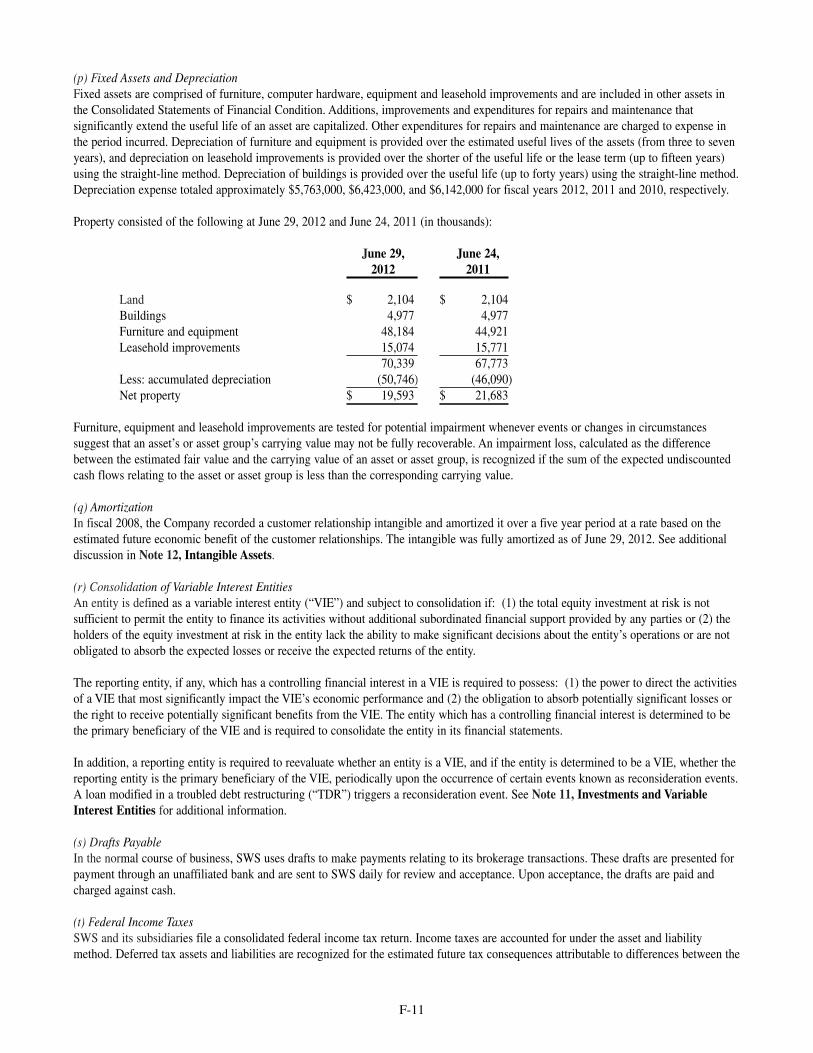
(p) Fixed Assets and DepreciationFixed assets are comprised of furniture, computer hardware, equipment and leasehold improvements and are included in other assets inthe Consolidated Statements of Financial Condition. Additions, improvements and expenditures for repairs and maintenance thatsignificantly extend the useful life of an asset are capitalized. Other expenditures for repairs and maintenance are charged to expense inthe period incurred. Depreciation of furniture and equipment is provided over the estimated useful lives of the assets (from three to sevenyears), and depreciation on leasehold improvements is provided over the shorter of the useful life or the lease term (up to fifteen years)using the straight-line method. Depreciation of buildings is provided over the useful life (up to forty years) using the straight-line method.Depreciation expense totaled approximately $5,763,000, $6,423,000, and $6,142,000 for fiscal years 2012, 2011 and 2010, respectively.
Property consisted of the following at June 29, 2012 and June 24, 2011 (in thousands):
June 29, June 24,2012 2011
Land $ 2,104 $ 2,104Buildings 4,977 4,977Furniture and equipment 48,184 44,921Leasehold improvements 15,074 15,771
70,339 67,773Less: accumulated depreciation (50,746) (46,090) Net property $ 19,593 $ 21,683
Furniture, equipment and leasehold improvements are tested for potential impairment whenever events or changes in circumstancessuggest that an asset’s or asset group’s carrying value may not be fully recoverable. An impairment loss, calculated as the differencebetween the estimated fair value and the carrying value of an asset or asset group, is recognized if the sum of the expected undiscountedcash flows relating to the asset or asset group is less than the corresponding carrying value.
(q) AmortizationIn fiscal 2008, the Company recorded a customer relationship intangible and amortized it over a five year period at a rate based on theestimated future economic benefit of the customer relationships. The intangible was fully amortized as of June 29, 2012. See additionaldiscussion in Note 12, Intangible Assets.
(r) Consolidation of Variable Interest Entities An entity is defined as a variable interest entity (“VIE”) and subject to consolidation if: (1) the total equity investment at risk is notsufficient to permit the entity to finance its activities without additional subordinated financial support provided by any parties or (2) theholders of the equity investment at risk in the entity lack the ability to make significant decisions about the entity’s operations or are notobligated to absorb the expected losses or receive the expected returns of the entity.
The reporting entity, if any, which has a controlling financial interest in a VIE is required to possess: (1) the power to direct the activitiesof a VIE that most significantly impact the VIE’s economic performance and (2) the obligation to absorb potentially significant losses orthe right to receive potentially significant benefits from the VIE. The entity which has a controlling financial interest is determined to bethe primary beneficiary of the VIE and is required to consolidate the entity in its financial statements.
In addition, a reporting entity is required to reevaluate whether an entity is a VIE, and if the entity is determined to be a VIE, whether thereporting entity is the primary beneficiary of the VIE, periodically upon the occurrence of certain events known as reconsideration events.A loan modified in a troubled debt restructuring (“TDR”) triggers a reconsideration event. See Note 11, Investments and VariableInterest Entities for additional information.
(s) Drafts PayableIn the normal course of business, SWS uses drafts to make payments relating to its brokerage transactions. These drafts are presented forpayment through an unaffiliated bank and are sent to SWS daily for review and acceptance. Upon acceptance, the drafts are paid andcharged against cash.
(t) Federal Income TaxesSWS and its subsidiaries file a consolidated federal income tax return. Income taxes are accounted for under the asset and liabilitymethod. Deferred tax assets and liabilities are recognized for the estimated future tax consequences attributable to differences between the
F-11
financial statement carrying amounts of existing assets and liabilities and their respective tax bases. Deferred tax assets and liabilities aremeasured using enacted tax rates in effect for the year in which those temporary differences are expected to be recovered or settled. Theeffect on deferred tax assets and liabilities of a change in tax rates is recognized in income in the period that includes the date of the taxrate changes.
The Company records net deferred tax assets to the extent the Company believes these assets are more likely to be realized than not. Inmaking such determination, the Company considers all available positive and negative evidence, including future reversals of existingtaxable temporary differences, projected future taxable income, tax planning strategies and recent financial operations. A valuationallowance is established against deferred tax assets when the Company determines that they are more likely to not be realized thanrealized. In the event the Company subsequently determines that it would be able to realize deferred income tax assets in excess of theirnet recorded amount, the Company would reduce the valuation allowance, which would reduce the provision for income taxes.
Deferred tax assets derived from operating losses are realized when the Company generates consolidated taxable income within theapplicable carry-back and carry-forward periods. Based on the Company’s projection for future taxable income over the carry-forwardperiod, management believes that it is more likely than not that the Company will realize all of its deferred tax assets derived fromoperating losses.
The Company has a $7,100,000 deferred tax asset related to the allowance for probable loan losses at the Bank. Management believes it ismore likely than not that the Company will realize this deferred tax asset due to the Company’s strong earnings history and management’sbelief that the loss that created the deferred asset related to the Bank’s allowance for probable loan losses was an aberration rather than acontinuing condition. In addition, management considered its expectation that the Company’s other subsidiaries will be profitable andgenerate future taxable income at the consolidated level. However, the amount of deferred tax assets considered realizable could bereduced if estimates of future taxable income during the carry-forward period are reduced. See Note 17, Income Taxes for a detail of theCompany’s deferred tax assets.
(u) Treasury StockPeriodically, SWS Group repurchases common stock under a plan approved by its Board of Directors. Currently, SWS Group isauthorized to repurchase 500,000 shares of common stock from time to time in the open market, expiring February 28, 2013. Duringfiscal 2012 and 2011, the Company did not repurchase any shares of common stock under the program in place at the time. The Companydoes not intend to repurchase any shares of common stock under this plan and would require Hilltop, Oak Hill and regulatory approval torepurchase shares under this plan.
Treasury stock is also repurchased periodically under the Company’s deferred compensation plan and the restricted stock plan (see Note19, Employee Benefits).
(v) Stock-Based CompensationSWS accounts for the SWS Group, Inc. Stock Option Plan (“1996 Plan”), the SWS Group, Inc. 1997 Stock Option Plan (“1997 Plan”)and the 2003 Restricted Stock Plan (“Restricted Stock Plan”) under the recognition and measurement principles of the FinancialAccounting Standards Board’s (“FASB”) accounting codification. All outstanding stock options are 100% vested. As a result, nocompensation expense was recorded for fiscal years 2012, 2011 or 2010 related to stock options.
(w) Loss Per Share (“EPS”)SWS provides a presentation of basic and diluted EPS. Basic EPS excludes dilution and is computed by dividing net income by weightedaverage common shares outstanding for the period. Diluted EPS reflects the potential dilution that would occur if contracts to issuecommon stock were exercised. Unvested share-based payment awards that contain non-forfeiture rights to dividends or dividendequivalents (paid or unpaid) are treated as participating securities and are factored into the calculation of basic and diluted EPS, except inperiods with a net loss, when they are excluded. See Note 23, Loss Per Share for additional detail regarding the Company’s calculationof EPS.
(x) Other Comprehensive Income (Loss)Net holding gains and losses represent the unrealized holding gains and losses on securities available for sale. See Note 10, SecuritiesAvailable for Sale.
(y) Fair Value of Financial InstrumentsFair value accounting establishes a framework for measuring fair value. Under fair value accounting, fair value refers to the price thatwould be received to sell an asset or paid to transfer a liability in an orderly transaction between market participants on the measurementdate in the principal market in which the reporting entity transacts. Further, fair value should be based on the assumptions market
F-12
participants would use when pricing the asset or liability. In support of this principle, fair value accounting establishes a fair valuehierarchy that prioritizes the information used to develop those assumptions. The fair value hierarchy gives the highest priority to quotedprices in active markets and the lowest priority to unobservable data. Under the standard, fair value measurements are separately disclosedby level within the fair value hierarchy. The standard describes three levels of inputs that may be used to measure fair value:
• Level 1 — Quoted prices in an active market for identical assets or liabilities. The Company values the following assets andliabilities utilizing Level 1 inputs: (1) the Company’s investment in U.S. Home Systems, Inc. (“USHS”) common stock; (2) theCompany’s deferred compensation plan’s investment in Westwood Holdings Group, Inc. (“Westwood”) common stock; (3) theCompany’s investment in government guaranteed bonds purchased under the Temporary Liquidity Guarantee Program (“TLGP”)and (4) certain inventories held in the Company’s securities owned and securities sold, not yet purchased portfolio. Valuation ofthese instruments does not require a high degree of judgment as the valuations are based on quoted prices in active markets that arereadily available.
• Level 2 — Observable inputs other than Level 1 prices, such as quoted prices for similar assets or liabilities; quoted prices inmarkets that are not active; or other inputs that are observable or can be corroborated by observable market data for substantially thefull term of the assets or liabilities. The Company values the following assets and liabilities utilizing Level 2 inputs: (1) certaininventories held in the Company’s securities owned and securities sold, not yet purchased portfolio and (2) securities in the availablefor sale portfolio. These financial instruments are valued by quoted prices that are less frequent than those in active markets or bymodels that use various assumptions that are derived from or supported by data that is generally observable in the marketplace.Valuations in this category are inherently less reliable than quoted market prices due to the degree of subjectivity involved indetermining appropriate methodologies and the applicable underlying observable market assumptions.
• Level 3 — Unobservable inputs that are supported by little or no market activity and that are significant to the fair value of theassets and liabilities. The Company values the following assets and liabilities utilizing Level 3 inputs: (1) certain inventories held inthe Company’s securities owned portfolio and (2) the Warrants. These financial instruments have significant inputs that cannot bevalidated by readily determinable market data and generally involve considerable judgment by management.
The following is a description of the valuation methodologies used for instruments measured at fair value on recurring and non-recurringbases and recognized in the Consolidated Statements of Financial Condition, as well as the general classification of such instrumentspursuant to the valuation hierarchy.
Recurring Fair Value Measurements
Assets Segregated for Regulatory Purposes. Because quoted market prices are available in an active market, these securities areclassified within Level 1 of the valuation hierarchy. These securities consist of government bonds purchased under the TLGP.
Securities Available for Sale. Because quoted market prices are available in an active market, the Company’s investment inUSHS common stock and the Company’s deferred compensation plan’s investment in Westwood common stock are classifiedwithin Level 1 of the valuation hierarchy. The Company’s investments in U.S. government and government agency andmunicipal obligations held by the Bank as available for sale are valued in a similar manner to the Company’s Level 2 securitiesowned and securities sold, not yet purchased portfolio, noted below.
Securities Owned and Securities Sold, Not Yet Purchased Portfolio. Securities classified as Level 1 securities primarily consistof financial instruments whose value is based on quoted market prices such as corporate equity securities and U.S. governmentand government agency obligations, primarily U.S. treasury securities.
Securities classified as Level 2 securities include financial instruments that are valued using models or other valuationmethodologies. These models are primarily industry standard models that consider various assumptions, including time value,yield curve, volatility factors, current market and contractual prices for the underlying financial instruments, as well as otherrelevant economic measures. Substantially all of these assumptions are observable in the marketplace, can be derived fromobservable data or are supported by observable levels at which transactions are executed in the marketplace. Securities in thiscategory include corporate obligations, U.S. government and government agency obligations and municipal obligations.
Securities classified as Level 3 securities are securities whose fair value is estimated based on internally developed models ormethodologies, including discounted cash flow, utilizing significant inputs that are generally less readily observable. The
F-13
models and methodologies consider the quality of the underlying loans, any related secondary market activity and expectationsregarding future interest rate movements. Included in this category are certain corporate equity securities, municipal auction ratesecurities and Warrants.
The Company held one municipal auction rate bond with a par amount of $21,950,000 and $22,650,000, at June 29, 2012 andJune 24, 2011, respectively, that was classified as a Level 3 security at both June 29, 2012 and June 24, 2011. This security isan investment grade credit, was valued at 95.7% of par, or $21,006,000 at June 29, 2012 and $21,676,000 at June 24, 2011, andyielded less than 1% per year for both periods. The interest rate on the bond is based on the London Interbank Offered Rate(“LIBOR”). The discount on the value of the bond is due to the lack of marketability. While management does not expect anyreduction in the cash flow from this bond, the disruption in the credit markets has led to auction failures. The Companycurrently has the ability to hold this investment until maturity. While the Company expects the issuer of this bond to refinancethe debt when LIBOR interest rates rise, there can be no certainty if or when this refinancing will occur. The Company believesthe valuation of this bond at 95.7% of par at June 29, 2012 reflected an appropriate discount for the current lack of liquidity inthis investment.
Warrants. The Warrants held by Hilltop and Oak Hill are valued using a binomial model which forecasts the Company’spotential stock price at certain points in time between the valuation date and expiration date of the Warrants. In addition to theCompany’s stock price, variables in the model include the risk free rate of return, dividend yield, time to maturity and volatilityof the Company’s stock price.
Substantially all of SWS’s brokerage assets and liabilities are carried at market value or at amounts which, because of their short-termnature, approximate current fair value.
Non-recurring Fair Value Measurements
Impaired loans held for investment. Certain impaired loans are reported at fair value through the recognition of a specificvaluation allowance or a partial principal charge-off. The fair value of an impaired loan is primarily determined based on thepresent value of the loan’s expected future cash flows discounted at the loan’s original effective rate or the fair value ofcollateral if the loan is collateral-dependent. If the fair value of collateral is used to measure impairment of a collateral-dependent loan and repayment is dependent on the sale of the collateral, the fair value is adjusted to incorporate estimated coststo sell the collateral. Impaired loans that are collateral-dependent are primarily measured for impairment using the fair value ofthe collateral as determined by third party appraisals using the income approach, recent comparable sales data or a combinationthereof. In certain instances it is necessary for management to adjust the appraised value, less estimated costs to sell thecollateral, to reflect changes in fair value occurring subsequent to the appraisal date. Therefore, impaired loans reported at fairvalue in the Consolidated Statements of Financial Condition are classified as Level 3 in the fair value hierarchy.
Loans held for sale. Loans held for sale are reported at the lower of cost or fair value. Fair value is determined by thenegotiated sales price less costs to sell the loan, or if no sales price is yet determined, by management utilizing collateralvaluations according to third party appraisals. The Bank receives appraisals on an annual basis or more often if deemednecessary by market and economic conditions. These appraisals generally use the sales comparison and /or income approachesto determine fair value. These loans were valued using Level 3 valuation methodologies.
REO and other repossessed assets. See Note 1(o), Real Estate Owned (“REO”) and Other Repossessed Assets for discussionof the valuation of these assets. REO and other repossessed assets are valued using Level 3 valuation methodologies as theinputs utilized to determine fair value require significant judgment and estimation.
Other Fair Value DisclosuresThe following is a description of the valuation methodologies used for financial instruments not measured at fair value in theConsolidated Statements of Financial Condition, but for which fair value is required to be disclosed in accordance with ASC 820– FairValue Measurements and Disclosure. See Note 27, Fair Value of Financial Instruments for additional information, including thehierarchy levels for these financial instruments.
F-14
Securities held to maturity. Fair values of securities held to maturity are based on the Company’s fair value policies regardingU.S. government and government agency obligations discussed above under – Recurring Fair Value Measurements –Securities Owned and Securities Sold, Not Yet Purchased portfolio.
Loans. Fair values of loans receivable, including purchased mortgage loans held for investment, are estimated for portfolios ofloans with similar characteristics. Loans are segregated by type, such as real estate, commercial and consumer, which arefurther segregated into fixed and adjustable rate interest terms. The fair value of loans receivable is calculated by discountingexpected future cash flows through the estimated maturity using interest rates currently being offered for loans with similarterms to borrowers of similar credit quality. Loan fair value estimates include judgments regarding future expected lossexperience and risk characteristics.
Deposits. The fair value of deposits with no stated maturity, such as interest-bearing checking accounts, passbook savingsaccounts and advance payments from borrowers for taxes and insurance, are equal to the amount payable on demand (carryingvalue), as these deposits are very liquid and can reprice immediately. The fair value of certificates of deposit is based on thediscounted value of contractual cash flows. The discount rate is estimated using the rates currently offered for deposits ofsimilar remaining maturities.
Advances from FHLB. The fair value of advances from FHLB is based on the discounted value of contractual cash flows. Thediscount rate is estimated using the rates currently offered for borrowings of similar remaining maturities.
Long-term debt. The fair value of long-term debt is estimated using a discounted cash flow model with assumptions regardingthe factors a market participant would consider in valuing the liability, including credit and liquidity risk.
(z) Accounting PronouncementsThe FASB and the SEC have recently issued the following statements and interpretations, which are applicable to SWS. Any other newaccounting pronouncements not specifically identified in our disclosures are not applicable to SWS.
ASU 2011-11, “Disclosures about Offsetting Assets and Liabilities.” In December 2011, the FASB issued ASU 2011-11 which requiresentities to disclose both gross and net information about instruments and transactions eligible for offset in the statement of financialposition and instruments and transactions subject to an agreement similar to a master netting agreement. The purpose of ASU 2011-11 isto facilitate comparison between entities that prepare their financial statements on a GAAP basis and entities that prepare their financialstatements on the basis of International Financial Reporting Standards (“IFRS”). ASU 2011-11 applies to derivatives, sale and repurchaseagreements and reverse sale and repurchase agreements and securities borrowing and lending arrangements. ASU 2011-11 is effective forannual reporting periods beginning on or after January 1, 2013, and interim periods within those annual periods, the Company’s firstquarter of fiscal 2014. The Company is in the process of evaluating the impact of ASU 2011-11 on its financial statements and processes.
ASU 2011-05, “Comprehensive Income” as amended by ASU 2011-12 “Deferral of the Effective Date for Amendments to thePresentation of Reclassification of Items Out of Accumulated Other Comprehensive Income.” In June 2011, the FASB issued ASU2011-05 to increase the prominence of items reported in other comprehensive income. ASU 2011-05 requires that all non-owner changesin stockholders’ equity be presented in either a single continuous statement of comprehensive income or in two separate but consecutivestatements. ASU 2011-05 is effective for annual periods beginning after December 15, 2011, the Company’s first quarter of fiscal 2013and early adoption is permitted. In December 2011, the FASB issued ASU 2011-12, which indefinitely defers the presentation ofreclassification adjustments out of other comprehensive income by component in both the statement in which net income is presented andthe statement in which comprehensive income is presented. The Company does not expect ASU 2011-05 or ASU 2011-12 to have amaterial impact on its financial statements and processes.
2. ASSETS SEGREGATED FOR REGULATORY PURPOSESAt June 29, 2012, SWS held TLGP bonds with a fair value of $10,114,000 and cash of approximately $166,185,000 segregated in specialreserve bank accounts for the exclusive benefit of customers under Rule 15c3-3 of the Securities Exchange Act of 1934 (“Exchange ActRule 15c3-3”). SWS had no reserve deposits in special reserve bank accounts for the Proprietary Accounts of Introducing Brokers(“PAIB”) at June 29, 2012.
F-15
At June 24, 2011, SWS held TLGP bonds with a fair value of $55,617,000 and cash of $182,708,000 segregated in special reserve bankaccounts for the exclusive benefit of customers under Exchange Act Rule 15c3-3. SWS had no reserve deposits in special reserve bankaccounts for the PAIB at June 24, 2011.
3. RECEIVABLE FROM AND PAYABLE TO BROKERS, DEALERS AND CLEARING ORGANIZATIONSAt June 29, 2012 and June 24, 2011, SWS had receivable from and payable to brokers, dealers and clearing organizations related to thefollowing (in thousands):
2012 2011Receivable:
Securities failed to deliver $ 23,220 $ 19,387 Securities borrowed 1,320,274 1,529,707Correspondent broker/dealers 41,941 38,019Clearing organizations 18,705 20,879Other 21,557 12,531
$ 1,425,697 $ 1,620,523
Payable:Securities failed to receive $ 28,879 $ 18,214 Securities loaned 1,289,198 1,519,665Correspondent broker/dealers 10,753 12,087Other 20,540 18,067
$ 1,349,370 $ 1,568,033
Securities failed to deliver and receive represent the contractual value of securities that have not been delivered or received subsequent tosettlement date. Securities borrowed and loaned represent deposits made to or received from other broker/dealers relating to thesetransactions. These deposits approximate the market value of the underlying securities.
SWS clears securities transactions for correspondent broker/dealers. Proprietary settled securities and related transactions for thesecorrespondents are included in the receivable from and payable to brokers, dealers and clearing organizations.
SWS participates in the securities borrowing and lending business by borrowing and lending securities other than those of its clients.SWS obtains or releases collateral as prices of the underlying securities fluctuate. At June 29, 2012, SWS had collateral of$1,320,024,000 under securities lending agreements, of which SWS had repledged $1,250,328,000. At June 24, 2011, SWS had collateralof $1,529,607,000 under securities lending agreements, of which SWS had repledged $1,484,485,000.
4. RECEIVABLE FROM AND PAYABLE TO CLIENTSReceivable from and payable to clients include amounts due on cash and margin transactions. Included in these amounts are receivablefrom and payable to noncustomers (as defined by Exchange Act Rule 15c3-3, principally officers, directors and related accounts), whichaggregated approximately $359,000 and $1,371,000, respectively, at June 29, 2012 and $648,000 and $670,000, respectively, at June 24,2011. Securities owned by customers and noncustomers that collateralize the receivable are not reflected in the accompanyingconsolidated financial statements.
SWS pays interest on certain customer “free credit” balances available for reinvestment. The aggregate balance of such funds wasapproximately $308,669,000 and $358,678,000 at June 29, 2012 and June 24, 2011, respectively. During fiscal 2012 and 2011, theinterest rates paid on these balances ranged from 0.02% to 0.05% and 0.05% to 0.09%, respectively. The weighted average interest ratepaid was 0.04% in fiscal 2012 and 0.05% in fiscal 2011.
F-16
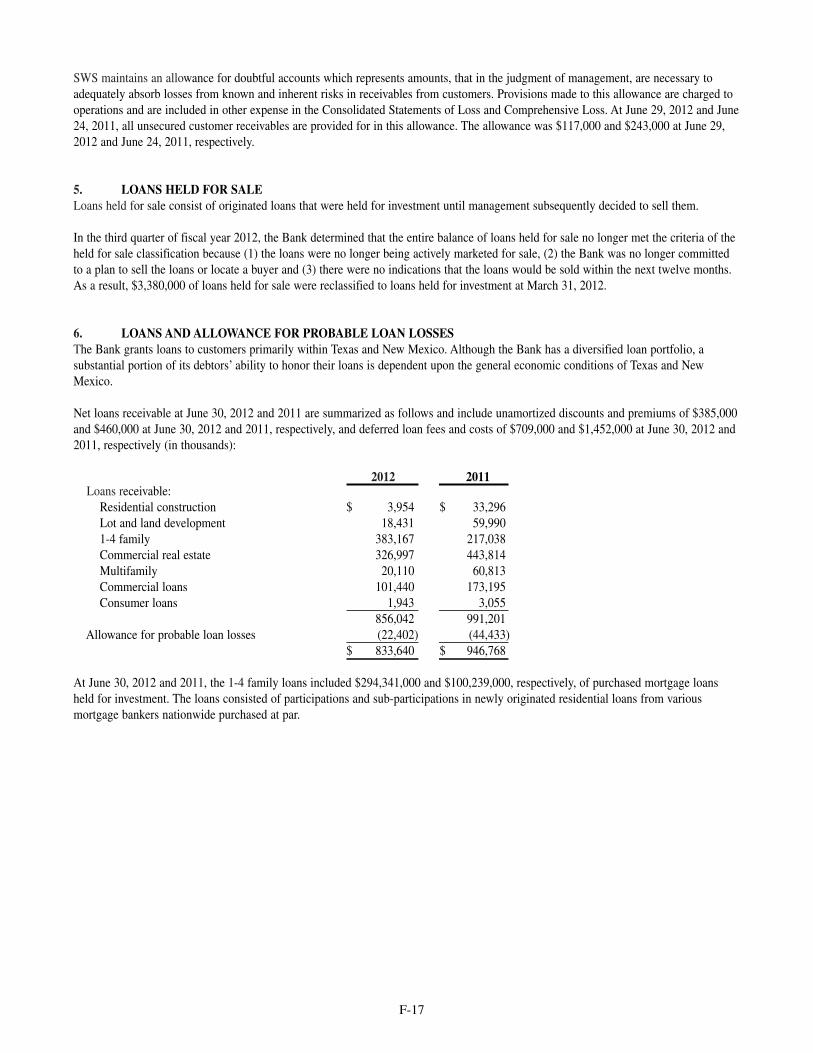
SWS maintains an allowance for doubtful accounts which represents amounts, that in the judgment of management, are necessary toadequately absorb losses from known and inherent risks in receivables from customers. Provisions made to this allowance are charged tooperations and are included in other expense in the Consolidated Statements of Loss and Comprehensive Loss. At June 29, 2012 and June24, 2011, all unsecured customer receivables are provided for in this allowance. The allowance was $117,000 and $243,000 at June 29,2012 and June 24, 2011, respectively.
5. LOANS HELD FOR SALELoans held for sale consist of originated loans that were held for investment until management subsequently decided to sell them.
In the third quarter of fiscal year 2012, the Bank determined that the entire balance of loans held for sale no longer met the criteria of theheld for sale classification because (1) the loans were no longer being actively marketed for sale, (2) the Bank was no longer committedto a plan to sell the loans or locate a buyer and (3) there were no indications that the loans would be sold within the next twelve months.As a result, $3,380,000 of loans held for sale were reclassified to loans held for investment at March 31, 2012.
6. LOANS AND ALLOWANCE FOR PROBABLE LOAN LOSSESThe Bank grants loans to customers primarily within Texas and New Mexico. Although the Bank has a diversified loan portfolio, asubstantial portion of its debtors’ ability to honor their loans is dependent upon the general economic conditions of Texas and NewMexico.
Net loans receivable at June 30, 2012 and 2011 are summarized as follows and include unamortized discounts and premiums of $385,000and $460,000 at June 30, 2012 and 2011, respectively, and deferred loan fees and costs of $709,000 and $1,452,000 at June 30, 2012 and2011, respectively (in thousands):
2012 2011Loans receivable:
Residential construction $ 3,954 $ 33,296 Lot and land development 18,431 59,9901-4 family 383,167 217,038Commercial real estate 326,997 443,814Multifamily 20,110 60,813Commercial loans 101,440 173,195Consumer loans 1,943 3,055
856,042 991,201Allowance for probable loan losses (22,402) (44,433)
$ 833,640 $ 946,768
At June 30, 2012 and 2011, the 1-4 family loans included $294,341,000 and $100,239,000, respectively, of purchased mortgage loansheld for investment. The loans consisted of participations and sub-participations in newly originated residential loans from variousmortgage bankers nationwide purchased at par.
F-17
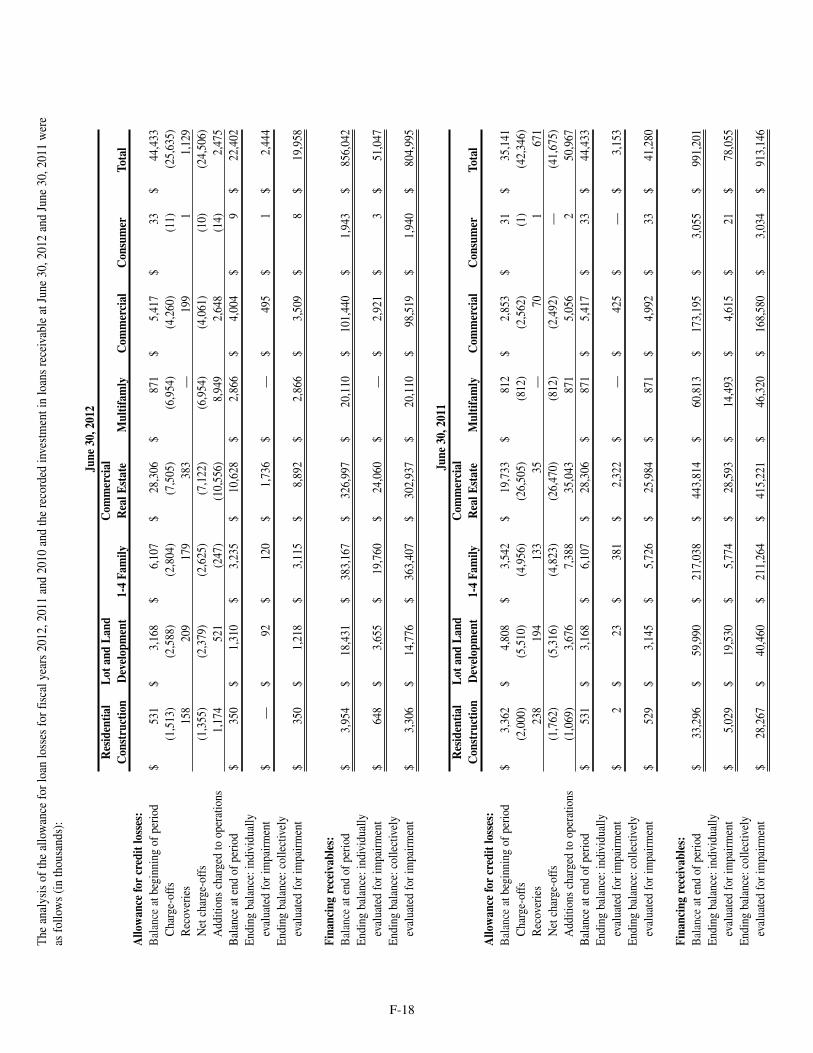
The
anal
ysis
of t
he a
llow
ance
for l
oan
loss
es fo
r fis
cal y
ears
201
2,20
11 a
nd 2
010
and
the
reco
rded
inve
stm
ent i
n lo
ans
rece
ivab
le a
t Jun
e 30
,201
2 an
d Ju
ne 3
0,20
11 w
ere
as fo
llow
s (in
thou
sand
s):
June
30,
2012
Res
iden
tial
Lot
and
Lan
dC
omm
erci
alC
onst
ruct
ion
Dev
elop
men
t1-
4 Fa
mily
Rea
l Est
ate
Mul
tifam
lyC
omm
erci
alC
onsu
mer
Tota
lA
llow
ance
for
cred
it lo
sses
:B
alan
ce a
t beg
inni
ng o
f per
iod
$53
1$
3,16
8 $
6,10
7$
28,3
06$
871
$5,
417
$33
$44
,433
Cha
rge-
offs
(1
,513
)(2
,588
)(2
,804
)(7
,505
)(6
,954
)(4
,260
)(1
1)(2
5,63
5)R
ecov
erie
s 15
820
917
938
3—
199
11,
129
Net
cha
rge-
offs
(1
,355
)(2
,379
)(2
,625
)(7
,122
)(6
,954
)(4
,061
)(1
0)
(24,
506)
Add
ition
s ch
arge
d to
ope
ratio
ns1,
174
521
(247
)(1
0,55
6)8,
949
2,64
8(1
4)
2,47
5B
alan
ce a
t end
of p
erio
d $
350
$1,
310
$3,
235
$10
,628
$2,
866
$4,
004
$ 9
$ 22
,402
Endi
ng b
alan
ce:i
ndiv
idua
llyev
alua
ted
for i
mpa
irmen
t $
—$
92$
120
$ 1,
736
$ —
$ 49
5 $
1 $
2,44
4En
ding
bal
ance
:col
lect
ivel
yev
alua
ted
for i
mpa
irmen
t $
350
$ 1,
218
$ 3,
115
$ 8,
892
$ 2,
866
$ 3,
509
$ 8
$ 19
,958
Fina
ncin
g re
ceiv
able
s:B
alan
ce a
t end
of p
erio
d $
3,95
4 $
18,4
31
$ 38
3,16
7 $
326,
997
$ 20
,110
$
101,
440
$1,
943
$85
6,04
2En
ding
bal
ance
:ind
ivid
ually
eval
uate
d fo
r im
pairm
ent
$64
8$
3,65
5$
19,7
60$
24,0
60$
—$
2,92
1$
3$
51,0
47En
ding
bal
ance
:col
lect
ivel
yev
alua
ted
for i
mpa
irmen
t $
3,30
6$
14,7
76$
363,
407
$30
2,93
7$
20,1
10$
98,5
19$
1,94
0$
804,
995
June
30,
2011
Res
iden
tial
Lot
and
Lan
dC
omm
erci
alC
onst
ruct
ion
Dev
elop
men
t1-
4 Fa
mily
Rea
l Est
ate
Mul
tifam
lyC
omm
erci
alC
onsu
mer
Tota
lA
llow
ance
for
cred
it lo
sses
:B
alan
ce a
t beg
inni
ng o
f per
iod
$3,
362
$4,
808
$3,
542
$19
,733
$81
2$
2,85
3$
31$
35,1
41C
harg
e-of
fs
(2,0
00)
(5,5
10)
(4,9
56)
(26,
505)
(812
)(2
,562
)(1
)(4
2,34
6)R
ecov
erie
s 23
819
413
335
—70
167
1N
et c
harg
e-of
fs
(1,7
62)
(5,3
16)
(4,8
23)
(26,
470)
(812
)(2
,492
)—
(4
1,67
5)A
dditi
ons
char
ged
to o
pera
tions
(1,0
69)
3,67
67,
388
35,0
4387
15,
056
2 50
,967
Bal
ance
at e
nd o
f per
iod
$53
1$
3,16
8$
6,10
7$
28,3
06$
871
$5,
417
$ 33
$
44,4
33En
ding
bal
ance
:ind
ivid
ually
eval
uate
d fo
r im
pairm
ent
$2
$23
$ 38
1 $
2,32
2$
—$
425
$ —
$ 3,
153
Endi
ng b
alan
ce:c
olle
ctiv
ely
eval
uate
d fo
r im
pairm
ent
$52
9 $
3,14
5 $
5,72
6 $
25,9
84$
871
$ 4,
992
$ 33
$ 41
,280
Fina
ncin
g re
ceiv
able
s:B
alan
ce a
t end
of p
erio
d $
33,2
96
$ 59
,990
$
217,
038
$ 44
3,81
4 $
60,8
13
$ 17
3,19
5$
3,05
5$
991,
201
Endi
ng b
alan
ce:i
ndiv
idua
llyev
alua
ted
for i
mpa
irmen
t $
5,02
9$
19,5
30$
5,77
4$
28,5
93$
14,4
93$
4,61
5$
21$
78,0
55En
ding
bal
ance
:col
lect
ivel
yev
alua
ted
for i
mpa
irmen
t $
28,2
67$
40,4
60$
211,
264
$41
5,22
1$
46,3
20$
168,
580
$3,
034
$91
3,14
6
F-18
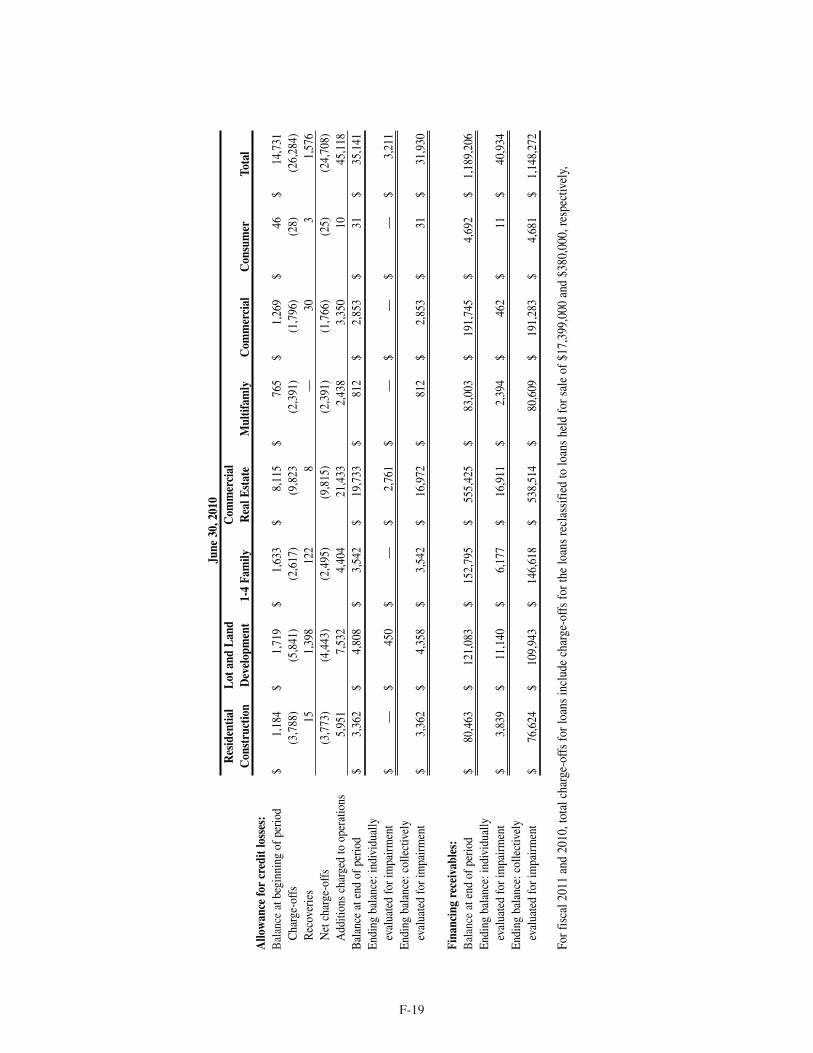
F-19
June
30,
2010
Res
iden
tial
Lot
and
Lan
dC
omm
erci
alC
onst
ruct
ion
Dev
elop
men
t1-
4 Fa
mily
Rea
l Est
ate
Mul
tifam
lyC
omm
erci
alC
onsu
mer
Tota
lA
llow
ance
for
cred
it lo
sses
:B
alan
ce a
t beg
inni
ng o
f per
iod
$1,
184
$1,
719
$1,
633
$8,
115
$76
5$
1,26
9$
46$
14,7
31C
harg
e-of
fs
(3,7
88)
(5,8
41)
(2,6
17)
(9,8
23(2
,391
)(1
,796
)(2
8)(2
6,28
4)R
ecov
erie
s 15
1,39
812
28
—30
31,
576
Net
cha
rge-
offs
(3
,773
)(4
,443
)(2
,495
)(9
,815
)(2
,391
)(1
,766
)(2
5)(2
4,70
8)A
dditi
ons
char
ged
to o
pera
tions
5,95
17,
532
4,40
421
,433
2,43
83,
350
10
45,1
18B
alan
ce a
t end
of p
erio
d $
3,36
2$
4,80
8$
3,54
2$
19,7
33$
812
$2,
853
$ 31
$
35,1
41En
ding
bal
ance
:ind
ivid
ually
eval
uate
d fo
r im
pairm
ent
$—
$45
0$
—
$ 2,
761
$ —
$ —
$
—$
3,21
1En
ding
bal
ance
:col
lect
ivel
yev
alua
ted
for i
mpa
irmen
t $
3,36
2 $
4,35
8 $
3,54
2 $
16,9
72$
812
$ 2,
853
$ 31
$ 31
,930
Fina
ncin
g re
ceiv
able
s:B
alan
ce a
t end
of p
erio
d $
80,4
63
$ 12
1,08
3$
152,
795
$ 55
5,42
5$
83,0
03
$ 19
1,74
5$
4,69
2$
1,18
9,20
6En
ding
bal
ance
:ind
ivid
ually
eval
uate
d fo
r im
pairm
ent
$3,
839
$11
,140
$6,
177
$16
,911
$2,
394
$46
2$
11$
40,9
34En
ding
bal
ance
:col
lect
ivel
yev
alua
ted
for i
mpa
irmen
t $
76,6
24$
109,
943
$14
6,61
8$
538,
514
$80
,609
$19
1,28
3$
4,68
1$
1,14
8,27
2
For f
isca
l 201
1 an
d 20
10,t
otal
cha
rge-
offs
for l
oans
incl
ude
char
ge-o
ffs
for t
he lo
ans
recl
assi
fied
to lo
ans
held
for s
ale
of $
17,3
99,0
00 a
nd $
380,
000,
resp
ectiv
ely,
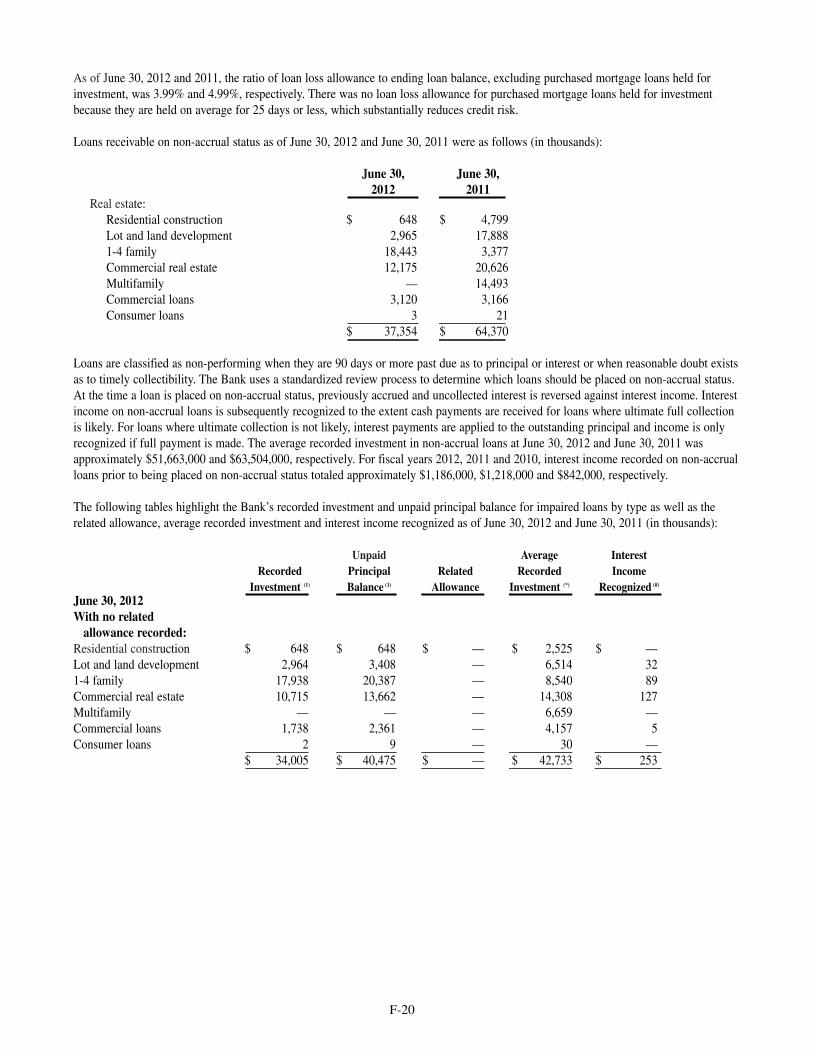
As of June 30, 2012 and 2011, the ratio of loan loss allowance to ending loan balance, excluding purchased mortgage loans held forinvestment, was 3.99% and 4.99%, respectively. There was no loan loss allowance for purchased mortgage loans held for investmentbecause they are held on average for 25 days or less, which substantially reduces credit risk.
Loans receivable on non-accrual status as of June 30, 2012 and June 30, 2011 were as follows (in thousands):
June 30, June 30,2012 2011
Real estate:Residential construction $ 648 $ 4,799Lot and land development 2,965 17,8881-4 family 18,443 3,377Commercial real estate 12,175 20,626Multifamily — 14,493Commercial loans 3,120 3,166Consumer loans 3 21
$ 37,354 $ 64,370
Loans are classified as non-performing when they are 90 days or more past due as to principal or interest or when reasonable doubt existsas to timely collectibility. The Bank uses a standardized review process to determine which loans should be placed on non-accrual status.At the time a loan is placed on non-accrual status, previously accrued and uncollected interest is reversed against interest income. Interestincome on non-accrual loans is subsequently recognized to the extent cash payments are received for loans where ultimate full collectionis likely. For loans where ultimate collection is not likely, interest payments are applied to the outstanding principal and income is onlyrecognized if full payment is made. The average recorded investment in non-accrual loans at June 30, 2012 and June 30, 2011 wasapproximately $51,663,000 and $63,504,000, respectively. For fiscal years 2012, 2011 and 2010, interest income recorded on non-accrualloans prior to being placed on non-accrual status totaled approximately $1,186,000, $1,218,000 and $842,000, respectively.
The following tables highlight the Bank’s recorded investment and unpaid principal balance for impaired loans by type as well as therelated allowance, average recorded investment and interest income recognized as of June 30, 2012 and June 30, 2011 (in thousands):
Unpaid Average InterestRecorded Principal Related Recorded Income
Investment (1) Balance (1) Allowance Investment (*) Recognized (#)
June 30, 2012With no related
allowance recorded:Residential construction $ 648 $ 648 $ — $ 2,525 $ —Lot and land development 2,964 3,408 — 6,514 32 1-4 family 17,938 20,387 — 8,540 89 Commercial real estate 10,715 13,662 — 14,308 127 Multifamily — — — 6,659 —Commercial loans 1,738 2,361 — 4,157 5 Consumer loans 2 9 — 30 —
$ 34,005 $ 40,475 $ — $ 42,733 $ 253
F-20
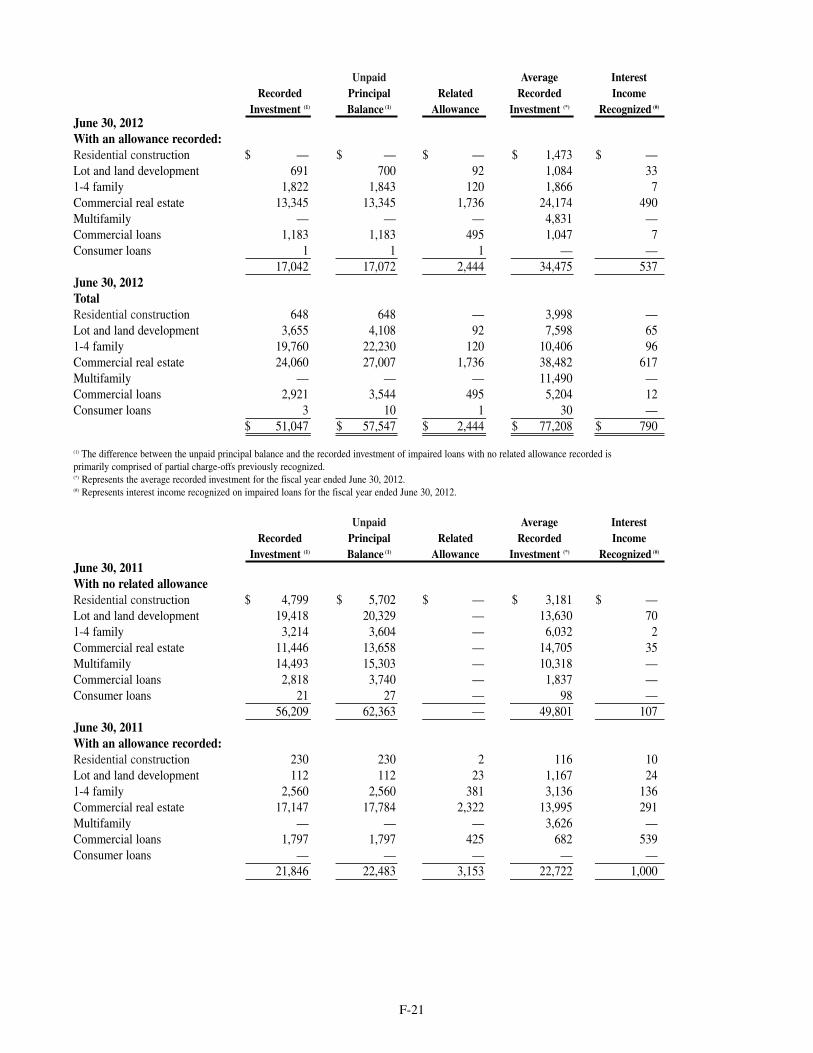
Unpaid Average InterestRecorded Principal Related Recorded Income
Investment (1) Balance (1) Allowance Investment (*) Recognized (#)
June 30, 2012With an allowance recorded:Residential construction $ — $ — $ — $ 1,473 $ —Lot and land development 691 700 92 1,084 33 1-4 family 1,822 1,843 120 1,866 7 Commercial real estate 13,345 13,345 1,736 24,174 490 Multifamily — — — 4,831 —Commercial loans 1,183 1,183 495 1,047 7 Consumer loans 1 1 1 — —
17,042 17,072 2,444 34,475 537 June 30, 2012TotalResidential construction 648 648 — 3,998 —Lot and land development 3,655 4,108 92 7,598 65 1-4 family 19,760 22,230 120 10,406 96 Commercial real estate 24,060 27,007 1,736 38,482 617 Multifamily — — — 11,490 —Commercial loans 2,921 3,544 495 5,204 12 Consumer loans 3 10 1 30 —
$ 51,047 $ 57,547 $ 2,444 $ 77,208 $ 790
(1) The difference between the unpaid principal balance and the recorded investment of impaired loans with no related allowance recorded is primarily comprised of partial charge-offs previously recognized.(*) Represents the average recorded investment for the fiscal year ended June 30, 2012.(#) Represents interest income recognized on impaired loans for the fiscal year ended June 30, 2012.
Unpaid Average InterestRecorded Principal Related Recorded Income
Investment (1) Balance (1) Allowance Investment (*) Recognized (#)
June 30, 2011With no related allowance Residential construction $ 4,799 $ 5,702 $ — $ 3,181 $ —Lot and land development 19,418 20,329 — 13,630 70 1-4 family 3,214 3,604 — 6,032 2 Commercial real estate 11,446 13,658 — 14,705 35 Multifamily 14,493 15,303 — 10,318 — Commercial loans 2,818 3,740 — 1,837 —Consumer loans 21 27 — 98 —
56,209 62,363 — 49,801 107 June 30, 2011With an allowance recorded:Residential construction 230 230 2 116 10 Lot and land development 112 112 23 1,167 24 1-4 family 2,560 2,560 381 3,136 136 Commercial real estate 17,147 17,784 2,322 13,995 291 Multifamily — — — 3,626 — Commercial loans 1,797 1,797 425 682 539 Consumer loans — — — — —
21,846 22,483 3,153 22,722 1,000
F-21
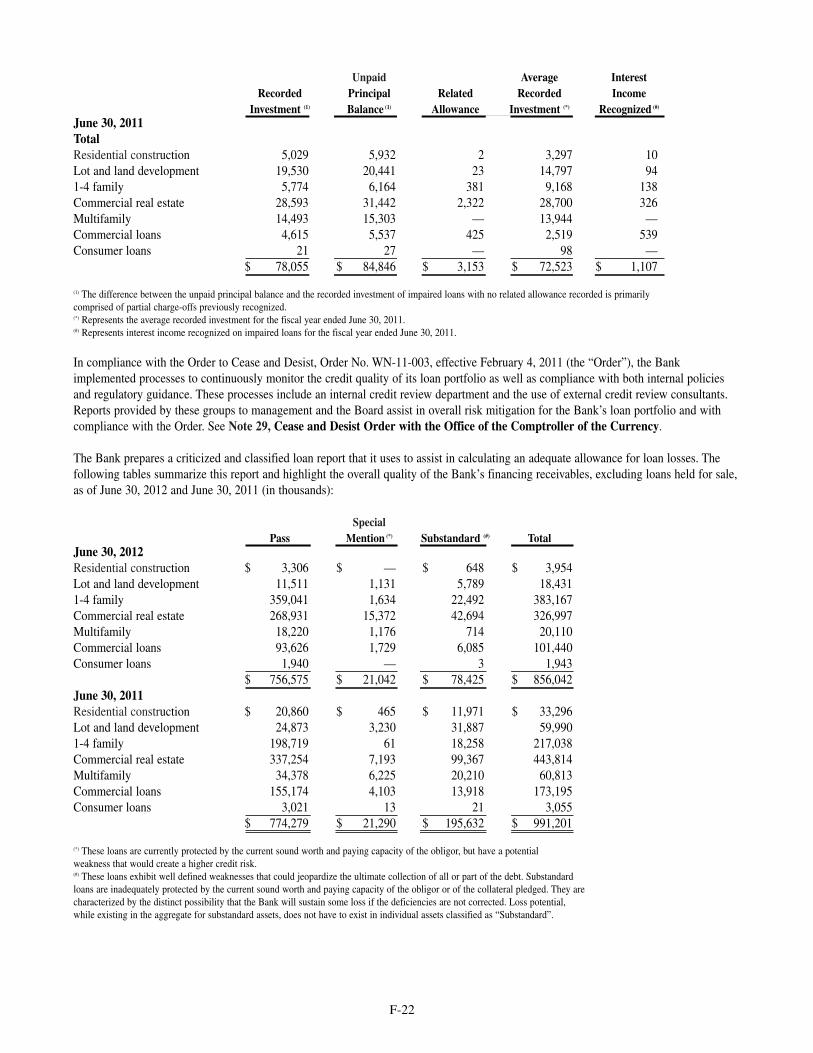
Unpaid Average InterestRecorded Principal Related Recorded Income
Investment (1) Balance (1) Allowance Investment (*) Recognized (#)
June 30, 2011TotalResidential construction 5,029 5,932 2 3,297 10 Lot and land development 19,530 20,441 23 14,797 94 1-4 family 5,774 6,164 381 9,168 138Commercial real estate 28,593 31,442 2,322 28,700 326Multifamily 14,493 15,303 — 13,944 —Commercial loans 4,615 5,537 425 2,519 539 Consumer loans 21 27 — 98 —
$ 78,055 $ 84,846 $ 3,153 $ 72,523 $ 1,107
(1) The difference between the unpaid principal balance and the recorded investment of impaired loans with no related allowance recorded is primarily comprised of partial charge-offs previously recognized.(*) Represents the average recorded investment for the fiscal year ended June 30, 2011.(#) Represents interest income recognized on impaired loans for the fiscal year ended June 30, 2011.
In compliance with the Order to Cease and Desist, Order No. WN-11-003, effective February 4, 2011 (the “Order”), the Bankimplemented processes to continuously monitor the credit quality of its loan portfolio as well as compliance with both internal policiesand regulatory guidance. These processes include an internal credit review department and the use of external credit review consultants.Reports provided by these groups to management and the Board assist in overall risk mitigation for the Bank’s loan portfolio and withcompliance with the Order. See Note 29, Cease and Desist Order with the Office of the Comptroller of the Currency.
The Bank prepares a criticized and classified loan report that it uses to assist in calculating an adequate allowance for loan losses. Thefollowing tables summarize this report and highlight the overall quality of the Bank’s financing receivables, excluding loans held for sale,as of June 30, 2012 and June 30, 2011 (in thousands):
SpecialPass Mention (*) Substandard (#) Total
June 30, 2012Residential construction $ 3,306 $ — $ 648 $ 3,954 Lot and land development 11,511 1,131 5,789 18,431 1-4 family 359,041 1,634 22,492 383,167 Commercial real estate 268,931 15,372 42,694 326,997 Multifamily 18,220 1,176 714 20,110 Commercial loans 93,626 1,729 6,085 101,440 Consumer loans 1,940 — 3 1,943
$ 756,575 $ 21,042 $ 78,425 $ 856,042 June 30, 2011Residential construction $ 20,860 $ 465 $ 11,971 $ 33,296 Lot and land development 24,873 3,230 31,887 59,990 1-4 family 198,719 61 18,258 217,038 Commercial real estate 337,254 7,193 99,367 443,814 Multifamily 34,378 6,225 20,210 60,813 Commercial loans 155,174 4,103 13,918 173,195 Consumer loans 3,021 13 21 3,055
$ 774,279 $ 21,290 $ 195,632 $ 991,201
(*) These loans are currently protected by the current sound worth and paying capacity of the obligor, but have a potential weakness that would create a higher credit risk.(#) These loans exhibit well defined weaknesses that could jeopardize the ultimate collection of all or part of the debt. Substandard loans are inadequately protected by the current sound worth and paying capacity of the obligor or of the collateral pledged. They are characterized by the distinct possibility that the Bank will sustain some loss if the deficiencies are not corrected. Loss potential,while existing in the aggregate for substandard assets, does not have to exist in individual assets classified as “Substandard”.
F-22
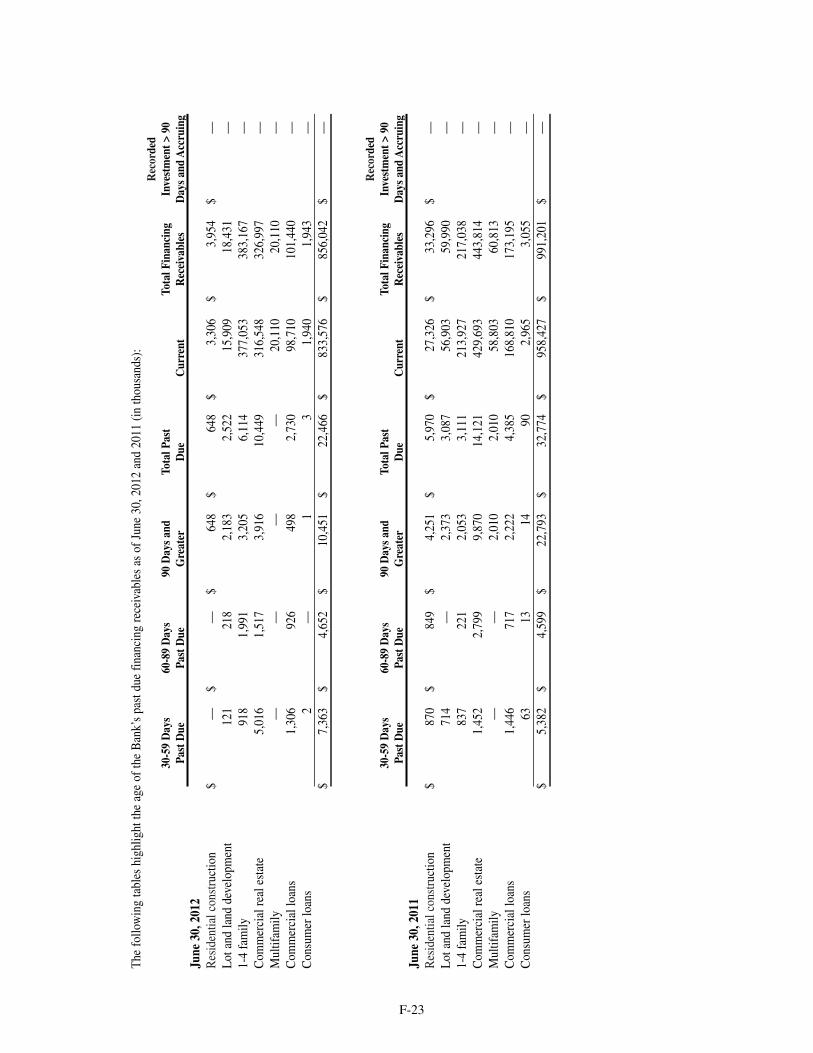
The
follo
win
g ta
bles
hig
hlig
ht th
e ag
e of
the
Ban
k’s
past
due
fina
ncin
g re
ceiv
able
s as
of J
une
30,2
012
and
2011
(in
thou
sand
s):
Rec
orde
d30
-59
Day
s60
-89
Day
s 90
Day
s an
d To
tal P
ast
Tota
l Fin
anci
ngIn
vest
men
t > 9
0Pa
st D
uePa
st D
ueG
reat
erD
ueC
urre
ntR
ecei
vabl
esD
ays
and
Acc
ruin
gJu
ne 3
0,20
12R
esid
entia
l con
stru
ctio
n $
—
$ —
$
648
$ 64
8 $
3,30
6 $
3,95
4 $
—Lo
t and
land
dev
elop
men
t 12
1 21
8 2,
183
2,52
2 15
,909
18
,431
—
1-4
fam
ily
918
1,99
1 3,
205
6,11
4 37
7,05
3 38
3,16
7 —
Com
mer
cial
real
est
ate
5,01
6 1,
517
3,91
6 10
,449
31
6,54
8 32
6,99
7 —
Mul
tifam
ily
—
—
—
—
20,1
10
20,1
10
—C
omm
erci
al lo
ans
1,30
6 92
6 49
8 2,
730
98,7
10
101,
440
—C
onsu
mer
loan
s 2
—
1 3
1,94
0 1,
943
—$
7,36
3 $
4,65
2 $
10,4
51
$ 22
,466
$
833,
576
$ 85
6,04
2 $
—
Rec
orde
d30
-59
Day
s60
-89
Day
s 90
Day
s an
d To
tal P
ast
Tota
l Fin
anci
ngIn
vest
men
t > 9
0Pa
st D
uePa
st D
ueG
reat
erD
ueC
urre
ntR
ecei
vabl
esD
ays
and
Acc
ruin
gJu
ne 3
0,20
11R
esid
entia
l con
stru
ctio
n $
870
$ 84
9 $
4,25
1 $
5,97
0 $
27,3
26
$ 33
,296
$
—Lo
t and
land
dev
elop
men
t 71
4 —
2,37
3 3,
087
56,9
03
59,9
90
—1-
4 fa
mily
83
7 22
1 2,
053
3,11
1 21
3,92
7 21
7,03
8 —
Com
mer
cial
real
est
ate
1,45
2 2,
799
9,87
0 14
,121
42
9,69
3 44
3,81
4 —
Mul
tifam
ily
—
—
2,01
0 2,
010
58,8
03
60,8
13
—C
omm
erci
al lo
ans
1,44
6 71
7 2,
222
4,38
5 16
8,81
0 17
3,19
5 —
Con
sum
er lo
ans
63
13
14
90
2,96
5 3,
055
—$
5,38
2 $
4,59
9 $
22,7
93
$ 32
,774
$
958,
427
$ 99
1,20
1 $
—
F-23
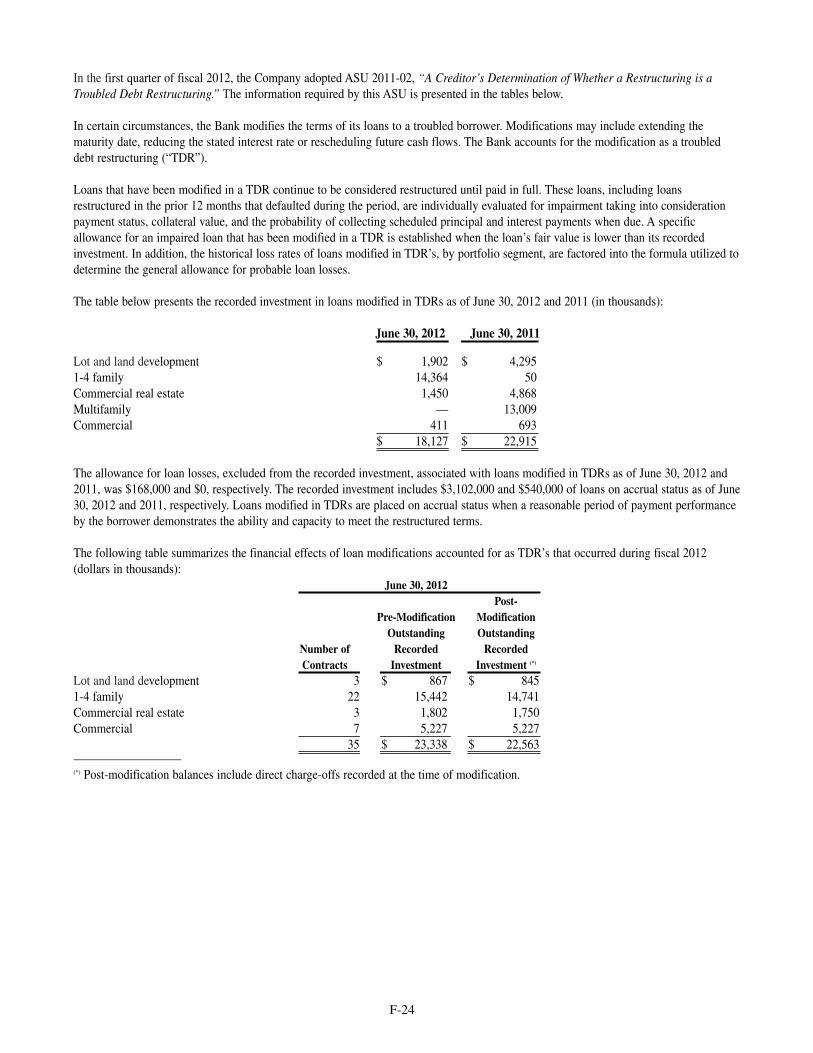
In the first quarter of fiscal 2012, the Company adopted ASU 2011-02, “A Creditor’s Determination of Whether a Restructuring is aTroubled Debt Restructuring.” The information required by this ASU is presented in the tables below.
In certain circumstances, the Bank modifies the terms of its loans to a troubled borrower. Modifications may include extending thematurity date, reducing the stated interest rate or rescheduling future cash flows. The Bank accounts for the modification as a troubleddebt restructuring (“TDR”).
Loans that have been modified in a TDR continue to be considered restructured until paid in full. These loans, including loansrestructured in the prior 12 months that defaulted during the period, are individually evaluated for impairment taking into considerationpayment status, collateral value, and the probability of collecting scheduled principal and interest payments when due. A specificallowance for an impaired loan that has been modified in a TDR is established when the loan’s fair value is lower than its recordedinvestment. In addition, the historical loss rates of loans modified in TDR’s, by portfolio segment, are factored into the formula utilized todetermine the general allowance for probable loan losses.
The table below presents the recorded investment in loans modified in TDRs as of June 30, 2012 and 2011 (in thousands):
June 30, 2012 June 30, 2011
Lot and land development $ 1,902 $ 4,2951-4 family 14,364 50 Commercial real estate 1,450 4,868 Multifamily — 13,009 Commercial 411 693
$ 18,127 $ 22,915
The allowance for loan losses, excluded from the recorded investment, associated with loans modified in TDRs as of June 30, 2012 and2011, was $168,000 and $0, respectively. The recorded investment includes $3,102,000 and $540,000 of loans on accrual status as of June30, 2012 and 2011, respectively. Loans modified in TDRs are placed on accrual status when a reasonable period of payment performanceby the borrower demonstrates the ability and capacity to meet the restructured terms.
The following table summarizes the financial effects of loan modifications accounted for as TDR’s that occurred during fiscal 2012(dollars in thousands):
June 30, 2012Post-
Pre-Modification ModificationOutstanding Outstanding
Number of Recorded RecordedContracts Investment Investment (*)
Lot and land development 3 $ 867 $ 8451-4 family 22 15,442 14,741 Commercial real estate 3 1,802 1,750 Commercial 7 5,227 5,227
35 $ 23,338 $ 22,563 —————————(*) Post-modification balances include direct charge-offs recorded at the time of modification.
F-24
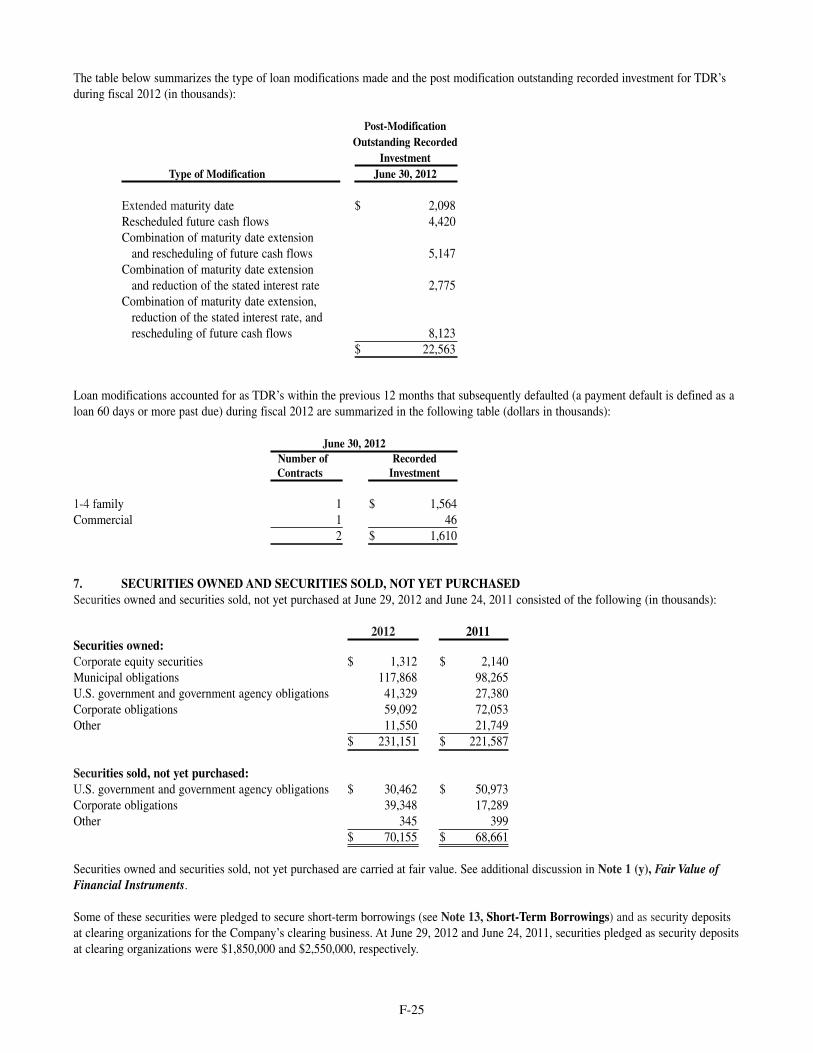
The table below summarizes the type of loan modifications made and the post modification outstanding recorded investment for TDR’sduring fiscal 2012 (in thousands):
Post-Modification Outstanding Recorded
InvestmentType of Modification June 30, 2012
Extended maturity date $ 2,098Rescheduled future cash flows 4,420 Combination of maturity date extension
and rescheduling of future cash flows 5,147 Combination of maturity date extension
and reduction of the stated interest rate 2,775 Combination of maturity date extension,
reduction of the stated interest rate, and rescheduling of future cash flows 8,123
$ 22,563
Loan modifications accounted for as TDR’s within the previous 12 months that subsequently defaulted (a payment default is defined as aloan 60 days or more past due) during fiscal 2012 are summarized in the following table (dollars in thousands):
June 30, 2012Number of Recorded Contracts Investment
1-4 family 1 $ 1,564 Commercial 1 46
2 $ 1,610
7. SECURITIES OWNED AND SECURITIES SOLD, NOT YET PURCHASEDSecurities owned and securities sold, not yet purchased at June 29, 2012 and June 24, 2011 consisted of the following (in thousands):
2012 2011Securities owned:Corporate equity securities $ 1,312 $ 2,140 Municipal obligations 117,868 98,265U.S. government and government agency obligations 41,329 27,380Corporate obligations 59,092 72,053Other 11,550 21,749
$ 231,151 $ 221,587
Securities sold, not yet purchased:U.S. government and government agency obligations $ 30,462 $ 50,973Corporate obligations 39,348 17,289Other 345 399
$ 70,155 $ 68,661
Securities owned and securities sold, not yet purchased are carried at fair value. See additional discussion in Note 1 (y), Fair Value ofFinancial Instruments.
Some of these securities were pledged to secure short-term borrowings (see Note 13, Short-Term Borrowings) and as security depositsat clearing organizations for the Company’s clearing business. At June 29, 2012 and June 24, 2011, securities pledged as security depositsat clearing organizations were $1,850,000 and $2,550,000, respectively.
F-25
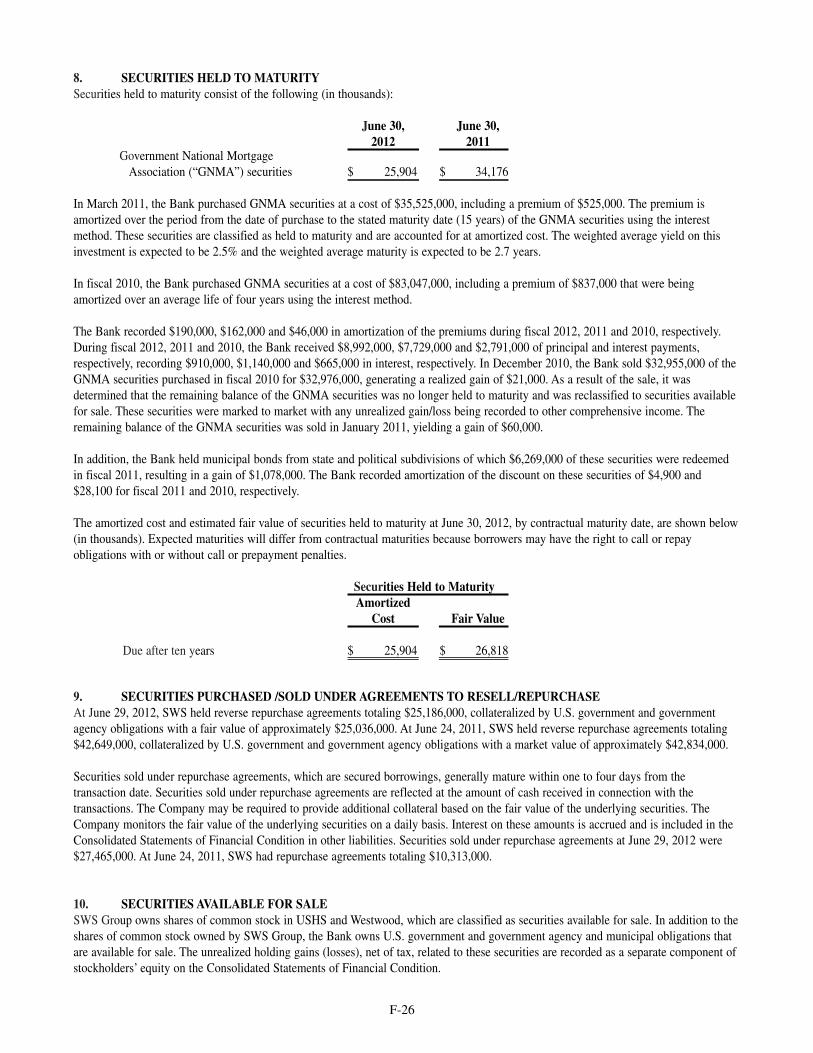
8. SECURITIES HELD TO MATURITYSecurities held to maturity consist of the following (in thousands):
June 30, June 30,2012 2011
Government National MortgageAssociation (“GNMA”) securities $ 25,904 $ 34,176
In March 2011, the Bank purchased GNMA securities at a cost of $35,525,000, including a premium of $525,000. The premium isamortized over the period from the date of purchase to the stated maturity date (15 years) of the GNMA securities using the interestmethod. These securities are classified as held to maturity and are accounted for at amortized cost. The weighted average yield on thisinvestment is expected to be 2.5% and the weighted average maturity is expected to be 2.7 years.
In fiscal 2010, the Bank purchased GNMA securities at a cost of $83,047,000, including a premium of $837,000 that were beingamortized over an average life of four years using the interest method.
The Bank recorded $190,000, $162,000 and $46,000 in amortization of the premiums during fiscal 2012, 2011 and 2010, respectively.During fiscal 2012, 2011 and 2010, the Bank received $8,992,000, $7,729,000 and $2,791,000 of principal and interest payments,respectively, recording $910,000, $1,140,000 and $665,000 in interest, respectively. In December 2010, the Bank sold $32,955,000 of theGNMA securities purchased in fiscal 2010 for $32,976,000, generating a realized gain of $21,000. As a result of the sale, it wasdetermined that the remaining balance of the GNMA securities was no longer held to maturity and was reclassified to securities availablefor sale. These securities were marked to market with any unrealized gain/loss being recorded to other comprehensive income. Theremaining balance of the GNMA securities was sold in January 2011, yielding a gain of $60,000.
In addition, the Bank held municipal bonds from state and political subdivisions of which $6,269,000 of these securities were redeemedin fiscal 2011, resulting in a gain of $1,078,000. The Bank recorded amortization of the discount on these securities of $4,900 and$28,100 for fiscal 2011 and 2010, respectively.
The amortized cost and estimated fair value of securities held to maturity at June 30, 2012, by contractual maturity date, are shown below(in thousands). Expected maturities will differ from contractual maturities because borrowers may have the right to call or repayobligations with or without call or prepayment penalties.
Securities Held to MaturityAmortized
Cost Fair Value
Due after ten years $ 25,904 $ 26,818
9. SECURITIES PURCHASED /SOLD UNDER AGREEMENTS TO RESELL/REPURCHASEAt June 29, 2012, SWS held reverse repurchase agreements totaling $25,186,000, collateralized by U.S. government and governmentagency obligations with a fair value of approximately $25,036,000. At June 24, 2011, SWS held reverse repurchase agreements totaling$42,649,000, collateralized by U.S. government and government agency obligations with a market value of approximately $42,834,000.
Securities sold under repurchase agreements, which are secured borrowings, generally mature within one to four days from thetransaction date. Securities sold under repurchase agreements are reflected at the amount of cash received in connection with thetransactions. The Company may be required to provide additional collateral based on the fair value of the underlying securities. TheCompany monitors the fair value of the underlying securities on a daily basis. Interest on these amounts is accrued and is included in theConsolidated Statements of Financial Condition in other liabilities. Securities sold under repurchase agreements at June 29, 2012 were$27,465,000. At June 24, 2011, SWS had repurchase agreements totaling $10,313,000.
10. SECURITIES AVAILABLE FOR SALESWS Group owns shares of common stock in USHS and Westwood, which are classified as securities available for sale. In addition to theshares of common stock owned by SWS Group, the Bank owns U.S. government and government agency and municipal obligations thatare available for sale. The unrealized holding gains (losses), net of tax, related to these securities are recorded as a separate component ofstockholders’ equity on the Consolidated Statements of Financial Condition.
F-26
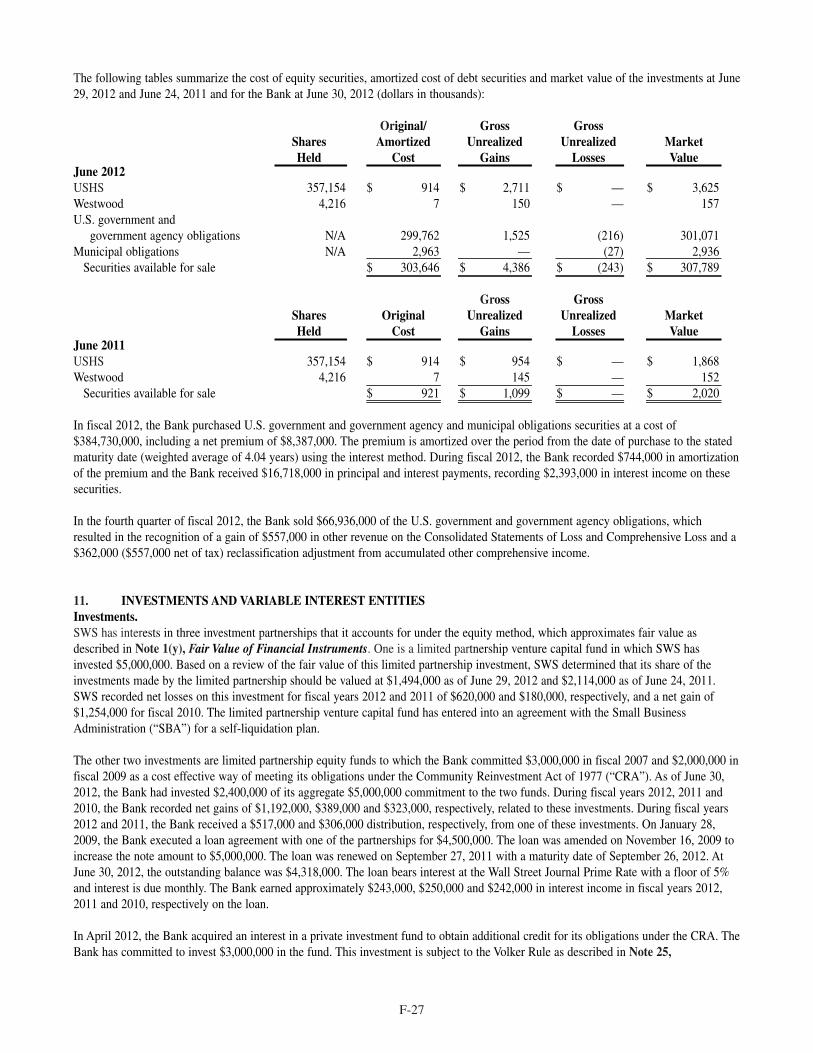
The following tables summarize the cost of equity securities, amortized cost of debt securities and market value of the investments at June29, 2012 and June 24, 2011 and for the Bank at June 30, 2012 (dollars in thousands):
Original/ Gross GrossShares Amortized Unrealized Unrealized MarketHeld Cost Gains Losses Value
June 2012USHS 357,154 $ 914 $ 2,711 $ — $ 3,625Westwood 4,216 7 150 — 157U.S. government and
government agency obligations N/A 299,762 1,525 (216) 301,071Municipal obligations N/A 2,963 — (27) 2,936
Securities available for sale $ 303,646 $ 4,386 $ (243) $ 307,789
Gross GrossShares Original Unrealized Unrealized MarketHeld Cost Gains Losses Value
June 2011USHS 357,154 $ 914 $ 954 $ — $ 1,868Westwood 4,216 7 145 — 152
Securities available for sale $ 921 $ 1,099 $ — $ 2,020
In fiscal 2012, the Bank purchased U.S. government and government agency and municipal obligations securities at a cost of$384,730,000, including a net premium of $8,387,000. The premium is amortized over the period from the date of purchase to the statedmaturity date (weighted average of 4.04 years) using the interest method. During fiscal 2012, the Bank recorded $744,000 in amortizationof the premium and the Bank received $16,718,000 in principal and interest payments, recording $2,393,000 in interest income on thesesecurities.
In the fourth quarter of fiscal 2012, the Bank sold $66,936,000 of the U.S. government and government agency obligations, whichresulted in the recognition of a gain of $557,000 in other revenue on the Consolidated Statements of Loss and Comprehensive Loss and a$362,000 ($557,000 net of tax) reclassification adjustment from accumulated other comprehensive income.
11. INVESTMENTS AND VARIABLE INTEREST ENTITIESInvestments. SWS has interests in three investment partnerships that it accounts for under the equity method, which approximates fair value asdescribed in Note 1(y), Fair Value of Financial Instruments. One is a limited partnership venture capital fund in which SWS hasinvested $5,000,000. Based on a review of the fair value of this limited partnership investment, SWS determined that its share of theinvestments made by the limited partnership should be valued at $1,494,000 as of June 29, 2012 and $2,114,000 as of June 24, 2011.SWS recorded net losses on this investment for fiscal years 2012 and 2011 of $620,000 and $180,000, respectively, and a net gain of$1,254,000 for fiscal 2010. The limited partnership venture capital fund has entered into an agreement with the Small BusinessAdministration (“SBA”) for a self-liquidation plan.
The other two investments are limited partnership equity funds to which the Bank committed $3,000,000 in fiscal 2007 and $2,000,000 infiscal 2009 as a cost effective way of meeting its obligations under the Community Reinvestment Act of 1977 (“CRA”). As of June 30,2012, the Bank had invested $2,400,000 of its aggregate $5,000,000 commitment to the two funds. During fiscal years 2012, 2011 and2010, the Bank recorded net gains of $1,192,000, $389,000 and $323,000, respectively, related to these investments. During fiscal years2012 and 2011, the Bank received a $517,000 and $306,000 distribution, respectively, from one of these investments. On January 28,2009, the Bank executed a loan agreement with one of the partnerships for $4,500,000. The loan was amended on November 16, 2009 toincrease the note amount to $5,000,000. The loan was renewed on September 27, 2011 with a maturity date of September 26, 2012. AtJune 30, 2012, the outstanding balance was $4,318,000. The loan bears interest at the Wall Street Journal Prime Rate with a floor of 5%and interest is due monthly. The Bank earned approximately $243,000, $250,000 and $242,000 in interest income in fiscal years 2012,2011 and 2010, respectively on the loan.
In April 2012, the Bank acquired an interest in a private investment fund to obtain additional credit for its obligations under the CRA. TheBank has committed to invest $3,000,000 in the fund. This investment is subject to the Volker Rule as described in Note 25,
F-27
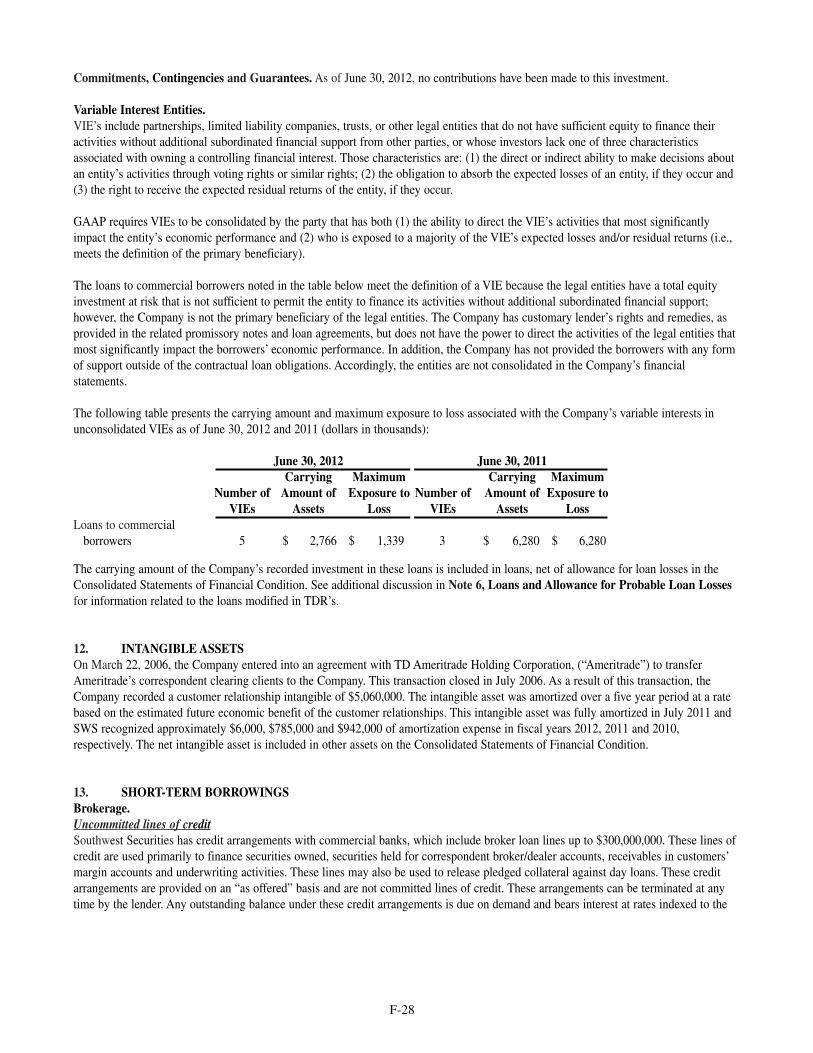
Commitments, Contingencies and Guarantees. As of June 30, 2012, no contributions have been made to this investment.
Variable Interest Entities. VIE’s include partnerships, limited liability companies, trusts, or other legal entities that do not have sufficient equity to finance theiractivities without additional subordinated financial support from other parties, or whose investors lack one of three characteristicsassociated with owning a controlling financial interest. Those characteristics are: (1) the direct or indirect ability to make decisions aboutan entity’s activities through voting rights or similar rights; (2) the obligation to absorb the expected losses of an entity, if they occur and(3) the right to receive the expected residual returns of the entity, if they occur.
GAAP requires VIEs to be consolidated by the party that has both (1) the ability to direct the VIE’s activities that most significantlyimpact the entity’s economic performance and (2) who is exposed to a majority of the VIE’s expected losses and/or residual returns (i.e.,meets the definition of the primary beneficiary).
The loans to commercial borrowers noted in the table below meet the definition of a VIE because the legal entities have a total equityinvestment at risk that is not sufficient to permit the entity to finance its activities without additional subordinated financial support;however, the Company is not the primary beneficiary of the legal entities. The Company has customary lender’s rights and remedies, asprovided in the related promissory notes and loan agreements, but does not have the power to direct the activities of the legal entities thatmost significantly impact the borrowers’ economic performance. In addition, the Company has not provided the borrowers with any formof support outside of the contractual loan obligations. Accordingly, the entities are not consolidated in the Company’s financialstatements.
The following table presents the carrying amount and maximum exposure to loss associated with the Company’s variable interests inunconsolidated VIEs as of June 30, 2012 and 2011 (dollars in thousands):
June 30, 2012 June 30, 2011Carrying Maximum Carrying Maximum
Number of Amount of Exposure to Number of Amount of Exposure toVIEs Assets Loss VIEs Assets Loss
Loans to commercial borrowers 5 $ 2,766 $ 1,339 3 $ 6,280 $ 6,280
The carrying amount of the Company’s recorded investment in these loans is included in loans, net of allowance for loan losses in theConsolidated Statements of Financial Condition. See additional discussion in Note 6, Loans and Allowance for Probable Loan Lossesfor information related to the loans modified in TDR’s.
12. INTANGIBLE ASSETSOn March 22, 2006, the Company entered into an agreement with TD Ameritrade Holding Corporation, (“Ameritrade”) to transferAmeritrade’s correspondent clearing clients to the Company. This transaction closed in July 2006. As a result of this transaction, theCompany recorded a customer relationship intangible of $5,060,000. The intangible asset was amortized over a five year period at a ratebased on the estimated future economic benefit of the customer relationships. This intangible asset was fully amortized in July 2011 andSWS recognized approximately $6,000, $785,000 and $942,000 of amortization expense in fiscal years 2012, 2011 and 2010,respectively. The net intangible asset is included in other assets on the Consolidated Statements of Financial Condition.
13. SHORT-TERM BORROWINGS Brokerage. Uncommitted lines of creditSouthwest Securities has credit arrangements with commercial banks, which include broker loan lines up to $300,000,000. These lines ofcredit are used primarily to finance securities owned, securities held for correspondent broker/dealer accounts, receivables in customers’margin accounts and underwriting activities. These lines may also be used to release pledged collateral against day loans. These creditarrangements are provided on an “as offered” basis and are not committed lines of credit. These arrangements can be terminated at anytime by the lender. Any outstanding balance under these credit arrangements is due on demand and bears interest at rates indexed to the
F-28
federal funds rate (0.09% at June 29, 2012 and 0.08% at June 24, 2011). The total amount of borrowings available under these lines ofcredit is reduced by the amount available under the options trading unsecured letter of credit, referenced below. At June 29, 2012, theamount outstanding under these secured arrangements was $22,500,000, which was collateralized by securities held for firm accountsvalued at $80,125,000. At June 24, 2011, the amount outstanding under these secured arrangements was $72,000,000, which wascollateralized by securities held for firm accounts valued at $111,521,000.
At June 29, 2012 and June 24, 2011, Southwest Securities had a $20,000,000 unsecured line of credit that is due on demand and bearsinterest at rates indexed to the federal funds rate. This credit arrangement is provided on an “as offered” basis and is not a committed lineof credit. The total amount of borrowings available under this line of credit is reduced by the amount outstanding on the line and underany unsecured letters of credit at the time of borrowing. At June 29, 2012, there were no amounts outstanding on this line. At June 24,2011, there were no amounts outstanding on this line, other than the $250,000 under unsecured letters of credit referenced below. At June29, 2012 and June 24, 2011, the total amount available for borrowing was $20,000,000 and $19,750,000, respectively.
On June 29, 2012, Southwest Securities entered into an agreement with an unaffiliated bank for a $75,000,000 secured, uncommittedrevolving credit facility that is due on demand and bears interest at a rate mutually agreed upon at the time of borrowing. All or a portionof the facility may be available for intra-day loan purposes (“Day Loans”). All Day Loans are payable on the day they are made. Interestis payable monthly and computed on the basis of 360 days for the actual number of days elapsed. One day of interest will accrue on DayLoans on the day they are made at a per annum rate of 1% per annum.
Committed lines of creditOn January 28, 2011, Southwest Securities entered into an agreement with an unaffiliated bank for a $45,000,000 committed revolvingcredit facility. The commitment fee is 37.5 basis points per annum, and when drawn, the interest rate is equal to the federal funds rateplus 75 basis points. The agreement provides that Southwest Securities must maintain a tangible net worth of at least $150,000,000. InJanuary 2012, the agreement was renewed amending the interest rate when drawn to the federal funds rate plus 125 basis points. As ofJune 29, 2012 and June 24, 2011, there was $45,000,000 and $38,000,000, respectively, outstanding under the committed revolving creditfacility. The secured borrowing was collateralized by securities with a value of $71,277,000 and $61,788,000 at June 29, 2012 and June24, 2011, respectively.
Unsecured letters of creditAt June 24, 2011, SWS had $250,000 outstanding under unsecured letters of credit pledged to support SWS’s open positions withsecurities clearing organizations. The letters of credit had a 1% commitment fee, were renewable semi-annually and expired in October2011.
At both June 29, 2012 and June 24, 2011, SWS had an irrevocable letter of credit agreement pledged to support customer open optionspositions with an options clearing organization. Until drawn, the letter of credit bears interest at a rate of 0.5% per annum and isrenewable semi-annually. If drawn, the letter of credit bears interest at a rate of 0.5% per annum plus a fee. At June 29, 2012 and June 24,2011, the maximum amount available under this letter of credit agreement was $75,000,000. At June 29, 2012 and June 24, 2011, theCompany had outstanding, undrawn letters of credit of $63,000,000 and $65,000,000, respectively, bearing interest at a rate of 0.5% perannum. The letter of credit agreement was fully collateralized by marketable securities held in client and non-client margin accounts witha value of $86,107,000 and $95,987,000 at June 29, 2012 and June 24, 2011, respectively.
In addition to using customer securities to collateralize short-term borrowings, SWS also loans client securities as collateral inconjunction with SWS’s securities lending activities. At June 29, 2012, approximately $335,453,000 of client securities under customermargin loans was available to be pledged, of which SWS had pledged $38,870,000 under securities loan agreements. At June 24, 2011,approximately $319,885,000 of client securities under customer margin loans was available to be pledged, of which SWS had pledged$35,181,000 under securities loan agreements.
Banking. In the second quarter of fiscal 2010, the Bank entered into a secured line of credit agreement with the Federal Reserve Bank of Dallas.This line of credit is secured by the Bank’s commercial loan portfolio. This line is due on demand and bears interest at a rate equal to thefederal funds target rate plus 100 basis points. At June 30, 2012 and June 30, 2011, the total amount available under this line was$61,956,000 and $82,595,000, respectively. There was no amount outstanding at June 30, 2012 and 2011.
F-29
14. DEPOSITSBank core deposits at June 30, 2012 and 2011 were as follows (dollars in thousands):
2012 2011Amount Percent Amount Percent
Noninterest bearing demand accounts $ 55,403 5.2% $ 69,131 6.3%Interest bearing demand accounts 8,862 0.8 10,288 0.9Savings accounts 934,636 88.0 952,775 86.1Limited access money market accounts 26,232 2.5 25,961 2.4Certificates of deposit, less than $100,000 21,680 2.0 27,002 2.4Certificates of deposit, $100,000 and greater 15,420 1.5 21,314 1.9
$ 1,062,233 100.0% $ 1,106,471 100.0%
The year to date weighted average interest rate on deposits was approximately 0.07% and 0.13% at June 30, 2012 and 2011, respectively.
At June 30, 2012, scheduled maturities of certificates of deposit were as follows (in thousands):
2013 2014 2015 2016 2017 Total
Certificates of deposit, less than $100,000 $ 15,590 $ 2,073 $ 3,419 $ 312 $ 286 $ 21,680Certificates of deposit, $100,000 and greater 10,650 1,197 3,147 225 201 15,420
$ 26,240 $ 3,270 $ 6,566 $ 537 $ 487 $ 37,100
The Bank is funded primarily by core deposits, with interest bearing savings accounts from Southwest Securities’ customers making up asignificant source of these deposits.
15. ADVANCES FROM THE FEDERAL HOME LOAN BANKAt June 30, 2012 and 2011, advances from the FHLB were due according to contractual maturities as follows (in thousands):
2012 2011Maturity:
Due in one year $ 9,267 $ 8,465Due in two years 26,491 14,987Due in five years 6,721 34,081Due in seven years 4,850 4,803Due in ten years 8,304 7,218Due in twenty years 13,008 25,158
$ 68,641 $ 94,712
The advances from the FHLB had interest rates ranging from 2% to 7% and were collateralized by approximately $382,000,000 ofcollateral in qualifying loans at June 30, 2012 (calculated at March 31, 2012). The weighted average interest rate was 4.4% at June 30,2012. At June 30, 2011 (calculated at March 31, 2011), the advances from the FHLB had interest rates from 2% to 7% and werecollateralized by approximately $354,000,000 of collateral value in qualifying loans. The weighted average interest rate was 4.6% at June30, 2011.
At June 30, 2012, the Bank had net borrowing capacity with the FHLB of $313,634,000.
16. DEBT ISSUED WITH STOCK PURCHASE WARRANTSOn March 20, 2011, the Company entered into a Funding Agreement with Hilltop and Oak Hill. On July 29, 2011, after receipt ofstockholder and regulatory approval, the Company completed the following transactions contemplated by the Funding Agreement:
• entered into a $100,000,000, five year, unsecured loan from Hilltop and Oak Hill under the terms of a credit agreement;• issued Warrants to Hilltop and Oak Hill for the purchase of up to 17,391,304 shares of the Company’s common stock; and
F-30

• granted Hilltop and Oak Hill certain rights, including certain registration rights, preemptive rights, and the right for each to appointone person to the Company’s Board of Directors for so long as each owns 9.9% or more of all of the outstanding shares of theCompany’s common stock or securities convertible into at least 9.9% of the Company’s outstanding common stock.
In connection with the loans made by Hilltop and Oak Hill under the credit agreement, the Company issued a warrant to Hilltop topurchase up to 8,695,652 shares of common stock (and in certain cases described below, shares of Non-Voting Perpetual ParticipatingPreferred Stock, Series (the “Series A Preferred Stock”) and warrants to Oak Hill to purchase up to 8,695,652 shares of common stock(and in certain cases described below, shares of Series A Preferred Stock). These Warrants are exercisable for five years and have a fixedexercise price of $5.75 per share, subject to standard anti-dilution adjustments for extraordinary corporate transactions, such as stocksplits, dividends and combinations, the issuance of stock purchase rights, debt or asset distributions (including cash), tender offers orexchange offers and entry into certain business combinations. In addition, the Warrants have a weighted average anti-dilution adjustmentfor the Company’s issuance of common stock at less than 90% of the market price of the common stock on the date prior to the pricing ofsuch shares. For each of Hilltop and Oak Hill, the Warrants represent approximately 17% of the Company’s common stock as of June 29,2012 (assuming that each of Hilltop and Oak Hill exercises its Warrant in full).
The Warrants provide that the Company would only issue shares of Series A Preferred Stock upon the exercise of the Warrants if it isnecessary to prevent Hilltop or Oak Hill from owning or being deemed to own shares of the Company’s common stock in excess of the“Ownership Limit” provided in the Warrants. The “Ownership Limit” is 24.9% of any class of the securities of the Company or such levelthat Hilltop or Oak Hill reasonably determines would prevent them being deemed to control the Company for purposes of the federalbanking laws and regulations specified in the Warrants. No shares of Series A Preferred Stock are issued or outstanding at June 29, 2012.See additional discussion concerning the Series A Preferred Stock in Note 21, Preferred Stock.
The Warrants are recorded as a liability in the Consolidated Statements of Financial Condition at fair value. Initial valuation of theWarrants using a binomial valuation model and a closing stock price of $5.45 per share indicated a fair value of $24,136,000. At June 29,2012, the Warrants were valued at $27,810,000. The change in fair value for fiscal year 2012 of $3,674,000 was recorded as an unrealizedloss on Warrants valuation, on the Consolidated Statements of Loss and Comprehensive Loss. The Warrants are classified as Level 3 inthe fair value hierarchy as disclosed in Note 27, Fair Value of Financial Instruments.
The loan is recorded as a liability with an 8% interest rate, a five year term and an effective interest rate of 14.9%. The discount on theloan was initially valued at $24,136,000 and is being accreted using the effective interest method. For fiscal year 2012, the Companyrecorded $3,212,000 in accretion expense on the discount, resulting in a total long-term debt balance of $79,076,000. For fiscal year2012, interest expense on the loan paid to Hilltop and Oak Hill was $7,355,000.
Legal and accounting fees, printing costs and other expenses associated with the loan and Warrants totaled $2,459,000 and are beingamortized on a straight-line method over the term of the loan. For fiscal year 2012, interest expense charged to operations was $451,000.
Total interest expense recorded for fiscal 2012 on the Consolidated Statements of Loss and Comprehensive Loss was $11,018,000.
The credit agreement contains customary covenants which require the Company to, among other things:• maintain a tangible net worth at least equal to the sum of $275,000,000 and 20% of cumulative consolidated net income (as
defined in the credit agreement) for each fiscal quarter for which consolidated net income is positive; • maintain a minimum unrestricted cash balance (as defined in the credit agreement) of at least $4,000,000;• maintain an excess net capital balance at Southwest Securities of at least $100,000,000 as of the end of each calendar month; and• adhere to the requirements of the Order.
In addition, the covenants limit the Company’s and certain of the Company’s subsidiaries’ ability to, among other things:• incur additional indebtedness;• dispose of or acquire certain assets;• pay dividends on the Company’s capital stock;• make investments, including acquisitions; and• enter into transactions with affiliates.
During the first quarter of fiscal 2012, the Company defaulted on two of the provisions of the credit agreement. Specifically, the Companybreached the representation and warranty that the Company’s financial statements were prepared in accordance with GAAP due to theCompany’s restatement of its quarterly financial statements resulting from an error in the application of GAAP with respect to the Bank’streatment of mortgage purchase loans held for sale. The Company requested and received a waiver of this event of default. The secondevent of default arose as a result of a late payment of interest. The credit agreement requires interest payments on the loans to be paid the
F-31
last day of each of March, June, September and December. The first payment, which was due September 30, 2011, was paid on October11, 2011, six business days after the required payment date. As a result of this event of default, the Company requested and received awaiver. There were no events of default for the remainder of fiscal 2012.
Should the Company determine it needs additional debt at SWS Group, the Company would require regulatory approval and approvalfrom Hilltop and Oak Hill.
17. INCOME TAXES Income tax benefit for fiscal years 2012, 2011 and 2010 (effective rate of 20.4% in fiscal 2012, 30.6% in fiscal 2011 and 36.4% in fiscal2010) differs from the amount that would otherwise have been calculated by applying the federal corporate tax rate (35% in fiscal years2012, 2011 and 2010) to income (loss) from continuing operations before income tax expense (benefit) and is comprised of the following(in thousands):
2012 2011 2010
Income tax benefit at the statutory rate $ (2,079) $ (11,709) $ (1,593) Tax exempt interest (872) (892) (782)Tax exempt expense (income) from company-owned
life insurance (“COLI”) 74 (483) (373)State income taxes, net of federal tax benefit 284 272 1,069Non-deductible meals and entertainment 189 160 274Non-deductible compensation 1,234 1,050 —Valuation allowance 28 844 —Other, net (69) 507 (254)
$ (1,211) $ (10,251) $ (1,659)
Income taxes as set forth in the Consolidated Statements of Loss and Comprehensive Loss consisted of the following components (inthousands):
2012 2011 2010Current
Federal $ (10,402) $ (7,979) $ 4,383State 140 921 2,303
(10,262) (7,058) 6,686Deferred
Federal $ 8,777 $ (2,923) $ (7,395)State 274 (270) (950)
9,051 (3,193) (8,345)Total income tax benefit $ (1,211) $ (10,251) $ (1,659)
F-32
The tax effects of temporary differences that give rise to the deferred tax assets and deferred tax liabilities as of June 29, 2012 and June24, 2011 are presented below (in thousands):
2012 2011Deferred tax assets:
Employee compensation plans $ 12,704 $ 12,711Allowance for probable loan losses 7,131 16,735Bad debt reserve 2,078 1,709Deferred rent 1,608 1,659Deferred income on loans 582 508Investment in unconsolidated ventures 915 128Long-term debt 1,262 —State taxes 1,152 1,426Other 645 690
Gross deferred tax assets 28,077 35,566Valuation allowance (872) (844)
Net deferred tax assets 27,205 34,722
Deferred tax liabilities:Securities available for sale (1,462) (398)Extraordinary gain related to the M.L. Stern &
Co., LLC acquisition (239) (239)Fixed assets, net (668) (440)REO (387) —Investment in unconsolidated ventures (742) —Other (56) (66)
Total gross deferred tax liabilities (3,554) (1,143)Net deferred tax assets – included in other assets
on the Consolidated Statements of Financial Condition $ 23,651 $ 33,579
As of June 29, 2012, the Company’s deferred tax assets included $915,000 related to capital losses from investments in variouspartnership assets. To use these deferred tax assets, the Company must generate sufficient capital gain income within the carry-back andcarry-forward period available under the tax law. As of June 29, 2012, the Company did not believe it was more likely than not that itwould generate sufficient capital gain income to offset all of these capital losses. Accordingly, the Company has an $872,000 valuationallowance to reflect the amount of the deferred tax assets that it believes is more likely than not to not be recognized. The valuationallowance increased $28,000 from June 24, 2011 as a result of receiving additional valuation information about these investments.
A reconciliation of the beginning and ending amounts of the net liability for uncertain tax positions is as follows (in thousands):
June 29, 2012 June 29, 2012 June 29, 2012
Balance at the beginning of the year $ 1,394 $ 1,121 $ 1,160 Increases as a result of tax positions taken
during prior years 551 168 188 Increases as a result of tax positions taken during
the current period 71 32 228 Decreases as a result of tax positions taken during
prior years (558) (47) (161)Decreases as a result of tax positions taken during
the current period — (45) (331)Lapse of applicable statute of limitations (99) 399 79Settlements (234) (234) (42)Balance at the end of the year $ 1,125 $ 1,394 $ 1,121
F-33
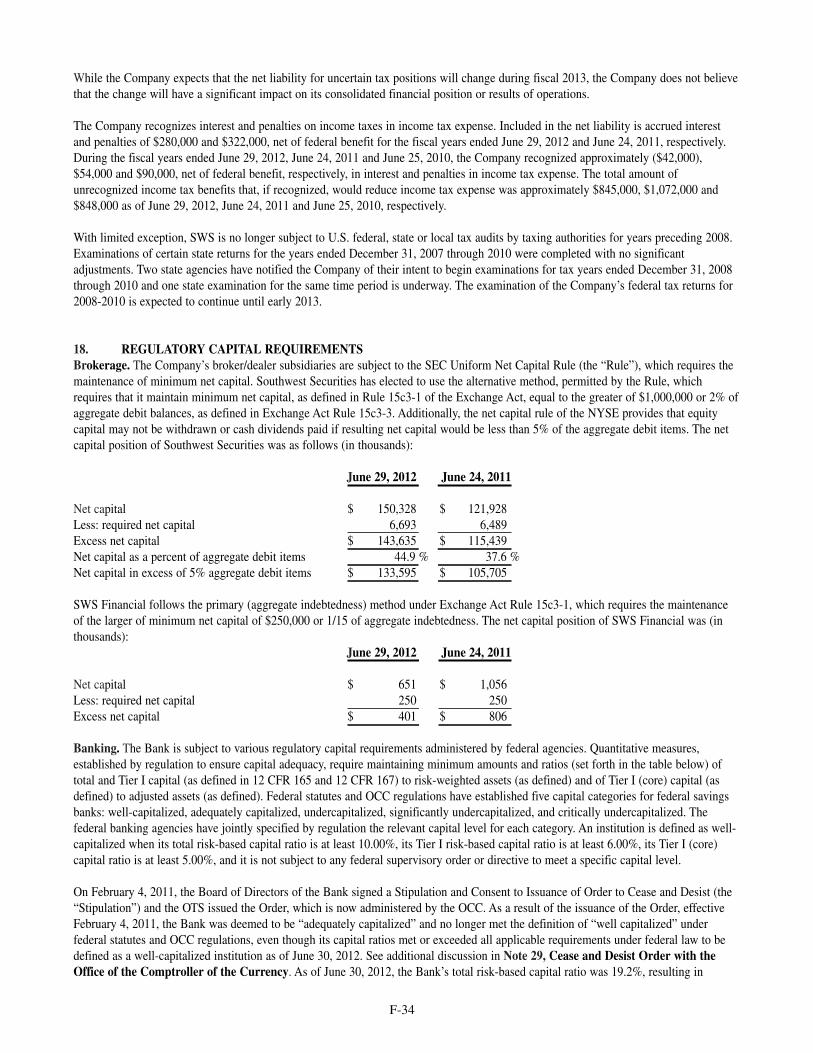
While the Company expects that the net liability for uncertain tax positions will change during fiscal 2013, the Company does not believethat the change will have a significant impact on its consolidated financial position or results of operations.
The Company recognizes interest and penalties on income taxes in income tax expense. Included in the net liability is accrued interestand penalties of $280,000 and $322,000, net of federal benefit for the fiscal years ended June 29, 2012 and June 24, 2011, respectively.During the fiscal years ended June 29, 2012, June 24, 2011 and June 25, 2010, the Company recognized approximately ($42,000),$54,000 and $90,000, net of federal benefit, respectively, in interest and penalties in income tax expense. The total amount ofunrecognized income tax benefits that, if recognized, would reduce income tax expense was approximately $845,000, $1,072,000 and$848,000 as of June 29, 2012, June 24, 2011 and June 25, 2010, respectively.
With limited exception, SWS is no longer subject to U.S. federal, state or local tax audits by taxing authorities for years preceding 2008.Examinations of certain state returns for the years ended December 31, 2007 through 2010 were completed with no significantadjustments. Two state agencies have notified the Company of their intent to begin examinations for tax years ended December 31, 2008through 2010 and one state examination for the same time period is underway. The examination of the Company’s federal tax returns for2008-2010 is expected to continue until early 2013.
18. REGULATORY CAPITAL REQUIREMENTSBrokerage. The Company’s broker/dealer subsidiaries are subject to the SEC Uniform Net Capital Rule (the “Rule”), which requires themaintenance of minimum net capital. Southwest Securities has elected to use the alternative method, permitted by the Rule, whichrequires that it maintain minimum net capital, as defined in Rule 15c3-1 of the Exchange Act, equal to the greater of $1,000,000 or 2% ofaggregate debit balances, as defined in Exchange Act Rule 15c3-3. Additionally, the net capital rule of the NYSE provides that equitycapital may not be withdrawn or cash dividends paid if resulting net capital would be less than 5% of the aggregate debit items. The netcapital position of Southwest Securities was as follows (in thousands):
June 29, 2012 June 24, 2011
Net capital $ 150,328 $ 121,928Less: required net capital 6,693 6,489Excess net capital $ 143,635 $ 115,439Net capital as a percent of aggregate debit items 44.9 % 37.6 %Net capital in excess of 5% aggregate debit items $ 133,595 $ 105,705
SWS Financial follows the primary (aggregate indebtedness) method under Exchange Act Rule 15c3-1, which requires the maintenanceof the larger of minimum net capital of $250,000 or 1/15 of aggregate indebtedness. The net capital position of SWS Financial was (inthousands):
June 29, 2012 June 24, 2011
Net capital $ 651 $ 1,056Less: required net capital 250 250Excess net capital $ 401 $ 806
Banking. The Bank is subject to various regulatory capital requirements administered by federal agencies. Quantitative measures,established by regulation to ensure capital adequacy, require maintaining minimum amounts and ratios (set forth in the table below) oftotal and Tier I capital (as defined in 12 CFR 165 and 12 CFR 167) to risk-weighted assets (as defined) and of Tier I (core) capital (asdefined) to adjusted assets (as defined). Federal statutes and OCC regulations have established five capital categories for federal savingsbanks: well-capitalized, adequately capitalized, undercapitalized, significantly undercapitalized, and critically undercapitalized. Thefederal banking agencies have jointly specified by regulation the relevant capital level for each category. An institution is defined as well-capitalized when its total risk-based capital ratio is at least 10.00%, its Tier I risk-based capital ratio is at least 6.00%, its Tier I (core)capital ratio is at least 5.00%, and it is not subject to any federal supervisory order or directive to meet a specific capital level.
On February 4, 2011, the Board of Directors of the Bank signed a Stipulation and Consent to Issuance of Order to Cease and Desist (the“Stipulation”) and the OTS issued the Order, which is now administered by the OCC. As a result of the issuance of the Order, effectiveFebruary 4, 2011, the Bank was deemed to be “adequately capitalized” and no longer met the definition of “well capitalized” underfederal statutes and OCC regulations, even though its capital ratios met or exceeded all applicable requirements under federal law to bedefined as a well-capitalized institution as of June 30, 2012. See additional discussion in Note 29, Cease and Desist Order with theOffice of the Comptroller of the Currency. As of June 30, 2012, the Bank’s total risk-based capital ratio was 19.2%, resulting in
F-34
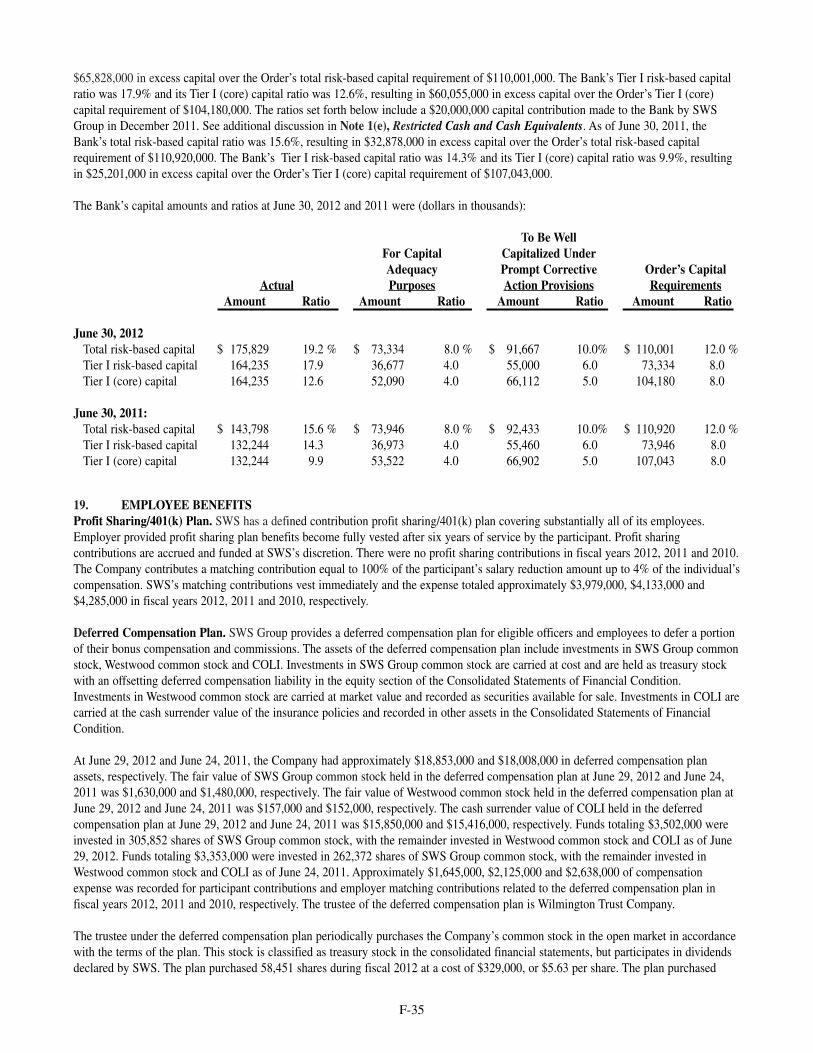
$65,828,000 in excess capital over the Order’s total risk-based capital requirement of $110,001,000. The Bank’s Tier I risk-based capitalratio was 17.9% and its Tier I (core) capital ratio was 12.6%, resulting in $60,055,000 in excess capital over the Order’s Tier I (core)capital requirement of $104,180,000. The ratios set forth below include a $20,000,000 capital contribution made to the Bank by SWSGroup in December 2011. See additional discussion in Note 1(e), Restricted Cash and Cash Equivalents. As of June 30, 2011, theBank’s total risk-based capital ratio was 15.6%, resulting in $32,878,000 in excess capital over the Order’s total risk-based capitalrequirement of $110,920,000. The Bank’s Tier I risk-based capital ratio was 14.3% and its Tier I (core) capital ratio was 9.9%, resultingin $25,201,000 in excess capital over the Order’s Tier I (core) capital requirement of $107,043,000.
The Bank’s capital amounts and ratios at June 30, 2012 and 2011 were (dollars in thousands):
To Be WellFor Capital Capitalized UnderAdequacy Prompt Corrective Order’s Capital
Actual Purposes Action Provisions RequirementsAmount Ratio Amount Ratio Amount Ratio Amount Ratio
June 30, 2012Total risk-based capital $ 175,829 19.2 % $ 73,334 8.0 % $ 91,667 10.0% $ 110,001 12.0 %Tier I risk-based capital 164,235 17.9 36,677 4.0 55,000 6.0 73,334 8.0Tier I (core) capital 164,235 12.6 52,090 4.0 66,112 5.0 104,180 8.0
June 30, 2011:Total risk-based capital $ 143,798 15.6 % $ 73,946 8.0 % $ 92,433 10.0% $ 110,920 12.0 %Tier I risk-based capital 132,244 14.3 36,973 4.0 55,460 6.0 73,946 8.0Tier I (core) capital 132,244 9.9 53,522 4.0 66,902 5.0 107,043 8.0
19. EMPLOYEE BENEFITS Profit Sharing/401(k) Plan. SWS has a defined contribution profit sharing/401(k) plan covering substantially all of its employees.Employer provided profit sharing plan benefits become fully vested after six years of service by the participant. Profit sharingcontributions are accrued and funded at SWS’s discretion. There were no profit sharing contributions in fiscal years 2012, 2011 and 2010.The Company contributes a matching contribution equal to 100% of the participant’s salary reduction amount up to 4% of the individual’scompensation. SWS’s matching contributions vest immediately and the expense totaled approximately $3,979,000, $4,133,000 and$4,285,000 in fiscal years 2012, 2011 and 2010, respectively.
Deferred Compensation Plan. SWS Group provides a deferred compensation plan for eligible officers and employees to defer a portionof their bonus compensation and commissions. The assets of the deferred compensation plan include investments in SWS Group commonstock, Westwood common stock and COLI. Investments in SWS Group common stock are carried at cost and are held as treasury stockwith an offsetting deferred compensation liability in the equity section of the Consolidated Statements of Financial Condition.Investments in Westwood common stock are carried at market value and recorded as securities available for sale. Investments in COLI arecarried at the cash surrender value of the insurance policies and recorded in other assets in the Consolidated Statements of FinancialCondition.
At June 29, 2012 and June 24, 2011, the Company had approximately $18,853,000 and $18,008,000 in deferred compensation planassets, respectively. The fair value of SWS Group common stock held in the deferred compensation plan at June 29, 2012 and June 24,2011 was $1,630,000 and $1,480,000, respectively. The fair value of Westwood common stock held in the deferred compensation plan atJune 29, 2012 and June 24, 2011 was $157,000 and $152,000, respectively. The cash surrender value of COLI held in the deferredcompensation plan at June 29, 2012 and June 24, 2011 was $15,850,000 and $15,416,000, respectively. Funds totaling $3,502,000 wereinvested in 305,852 shares of SWS Group common stock, with the remainder invested in Westwood common stock and COLI as of June29, 2012. Funds totaling $3,353,000 were invested in 262,372 shares of SWS Group common stock, with the remainder invested inWestwood common stock and COLI as of June 24, 2011. Approximately $1,645,000, $2,125,000 and $2,638,000 of compensationexpense was recorded for participant contributions and employer matching contributions related to the deferred compensation plan infiscal years 2012, 2011 and 2010, respectively. The trustee of the deferred compensation plan is Wilmington Trust Company.
The trustee under the deferred compensation plan periodically purchases the Company’s common stock in the open market in accordancewith the terms of the plan. This stock is classified as treasury stock in the consolidated financial statements, but participates in dividendsdeclared by SWS. The plan purchased 58,451 shares during fiscal 2012 at a cost of $329,000, or $5.63 per share. The plan purchased
F-35
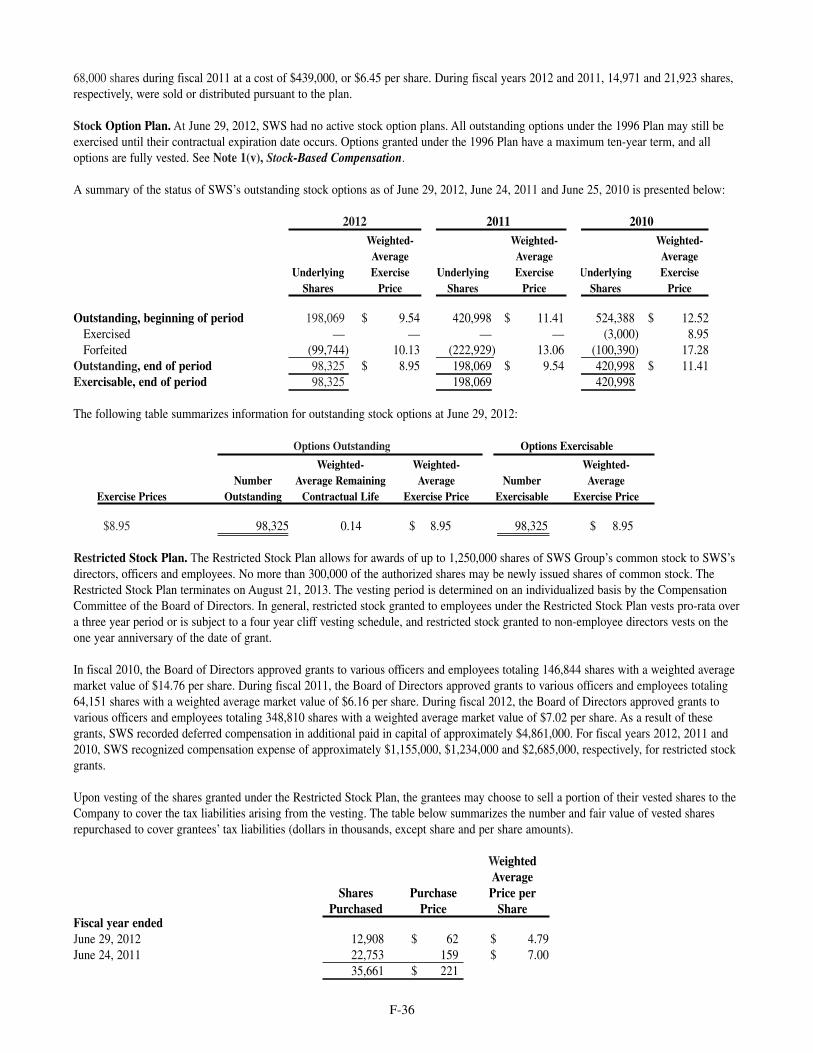
68,000 shares during fiscal 2011 at a cost of $439,000, or $6.45 per share. During fiscal years 2012 and 2011, 14,971 and 21,923 shares,respectively, were sold or distributed pursuant to the plan.
Stock Option Plan. At June 29, 2012, SWS had no active stock option plans. All outstanding options under the 1996 Plan may still beexercised until their contractual expiration date occurs. Options granted under the 1996 Plan have a maximum ten-year term, and alloptions are fully vested. See Note 1(v), Stock-Based Compensation.
A summary of the status of SWS’s outstanding stock options as of June 29, 2012, June 24, 2011 and June 25, 2010 is presented below:
2012 2011 2010Weighted- Weighted- Weighted-Average Average Average
Underlying Exercise Underlying Exercise Underlying Exercise Shares Price Shares Price Shares Price
Outstanding, beginning of period 198,069 $ 9.54 420,998 $ 11.41 524,388 $ 12.52 Exercised — — — — (3,000) 8.95Forfeited (99,744) 10.13 (222,929) 13.06 (100,390) 17.28
Outstanding, end of period 98,325 $ 8.95 198,069 $ 9.54 420,998 $ 11.41Exercisable, end of period 98,325 198,069 420,998
The following table summarizes information for outstanding stock options at June 29, 2012:
Options Outstanding Options Exercisable
Weighted- Weighted- Weighted-Number Average Remaining Average Number Average
Exercise Prices Outstanding Contractual Life Exercise Price Exercisable Exercise Price
$8.95 98,325 0.14 $ 8.95 98,325 $ 8.95
Restricted Stock Plan. The Restricted Stock Plan allows for awards of up to 1,250,000 shares of SWS Group’s common stock to SWS’sdirectors, officers and employees. No more than 300,000 of the authorized shares may be newly issued shares of common stock. TheRestricted Stock Plan terminates on August 21, 2013. The vesting period is determined on an individualized basis by the CompensationCommittee of the Board of Directors. In general, restricted stock granted to employees under the Restricted Stock Plan vests pro-rata overa three year period or is subject to a four year cliff vesting schedule, and restricted stock granted to non-employee directors vests on theone year anniversary of the date of grant.
In fiscal 2010, the Board of Directors approved grants to various officers and employees totaling 146,844 shares with a weighted averagemarket value of $14.76 per share. During fiscal 2011, the Board of Directors approved grants to various officers and employees totaling64,151 shares with a weighted average market value of $6.16 per share. During fiscal 2012, the Board of Directors approved grants tovarious officers and employees totaling 348,810 shares with a weighted average market value of $7.02 per share. As a result of thesegrants, SWS recorded deferred compensation in additional paid in capital of approximately $4,861,000. For fiscal years 2012, 2011 and2010, SWS recognized compensation expense of approximately $1,155,000, $1,234,000 and $2,685,000, respectively, for restricted stockgrants.
Upon vesting of the shares granted under the Restricted Stock Plan, the grantees may choose to sell a portion of their vested shares to theCompany to cover the tax liabilities arising from the vesting. The table below summarizes the number and fair value of vested sharesrepurchased to cover grantees’ tax liabilities (dollars in thousands, except share and per share amounts).
WeightedAverage
Shares Purchase Price perPurchased Price Share
Fiscal year endedJune 29, 2012 12,908 $ 62 $ 4.79June 24, 2011 22,753 159 $ 7.00
35,661 $ 221
F-36
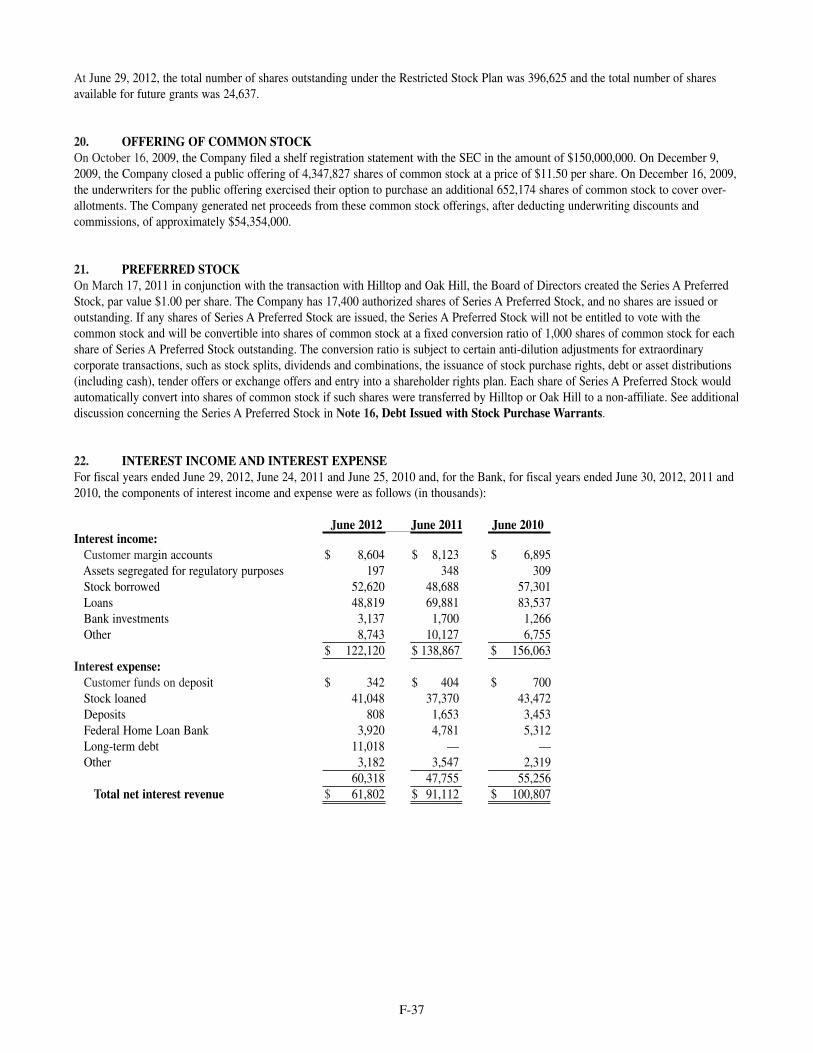
At June 29, 2012, the total number of shares outstanding under the Restricted Stock Plan was 396,625 and the total number of sharesavailable for future grants was 24,637.
20. OFFERING OF COMMON STOCKOn October 16, 2009, the Company filed a shelf registration statement with the SEC in the amount of $150,000,000. On December 9,2009, the Company closed a public offering of 4,347,827 shares of common stock at a price of $11.50 per share. On December 16, 2009,the underwriters for the public offering exercised their option to purchase an additional 652,174 shares of common stock to cover over-allotments. The Company generated net proceeds from these common stock offerings, after deducting underwriting discounts andcommissions, of approximately $54,354,000.
21. PREFERRED STOCKOn March 17, 2011 in conjunction with the transaction with Hilltop and Oak Hill, the Board of Directors created the Series A PreferredStock, par value $1.00 per share. The Company has 17,400 authorized shares of Series A Preferred Stock, and no shares are issued oroutstanding. If any shares of Series A Preferred Stock are issued, the Series A Preferred Stock will not be entitled to vote with thecommon stock and will be convertible into shares of common stock at a fixed conversion ratio of 1,000 shares of common stock for eachshare of Series A Preferred Stock outstanding. The conversion ratio is subject to certain anti-dilution adjustments for extraordinarycorporate transactions, such as stock splits, dividends and combinations, the issuance of stock purchase rights, debt or asset distributions(including cash), tender offers or exchange offers and entry into a shareholder rights plan. Each share of Series A Preferred Stock wouldautomatically convert into shares of common stock if such shares were transferred by Hilltop or Oak Hill to a non-affiliate. See additionaldiscussion concerning the Series A Preferred Stock in Note 16, Debt Issued with Stock Purchase Warrants.
22. INTEREST INCOME AND INTEREST EXPENSEFor fiscal years ended June 29, 2012, June 24, 2011 and June 25, 2010 and, for the Bank, for fiscal years ended June 30, 2012, 2011 and2010, the components of interest income and expense were as follows (in thousands):
June 2012 June 2011 June 2010Interest income:
Customer margin accounts $ 8,604 $ 8,123 $ 6,895 Assets segregated for regulatory purposes 197 348 309 Stock borrowed 52,620 48,688 57,301 Loans 48,819 69,881 83,537 Bank investments 3,137 1,700 1,266 Other 8,743 10,127 6,755
$ 122,120 $ 138,867 $ 156,063 Interest expense:
Customer funds on deposit $ 342 $ 404 $ 700 Stock loaned 41,048 37,370 43,472 Deposits 808 1,653 3,453 Federal Home Loan Bank 3,920 4,781 5,312 Long-term debt 11,018 — — Other 3,182 3,547 2,319
60,318 47,755 55,256 Total net interest revenue $ 61,802 $ 91,112 $ 100,807
F-37
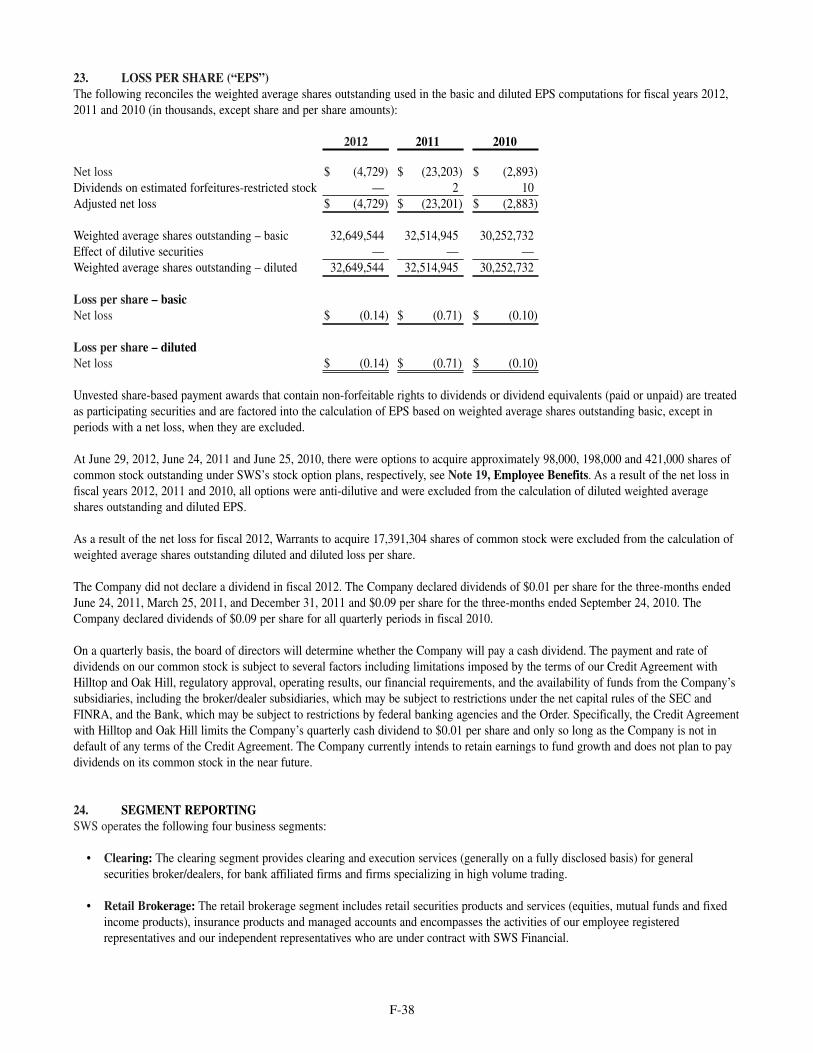
23. LOSS PER SHARE (“EPS”)The following reconciles the weighted average shares outstanding used in the basic and diluted EPS computations for fiscal years 2012,2011 and 2010 (in thousands, except share and per share amounts):
2012 2011 2010
Net loss $ (4,729) $ (23,203) $ (2,893)Dividends on estimated forfeitures-restricted stock — 2 10Adjusted net loss $ (4,729) $ (23,201) $ (2,883)
Weighted average shares outstanding – basic 32,649,544 32,514,945 30,252,732 Effect of dilutive securities — — —Weighted average shares outstanding – diluted 32,649,544 32,514,945 30,252,732
Loss per share – basicNet loss $ (0.14) $ (0.71) $ (0.10)
Loss per share – dilutedNet loss $ (0.14) $ (0.71) $ (0.10)
Unvested share-based payment awards that contain non-forfeitable rights to dividends or dividend equivalents (paid or unpaid) are treatedas participating securities and are factored into the calculation of EPS based on weighted average shares outstanding basic, except inperiods with a net loss, when they are excluded.
At June 29, 2012, June 24, 2011 and June 25, 2010, there were options to acquire approximately 98,000, 198,000 and 421,000 shares ofcommon stock outstanding under SWS’s stock option plans, respectively, see Note 19, Employee Benefits. As a result of the net loss infiscal years 2012, 2011 and 2010, all options were anti-dilutive and were excluded from the calculation of diluted weighted averageshares outstanding and diluted EPS.
As a result of the net loss for fiscal 2012, Warrants to acquire 17,391,304 shares of common stock were excluded from the calculation ofweighted average shares outstanding diluted and diluted loss per share.
The Company did not declare a dividend in fiscal 2012. The Company declared dividends of $0.01 per share for the three-months endedJune 24, 2011, March 25, 2011, and December 31, 2011 and $0.09 per share for the three-months ended September 24, 2010. TheCompany declared dividends of $0.09 per share for all quarterly periods in fiscal 2010.
On a quarterly basis, the board of directors will determine whether the Company will pay a cash dividend. The payment and rate ofdividends on our common stock is subject to several factors including limitations imposed by the terms of our Credit Agreement withHilltop and Oak Hill, regulatory approval, operating results, our financial requirements, and the availability of funds from the Company’ssubsidiaries, including the broker/dealer subsidiaries, which may be subject to restrictions under the net capital rules of the SEC andFINRA, and the Bank, which may be subject to restrictions by federal banking agencies and the Order. Specifically, the Credit Agreementwith Hilltop and Oak Hill limits the Company’s quarterly cash dividend to $0.01 per share and only so long as the Company is not indefault of any terms of the Credit Agreement. The Company currently intends to retain earnings to fund growth and does not plan to paydividends on its common stock in the near future.
24. SEGMENT REPORTINGSWS operates the following four business segments:
• Clearing: The clearing segment provides clearing and execution services (generally on a fully disclosed basis) for generalsecurities broker/dealers, for bank affiliated firms and firms specializing in high volume trading.
• Retail Brokerage: The retail brokerage segment includes retail securities products and services (equities, mutual funds and fixedincome products), insurance products and managed accounts and encompasses the activities of our employee registeredrepresentatives and our independent representatives who are under contract with SWS Financial.
F-38
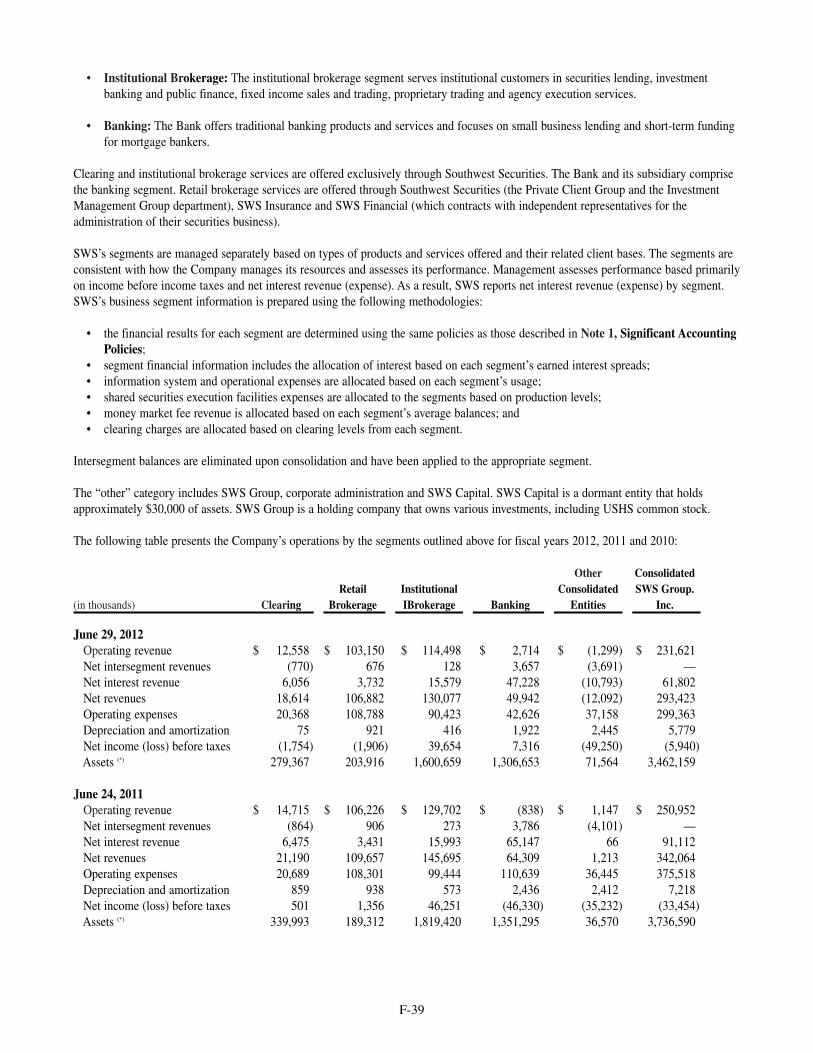
• Institutional Brokerage: The institutional brokerage segment serves institutional customers in securities lending, investmentbanking and public finance, fixed income sales and trading, proprietary trading and agency execution services.
• Banking: The Bank offers traditional banking products and services and focuses on small business lending and short-term fundingfor mortgage bankers.
Clearing and institutional brokerage services are offered exclusively through Southwest Securities. The Bank and its subsidiary comprisethe banking segment. Retail brokerage services are offered through Southwest Securities (the Private Client Group and the InvestmentManagement Group department), SWS Insurance and SWS Financial (which contracts with independent representatives for theadministration of their securities business).
SWS’s segments are managed separately based on types of products and services offered and their related client bases. The segments areconsistent with how the Company manages its resources and assesses its performance. Management assesses performance based primarilyon income before income taxes and net interest revenue (expense). As a result, SWS reports net interest revenue (expense) by segment.SWS’s business segment information is prepared using the following methodologies:
• the financial results for each segment are determined using the same policies as those described in Note 1, Significant AccountingPolicies;
• segment financial information includes the allocation of interest based on each segment’s earned interest spreads;• information system and operational expenses are allocated based on each segment’s usage;• shared securities execution facilities expenses are allocated to the segments based on production levels;• money market fee revenue is allocated based on each segment’s average balances; and • clearing charges are allocated based on clearing levels from each segment.
Intersegment balances are eliminated upon consolidation and have been applied to the appropriate segment.
The “other” category includes SWS Group, corporate administration and SWS Capital. SWS Capital is a dormant entity that holdsapproximately $30,000 of assets. SWS Group is a holding company that owns various investments, including USHS common stock.
The following table presents the Company’s operations by the segments outlined above for fiscal years 2012, 2011 and 2010:
Other ConsolidatedRetail Institutional Consolidated SWS Group.
(in thousands) Clearing Brokerage IBrokerage Banking Entities Inc.
June 29, 2012Operating revenue $ 12,558 $ 103,150 $ 114,498 $ 2,714 $ (1,299) $ 231,621Net intersegment revenues (770) 676 128 3,657 (3,691) —Net interest revenue 6,056 3,732 15,579 47,228 (10,793) 61,802Net revenues 18,614 106,882 130,077 49,942 (12,092) 293,423Operating expenses 20,368 108,788 90,423 42,626 37,158 299,363Depreciation and amortization 75 921 416 1,922 2,445 5,779Net income (loss) before taxes (1,754) (1,906) 39,654 7,316 (49,250) (5,940)Assets (*) 279,367 203,916 1,600,659 1,306,653 71,564 3,462,159
June 24, 2011Operating revenue $ 14,715 $ 106,226 $ 129,702 $ (838) $ 1,147 $ 250,952Net intersegment revenues (864) 906 273 3,786 (4,101) —Net interest revenue 6,475 3,431 15,993 65,147 66 91,112Net revenues 21,190 109,657 145,695 64,309 1,213 342,064Operating expenses 20,689 108,301 99,444 110,639 36,445 375,518Depreciation and amortization 859 938 573 2,436 2,412 7,218Net income (loss) before taxes 501 1,356 46,251 (46,330) (35,232) (33,454)Assets (*) 339,993 189,312 1,819,420 1,351,295 36,570 3,736,590
F-39
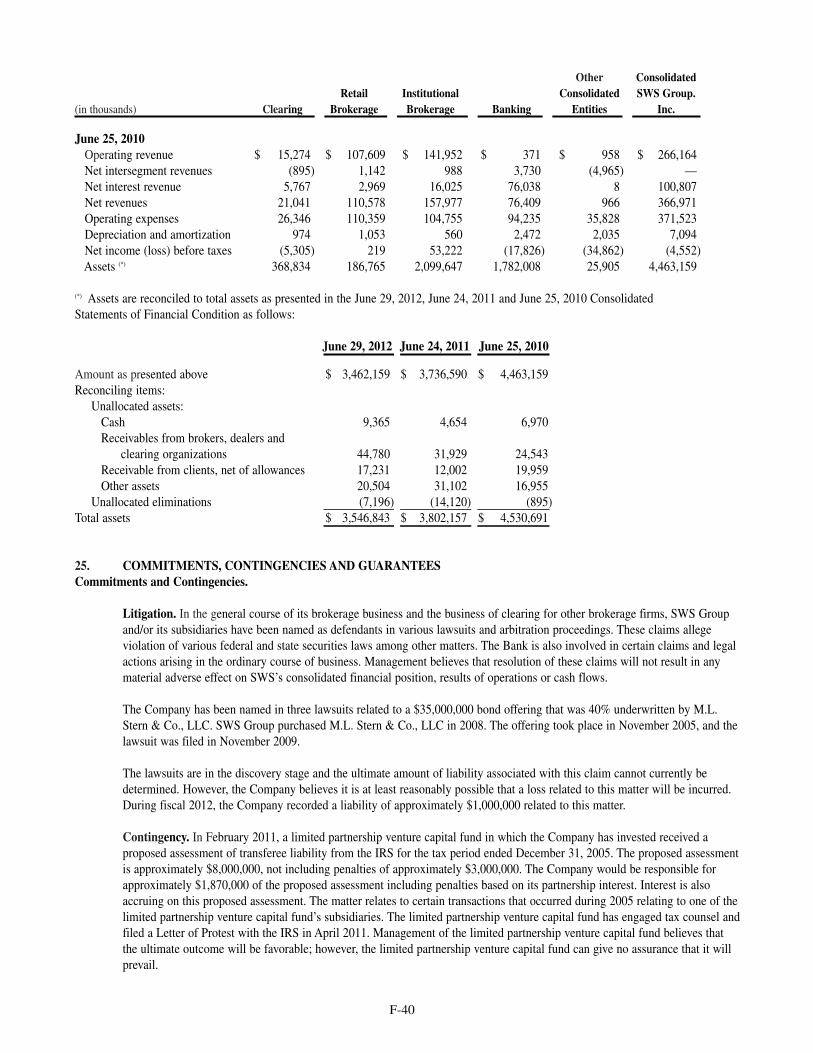
Other ConsolidatedRetail Institutional Consolidated SWS Group.
(in thousands) Clearing Brokerage Brokerage Banking Entities Inc.
June 25, 2010Operating revenue $ 15,274 $ 107,609 $ 141,952 $ 371 $ 958 $ 266,164Net intersegment revenues (895) 1,142 988 3,730 (4,965) —Net interest revenue 5,767 2,969 16,025 76,038 8 100,807Net revenues 21,041 110,578 157,977 76,409 966 366,971Operating expenses 26,346 110,359 104,755 94,235 35,828 371,523Depreciation and amortization 974 1,053 560 2,472 2,035 7,094Net income (loss) before taxes (5,305) 219 53,222 (17,826) (34,862) (4,552)Assets (*) 368,834 186,765 2,099,647 1,782,008 25,905 4,463,159
(*) Assets are reconciled to total assets as presented in the June 29, 2012, June 24, 2011 and June 25, 2010 Consolidated Statements of Financial Condition as follows:
June 29, 2012 June 24, 2011 June 25, 2010
Amount as presented above $ 3,462,159 $ 3,736,590 $ 4,463,159Reconciling items:
Unallocated assets:Cash 9,365 4,654 6,970Receivables from brokers, dealers and
clearing organizations 44,780 31,929 24,543Receivable from clients, net of allowances 17,231 12,002 19,959Other assets 20,504 31,102 16,955
Unallocated eliminations (7,196) (14,120) (895)Total assets $ 3,546,843 $ 3,802,157 $ 4,530,691
25. COMMITMENTS, CONTINGENCIES AND GUARANTEESCommitments and Contingencies.
Litigation. In the general course of its brokerage business and the business of clearing for other brokerage firms, SWS Groupand/or its subsidiaries have been named as defendants in various lawsuits and arbitration proceedings. These claims allegeviolation of various federal and state securities laws among other matters. The Bank is also involved in certain claims and legalactions arising in the ordinary course of business. Management believes that resolution of these claims will not result in anymaterial adverse effect on SWS’s consolidated financial position, results of operations or cash flows.
The Company has been named in three lawsuits related to a $35,000,000 bond offering that was 40% underwritten by M.L.Stern & Co., LLC. SWS Group purchased M.L. Stern & Co., LLC in 2008. The offering took place in November 2005, and thelawsuit was filed in November 2009.
The lawsuits are in the discovery stage and the ultimate amount of liability associated with this claim cannot currently bedetermined. However, the Company believes it is at least reasonably possible that a loss related to this matter will be incurred.During fiscal 2012, the Company recorded a liability of approximately $1,000,000 related to this matter.
Contingency. In February 2011, a limited partnership venture capital fund in which the Company has invested received aproposed assessment of transferee liability from the IRS for the tax period ended December 31, 2005. The proposed assessmentis approximately $8,000,000, not including penalties of approximately $3,000,000. The Company would be responsible forapproximately $1,870,000 of the proposed assessment including penalties based on its partnership interest. Interest is alsoaccruing on this proposed assessment. The matter relates to certain transactions that occurred during 2005 relating to one of thelimited partnership venture capital fund’s subsidiaries. The limited partnership venture capital fund has engaged tax counsel andfiled a Letter of Protest with the IRS in April 2011. Management of the limited partnership venture capital fund believes thatthe ultimate outcome will be favorable; however, the limited partnership venture capital fund can give no assurance that it willprevail.
F-40
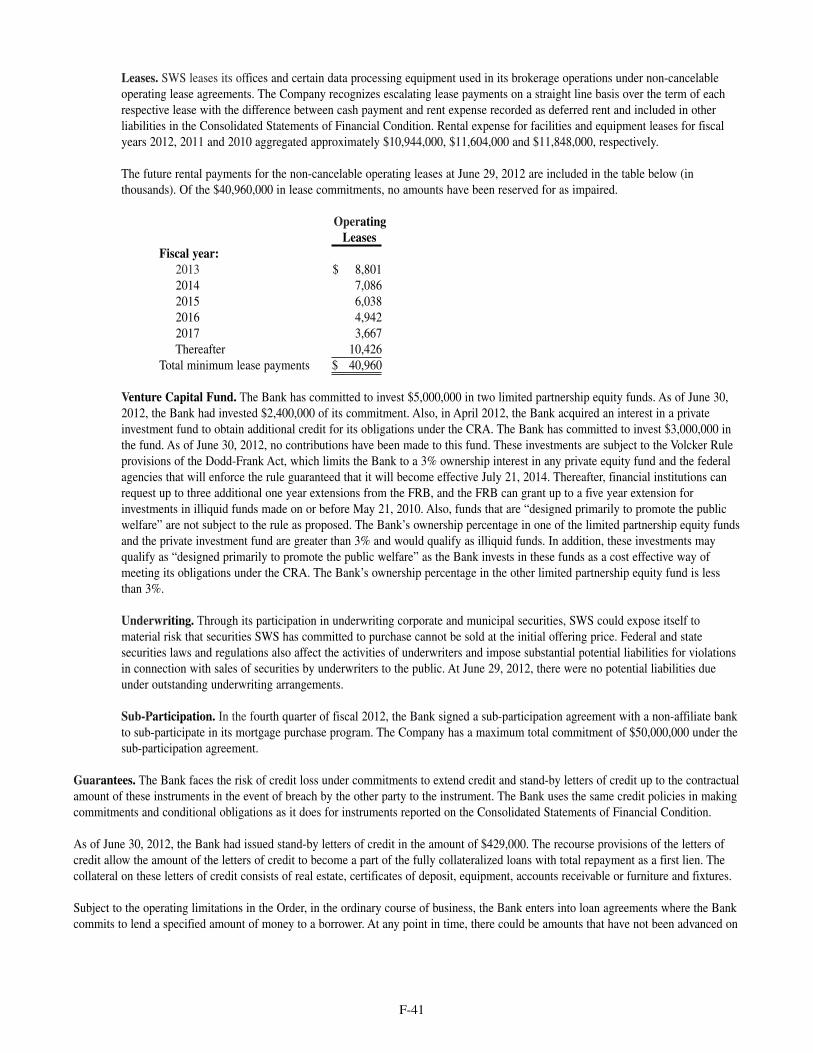
Leases. SWS leases its offices and certain data processing equipment used in its brokerage operations under non-cancelableoperating lease agreements. The Company recognizes escalating lease payments on a straight line basis over the term of eachrespective lease with the difference between cash payment and rent expense recorded as deferred rent and included in otherliabilities in the Consolidated Statements of Financial Condition. Rental expense for facilities and equipment leases for fiscalyears 2012, 2011 and 2010 aggregated approximately $10,944,000, $11,604,000 and $11,848,000, respectively.
The future rental payments for the non-cancelable operating leases at June 29, 2012 are included in the table below (inthousands). Of the $40,960,000 in lease commitments, no amounts have been reserved for as impaired.
OperatingLeases
Fiscal year:2013 $ 8,8012014 7,0862015 6,0382016 4,9422017 3,667Thereafter 10,426
Total minimum lease payments $ 40,960
Venture Capital Fund. The Bank has committed to invest $5,000,000 in two limited partnership equity funds. As of June 30,2012, the Bank had invested $2,400,000 of its commitment. Also, in April 2012, the Bank acquired an interest in a privateinvestment fund to obtain additional credit for its obligations under the CRA. The Bank has committed to invest $3,000,000 inthe fund. As of June 30, 2012, no contributions have been made to this fund. These investments are subject to the Volcker Ruleprovisions of the Dodd-Frank Act, which limits the Bank to a 3% ownership interest in any private equity fund and the federalagencies that will enforce the rule guaranteed that it will become effective July 21, 2014. Thereafter, financial institutions canrequest up to three additional one year extensions from the FRB, and the FRB can grant up to a five year extension forinvestments in illiquid funds made on or before May 21, 2010. Also, funds that are “designed primarily to promote the publicwelfare” are not subject to the rule as proposed. The Bank’s ownership percentage in one of the limited partnership equity fundsand the private investment fund are greater than 3% and would qualify as illiquid funds. In addition, these investments mayqualify as “designed primarily to promote the public welfare” as the Bank invests in these funds as a cost effective way ofmeeting its obligations under the CRA. The Bank’s ownership percentage in the other limited partnership equity fund is lessthan 3%.
Underwriting. Through its participation in underwriting corporate and municipal securities, SWS could expose itself tomaterial risk that securities SWS has committed to purchase cannot be sold at the initial offering price. Federal and statesecurities laws and regulations also affect the activities of underwriters and impose substantial potential liabilities for violationsin connection with sales of securities by underwriters to the public. At June 29, 2012, there were no potential liabilities dueunder outstanding underwriting arrangements.
Sub-Participation. In the fourth quarter of fiscal 2012, the Bank signed a sub-participation agreement with a non-affiliate bankto sub-participate in its mortgage purchase program. The Company has a maximum total commitment of $50,000,000 under thesub-participation agreement.
Guarantees. The Bank faces the risk of credit loss under commitments to extend credit and stand-by letters of credit up to the contractualamount of these instruments in the event of breach by the other party to the instrument. The Bank uses the same credit policies in makingcommitments and conditional obligations as it does for instruments reported on the Consolidated Statements of Financial Condition.
As of June 30, 2012, the Bank had issued stand-by letters of credit in the amount of $429,000. The recourse provisions of the letters ofcredit allow the amount of the letters of credit to become a part of the fully collateralized loans with total repayment as a first lien. Thecollateral on these letters of credit consists of real estate, certificates of deposit, equipment, accounts receivable or furniture and fixtures.
Subject to the operating limitations in the Order, in the ordinary course of business, the Bank enters into loan agreements where the Bankcommits to lend a specified amount of money to a borrower. At any point in time, there could be amounts that have not been advanced on
F-41
the loan to the borrower, representing unfunded commitments, as well as amounts that have been disbursed but repaid, which are availablefor re-borrowing under a revolving line of credit. As of June 30, 2012, the Bank had commitments of $29,061,000 relating to revolvinglines of credit and unfunded commitments. In addition, as of June 30, 2012, the Bank had no unfunded new loans.
Commitments to extend credit are agreements to lend to a customer as long as there is no violation of any condition established in thecontract. Commitments generally have fixed expiration dates or other termination clauses and may require the payment of a fee. Sincemany of the commitments are expected to expire unused, the total Bank’s commitments do not necessarily represent future cashrequirements. The Bank evaluates the customer’s creditworthiness on a case-by-case basis. The amount and type of collateral obtained, ifdeemed necessary by the Bank upon extension of credit, varies and is based on management’s credit evaluation of the counterparty. TheBank did not incur any significant losses on its commitments in fiscal 2012. In addition, management does not believe the Bank will incurmaterial losses as a result of its outstanding commitments at June 30, 2012.
The Company provides representations and warranties to counterparties in connection with a variety of commercial transactions andoccasionally indemnifies counterparties against potential losses caused by the breach of those representations and warranties. Theseindemnification obligations generally are standard contractual indemnities and are entered into in the normal course of business. Themaximum potential amount of future payments that the Company could be required to make under these indemnities cannot be estimated.However, the Company believes that it is unlikely it will have to make material payments under these arrangements and has not recordedany contingent liability in the consolidated financial statements for these indemnities.
Southwest Securities is a member of multiple exchanges and clearinghouses. Under the membership agreements, members are generallyrequired to guarantee the performance of other members. Additionally, if a member becomes unable to satisfy its obligations to theclearinghouse, other members would be required to meet shortfalls. To mitigate these performance risks, the exchanges andclearinghouses often require members to post collateral. SWS’s maximum potential liability under these arrangements cannot bequantified. However, the potential for SWS to be required to make payments under these arrangements is unlikely. Accordingly, nocontingent liability is recorded in the consolidated financial statements for these arrangements.
26. AFFILIATE TRANSACTIONSClients and correspondents of SWS have the option to invest in a savings account called Bank Insured Deposits at the Bank. These fundsare FDIC insured up to $250,000. The funds are considered core deposits and are the primary funding source for the Bank. The Bank’score deposits were $1,062,491,000 at June 30, 2012. At June 29, 2012, clients of Southwest Securities had invested $930,741,000 in thesefunds.
One director of SWS was a principal guarantor of one loan made by the Bank to a North Texas business franchise in which he is a co-managing partner. The loan totaled $1,696,000 and was made by the Bank to the franchise in fiscal 2007. This loan was paid off in fiscal2010. The loan bore interest at the prime rate and, during fiscal 2010, the Bank recognized interest income on the loan of $25,500.
At June 30, 2010, two directors together with certain members of their families, owned approximately 64% of a holding company thatowned a local bank. The Bank sold this local bank loan participations with outstanding balances of $1,404,000, which were collateralizedby foreclosed property at June 30, 2012. At June 30, 2011, the Bank sold this local bank loan participations with outstanding balances of$3,217,000, of which $1,404,000 was collateralized by foreclosed property. Pursuant to participations agreements with the local bank, theBank paid interest and fees to the local bank of $98,000, $137,000 and $157,000 in fiscal years 2012, 2011 and 2010, respectively. Theinterest rates on these participations were substantially the same as those participations sold by the Bank to unrelated banks. In fiscal2011, one loan was sold and the local bank was paid $721,000 for its participation share of the net sales price. Affiliate transactions aresubject to limitations specified in the Order. See Note 29, Cease and Desist Order with the Office of the Comptroller of the Currencyfor additional information.
In the ordinary course of business, the Bank has transactions, including borrowings and deposits, with its executive officers, directors andtheir affiliates. It is the policy of the Bank that such transactions are on the same terms, including interest rates and collateralrequirements, as those prevailing at the time for comparable transactions with unaffiliated persons. There were no such loans at June 30,2012 and 2011. The Bank recorded interest income on affiliate loans of $0, $21,000 and $97,000 during fiscal years 2012, 2011 and2010, respectively. Aggregate deposits from affiliates totaled approximately $3,908,000 and $2,883,000 at June 30, 2012 and 2011,respectively.
F-42
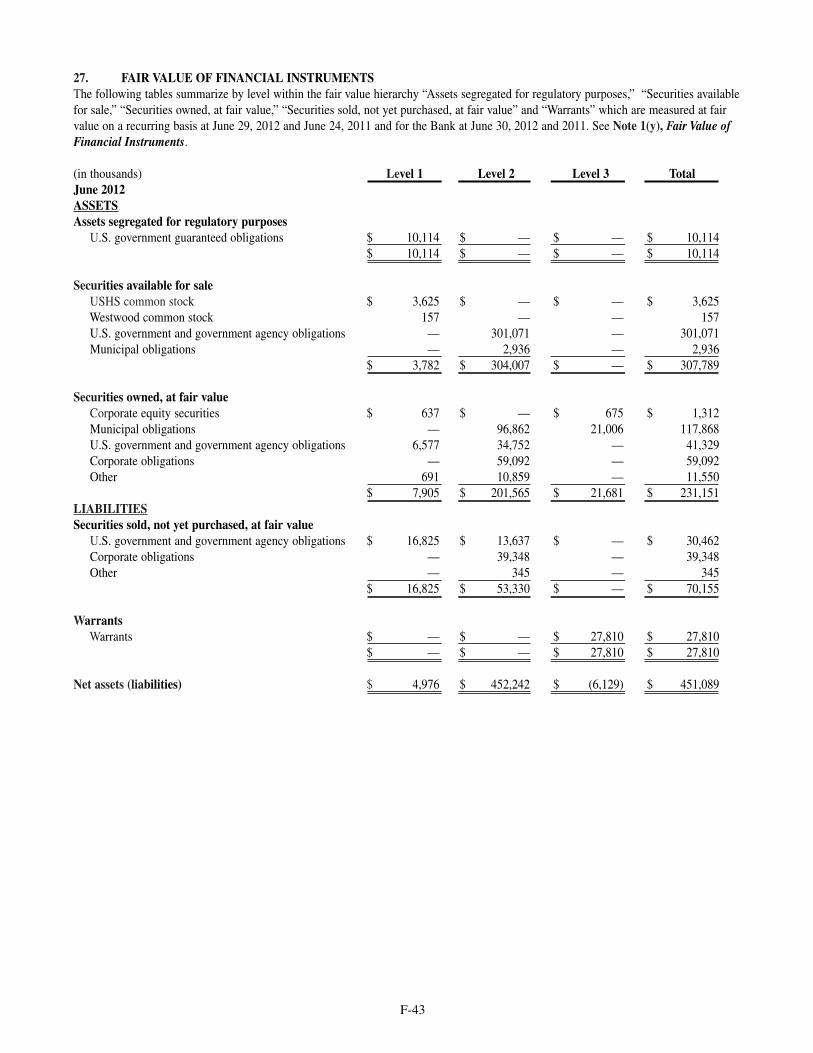
27. FAIR VALUE OF FINANCIAL INSTRUMENTSThe following tables summarize by level within the fair value hierarchy “Assets segregated for regulatory purposes,” “Securities availablefor sale,” “Securities owned, at fair value,” “Securities sold, not yet purchased, at fair value” and “Warrants” which are measured at fairvalue on a recurring basis at June 29, 2012 and June 24, 2011 and for the Bank at June 30, 2012 and 2011. See Note 1(y), Fair Value ofFinancial Instruments.
(in thousands) Level 1 Level 2 Level 3 TotalJune 2012ASSETSAssets segregated for regulatory purposes
U.S. government guaranteed obligations $ 10,114 $ — $ — $ 10,114$ 10,114 $ — $ — $ 10,114
Securities available for saleUSHS common stock $ 3,625 $ — $ — $ 3,625Westwood common stock 157 — — 157U.S. government and government agency obligations — 301,071 — 301,071Municipal obligations — 2,936 — 2,936
$ 3,782 $ 304,007 $ — $ 307,789
Securities owned, at fair valueCorporate equity securities $ 637 $ — $ 675 $ 1,312Municipal obligations — 96,862 21,006 117,868U.S. government and government agency obligations 6,577 34,752 — 41,329Corporate obligations — 59,092 — 59,092Other 691 10,859 — 11,550
$ 7,905 $ 201,565 $ 21,681 $ 231,151LIABILITIESSecurities sold, not yet purchased, at fair value
U.S. government and government agency obligations $ 16,825 $ 13,637 $ — $ 30,462Corporate obligations — 39,348 — 39,348Other — 345 — 345
$ 16,825 $ 53,330 $ — $ 70,155
WarrantsWarrants $ — $ — $ 27,810 $ 27,810
$ — $ — $ 27,810 $ 27,810
Net assets (liabilities) $ 4,976 $ 452,242 $ (6,129) $ 451,089
F-43
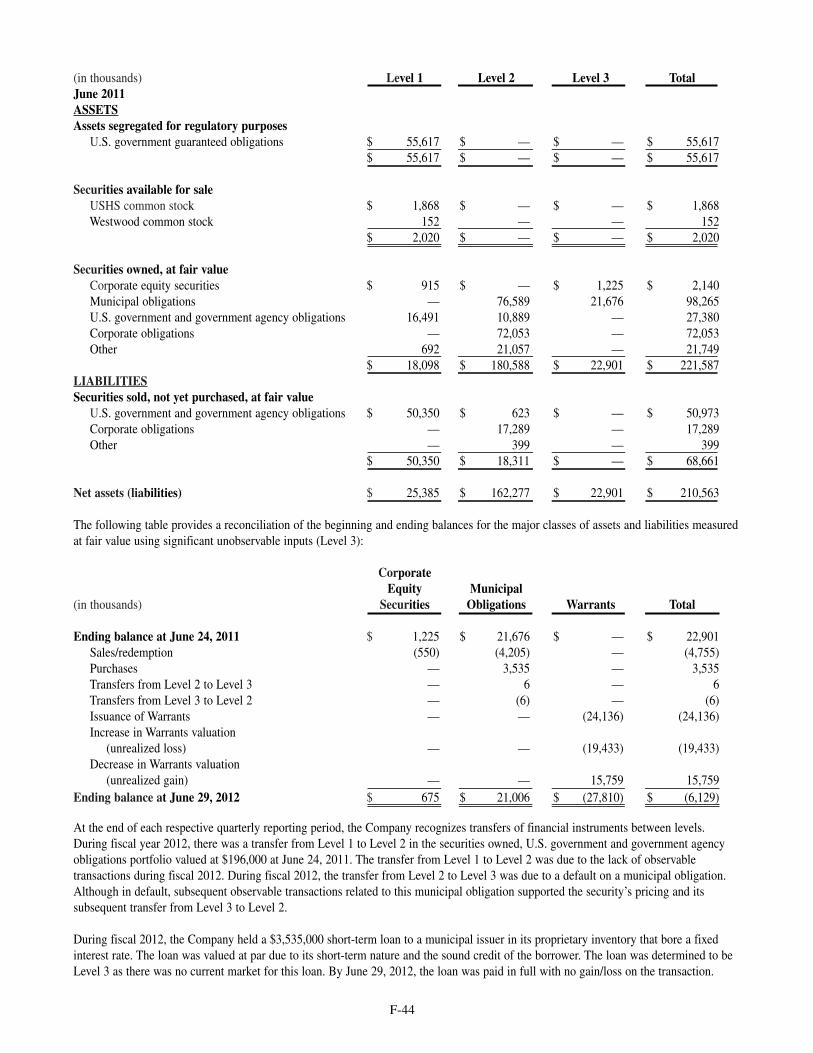
(in thousands) Level 1 Level 2 Level 3 TotalJune 2011ASSETSAssets segregated for regulatory purposes
U.S. government guaranteed obligations $ 55,617 $ — $ — $ 55,617$ 55,617 $ — $ — $ 55,617
Securities available for saleUSHS common stock $ 1,868 $ — $ — $ 1,868Westwood common stock 152 — — 152
$ 2,020 $ — $ — $ 2,020
Securities owned, at fair valueCorporate equity securities $ 915 $ — $ 1,225 $ 2,140Municipal obligations — 76,589 21,676 98,265U.S. government and government agency obligations 16,491 10,889 — 27,380Corporate obligations — 72,053 — 72,053Other 692 21,057 — 21,749
$ 18,098 $ 180,588 $ 22,901 $ 221,587LIABILITIESSecurities sold, not yet purchased, at fair value
U.S. government and government agency obligations $ 50,350 $ 623 $ — $ 50,973Corporate obligations — 17,289 — 17,289Other — 399 — 399
$ 50,350 $ 18,311 $ — $ 68,661
Net assets (liabilities) $ 25,385 $ 162,277 $ 22,901 $ 210,563
The following table provides a reconciliation of the beginning and ending balances for the major classes of assets and liabilities measuredat fair value using significant unobservable inputs (Level 3):
CorporateEquity Municipal
(in thousands) Securities Obligations Warrants Total
Ending balance at June 24, 2011 $ 1,225 $ 21,676 $ — $ 22,901Sales/redemption (550) (4,205) — (4,755)Purchases — 3,535 — 3,535Transfers from Level 2 to Level 3 — 6 — 6Transfers from Level 3 to Level 2 — (6) — (6)Issuance of Warrants — — (24,136) (24,136)Increase in Warrants valuation
(unrealized loss) — — (19,433) (19,433)Decrease in Warrants valuation
(unrealized gain) — — 15,759 15,759Ending balance at June 29, 2012 $ 675 $ 21,006 $ (27,810) $ (6,129)
At the end of each respective quarterly reporting period, the Company recognizes transfers of financial instruments between levels.During fiscal year 2012, there was a transfer from Level 1 to Level 2 in the securities owned, U.S. government and government agencyobligations portfolio valued at $196,000 at June 24, 2011. The transfer from Level 1 to Level 2 was due to the lack of observabletransactions during fiscal 2012. During fiscal 2012, the transfer from Level 2 to Level 3 was due to a default on a municipal obligation.Although in default, subsequent observable transactions related to this municipal obligation supported the security’s pricing and itssubsequent transfer from Level 3 to Level 2.
During fiscal 2012, the Company held a $3,535,000 short-term loan to a municipal issuer in its proprietary inventory that bore a fixedinterest rate. The loan was valued at par due to its short-term nature and the sound credit of the borrower. The loan was determined to beLevel 3 as there was no current market for this loan. By June 29, 2012, the loan was paid in full with no gain/loss on the transaction.
F-44
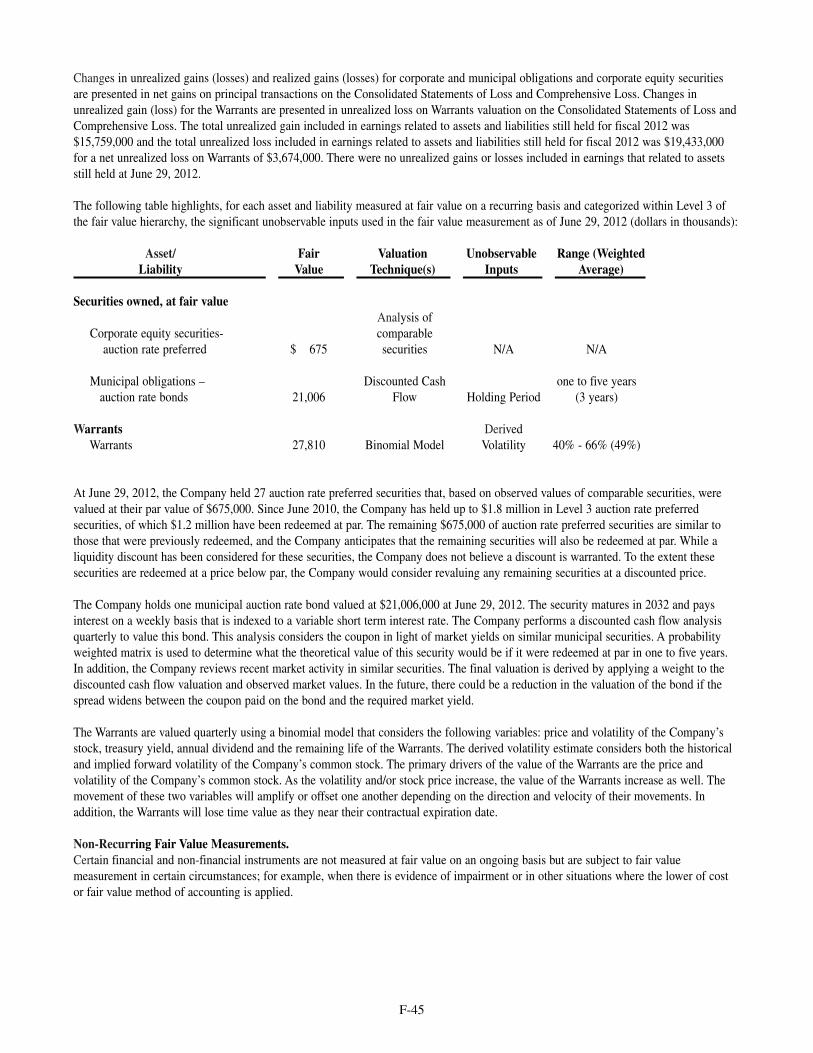
Changes in unrealized gains (losses) and realized gains (losses) for corporate and municipal obligations and corporate equity securitiesare presented in net gains on principal transactions on the Consolidated Statements of Loss and Comprehensive Loss. Changes inunrealized gain (loss) for the Warrants are presented in unrealized loss on Warrants valuation on the Consolidated Statements of Loss andComprehensive Loss. The total unrealized gain included in earnings related to assets and liabilities still held for fiscal 2012 was$15,759,000 and the total unrealized loss included in earnings related to assets and liabilities still held for fiscal 2012 was $19,433,000for a net unrealized loss on Warrants of $3,674,000. There were no unrealized gains or losses included in earnings that related to assetsstill held at June 29, 2012.
The following table highlights, for each asset and liability measured at fair value on a recurring basis and categorized within Level 3 ofthe fair value hierarchy, the significant unobservable inputs used in the fair value measurement as of June 29, 2012 (dollars in thousands):
Asset/ Fair Valuation Unobservable Range (WeightedLiability Value Technique(s) Inputs Average)
Securities owned, at fair valueAnalysis of
Corporate equity securities- comparable auction rate preferred $ 675 securities N/A N/A
Municipal obligations – Discounted Cash one to five yearsauction rate bonds 21,006 Flow Holding Period (3 years)
Warrants Derived Warrants 27,810 Binomial Model Volatility 40% - 66% (49%)
At June 29, 2012, the Company held 27 auction rate preferred securities that, based on observed values of comparable securities, werevalued at their par value of $675,000. Since June 2010, the Company has held up to $1.8 million in Level 3 auction rate preferredsecurities, of which $1.2 million have been redeemed at par. The remaining $675,000 of auction rate preferred securities are similar tothose that were previously redeemed, and the Company anticipates that the remaining securities will also be redeemed at par. While aliquidity discount has been considered for these securities, the Company does not believe a discount is warranted. To the extent thesesecurities are redeemed at a price below par, the Company would consider revaluing any remaining securities at a discounted price.
The Company holds one municipal auction rate bond valued at $21,006,000 at June 29, 2012. The security matures in 2032 and paysinterest on a weekly basis that is indexed to a variable short term interest rate. The Company performs a discounted cash flow analysisquarterly to value this bond. This analysis considers the coupon in light of market yields on similar municipal securities. A probabilityweighted matrix is used to determine what the theoretical value of this security would be if it were redeemed at par in one to five years.In addition, the Company reviews recent market activity in similar securities. The final valuation is derived by applying a weight to thediscounted cash flow valuation and observed market values. In the future, there could be a reduction in the valuation of the bond if thespread widens between the coupon paid on the bond and the required market yield.
The Warrants are valued quarterly using a binomial model that considers the following variables: price and volatility of the Company’sstock, treasury yield, annual dividend and the remaining life of the Warrants. The derived volatility estimate considers both the historicaland implied forward volatility of the Company’s common stock. The primary drivers of the value of the Warrants are the price andvolatility of the Company’s common stock. As the volatility and/or stock price increase, the value of the Warrants increase as well. Themovement of these two variables will amplify or offset one another depending on the direction and velocity of their movements. Inaddition, the Warrants will lose time value as they near their contractual expiration date.
Non-Recurring Fair Value Measurements.Certain financial and non-financial instruments are not measured at fair value on an ongoing basis but are subject to fair valuemeasurement in certain circumstances; for example, when there is evidence of impairment or in other situations where the lower of costor fair value method of accounting is applied.
F-45
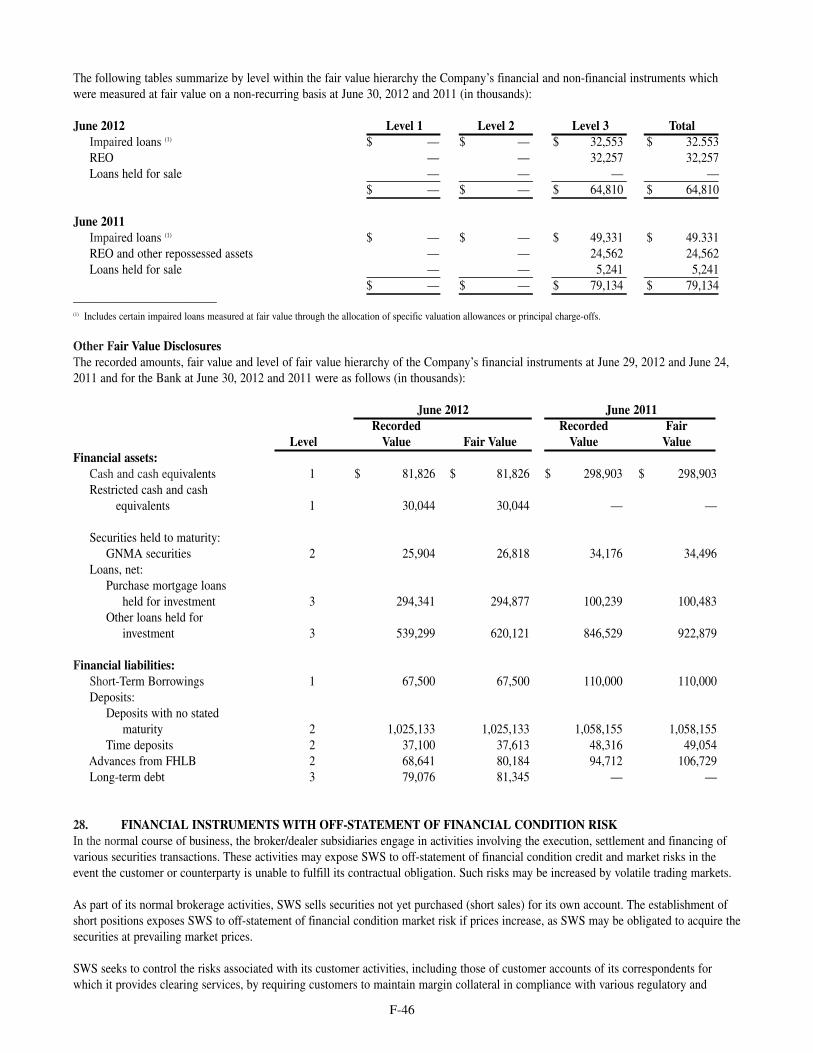
The following tables summarize by level within the fair value hierarchy the Company’s financial and non-financial instruments whichwere measured at fair value on a non-recurring basis at June 30, 2012 and 2011 (in thousands):
June 2012 Level 1 Level 2 Level 3 TotalImpaired loans (1) $ — $ — $ 32,553 $ 32.553REO — — 32,257 32,257Loans held for sale — — — —
$ — $ — $ 64,810 $ 64,810
June 2011Impaired loans (1) $ — $ — $ 49,331 $ 49.331REO and other repossessed assets — — 24,562 24,562Loans held for sale — — 5,241 5,241
$ — $ — $ 79,134 $ 79,134————————————(1) Includes certain impaired loans measured at fair value through the allocation of specific valuation allowances or principal charge-offs.
Other Fair Value DisclosuresThe recorded amounts, fair value and level of fair value hierarchy of the Company’s financial instruments at June 29, 2012 and June 24,2011 and for the Bank at June 30, 2012 and 2011 were as follows (in thousands):
June 2012 June 2011Recorded Recorded Fair
Level Value Fair Value Value ValueFinancial assets:
Cash and cash equivalents 1 $ 81,826 $ 81,826 $ 298,903 $ 298,903Restricted cash and cash
equivalents 1 30,044 30,044 — —
Securities held to maturity:GNMA securities 2 25,904 26,818 34,176 34,496
Loans, net:Purchase mortgage loans
held for investment 3 294,341 294,877 100,239 100,483Other loans held for
investment 3 539,299 620,121 846,529 922,879
Financial liabilities:Short-Term Borrowings 1 67,500 67,500 110,000 110,000Deposits:
Deposits with no stated maturity 2 1,025,133 1,025,133 1,058,155 1,058,155
Time deposits 2 37,100 37,613 48,316 49,054Advances from FHLB 2 68,641 80,184 94,712 106,729Long-term debt 3 79,076 81,345 — —
28. FINANCIAL INSTRUMENTS WITH OFF-STATEMENT OF FINANCIAL CONDITION RISKIn the normal course of business, the broker/dealer subsidiaries engage in activities involving the execution, settlement and financing ofvarious securities transactions. These activities may expose SWS to off-statement of financial condition credit and market risks in theevent the customer or counterparty is unable to fulfill its contractual obligation. Such risks may be increased by volatile trading markets.
As part of its normal brokerage activities, SWS sells securities not yet purchased (short sales) for its own account. The establishment ofshort positions exposes SWS to off-statement of financial condition market risk if prices increase, as SWS may be obligated to acquire thesecurities at prevailing market prices.
SWS seeks to control the risks associated with its customer activities, including those of customer accounts of its correspondents forwhich it provides clearing services, by requiring customers to maintain margin collateral in compliance with various regulatory and
F-46
internal guidelines. The required margin levels are monitored daily and, pursuant to such guidelines, customers are required to depositadditional collateral or to reduce positions when necessary.
A portion of SWS’s customer activity involves short sales and the writing of option contracts. Such transactions may require SWS topurchase or sell financial instruments at prevailing market prices in order to fulfill the customer’s obligations.
At times, SWS lends money using reverse repurchase agreements. These positions are collateralized by U.S. government and governmentagency securities. Such transactions may expose SWS to off-statement of financial condition risk in the event such borrowers do notrepay the loans and the value of collateral held is less than that of the underlying receivable. These agreements provide SWS with theright to maintain the relationship between market value of the collateral and the receivable.
SWS arranges secured financing by pledging securities owned and unpaid customer securities for short-term borrowings to satisfy margindeposits of clearing organizations. SWS also actively participates in the borrowing and lending of securities. In the event the counterpartyin these and other securities loaned transactions is unable to return such securities pledged or borrowed or to repay the deposit placedwith them, SWS may be exposed to the risks of acquiring the securities at prevailing market prices or holding collateral possessing amarket value less than that of the related pledged securities. SWS seeks to control the risks by monitoring the market value of securitiespledged and requiring adjustments of collateral levels where necessary.
The Bank is a party to financial instruments with off-statement of financial condition risk in the normal course of business to meet thefinancing needs of its customers. These financial instruments involve, to varying degrees, elements of credit and interest rate risk inexcess of the amount recognized in the Consolidated Statements of Financial Condition.
29. CEASE AND DESIST ORDER WITH THE OFFICE OF THE COMPTROLLER OF THE CURRENCYOn February 4, 2011 (the “Effective Date”), the Board of Directors of the Bank signed the Stipulation consenting to and agreeing to theissuance by the OTS of the Order without admitting or denying that grounds exist for the OTS to initiate an administrative proceedingagainst the Bank. The description of the Order and the corresponding Stipulation set forth in this section or elsewhere in this section orelsewhere in this filing is qualified in its entirety by reference to the Order and Stipulation, copies of which were filed as exhibits to ourForm10-Q for the quarter ended December 31, 2010, which was filed with the SEC on February 9, 2011. On July 21, 2011, the authorityto enforce the terms of the Order was transferred to the OCC. On March 16, 2012, the Bank was notified by the OCC that the OCC willallow relief from certain operating and growth restrictions required under the Order. The OCC stated that it has no supervisory objectionto any future extensions of Small Business Administration program 504 loans, commercial real estate owner-occupied loans, ormechanic’s lien residential 1-4 family construction loans. The OCC also stated that it has no supervisory objection to a futureconservative growth plan for the Bank’s balance sheet provided that the Bank maintains capital ratios above the requirements of the Orderand concentration levels within policy guidelines. As of June 30, 2012, the Bank was in compliance with the terms of the Order and theOrder will remain in effect until terminated, modified or suspended in writing by the OCC. Among other things, the Order provides:
• The Bank must maintain a Tier 1 (Core) Capital Ratio equal to or greater than eight percent (8%) after the funding of an adequateAllowance for Loan and Lease Losses (“ALLL”) and a Total Risk-Based Capital Ratio equal to or greater than twelve percent(12%) (the “Minimum Levels”). On June 30, 2012, the Bank complied with these requirements with a Total Risk-Based CapitalRatio of 19.2% and a Tier 1 (Core) Capital Ratio of 12.6%.
• The Bank submitted to the OTS for review and comment a written capital plan to maintain the Bank’s capital at the MinimumLevels for the quarterly periods from January 1, 2011 through December 31, 2013. In June 2012, the Bank revised its Capital Planand submitted it to the OCC. On a quarterly basis, the Board of Directors of the Bank must review a report prepared bymanagement detailing deviations from the capital plan and related corrective actions (if any).
• Within 15 days after the Bank fails to meet the Minimum Levels or the Bank fails to submit or comply with the capital plan, theBank must submit a contingency plan that is acceptable to the OCC that details the actions to be taken to: (a) consummate a mergeror acquisition by another federally insured depository institution, or (b) voluntarily liquidate by filing an appropriate applicationwith the OCC. Upon written notification from the OCC, this contingency plan must be implemented immediately and the Bankmust provide the OCC with written status reports no later than the 1st and 15th day of each month following implementation of thecontingency plan.
• The Bank must implement and adhere to the business plan previously submitted by the Bank to the OTS and any materialmodifications are subject to the prior written approval of the OCC after a 45 day review period. On a quarterly basis starting onMarch 31, 2011, the Board of Directors of the Bank must review a report prepared by management detailing deviations from thebusiness plan and related corrective actions (if any). The Bank modified the business plan when it completed the capital plan. TheOCC will review these modifications as part of its review of the capital plan.
• The Bank must implement and adhere to the classified asset reduction plan previously submitted by the Bank to the OTS anddevelop individual written specific workout plans for each classified asset in excess of $500,000. On a quarterly basis starting on
F-47
March 31, 2011, the Board of Directors of the Bank must review an asset status report prepared by management detailing changesto classified assets and the status of workout plans and any revisions to such plans.
• The Bank engaged an independent third party, acceptable to the OTS, to perform a review of at least forty percent (40%) of theconstruction, multifamily, nonresidential and land loan portfolios that were not classified substandard and prepare a written reportsetting forth its findings, including a detailed analysis for the loan classifications of each asset over $500,000. The Bank submittedthis report to the OTS on July 1, 2011.
• The Bank submitted to the OTS for review and comment its written program for identifying, monitoring and controlling risksassociated with concentrations of credit. Once the Bank is notified that the revised program is acceptable, the Board of Directors ofthe Bank must adopt the revised program. On a quarterly basis starting on March 31, 2011, the Board of Directors of the Bankmust review the appropriateness of the Bank’s concentration limits given current conditions and the Bank’s compliance with therevised program and document the review in the minutes.
• The Bank must not, without the prior written non-objection of the OCC, originate or purchase, or commit to originate and purchaseconstruction, nonresidential mortgage or land loans subject to certain exceptions, including: (a) construction loans to facilitate thesale of lots financed by the Bank and loans for the purpose of construction of homes that are pre-sold on lots financed by the Bank;(b) owner-occupied residential construction loans to qualified customers who have a prior existing banking relationship with theBank; (c) loans guaranteed by the Small Business Administration; (d) loans to facilitate the sale of real estate owned; and (e)commercial real estate workouts. All lending subject to the exceptions must comply with the Bank’s loan policy and all applicablelaws, regulations and regulatory guidance. The Bank provided the OTS with a schedule of all legally binding commitments as ofJanuary 27, 2011. The OCC stated in its March 16, 2012 communication, that it has no supervisory objection to any futureextensions of Small Business Administration program 504 loans, commercial real-estate owner occupied loans or mechanic’s lienresidential 1-4 family construction loans, subject to Board approval and certification requirements.
• The Bank’s outside directors conducted a management study and submitted the study to the Board of Directors. The Board adopteda written plan to address any identified weaknesses or deficiencies noted in the management study and specific dates forcompletion of corrective actions and submitted the written plan to the OTS within 10 days of the Board meeting to consider themanagement plan.
• The Bank must comply with brokered deposit regulatory requirements.• The Bank cannot increase its total assets during any quarter in excess of an amount equal to net interest credited on deposit
liabilities during the prior quarter without the prior written notice of non-objection from the OCC. The OCC stated in its March 16,2012 communication that it has no supervisory objection to a future conservative growth plan for the Bank’s balance sheet providethat the Bank maintain capital ratios above the requirements of the Order and concentration levels within policy guidelines.
• The Bank cannot declare or pay dividends or make any other capital distributions without the prior approval of the OCC after 30days prior notice to the OCC.
• The Bank must comply with the prior notification requirements for changes in directors and senior executive officers set forth inapplicable regulations.
• The Bank cannot enter into, renew, extend or revise any contractual arrangement relating to compensation or benefits for any seniorexecutive officer or director of the Bank without providing the OCC with 45 days prior written notice of the proposed transaction.The Bank cannot make any bonus payment or otherwise increase the compensation of any of its senior executive officers ordirectors without providing the OCC with 45 days prior written notice of the proposed bonus or increase and receiving a writtennotice of non-objection from the OCC.
• The Bank cannot make any golden parachute payment or prohibited indemnification payment unless, with respect to each payment,the Bank complies with applicable regulations.
• The Bank cannot enter into any arrangement or contract with a third party service provider that is significant to the overalloperation or financial condition of the Bank or outside the Bank’s normal course of business without providing the OCC with 45days prior written notice of the proposed arrangement including a written determination that the arrangement or contract complieswith regulatory guidance and receiving a written notice of non-objection from the OCC.
• The Bank cannot engage in new transactions with affiliates unless, with respect to each transaction the Bank complies withapplicable regulations.
• The Bank ensured that all violations of law and/or regulation were corrected and adequate policies, procedures and systems wereestablished or revised and thereafter implemented to prevent future violations by April 30, 2011.
• The Board of Directors of the Bank must monitor and coordinate the Bank’s compliance with the Order, review and adopt allpolicies and procedures required by the Order prior to submission to the OCC.
• Within 30 days after the end of each calendar quarter beginning on March 31, 2011, the Bank must prepare a written compliancetracking report for the Board. Within 45 days after the end of each calendar quarter beginning on March 31, 2011, the Board mustreview the compliance tracking report and all other reports required to be prepared by the Order, adopt a resolution certifying thateach director has reviewed the compliance tracking report and all required reports and documenting any corrective actions adoptedby the Board.
F-48
REPORT OF INDEPENDENT REGISTERED PUBLIC ACCOUNTING FIRM
Board of Directors and ShareholdersSWS Group, Inc.
We have audited the accompanying consolidated balance sheets of SWS Group, Inc. (a Delaware corporation) and subsidiaries(collectively the “Company”) as of June 29, 2012 and June 24, 2011, and the related consolidated statements of income (loss) andcomprehensive income (loss), stockholders’ equity, and cash flows for each of the three years in the period ended June 29, 2012. Ouraudits of the basic consolidated financial statements included the financial statement schedule listed in the index appearing under Item15(a)2. These financial statements and financial statement schedule are the responsibility of the Company’s management. Ourresponsibility is to express an opinion on these financial statements and financial statement schedule based on our audits.
We conducted our audits in accordance with the standards of the Public Company Accounting Oversight Board (United States). Thosestandards require that we plan and perform the audit to obtain reasonable assurance about whether the financial statements are free ofmaterial misstatement. An audit includes examining, on a test basis, evidence supporting the amounts and disclosures in the financialstatements. An audit also includes assessing the accounting principles used and significant estimates made by management, as well asevaluating the overall financial statement presentation. We believe that our audits provide a reasonable basis for our opinion.
In our opinion, the consolidated financial statements referred to above present fairly, in all material respects, the financial position ofSWS Group, Inc. and subsidiaries as of June 29, 2012 and June 24, 2011, and the results of their operations and their cash flows for eachof the three years in the period ended June 29, 2012, in conformity with accounting principles generally accepted in the United States ofAmerica. Also in our opinion, the related financial statement schedule, when considered in relation to the basic consolidated financialstatements taken as a whole, presents fairly, in all material respects, the information set forth therein.
We also have audited, in accordance with the standards of the Public Company Accounting Oversight Board (United States), theCompany’s internal control over financial reporting as of June 29, 2012, based on criteria established in Internal Control—IntegratedFramework issued by the Committee of Sponsoring Organizations of the Treadway Commission (COSO) and our report dated September7, 2012 expressed an unqualified opinion on the effective operation of the Company’s internal control over financial reporting.
Grant Thornton LLP
Dallas, TexasSeptember 7, 2012
F-49
REPORT OF INDEPENDENT REGISTERED PUBLIC ACCOUNTING FIRM
Board of Directors and ShareholdersSWS Group, Inc.
We have audited SWS Group, Inc. (a Delaware Corporation) and subsidiaries’ (collectively, the “Company”) internal control overfinancial reporting as of June 29, 2012, based on criteria established in Internal Control—Integrated Framework issued by the Committeeof Sponsoring Organizations of the Treadway Commission (COSO). The Company’s management is responsible for maintaining effectiveinternal control over financial reporting and for its assessment of the effectiveness of internal control over financial reporting, included inthe accompanying Management’s Report on Internal Control Over Financial Reporting appearing under Item 9A of the Company’s annualreport on Form 10-K for the year ended June 29, 2012. Our responsibility is to express an opinion on the Company’s internal control overfinancial reporting based on our audit.
We conducted our audit in accordance with the standards of the Public Company Accounting Oversight Board (United States). Thosestandards require that we plan and perform the audit to obtain reasonable assurance about whether effective internal control over financialreporting was maintained in all material respects. Our audit included obtaining an understanding of internal control over financialreporting, assessing the risk that a material weakness exists, testing and evaluating the design and operating effectiveness of internalcontrol based on the assessed risk, and performing such other procedures as we considered necessary in the circumstances. We believethat our audit provides a reasonable basis for our opinion.
A company’s internal control over financial reporting is a process designed to provide reasonable assurance regarding the reliability offinancial reporting and the preparation of financial statements for external purposes in accordance with generally accepted accountingprinciples. A company’s internal control over financial reporting includes those policies and procedures that (1) pertain to themaintenance of records that, in reasonable detail, accurately and fairly reflect the transactions and dispositions of the assets of thecompany; (2) provide reasonable assurance that transactions are recorded as necessary to permit preparation of financial statements inaccordance with generally accepted accounting principles, and that receipts and expenditures of the company are being made only inaccordance with authorizations of management and directors of the company; and (3) provide reasonable assurance regarding preventionor timely detection of unauthorized acquisition, use, or disposition of the company’s assets that could have a material effect on thefinancial statements.
Because of its inherent limitations, internal control over financial reporting may not prevent or detect misstatements. Also, projections ofany evaluation of effectiveness to future periods are subject to the risk that controls may become inadequate because of changes inconditions, or that the degree of compliance with the policies or procedures may deteriorate.
In our opinion, the Company maintained, in all material respects, effective internal control over financial reporting as of June 29, 2012,based on criteria established in Internal Control—Integrated Framework issued by COSO.
We also have audited, in accordance with the standards of the Public Company Accounting Oversight Board (United States), theconsolidated statements of financial condition of the Company as of June 29, 2012 and June 24, 2011, and the related consolidatedstatements of income (loss) and comprehensive income (loss), stockholders’ equity, and cash flows for each of the three years in theperiod ended June 29, 2012, and the financial statement schedule listed in the index appearing under Item 15(a)2 and our report datedSeptember 7, 2012 expressed an unqualified opinion on those financial statements and schedule.
Grant Thornton LLP
Dallas, TexasSeptember 7, 2012
F-50
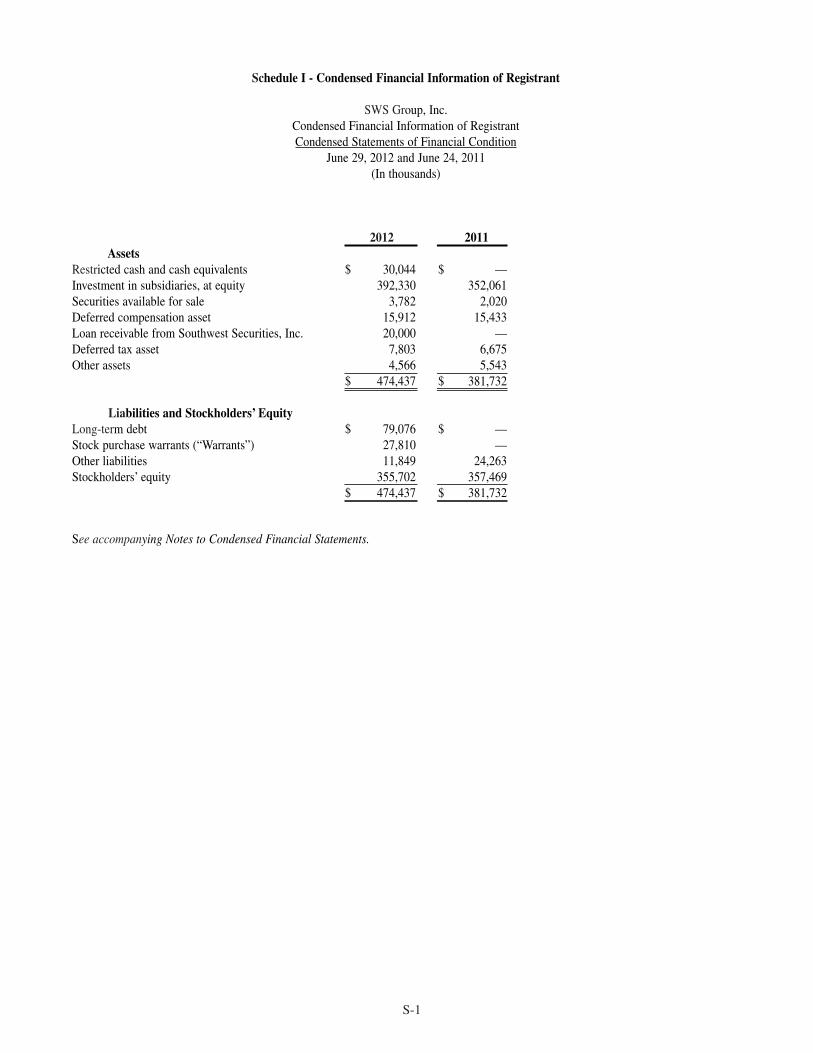
Schedule I - Condensed Financial Information of Registrant
SWS Group, Inc. Condensed Financial Information of RegistrantCondensed Statements of Financial Condition
June 29, 2012 and June 24, 2011(In thousands)
2012 2011Assets
Restricted cash and cash equivalents $ 30,044 $ —Investment in subsidiaries, at equity 392,330 352,061Securities available for sale 3,782 2,020Deferred compensation asset 15,912 15,433Loan receivable from Southwest Securities, Inc. 20,000 —Deferred tax asset 7,803 6,675Other assets 4,566 5,543
$ 474,437 $ 381,732
Liabilities and Stockholders’ EquityLong-term debt $ 79,076 $ —Stock purchase warrants (“Warrants”) 27,810 —Other liabilities 11,849 24,263 Stockholders’ equity 355,702 357,469
$ 474,437 $ 381,732
See accompanying Notes to Condensed Financial Statements.
S-1
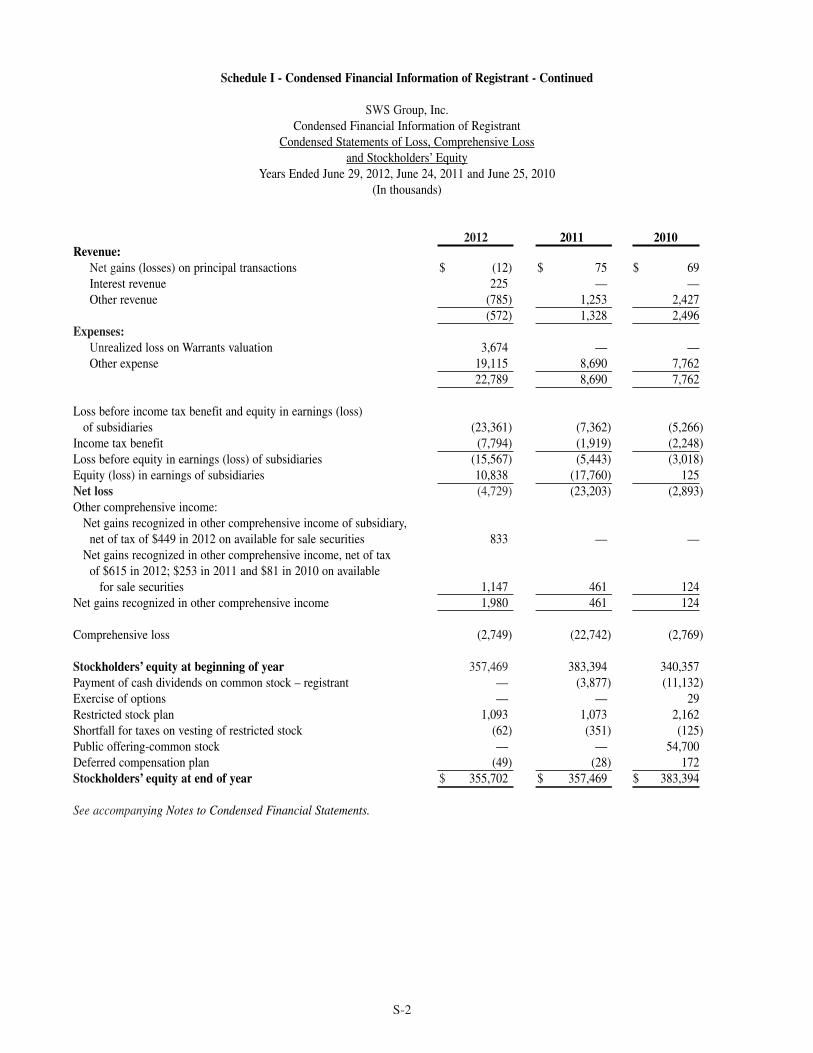
Schedule I - Condensed Financial Information of Registrant - Continued
SWS Group, Inc. Condensed Financial Information of Registrant
Condensed Statements of Loss, Comprehensive Lossand Stockholders’ Equity
Years Ended June 29, 2012, June 24, 2011 and June 25, 2010(In thousands)
2012 2011 2010Revenue:
Net gains (losses) on principal transactions $ (12) $ 75 $ 69 Interest revenue 225 — —Other revenue (785) 1,253 2,427
(572) 1,328 2,496Expenses:
Unrealized loss on Warrants valuation 3,674 — —Other expense 19,115 8,690 7,762
22,789 8,690 7,762
Loss before income tax benefit and equity in earnings (loss) of subsidiaries (23,361) (7,362) (5,266)
Income tax benefit (7,794) (1,919) (2,248)Loss before equity in earnings (loss) of subsidiaries (15,567) (5,443) (3,018)Equity (loss) in earnings of subsidiaries 10,838 (17,760) 125Net loss (4,729) (23,203) (2,893)Other comprehensive income:
Net gains recognized in other comprehensive income of subsidiary,net of tax of $449 in 2012 on available for sale securities 833 — —
Net gains recognized in other comprehensive income, net of taxof $615 in 2012; $253 in 2011 and $81 in 2010 on available
for sale securities 1,147 461 124Net gains recognized in other comprehensive income 1,980 461 124
Comprehensive loss (2,749) (22,742) (2,769)
Stockholders’ equity at beginning of year 357,469 383,394 340,357Payment of cash dividends on common stock – registrant — (3,877) (11,132)Exercise of options — — 29Restricted stock plan 1,093 1,073 2,162Shortfall for taxes on vesting of restricted stock (62) (351) (125)Public offering-common stock — — 54,700Deferred compensation plan (49) (28) 172Stockholders’ equity at end of year $ 355,702 $ 357,469 $ 383,394
See accompanying Notes to Condensed Financial Statements.
S-2
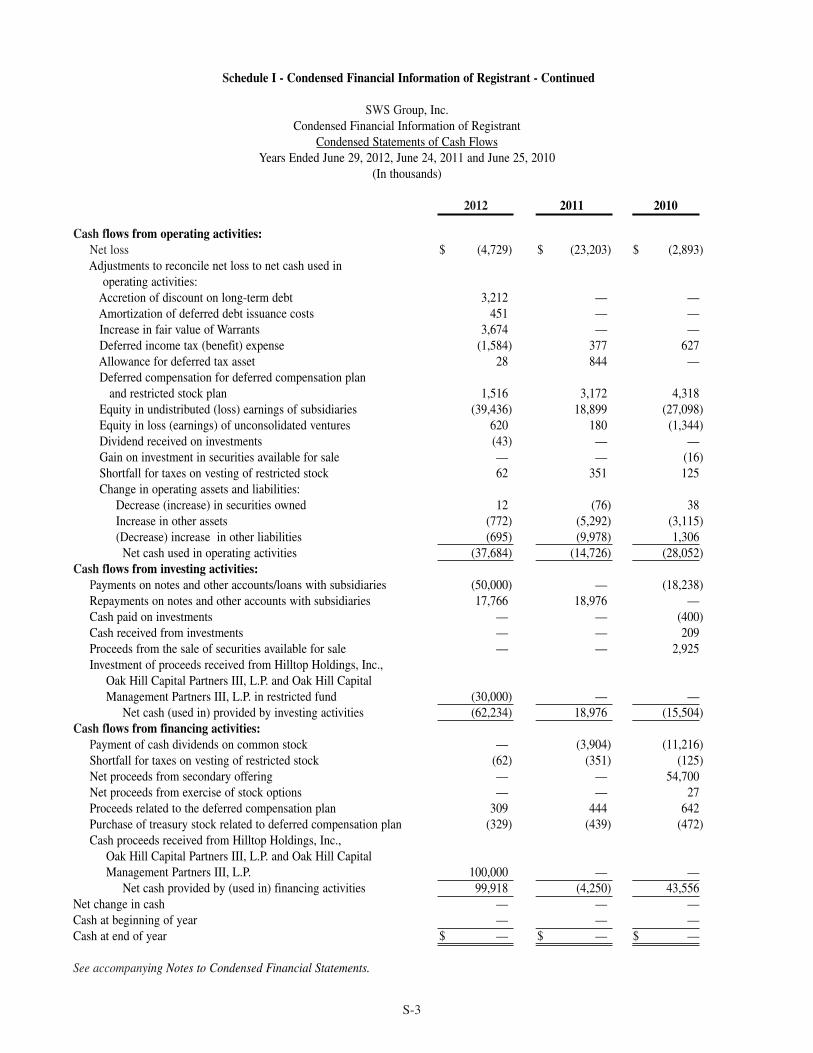
Schedule I - Condensed Financial Information of Registrant - Continued
SWS Group, Inc. Condensed Financial Information of Registrant
Condensed Statements of Cash FlowsYears Ended June 29, 2012, June 24, 2011 and June 25, 2010
(In thousands)
2012 2011 2010
Cash flows from operating activities:Net loss $ (4,729) $ (23,203) $ (2,893) Adjustments to reconcile net loss to net cash used in
operating activities:Accretion of discount on long-term debt 3,212 — —Amortization of deferred debt issuance costs 451 — —Increase in fair value of Warrants 3,674 — —Deferred income tax (benefit) expense (1,584) 377 627Allowance for deferred tax asset 28 844 —Deferred compensation for deferred compensation plan
and restricted stock plan 1,516 3,172 4,318Equity in undistributed (loss) earnings of subsidiaries (39,436) 18,899 (27,098)Equity in loss (earnings) of unconsolidated ventures 620 180 (1,344)Dividend received on investments (43) — —Gain on investment in securities available for sale — — (16)Shortfall for taxes on vesting of restricted stock 62 351 125Change in operating assets and liabilities:
Decrease (increase) in securities owned 12 (76) 38Increase in other assets (772) (5,292) (3,115)(Decrease) increase in other liabilities (695) (9,978) 1,306
Net cash used in operating activities (37,684) (14,726) (28,052)Cash flows from investing activities:
Payments on notes and other accounts/loans with subsidiaries (50,000) — (18,238)Repayments on notes and other accounts with subsidiaries 17,766 18,976 —Cash paid on investments — — (400)Cash received from investments — — 209Proceeds from the sale of securities available for sale — — 2,925Investment of proceeds received from Hilltop Holdings, Inc.,
Oak Hill Capital Partners III, L.P. and Oak Hill Capital Management Partners III, L.P. in restricted fund (30,000) — —
Net cash (used in) provided by investing activities (62,234) 18,976 (15,504)Cash flows from financing activities:
Payment of cash dividends on common stock — (3,904) (11,216)Shortfall for taxes on vesting of restricted stock (62) (351) (125)Net proceeds from secondary offering — — 54,700Net proceeds from exercise of stock options — — 27Proceeds related to the deferred compensation plan 309 444 642Purchase of treasury stock related to deferred compensation plan (329) (439) (472)Cash proceeds received from Hilltop Holdings, Inc.,
Oak Hill Capital Partners III, L.P. and Oak Hill Capital Management Partners III, L.P. 100,000 — —
Net cash provided by (used in) financing activities 99,918 (4,250) 43,556Net change in cash — — —Cash at beginning of year — — —Cash at end of year $ — $ — $ —
See accompanying Notes to Condensed Financial Statements.
S-3

Schedule I - Condensed Financial Information of Registrant - Continued
SWS Group, Inc. Notes to the Condensed Financial Statements of Registrant
GENERALThe accompanying condensed financial statements of SWS Group, Inc. (“Registrant”) should be read in conjunction with the notes to theconsolidated financial statements for the years ended June 29, 2012, June 24, 2011 and June 25, 2010 included elsewhere in this AnnualReport on Form 10-K.
S-4

Exhibit 21.1 - Subsidiaries
State or Other Jurisdiction of
Incorporation or SWS Group, Inc. Organization
Southwest Securities, Inc. DelawareSWS Financial Services, Inc. TexasSWS Capital Corporation DelawareSouthwest Investment Advisors, Inc. DelawareSouthwest Insurance Agency, Inc. Texas
Southwest Insurance Agency of Alabama, Inc. AlabamaSouthwest Financial Insurance Agency, Inc. OklahomaSWS Banc Holdings, Inc. Delaware
Southwest Securities, FSB FederalFSB Development, LLC Texas

Exhibit 23.1 - Consent of Independent Registered Public Accounting Firm
We have issued our reports dated September 7, 2012 with respect to the consolidated financial statements, schedules and internal controlover financial reporting included in the Annual Report of SWS Group, Inc. on Form 10-K for the year ended June 29, 2012. We herebyconsent to the incorporation by reference of said reports in the Registration Statement of SWS Group, Inc. on Forms S-8 (File No. 333-153456, effective September 12, 2008; File No. 333-121752, effective December 30, 2004; File No. 333-111603, effective December 29,2003; File No. 333-104446, effective April 10, 2003; and File No. 333-65073, effective September 30, 1998) and Forms S-3 (File No.333-162537, effective October 16, 2009 and File No. 333-177217, effective November 23, 2011).
Grant Thornton LLP
Dallas, TexasSeptember 7, 2012
Exhibit 31.1CHIEF EXECUTIVE OFFICER CERTIFICATION
AS ADOPTED PURSUANT TO SECTION 302 OF THE SARBANES-OXLEY ACT OF 2002
I, James H. Ross, certify that:
1. I have reviewed this report on Form 10-K of SWS Group, Inc.;
2. Based on my knowledge, this report does not contain any untrue statement of a material fact or omit to state a material factnecessary to make the statements made, in light of the circumstances under which such statements were made, not misleadingwith respect to the period covered by this report;
3. Based on my knowledge, the financial statements, and other financial information included in this report, fairly present in allmaterial respects the financial condition, results of operations and cash flows of the registrant as of, and for, the periodspresented in this report;
4. The registrant’s other certifying officer and I are responsible for establishing and maintaining disclosure controls and procedures(as defined in Exchange Act Rules 13a-15(e) and 15d-15(e)) and internal control over financial reporting (as defined inExchange Act Rules 13a-15(f) and 15d-15(f)) for the registrant and have:
a. Designed such disclosure controls and procedures, or caused such disclosure controls and procedures to be designed underour supervision, to ensure that material information relating to the registrant, including its consolidated subsidiaries, ismade known to us by others within those entities, particularly during the period in which this report is being prepared;
b. Designed such internal control over financial reporting, or caused such internal control over financial reporting to bedesigned under our supervision, to provide reasonable assurance regarding the reliability of financial reporting and thepreparation of financial statements for external purposes in accordance with generally accepted accounting principles;
c. Evaluated the effectiveness of the registrant’s disclosure controls and procedures and presented in this report ourconclusions about the effectiveness of the disclosure controls and procedures, as of the end of the period covered by thisreport based on such evaluation; and
d. Disclosed in this report any change in the registrant’s internal control over financial reporting that occurred during theregistrant’s most recent fiscal quarter (the registrant’s fourth fiscal quarter in the case of an annual report) that hasmaterially affected, or is reasonably likely to materially affect, the registrant’s internal control over financial reporting; and
5. The registrant’s other certifying officer and I have disclosed, based on our most recent evaluation of internal control overfinancial reporting, to the registrant’s auditors and the audit committee of the registrant’s board of directors (or personsperforming the equivalent functions):
a. All significant deficiencies and material weaknesses in the design or operation of internal control over financial reportingwhich are reasonably likely to adversely affect the registrant’s ability to record, process, summarize and report financialinformation; and
b. Any fraud, whether or not material, that involves management or other employees who have a significant role in theregistrant’s internal control over financial reporting.
September 7, 2012 Date James H. Ross
President and Chief Executive Officer

Exhibit 31.2
CHIEF FINANCIAL OFFICER CERTIFICATION AS ADOPTED PURSUANT TO SECTION 302 OF THE SARBANES-OXLEY ACT OF 2002
I, Stacy M. Hodges, certify that:
1. I have reviewed this report on Form 10-K of SWS Group, Inc.;
2. Based on my knowledge, this report does not contain any untrue statement of a material fact or omit to state a material factnecessary to make the statements made, in light of the circumstances under which such statements were made, not misleadingwith respect to the period covered by this report;
3. Based on my knowledge, the financial statements, and other financial information included in this report, fairly present in allmaterial respects the financial condition, results of operations and cash flows of the registrant as of, and for, the periodspresented in this report;
4. The registrant’s other certifying officer and I are responsible for establishing and maintaining disclosure controls and procedures(as defined in Exchange Act Rules 13a-15(e) and 15d-15(e)) and internal control over financial reporting (as defined inExchange Act Rules 13a-15(f) and 15d-15(f)) for the registrant and have:
a. Designed such disclosure controls and procedures, or caused such disclosure controls and procedures to be designed underour supervision, to ensure that material information relating to the registrant, including its consolidated subsidiaries, is madeknown to us by others within those entities, particularly during the period in which this report is being prepared;
b. Designed such internal control over financial reporting, or caused such internal control over financial reporting to bedesigned under our supervision, to provide reasonable assurance regarding the reliability of financial reporting and thepreparation of financial statements for external purposes in accordance with generally accepted accounting principles;
c. Evaluated the effectiveness of the registrant’s disclosure controls and procedures and presented in this report ourconclusions about the effectiveness of the disclosure controls and procedures, as of the end of the period covered by thisreport based on such evaluation; and
d. Disclosed in this report any change in the registrant’s internal control over financial reporting that occurred during theregistrant’s most recent fiscal quarter (the registrant’s fourth fiscal quarter in the case of an annual report) that has materiallyaffected, or is reasonably likely to materially affect, the registrant’s internal control over financial reporting; and
5. The registrant’s other certifying officer and I have disclosed, based on our most recent evaluation of internal control overfinancial reporting, to the registrant’s auditors and the audit committee of the registrant’s board of directors (or personsperforming the equivalent functions):
a. All significant deficiencies and material weaknesses in the design or operation of internal control over financial reportingwhich are reasonably likely to adversely affect the registrant’s ability to record, process, summarize and report financialinformation; and
b. Any fraud, whether or not material, that involves management or other employees who have a significant role in theregistrant’s internal control over financial reporting.
September 7, 2012Date Stacy M. Hodges
Chief Financial Officer

Exhibit 32.1
CERTIFICATION FURNISHED PURSUANT TO 18 U.S.C. SECTION 1350,AS ADOPTED PURSUANT TO SECTION 906 OF THE SARBANES-OXLEY ACT OF 2002
In connection with the report of SWS Group, Inc. (the “Company”) on Form 10-K for the period ended June 29, 2012 as filed with theSecurities and Exchange Commission on the date hereof (the “Report”), I, James H. Ross, Chief Executive Officer of the Company,certify, pursuant to 18 U.S.C. § 1350, as adopted pursuant to Section 906 of the Sarbanes-Oxley Act of 2002, to my knowledge that:
1. The Report fully complies with the requirements of Section 13(a) or 15(d) of the Securities Exchange Act of 1934; and
2. The information contained in the Report fairly presents, in all material respects, the financial condition and results ofoperations of the Company.
Date: September 7, 2012James H. RossPresident and Chief Executive Officer
The foregoing certification is being furnished as an exhibit to the Form 10-K pursuant to Item 601(b)(32) of Regulation S-K and Section906 of the Sarbanes-Oxley Act of 2002 (subsections (a) and (b) of Section 1350, Chapter 63 of Title 18, United States Code) and,accordingly, is not being filed as part of the Form 10-K for purposes of Section 18 of the Securities Exchange Act of 1934, as amended,and is not incorporated by reference into any filing of the Company, whether made before or after the date hereof, regardless of anygeneral incorporation language in such filing.
Exhibit 32.2
CERTIFICATION FURNISHED PURSUANT TO 18 U.S.C. SECTION 1350,AS ADOPTED PURSUANT TO SECTION 906 OF THE SARBANES-OXLEY ACT OF 2002
In connection with the report of SWS Group, Inc. (the “Company”) on Form 10-K for the period ended June 29, 2012 as filed with theSecurities and Exchange Commission on the date hereof (the “Report”), I, Stacy M. Hodges, Chief Financial Officer of the Company,certify, pursuant to 18 U.S.C. § 1350, as adopted pursuant to Section 906 of the Sarbanes-Oxley Act of 2002, to my knowledge that:
1. The Report fully complies with the requirements of Section 13(a) or 15(d) of the Securities Exchange Act of 1934; and
2. The information contained in the Report fairly presents, in all material respects, the financial condition and results ofoperations of the Company.
Date: September 7, 2012Stacy M. HodgesChief Financial Officer
The foregoing certification is being furnished as an exhibit to the Form 10-K pursuant to Item 601(b)(32) of Regulation S-K and Section906 of the Sarbanes-Oxley Act of 2002 (subsections (a) and (b) of Section 1350, Chapter 63 of Title 18, United States Code) and,accordingly, is not being filed as part of the Form 10-K for purposes of Section 18 of the Securities Exchange Act of 1934, as amended,and is not incorporated by reference into any filing of the Company, whether made before or after the date hereof, regardless of anygeneral incorporation language in such filing.

.


James H. RossPresident and
Chief Executive Officer
Stacy M. HodgesExecutive Vice PresidentChief Financial Officer
and Treasurer
Daniel R. LelandExecutive Vice President
Richard H. LittonExecutive Vice President
Jeffrey J. SingerExecutive Vice President
W. Norman ThompsonExecutive Vice President
and Chief Information Officer
Allen R. TubbExecutive Vice President
General Counsel and Secretary
Laura LeventhalSenior Vice President
ControllerChief Financial Officer ofSouthwest Securities, Inc.
D I R E C T O R S
O F F I C E R S
Frederick R. MeyerChairman of the Board
James H. RossPresident and
Chief Executive Officer
Robert A. BuchholzCEO and Chairman
Town Center Holdings, Inc.
Brodie L. Cobb 2
Managing Director, PresidioFinancial Partners, LLC
J. Taylor Crandall 3
Managing Partner, Oak HillCapital Partners III, L.P.
Tyree B. “Ty” Miller 1
President, A.G. Hill Partners, LLC
Christie S. Flanagan 1, 2
Counsel, Hunton &Williams, LLP
Gerald J. Ford 3
Chairman, Hilltop Holdings Inc.
Larry A. Jobe 1, 2
Co-Founder and Chairman ofthe Board, Legal Network, Ltd.
Dr. Mike MosesFormer Texas
Commissioner of Education
Joel T. Williams, III 1, 3
Attorney at Law
1 Member of the Audit Committee2 Member of the Compensation Committee3 Member of the Nominating/Corporate
Governance Committee

SOUTHWEST SECURITIES, INC.
Clearing Services:
1201 Elm StreetSuite 3500Dallas, Texas 75270 (877) 797-6613
100 Broadway, 9th FloorNew York, New York 10005 (877) 797-6613
Corporate Finance:
1201 Elm StreetSuite 3500Dallas, Texas 75270(214) 859-9407
Municipal Finance:
1201 Elm StreetSuite 3500Dallas, Texas 75270 (214) 859-5800
2533 South Coast Highway 101Suite 210Cardiff, California 92007 (760) 632-1347
15760 Ventura BoulevardSuite 2000Encino, California 91436(818) 789-9974
2600 Michelson DriveSuite 740Irvine, California 92612(949) 717-2009
51 Riverside Avenue Westport, Connecticut 06880(203) 293-1999
11770 US Highway 1East TowerSuite 304EPalm Beach Gardens, Florida 33408(561) 627-4145
1 South Wacker DriveSuite 2290Chicago, Illinois 60606(312) 706-0774
360 East Vine StreetSuite 110Lexington, Kentucky 40507(859) 410-2602
302 Country Club Monroe, Louisiana 71201(318) 323-3224
6565 Americas Parkway NE Suite 239Albuquerque, New Mexico 87110(505) 563-5860
75 Old HighwayHillsdale, New York 12529(518) 325-5020
100 Broadway, 9th FloorNew York, New York 10005(518) 325-5020
10700 Sikes PlaceSuite 105Charlotte, North Carolina 28277(704) 321-2004
1219 Assembly Street, Suite 202Columbia, South Carolina 29201(803) 765-1004
1661 International DriveSuite 417Memphis, Tennessee 38120(901) 818- 3187
700 Central Expressway SouthSuite 410Allen, Texas 75013(214) 859-9498
701 Brazos Street Suite 400Austin, Texas 78701(512) 320-5860
1127 Judson RoadSuite 242Longview, Texas 75601(903) 758-0111
4040 Broadway Suite 220San Antonio, Texas 78209(210) 474-7311
Taxable Fixed Income:
1201 Elm StreetSuite 3500Dallas, Texas 75270(877) 883-2663
15760 Ventura Boulevard Suite 2000Encino, California 91436(818) 212-2032
44 Montgomery Street Suite 4020San Francisco, California 94104(415) 489-1940
32186 Castle CourtSuite 250Evergreen, Colorado 80439(877) 779-0314
50 Albany TurnpikeCanton Gateway Office ParkSuite 2020Canton, Connecticut 06019(860) 269-8668
146 Nurmi DriveFort Lauderdale, Florida 33301(954) 468-2366
500 East Broward BoulevardSuite 128Fort Lauderdale, Florida 33394(954) 463-6001
1 South Wacker DriveSuite 2290Chicago, Illinois 60606(312) 706-0750
300 Broadacres DriveSuite 315Bloomfield, New Jersey 07003(888) 602-6856
100 Broadway, 9th FloorNew York, New York 10005(877) 628-9700
7000 North MoPac ExpresswaySuite 400Austin, Texas 78731(855) 764-9246
O F F I C E L O C A T I O N S

Private Client Group:
1201 Elm StreetSuite 3500Dallas, Texas 75270(214) 859-1800
8350 Wilshire BoulevardBeverly Hills, California 90211(323) 658-4400
24600 Silver Cloud CourtSuite 200Monterey, California 93940 (831) 718-9800
2804 Gateway Oaks DriveSuite 100Sacramento, California 95833 (916) 567-6600
750 B StreetSuite 3100San Diego, California 92101 (619) 234-2242
50 California StreetSuite 2700San Francisco, California 94111 (415) 263-1100
10801 West Charleston BoulevardSuite 690Las Vegas, Nevada 89135 (702) 932-5522
4811 Gaillardia ParkwaySuite 105Oklahoma City, Oklahoma 73142 (405) 302-4130
1012 24th Avenue NorthwestSuite 400Norman, Oklahoma 73069 (405) 928-5900
7000 North MoPac ExpresswaySuite 400Austin, Texas 78731 (512) 340-1800
8333 Douglas AvenueSuite 400Dallas, Texas 75225 (214) 987-5200
1103 D Williams DriveGeorgetown, Texas 78628 (512) 869-1586
1500 Citywest BoulevardSuite 400Houston, Texas 77042 (832) 681-4600
3 RiverwaySuite 1400Houston, Texas 77056 (713) 808-6900
1127 Judson RoadSuite 242Longview, Texas 75601(903) 758-0111
1609 South ChestnutSuite 103Lufkin, Texas 75901(936) 639-2391
5601 Granite ParkwaySuite 300Plano, Texas 75024 (972) 624-6300
153 Treeline ParkSuite 101San Antonio, Texas 78209 (210) 841-6400
1110 East State Highway 114Suite 210Southlake, Texas 76092 (817) 375-4740
SOUTHWEST SECURITIES, FSB
1201 Elm StreetSuite 3500Dallas, Texas 75270(214) 859-1800
Full-Service Banking Centers
7401 Jefferson Street NortheastAlbuquerque, New Mexico 87109 (505) 857-6200
1860 Sudderth DriveRuidoso, New Mexico 88345 (575) 257-1414
410 West AbramArlington, Texas 76010 (817) 299-4875
4501 MatlockSuite 101Arlington, Texas 76018 (817) 557-2090
7000 North MoPac ExpresswaySuite 400Austin, Texas 78731 (512) 684-6390
1201 Elm StreetSuite 121Dallas, Texas 75270 (469) 941-1200
671 South Mesa HillsSuite 2BEl Paso, Texas 79912 (915) 581-3981
6050 Southwest BoulevardSuite 100Fort Worth, Texas 76109 (817) 962-4010
1100 East Highway 377Suite 101Granbury, Texas 76048(817) 573-2342
3 RiverwaySuite 1410Houston, Texas 77056(713) 395-3860
1110 East State Highway 114Suite 100Southlake, Texas 76092 (817) 375-4760
1791 Highway 77 NorthWaxahachie, Texas 75165 (469) 941-1400

C O R P O R A T E I N F O R M A T I O N
SWS GROUP, INC.James H. RossPresident and CEO
Corporate Headquarters1201 Elm Street, Suite 3500Dallas, Texas 75270-2180(214) 859-1800swst.com
SUBSIDIARIES
Southwest Securities, Inc.James H. RossPresident and CEO1201 Elm Street, Suite 3500Dallas, Texas 75270-2180(214) 859-1800swst.com
Southwest Securities, FSBRobert ChereckExecutive Chairman and President1201 Elm Street, Suite 3500Dallas, Texas 75270-2180(214) 859-1800banking.swst.com
SWS Financial Services, Inc.Larry G. TateCEO1201 Elm Street, Suite 3500Dallas, Texas 75270-2180(800) 241-7849swsfinancial.swst.com
Southwest Insurance AgencyWilliam NelsonPresident1201 Elm Street, Suite 3500Dallas, Texas 75270-2180(214) 859-1708(866) 797-9025insurance.swst.com
INDEPENDENTACCOUNTANTSGrant Thornton LLP1717 Main Street, Suite 1500Dallas, Texas 75201
TRANSFER AGENTComputershare Investor Services350 Indiana Street, Suite 750Golden, Colorado 80401
ANNUAL CERTIFICATIONSThe company submitted aSection 12(a) CEOCertification to the NewYork Stock Exchange onDecember 2, 2011. Thecompany filed the CEO andCFO certifications requiredunder Section 302 of theSarbanes-Oxley Act of 2002with the Securities andExchange Commission asexhibits to its 2012 Annualreport on Form 10-K.
COMMON STOCKShares of SWS Group, Inc.common stock are listed andtraded on the New YorkStock Exchange under thesymbol SWS.
FORM 10-KAdditional copies of thecompany’s fiscal 2012Annual Report to theSecurities and ExchangeCommission on Form 10-Kare available upon request bywriting to the corporateheadquarters address.
ANNUAL MEETINGThe Annual Meeting ofShareholders will be held at9:00 a.m. on November 15,2012, at 1201 Elm Street,Suite 4200, RenaissanceTower, Dallas, Texas 75270.
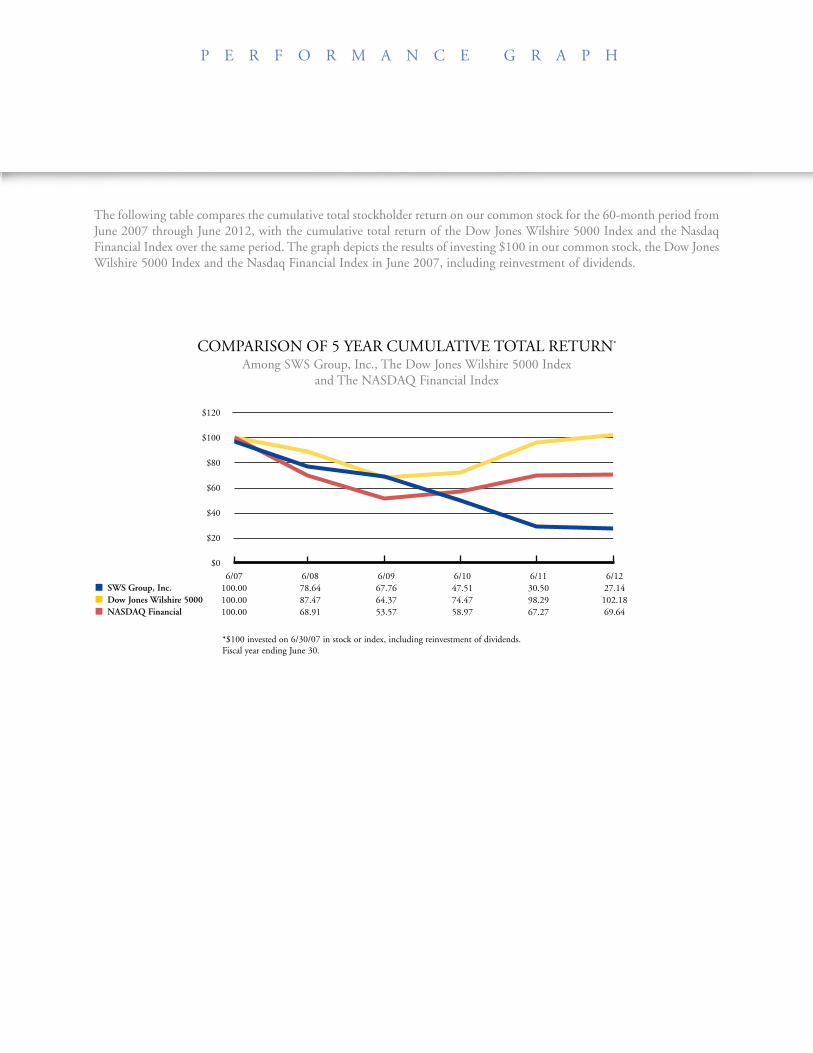
6/07100.00100.00100.00
6/0878.6487.4768.91
6/0967.7664.3753.57
6/1047.5174.4758.97
6/1130.5098.2967.27
6/1227.14102.1869.64
■ SWS Group, Inc.■ Dow Jones Wilshire 5000■ NASDAQ Financial
$120
$100
$80
$60
$40
$20
$0
COMPARISON OF 5 YEAR CUMULATIVE TOTAL RETURN*
Among SWS Group, Inc., The Dow Jones Wilshire 5000 Index and The NASDAQ Financial Index
*$100 invested on 6/30/07 in stock or index, including reinvestment of dividends.Fiscal year ending June 30.
The following table compares the cumulative total stockholder return on our common stock for the 60-month period fromJune 2007 through June 2012, with the cumulative total return of the Dow Jones Wilshire 5000 Index and the NasdaqFinancial Index over the same period. The graph depicts the results of investing $100 in our common stock, the Dow JonesWilshire 5000 Index and the Nasdaq Financial Index in June 2007, including reinvestment of dividends.
P E R F O R M A N C E G R A P H