Embed Size (px)
Citation preview

ASIAN DEVELOPMENT BANK
AsiAn Development BAnk6 ADB Avenue, Mandaluyong City1550 Metro Manila, Philippineswww.adb.org
Fiscal Responsibility and Budget Management Act in IndiaA Review and Recommendations for Reform
Prudent management of public finances remains a challenge for both developed and emerging market economies. To improve the state of public finances, in 2003, the Government of India adopted the Fiscal Responsibility and Budget Management (FRBM) Act, a landmark event in fiscal reforms, to engender fiscal sustainability by limiting central government debt and fiscal deficit levels. This paper assesses India’s experience with fiscal consolidation and performance under the FRBM Act, and compares FRBM framework against properties of fiscal frameworks. Find out about the “golden rule” and recommendations put forward on adopting appropriate fiscal rules and targets with clearly defined escape clauses, and strengthening the enforcement of fiscal rules.
About the Asian Development Bank
ADB’s vision is an Asia and Pacific region free of poverty. Its mission is to help its developing member countries reduce poverty and improve the quality of life of their people. Despite the region’s many successes, it remains home to a large share of the world’s poor. ADB is committed to reducing poverty through inclusive economic growth, environmentally sustainable growth, and regional integration.
Based in Manila, ADB is owned by 67 members, including 48 from the region. Its main instruments for helping its developing member countries are policy dialogue, loans, equity investments, guarantees, grants, and technical assistance.
FIscAl ResponsIBIlIty AnD BuDget MAnAgeMent Act In InDIAA Review and Recommendations for Reform Çiǧdem Akιn, Bruno Carrasco, Sudipto Mundle, and Abhijit Sen Gupta
adb south asiaworking paper series
no. 52
July 2017

ADB South Asia Working Paper Series
Fiscal Responsibility and Budget Management Act in India: A Review and Recommendations for Reform Çiǧdem Akιn, Bruno Carrasco, Sudipto Mundle, and Abhijit Sen Gupta
No. 52 | July 2017
Çiǧdem Akιn is a public management economist, South Asia Department, ADB Bruno Carrasco is the director of Public Management, Financial Sector, and Trade Division, South Asia Department, ADB Sudipto Mundle is emeritus professor and member of the board of governors of the National Institute of Public Finance and Policy, New Delhi-India Abhijit Sen Gupta is a senior economics officer, India Resident Mission, ADB

Creative Commons Attribution 3.0 IGO license (CC BY 3.0 IGO)
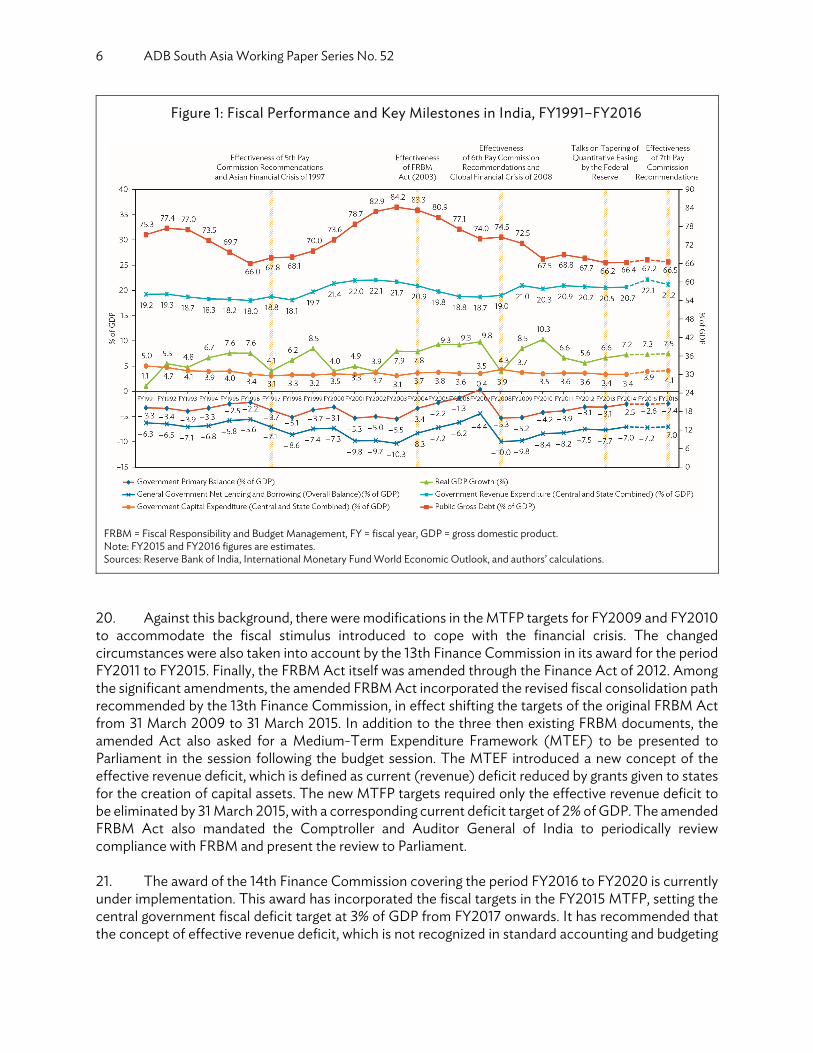
© 2017 Asian Development Bank6 ADB Avenue, Mandaluyong City, 1550 Metro Manila, PhilippinesTel +63 2 632 4444; Fax +63 2 636 2444www.adb.org
Some rights reserved. Published in 2017.
ISSN 2313-5867 (Print), 2313-5875 (e-ISSN)Publication Stock No. WPS178804-2DOI: http://dx.doi.org/10.22617/WPS178804-2
The views expressed in this publication are those of the authors and do not necessarily reflect the views and policies of the Asian Development Bank (ADB) or its Board of Governors or the governments they represent.
ADB does not guarantee the accuracy of the data included in this publication and accepts no responsibility for any consequence of their use. The mention of specific companies or products of manufacturers does not imply that they are endorsed or recommended by ADB in preference to others of a similar nature that are not mentioned.
By making any designation of or reference to a particular territory or geographic area, or by using the term “country” in this document, ADB does not intend to make any judgments as to the legal or other status of any territory or area.
This work is available under the Creative Commons Attribution 3.0 IGO license (CC BY 3.0 IGO) https://creativecommons.org/licenses/by/3.0/igo/. By using the content of this publication, you agree to be bound by the terms of this license. For attribution, translations, adaptations, and permissions, please read the provisions and terms of use at https://www.adb.org/terms-use#openaccess
This CC license does not apply to non-ADB copyright materials in this publication. If the material is attributed to another source, please contact the copyright owner or publisher of that source for permission to reproduce it. ADB cannot be held liable for any claims that arise as a result of your use of the material.
Please contact [email protected] if you have questions or comments with respect to content, or if you wish to obtain copyright permission for your intended use that does not fall within these terms, or for permission to use the ADB logo.
The ADB South Asia Working Paper Series is a forum for ongoing and recently completed research and policy studies undertaken in ADB or on its behalf. It is meant to enhance greater understanding of current important economic and development issues in South Asia, promote policy dialogue among stakeholders, and facilitate reforms and development management.
The ADB South Asia Working Paper Series is a quick-disseminating, informal publication whose titles could subsequently be revised for publication as articles in professional journals or chapters in books. The series is maintained by the South Asia Department. The series will be made available on the ADB website and on hard copy.
Notes: In this publication, “$” refers to US dollars. Corrigenda to ADB publications may be found at http://www.adb.org/publications/corrigenda
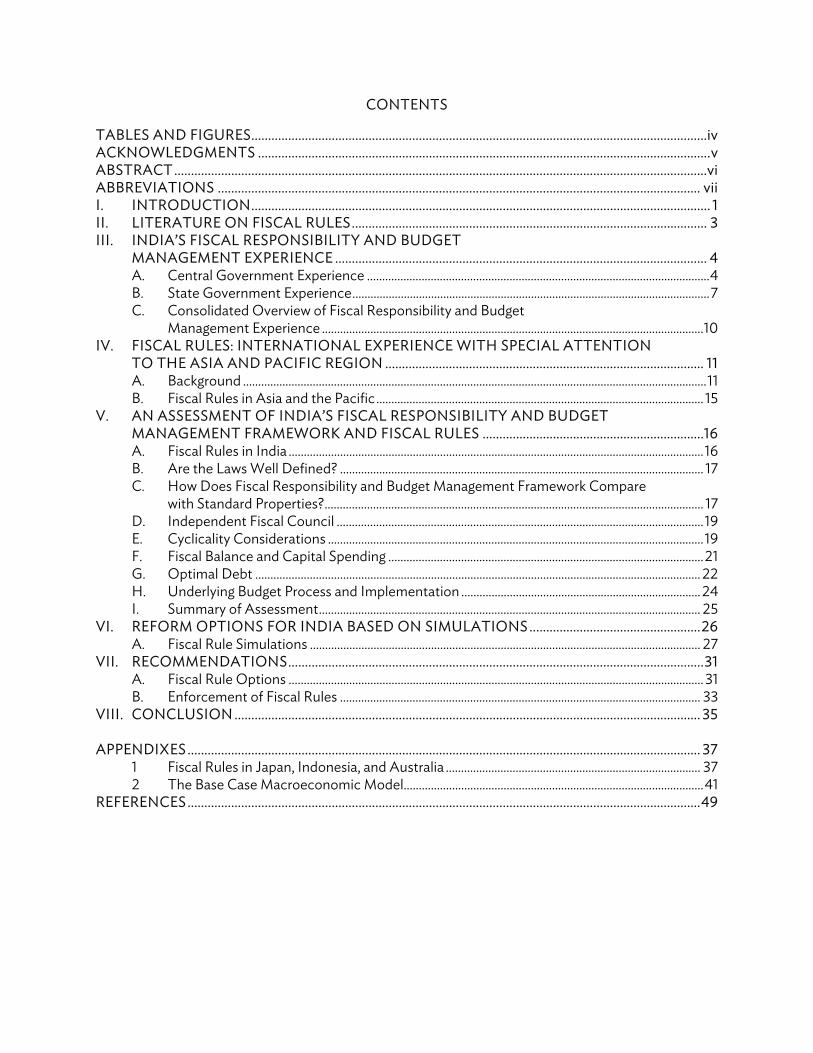
CONTENTS
TABLES AND FIGURES ........................................................................................................................................iv ACKNOWLEDGMENTS ....................................................................................................................................... v ABSTRACT ...............................................................................................................................................................vi ABBREVIATIONS ................................................................................................................................................ vii I. INTRODUCTION ......................................................................................................................................... 1 II. LITERATURE ON FISCAL RULES .......................................................................................................... 3 III. INDIA’S FISCAL RESPONSIBILITY AND BUDGET
MANAGEMENT EXPERIENCE ............................................................................................................... 4 A. Central Government Experience ................................................................................................................. 4
B. State Government Experience ...................................................................................................................... 7 C. Consolidated Overview of Fiscal Responsibility and Budget
Management Experience .............................................................................................................................. 10 IV. FISCAL RULES: INTERNATIONAL EXPERIENCE WITH SPECIAL ATTENTION
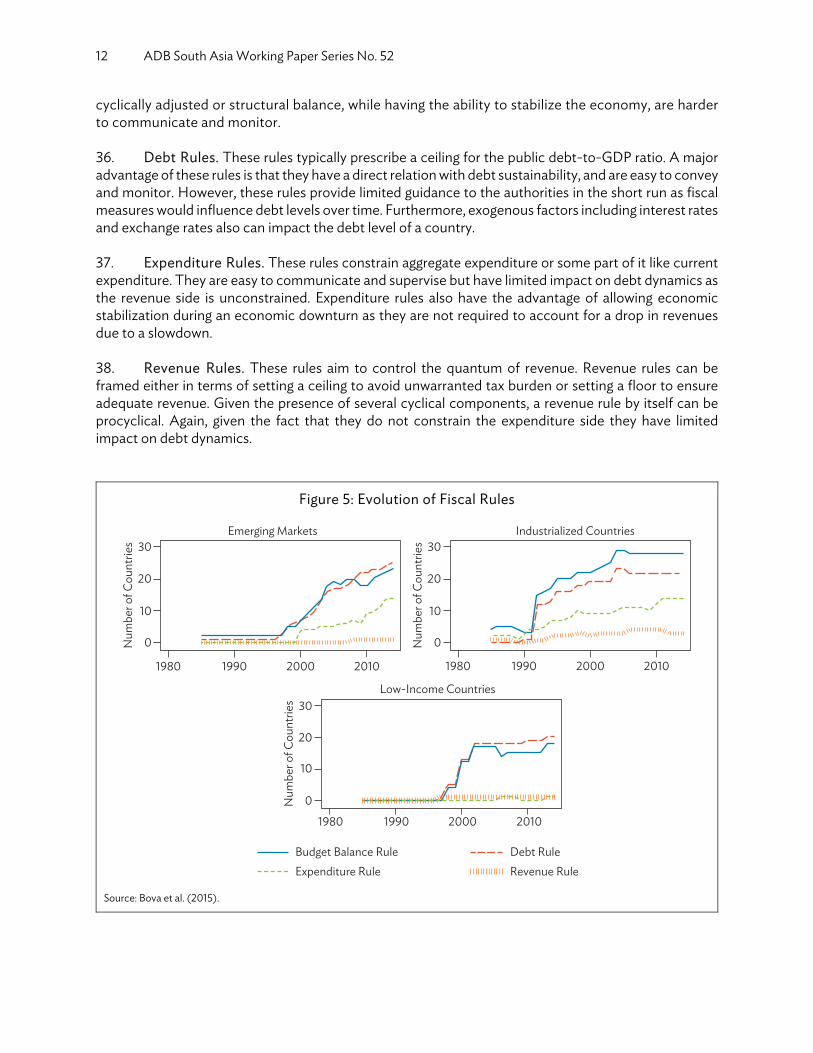
TO THE ASIA AND PACIFIC REGION ............................................................................................... 11 A. Background ......................................................................................................................................................... 11 B. Fiscal Rules in Asia and the Pacific ............................................................................................................ 15 V. AN ASSESSMENT OF INDIA’S FISCAL RESPONSIBILITY AND BUDGET
MANAGEMENT FRAMEWORK AND FISCAL RULES .................................................................. 16 A. Fiscal Rules in India ......................................................................................................................................... 16 B. Are the Laws Well Defined? ........................................................................................................................ 17 C. How Does Fiscal Responsibility and Budget Management Framework Compare
with Standard Properties? ............................................................................................................................. 17 D. Independent Fiscal Council ......................................................................................................................... 19 E. Cyclicality Considerations ............................................................................................................................ 19 F. Fiscal Balance and Capital Spending ........................................................................................................ 21 G. Optimal Debt ................................................................................................................................................... 22 H. Underlying Budget Process and Implementation ............................................................................... 24 I. Summary of Assessment .............................................................................................................................. 25 VI. REFORM OPTIONS FOR INDIA BASED ON SIMULATIONS ................................................... 26 A. Fiscal Rule Simulations ................................................................................................................................. 27 VII. RECOMMENDATIONS ............................................................................................................................ 31 A. Fiscal Rule Options ......................................................................................................................................... 31 B. Enforcement of Fiscal Rules ....................................................................................................................... 33 VIII. CONCLUSION ........................................................................................................................................... 35 APPENDIXES ......................................................................................................................................................... 37 1 Fiscal Rules in Japan, Indonesia, and Australia .................................................................................... 37 2 The Base Case Macroeconomic Model................................................................................................... 41 REFERENCES ......................................................................................................................................................... 49

TABLES AND FIGURES TABLES 1 Fiscal Reaction Function ...................................................................................................................................... 20 2 Determinants of Debt Tolerance and Debt Sustainability Assessment for India ........................... 22 FIGURES 1 Fiscal Performance and Key Milestones in India, FY1991–FY2016 ......................................................... 6 2 Gross Fiscal Deficit as a Share of Gross State Domestic Product ............................................................ 8 3 State-Wise Debt as a Share of Gross State Domestic Product ................................................................ 9 4 Capital Outlay as a Share of Gross State Domestic Product ..................................................................... 9 5 Evolution of Fiscal Rules ....................................................................................................................................... 12 6 Combination of Fiscal Rules ................................................................................................................................ 13 7 International Experience with Fiscal Councils .............................................................................................. 14 8 Remit of Fiscal Councils ........................................................................................................................................ 15 9 Economies Adopting Fiscal Rules in Asia and the Pacific ......................................................................... 15 10 Deviation from Trend Gross Domestic Product and Overall Fiscal Deficit as a
Share of Gross Domestic Product .................................................................................................................... 20 11 Government Capital Expenditures and Fiscal Balance as a Share of Gross Domestic
Product (Average of FY2010–FY2014) ........................................................................................................... 21 12 Scatter Diagram of Fiscal Deficit, Gross Debt, and Sovereign Ratings
(Average of 2010–2014) ...................................................................................................................................... 23 13 What’s Under the Hood? ..................................................................................................................................... 24 14 The Budget Process ............................................................................................................................................... 24 15 Outturn vs. Budget: Central Government Performance .......................................................................... 26 16 Countercyclicality with Structural Deficit Rule ........................................................................................... 28 17 Countercyclicality with Expenditure Rule ..................................................................................................... 28 18 Impact of 25% Increase in Public Capital Expenditure to Gross Domestic Product Ratio
(Incorporating 7th Pay Commission Shock) ................................................................................................. 29 19 Impact of Debt as a Share of Gross Domestic Product Gradually Moving to 55%
(Incorporating 7th Pay Commission Shock) ................................................................................................. 29 20 Impact of Debt as a Share of Gross Domestic Product Gradually Moving to 60%
(Incorporating 7th Pay Commission Shock) ................................................................................................. 30 21 Impact of Debt as a Share of Gross Domestic Product Gradually Moving to 70%
(Incorporating 7th Pay Commission Shock) ................................................................................................. 30
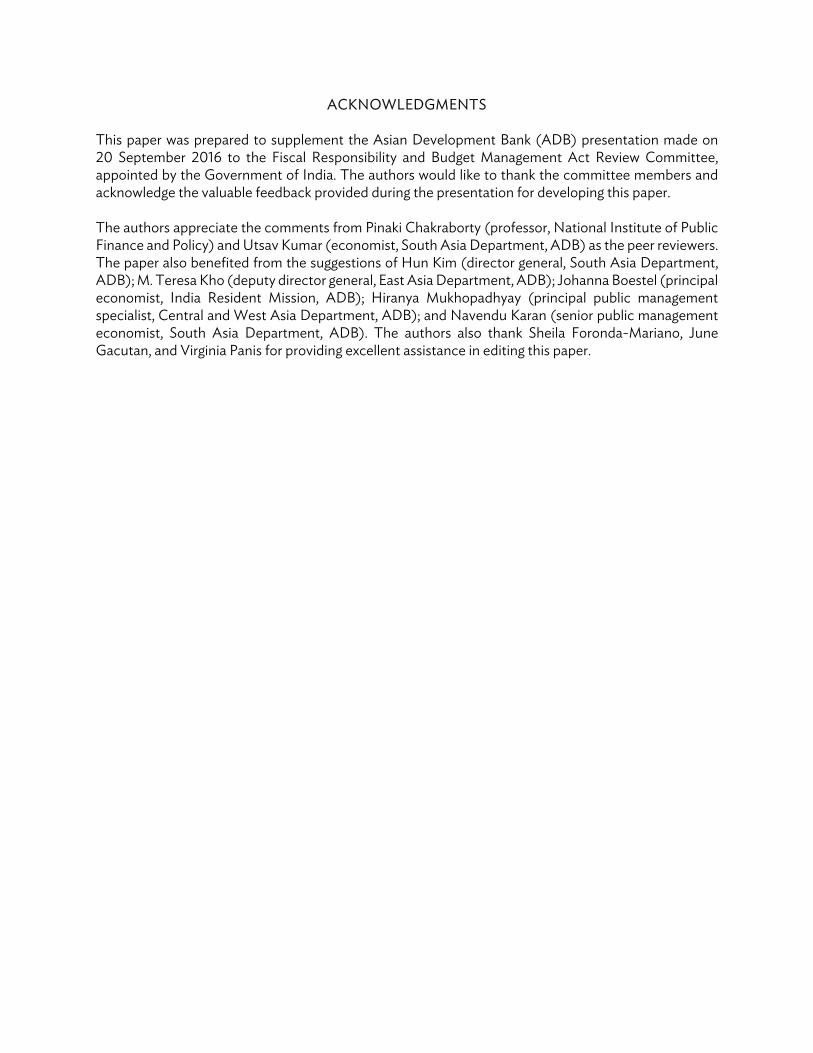
ACKNOWLEDGMENTS This paper was prepared to supplement the Asian Development Bank (ADB) presentation made on 20 September 2016 to the Fiscal Responsibility and Budget Management Act Review Committee, appointed by the Government of India. The authors would like to thank the committee members and acknowledge the valuable feedback provided during the presentation for developing this paper. The authors appreciate the comments from Pinaki Chakraborty (professor, National Institute of Public Finance and Policy) and Utsav Kumar (economist, South Asia Department, ADB) as the peer reviewers. The paper also benefited from the suggestions of Hun Kim (director general, South Asia Department, ADB); M. Teresa Kho (deputy director general, East Asia Department, ADB); Johanna Boestel (principal economist, India Resident Mission, ADB); Hiranya Mukhopadhyay (principal public management specialist, Central and West Asia Department, ADB); and Navendu Karan (senior public management economist, South Asia Department, ADB). The authors also thank Sheila Foronda-Mariano, June Gacutan, and Virginia Panis for providing excellent assistance in editing this paper.

ABSTRACT The paper assesses India’s experience with fiscal consolidation and performance under the Fiscal Responsibility and Budget Management (FRBM) Act. While the introduction of FRBM rules helped consolidate the finances of both the central and state governments, key challenges under the FRBM Act remain such as (i) a weak linkage between budget policy setting and operational framework, (ii) insufficient coverage or assessment of fiscal risks, and (iii) inadequate course correction under the transparency and accountability framework when fiscal objectives went “off-track.” The paper reviews the international experience and global best practices on fiscal rules, types of rules, introduction of fiscal councils and compares India’s FRBM framework against properties of fiscal frameworks, including fiscal balance, capital spending, optimal debt levels, cyclical considerations, and underlying budget processing and implementation. India’s fiscal rules follow mainly a traditional balanced budget rule with no debt ceiling law while emerging best practices have moved toward either a structural budget balance rule or an expenditure rule. As a consequence, the fiscal framework in India is less flexible to manage the dual goals of fiscal stabilization and debt sustainability. Limited coverage, vague escape clauses, and lack of independent fiscal institutions to monitor compliance with fiscal rules have also led to inefficiencies in implementation. The paper analyzes various reform options based on quantitative fiscal rule simulations, including (i) fiscal prudence with countercyclical stabilization, (ii) anchoring fiscal rules in a debt target vs. a fiscal deficit target, (iii) implications of different aggregate debt targets, and (iv) harmonizing fiscal rules with adequate public investment to stimulate private investment. Quantitative fiscal rule simulations based on a simultaneous equations model show that fiscal deficit, primary deficit, and public debt ratio all gradually decline as a result of a prudent increase in capital expenditure through the interactions of the model. This points to the scope for India to reorient public expenditures toward growth-enhancing investment while maintaining overall fiscal objectives. Finally, the paper presents recommendations on adopting appropriate fiscal rules and targets with clearly defined escape clauses, and strengthening the enforcement of fiscal rules. These include measures such as (i) the establishment of independent fiscal councils; (ii) full-fledged fiscal stability reporting, addressing the coverage of off-budget items like contingent liabilities; (iii) improving linkages between fiscal policy and budget processes; (iv) sharing of responsibilities and coordination within tiers of government for stabilization and sustainability; and (v) introducing state credit ratings for measuring fiscal performance. JEL Classification: E61, E62, H6 Keywords: fiscal management, fiscal policy, fiscal reforms, public debt sustainability, India
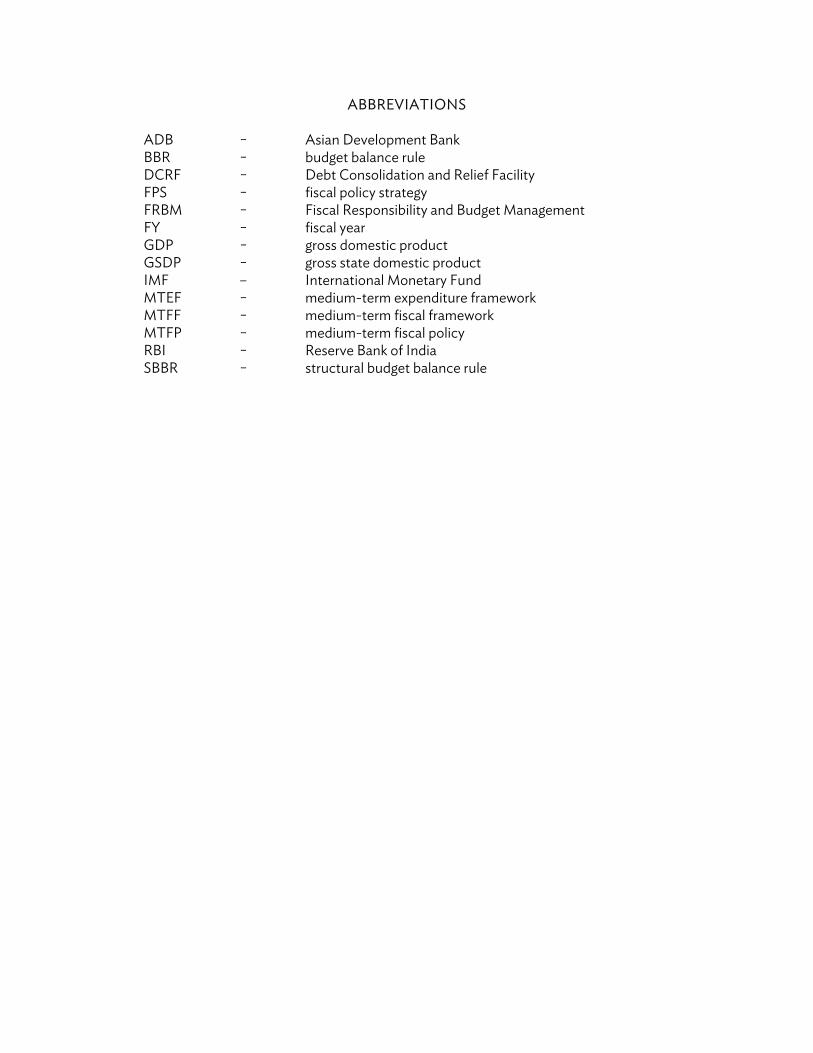
ABBREVIATIONS
ADB − Asian Development Bank BBR − budget balance rule DCRF − Debt Consolidation and Relief Facility FPS − fiscal policy strategy FRBM − Fiscal Responsibility and Budget Management FY − fiscal year GDP − gross domestic product GSDP − gross state domestic product IMF – International Monetary Fund MTEF − medium-term expenditure framework MTFF − medium-term fiscal framework MTFP − medium-term fiscal policy RBI − Reserve Bank of India SBBR − structural budget balance rule
I. INTRODUCTION
1. Despite general improvements over time, prudent management of public finances continues to be a challenge for both developed and emerging market economies. Due to competing demands for scarce public resources, electoral cycles and at times distorted incentives coupled with vested interests, there is a tendency for governments to overspend during good years and thereby limiting room for countercyclical response in bad years, leading to deficit bias. (Rogoff 1990, Debrun and Kumar 2007). 2. To contain these pressures, recent efforts have focused on establishing rules and frameworks for strengthening fiscal responsibility, transparent fiscal management, and strengthening the coordination between the monetary–fiscal policy mix. A fiscal rule in its very essence is a legislated numerical limit on a budgetary aggregate with the main objective of ensuring sustainability of public finances (Kopits and Symansky 1998). Establishing a credible medium-term anchor has been a common motive for adopting fiscal rules to improve policymaking, including the twin goals of fiscal stability over the short term and debt sustainability over the medium term. Fiscal rules also enhance the market credibility of the fiscal consolidation path (similar to the rules vs. discretion debate for monetary policy [Kydland and Prescott 1977]) while correcting imbalances. Adopting fiscal rules, including automatic stabilizers and/or countercyclical fiscal policy stance, serves the objective of containing variability and therefore uncertainty in output and inflation that could arise due to misalignment in the timing of discretionary fiscal policy and the impact on the aggregate demand considering the interactions with the monetary policy and other macroeconomic factors (Taylor 2000). Fiscal rules also help achieve the commitment for long-term macroeconomic reforms while maintaining flexibility in response to economic shocks, and support intergenerational equity considerations (Schaechter et al. 2012). Many countries have adopted a combination of fiscal rules reflecting their country-specific needs and institutional capacity. Recent research indicates that the number of countries employing fiscal rules has gone from 7 in 1990 to 92 in 2015 (Lledó et al. 2017, Bova et al. 2015). 3. To improve the state of public finances, in 2003, the Government of India adopted a rule-based fiscal framework, the Fiscal Responsibility and Budget Management (FRBM) Act with the objective of engendering fiscal sustainability by limiting central government debt and fiscal deficit levels. Under the FRBM Act, the fiscal deficit was to be reduced steadily to 3% of gross domestic product (GDP) and revenue (current) deficit be eliminated by fiscal year (FY)2009.1 Subsequently, similar fiscal responsibility laws were adopted in most states, with the states being given various incentives to adhere to these laws.
4. One of the concerns raised about the existing FRBM Act is its reliance on fixed targets or numbers. This is a shortcoming as focusing on a fixed point for the fiscal deficit—as compared with a range, for example—restricts the government from dealing with dynamic situations typical of market economies. The requirement to achieve a fixed number has prevented fiscal policy from being countercyclical when needed. The FRBM Act has also been criticized because of incorporating imprecisely defined fiscal deficit escape clauses and limited accountability in the event of missed targets.
5. With fiscal consolidation continuing to remain an important priority, the Government of India established a committee in May 2016, tasked with reviewing the FRBM Act. The committee was also responsible for evaluating various considerations for determining fiscal consolidation targets, and giving
1 In the context of India, revenue deficit refers to current deficit. The fiscal year (FY) of the Government of India and its
agencies begins on 1 April and ends on 31 March. FY before a calendar year denotes the year in which the fiscal year ends, e.g., FY2016 begins on 1 April 2015 and ends on 31 March 2016.
2 ADB South Asia Working Paper Series No. 52
recommendations on the road map for fiscal consolidation. This paper was prepared in response to an invitation by the FRBM Act Review Committee to the Asian Development Bank (ADB) to review the framework and operations of the FRBM Act in line with the international best practices, and in particular, the Asian experience. A presentation was delivered to the committee chaired by N.K. Singh on 20 September 2016. The present paper supplements the presentation.2
6. This paper assesses the Indian experience of fiscal rules against the background of international experience and global best practices, and analyzes various reform options based on quantitative fiscal rule simulations. The rest of the paper is structured as follows. The introduction is followed by section II that provides a brief summary of the literature on fiscal rules. Section III assesses India’s experience and performance with FRBM legislation at the central and state levels in the context of India’s federal structure. Section IV reviews international experience and global best practices on fiscal rules, and the introduction of fiscal councils with a focus on the Asia and Pacific region. Section V assesses India’s fiscal rules and compares the FRBM framework against international best practices and properties of fiscal frameworks in other countries, including fiscal balance, capital spending, optimal debt levels, cyclical considerations, and underlying budget processing and implementation. Section VI analyzes various reform options using quantitative simulations based on simultaneous equations model. These include fiscal rules that combine fiscal prudence with countercyclical stabilization, anchoring fiscal rules in a debt target vs. a fiscal deficit target, implications of different aggregate debt targets, and harmonizing fiscal rules with adequate public investment to stimulate private investment. Section VII presents the key recommendations based on the analyses while section VIII concludes. 7. The analyses in the paper provide the following findings: Firstly, while the introduction of FRBM rules helped to consolidate India’s public finances, the key challenges remain. These include (i) a weak linkage between policy setting and operational framework in the budget processes and the budget implementation, (ii) insufficient coverage or assessment of fiscal risks, and (iii) inadequate course correction under the transparency and accountability framework when fiscal objectives went “off-track.” Secondly, while emerging best practices have moved toward a structural budget balance rule or an expenditure rule, India’s fiscal rules are found to be mainly in the realm of traditional budget balance rule with no debt ceiling law. Limited coverage, vague escape clauses, and lack of independent fiscal institutions to monitor compliance also have led to inefficiencies in implementation. Thirdly, the numerical simulations indicate that fiscal deficit, primary deficit, and public debt ratios all gradually decline as a result of prudently higher capital expenditure through the interactions of the model. This points to the scope for India to reorient public expenditures toward growth-enhancing investment while maintaining overall fiscal discipline. 8. Based on the analyses, the key recommendations of the paper include adopting appropriate fiscal rules and targets with clearly defined escape clauses, and strengthening the enforcement of fiscal rules. These include measures such as (i) the establishment of independent fiscal councils; (ii) full-fledged fiscal stability reporting, addressing the coverage of off-budget items like contingent liabilities; (iii) improving linkages between fiscal policy and budget processes; (iv) sharing of responsibilities and coordination within tiers of government for stabilization and sustainability; and (v) introducing state credit ratings for measuring fiscal performance.
2 The Fiscal Responsibility and Budget Management (FRBM) Review Committee published its final report on January 2017,
which set a debt-to-gross domestic product (GDP) ratio of 60% for the general government, consisting of 40% for central government and 20% for state government. Within this framework, the committee recommended a 3% fiscal deficit during FY2018–FY2020.

Fiscal Responsibility and Budget Management Act in India: A Review and Recommendations for Reform 3
II. LITERATURE ON FISCAL RULES 9. Fiscal rules are widespread across economies. Two important factors underpin the advent of fiscal rules, i.e., the recognition of the role of sound fiscal policy to overall macroeconomic stability, and the rules vs. discretion debate. The Washington Consensus spurred greater interest in the importance of hard rules to ensure greater predictability of macroeconomic outcomes and to strengthen economic fundamentals. Fiscal rules are used to counter the deficit bias arising out of the time inconsistency problem and the common pool theory. The time inconsistency problem, outlined by Alesina and Tabellini (1990) arises when policy makers promise in advance to be fiscally prudent, but want to renege on these promises afterward based on economic or political reasons. "Political business cycle" pressures often lead to expansionary fiscal policy (i.e., increase in spending or tax cuts) in the short run, even though such stimulus would be inflationary and lead to fiscal deficits in the long run. Time inconsistency, in which there is a temptation to announce one policy now and follow another one later, is a problem for fiscal policy as well as for monetary policy (Taylor 2000). Similarly, as per the common pool problem formalized by Von Hagen and Harden (1995) and Velasco (1999), several policy makers are involved in formulating the budget. Tax revenues represent a common resource for the policy makers and since the fiscal deficit represent claims on future tax revenues, the fiscal deficit is treated as common pool as well. Thus, when policy makers wish to enact tax reform or raise spending that benefits their constituency, the cost of these measures will result in a higher future tax burden that will be shared by all constituencies. Thus, unconstrained policy makers will always tend to enact policies that raise the fiscal deficit. 10. By enshrining the rule under legislation, it serves to anchor fiscal policy and holds back governments from changing the rules at their discretion. Fiscal rules hold governments accountable to maintain aggregate spending in line with aggregate revenue mobilization capacity and keep the public debt at sustainable levels. Fiscal rules also help maintain the intergenerational equity by preventing short-sighted expansionary fiscal policies and overaccumulation of debt at the expense of impoverishing future generations through crowding out of investment and shifting the tax burden to finance future budget deficits (Stern 1987). Fiscal rules also help contain the macroeconomic uncertainties associated with the timing, size, and unpredictable economic transmission mechanisms of discretionary fiscal policies (Burnside et al. 2000). Schaechter et al. (2012) characterize fiscal rules as having numerical targets (ceiling or floor) that are set on government budgetary aggregates (expenditure, revenue, budget balance, and/or public debt) and bound in legislation and fiscal arrangements. A detailed discussion of various kinds of fiscal rules is provided in section IV. 11. Fiscal rules vary significantly across countries reflecting the country-specific institutions, and the needs of the economy. Kopits and Symansky (1998) stress that fiscal rules can enhance their effectiveness if they are (i) well defined, (ii) transparent, (iii) simple, (iv) adequate with respect to the specified goals, (v) consistent with macroeconomic policies, (vi) flexible to accommodate cyclical fluctuations and shocks, (vii) enforceable, (viii) independently monitored, and (ix) supported by efficient policy measures. 12. Recent literature stresses prudence as one of the characteristics of effective fiscal policymaking along with (i) smoothing business cycles through countercyclical policies, (ii) growth-friendly tax and spending policies, (iii) inclusiveness, and (iv) strong tax mobilization capacity (Gaspar and Eyraud 2017). While fiscal rules are not a panacea and cannot always guarantee fiscal sustainability, they have become a popular mechanism to anchor fiscal policy, infuse fiscal discipline, and promote credibility (Wright et al. 2017). Over time, adhering to the targets under fiscal rules is believed to confer greater government credibility in maintaining sound economic management in relation to market participants, strengthening

4 ADB South Asia Working Paper Series No. 52
transparency and accountability of the fiscal authorities. The stronger the government’s ability to convincingly communicate and explain any temporary deviations from the subscribed targets, the lower will be the level of uncertainty on the part of economic agents and the greater will be the level of government credibility. For example, greater predictability on future tax liabilities allows households to better account for their disposable income and subsequently plan their consumption behavior. Enhanced credibility of the government facilitates access to financial markets at a much lower cost. Greater predictability of future interest rates facilitates investment decisions. The upshot is likely to be sustained macroeconomic stability, investment, and growth. With this background, the following sections elaborate the Indian and international experience with fiscal rules in more detail.
III. INDIA’S FISCAL RESPONSIBILITY AND BUDGET MANAGEMENT EXPERIENCE
13. India is a federal country, with a clearly defined constitutional assignment of taxation and expenditure responsibilities for the union (or central) government and the state governments.3 India’s fiscal framework and its experience with fiscal rules therefore should be reviewed separately for these two tiers of government. A. Central Government Experience 14. At the central level, a medium-term fiscal policy, with specific 3-year targets for the fiscal and current deficits was introduced as early as the mid-1980s. However, these were discretionary targets adopted by the Ministry of Finance and not a mandate legislated by Parliament. Fiscal rules for the Government of India were first legislated by Parliament in FRBM Act in August 2003, and became effective from July 2004. Following on the FRBM Act, many states enacted their own FRBM acts (see section B). 15. The FRBM Act did not lay down any fiscal targets, but required the Government of India to set these targets every fiscal year in a 3-year rolling plan called the Medium-Term Fiscal Policy (MTFP) Statement. These targets include revenue receipts, revenue expenditure, current deficit, and borrowing for capital expenditure, hence the total fiscal deficit. The FRBM Act also required the central government to produce annually a Fiscal Policy Strategy (FPS) Statement which would, among other things, specify the annual policy and underlying rationale relating to tax and nontax revenue, e.g., administered prices, market borrowing and other direct liabilities, contingent liabilities such as guarantees, investment, lending, expenditure (including subsidies), and the strategic priorities and their consistency with the MTFP. The FRBM Act further required the government to annually provide a macroeconomic framework statement incorporating its assessment and assumptions relating to GDP, revenue balance, gross fiscal balance, and the current account in the balance of payments.
16. Emphasizing the need for fiscal prudence and transparency, the FRBM Act also required that the MTFP, FPS, and macroeconomic framework statements be presented in a specified format. The three documents have since been included in the official set of budget documents presented along with the annual budget. Further, although the FRBM Act did not specify annual targets, it indicated that the Government of India should set, through fiscal rules presented to Parliament, annual targets for elimination of revenue deficit and reduction of the fiscal deficit during the 3-year period ending on 31
3 In 2016, India approved a major tax reform that would allow the implementation of the Goods and Services Tax, starting from
1 July 2017, which would subsume a plethora of indirect taxes imposed both by the center and the states. This is expected to significantly simplify the indirect tax regime and introduce numerous economic gains.
Fiscal Responsibility and Budget Management Act in India: A Review and Recommendations for Reform 5
March 2008. It also required the government to specify annual targets for assuming contingent liabilities in the form of guarantees and total liabilities as a percentage of GDP. In case the MTFP targets are exceeded due to exceptional conditions of national security or natural calamity specified by the government, the FRBM Act required these exceptions to be approved by Parliament. Finally, the FRBM Act disallowed the central government to borrow from the Reserve Bank of India (RBI) except for temporary cash management purposes under specified limits and conditions. 17. Introduction of the FRBM regime initially led to significant improvement in the Government of India’s public finances. Thus, compared with 6.2% of GDP in FY2002, the government’s fiscal deficit declined to 4.0% in FY2005 and further to 2.5% in FY2008. Though the government’s current deficit could not be eliminated, it declined from 4.4% in FY2002 to 2.5% in FY2005 and further to 1.1% by FY2008. Thereafter, the program of fiscal consolidation was disrupted following the global financial crisis of 2008 and subsequent growth slowdown. The government’s fiscal deficit shot up to 6% of GDP, with the current deficit rising to 4.5% in FY2009. The government’s capital expenditure, which was low at around 2% to 3% of GDP, shrank further to only 1.5% in FY2009.4 Interestingly, there was a slight decline in the government’s public debt, from 40.2% of GDP in FY2006 to 38.1% in FY2009. Internal public debt amounted to 35.9% of GDP in FY2009. Total liabilities—which include liabilities on public accounts such as deposits under provident fund and national small savings scheme in addition to public debt—also continued to decline from 61.2% in FY2006 to 56.1% in FY2009 and further below 50% by FY2014.5 18. Three objectives are explicitly stated in the FRBM Act: (i) ensure intergenerational equity in fiscal management, (ii) achieve fiscal sustainability necessary for long-term macroeconomic stability, and (iii) improve transparency of central government fiscal operations. Comparing the actual performance against each of these objectives individually, we observe in Figure 1 that under (i) gross debt (center and states combined) declined from 83.3% of GDP in FY2004 to 66.5% in FY2016; under (ii) fiscal deficit declined from 8.3% of GDP in FY2004 to 7% in FY2016 and GDP growth rates remained robust at 7%–8% per annum; and under (iii) there has been improved transparency of fiscal operations at the central level although there remains room for improvement. Indeed, original targets were postponed twice, the framework does not envisage a definitive timeframe for addressing deviations from target, and off-budget items such as reporting on contingent liabilities could be stronger. To sum up, the view is that measured against these objectives, the FRBM framework has been broadly positive. 19. Figure 1 traces the major fiscal aggregates from FY1991–FY2016 as measured against important milestones. Since the introduction of FRBM, public debt as a share of GDP has declined as stated earlier and despite the deterioration in the primary balance in FY2008, the overall trend on primary balance and overall fiscal balance has been positive. Going back in time, the largest “shocks” have reflected internal Pay Commission6 salary increase awards both in FY1997 and FY2008, although in the latter instance it also coincided with the advent of the global financial crisis and the general call by the Group of Twenty for fiscal stimulus. An important feature is that government capital spending has been rather moderate and generally stable although accommodative to fiscal consolidation needs (Chakraborty 2017).
4 Government of India, Ministry of Finance. Various years. Indian Public Financial Statistics. New Delhi. 5 Government of India, Ministry of Finance. Various years. Status Paper on Government Debt. New Delhi. 6 Pay Commission gives recommendations regarding work and pay structure of all civil and military employees of the
Government of India. Since India's Independence, seven pay commissions have been set up intermittently.
6 ADB South Asia Working Paper Series No. 52
Figure 1: Fiscal Performance and Key Milestones in India, FY1991–FY2016
FRBM = Fiscal Responsibility and Budget Management, FY = fiscal year, GDP = gross domestic product. Note: FY2015 and FY2016 figures are estimates. Sources: Reserve Bank of India, International Monetary Fund World Economic Outlook, and authors’ calculations.
20. Against this background, there were modifications in the MTFP targets for FY2009 and FY2010 to accommodate the fiscal stimulus introduced to cope with the financial crisis. The changed circumstances were also taken into account by the 13th Finance Commission in its award for the period FY2011 to FY2015. Finally, the FRBM Act itself was amended through the Finance Act of 2012. Among the significant amendments, the amended FRBM Act incorporated the revised fiscal consolidation path recommended by the 13th Finance Commission, in effect shifting the targets of the original FRBM Act from 31 March 2009 to 31 March 2015. In addition to the three then existing FRBM documents, the amended Act also asked for a Medium-Term Expenditure Framework (MTEF) to be presented to Parliament in the session following the budget session. The MTEF introduced a new concept of the effective revenue deficit, which is defined as current (revenue) deficit reduced by grants given to states for the creation of capital assets. The new MTFP targets required only the effective revenue deficit to be eliminated by 31 March 2015, with a corresponding current deficit target of 2% of GDP. The amended FRBM Act also mandated the Comptroller and Auditor General of India to periodically review compliance with FRBM and present the review to Parliament. 21. The award of the 14th Finance Commission covering the period FY2016 to FY2020 is currently under implementation. This award has incorporated the fiscal targets in the FY2015 MTFP, setting the central government fiscal deficit target at 3% of GDP from FY2017 onwards. It has recommended that the concept of effective revenue deficit, which is not recognized in standard accounting and budgeting

Fiscal Responsibility and Budget Management Act in India: A Review and Recommendations for Reform 7
practices, be given up. However, it has adopted a relatively liberal target for the current deficit, allowing for a gradual decline to 0.93% by FY2020. The MTFP FY2017 has set the fiscal deficit target at 3.5% for FY2017 and 3% from FY2018 onwards. The current deficit target has been set at 2.3% for FY2017, 1.8% for FY2018, and 1.3% for FY2019. B. State Government Experience 22. Prior to the introduction of state-level FRBMs, the picture across states was quite mixed. Several states had already started setting medium-term fiscal consolidation targets, and introduced measures to enhance revenues or contain expenditure, cap contingent liabilities, set up sinking funds to finance debt repayment, and guarantee redemption funds. Some states had even introduced their own fiscal consolidation laws. At the other extreme, some states were continuing to borrow imprudently instead of strengthening their tax effort. A concerted effort toward introducing FRBM for all states followed from the recommendations of the 12th Finance Commission in FY2005. 23. The 12th Finance Commission recommended that states should discontinue borrowing from the central government and instead directly borrow from the market. In the case of states with weak finances, which find it difficult to borrow from the market, the central government could borrow on their behalf and pass on the proceeds to the concerned states at interest rates aligned to the marginal cost of loans for the central government. External loans were also passed on to the states, along with the interest cost, with the Government of India acting as intermediary. Most importantly, the commission recommended creation of the Debt Consolidation and Relief Facility (DCRF), which would consolidate the outstanding central loans to a state as of 31 March 2004 and reschedule them for a fresh 20-year term at 7.5% interest, along with a significant debt write off. However, access to the DCRF was made conditional on a state enacting its own FRBM law, and setting a target to eliminate its current deficit by FY2009 and reduce its fiscal deficit to 3% of gross state domestic product (GSDP) by this date.
24. Access to the DCRF gave considerable relief to the states, with the debt write off and rescheduling substantially reducing their interest burden. There was also increased devolution from the Government of India due to buoyant revenues in a period of high growth. States also undertook significant fiscal consolidation measures as required by their FRBM rules. By FY2011 all states had introduced their state-specific FRBMs. States also introduced value-added tax, retired high cost debt under a central government debt swap scheme, and undertook expenditure rationalization. This process of fiscal consolidation was reinforced by recommendations of the 13th Finance Commission. It recommended a revised road map considering the impact of the 2008 global financial crisis shock, such as reduction of excise duties and slower revenue growth, as well as the impact of the Sixth Pay Commission recommendations, introduced in most states in FY2010 or FY2011.
25. The 14th Finance Commission introduced a new framework of flexibility to fiscally prudent states for additional borrowing of up to 0.5% of GSDP each year above the annual fiscal deficit threshold limit of 3% upon fulfillment of certain conditions. Accordingly, implicit targets have been set for the states for (i) restricting interest payments at or below 10% of their revenue receipts, (ii) curtailing debt below 25% of their GSDP, and (iii) maintaining a balanced or surplus revenue account. An earlier framework was based on a performance incentive grant under the 13th Finance Commission or debt relief and debt consolidation under the 12th Finance Commission if a state adhered to a fiscal rule. With these rules, improvement in states’ finances have been observed. Their combined gross fiscal deficit has

8 ADB South Asia Working Paper Series No. 52
been well below the target of 3% of GSDP since FY2007.7 Their combined current deficit had also been eliminated by the same year, though a small current deficit has re-appeared in some years (Figure 2). Of course, there are large variations across states. Several states still have fiscal deficits over 3% of GSDP and Punjab, Kerala, and West Bengal have had current deficits in some years. To help the lagging states, the Government of India has facilitated ADB support for fiscal consolidation in states such as Assam and West Bengal. Similar support has also been considered for Punjab.
Figure 2: Gross Fiscal Deficit as a Share of Gross State Domestic Product
BE = budget estimate, FY = fiscal year, RE = revised estimate. Source: Reserve Bank of India, State Finances, A Study of Budgets. Various years.
26. Under the Indian federal structure, states have a preponderance of expenditure assignment relative to own revenues thereby resulting in a vertical imbalance in the fiscal federal framework. Indian states have introduced state level fiscal rules in different time periods. For example, Karnataka introduced its own FRBM Act in 2002 preceding India’s FRBM Act of 2003, while in other states such as West Bengal, it followed later in 2010. However, the general trend across all states has been one of fiscal consolidation and reduction in state-level debt-to-GSDP ratios. From Figure 2, we observe that the largest improvement in gross fiscal deficit as a share of GSDP across selected states has been in Odisha since early 2000s. More importantly, in Figure 3, debt-to-GSDP has declined across all states in the sample during this period with the exception of Karnataka and Tamil Nadu, which remained stable. Finally, from Figure 4, there has even been a recent evidence of fiscal consolidation that has not been driven by cutbacks in growth of capital spending from the budget including in Odisha and West Bengal.
7 Figures 2–4 display the fiscal indicators for selected states that have achieved major fiscal consolidation results over time.
Tamil Nadu, West Bengal, and Punjab are selected as examples of large states that have benefited from fiscal reforms.
4.7
2.0
3.2 3.22.8 2.7
2.8
2.8
2.7 2.7
5.3
3.23.3 3.4
2.8
4.1 4.3 4.3
3.2 3.1
8.0
0.10.3
1.4
0.3
–0.3
0.0
1.7
2.9 3.0
6.2
3.3
4.0
3.2 3.2 3.33.3
2.83.0 3.0
3.7
1.4
2.5
2.5
3.2
2.6 2.22.4 2.8
2.9
7.2
4.4
3.8
6.3
4.1
3.3
3.2
3.63.0
1.7
2.32.4
2.92.1
1.9 2.02.2
2.92.4
–1
0
1
2
3
4
5
6
7
8
9
FY2000–FY2003Average
FY2004–FY2008Average
FY2009 FY2010 FY2011 FY2012 FY2013 FY2014 FY2015(RE)
FY2016(BE)
%
Karnataka Kerala Odisha Punjab Tamil Nadu West Bengal All States

Fiscal Responsibility and Budget Management Act in India: A Review and Recommendations for Reform 9
Figure 3: State-Wise Debt as a Share of Gross State Domestic Product
BE = budget estimate, FY = fiscal year, RE = revised estimate. Source: Reserve Bank of India, State Finances, A Study of Budgets. Various years.
Figure 4: Capital Outlay as a Share of Gross State Domestic Product
BE = budget estimate, FY = fiscal year, RE = revised estimate. Source: Reserve Bank of India, State Finances, A Study of Budgets. Various years.
24.9 25.0
21.2
24.524.5
23.3
21.622.6 22.5
24.1
35.6 34.8 33.332.5
30.3 30.331.6 31.7
28.5 28.1
60.1
43.4
30.8 28.2
24.1
21.719.6 18.5 19.1 18.8
45.3
43.2
35.434.2 33.2 32.3 32.4 32.2 32.4
31.4
22.6 23.4 21.5
21.5 22.119.6
20.5 21.0 21.0 21.2
38.0
47.3
44.0 44.0
40.7 40.439.1
36.735.5
32.9
29.5
26.1 25.5
23.822.6
22.221.9 22.3 22..0
14
18
22
26
30
34
38
42
46
50
54
58
62
FY2000–FY2003
(Average)
FY2004–FY2008
(Average)
FY2009 FY2010 FY2011 FY2012 FY2013 FY2014 FY2015(RE)
FY2016(BE)
%
Karnataka Kerala Odisha Punjab Tamil Nadu West Bengal All States
2.1
3.2
3.6 3.5 3.5 3.4
3.02.8 2.7 2.8
0.8
0.6
0.90.9
1.2 1.2 1.3 1.1
1.0
1.6
2.2
1.6
2.8
2.22.2 2.1
2.22.8
3.9
4.4
1.31.4
1.71.1
1.1 0.6
0.7 0.7
1.11.2
1.1
1.9
2.7
1.8
2.4 2.5
2.0 2.0 2.1 2.2
0.7
0.81.0
0.8
0.5 0.5
0.81.0
1.7 1.7
2.2 2.6 2.3
2.0 1.9 1.9 1.9
2.62.6
0
0.5
1.0
1.5
2.0
2.5
3.0
3.5
4.0
4.5
5.0
FY2000–FY2003
(Average)
FY2004–FY2008
(Average)
FY2009 FY2010 FY2011 FY2012 FY2013 FY2014 FY2015(RE)
FY2016(BE)
%
Karnataka Kerala Odisha Punjab Tamil Nadu West Bengal All States

10 ADB South Asia Working Paper Series No. 52
C. Consolidated Overview of Fiscal Responsibility and Budget Management Experience 27. A consolidated overview of the combined finances of the central and state governments indicates that the introduction of FRBM rules helped a great deal in consolidating the finances of both central government and the states. As indicated by the analysis in the Economic Survey 2016–2017,8 the fiscal progress of states following the introduction of the FRBM Act was also supported by favorable exogenous factors such as (i) accelerated GDP growth, boosting state revenues; (ii) adoption of value-added tax by most states in FY2006; (iii) increased transfers from the center to states with the surge in central government revenues; (iv) reduced interest payments on account of debt restructuring package offered by the central government; and (v) reduced need for spending by the states as the central government took on a number of social sector expenditures under the centrally sponsored scheme, creating off-budget expenditures from the perspective of states. 9 The FRBM Act contributed to fiscal consolidation by preventing the states from spending all of their windfall revenues from these exogenous factors, and creating additional guarantees and debt for state enterprises or public utilities.10 28. However, the impact of the 2008 global financial crisis disrupted the fiscal consolidation process in the case of the central government, leading to a progressive loosening of fiscal targets and eventually an amendment of the FRBM Act itself in 2012. As a consequence, the Government of India has fallen short of the original FRBM target of eliminating the current deficit by FY2008. It still has a substantial current deficit that is likely to continue until FY2020, and its fiscal deficit target of 3% of GDP has not yet been achieved even in FY2017. The performance of the states is quite different. Taken together, they have achieved a revenue surplus in most years since FY2007 and maintained a gross fiscal deficit well below the target level of 3% of GSDP since then. 29. Sovereign debt has remained at prudent levels for both the central government and the states, and gradually declined in both cases, which is in line with prevailing views about optimal debt policy (Escolano and Gaspar, International Monetary Fund [IMF], 2016). In the case of the latter, outstanding liabilities have come down from a peak of over 31% of GDP in FY2006 to less than 22% at present. In the case of the central government, total outstanding liabilities have come down from 61.2% in FY2006 to 48.9% in FY2016 (budget estimate). Public debt as percentage of GDP amounted to 40.1% and external sovereign debt was 2.7% in FY2016 (budget estimate).11 Total liability of all governments, adjusted for states’ liabilities to the central government, is close to around 67% in FY2016 (budget estimate) (See Figure 1).
30. However, the FRBM Act has proven deficient across three areas: (i) a weak link between policy setting and operational framework, where the budget processes and procedures and the budget implementation have not been adaptable to fiscal policy changes in a timely and clear manner; (ii) the transparency and accountability framework has not been able to provide sufficient coverage or assessment of fiscal risks; and (iii) the same transparency and accountability framework has not 8 Government of India, Ministry of Finance. 2017. The Economic Survey 2016–2017. New Delhi. 9 Chapter 6 of the Economic Survey provides an analysis of the average change in fiscal, primary, and revenue deficits of states
as a share of gross state domestic product (GSDP), comparing the average of the 10 years following the FRBM Act and the 11 years prior. Results indicate that central transfers as a percent of GSDP increase by 0.9 percentage points over this period, explaining more than half of the reduction in the states’ fiscal deficits and about half the change in revenue deficits. Own tax revenues as a percent of GSDP increased by 1 percentage point, largely due to high GDP growth and adoption of value-added tax. Interest payments as a percent of GSDP fell by 0.9 percentage points, owing to debt restructuring.
10 The Economic Survey indicates that the noninterest revenue expenditure shows a modest increase of 0.4 percentage points, suggesting that states used the revenue gains to bring down deficits rather than increase spending. This is despite the global financial crisis of 2008 during the post-FRBM period.
11 Government of India, Ministry of Finance. Various years. Status Paper on Government Debt. New Delhi.

Fiscal Responsibility and Budget Management Act in India: A Review and Recommendations for Reform 11
identified or pointed to a path for effectively meeting the targets when the fiscal objectives went “off-track.” On item (i) above, it has reflected the fact that the medium-term fiscal framework and especially the medium-term expenditure framework was initially not tied closely to the fiscal strategy and the fiscal stance. On item (ii), there was no attempt to include an analysis of the potential fiscal risks either domestically, such as the impact of the announcement of the Pay Commission, or externally, such as the increase in commodity prices and the implications on fiscal policy. Similarly, there was little sense of the implications of off-budget items such as contingent liabilities. Finally, on item (iii), the ambiguity reflected some uncertainty in terms of the real-time magnitude of the shock and hence avoiding a commitment to make time-dependent fiscal corrections in advance.
IV. FISCAL RULES: INTERNATIONAL EXPERIENCE WITH SPECIAL ATTENTION TO THE ASIA AND PACIFIC REGION
A. Background 31. Fiscal rules can be classified into broadly of two types depending on their objectives. The first set of rules includes those whose goal is to ensure fiscal sustainability. Such rules enforce targets on key fiscal performance indicators such as public debt, fiscal deficit, overall revenue and aggregate expenditure or certain specific expenditure areas. In some instances, to ensure that growth enhancing capital expenditure does not get squeezed, public investment is excluded from the purview of fiscal rules. Such rules are referred to as a ‘golden rule’. The focus of the second set of rules is to provide room to the policy makers to undertake countercyclical fiscal policy and stabilize the economy. Examples of such rules include rules that target the fiscal deficit over an economic cycle or target cyclically adjusted balance every year.
32. The main benefit of the first set of rules is that they can be easily monitored as most economies report the various fiscal indicators these rules impinge upon. However, a vital drawback of these rules is that they do not give the policy maker adequate flexibility to adjust to an unanticipated shock (Bova et al. 2015). In contrast, while the second set of rules provides the space to the policy maker to undertake countercyclical policy measures, they tend to be constrained by the fact that the budgetary variables are rarely available in cyclically adjusted terms—at the time of decision making—especially in developing economies. 33. The analysis below is based on the fiscal rule dataset developed at the IMF with the methodology outlined in Schaechter et al. (2012) and Bova et al. (2015). The dataset covers rules whereby numerical targets are enshrined in the legislations. The dataset also includes those rules where the targets are revised infrequently and tend to be mandatory for a period of at least three years. Furthermore, only those fiscal rules that impose targets on key fiscal indicators such as debt, budget deficit, expenditure and revenue are taken into account.
34. Schaechter et al. (2012) and Bova et al. (2015) distinguish between four main categories of fiscal rules based on the fiscal variables that these rules impinge upon. 35. Budget Balance Rules. Budget balance rules (BBRs) impact the fiscal balance, which can either be the aggregate balance or cyclically adjusted balance. As discussed above, while rules impinging on the aggregate balance are easy to monitor and convey to the public, they are not so easily suitable to the policy maker to take steps to stabilize the economy. In contrast, rules targeting the
12 ADB South Asia Working Paper Series No. 52
cyclically adjusted or structural balance, while having the ability to stabilize the economy, are harder to communicate and monitor. 36. Debt Rules. These rules typically prescribe a ceiling for the public debt-to-GDP ratio. A major advantage of these rules is that they have a direct relation with debt sustainability, and are easy to convey and monitor. However, these rules provide limited guidance to the authorities in the short run as fiscal measures would influence debt levels over time. Furthermore, exogenous factors including interest rates and exchange rates also can impact the debt level of a country. 37. Expenditure Rules. These rules constrain aggregate expenditure or some part of it like current expenditure. They are easy to communicate and supervise but have limited impact on debt dynamics as the revenue side is unconstrained. Expenditure rules also have the advantage of allowing economic stabilization during an economic downturn as they are not required to account for a drop in revenues due to a slowdown. 38. Revenue Rules. These rules aim to control the quantum of revenue. Revenue rules can be framed either in terms of setting a ceiling to avoid unwarranted tax burden or setting a floor to ensure adequate revenue. Given the presence of several cyclical components, a revenue rule by itself can be procyclical. Again, given the fact that they do not constrain the expenditure side they have limited impact on debt dynamics.
Figure 5: Evolution of Fiscal Rules
Source: Bova et al. (2015).
Emerging Markets
Low-Income Countries
Budget Balance Rule Debt RuleExpenditure Rule Revenue Rule
Industrialized Countries30
20
1980
1980
30
20
10
0
1990 2000 2010
1990 2000 2010
10
0Num
ber o
f Cou
ntrie
s
Num
ber o
f Cou
ntrie
s
30
20
10
0Num
ber o
f Cou
ntrie
s
1980 1990 2000 2010

Fiscal Responsibility and Budget Management Act in India: A Review and Recommendations for Reform 13
39. As per Figure 5, over the last 3 decades, there has been a steady increase in the number of industrialized countries, emerging markets, and low-income countries adopting a fiscal rule. While there was a surge in adoption of fiscal rules among the industrialized countries in the early 1990s, emerging markets and low-income countries witnessed an uptick in adoption of these rules in the late 1990s. BBRs and debt rules are the most common rules prevalent across the different set of countries. While some industrialized countries and emerging markets have also adopted expenditure rules, there has been limited adoption of rules targeting government revenue. 40. Given that a single rule would be unable to help achieve the various objectives like fiscal sustainability, economic stabilization, and targeting the size of the government, many countries have resorted to a combination of fiscal rules (Figure 6). The most common combination is the mix of rules that constrain debt and budget balance.12 Expenditure rules have also been introduced in combination with other rules. In industrialized countries, expenditure rules have been combined with BBRs, while in emerging markets, they are often used in conjunction with debt rules. The latter combination allows a country to strive for debt sustainability while assisting policy makers with short-term to medium-term operational decisions. This would also allow countercyclicality of budgetary policies while targeting the government size.
Figure 6: Combination of Fiscal Rules
BBR = budget balance rule, DR = debt rule, ER = expenditure rule. List of countries in each group is provided in Schaechter et al. (2012), Appendix 3. Source: Bova et al. (2015).
41. Over the last 15 years, in an increasing number of countries, fiscal rules have been accompanied by the establishment of independent fiscal councils that aim at promoting sound fiscal policies. Fiscal councils, which are in the form of independent fiscal institutions, improve the policy makers’ incentives 12 This is driven by the member countries of the European Union which are subject to the supranational Maastricht budget
balance and debt rules.
60
40
Num
ber o
f Cou
ntrie
s
BBR and DR
Industrialized Countries Emerging MarketsLow-Income Countries
ER and BBR ER, BBR and DR ER and DR
20
0

14 ADB South Asia Working Paper Series No. 52
to pursue prudent fiscal policies in a variety of ways. By promoting transparency, fiscal councils can deter discretionary shifts in fiscal policy for political gain. Moreover, fiscal councils can create public awareness about the consequence of unsound fiscal policy, thereby raising the cost of such policies. Finally, these councils can provide inputs into budget making and ensure that loopholes are not used to circumvent fiscal rules (see Hemming and Joyce 2013). 42. While all fiscal councils share the ultimate objective of promoting sound fiscal policies through independent oversight, the councils vary greatly in terms of their remit, tasks, and institutional forms, which are driven by country-specific characteristics such as available human and financial capacities, political traditions, and the causes for excessive deficits and debts (see Beetsma and Debrun 2016, Debrun et al. 2013). Initially, most of the fiscal councils were established in industrialized countries, with Denmark, Japan and the Netherlands establishing some of the earliest fiscal councils. Emerging markets started showing greater interest in developing fiscal councils since the late 1990s, with some low-income countries setting up these councils in the early 2000s. Traditionally, the majority of the fiscal councils have been established in Europe, although there has been growing interest in other parts of the world as well.
Figure 7: International Experience with Fiscal Councils
(a) Evolution of Fiscal Councils (b) Spread of Fiscal Councils (2015)
Sources: Debrun et al. (2013); Debrun and Kinda (2014).
43. There has been a great deal of diversity across fiscal councils. A comparison of fiscal councils in industrialized economies with those in the developing countries provides some interesting insights. A significantly higher proportion of fiscal councils in industrialized countries tend to focus on analyzing long-term sustainability, monitoring fiscal rules, and assessment of actual fiscal performance compared with developing countries. In contrast, a greater proportion of councils in developing countries concentrated on reviewing macroeconomic forecast and costing of policy initiatives.
40
30
20
Num
ber o
f Cou
ntrie
s
1980Industrialized Countries Emerging MarketsLow-Income Countries
1985 1990 1995 2000 2005 2010 2015
Asia Pacific
Africa
NorthAmericaLatin
America
10
0Europe

Fiscal Responsibility and Budget Management Act in India: A Review and Recommendations for Reform 15
Figure 8: Remit of Fiscal Councils
Note: Developing countries include emerging markets and low-income countries. Sources: Debrun et al. (2013); Debrun and Kinda (2014).
B. Fiscal Rules in Asia and the Pacific 44. Within Asia and the Pacific, there are 11 major economies that have adopted some form of a fiscal rule. While some countries such as Australia, Indonesia, Japan, Malaysia, New Zealand, and Singapore have several decades of experience with fiscal rules, South Asian economies such as India and Sri Lanka have had these rules only since the 2000s. All the countries in Asia and the Pacific, which have adopted a fiscal rule, implemented some form of a BBR. In several countries, including Australia, New Zealand, Indonesia, Malaysia, and Sri Lanka, the BBR was accompanied by a debt rule, which imposes a ceiling on the ratio of debt-to-GDP. While Australia, Singapore, and Japan had an expenditure rule accompanying the BBR for a part of the period, in Australia, these rules were additionally supplemented with a revenue rule (see Figure 9).
Figure 9: Economies Adopting Fiscal Rules in Asia and the Pacific
Source: Bova et al. (2015).
Posit
iveAn
alysis
Developing Countries Industrialized CountriesFo
reca
stAs
sess
men
t
Opt
imali
ty
Reco
mm
enda
tions
Mon
itorin
gFis
cal R
ules
Ex-P
ost
Analy
sis
Costi
ng of
Mea
sure
s
Long
-Ter
mSu
staina
bility
Fore
cast
Prep
arat
ion
Norm
ative
Analy
sis
1008060%4020
0
Australia
Japan
New Zealand
Hong Kong, China
Malaysia
Singapore
India
Maldives
Sri Lanka
YearExpenditure Rule Budget Balance RuleRevenue Rule Debt Rule
Indonesia
Mongolia
1980
1980 1980 19801990 1990 19902000 2000 20002010 2010 2010
1990 2000 2010
1980 1990 2000 20101980 1990 2000 20101980 1990 2000 20101980 1990 2000 2010
1980 1990 2000 20101980 1990 2000 2010 1980 1990 2000 2010

16 ADB South Asia Working Paper Series No. 52
45. We describe the experience of fiscal rules in three major Asia and Pacific economies (Indonesia, Japan, and Australia) in detail in Appendix 1. While Japan has had a fiscal rule since 1947, Indonesia introduced a BBR in 1967, and Australia had initiated a rule since 1985. However, the extent of compliance under these rules varies a lot across the three countries and even over different time periods.
V. AN ASSESSMENT OF INDIA’S FISCAL RESPONSIBILITY AND BUDGET MANAGEMENT FRAMEWORK AND FISCAL RULES
46. Best practices emerging from several decades of international experience in implementing fiscal rules provide a useful benchmark against which one can assess the Indian experience (Kopits and Symansky, 1998; Schaechter et al. 2012; Bova et al., 2015). The assessment criteria considers whether types of rules are (i) well-defined, (ii) simple, (iii) flexible, (iv) adequate, (v) consistent, (vi) transparent, (vii) enforceable, (viii) efficient, and (ix) independently monitored. These criteria should serve as a guide to future directions of reform starting from the existing conditions in India. The following is an assessment from this perspective. A. Fiscal Rules in India 47. As presented in paragraphs 34–38, there are different types of fiscal rules. Increasingly countries are combining more than one type of rule. Typically, a debt rule is combined with either a BBR or increasingly, a structural budget balance rule (SBBR) or expenditure rule. The Indian FRBM Act only applies one rule, a BBR. The original act adopted the “golden rule”, i.e., to achieve zero current deficit by a target date and a corresponding limit on the fiscal deficit, i.e., borrowing only for capital expenditure. This was set at 3% of GDP for the central government and at 2.8% of GDP (3% of GSDP) for all states combined, totaling 5.8% for all government. 48. However, the original target date has been repeatedly shifted forward and the zero current deficit target has been abandoned in the case of central government, undermining the credibility of this fiscal rule. In the case of the states the story is different. Their combined fiscal deficit has remained well below the 3% of GSDP target since FY2006. States had also collectively eliminated the revenue or current deficit by FY2007, though a small current deficit has reappeared in the last couple of years. Thus, the states’ commitment to enforcing fiscal rules seems much more credible at present, partly reflecting a hard budget constraint, unlike the central government.13 This is discussed further below.
49. As noted, total public liabilities have remained at prudent levels and are gradually declining. This is in line with prevailing views on the optimal inter-temporal debt path (Escolano and Gaspar, 2016). However, the FRBM laws themselves do not provide any debt ceiling either for the central government or the states, though such a ceiling is required under the Indian constitution.
50. The FRBM laws also do not provide any SBBR targets, though the 13th Finance Commission report recognized the need for countercyclical fiscal policies and this has also been recognized in some official documents like the recent Economic Survey 2016–2017. One of the reasons cited for countries
13 In recent years, state governments’ finances have witnessed some deterioration. The aggregate fiscal deficit of the states has
increased from 1.9% of GDP in FY2012 to an estimated 2.9% in FY2016. If the debt taken over by states as per Ujwal DISCOM Assurance Yojana scheme is included, fiscal deficit rises to 3.6% of GDP (RBI, State Finances, A Study of Budgets, FY2017) Over the same period, central government’s fiscal deficit declined from 5.9% of GDP to 3.9%. (Ministry of Finance, Union Budget, FY2018)

Fiscal Responsibility and Budget Management Act in India: A Review and Recommendations for Reform 17
not moving on from BBRs to SBBRs is the complexity of estimating output gaps for setting the SBBR targets. However, in India’s case technical exercises have been undertaken in the RBI and elsewhere on estimating trend growth paths, fiscal response elasticities, and the structural deficit (Pattnaik et al. 2006; Ghosh and Misra, 2016).
51. Expenditure targets (as expenditure rules) and revenue targets (as revenue rules) are also not included in India’s existing FRBM laws.
B. Are the Laws Well Defined? 52. The Indian FRBM laws are well defined to the extent that they set specific BBR targets and every state is covered by its own FRBM law, which is also consistent with the national FRBM law. However, coverage is still limited because it does not extend to public enterprises and contingent liabilities in the form of guarantees. Finally, the escape clause from the FRBM, clause 7(3) (b) is quite vague, referring to “unforeseen circumstances.” It is left to the discretion of the government to determine what qualifies as “unforeseen circumstances.”
C. How Does Fiscal Responsibility and Budget Management Framework Compare with
Standard Properties? 53. Simplicity. FRBM laws of the central government and the states specify a ceiling for the fiscal deficit and require the current deficit to be eliminated or reduced by a target date. This is quite simple and straightforward compared with a cyclically adjusted fiscal deficit. 54. Flexibility. Lack of flexibility is a major limitation of traditional BBRs, e.g., setting a fiscal deficit target as a fixed proportion of GDP. It makes the fiscal policy stance automatically procyclical, when in fact it should be countercyclical. The Government of India, which is primarily responsible for macroeconomic management, along with the RBI, has accordingly found it difficult to pursue countercyclical fiscal policy within the constraints of the FRBM target. This has led the Ministry of Finance to try to maneuver in various ways to get out of the FRBM straightjacket since the 2008 crisis. It postponed the target dates in the MTFP, introduced a concept of effective revenue deficit, and eventually amended the FRBM Act, abandoning the zero current deficit goal and further postponing the date for achieving the fiscal deficit of 3% of GDP. 55. Other creative ways to artificially reduce the deficit have also been reported. Expenditures are sometimes shifted past the end of the financial year to stay within the deficit limit. On the revenue side, the use of one-off measures such as sale of public sector assets to shore up receipts has been a standard strategy. Off-budget transactions through public sector enterprises, e.g., on oil subsidies, has also been a popular technique. Refund of excess tax collections has often been delayed until after the end of an accounting year. These actions have weakened the robustness of the budget process and undermined the credibility of the FRBM law. However, it should be recognized that the problem originates with an inflexible fiscal rule that forces fiscal policy into a procyclical stance.
56. Adequacy. Are India’s FRBM rules commensurate with the goals? The primary goal of fiscal rules is debt sustainability, with a supplementary goal of macroeconomic stabilization. India could adopt direct rules on debt ceiling, which would also fulfill a constitutional mandate. Certainly, debt sustainability can also be approached indirectly through fiscal deficit targets, but that can lead to other adverse consequences for macroeconomic stabilization policies as explained above. The challenge is to identify fiscal rules that can address both goals at the same time.

18 ADB South Asia Working Paper Series No. 52
57. Consistency. Fiscal rules need to be consistent internally as well as with other macroeconomic policies. Particularly important in this context is consistency between fiscal and monetary policies. If there is more than one fiscal rule, then the two rules have to be consistent, e.g., a fiscal deficit target with the debt target.14 Consistency across fiscal and monetary policies would require coordination between the two. For example, a fixed 5.8% of GDP fiscal deficit target (center plus states) can lead to a sharp increase in the absolute volume of borrowing during a period of rising growth, and this could crowd out private investment unless it is matched by an accommodating monetary policy stance. On the other hand, an accommodating monetary policy combined with a sharp rise in the volume of deficit could build up inflationary pressures. Therefore, fiscal rules and monetary policy need to be closely coordinated. The RBI and the Ministry of Finance do meet regularly to coordinate fiscal policy with monetary policy, and this has now been formalized through the monetary policy framework. 58. Transparency. Reference was made above to the various actions the central government has tried to somehow square the circle, i.e., meet the requirements of countercyclical fiscal policy within the straitjacket of procyclical FRBM rules, the fixed fiscal deficit, and current deficit targets. These actions were intended to show that fiscal rule targets were being met when in fact they were being breached. Eventually, the FRBM law itself was amended in 2013 to bring in the concept of the “effective revenue deficit,” which as pointed out earlier, is not recognized in conventional budgeting practices. Revised FRBM targets are being set in terms of this concept. It excludes grants to states for capital expenditure from the computation of the central government revenue expenditure, though these appear in state budgets as receipts on the revenue account. Though the compulsions underlying such actions are understandable, the erosion of transparency arising from such moves has, as noted above, weakened the robustness of the budgeting exercise and eroded the credibility of fiscal rules in India.
59. Enforcement. The FRBM laws in India are not backed by any legal sanctions or penalties for breach of targets. In the case of states, enforcement of targets is nevertheless effectively accomplished through central government control of states’ borrowing program under Article 293 clause (3) of the Constitution, which requires the states to seek consent of the central government for any borrowing if the state has any outstanding loan from the center.
60. With the 12th Finance Commission having barred the states from borrowing from the central government, the stock of outstanding central loans for the states is rapidly declining. Two states are likely to cease to have any outstanding central government loans by 2025, and several others by 2030. The central government will cease to have effective control of states’ borrowing at that point in time. The states will then no longer face a hard budget constraint unless there is fresh state legislation to introduce a debt ceiling under Article 293 (1) of the Constitution. With states having to increasingly rely on market borrowing to finance their deficit, market discipline will become the main driver of states’ fiscal prudence in the future. An important issue that arises in this context is the need to have a transparent system of fiscal performance and debt rating for the states.
61. In the case of central government, there are no real levers to ensure enforcement. There is no debt ceiling legislated to date, although this is mandated under Article 292 of the Constitution. There are no sanctions or penalties for breaching targets except reputational risk. The rolling deficit targets under the MTFP can be and are revised from time to time. Furthermore, there is no independent fiscal council to monitor the central government’s compliance with FRBM rules. The fact that central government seeks to meet its FRBM targets and that debt levels are declining is therefore attributable to fiscal prudence of the government and improving GDP growth and interest rate differentials rather 14 It has been pointed out in the 13th Finance Commission report that the 3% fiscal deficit target is derived from the debt target.

Fiscal Responsibility and Budget Management Act in India: A Review and Recommendations for Reform 19
than enforcement provisions under the FRBM Act. Two important reform issues that arise here are (i) the introduction of a debt ceiling rule as mandated under Article 292; and (ii) the importance of an independent fiscal council to assess compliance with fiscal rules, fiscal marksmanship, and the costing of expenditures.
62. Efficiency. This issue relates to whether the tax provisions and expenditure programs are such that they enable the fiscal targets to be met in a sustainable manner, without special one-off measures in annual budgets to meet the gap. A key requirement for this is a rolling MTEF, which has been produced annually since the 2012 amendment of the central FRBM law. Nevertheless, one-off measures are routinely introduced to meet the FRBM targets such as sale of public enterprise equity and imposition of dividend demands on them, especially large dividend demands from the RBI. Several amendments are also introduced every year in tax laws through the annual finance acts.
63. A related issue is the soundness of the MTEF and how well it is integrated with the bottom–up costing of programs and projects prepared by the line departments, i.e., the need for a tightly integrated and robust budgeting process through different tiers of government. D. Independent Fiscal Council 64. The review of international experience presented above indicates that independent fiscal institutions, often called fiscal councils, now exist in many countries in Europe, the United States, and several emerging market economies. There has been no move in this direction so far in India. The 13th Finance Commission had recommended that central government should institutionalize independent review and monitoring of its own FRBM process. The 2012 amendment to the FRBM Act incorporated a section requiring the Comptroller and Auditor General of India to periodically review the implementation of the FRBM Act. However, this is more in the nature of a periodic post facto review. What is required is continuing ex ante monitoring and assessment of the internal consistency of FRBM revenue, expenditure, and deficit targets, and their realistic and effective implementation. Hence, the 14th Finance Commission made a strong case for legally institutionalizing an independent fiscal institution for this purpose. E. Cyclicality Considerations 65. Fiscal indicators are highly correlated with the state of the business cycle in the economy. As such, government’s procyclical fiscal stance is characterized by increased public spending during an economic boom, buoyed by higher revenue collection but reduced spending during a recession. A countercyclical fiscal stance on the other hand refers to the opposite approach, whereby spending is reduced during a boom period and increased during a recession. 66. Figure 10 illustrates characteristics of the overall fiscal deficit (total government revenue minus expenditure, indicating net lending or borrowing of the government) as a share of GDP in India in comparison to the cyclical GDP fluctuations, which are measured by deviation from trend GDP using Hodrick–Prescott filtering method. The fiscal deficits before the introduction of FRBM Act (2004) display countercyclicality during FY1992–FY1997 and mixed characteristics during FY1998–FY2003, with procyclicality observed in FY1998, FY2002, and FY2003 and countercyclicality in FY1999 and FY2001. With the introduction of the FRBM Act in 2003, fiscal deficits became primarily countercyclical during FY2004–FY2010. Fiscal deficit is procyclical during the period FY2011–FY2016, except for FY2013.
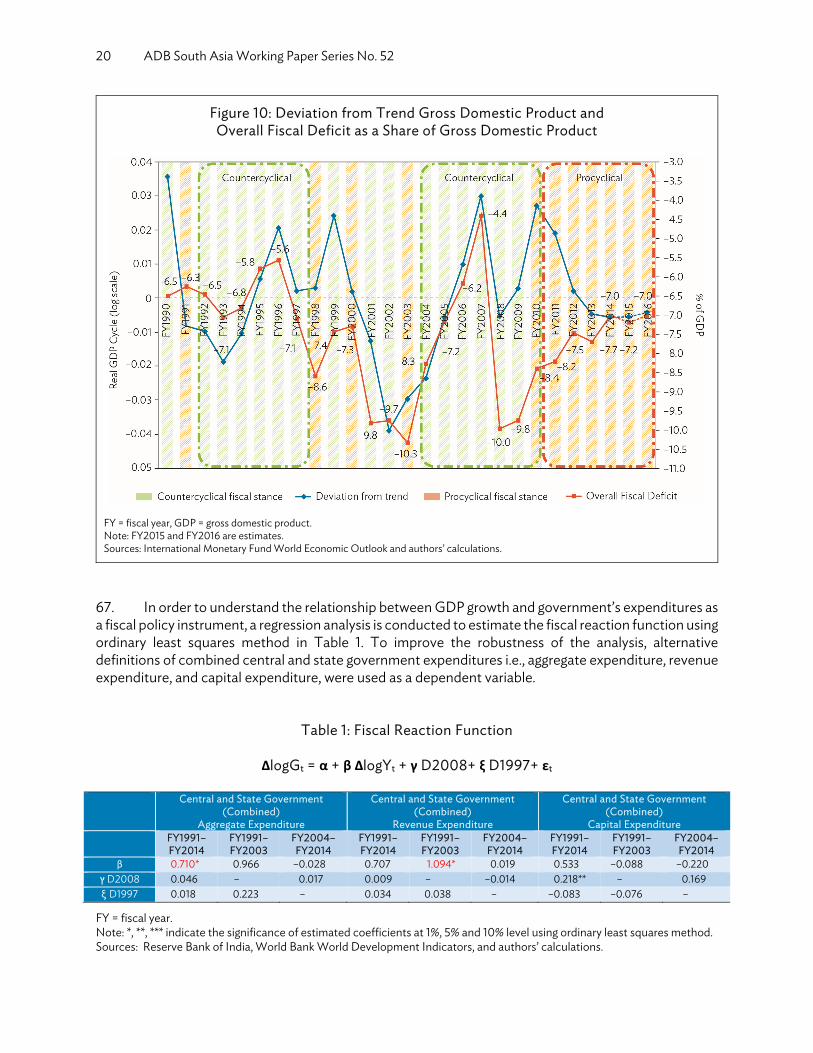
20 ADB South Asia Working Paper Series No. 52
Figure 10: Deviation from Trend Gross Domestic Product and Overall Fiscal Deficit as a Share of Gross Domestic Product
FY = fiscal year, GDP = gross domestic product. Note: FY2015 and FY2016 are estimates. Sources: International Monetary Fund World Economic Outlook and authors’ calculations.
67. In order to understand the relationship between GDP growth and government’s expenditures as a fiscal policy instrument, a regression analysis is conducted to estimate the fiscal reaction function using ordinary least squares method in Table 1. To improve the robustness of the analysis, alternative definitions of combined central and state government expenditures i.e., aggregate expenditure, revenue expenditure, and capital expenditure, were used as a dependent variable.
Table 1: Fiscal Reaction Function
ΔlogGt = α + β ΔlogYt + γ D2008+ ξ D1997+ εt
Central and State Government
(Combined) Aggregate Expenditure
Central and State Government (Combined)
Revenue Expenditure
Central and State Government (Combined)
Capital Expenditure FY1991–
FY2014 FY1991–FY2003
FY2004–FY2014
FY1991–FY2014
FY1991–FY2003
FY2004–FY2014
FY1991–FY2014
FY1991–FY2003
FY2004–FY2014
β 0.710* 0.966 –0.028 0.707 1.094* 0.019 0.533 –0.088 –0.220D2008 0.046 – 0.017 0.009 ץ – –0.014 0.218** – 0.169ξ D1997 0.018 0.223 – 0.034 0.038 – –0.083 –0.076 –
FY = fiscal year. Note: *, **, *** indicate the significance of estimated coefficients at 1%, 5% and 10% level using ordinary least squares method. Sources: Reserve Bank of India, World Bank World Development Indicators, and authors’ calculations.

Fiscal Responsibility and Budget Management Act in India: A Review and Recommendations for Reform 21
68. In addition, control variables are introduced for the year 1997 corresponding to the effectiveness of Fifth Pay Commission recommendations and the Asian financial crisis, and the year 2008, corresponding to the effectiveness of Sixth Pay Commission recommendations and the global financial crisis. The regression estimate is conducted for the entire sample period of FY1991–FY2014 and the subsamples of pre-FRBM period of FY1991–FY2003 and post-FRBM period of FY2004–FY2014 to test the structural breaks in the fiscal reaction function. 69. The results show that there is some evidence of procyclicality (β>0), whereby GDP growth increases the growth of aggregate expenditures during the entire sample period of FY1991–FY2014 and the growth of revenue expenditures during pre-FRBM period. There is no structural break in the fiscal reaction function post-FRBM. Capital expenditures do not show any reaction to the GDP fluctuations and acyclical across all sample periods. F. Fiscal Balance and Capital Spending 70. Figure 11 illustrates the government capital expenditures to GDP and fiscal balance (government net lending or borrowing) to GDP ratios of various Asian economies. During FY2010–FY2014, India’s public capital expenditure (central and states combined) is slightly lower than the Asian average, despite higher fiscal deficit.15 71. Simulation results under section VI show that there is a possible scope for reorienting government expenditures from current spending and subsidies to capital expenditures while improving the fiscal discipline by stimulating the GDP growth and enhancing the revenues of the government due to the growing economy under a debt ceiling rule.
Figure 11: Government Capital Expenditures and Fiscal Balance as a Share of Gross Domestic Product
(Average of FY2010–FY2014)
FY = fiscal year, GDP = gross domestic product, PRC = People’s Republic of China. Note: Definition of fiscal year differs for each country. Sources: ADB Statistical Database System, Organisation for Economic Co-operation and Development National Accounts, International Monetary Fund World Economic Outlook, Reserve Bank of India, and Philippine Statistics Authority.
15 India’s average government capital expenditure to GDP ratio during FY2007–FY2014 is slightly higher at 3.6%.
6
4
2
4.92
–0.38
–7.76
–1.58
–3.72
–0.40
–6.64
–0.54
–3.14 –3.02
3.49
1.51
4.65
2.89
5.28
1.58
4.02 3.54
0
-2
-4
-6
-8
-10
% o
f GD
P
Government Capital Expenditure/GDP (%) Government Net Lending and Borrowing (Overall Balance)
PRC India Indonesia Malaysia Philippines Sri Lanka Thailand Bangladesh Average

22 ADB South Asia Working Paper Series No. 52
G. Optimal Debt
72. A question often raised when analyzing public policy is “what is the optimal level of public debt for a country?” There is no standard rule in this regard. The European Union has adopted the Stability and Growth Pact, which sets a desirable maximum of 60% of GDP for member countries. On the other side of the spectrum, 90% is considered the outer limit where likelihood of macro-instability sets in (Reinhart and Rogoff, 2010). Comparing advanced economies with emerging ones, conventional wisdom points to lower debt tolerance levels in emerging economies given that they are likely to have more volatile GDP and a more limited revenue base (Simone and Topalova, 2009). In addition, when factoring in the net position on the capital accounts, advanced economies tend to have stronger cross-border investments often resulting in net debt levels significantly below gross levels (see Japan for example). 73. However, it often makes more sense to review countries individually based on key determinants that can influence and hence are critical in identifying a prudent level of debt tolerance and overall sustainability. Table 2 presents such an analysis for India. Improvements in key determinants (i.e., more green-colored factors) would allow higher levels of debt tolerance and lower adjustment costs to achieve sustainability.
Table 2: Determinants of Debt Tolerance and Debt Sustainability Assessment for India
Determinants Key Factors Effect India
Fiscal Performance
Size and Stability of Government Revenue Base + Weak Efficiency of Tax System + Weak Fiscal Discipline + Moderate Large Size of Informal Sector – Weak
Debt Structure
Low Level of Existing Debt Stock + Moderate Low Share of Foreign Currency Denominated Debt Relative to Reserves + Strong
Low Share of Short-Term Debt + Strong Risks Related to Contingent Liabilities – Moderate
Macroeconomic Stability
High GDP Growth + Strong Low Inflation + Moderate Stable Exchange Rates + Moderate Low Interest Rates + Moderate Quality of Fiscal and Monetary Policies + Moderate
Financial Sector Development Development of Domestic Financial Markets + Moderate
Trade Openness Favorable Terms of Trade Shocks + Moderate Current Account Balance (Export Orientation) + Moderate
Global Economy
Global Economic Growth + Moderate Increase in Developed Country Interest Rates – Moderate Reversals in Global Capital Flow Cycle and Financial Conditions i.e., Crises in Center Countries – Moderate
Risk Premiums Political Stability + Strong Quality of Institutional Development and Rule of Law + Moderate
GDP = gross domestic product. Sources: International Monetary Fund World Economic Outlook. 2003; Authors’ assessment for India.

Fiscal Responsibility and Budget Management Act in India: A Review and Recommendations for Reform 23
74. Other important considerations on optimal debt size would need to factor in interest, price, and income elasticities in the economy. For example, the wage and salaries bill is more sensitive to inflation and this results in a need to accommodate these increases during a pay commission year. If we consider how the subsidies bill in India varies, it is largely driven by changes in inflation and income that defines the segment of the population that is below the poverty line. If increases in inflation lead to a reduction in the purchasing power of those near the poverty line, this could lead to an increase in those falling below the poverty line and with it trigger an increase in the overall subsidy bill. When analyzing debt repayments, the debt bill is most sensitive to changes in interest rates and to the extent that it may be denominated in different currencies. The latter creates sensitivity to exchange rate fluctuations. Similarly, given the large infrastructure and housing deficits in India, public investment tends to be more sensitive to interest and commodity price increases. 75. Finally, accounting for debt on a net vs. gross basis may also highlight some important findings. Accordingly, a thorough fiscal analysis would be able to determine what proportion of public debt is held by quasi-fiscal institutions as well as what the level of actual government liability vs. contingent liabilities is.
76. It is important to compare how countries within the same sovereign rating group compare with one another. India is classified by Standard and Poor’s as BBB-, which is the lowest category of investment grade. Figure 12 plots a scatter diagram of countries classified as BBB- across fiscal deficits and public debt. It is interesting to note that among the BBB- rated countries, India stands out as having the largest fiscal deficit while having a debt level slightly above the average.
Figure 12: Scatter Diagram of Fiscal Deficit, Gross Debt, and Sovereign Ratings
(Average of 2010–2014)
GDP = gross domestic product, HUN = Hungary, IND = India, ITA = Italy, KAZ = Kazakhstan, MAR = Morocco, OMN = Oman, ROU = Romania, ZAF = South Africa. Note: The figure shows countries with BBB- credit rating by Standard and Poor’s (S&P). Sources: International Monetary Fund World Economic Outlook; Standard and Poor’s (S&P).
6
4
2
00 5 10 15 20 25 30 35 40 45 50 55 60
OMN 5.25, 4.28KAZ 12.22, 3.76
ROU 36.27, –3.46ZAF 41.01, –4.12
HUN 78.51, –3.46
MAR 56.94, –5.64
IND 67.32, –7.76
ITA 123.32, –3.32
Government Gross Debt/GDP (%)
Ove
rall F
iscal
Bal
ance
/GD
P (%
)
–2
–4
–6
–8
65 70 75 80 85 90 95 100 105 110 115 120 125 130

24 ADB South Asia Working Paper Series No. 52
H. Underlying Budget Process and Implementation
77. One of the weakest links in fiscal management is linking the fiscal strategy and overall fiscal policy to budget process and implementation. Throughout the first 8 to 9 years since FRBM was enacted, the link at the national level was missing. In FY2013 however, with an amendment to the FRBM Act, the MTEF statement was made mandatory and that provided a bridge between firmed up intentions on the strategy side with a commitment on the operations side. If all components of the fiscal framework are operating effectively and are well synchronized, an FPS statement should be consistent with the overall path to fiscal consolidation and achieving the stated fiscal target in the legislation consistent with the budget (Appropriation Act) while allowing for fiscal breaks to be deployed intelligently on budget implementation (see Figure 13).
Figure 13: What’s Under the Hood?
a Amendment to FRBM Rules in 2012–13. Source: Authors’ assessment.
Figure 14: The Budget Process
MTEF = medium-term expenditure framework, MTFF = medium-term fiscal framework. Source: Authors’ assessment.
LinkagesFRBM Act (legislation)
Medium-Term Fiscal Policy Statement (policy)
Fiscal Policy Strategy Statement (strategy)
Macroeconomic Framework Statement (strategy)
Link from policy and strategy rules to expenditure management and to budgetary controls
Medium Term Expenditure Framework Statementa (operations?)
What’s Missing?
RESULTSCONSISTENT
WITHMTFF/MTEF
BUDGETING
IMPLEMENTATIONMONITORING
EVALUATION
PLANNING

Fiscal Responsibility and Budget Management Act in India: A Review and Recommendations for Reform 25
78. A typical budget process can be broken down along the lines of Figure 14. More generally, for a proper articulation of fiscal goals and their overall results in terms of the outcome of public spending, the budget process needs to be fully aligned with the planning and budgeting stages of the budget cycle. In this case, the 3-year rolling Medium-Term Fiscal Framework (MTFF) (top–down approach), informed by the FPS, should be reconciled with the consolidation of the aggregate revenue and spending estimates to arrive at a common medium-term budget or expenditure framework (bottom–up approach). In the absence of a full reconciliation, what ultimately happens is that the MTFF is part of a top–down approach and implementation becomes an ad hoc, blunt, and rudimentary exercise devoid of consideration for results on the use of public resources. 79. Along these lines of strengthening the link between budgeting and implementation in any fiscal federalism, there has to be a stronger realization of the interdependence between central and state budgets. With the significant share of the spending at the state level and a large share of the revenues mobilized at the national level, there is a natural tendency for vertical imbalances to arise. As such, the transfer programs from the national to the state level play a very important role. A better recognition of the division of labor between the state and the central government could lead to improved outcomes particularly in distinguishing short-term stabilization roles—falling under the national fiscal policy and longer-term debt sustainability considerations—falling under the responsibility of state budgets.
80. Existing ADB operational work on state-level development finance programs has carried out assessments in the context of Figure 13 and in particular the strength of the linkages between the five components of the budget process. Based on this work, strengthening of these linkages remains a work in progress in many states.16 81. A quick check on how well the budget process is operating entails assessing budgeted (before) vs. actual (after) performance. The larger these differences are outside of any unanticipated shock, the more work is required to clearly link strategy to budget outcomes. In the case of India, there are deviations in the budget estimates and actual out-turns, indicating a clear scope for improving the linkages (Figure 15). I. Summary of Assessment
82. The introduction of an FRBM Law in 2003 was a landmark event in the recent history of fiscal reforms in India. However, the foregoing review of India’s experience with fiscal rules indicates that it has stayed with what are described as first generation fiscal rules. It has no debt ceiling law and only a traditional BBR. At one stage, this was supposed to be a “golden rule”, allowing borrowing only for capital expenditure beyond a target date. But that has now been given up. To date, there has been no change in adopting the emerging best practices such as SBBR or expenditure rule, though there is demonstrated technical capacity for introducing such rules. As a consequence, the fiscal framework is inflexible and inadequate to handle the dual goals of debt sustainability and stabilization.
16 Two important ADB programs that aim at strengthening such linkages in India are (i) ADB. 2012. Report and Recommendation
of the President to the Board of Directors: Proposed Policy-Based Loan and Technical Assistance Grant to India for the West Bengal Development Finance Program. Manila. (Loan 2926-IND and TA 8203-IND); and (ii) ADB. 2014. Report and Recommendation of the President to the Board of Directors: Proposed Policy-Based Loan and Technical Assistance Grant to India for the Punjab Development Finance Program. Manila (Loan 3187-IND and TA 8759-IND).

26 ADB South Asia Working Paper Series No. 52
Figure 15: Outturn vs. Budget: Central Government Performance
FY = fiscal year, GDP = gross domestic product, Std. Dev = standard deviation. Sources: International Monetary Fund and Indian public finance statistics, and authors’ calculations.
83. Targets are well defined and simple both for central government and the states. However, coverage is limited; it does not include public enterprises and other public institutions, and the escape clause is very vague. The two together make the fiscal framework somewhat soft and malleable. It is also inefficient, frequently requiring one-off measures to enable compliance. Further, while the fiscal rules are enforced for states by the center under Article 293 of the Constitution, no such restraints, sanctions or penalties apply in the case of central government and there is no independent fiscal institution to monitor compliance with fiscal rules on behalf of Parliament and the public, as is the case in many advanced and emerging market economies. Finally, with the states being required to borrow directly from the market following the recommendations of the 12th Finance Commission, there is a need for independent and transparent credit rating of states, which is currently missing.
VI. REFORM OPTIONS FOR INDIA BASED ON SIMULATIONS
84. The foregoing assessment of India’s experience with fiscal rules suggests a range of possible reforms that could bring India abreast of emerging global best practices. These are briefly discussed below. As a prelude to that discussion, quantitative fiscal rule simulations are presented to illustrate the implications of different options. 85. Methodology. The fiscal rule simulations are run using a Klein–Goldberger type macroeconomic simultaneous equations model that was used by the National Institute of Public Finance and Policy, New Delhi for its presentation to the 14th Finance Commission (Bhanumurthy et al., 2015). It is a medium-sized flexible model with five blocks (real sector, external sector, fiscal, monetary, and macroeconomic), which can be adapted to address different policy questions.17 17 The details of the base case model used by Bhanumurthy et al. (2015) are in Appendix 2.
250 45
40
35
30
25
20
15
10
5
0
225
200
175
150
125
100
75
104
9786
50
25FY2004
Revenue (Std. Dev) FY2004–FY2014Fiscal Balance (Std. Dev) FY2004–FY2014Expenditure as % of GDP (Outturn/Budget)
Expenditure (Std. Dev) FY2004–FY2014Revenue as % of GDP (Outturn/Budget)Fiscal Balance as % of GDP (Outturn/Budget)
FY2005 FY2006 FY2007 FY2008 FY2009 FY2010 FY2011 FY2012 FY2013 FY2014
%%
9897
92
109
10298
123111
107
109 108
105
111
84
10096
89
117
10999
125
10395
96
9492
9896
939
43
7
240

Fiscal Responsibility and Budget Management Act in India: A Review and Recommendations for Reform 27
86. The model has been used for four types of simulations. The first simulation demonstrates countercyclicality of structural deficit rule with growth shock. The second simulation demonstrates countercyclicality of expenditure rule with growth shock. The third simulation shows the impact of 25% increase in public capital expenditure from 4% to 5% of GDP. The fourth set of simulations demonstrates the impact of debt-to-GDP ratio gradually moving to 55%, 60%, and 70%. The third and fourth simulations incorporate the Seventh Pay Commission Shock. A. Fiscal Rule Simulations
87. The challenge here is to choose fiscal rules that simultaneously meet the dual policy goals of debt sustainability and macroeconomic stabilization. The latter requires a countercyclical fiscal policy stance, whereas traditional BBRs aimed at ensuring debt sustainability were procyclical. Many countries have adopted SBBRs, which set a primary deficit target, net of interest liabilities, corresponding to trend growth that is compatible with a sustainable debt stock. 88. The first simulation (Figure 16) demonstrates how a structural deficit target acts as a countercyclical automatic stabilizer along with a stationary debt-to-GDP ratio. Positive and negative shocks have been applied to the base case by raising or lowering the assumed global growth rate, which is exogenously given in the model. However, the time path of the fiscal deficit target (center + states) has been maintained as in the base case, assumed to be the trend growth path. Countercyclicality is demonstrated by a primary deficit rate that is 13 percentage points lower on average with a positive growth shock and 15 percentage points higher in the case of a negative growth shock.
89. The second simulation (Figure 17) illustrates that a simple expenditure rule can also act as an automatic stabilizer. In fact, countercyclicality is more pronounced in this case than with a structural deficit rule and with public debt stationary at about the same level as with the structural deficit rule. The same positive and negative growth shocks are applied to the base case as before, but with the expenditure level following exactly the same target path as in the base case. The primary deficit shrinks by 55 basis points on average with a positive shock and it increases by 66 basis points when there is a negative shock.
90. The third simulation (Figure 18) demonstrates the impact of a capital expenditure preserving expenditure rule by gradually raising public capital expenditure from 4% of GDP in the initial year, FY2017, to 5% by FY2020, a 25% increase over the 4 years. The interesting result is that fiscal deficit, primary deficit, and public debt ratios gradually decline as the impact of the higher capital expenditure works its way through the interactions of the model. The public debt ratio in this case ends up at 57.1% in FY2020 compared with 66.3% in FY2017.
91. The fourth simulation (Figure 19) compresses “transfers” (defined to include subsidies), a component of revenue expenditure, thereby gradually reducing the fiscal and primary deficit ratios. The debt-to-GDP ratio accordingly declines to 55.3% by FY2020. Capital expenditure rises to 5% of GDP by FY2020 in this scenario, while growth and inflation are also significantly higher compared with the base case. It is the higher level of nominal growth, hence the denominator of the debt-to-GDP ratio, that drives down this ratio.
92. The fifth simulation (Figure 20) also illustrates a debt ceiling rule, a ceiling of 60% of GDP in this case. The compression of expenditure on “transfers” under revenue expenditure is now re-calibrated to decline from 5.6% of GDP in FY2016 to 4.4% in FY2020. The fiscal and primary deficit levels, GDP

28 ADB South Asia Working Paper Series No. 52
growth, and inflation all adjust accordingly to generate a debt-to-GDP ratio of 60.2% by FY2020. The compression of revenue expenditure is partly offset by an increase in capital expenditure.
93. The sixth simulation (Figure 21) demonstrates the impact of a more liberal debt ceiling rule that allows the debt-to-GDP ratio to rise to 70%. In this case, “other revenue expenditure”, which was already bumped up to capture the pay commission shock in the new base scenario, is pushed up by another 17% in FY2016. The fiscal and primary deficits increase accordingly, along with some increase in the average growth rate and inflation rate over the reference period, with a net effect of raising the debt-to-GDP ratio to 69.5% by FY2020. Capital expenditure, however, is maintained at just over 4% of GDP.
Figure 16: Countercyclicality with Structural Deficit Rule
FY = fiscal year, GDP = gross domestic product. Source: Authors’ calculations.
Figure 17: Countercyclicality with Expenditure Rule
FY = fiscal year, GDP = gross domestic product. Source: Authors’ calculations.
Primary Deficit (as % of GDP)
2.5 12.010.0
8.06.04.02.0
0
2.0
1.5
1.0
0.5
1.8
7.3 7.08.4
5.57.0 7.4 6.6 6.9 6.4
7.4
10.2
4.2
1.91.7
1.6 1.6 1.41.8
1.5 1.41.7
1.9
Base case (structural deficit) nominal global growth 7.5% in FY2017
Positive shock, nominal global growth 10% in FY2017Negative shock, nominal global growth 5% in FY2017
1.7
FY2017 FY2018 FY2019 FY2020 FY2017 FY2018 FY2019 FY20200
Real GDP Growth %
Primary Deficit (as % of GDP)
3.0 10.0
8.0
6.0
4.0
2.0
0
2.52.01.51.00.5
1.87.3 7.0 7.4 6.7 7.0 7.0 7.1 6.9 6.7 7.1
9.1
5.4
2.4
1.7
1.1
1.6
1.0
2.2
1.51.1
2.02.4
Base case (structural deficit) nominal global growth 7.5% in FY2017
Positive shock, nominal global growth 10% in FY2017Negative shock, nominal global growth 5% in FY2017
1.3
FY2017 FY2018 FY2019 FY2020 FY2017 FY2018 FY2019 FY20200
Real GDP Growth %

Fiscal Responsibility and Budget Management Act in India: A Review and Recommendations for Reform 29
Figure 18: Impact of 25% Increase in Public Capital Expenditure to Gross Domestic Product Ratio (Incorporating 7th Pay Commission Shock)
FY = fiscal year, GDP = gross domestic product. Source: Authors’ calculations.
Figure 19: Impact of Debt as a Share of Gross Domestic Product Gradually Moving to 55% (Incorporating 7th Pay Commission Shock)
FY = fiscal year, GDP = gross domestic product. Source: Authors’ calculations.
Primary Deficit (as % of GDP) Total Government Liabilities (as % of GDP) Real GDP Growth Rate %3.5 68.0 12.0
10.0
8.0
6.0
4.0
2.0
0
66.064.062.060.058.056.054.052.0
66.3 66.3 66.1
63.7
66.0 66.4
8.9 8.97.9
9.8
7.4
10.2
7.0
8.8
59.9
57.1
3.03.1 3.1
2.72.5
FY2017 FY2018 FY2019 FY2020 FY2017 FY2018 FY2019 FY2020 FY2017 FY2018 FY2019 FY2020
2.5
1.8
2.4
1.2
2.5
2.0
1.5
1.00.5
0
Pay Commission Shock Public Capital Expenditure to GDP raised from 4% to 5%
Total Government Liabilities (as % of GDP) Primary Deficit (as % of GDP) Real GDP Growth Rate %
70.080.0 3.5 12.0
10.0
8.0
6.0
4.0
2.0
0
3.0
2.5
2.0
1.5
1.0
0.5
0
1.7
1.2
2.7
0.3
1.51.6
2.5
0.8
2.460.0
FY2017 FY2018 FY2019 FY2020 FY2017 FY2018 FY2019 FY2020 FY2017 FY2018 FY2019 FY2020
50.040.030.020.010.0
0
Base case Pay Commission Shock Debt Reduction to 55% by FY2020
65.166.0
60.065.7
66.163.2
66.366.3
65.664.5
66.4
55.3
1.8
3.1
2.6
7.3
8.9 8.7
7.07.9 8.3
7.0 7.48.6
6.9 7.0
9.6

30 ADB South Asia Working Paper Series No. 52
Figure 20: Impact of Debt as a Share of Gross Domestic Product Gradually Moving to 60% (Incorporating 7th Pay Commission Shock)
FY = fiscal year, GDP = gross domestic product. Source: Authors’ calculations.
Figure 21: Impact of Debt as a Share of Gross Domestic Product Gradually Moving to 70% (Incorporating 7th Pay Commission Shock)
FY = fiscal year, GDP = gross domestic product. Source: Authors’ calculations.
Total Government Liabilities (as % of GDP) Primary Deficit (as % of GDP) Real GDP Growth Rate %68.0 3.5 10.0
8.0
6.0
4.0
2.0
0
3.0
2.5
2.0
1.5
1.0
0.5
0
1.71.3
2.7
0.9
1.51.6
2.5
1.1
2.466.0
FY2017 FY2018 FY2019 FY2020 FY2017 FY2018 FY2019 FY2020 FY2017 FY2018 FY2019 FY2020
64.0
62.0
60.0
58.0
56.0
Base case Pay Commission Shock Debt Reduction to 60% by FY2020
65.166.0
61.9
65.766.1
63.8
66.366.3
65.664.5
66.4
60.2
1.8
3.1
2.6 7.3
8.9 8.7
7.07.9 7.8
7.0 7.4 7.76.9 7.0
7.4
Total Government Liabilities (as % of GDP) Primary Deficit (as % of GDP) Real GDP Growth Rate %70.0 5.0 12.0
10.0
8.0
6.0
4.0
2.0
0
4.0
3.0
2.0
1.0
0
1.7
3.8
2.7
3.5
1.51.6
2.5
3.6
2.4
69.0
FY2017 FY2018 FY2019 FY2020 FY2017 FY2018 FY2019 FY2020 FY2017 FY2018 FY2019 FY2020
68.067.066.065.064.0
62.063.0
Base case Pay Commission Shock Debt Reduction to 70% by FY2020
65.166.0
68.0
65.766.1
67.166.3
66.366.7
64.5
66.4
69.5
1.8
3.1
4.3
7.3
8.910.1
7.17.9 8.4
7.0 7.4 7.56.9 7.0 6.9

Fiscal Responsibility and Budget Management Act in India: A Review and Recommendations for Reform 31
VII. RECOMMENDATIONS
A. Fiscal Rule Options Recommendation 1: Target Multiple Fiscal Rules or a Numerical Range and Recommendation 2: Adopt a Golden Rule 94. Based on the simulation results presented above, two alternative combinations of fiscal rules can be considered for the next generation of fiscal reforms in India.
a. Option A 95. The first option is to adopt
(i) an expenditure rule, which sets MTFP and MTEF expenditure targets that are consistent with a desirable, stationary or declining public debt-to-GDP ratio, and
(ii) a supplementary capital expenditure preserving rule that can be achieved by setting a minimum threshold for the share of capital expenditure, e.g., 5% of GDP. Alternatively, capital expenditure can also be preserved by a rule that specifies that public borrowing will only be allowed for capital expenditure, which is equivalent to the traditional “golden rule” where current deficit is zero.
96. The model simulations show that raising the share of capital expenditure reduces the fiscal deficit and primary deficit as well as public debt ratios if it is financed by compressing other components of revenue expenditure. However, capital expenditure may also be financed through loans. If there is a concern that this could lead to a rising debt ratio despite rule (i), as a matter of abundant caution, it would be desirable to add a rule that explicitly sets a ceiling on the permissible level of debt. This would also fulfill a constitutional mandate. 97. The present FRBM law can be replaced by a new Debt Ceiling and Fiscal Responsibility Act under Article 292 of the Constitution along the lines suggested by the 14th Finance Commission. The states can be encouraged to bring in similar legislation under Article 293 (1).
b. Option B 98. If legislation to explicitly set a ceiling on debt is not considered suitable, the objective of combining debt sustainability with countercyclicality can also be achieved through a second option, i.e.,
(i) a fiscal rule that sets a target for the level of structural deficit consistent with a desired, stationary level of public debt,18 plus
(ii) either of the capital preserving fiscal rules discussed under option A. 99. This can be accomplished by amending the existing FRBM Act while dropping the concept of an effective revenue deficit that is not in line with standard budgeting practices.
18 There are measurement problems in calculating structural balance such as estimation of the potential output and output
gaps, adjustment of fiscal revenues for the effect of business cycle using estimated revenue elasticities, and adjustment for national income reflecting asset price cycles. (IMF 2011).

32 ADB South Asia Working Paper Series No. 52
100. The issue of setting targets in the form of bands—whether for expenditure level or fiscal deficit—to accommodate shocks has sometimes been raised. The difficulty with this approach is to determine the width of the band without knowing the severity of shocks in advance. If the shock is too severe relative to the band, special interventions would be required, possibly disrupting the whole fiscal consolidation effort, as what happened in 2008. By contrast, under the two options suggested above, the rules come into play as automatic countercyclical stabilizers calibrated to the severity of a negative or positive shock. The safety net of a well-defined escape clause in case of exceptional circumstances needs to be articulated. 101. A vague escape clause, referring to “unforeseen circumstances” was identified earlier as one of the limitations of the existing FRBM law. A tightly defined escape clause, which specifies in advance the circumstances under which fiscal rule may be breached, is now a standard component of best practice fiscal rules. Without such specification, breaching of fiscal targets can become an ad hoc affair, left to the discretion and convenience of the incumbent government. The authority that permits such an “escape” should also be specified. The suggested new Debt Ceiling and Fiscal Responsibility Act, or alternatively, an amended FRBM, should incorporate such a well-defined escape clause.
102. We suggest that the breach of fiscal rule may be allowed temporarily, in exceptional circumstances, and only for a very limited range of factors, e.g., a major natural disaster, significant growth slowdown or recession, out-of-ordinary events with temporary but significant impact on deficit, and significant change in scope of the budget. Each of these triggers should be clearly defined, preferably quantitatively, in terms of deviation from normal. For example, growth slowdown can be defined as a fall in annual GDP growth rate by more than three standard deviations from the trend growth rate. Similarly, out-of-ordinary events of financial significance can be defined as those that, other things being equal, cause a deterioration of 0.5% or more in the fiscal deficit-to-GDP ratio. It is highly desirable that the invocation of escape clauses is taken by the Government of India based on the advice of an independent fiscal institution such as a fiscal council, which can provide an objective account of whether the circumstances in question warrant a deviation.
103. The escape clauses should be triggered only during exceptional situations that are entirely outside the government’s control, which can affect the country’s macroeconomic stability. The clauses should allow for discretionary countercyclical policies when needed and should be designed in such a way that deviations do not alter the long-term fiscal path. Further extension can be granted based on a clear justification of the circumstances warranting a relaxation. While some flexibility can be allowed in terms of borrowing for both union and states, escape clauses should clearly set out the extent and the period of deviation, and specify a path of return to the original fiscal rule. The escape clauses should clearly mandate that the government prepares a plan with a well-defined commitment to return to the original fiscal targets in ensuring fiscal years. 104. With regard to fiscal rules for the states, macroeconomic stabilization is not their responsibility constitutionally. That is the responsibility of the central government. Considering the states’ responsibilities, all states are not in the same economic or fiscal situation, and their fiscal rules need to take this into account.
105. One issue here is the constraints and needs of the poorer states. Instead of dealing with this in an ad hoc manner for individual states, it is best to address this as a systemic issue, based on the principal of equal fiscal treatment of all entities within the same national tax jurisdiction. The 14th Finance Commission did this in its devolution formula and its post-devolution current deficit grant. Normatively assessed needs and revenue capacity were factored into the devolution formula, taking into account the

Fiscal Responsibility and Budget Management Act in India: A Review and Recommendations for Reform 33
disadvantages of the poorer states. States that were assessed to fall short of the average per capita public expenditure post devolution by more than 80% in FY2020, the terminal year of the award, were given a special current deficit grant to meet the gap.19 Should the government wish to push the principal of equalization further, it can do so through centrally sponsored schemes or even suggest it as a term of reference for the next finance commission.
106. The second issue is differentiation in the fiscal rules applicable to individual states to take into account their different fiscal situations. States in a more comfortable fiscal situation should be enabled to raise more loans, especially to finance capital expenditure. With the fiscal deficits of all states anchored at 3% of GSDP, the 14th Finance Commission has allowed an additional 0.25% fiscal deficit for states that have a debt-to-GSDP ratio of less than or up to 25% in the reference year. It has also allowed an additional 0.25% fiscal deficit for states with interest payments amounting to less than 10% of their revenue receipts in the reference year. Thus, states in a comfortable fiscal situation may be allowed fiscal deficits of up to 3.5% of their GSDP.
107. In this context, it is noted that following the award of the 12th Finance Commission, states are now required to directly borrow from the market. That raises the need for a transparent system for rating the fiscal performance of states. It is possible that rating institutions are already providing such assessments privately to potential lenders. However, such rating systems need to be objective, standardized, and available in a transparent platform for public scrutiny. B. Enforcement of Fiscal Rules
108. The current Indian FRBM system does not have any specific instruments to enforce fiscal rules such as sanctions and penalties for the central government other than its the reputational risk. In the case of the states, Article 293 clause (3) of the Constitution requires them to seek central government permission to raise loans so long as they have outstanding liabilities to the central government. This effectively enforces a hard budget constraint on them. However, with states’ liabilities to the central government progressively declining, following the award of the 12th Finance Commission, this clause will gradually cease to apply. Thus, both for the central government as well as the states, it is desirable that debt ceilings be legislated as envisaged under Articles 292 and 293. This would serve a powerful enforcement tool, since breaching the debt ceiling would be tantamount to breaking a law. 109. A second effective enforcement instrument would be the establishment of an independent financial institution to monitor fiscal rule compliance. This is elaborated below. Recommendation 3: Establish an Independent Fiscal Institution 110. The establishment of an independent fiscal institution to monitor the government’s compliance with fiscal rules, its fiscal marksmanship, and the cost of public expenditure is an important feature of second generation fiscal rules. Many countries in the Organisation for Economic Co-operation and Development as well as emerging market economies have set up such institutions with a variety of features. 111. In the Indian context, several institutional models can be considered. The institution can be established as a constitutional body but that would require a constitutional amendment. It can be established as an institution reporting to Parliament, somewhat like the Congressional Budget Office in 19 Excluding interest payments, pensions, and grants under centrally sponsored schemes.
34 ADB South Asia Working Paper Series No. 52
the United States. It can also be established by the Ministry of Finance as an independent body. Whichever format is adopted, the institution should be established by legislation, not just through executive order, and it should be adequately funded through a charged item in the budget and not by annual budget appropriations approved by Parliament. These safeguards are necessary to ensure the independence of the institution. 112. It is suggested that such an institution be established as part of the next generation of fiscal reforms in India, either under the suggested Debt Ceiling and Fiscal Responsibility Act or an amendment of the existing FRBM Act. Recommendation 4: Introduce a Fiscal Stability Report
113. Similar to the advent of financial stability reports generated by central banks and particularly those that have to explain risks to inflation targets, there is an increasing view of the importance of having fiscal authorities improve their overall communication strategy by issuing an annual reporting on fiscal risks and outlook to fiscal stability, including better reporting on contingent liabilities.20 The Indian FRBM does not spell out this requirement and this would be important as a means to explain the headwinds or tailwinds facing the economy—perhaps building from the Economic Survey 2016–2017—and translating these to assess the impact on the underlying fiscal path. The improved analysis could take off from the fiscal challenges section of the survey to expand into a full-fledged report including better coverage of the balance of risks, off-budget liabilities, and overall fiscal outlook. This would be a valuable contribution in guiding expectations on the government’s fiscal position. As governments have increasing access to off-budget financing through special purpose vehicles, borrowing through state-owned enterprises, and quasi-fiscal operations, with increasing demands on guarantees as the economy turns to greater involvement of public–private partnerships, other risk-sharing arrangements, and the possible support for bank recapitalization, there is an increasing importance for this type of fiscal analysis under a dedicated fiscal stability report. A similar consideration could apply to the states. Recommendation 5: Improve the Linkage between Fiscal Policy and Strategy and Budget Operations 114. For the government to have a more effective framework to make changes to the fiscal stance over the short term while allowing for a convergence to a sustainable fiscal target over the medium term, a close and strong link between fiscal strategy and the budget process—in particular the expenditure framework—would be recommended. While fiscal brakes are a blunt tool and more conventional measures of expenditure consolidation generally require long lead times, a better integration with the budget process would allow for greater finessing of revisions to the fiscal stance with an improved outcome in terms of budgeting results. Under the circumstances, the strategy and policy rules would have to dovetail with the MTEF. In addition, efforts should focus on strengthening adherence to the four principles of sound budgeting: transparency, predictability, credibility, and comprehensiveness. There should be clear linkages between the MTEF as it is articulated with the budget and the links between
20 It is recognized that both the central government and state governments acquire contingent liabilities mostly in the form of
sovereign guarantees for public enterprises. The question is how these contingent liabilities are to be valued. The 14th Finance Commission suggested that the government should use the concept of extended debt, which includes some valuation for the guarantees given to public enterprises. However, it did not propose any particular rule for valuing guarantees in the case of the central government. In the case of state governments, the commission proposed a formula of counting 90% of power guarantees, which account for the bulk of guarantees, and 10% of the value of guarantees given in other sectors. While efforts should clearly be made to resolve the valuation question, it may be premature at this stage to factor contingent liabilities into fiscal rules.

Fiscal Responsibility and Budget Management Act in India: A Review and Recommendations for Reform 35
budget planning, budgeting, implementation, and monitoring and evaluation. This would once again apply at both the central and state levels. To supplement this work, efforts should also focus on continuing to improve the fiscal accounting framework to commit to well-defined targets and statistical standards, reducing possible leakages in the accounting process, and ensuring timely and reliable reporting of fiscal operations. Recommendation 6: Better Sharing of Responsibilities for Stabilization and Sustainability 115. In a federal union, fiscal responsibility requires a balancing between the short-term economic stabilization goals and medium-term goals of sustainable public finances. Considerations such as the average size of the national vs. subnational budgets, the degree of vertical imbalance based on expenditure and revenue assignments help shape the division of responsibilities. Harmonizing state fiscal deficit and debt targets with macroeconomic stabilization goals at the federal union level is necessary to ensure that states are able to contribute to national fiscal outcomes. This requires clearly articulated rules that allow for incentives at the state level to keep to the agreed goals. While there are no specific challenges to point to, promoting a better articulation of fiscal responsibilities in a federal union between stabilization measures and fiscal sustainability at the federal level is an agenda that can always be improved upon. Similarly, a division between the types of public spending as well as the off-budget liabilities will help in terms of cross-government coordination. Recommendation 7: Introduce State Credit Ratings 116. Over the longer term, if subnational entities evolve as we have seen across other federal jurisdictions in advanced economies, i.e., Australia and Canada, we are likely to see a similar pattern in India where states become less wholly reliant on central transfers to supplement own revenue assignments and where sub-sovereign borrowing is one more funding source available to the state. This will be important as part of efforts to ensure that states have built-in incentives to keep to a desired level of fiscal prudence but more generally give them greater decision-making power in how they would like to borrow and spend. While in India this may still be something to consider over the medium term, it would be important to begin promoting the idea of having states selectively build a credit rating culture. This would help in establishing a discipline for good fiscal housekeeping and in turn allow the market through credit rating agencies to form an opinion on the creditworthiness of states. The states, in turn, by having “skin in the game” would have their own incentives to improve their ratings over time as that would reduce cost of borrowing and foster greater prudence and encourage accountability.
VIII. CONCLUSION
117. This paper has been prepared in response to a request from the chair of the FRBM Review Committee for a study from ADB on global best practices relating to the next generation fiscal framework. Accordingly, this paper has assessed India’s FRBM experience against the background of emerging global best practices on fiscal rules and other allied issues. The paper points out that the introduction of an FRBM Act in 2003 was a landmark event in fiscal reforms in India, subsequently followed by similar acts in all the states. However, the assessment also indicates that India has stayed with what are called traditional first generation fiscal rules and their associated challenges. Meanwhile, many advanced and emerging market economies have moved on to a second generation of fiscal rules. The paper has therefore presented a set of detailed options for consideration as a package of second generation fiscal rules for India. It is hoped that the FRBM Review Committee will find these proposals helpful.

APPENDIX 1
FISCAL RULES IN JAPAN, INDONESIA, AND AUSTRALIA
1. The experience of fiscal rules in three major economies in the Asia and Pacific region (Japan, Indonesia, and Australia) is explained in this appendix. While Japan had a fiscal rule since 1947, Indonesia introduced a budget balance rule (BBR) in 1967, and Australia initiated a troika of rules in 1985. However, the extent of compliance varies a lot across the three countries and even over different time periods. A. Japan
2. Japan has been working under fiscal rules since 1947. However, for a variety of reasons, which include periods of stagnant economy, adherence to these rules has been patchy. Lledó et al. (2017) highlight that since 1947, Japan has subject itself to a type of ‘golden rule’ according to which domestic revenues should cover current expenditure, and any borrowing through bonds would only be for financing public construction, capital contributions and loans. Sugimoto and Ueda (2013) point out that the Government of Japan adhered to this rule until 1964 and refrained from issuing any bonds. To counter the economic slowdown in 1965, the government chose to issue “construction bonds” for the first time, which became a regular feature in the subsequent years. 3. The first oil crisis in 1973 led to sharp slowdown in economic activity across the world. Japan was also impacted with the economy contracting by 1.2% in 1974, compared with growth rates of over 8% during the previous two years. The economic downturn caused a shortfall in tax revenues with a lag, and necessitated the issuance of “deficit financing bonds”. Sugimoto and Ueda (2013) point out that after 1975, the government continued to enact a special law that allowed it to issue these bonds. Asako et al. (1991) argue that these bonds played an important role until late 1980s as they ensured that actual revenues were close to planned revenue. Between 1987 and 1989, there was a sharp drop in issuance of these bonds as high land and stock price inflation facilitated robust tax collection. Further improvement in tax revenue growth resulted in the government halting the issuance of these bonds between 1990 and 1993. 4. However, the macroeconomic performance started deteriorating in the 1990s as the asset price bubble, fueling the growth in the late 1980s and early 1990s collapsed in 1992. The gross domestic product (GDP) growth rate fell below 1% during 1992 to 1994, and to stimulate the economy several fiscal measures such as expenditure hikes and tax cuts were introduced. However, these measures had little impact on GDP growth but led to widening of the fiscal deficit. Sugimoto and Ueda (2013) point out that the worsening of fiscal conditions led to the realization that a legislative framework with multi-year commitments was necessary to achieve fiscal consolidation. Consequently, the Fiscal Structure Reform Act (FSRA) was enacted in 1997. Under the FSRA, the fiscal deficit was to be brought down to below 3% of GDP by 2003, and the quantum of deficit financing bonds was to be reduced every year, and eventually eliminated by 2003. The FSRA also curtailed the targets for major expenditure categories like social security, defense and public works. However, soon after the implementation of the FSRA, economic conditions in Japan worsened considerably due to failure of major financial institutions and the onset of the Asian Financial Crisis. Even though some amendments were made to the FSRA as the government changed its fiscal stance into an expansionary one, like suspending the annual decrease in the issuance of deficit financing bonds and extending their termination date, it was soon realized that these would not be enough to prevent the downturn and the FSRA was suspended in December 1998.

38 Appendixes
5. Subsequently, between 2001 and 2006, the government worked with annual targets to balance the objectives of economic growth and fiscal consolidation. In 2006, the Government of Japan through a cabinet decision sought to achieve fiscal consolidation, and targeted a primary surplus by 2011. Lledó et al. (2017) characterize this as an expenditure rule as it imposed targets on various spending categories including public investment and social security. While these targets were applied to the budgets of 2007 and 2008, the onset of the global financial crisis led to the abandonment of the target as the government decided to follow an expansionary policy. 6. To revert to the path of fiscal consolidation, the Government of Japan adopted the Fiscal Management Strategy in June 2010. The main objective was to initially stabilize the debt to GDP ratio, and subsequently reduce it. Under the strategy, the government was required to halve its primary deficit from 6.4% in 2010 by 2015, and allow a gradual reduction in the debt to GDP ratio from 2021. Again, expenditure limits were introduced whereby expenditure, excluding repayment of debt and interest, had to be less than the previous year. In addition, as Lledó et al. (2017) point out, a pay-as-you-go rule was introduced, which requires any expenditure increasing or revenue decreasing measure to be compensated by a permanent expenditure decreasing or revenue raising measure. B. Indonesia 7. Indonesia has been one of the earliest emerging markets to work under any form of fiscal rule. In a bid to reduce the level of government debt and inflation, Indonesia chose to adopt a conservative fiscal policy stance. According to Lledó et al. (2017), since 1967, Indonesia has been subject to a BBR, under which the general government (central and local government) deficit would be limited to 3% of GDP in a given year. Consequently, in the years preceding the Asian Financial Crisis, Indonesia enjoyed a fiscal surplus of around 0.5% of GDP (1994 to 1996), and a low debt-to-GDP ratio. Despite its healthy fiscal stance, Indonesia, like other East Asian economies, was significantly impacted by the Asian Financial Crisis. Average GDP growth rate dropped from 7.9% during 1994 to 1996 to -2.5% during 1997-1999. The decline in economic activity, combined with the need to strengthen the domestic banking sector resulted in the fiscal deficit rising to 1.3% of GDP during 1997-1999. 8. Even though the fiscal deficit started declining since 2000, in 2003 Indonesia adopted a fiscal rule that combined a BBR with a debt rule as per the State Finance Law and Government Regulation 23/2003. Blöndal et al. (2009) point out that this was done to solidify the recent fiscal gains and ensure future fiscal discipline. According to this rule, annual fiscal deficit was limited to 3% of GDP, while government debt was capped at 60% of GDP. After the adoption of this rule, Indonesia witnessed an improvement in its fiscal parameters. Fiscal deficit averaged a modest 0.5% of GDP per year during the period 2004 to 2011 while the debt-to-GDP ratio more than halved from 51.3% to 23.1% over the same period. 9. Indonesia’s fiscal position started to come under pressure since 2012 due to a variety of factors. Rising fuel consumption and a surge in global fuel price resulted in Indonesia’s fuel subsidies rising faster than the tax revenue growth between 2009 and 2012. This resulted in the central government fiscal deficit breaching 2% of GDP benchmark in 2013, and the general government debt rising to 26.8% of GDP by 2015 (IMF, 2013). Despite the recent deterioration in fiscal position, Indonesia’s overall fiscal management has largely been prudent and its deficit and debt levels continue to remain well below those of most other emerging markets.
Appendixes 39
10. While the adoption of fiscal rules has helped improve Indonesia’s fiscal position, they have been critiqued for curtailing developmental expenditure in order to stay within the rules. ADB (2017) points out that aggregate investment in infrastructure in Indonesia in 2015 was only $23 billion (2.7% of GDP), compared with $118 billion in India (5.6% of GDP) and $686 billion in the People’s Republic of China (6.2% of GDP). Similarly, Francis (2012) argue that the conservative fiscal policy stance has resulted in capital expenditure and non-education social expenditure like those on health and access to water and sanitation remaining quite low. C. Australia
11. As described in Figure 9 under Section IV of the paper, Australia was the only country in Asia and the Pacific region that experimented with all the four kinds of fiscal rules outlined in Schaechter et al. (2012). In 1985, the government adopted an expenditure rule, revenue rule and BBR for the period 1985 to 1988. While the revenue rule and the expenditure rule restrained the government from raising government expenditure (as a percentage of GDP) and government revenue (as a percentage of GDP), respectively, compared with the base year, BBR required a reduction in the budget deficit, both in actual terms as well as a percentage of GDP. The government was able to meet the expenditure and the budget deficit targets, but overshot the revenue target due to strong economic conditions bolstering revenue (Kirchner, 2013). 12. However, the recession in early 1990s reversed most of the fiscal gains that were achieved in the late 1980s. The budget surplus achieved in the late 1980s rapidly turned into a deficit, and averaged more than 4% of GDP during the period 1992 to 1994. The worsening of the fiscal outcome was driven by both a slowdown of the economy and a discretionary fiscal stimulus, which had a limited impact. With the economy showing signs of revival from 1993, there was an attempt to revert back to a path of the fiscal consolidation and the government sought to reduce the fiscal deficit from around 4% of GDP to 1% by 1996. 13. In 1998, Australia formally adopted a new fiscal framework under the Charter of Budget Honesty Act (Lledó et al. 2017). The fiscal strategy under the Charter of Budget Honesty Act 1998 recommended that the government attain budget surplus over the business cycle, and not necessarily every year. It also prescribed capping of tax revenues (as a percentage of GDP) and improvement in net financial worth of the government in the medium term. The Charter of Budget Honesty Act has been criticized on account of being too general, and not providing specific guidance on policy outcomes (Carling and Kirchner, 2009). This provided significant discretionary power to the government while making policy commitments. Furthermore, if certain budget outcomes were to be viewed as being inconsistent with the terms of the act, the Charter of Budget Honesty Act does not have any enforcement mechanism, and any form of judicial or administrative review is prohibited. 14. Under the Charter of Budget Honesty Act, the government is also tasked with publishing numerous macroeconomic and fiscal updates to improve transparency and accountability. However, the credibility of these reports has been questioned as they have been released in a highly discretionary manner to suit political convenience (Carling and Kirchner, 2009). A key novelty of the Charter of Budget Honesty Act was the requirement to produce Intergenerational Report that would look at the long-term sustainability of the current fiscal policies. According to the most recent report, fiscal sustainability would deteriorate unambiguously over the next 40 years unless key fiscal policies are altered (Commonwealth of Australia, 2015).

40 Appendixes
15. In 2007, the government committed to raising the budget surplus to 1.5% of GDP and contributing any additional amount that would accrue to a future fund. However, the global financial crisis in 2008 and the subsequent fiscal stimuli in 2008 and 2009, in the form of higher expenditure on public works and lump-sum transfers to households to boost consumption, implied that the target could not be achieved. To improve the weakened fiscal position because of the global financial crisis, in 2009, Australia set out a deficit-exit strategy and introduced an expenditure rule that would restrain growth in spending (Lledó et al. 2017). According to this rule once the Australian economy starts growing above its trend, real expenditure growth would be curbed at 2% per year until the budget achieves a surplus. The government was able to achieve this in the subsequent years. 16. Going forward, the government aims to achieve budget surplus on average over the economic cycle. The approach is supported by channeling public investment to bolster productivity and workforce participation, freeing up resources for the private sector by restraining expenditure and improving government’s net financial worth over time.

Appendixes 41
APPENDIX 2
THE BASE CASE MACROECONOMIC MODEL
1. The base case Klein-Goldberger type structural macroeconomic policy simulation model used by Bhanumurthy et al. (2015)1 represents the macroeconomy in terms of five blocks, which are real sector block, external sector block, fiscal block, monetary block, and macroeconomic block. The model has been estimated using annual data for the period of fiscal year (FY) 1992 to FY2013. In some cases, as the final national accounts statistics data for FY2013 such as sectoral investments were not available, the estimation was limited to FY2012. 2. In terms of estimation procedures, simple ordinary least squares method was used. To adjust for the instability created during the 2008 crisis, a dummy variable was introduced along with structural dummies that capture the structural breaks in the dependent variables and outlier dummies for robustness of parameters. To correct for autocorrelation, autoregressive (AR1) terms were introduced. Such adjustments in outliers are largely similar to the error correction models that help derive underlying long term behavior after correcting for errors. 3. Real sector block. The real sector is disaggregated into agriculture, industry, services, and infrastructure. The structural equations are as follows: Agriculture 1) ZYFtAGRI = f(ZNKt-1AGRI, RAIN, MSP)
ZYFtAGRI : real agricultural GDP at factor cost ZNKt-1AGRI: real net capital stock in agriculture (in previous period) RAIN: deviation of actual from normal rainfall (EXOGENOUS) MSP: minimum support price (POLICY variable)
2) ZNKtAGRI = ZNItAGRI + ZNKt-1AGRI 3) ZGItAGRI = ZNItAGRI + Depreciationt AGRI
ZNItAGRI: real net capital formation in agriculture ZGIt AGRI: real gross capital formation in agriculture Depreciationt AGRI: depreciation of capital stock in agriculture (EXOGENOUS)
4) GItAGRI ≡ Pt AGRI * ZGIt AGRI ≡ GIPUt AGRI + GIPVt AGRI
GItAGRI: nominal gross investment in agriculture GIPVtAGRI: nominal gross private investment in agriculture GIPUtAGRI: nominal gross public investment in agriculture PtAGRI : price deflator of agriculture sector
5) GIPVtAGRI = f(YFtAGRI, GIPUtAGRI)
YFtAGRI: GDP at factor cost in the agriculture sector 6) GIPUtAGRI = f(ECAPtAGRI) 1 N. Bhanumurthy, S. Bose, and P. Adhikari. 2015. Targeting Debt and Deficits in India: A Structural Macroeconometric
Approach. NIPFP Working Paper. No. 148. New Delhi: National Institute of Public Finance and Policy.

42 Appendixes
7) ECAPtAGRI ≡ a1. ECAPt ECAPtAGRI: capital expenditure by government in agriculture (nominal) ECAPt: total capital expenditure by government (nominal) a1: policy determined ratio of proportion of capital expenditure going to agriculture
8) d(PtAGRI) = f(d(CPRt), d(MSP), Cyc_ZYFtAGRI)
PtAGRI: price deflator of the agricultural sector CPRt: private consumption Cyc_ZYFtAGRI: cyclic component of ZYFtAGRI
Industry 9) ZYFtINDUS = f (XtG/PtINDUS , GIt / PtINDUS )
ZYFtINDUS: real output of the industrial sector at factor cost GIt: gross total investment XtG: exports of goods (nominal) PtINDUS: price deflator of industrial goods
10) GItINDUS = GIPUtINDUS + GIPVtINDUS
GItINDUS : gross investment in industry GIPUtINDUS : gross public investment in industry GIPVtINDUS : gross private investment in industry
11) GIPVtINDUS / YMPt = f[INTRATEt, (GIPUtINDUS /YMPt), ZYFt-1INDUS/ C(ZYFt-1 INDUS)]
INTRATEt: lending rate by commercial banks ZYFt-1INDUS: real output of the industrial sector in the previous period C(ZYFt-1INDUS): capacity output of the industrial sector in the previous period
12) C(ZYFtINDUS) ≡ (1/ KOR_TRENDtINDUS) * ZNKtINDUS
ZNKtINDUS: real net capital stock in industry KOR_TRENDtINDUS: trend component (HP-Trend) of the capital output ratio in the industrial sector after removing the cyclical component. This variable can be viewed as representative of the industrial technology. KOR_TRENDtINDUS shows a secularly rising trend since mid-1990s.
13) GIPUtINDUS = f(ECAPtINDUS) 14) ECAPtINDUS ≡ a2. ECAPt
ECAPtINDUS: capital expenditure by government in industry (nominal) ECAPt: total capital expenditure by government (nominal) a2: policy determined proportion of capital expenditure going to industry
15) PtINDUS = f(Pt-1INDUS, PtAGRI, PtOIL, Net Capital Flowst)
PtINDUS: price of industrial goods PtAGRI: price of agricultural goods PtOIL: administered price of oil (POLICY variable) Net Capital Flowst: net international capital flows to India

Appendixes 43
16) PtOIL = f(OILPRUSDt, OILPRRATIOt) OILPRUSDt: international price of Indian basket of oil imports (EXOGENOUS) OILPRRATIOt: the ratio of domestic oil price index divided by the international oil price index in Rupee terms. This is also called the pass-through ratio.
Services 17) ZYFtSER = ZNKtSER * (Z YFtSER / ZNKtSER) 18) ZYFtSER / ZNKtSER = ( NXtSER/PtSER, CPUt +CPRt/PtSER)
ZYFtSER : real output of the service sector at factor cost ZNKtSER: real net capital stock of the service sector NXtSER: net exports of services PtSER: price of services CPRt: private consumption demand CPUt: public consumption demand
19) GIPVtSER = f(GIPUtINFRA + GIPUtSER)
GIPVtSER: gross private investment in services GIPUtINFRA: gross public investment in infrastructure sector GIPUtSER: gross public investment in service sector
20) GIPUtSER = f(ECAPtSER) 21) ECAPtSER ≡ a3. ECAPt
ECAPtSER: capital expenditure by government in services (nominal) ECAPt: total capital expenditure by government (nominal) a3: policy determined ratio of proportion of capital expenditure going to services
22) PtSER = f(Pt-1SER, YMPt)
PtSER: price deflator of the service sector YMPt: nominal GDP at market price
Infrastructure 23) ZYFtINFRA = f (ZNKt-1INFRA)
ZYFtINFRA: real output of the infrastructure sector at factor cost ZNKt-1INFRA: real net capital stock of infrastructure sector at the end of the previous period
24) GIPVtINFRA = f(GIPUtINFRA, INTRATEt, YMPt)
GIPVtINFRA: gross private investment in infrastructure sector GIPUtINFRA: gross public investment in infrastructure sector
25) GIPUtINFRA = f(ECAPtINFRA) 26) ECAPtINFRA ≡ a4. ECAPt
ECAPtINFRA: capital expenditure by government on infrastructure (nominal) ECAPt: total capital expenditure by government (nominal) a4: policy determined ratio of proportion of capital expenditure going to infrastructure sector
44 Appendixes
27) PtINFRA = f(Pt-1INFRA,Pt INDUS) PtINFRA: infrastructure prices PtINDUS: industrial commodity price
4. External sector block. Trade flows along with flows on income account comprise the current account of the balance of payments. The structural equations are as follows: 28) XtG = f(WORLDGDPt, DUTYt, ERt)
XtG: export of goods WORLDGDPt: world GDP (EXOGENOUS) ERt: exchange rate (EXOGENOUS) DUTYt: import weighted average tariff rate (EXOGENOUS)
29) MtG = f(YMPt, ERt, OILPRUSDt)
MtG: import of goods YMPt: nominal output ERt: exchange rate OILPRUSDt: oil price in US Dollars (EXOGENOUS)
30) NXtSER = f(XtG, USGDPt)
NXtSER: net export of services USGDPt: US GDP (EXOGENOUS)
31) REMITt = f(MEGDPt + ADVGDPt, INTRATEt)
REMITt: remittances MEGDPt: Middle East GDP (EXOGENOUS) ADVGDPt: GDP of the advanced countries (EXOGENOUS) INTRATEt: lending rates of banks
32) NETINVESTINCOMEt = f(NETCAPITALFLOWSt, ERt)
NETINVESTINCOMEt: net investment income NETCAPITALFLOWSt: net capital flows (inflows minus outflows in the capital account)
33) NETCAPITALFLOWSt = f(YMPt , CREDITRATINGt) CREDITRATINGt: credit rating (EXOGENOUS)
34) CABt = XtG - MtG + NXtSER +REMITt+NETINVESTINCOMEt
CABt: current account balance 5. Fiscal block. Fiscal block has important policy levers consisting of expenditure and revenue measures of the government. The structural equations are as follows: 35) d(DTAX)t ≡ b1t * d(YMP) t /YMPt-1] * DTAXt-1
DTAXt: direct tax b1t: direct tax buoyancy (POLICY variable) It is assumed that the government can influence the buoyancy through adjustments in tax rates and the administrative tax effort. YMPt: nominal income

Appendixes 45
36) d(INDTAX)t ≡ b2t * [d(YMP)t /YMPt-1] *INDTAXt-1 INDTAXt: indirect tax b2t: indirect tax buoyancy (POLICY variable) YMPt: nominal income
37) NONTAXREVt = f(YMPt)
NONTAXREVt: non-tax revenue in year t. 38) REVRECt= DTAXt + INDTAXt + NONTAXREVt
REVRECt: revenue receipts 39) REVEXPt = OTHERECURRt+ TRANSFERSt+ INTERESTPAYt
REVEXPt : revenue expenditure in year t OTHERECURRt: other revenue expenditure in year t TRANSFERSt: transfer payments by government inclusive of subsidies (EXOGENOUS) INTERESTPAYt: interest payment on government liabilities
40) OTHERECURRt = f(OTHERECURRt-1)
OTHERECURRt: budgetary counterpart to government consumption expenditure. It includes the salaries and wages and is sticky upwards; it is assumed to depend on its own past values
41) INTERESTPAYt ≡ LIABt-1 * ROIGSECt-1
INTERESTPAYt: interest payments LIABt-1: stock of government liabilities outstanding at the end of the previous period ROIGSECt-1: interest rate on government securities in the previous period
42) REVDEFICITt ≡ REVEXPt – REVRECt REVDEFICITt: revenue deficit
43) ECAPt = f(REVDEFICITt) ECAPt: capital expenditure in year t
44) ECAPt ≡ ECAPtAGRI + ECAPtINDUS + ECAPtSER + ECAPtINFRA + ECAPtDEF
15-25 percent of total capital expenditure is defense related. 45) FDt ≡ REVDEFICITt +ECAPt -NDCRt ≡ d(Dt) + d(FRt)
FDt: fiscal deficit in year t NDCRt: non-debt capital receipts (EXOGENOUS) d(D t): change in government debt d(FR t): change in fiscal reserves. (EXOGENOUS)
46) d(Dt) ≡ MBt + OBt
MBt: market borrowing of the government OBt: other borrowing of the government such as the proportions of small savings and provident funds used to finance fiscal deficit (EXOGENOUS)
47) MBt= f(FDt)
MBt: market borrowing is assumed to be a function of fiscal deficit

46 Appendixes
48) LIABt ≡ Dt + OLt LIABt: stock of government liabilities outstanding in period t OLt: other liabilities includes liabilities on account of NSSF, state provident funds, other accounts and reserve funds not accounted for in Dt (EXOGENOUS)
49) PDt ≡ FDt - INTERESTPAYt
PDt: primary deficit 6. Monetary block. Repo rate is a policy parameter for the central bank. With inflation control being the principal objective of the RBI, repo rate (REPO) is supposed to respond to the gap between actual and desired inflation rate. The structural equations are as follows: 50) REPOt = f(PWPIt)-.05, REPOt-1),
PWPIt :overall wholesale price index REPOt : repo rate
51) ROIGSECt = f(REPOt)
ROIGSECt: interest rate on government securities 52) INTRATEt = f(REPOt , MBt)
INTRATEt: lending rate of commercial banks MBt: government’s market borrowing
53) BCt = f(GIPUt + GIPVt)
BCt: non-food credit disbursed by commercial banks
7. Macroeconomic block. The structural equations are as follows:
54) YMPt = (CPRt + CPUt) + (GIPUt+ GIPVt) + (XtG – MtG+ NXtSER) + VALUABLES t YMPt: GDP at market prices (aggregate demand) CPRt: private consumption expenditure CPUt: public consumption expenditure GIPUt: gross public investment GIPVt: gross private investment XtG: export of goods MtG: import of goods NXtSER: net export of services VALUABLESt: investments on expensive durable goods acquired primarily as stores of value and discrepancy (EXOGENOUS)
55) CPRt = f(YMPt-DTAXt+TRANSFERSt+INTERESTPAYt)
CPRt: private sector consumption is a function of private disposable income. Private disposable income is estimated as nominal output minus direct tax plus transfer payments and interest payments.
56) CPUt = f(OTHECURRt)
CPUt: public sector consumption OTHECURRt: other revenue expenditure of the government

Appendixes 47
57) GIPUt ≡ GIPU tAGRI + GIPU tINDUS+ GIPU tSER+ GIPU tINFRA GIPUt: gross public investment
58) GIPVt ≡ GIPVtAGRI + GIPVtINDUS+ GIPVtSER+ GIPVtINFRA GIPVt: gross private investment
59) Pt ≡ w1PtAGRI + w2PtINDUS + w3PtSER + w4PtINFRA
Pt: the overall price deflator (GDP deflator) is derived through aggregation of sectoral price deflators after applying the suitable weights, w1, w2, w3 and w4
60) PWPIt = f(Pt)
PWPIt: wholesale price index

REFERENCES Aguiar, Mark, and Gita Gopinath. 2004. Emerging Market Business Cycles: The Cycle is the Trend. NBER
Working Paper No. 10734. Massachusetts: National Bureau of Economic Research. Alesina, Alberto, and Guido Tabellini. 1990. A Positive Theory of Fiscal Deficits and Government Debt.
The Review of Economic Studies. Vol. 57 (3). pp. 403–14. Asako, Kazumi, Takatoshi Ito and Kazunori Sakamoto. 1991. The Rise and Fall of Deficit in Japan, 1965-
1990. Journal of the Japanese and International Economies. Vol 5(4). pp. 451-472. Asian Development Bank (ADB). 2017. Meeting Asia's Infrastructure Needs. Manila. Beetsma, Roel, and Xavier Debrun. 2016. Fiscal Councils: Rationale and Effectiveness. IMF Working
Papers 16/86. Washington, DC: International Monetary Fund. Bhanumurthy, N.R., Sukanya Bose, and Parma Devi Adhikari. 2015. Targeting Debt and Deficits in India:
A Structural Macroeconometric Approach. NIPFP Working Paper No. 2015–148. Delhi: National Institute of Public Finance and Policy.
Bhattacharya, B.K. 2016. Inaugural Address at the Conference on Fiscal Responsibility and Budget
Management Act organized by the Centre for Public Policy, Indian Institute of Management Bangalore. Bangalore. August.
Blöndal, Jón R., Ian Hawkesworth, and Hyun-Deok Choi. 2009. Budgeting in Indonesia. OECD Journal
on Budgeting. Vol. 9 (2). Paris: Organisation for Economic Co-operation and Development. Bornhost, Fabian, Gabriela Dobrescu, Annalisa Fedelino, Jan Gottschalk, and Taisuke Nakata. 2011.
When and How to Adjust Beyond the Business Cycle? A Guide to Structural Fiscal Balance. Technical Notes and Manuals. Washington, DC: International Monetary Fund.
Bova, Elva, Nathalie Carcenac, and Martine Guerguil, 2014. Fiscal Rules and the Procyclicality of Fiscal
Policy in the Developing World. IMF Working Paper WP/14/122. Washington, DC: International Monetary Fund.
Bova, Elva, Tidiane Kinda, Priscilla Muthoora, and Frederik Toscani. 2015. Fiscal Rules at a Glance.
Washington, DC: International Monetary Fund. Budina, Nina, Tidiane Kinda, Andrea Schaechter, and Anke Weber. 2013. Numerical Fiscal Rules:
International Trends. In Marco Cagiano, Teresa Curristine, and Michel Lazare eds. Public Financial Management and Its Emerging Architecture. Chapter 3. Washington DC: International Monetary Fund.
Burnside, Craig, Martin Eichenbaum, and Jonas D.M. Fisher. 2000. Assessing the Effects of Fiscal
Shocks. NBER Working Paper No. 7459. Massachusetts: National Bureau of Economic Research.

50 References
Buti, Marco. 2016. What Future for Rules-Based Fiscal Policy? In Olivier Blanchard, Raghuram Rajan, Kenneth Rogoff, and Lawrence Summers, eds. Progress and Confusion: The State of Macroeconomic Policy. Cambridge, Massachusetts: The MIT Press.
Carling, Robert and Stephen Kirchner. 2009. Fiscal Rules for the Limited Government: Reforming
Australia’s Fiscal Responsibility Legislation. The Centre for International Studies Policy Monograph No. 98. Centre for Independent Studies
Chakraborty, Pinaki. 2017. Federalism, Fiscal Space, and Public Investment Spending: Do Fiscal Rules
Impose Hard Budget Constraints? ADBI Working Paper Series No. 637. January. Tokyo: Asian Development Bank Institute.
Commonwealth of Australia. 2015. Intergenerational Report: Australia in 2055. The Australian
Government, Treasury. Canberra. ———— .2016. Budget Strategy and Outlook Budget Paper No. 1 2016-17. The Australian Government,
Treasury. Canberra. Cordes, Till, Tidiane Kinda, Priscilla Muthoora, and Anke Weber. 2015. Expenditure Rules: Effective
Tools for Sound Fiscal Policy? IMF Working Paper WP/15/29. Washington, DC: International Monetary Fund.
Debrun, Xavier, and Manmohan S. Kumar. 2007. Fiscal Rules, Fiscal Councils and All That: Commitment
Devices, Signaling Tools or Smokescreens? In Banca d’Italia, eds. Fiscal Policy: Current Issues and Challenges. Papers presented at the Banca d’Italia workshop held in Perugia, 29–31 March. pp. 479–512.
Debrun, Xavier, Tidiane Kinda, Teresa Curristine, Luc Eyraud; Jason Harris, and Johann Seiwald. 2013.
The Functions and Impact of Fiscal Councils. IMF Policy Paper. 16 July. Washington, DC: International Monetary Fund.
Debrun, Xavier, and Tidiane Kinda. 2014. Strengthening Post-Crisis Fiscal Credibility— Fiscal Councils
on the Rise. A New Dataset. IMF Working Paper WP14/58. Washington, DC: International Monetary Fund.
Escolano, Julio, and Vitor Gaspar. 2016. Optimal Debt Policy Under Asymmetric Risk. IMF Working Paper
WP/16/178. Washington, DC: International Monetary Fund. Francis, Smitha. 2012. Fiscal Policy Evolution and Distributional Implications: The Indonesian
Experience. The IDEAs Working Paper Series, 01/12. International Development Economics Associate. New Delhi.
FRBM Review Committee Report. 2017. Responsible Growth: A Debt and Fiscal Framework for 21st
Century India. Volume 1 and 2. Delhi. Gaspar, Vitor, and Luc Eyraud. 2017. Five Keys to a Smart Fiscal Policy. 19 April. International Monetary
Fund Blog. Insights and Analysis on Economics and Finance.

References 51
Ghosh, Saurabh, and Sangita Misra. 2016. Quantifying the Cyclically Adjusted Fiscal Stance for India. Macroeconomics and Finance in Emerging Market Economies. Vol. 9 Issue 1, pp.1–17.
Girouard, Nathalie, and Christophe André. 2005. Measuring Cyclically-Adjusted Budget Balances for
OECD Countries. OECD Economic Department Working Paper No. 434. Paris: Organisation for Economic Co-operation and Development.
Government of India, Finance Commission. 2009. Report of the 13th Finance Commission. Delhi. ———— .2014. Report of the 14th Finance Commission. Delhi. Government of India, Ministry of Finance. 2004. Fiscal Responsibility and Budget Management Rules,
2004. Delhi. ———— .2013. Fiscal Responsibility and Budget Management (Amendment) Rules, 2013. Delhi. ———— .2016a. Medium-term Expenditure Framework Statement laid before the Parliament as required
under the Fiscal Responsibility and Budget Management Act, 2003. Delhi. ———— .2016b. Medium Term Expenditure Framework Circular 2016–2017. Delhi. ———— .2017a. Fiscal Framework: The World is Changing, Should India Change Too? In Chapter 5 of
Economic Survey, 2016–2017. January. Delhi. ———— .2017b. Fiscal Rules: Lessons from the States. In Chapter 6 of Economic Survey, 2016–2017.
January. Delhi. Government of India, Ministry of Law and Justice. 2003. The Fiscal Responsibility and Budget
Management Act, 2003. Delhi. Hemming, Richard and Philip Joyce. 2013. The Role of Fiscal Councils in Promoting Fiscal Responsibility.
In Marco Cagiano, Teresa Curristine, and Michel Lazare eds. Public Financial Management and Its Emerging Architecture. Chapter 6. Washington, DC: International Monetary Fund.
International Monetary Fund (IMF). 2003. Public Debt in Emerging Markets: Is It Too High? In Public
Debt in Emerging Markets, Chapter 3. World Economic Outlook. September. Washington, DC: International Monetary Fund.
———— .2009. Fiscal Rules: Anchoring Expectations for Sustainable Public Finances. Fiscal Affairs
Department. Washington, DC: International Monetary Fund. ———— .2010. Recovery, Risk, and Rebalancing. October. Washington, DC: International Monetary Fund. ———— .2011. Kingdom of the Netherlands–Netherlands: Selected Issues and Analytical Notes. Country
Report 11/143. Washington, DC: International Monetary Fund. ———— .2013. Indonesia: Staff Report for the 2013 Article IV Consultation. IMF Country Report 13/362.
Washington, DC: International Monetary Fund.
52 References
Kirchner, Stephen. 2013. Strengthening Australia’s Fiscal Institutions, Target 30 Reducing the Burden for Future Generations. Centre for Independent Studies Paper T30.06.
Kopits, George, and Steven Symansky. 1998. Fiscal Policy Rules. IMF Occasional Paper No. 162.
Washington, DC: International Monetary Fund. Kydland, Finn E., and Edward C. Prescott. 1977. Rules Rather than Discretion: The Inconsistency of
Optimal Plans. Journal of Political Economy. Vol. 85(3). pp. 473–492. Lewis, Blane D., and Andre Oosterman. 2009. The Impact of Decentralization of Subnational
Government Fiscal Slack in Indonesia. Public Budgeting & Finance. Vol. 29, Issue 2. pp. 27–47. Summer 2009.
Liu, Lili, and Steven B. Webb. 2011. Laws for Fiscal Responsibility for Subnational Discipline:
International Experience. Policy Research Working Paper Series 5587. Washington, DC: The World Bank.
Lledó, Victor, Sungwook Yoon, Xiangming Fang, Samba Mbaye, and Young Kim. 2017. Fiscal Rules at a
Glance. March. Washington, DC: International Monetary Fund.
Oreng, Mauricio. 2012. Brazil’s Structural Fiscal Balance. Itau Working Paper No. 6. April. Pattnaik, Ranjit K., Deepa S. Raj, and Jai Chander. 2006. Fiscal Indicators in a Rule-Based Framework:
An Indian Perspective. Paper presented at Bank Italia Conference. April. Rao, M. Govinda. 2016. FRBM Act—Roadmap of Fiscal Rules for Future: Should Targets be Range-
Bound? Financial Express. 6 September. Reserve Bank of India. State Finances, A Study of Budgets. Various years. New Delhi. Reinhart, Carmen M., and Kenneth S. Rogoff. 2010. Growth in a Time of Debt. NBER Working Paper No.
15639. Cambridge, Massachusetts: National Bureau of Economic Research. Rogoff, Kenneth S. 1990. Equilibrium Political Budget Cycles. NBER Working Paper 2428. Cambridge,
Massachusetts: National Bureau of Economic Research. Schaechter, Andrea, Tidiane Kinda, Nina Budina, and Anke Weber. 2012. Fiscal Rules in Response to
the Crisis – Toward the “Next Generation” Rules. A New Dataset. IMF Working Paper WP12/187. Washington, DC: International Monetary Fund.
Simone, Alejandro Sergio, and Petia Topalova. 2009. India’s Experience with Fiscal Rules: An Evaluation
and The Way Forward. IMF Working Paper WP/09/175. Washington, DC: International Monetary Fund.
Stern, Gary H. 1987. The Federal Budget's Effects on Intergenerational Equity: Undone or Not Undone?
Federal Reserve Bank of Minneapolis Quarterly Review. Vol 11 (1). pp. 2–6. Sugimoto, Kazuyuki, and Junji Ueda. 2013. Challenges for Japan’s Fiscal Consolidation. Public Policy
Review. Vol.9, No.4. September. Japan: Policy Research Institute, Ministry of Finance.
References 53
Taylor, John B. 2000. Reassessing Discretionary Fiscal Policy. Journal of Economic Perspectives. Vol. 14
(3) Summer. pp. 21–36. Velasco, Andres. 1999. A Model of Endogenous Fiscal Deficits and Delayed Fiscal Reforms. In James
Poterba and Jürgen von Hagen, eds. Fiscal Institutions and Fiscal Performance. Chicago: University of Chicago Press.
Von Hagen, Jürgen, and Ian Harden. 1995. Budget Processes and Commitment to Fiscal Discipline.
European Economic Review. Vol. 39 (3). pp. 771–779. Wright, Allan Kari Grenade, and Ankie Scott-Joseph. 2017. Fiscal Rules: Towards a New Paradigm for
Fiscal Sustainability in Small States. IADB Working Paper IDB-WP-780. Inter-American Development Bank.
ASIAN DEVELOPMENT BANK
AsiAn Development BAnk6 ADB Avenue, Mandaluyong City1550 Metro Manila, Philippineswww.adb.org
Fiscal Responsibility and Budget Management Act in IndiaA Review and Recommendations for Reform
The paper assesses India’s experience with fiscal consolidation and performance under the Fiscal Responsibility and Budget Management (FRBM) Act. The paper reviews the international experience and best practices on fiscal rules, types of rules, introduction of fiscal councils and compares India’s FRBM framework against properties of fiscal frameworks, including fiscal balance, capital spending, optimal debt levels, cyclical considerations, and underlying budget processing and implementation. The paper analyzes various reform options based on quantitative fiscal rule simulations. Finally, the paper presents recommendations on adopting appropriate fiscal rules and targets with clearly defined escape clauses and strengthening the enforcement of fiscal rules.
About the Asian Development Bank
ADB’s vision is an Asia and Pacific region free of poverty. Its mission is to help its developing member countries reduce poverty and improve the quality of life of their people. Despite the region’s many successes, it remains home to a large share of the world’s poor. ADB is committed to reducing poverty through inclusive economic growth, environmentally sustainable growth, and regional integration.
Based in Manila, ADB is owned by 67 members, including 48 from the region. Its main instruments for helping its developing member countries are policy dialogue, loans, equity investments, guarantees, grants, and technical assistance.
FIscAl ResponsIBIlIty AnD BuDget MAnAgeMent Act In InDIAA Review and Recommendations for Reform Çiǧdem Akιn, Bruno Carrasco, Sudipto Mundle, and Abhijit Sen Gupta
adb south asiaworking paper series
no. 52
July 2017