Embed Size (px)
Citation preview

SWMD - Wood Waste Briefing 1
City of Houston Wood Waste Diversion Program

SWMD - Wood Waste Briefing 2
Wood Waste Diversion Overview Landfill Airspace
Preservation Recycling Case Greenhouse Gas and Air
Quality Financial Impact of Program
Disposal Cost Reduction Fuel Savings Personnel Savings
Pilot Area Review Next Steps Questions
SWMD - Wood Waste Briefing 3
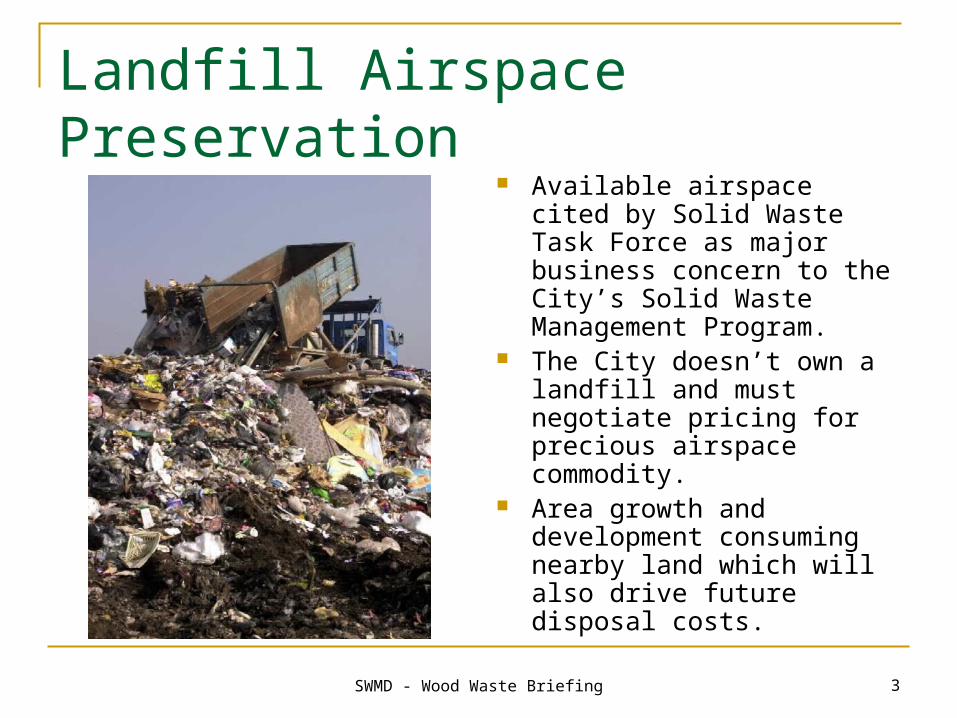
Landfill Airspace Preservation
Available airspace cited by Solid Waste Task Force as major business concern to the City’s Solid Waste Management Program.
The City doesn’t own a landfill and must negotiate pricing for precious airspace commodity.
Area growth and development consuming nearby land which will also drive future disposal costs.

SWMD - Wood Waste Briefing 4
Houston Area Landfills
Direct Hauls / Lower Costs Allied McCarty (NE) Allied Whispering
Pines (NE) Allied Blue Ridge
(SW) WM Atascocita* (NE)

SWMD - Wood Waste Briefing 5
Current Landfill Effective LifeDirect Haul
14
6.2
19
0
2
4
6
8
10
12
14
16
18
20
Blue Ridge WP/McCarty Atascosita
Site
Yea
rs
SWMD - Wood Waste Briefing 6
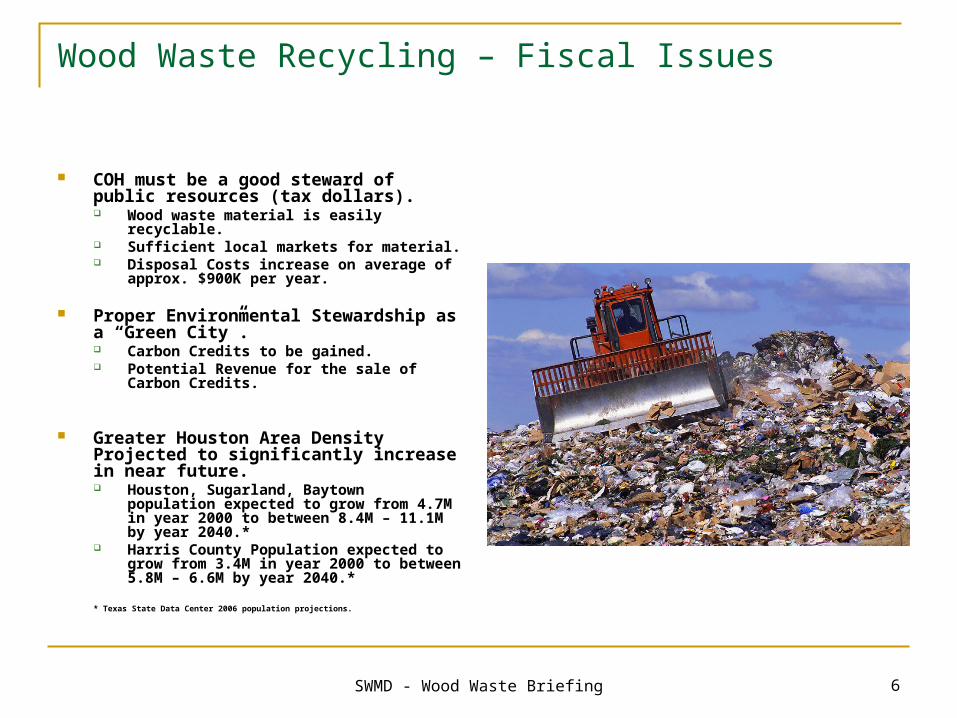
Wood Waste Recycling – Fiscal Issues
COH must be a good steward of public resources (tax dollars). Wood waste material is easily recyclable. Sufficient local markets for material. Disposal Costs increase on average of approx.
$900K per year.
Proper Environmental Stewardship as a “Green City”. Carbon Credits to be gained. Potential Revenue for the sale of Carbon
Credits.
Greater Houston Area Density Projected to significantly increase in near future. Houston, Sugarland, Baytown population
expected to grow from 4.7M in year 2000 to between 8.4M – 11.1M by year 2040.*
Harris County Population expected to grow from 3.4M in year 2000 to between 5.8M – 6.6M by year 2040.*
* Texas State Data Center 2006 population projections.

SWMD - Wood Waste Briefing 7
Air Quality
Houston air quality is monitored very intensely by governmental units and private industry.
At least 141 air pollution monitors screening for up to 138 chemical compounds.
Several initiatives in process to improve Houston air quality.
Wood Waste Diversion contributes to improved air quality with landfill GHG reduction.
“Houston Smog”

SWMD - Wood Waste Briefing 8
Top 20 U.S. Counties in GHG Emissions
1. Harris, Texas (Houston) — 18.625 million tons of carbon per year
2. Los Angeles, Calif. (Los Angeles) — 18.595 3. Cook, Ill. (Chicago) — 13.209 4. Cuyahoga, Ohio (Cleveland) — 11.144 5. Wayne, Mich. (Detroit) — 8.270 6. San Juan, N.M. (Farmington) — 8.245 7. Santa Clara, Calif. (San Jose) — 7.995* 8. Jefferson, Ala. (Birmingham) — 7.951 9. Wilcox, Ala. (Camden) — 7.615 10. East Baton Rouge, La. (Baton Rouge) —
7.322 11. Titus, Texas (Mt. Pleasant) — 7.244 12. Carbon, Pa. (Jim Thorpe) — 6.534 13. Porter, Ind. (Valparaiso) — 6.331 14. Jefferson, Ohio (Steubenville) — 6.278 15. Indiana, Pa. (Indiana) — 6.224 16. Middlesex, Mass. (Boston metro area) —
6.198 17. Bexar, Texas (San Antonio) — 6.141 18. Hillsborough, Fla. (Tampa) — 6.037 19. Suffolk, N.Y. (New York metro area) — 6.030 20. Clark, Nev. (Las Vegas) — 5.955
SWMD - Wood Waste Briefing 9
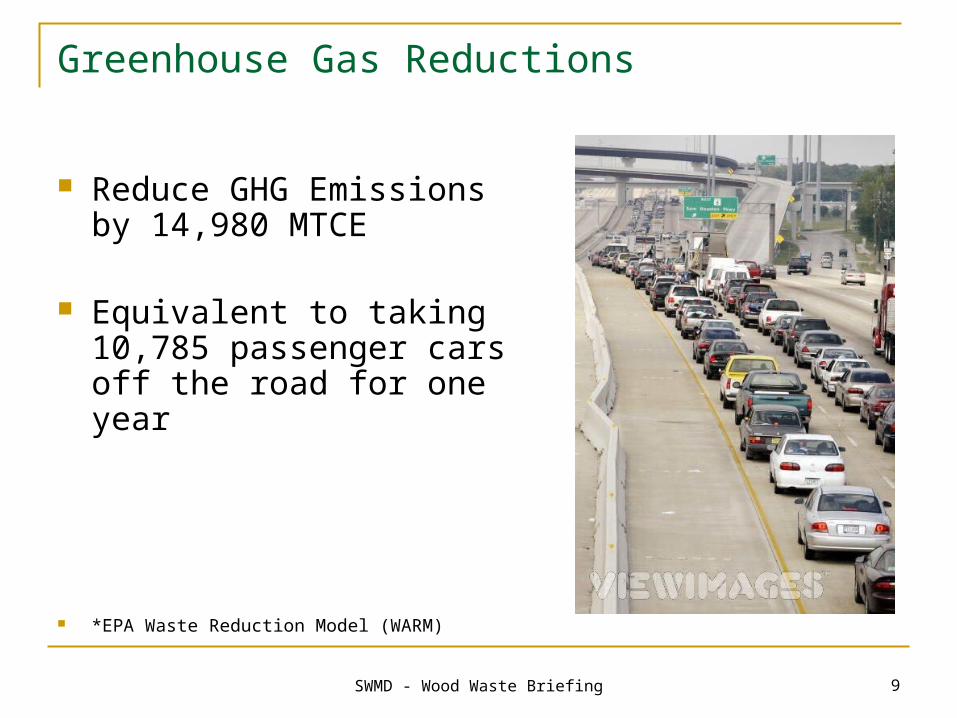
Greenhouse Gas Reductions
Reduce GHG Emissions by 14,980 MTCE
Equivalent to taking 10,785 passenger cars off the road for one year
*EPA Waste Reduction Model (WARM)

SWMD - Wood Waste Briefing 10
Wood Waste Diversion Low Hanging Financial Fruit
Average Annual Heavy Trash Collected by SWMD approx. 300,000 tons. 30% - 40% Green Waste Average Tipping Fee of
$32.00 per ton. 30% reduction equals
90,000 tons Direct disposal savings of
$2.9 Million. Net after grinding savings of
$1.71 Million.

SWMD - Wood Waste Briefing 11
SWMD Projected Disposal Costs Thru FY40Growth Rate of 4% Per Year
24.9330.5
38.86
47.56
58.19
71.21
87.14
0
10
20
30
40
50
60
70
80
90
100
FY09 FY14 FY20 FY25 FY30 FY35 FY40
Fiscal Year
Mil
lio
ns
of
Do
llar
s

SWMD - Wood Waste Briefing 12
Regional Population and Disposal Growth
Population & Garbage Volume Growth
0.0
1.0
2.0
3.0
4.0
5.0
6.0
7.0
8.0
9.0
2000 2004 2008 2012 2016 2020 2024 2028 2032 2036 2040
Year
Mill
ion
s P
eo
ple
/ T
on
s G
en
era
ted
Population
Tons Generated
50% Divert

SWMD - Wood Waste Briefing 13
Wood Waste Recycling Diversion The amount of material to be diverted,
approximately 90,000 Tons; or close to 660,000 cubic yards
If stacked on the playing field of Reliant Stadium, (54,000 sq. feet) would reach nearly 1000 feet high, the height of Chase Tower

SWMD - Wood Waste Briefing 14
Wood Waste Pilot Program
Approximately 47,000 homes in pilot area.
Estimated tons not landfilled 30% - 40% of normal service.
Estimated Cost Savings of $260,000 for pilot area.
Grinding Savings of $10 - $15 per ton donated by LETCO (pilot area only).
Council Districts Currently Affected: A, B, C, D, F, G, H

SWMD - Wood Waste Briefing 15

SWMD - Wood Waste Briefing 16
Pilot Area Review
70% Reduction in landfilled material. $225,000 in disposal
savings. $97,000 contributed by
LETCO for grinding pilot period.
0
2000
4000
6000
8000
10000
12000
2006 2007
2006
2007

SWMD - Wood Waste Briefing 17
Next Steps
Approve wood waste grinding contract. Posted on council agenda
within two weeks. Implement Wood Waste
Program Citywide Immediately begin
education process. Community Meetings. Direct Mail / Door to door. Radio / TV / Phone Bank
Start Date of 1 October 2008.

SWMD - Wood Waste Briefing 18
Other Steps for Reduction - 1
Gain further waste reduction with yard waste diversion strategies – biodegradable bags.

SWMD - Wood Waste Briefing 19
Other Steps for Reduction - 2 Review/Expansion of Curbside
Recycling Program Drop low performing
neighborhoods. Add new “productive”
neighborhoods. Encourage and assist major
business centers with recycling efforts. Downtown Texas Medical Center Galleria Area Energy Corridor
Bring a single stream processing facility to Houston Market Area.

SWMD - Wood Waste Briefing 20
Other Steps for Reduction - 3
Enhanced Community Education Promote Backyard
composting. Partnerships
Keep Houston Beautiful School Districts Business Management
Districts Private Sector

SWMD - Wood Waste Briefing 21
Questions