Embed Size (px)
Citation preview

BIS WORKING PAPERS
No. 83 – January 2000
SWITCHING FROM SINGLE TO MULTIPLE
BANK LENDING RELATIONSHIPS:
DETERMINANTS AND IMPLICATIONS
by
Luísa A Farinha and João A C Santos
BANK FOR INTERNATIONAL SETTLEMENTSMonetary and Economic Department
Basel, Switzerland

BIS Working Papers are written by members of the Monetary and Economic Department of the Bank forInternational Settlements, and from time to time by other economists, and are published by the Bank. The papersare on subjects of topical interest and are technical in character. The views expressed in them are those of theirauthors and not necessarily the views of the BIS.
Copies of publications are available from:
Bank for International SettlementsInformation, Press & Library ServicesCH-4002 Basel, Switzerland
Fax: +41 61 / 280 91 00 and +41 61 / 280 81 00
This publication is available on the BIS website (www.bis.org).
© Bank for International Settlements 2000.All rights reserved. Brief excerpts may be reproduced or translated provided the source is stated.
ISSN 1020-0959

BIS WORKING PAPERS
No. 83 – January 2000
SWITCHING FROM SINGLE TO MULTIPLE
BANK LENDING RELATIONSHIPS:
DETERMINANTS AND IMPLICATIONS
by
Luísa A Farinha and João A C Santos*
Abstract
Our results show that the majority of firms borrow for the first time from a singlebank, but soon afterwards some of them start borrowing from several banks.Duration analysis shows that the likelihood of a firm substituting a single withmultiple relationships increases with the duration of the single relationship and thatfirms with more growth opportunities and more bank debt are more likely toinitiate multiple relationships. Firms with poor performance, too, are more likely toinitiate multiple relationships. The analysis of the ex post effects of the initiation ofmultiple relationships does not detect an increase in the firm’s overall indebtednessand investment, but it finds an increase in its trade credit reliance and noimprovement in its performance. Overall these results suggest to us that a potentialunwillingness by the incumbent bank to increase its exposure to a firm because ofits past poor performance appears to explain better firms’ decision to initiatemultiple relationships than the hypothesis that they do so to protect themselvesagainst the hold-up rents inherent to exclusive relationships because they havemany growth opportunities.
* The authors are economists at the Bank of Portugal and the Bank for International Settlements respectively. They thankMark Flannery, Stanley Longhofer, David Smith, Steven Ongena, Pedro Portugal, Mário Santos, Reint Gropp, KostasTsatsaronis, Oved Yosha and seminar participants at the Bank for International Settlements, the European Central Bankand the 1999 FMA International meetings for useful comments and suggestions, and Lucena Vieira for valuable dataassistance. The views stated herein are those of the authors and are not necessarily the views of the Bank of Portugal or ofthe Bank for International Settlements.


Contents
1. Introduction .................................................................................................................1
2. Related literature .........................................................................................................4
3. Data ...........................................................................................................................6
3.1 Lending relationships ........................................................................................6
3.2 Explanatory variables .......................................................................................7
3.3 Sample ............................................................................................................9
4. Method ......................................................................................................................10
4.1 Duration analysis ............................................................................................10
4.1.1 Explanatory variables and the hazard function ...............................10
4.2 Regression analysis .........................................................................................12
5. Results .......................................................................................................................13
5.1 Results of the duration analysis ......................................................................13
5.2 Robustness checks ..........................................................................................14
5.2.1 The Weibull assumption on the distribution of duration .................14
5.2.2 The assumption on the time path of the explanatory variables .......14
5.2.3 The exogeneity assumption of the variable “number of switches” 14
5.2.4 Distinguishing switches from initiations of multiple relationships 15
5.3 A possible interpretation of the results ...........................................................16
5.4 Ex post effects ................................................................................................17
6. Final remarks ............................................................................................................18
Tables ...................................................................................................................................21
References ................................................................................................................................33


1
1. Introduction
This paper presents empirical evidence showing that the vast majority of firms borrow for the first
time from a single bank. Soon afterwards, however, many of them switch banks and others start to
borrow from multiple banks. Why do firms switch banks or start to borrow from multiple banks as
opposed to continuing to borrow from one bank and improve on the relationship with it? What are the
implications of these changes? Our paper attempts to shed light on these questions using a unique data
set containing information on individual bank lending relationships since the beginning of firms’ life.
Modern banking literature argues that banks are valuable because firms have information that is not
readily available to outsiders. Rather than having investors collect information on the firm’s prospects
prior to granting credit, investors find it efficient to delegate such a costly task to a bank, through
which they all provide funding to the firm.1 Within that set-up, borrowing from a single bank is
advantageous because it saves on monitoring costs (Diamond (1984)). Borrowing from a single bank,
however, may also be advantageous for other reasons. For example, it makes it easier to renegotiate
when the firm gets into financial distress (Bulow and Shoven (1978)).
Once a firm has borrowed from a given bank, it has an incentive to borrow from it again. This bank is
better positioned to enforce compliance with the terms of the new loan because of the information on
the firm it has already learned (Haubrich (1989)). The firm may want to borrow from the same bank
again because repeated borrowing gives the bank an opportunity to efficiently tax and subsidise it over
time in order to reduce the use of (costly) collateral (Boot and Thakor (1994)). From these
perspectives, the longer the relationship a firm has with a bank the lower its incentive to switch banks
or initiate multiple relationships.
Relying on a single bank, however, can be costly. The reason is that the bank may develop an
information monopoly on the firm because the information it gathers is not easily transferable to other
parties. Given that the firm will pay a “lemon’s premium” if it approaches another bank, as this bank
will question the firm’s decision not to seek funding at its original lender, the incumbent bank will be
able to extract rents ex post.
Several researchers have studied various implications of the incumbent bank’s informational
advantage. Greenbaum, Kanatas and Venezia (1989), for example, build on the assumption that the
incumbent bank knows more about the firm because the firm borrowed from it in the past to show that
if the firm then borrows repeatedly from that bank, the likelihood of it leaving the bank increases as
1 See Bhattacharya and Thakor (1993) and Freixas and Rochet (1997) for a review of the contemporary banking literature.

2
their relationship ages.2 Sharpe (1990), instead, presents a model where that advantage arises
endogenously. An initial situation of competition between symmetrically informed lenders turns into
one of asymmetric information once one lender has attracted the business and dealt with the firm for
some time. Since both parties rationally anticipate that the firm will be “informationally captured,”
competition in the banking sector forces initial finance to be offered at a discount to reflect the
expected mark-up on future terms of finance.3
Anticipating that it will become gradually locked in as the relationship ages, it will be in the firm’s
interests, as well as in the bank’s, to develop arrangements to guarantee that the bank will not extract
rents latter on. These arrangements can include an equity investment in the capital of the firm, long-
term contracts (von Thadden (1995)), or borrowing simultaneously from the bank and another funding
provider, such as the capital markets (Rajan (1992)), trade creditors or another bank.
Regulations in some countries prohibit banks from owning equity stakes in nonfinancial firms.4
Agency problems often limit the feasibility of long-term contracts. The little information available on
young firms usually makes their access to capital markets infeasible. With respect to trade credit,
despite its importance as a funding source, its usefulness to restrict the bank’s ability to extract rents is
limited because trade creditors usually extend credit only as an ancillary activity to their primary
business and not to fund new investments.5 Therefore, initiating a second bank lending relationship
can be the optimal solution to the potential hold-up problem faced by young firms. As in the
Williamsonian “dual-sourcing” theory in industrial organisation, ex ante duplication costs may be
more than offset by the protection competition offers to the firm. Note that it may be in the bank’s
self-interest that the firm initiates a second relationship.6 Von Thadden (1992), for example, shows
that if incentive compatibility precludes an exclusive monitor from passing future monopoly profits on
to the firm through interest reductions, banks will optimally give up exclusivity and offer contracts
with duplicated monitoring.
2 Blackwell and Santomero (1982) also argue that long-term relationships may not lead to preferential treatment because
when the bank is forced to ration credit it does so first to firms with more elastic demands for loans, regardless of theirrelationship status.
3 Banking competition limits the incumbent bank’s ability to extract rents ex post, but it does not eliminate it because
“outside” banks are afraid of a “winner’s curse” and bid less aggressively than they would under symmetric information(Broecker (1990)). Competition, however, leads some firms, both good and bad ones, to switch banks when they needadded funding (von Thadden (1998)).
4 See Santos (1998) for the regulations in several countries on banks’ equity investments in firms.
5 See Elliehausen and Wolken (1993), Petersen and Rajan (1997) and Farinha and Santos (2000) for evidence on the
importance of trade credit.
6 The hold-up problem that arises in an exclusive lending relationship is similar to that which arises when customers are
deterred from buying specific products from a monopolist supplier because they expect to become locked in andexpropriated later on. A common response to this problem has been “dual-sourcing” – monopolists giving away theproduction technology to a competitor in order to create ex post competition (Shepard (1987) and Farrell and Gallini(1988)).
3
Researchers have identified reasons for firms to borrow from multiple banks that are unrelated to the
hold-up problem. Bolton and Scharfstein (1996), for example, show that when firms default because
they either cannot meet their debt payments or their managers want to divert cash for themselves,
borrowing from multiple lenders may be beneficial, particularly for the less risky firms. In doing so,
firms incur the costs of defaulting because of a liquidity problem but they reduce management’s
incentive to default strategically.
Bhattacharya and Chiesa (1995) and von Rheinbaben and Ruckes (1998) consider in turn the role of
confidential information in a firm’s choice of the number of lenders. Providing information to a lender
is beneficial as it allows for a better evaluation but is risky because it may be leaked to the firm’s
competitors. Therefore, the firm trades off the benefits from competition against the costs of
information leakage when it chooses the number of lenders. Yosha (1995) focuses on the signal that
the choice of lenders sends to competition. Borrowing from a single lender avoids the disclosure of
information that occurs when the firm borrows from multiple lenders, but it leads the firm’s
competitors to infer that the firm is concealing information and react accordingly. Firms with the most
to lose if private information is disclosed borrow from a single lender.
Detragiache, Garella and Guiso (1997) provide a rationale for a firm to seek multiple lenders by
considering the cost it incurs when it is denied credit by its bank for reasons that have to do with the
bank itself. For example, the bank may be forced to deny credit even to its loyal borrowers because of
a temporary liquidity shortage. Given that possibility and the risk of not being able to raise funding
from an alternative bank when it approaches it for the first time, then it may be worth starting and
maintaining multiple relationships despite the costs that this entails.
Despite the importance attributed in the literature to the single-multiple lender dichotomy, to our
knowledge there is no empirical research on a firm’s decision to replace a single with multiple bank
relationships. Yet this is an important issue in understanding, for example, the importance of exclusive
relationships and how the value of these relationships evolves with their duration. It is also an
important complement to the growing research on the implications of the number of bank lending
relationships chosen by firms. This paper attempts to make a contribution to fill that gap. We use a
sample of firms for which we have information on their relationships since the beginning of their life,
which allows us to consider the complete history of the firm’s relationships with banks. We use
duration analysis to investigate why the length of time that elapses from the beginning of an exclusive
relationship until its end differs across firms, and to identify the determinants of that difference. We
then use conventional regression analysis to study some ex post effects of firms’ initiation of multiple
relationships.
Our results show that the likelihood of a firm substituting a single with multiple relationships increases
with the duration of the single relationship. The investigation into the determinants of that substitution

4
shows that, among other things, firms with more growth opportunities and more bank debt are more
likely to initiate multiple relationships. It also shows that poorly performing firms and those that more
often had bank loans that were past due are also more likely to initiate multiple relationships. These
results suggest us two potential explanations for firms’ decision to initiate multiple relationships.
Firms do that because they want to protect themselves against the future hold-up rents inherent to
exclusive relationships, as they are very dependent on banks for funding and have many growth
opportunities; alternatively, firms start to borrow from a second bank because the incumbent bank is
reluctant to increase its exposure due to the firms’ past poor performance and problems in repaying
their loans.
The analysis of the ex post effects of the initiation of multiple relationships appears to support the
second hypothesis. We find in the years following the initiation of multiple relationships an increase in
the firm’s bank indebtedness, but we do not detect an increase in its overall indebtedness and in its
investment, as one would expect to observe had the firm started multiple relationships because it had
many growth opportunities and wanted to protect itself against hold-up rents. In contrast, and
compatible with the second hypothesis, we find no improvement in the firm’s performance and an
increase in its trade credit reliance. Given that trade credit usually comes lower than bank debt in the
pecking order, this suggests that the firm is not able to meet its demand for funding in the banking
sector even after it initiates multiple relationships. Finally, and still compatible with that hypothesis,
we find a continuous decline in the subsequent years in the portion of the firm’s bank debt that is
provided by the incumbent bank.
The remainder of the paper is organised as follows. The next section presents the empirical literature
related to our paper. Section 3 describes our data set. Section 4 presents the method. Section 5
discusses the results and Section 6 concludes.
2. Related literature
Since the Petersen and Rajan (1994) study on the implications of the duration of a relationship and on
those resulting from borrowing from a single or multiple banks, there have been several studies of
these two aspects of firms’ relationships with banks.7 This literature finds that longer relationships
generally improve credit availability, but have a mixed impact on the interest rate charged and the
collateral required. Regarding the impact of the single-multiple bank dichotomy, Petersen and Rajan
(1994) find that firms with multiple relationships pay higher interest rates and are more credit
7 See Berger and Udell (1995), Blackwell and Winters (1997), Cole (1998), Elsas and Krahnen (1998), Harhoff and
Körting (1998a), Angelini, Salvo and Ferri (1998), Degryse and Van Cayseele (1998) and D’Auria, Foglia and Reedtz(1999). See Ongena and Smith (1999a) for a literature review of bank-firm relationships.

5
constrained than those with a single relationship.8 Other studies on the impact of that dichotomy on the
availability of credit, however, find mixed results.9
A common problem to studies on the importance of the relationship duration relates to their estimates
of duration. Because they rely on firms surveyed only at a given point in time, these studies miss the
information on the relationships that have already ended. Moreover, because firms cannot provide
information on when the current relationships will end, their duration is therefore “right-censored.”
Another problem with these studies is that they do not take into account the history of the relationship.
For example, they do not consider whether that relationship is or was an exclusive one throughout its
entire existence.10 These problems are important because, among other things, they make it difficult to
understand how the value of a relationship varies with its age and with the number of other
relationships the firm might have.
Ongena and Smith (1998) address these issues using a panel of data. In particular, they study the
likelihood of the relationship ending given its duration and how that likelihood varies with the number
of relationships that the firm has, respectively. They find that long-standing relationships are more
likely to end and firms with multiple relationships tend to end a relationship sooner.
The Ongena and Smith study, however, has some problems of its own. Because they rely on firms for
which they do not have information prior to the sample period, they are unable to consider the
complete history of these firms’ relationships and in some cases they cannot identify the beginning of
their relationships with banks, thus leading to “left-censored” estimates of duration. These problem
are heightened by their reliance on a sample of mature firms (with an average age of 45 years) and
therefore with a rich history of bank relationships that the authors cannot account for.
Our paper is closer to that of Ongena and Smith in that we also use duration analysis to study
relationships duration. However, there are important differences between the two studies. First, and
contrary to them, we are not interested in the duration of a given relationship. We are interest instead
in what makes a firm end a single relationship because it wants to borrow from multiple banks.
Second, because we want to avoid the problems arising from considering firms that already have a
history of relationships at the beginning of the sample period, we consider only firms for which we
have their complete history of relationships. This assures us that when the firm starts borrowing from
8 D’Auria, Foglia and Reedtz (1999), however, find that firms with more relationships pay lower interest rates.
9 Petersen and Rajan (1995), Cole (1998) and Harhoff and Körting (1998a) also find that firms with multiple bank
relationships are more credit constrained than those with a single relationship are. Houston and James (1996a, 1996b)find evidence that suggests the opposite, but they rely on listed firms.
10 D’Auria, Foglia and Reedtz (1999) avoid these problems as they consider a panel of firms over the 1987-94 period.
However, their estimates of duration are “left-censored” because their information on relationships goes back only to1985. This problem is heightened by the fact that they rely on a sample of large and medium-sized firms which by 1985already had by a rich history of bank relationships.
6
multiple banks it is the first time it does so. A consequence of this criterion is that we are left with a
panel of very young firms. While this has the additional advantage that our results relate to firms for
which there is the least information available and therefore the informational theories of banks are
most applicable, it has also the disadvantage of our sample being biased towards very young and small
firms.
3. Data
3.1 Lending relationships
Our data source on lending relationships is the monthly reports on credit filed by banks operating in
Portugal with the central bank during the period 1980-96. This data source covers virtually all banks
operating in the country. The number of banks increased form 14 in 1980 to 43 in 1996. The credit
reports detail all of the bank’s credit claims vis-à-vis each firm at the end of the month. Because we
want to study only bank-firm relationships, we do not consider claims on individuals. Each claim
specifies, among other things, the debtor’s identity, the amount it owes the bank in the short and long
term, and the amount that is past due.11 It does not, however, specify the amount and terms of the loans
that the bank extended to the firm and which led to the credit claim. For this reason, we cannot use
information on such things as the interest rate charged and the collateral required over the life of the
firm’s relationship with the bank.
Research on the number of firms’ bank lending relationships finds that small firms generally have only
one relationship and that the average number of relationships increases with the firm’s size.12 Table 1
shows that these patterns also apply to the Portuguese firms. It also shows that the number of
relationships is highly dependent on the firm’s age. As firms mature the average number of
relationships increases and the number of firms that continue to have a single relationship decreases.
In Table 2, we present stronger evidence of the negative correlation between single relationships and
firm age. Note that the fraction of firms that borrow from a single bank decreases very fast with the
firm’s age, suggesting that most of the firms that initiate multiple relationships do so in the early
stages of their life. Table 2, however, is mute about the length of time that elapses from the beginning
of an exclusive relationship until its end, that is, until the firm starts to borrow from several banks.
This issue is the main focus of our paper.
11 Throughout the paper, short-term claims are defined as those with a maturity shorter than one year and long-term claims
as those with a maturity of at least one year.
12 For example, Petersen and Rajan (1994) and Harhoff and Körting (1998a) report that single relationships dominate
among small US and German firms respectively. This contrasts with the evidence presented by Detragiache, Garella andGuiso (1997) showing that single relationships are uncommon even among small Italian firms. Ongena and Smith(1999b) report in turn that only a small fraction of large European firms have a single relationship.

7
The starting point of our analysis is to investigate, for those firms that borrow for the first time from a
single bank, how the likelihood of their starting to borrow from multiple banks varies with the age of
the single relationship. We then study some of the ex post effects of that change in the number of
relationships. In both cases we analyse how the results vary with a number of factors pertaining to the
firm and the bank with which it has a lending relationship. Before presenting these variables, it is
important to note that we do not consider in the analysis those firms that borrow for the first time from
multiple banks. However, we do not think that this biases our results because, of all the firms that
borrow for the first time from banks in the 1980-96 period only 2% of them do so from more than one
bank.
3.2 Explanatory variables
We follow the relationship lending literature and that on the firms’ optimal number of creditors to
select the explanatory variables for the duration analysis. Even though the latter literature does not
derive implications about the timing of a firm’s switch from a single to multiple relationships, one
would expect that the firms which that literature suggest should borrow from multiple creditors have
the most incentive to initiate multiple bank lending relationships earlier. The explanatory variables we
consider can be grouped in four sets related to the firm, the bank with which it had the single
relationship, the relationship with that bank, and the banking market, respectively.13 We also consider
variables to control for other factors that may influence firms’ choice of the number of lenders. We do
not consider the age of the firm in the duration analysis, however, because this variable is highly
correlated with our dependent variable.
We attempt to capture with the set of variables related to the firm several factors that may play a role
in its decision to initiate multiple relationships. First, we consider its growth opportunities, which we
proxy by the firm’s size, growth and investments, as an indication of its need for funding.14 Second,
we account for the firm’s risk, which we proxy by the firm’s profitability and solvency. Third, we
consider the funding provided by its main sources of funding, namely the bank, trade creditors and
insiders (firm shareholders and other associated firms). Fourth, we use the firm’s liquidity as a
measure of its “financial slack.” Fifth, we use a dummy variable to control whether the firm is
independent or part of a conglomerate. Finally, we use the ratio of the firm’s tangible assets to its debt
as a measure of its ability to pledge collateral and its intangible assets as a measure of its opaqueness.
13 Our source for firms’ balance sheet data is the balance sheet survey conducted by the Bank of Portugal on a yearly basis
since 1986. Our sources for bank balance sheet data and the regional number of bank branches are the publications of thePortuguese Bankers Association.
14 The results in the paper are for the case where the firm’s size and growth are measured by its sales. We obtained similar
results when we measured those variables by the firm’s number of employees.

8
With respect to the bank with which the firm has the single relationship, following the diversification
argument of Detragiache, Garella and Guiso (1997) for firms to borrow from multiple banks, we
include variables intended to capture the bank’s lending capacity. These are the bank’s size, growth,
liquidity, profitability and the fraction of its assets in loans.
Our third group of variables relates to the single relationship that the firm has before it initiates
multiple relationships.15 In line with von Thadden’s (1995) suggestion that firms can protect
themselves from ex post rents extraction attempts by making use of long-term contracts, we include
the long-term portion of the firm’s bank debt to account for its ability to access long-term financing.
We include a dummy to indicate if the firm has past due loans from that bank. We account for the risk
exposure regulation by considering the ratio of the amount the firm owes the bank over the bank’s
capital.16 Following von Thadden’s (1998) argument that in the presence of competition some firms
may react to an incumbent bank’s attempt to extract rents by switching banks, we consider the number
of times the firm switched banks in the past.
With respect to the banking market group, we consider variables that attempt to capture the
competition among banks in the market relevant to the firm. As Petersen and Rajan (1995) show,
competition is detrimental to relationship lending because it makes it more difficult for the bank to
carry out intertemporal subsidisation.17 We proxy banking competition by the number of banks in the
region where the firm is located and we control if the firm’s single relationship is with a local bank.18
Finally, we consider a set of variables to control for other factors that may influence a firm’s choice of
the number of lenders. We include a bank age dummy to control whether the incumbent bank is an old
or a new bank;19 economic activity dummies to control for factors that are specific to the various
sectors of activity;20 and time dummies to control for time-varying effects such as macroeconomic
conditions.
15 We do not include a dummy to indicate if the incumbent bank owns an equity stake in the firm because that happens with
only two of the firms in our sample.
16 This regulation requires banks to limit their exposure to any single borrower to 25% of their own funds. We do not expectit to be binding for these firms because they are all small firms.
17 Boot and Thakor (forthcoming), however, show in a different set-up that an increase in competition encourages banks to
customise services and leads to an increase in relationship lending, but as competition keeps increasing that response isno longer profitable and relationship lending decreases.
18 Here we follow Hannan (1991), who argues that the relevant banking market for small firms is formed by the banks in the
region where the firm is headquartered.
19 We define the banks operating at the beginning of our sample period to be old and those created since then to be new.
20 Anecdotal evidence suggests banks often take into account the firm’s sector of activity in their decision to extend credit
to the firm. The results presented in the paper were estimated without these dummies. We did not detect any significantchanges, however, when we included the dummies.

9
3.3 Sample
As mentioned above, to avoid the problems of left-censoring, we consider only firms born after 1980
that borrow for the first time from a single bank. We have balance sheet data for every year from the
time they first borrow until they initiate multiple relationships or the end of the sample period (1996)
for 1,577 firms. Of these firms, 870 borrow from a single bank throughout the entire sample period
(censored observations) and 707 start to borrow from multiple banks after they have had a single
relationship lasting on average two years. The median duration of these single relationships is two
years. Note, however, that this duration is “right-censored” because it does not take into account those
firms in the sample (870) that still have a single relationship at the end of the sample period. Once this
is considered and duration is adjusted for “right-censoring” the median of the single relationship
duration becomes five years.
Of the 707 firms that initiate multiple relationships, 512 did not switch from their original lender and
195 switched banks before they started to borrow from several banks. Table 3 compares these two sets
of firms at the time immediately before the firm substitutes a single relationship with multiple
relationships. Firms that switch banks initiate multiple relationships on average 7.5 months later than
those that do not switch banks beforehand. Note, though, that at the time the latter initiate multiple
relationships they are younger but appear to be more dynamic. They are growing faster, have less
liquidity and are more indebted vis-à-vis both banks, trade creditors and firm insiders (insider debt is
defined as the sum of loans extended by the firm’s shareholders and associated firms). Finally, it is
worth noting that trade credit is the most important source of external funding for both sets of firms. It
appears ahead of insider debt and bank debt.
Following von Thadden (1998), who argues that firms may react to a bank’s attempt to extract rents by
switching banks, we compare in Table 4 firms that initiate multiple relationships with those that switch
banks.21 The statistics in the table show that these are two quite different sets of firms. Firms that
initiate multiple relationships are younger, more dynamic, but less profitable. They are growing faster,
have less liquidity, are more indebted vis-à-vis both banks and trade creditors and have more long-
term bank loans. These results seem to suggest that the causes that lead firms to end a single
relationship by switching banks are different from those that lead banks to end a single relationship by
initiating multiple relationships.
21 The former are measured just before they initiate multiple relationships and the latter are measured just before they first
switch banks.
10
4. Method
4.1 Duration analysis
We use duration analysis to analyse, for firms starting out with a single relationship, the time that
elapses from the beginning of that relationship until the firm starts to borrow from multiple banks. The
term “spell” in duration analysis is used as a catch-all for the different duration variables that may be
measured. The length of a spell can be represented by a continuous random variable, T, with a density
function f(t) where t is a realisation of T. The hazard function gives us the rate at which spells are
completed after duration t, given that they lasted at least until t. It can be defined as
t
tTttTtPt
t ∆≥∆+<≤=
→∆
)|(lim)(
0λ ,
or alternatively in terms of the distribution and probability density functions of T:22
)(
)(
)(1
)()(
tS
tf
tF
tft =
−=λ ,
where S(t) is defined as the survivor function. It gives us the probability that the spell duration lasts
until t.
The hazard function does not add any information to f(t), but it is useful because it provides a
straightforward interpretation of the distribution. When a hazard function has a positive slope
(negative slope), it is said to have positive (negative) duration dependence, that is, the likelihood that
the spell ends at time t, conditional upon duration until t, increases (decreases) in t.
4.1.1 Explanatory variables and the hazard function
Parametric models of duration, which are akin to the conventional regression models, embody specific
assumptions about the distribution of duration. In parametric analysis the choice among the various
models is made on the basis of the specification chosen for the distribution, the Weibull being one of
the most frequently used in the literature. Its hazard function is23
1)()( −= ptpt λλλ .
When 1>p ),1( <p the Weibull hazard function has positive (negative) duration dependence. The
effect of explanatory variables on the hazard function can be considered by assuming
ixi e βλ ′−= .
22 Lancaster (1990).

11
This is equivalent to a change in the units of measurement on the time axis. The coefficients for the
explanatory variables can be estimated by maximising the likelihood function, which when it
incorporates the relevant probabilities for right-censored observations can be written as
)](ln)1()(ln[ln iiii
i wSwfL δδ −+= ∑
where δi takes the value 1 if the spell is completed and 0 if it is censored, and wi results from a
convenient change of variable:
)(ln)ln( iiiii xtptpw βλ ′−==
With the Weibull distribution, the sign of the coefficients suggests the direction of the effect of the
explanatory variable on the hazard function. In these cases we can also get a regression-like
interpretation of the magnitudes of the coefficients because we have:
[ ] )exp(| ii xpxtE β ′=
Thus, βk is a multiple of the derivative of this conditional mean.
Parametric models, however, impose specific assumptions on the distribution of duration data. For this
reason, semi-parametric models have proven useful to analyse duration data because they impose
fewer restrictions. Cox’s approach to the proportional hazard model, for example, assumes that the
hazard rate may be written as the product of the “baseline” hazard function and a non-negative
function
),()(),,( 0 βφλβλ xtxt = .
The Cox approach provides a method of estimating β without requiring estimation of λ0. Therefore, it
is not subject to the bias that could be induced by specifying an incorrect form for the baseline hazard
function. However, as no baseline hazard function is assumed, the estimator does not reflect the
information that the individual i has survived until ti.
Most estimators have been developed under the assumption that the explanatory variables do not vary
with time or that the time path of these variables does not affect the likelihood of exiting. Despite the
fact that most relevant variables change with duration, in some cases they change at a slower pace than
a typical duration. For that reason, they are often treated as if they were constant.24 As we did not
expect this was the case for most variables in our sample period, we relax that assumption by
incorporating time-varying explanatory variables in the duration model. Different values of these
23 The exponential distribution can be derived from the Weibull distribution by assuming p=1.
24 Lancaster (1990), p. 21.

12
variables are provided for each interval between t=0 and t=ti, the terminal point at which exit or
censoring takes place.25
4.2 Regression analysis
To analyse the performance of firms after they start borrowing from multiple banks we followed the
firms in our sample during several periods after the change. In this case the variables of interest were
the investment rate, debt ratios (total, bank, insiders and trade creditors) and profitability. The analysis
was structured along the following lines. Let Yit be the variable of interest of firm i in period t. The
general model was then:
ittiitititit BanksSwitchBanksMultipleY ελθαα +++ΒΧ++= 21
where Multiple Banksit is a dummy variable which takes the value 1 from the moment the firm starts
to borrow from more than one bank until the end of the sample period and 0 otherwise. The variable
Switch Banksit is a dummy that takes the value 1 from the moment the firm switches banks for the first
time until the end of the sample period and 0 otherwise. We are primarily interested in estimating α1
and α2. However, we need to control for other firm characteristics expected to be correlated with the
dependent variables. This was done in two ways, first by including a set of observed firm variables
(such as firm size and age) represented by Xit. We also took advantage of the panel nature of the data
by estimating a fixed-effects model in order to account for unobserved firm-specific time–constant
factors. The coefficients θi in the model capture this heterogeneity. The effect of time-varying
economy-wide conditions was also taken into account, by including a set of time dummy variables.
The λt in the model represents the time effects. Finally, εit is the error term of the regression.
With our data the random-effects estimator was clearly rejected in favour of the fixed-effects model.
The random-effects model assumes that the individual effects are uncorrelated with the other
regressors. Under the alternative hypothesis this estimator is not consistent. The procedure suggested
by Hausman (1978) may be used to test for orthogonality of the random effects and the regressors.
Large values of the Hausman statistic argue in favour of the fixed over the random-effects estimator.
F-statistics were also computed in order to test for the overall significance of both firm and time
dummies in the fixed-effects model.
25 See Lancaster (1990), p. 23, for a discussion of some of the issues associated with these models.

13
5. Results
As mentioned above, we want to find out, for the firms that borrow for the first time from a single
bank, the likelihood of their starting to borrow from multiple banks as their single bank relationships
mature and the determinants of that likelihood. In addition, we want to investigate the implications for
a firm of substituting a single bank relationship with relationships with multiple banks.
5.1 Results of the duration analysis
We start by estimating several parametric and semi-parametric models of duration to study the firms’
likelihood of initiating multiple relationships. Recall that as we consider only firms for which we have
information on their bank lending relationships since the beginning of their life, we avoid the problem
of left-censored observations. Note though that we are still left with the usually unavoidable problem
of right-censored observations, which can appropriately be taken into account in the estimation.
Table 5 presents the results of the estimation of the model where the dependent variable is the duration
of the single relationship measured from its beginning until the firm initiates multiple relationships (or
censoring). These results were obtained using a fully parameterised specification for the baseline
hazard (Weibull distribution) and assuming that the path of the explanatory variables does not affect
the probability of firms’ initiating multiple relationships. The explanatory variables were measured at
the time just before the change in the number of relationships (or censoring) occurs.
The results show that the likelihood of a firm substituting a single relationship with multiple
relationships increases with the duration of the single relationship, as a unilateral test to the null
hypothesis 1≤p is rejected for the conventional significance levels in all three models. They also
show that the estimated median duration of single relationships that end when firms initiate multiple
relationships is almost five years.
The models in Table 5 show that the likelihood of changing to multiple relationships increases with
the firm’s size, growth and investments. That likelihood is also larger for firms with more bank debt
and for those that had past due bank loans more often during the time they had a single relationship.
Firms that belong to conglomerates are also more likely to replace a single relationship with multiple
relationships, but those with more liquid assets are less likely to do so. Finally, note that even though
the bank and the banking market variables are not individually statistically significant (with the
exception of the bank location dummy, but only at the 10% level of significance, and the risk
exposure, but only in one of the models) as a group each of these two sets of variables is statistically
significantly different from zero as the likelihood ratio indicates.
14
5.2 Robustness checks
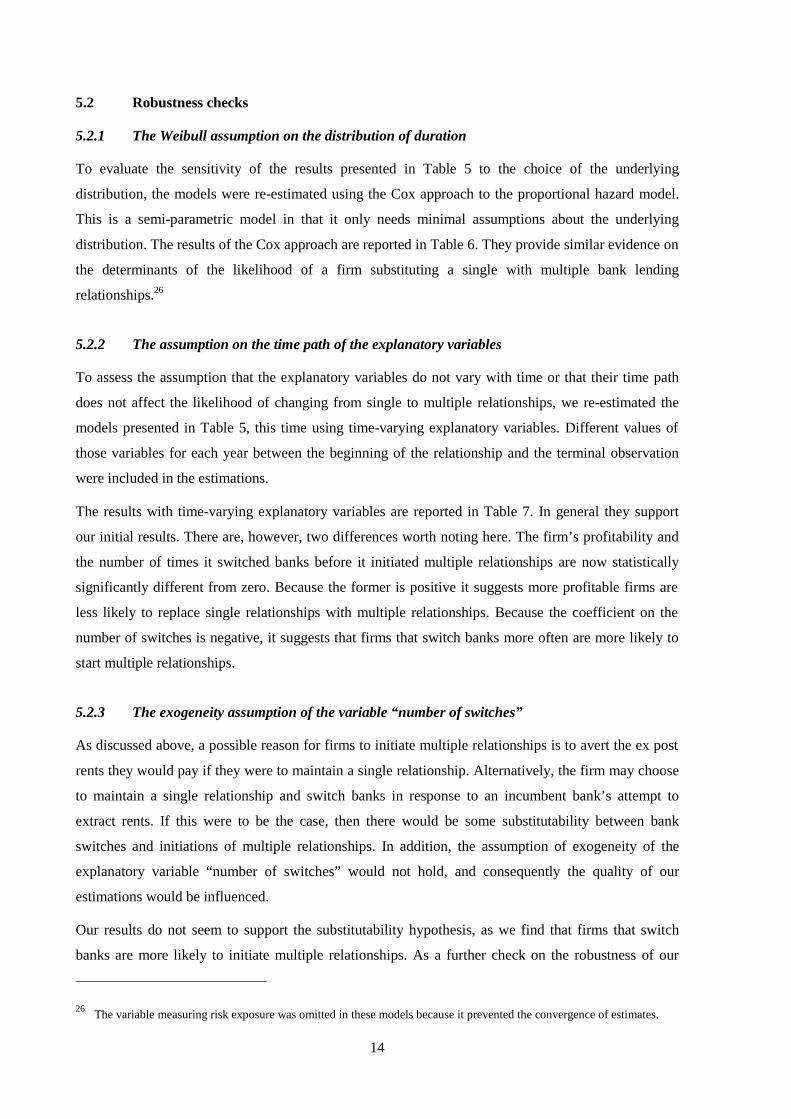
5.2.1 The Weibull assumption on the distribution of duration
To evaluate the sensitivity of the results presented in Table 5 to the choice of the underlying
distribution, the models were re-estimated using the Cox approach to the proportional hazard model.
This is a semi-parametric model in that it only needs minimal assumptions about the underlying
distribution. The results of the Cox approach are reported in Table 6. They provide similar evidence on
the determinants of the likelihood of a firm substituting a single with multiple bank lending
relationships.26
5.2.2 The assumption on the time path of the explanatory variables
To assess the assumption that the explanatory variables do not vary with time or that their time path
does not affect the likelihood of changing from single to multiple relationships, we re-estimated the
models presented in Table 5, this time using time-varying explanatory variables. Different values of
those variables for each year between the beginning of the relationship and the terminal observation
were included in the estimations.
The results with time-varying explanatory variables are reported in Table 7. In general they support
our initial results. There are, however, two differences worth noting here. The firm’s profitability and
the number of times it switched banks before it initiated multiple relationships are now statistically
significantly different from zero. Because the former is positive it suggests more profitable firms are
less likely to replace single relationships with multiple relationships. Because the coefficient on the
number of switches is negative, it suggests that firms that switch banks more often are more likely to
start multiple relationships.
5.2.3 The exogeneity assumption of the variable “number of switches”
As discussed above, a possible reason for firms to initiate multiple relationships is to avert the ex post
rents they would pay if they were to maintain a single relationship. Alternatively, the firm may choose
to maintain a single relationship and switch banks in response to an incumbent bank’s attempt to
extract rents. If this were to be the case, then there would be some substitutability between bank
switches and initiations of multiple relationships. In addition, the assumption of exogeneity of the
explanatory variable “number of switches” would not hold, and consequently the quality of our
estimations would be influenced.
Our results do not seem to support the substitutability hypothesis, as we find that firms that switch
banks are more likely to initiate multiple relationships. As a further check on the robustness of our
26 The variable measuring risk exposure was omitted in these models because it prevented the convergence of estimates.

15
results, we re-estimated our models excluding from our sample all the firms that switched banks
before they initiated multiple relationships. The results are reported in Table 8. They confirm the
results presented in Table 7, which were obtained with all the firms in the sample. The main difference
relates to trade credit, which is now statistically significantly different from zero.
5.2.4 Distinguishing switches from initiations of multiple relationships
Finally, we evaluate the sensitivity of our results to the procedure we used to distinguish switches
between banks from initiations of multiple relationships. As mentioned above, our data source
contains only the amounts that a firm owes each bank at the end of every month during the sample
period. In some cases it is difficult to distinguish a switch from an initiation of multiple relationships
based on that information. For example, when a firm owes money for the first time to two banks, one
of which is its old lender, it does not necessarily mean that it has started multiple relationships. It
could be that the firm has switched banks but still owes money to its original lender. When that occurs
closer to the end of the sample period it becomes difficult to distinguish the two possibilities.
We considered several variants to the criteria we used to distinguish switches from initiations of
multiple relationships.27 In all cases we obtained results similar to those presented in Table 7
concerning both the likelihood of firms with single relationships starting multiple relationships, the
median estimation of single relationships and the impact of the firm-characteristic variables on that
likelihood. We found, however, some differences on the significance of certain bank-characteristic
variables.
Table 9 presents the results for one of the variants that we studied. It relates to the case where we
excluded all the firms that started borrowing from a second bank less than 12 months before the end of
the sample period (57 firms), and a subset of the firms we had considered to have switched banks. This
subset included the firms that started to borrow from a second bank and did not increase their
indebtedness with the former bank during the subsequent 12-month period, but started to borrow again
from the first bank during the second subsequent 12-month period (10 firms). The results obtained
with this sample are similar to those we got with our original sample. There is only one difference. It
relates to the firms’ investments: while it continues to carry the same sign, it is not statistically
significant any more.
27 After identifying the first month a firm owes money to more than one bank, say 0t , we considered the following criteria
to decide whether the firm switched banks or started multiple relationships at that time. If at 0t the firm starts to owe
money to three or more banks we considered as having started multiple relationships at 0t . If it starts to owe money to
two banks and in the twelve subsequent months it increased the amount it owed the incumbent bank at 0t by more than

16
5.3 A possible interpretation of the results
What do the results we unveil have to say regarding the various hypotheses suggested in the literature
regarding a firm’s decision to borrow from multiple banks rather than a single bank? They do not
support the hypothesis that firms initiate multiple relationships because they want to diversify the risk
of being denied credit for reasons that have to do with their bank, as we find that bank variables do not
influence firms’ decisions to start multiple relationships. They do not support either of the opposing
views in the literature regarding the impact of bank competition on relationship lending, as the
variables we consider as proxies for competition are generally not statistically different from zero.28
Our results also do not appear to support the hypothesis that switching banks is a substitutable device
to initiating multiple relationships, as we find that firms that switch banks more often also initiate
multiple relationships earlier.
Our results’ support for the hypothesis that firms initiate multiple relationships in order to avert the
hold-up rents associated with an exclusive relationship is mixed, thus casting some doubt on that
explanation. The relationship lending literature suggests that as a firm’s relationship with a single bank
gets older, the firm will become increasingly locked in. Moreover, the more dependent the firm is on
that bank for funding the more growth opportunities it has, and the more opaque its assets are the
larger will be in the future the costs of becoming locked in and therefore the higher the firm’s
incentives to initiate multiple relationships earlier.
We do find that the likelihood of a firm substituting a single with multiple relationships increases with
the duration of the single relationship and that such a likelihood is larger for firms with more bank
debt, less liquidity and more growth opportunities.29 However, we do not find the conditional
likelihood of initiating multiple relationships to be higher for firms with more intangible assets, and
therefore more opaque assets, for firms with less trade credit and insider debt, and therefore more bank
dependent, and for firms with less capacity to pledge collateral. The availability of collateral makes the
information specific to the firm less valuable, as the firm can use the collateral to raise funding.
There are two other results that also cast some doubt on the concern of becoming locked in as the
reason for initiating multiple relationships. More profitable firms are less likely to substitute a single
with multiple relationships and firms that have had past due loans more often are more likely to
25 % then we considered that the firm started multiple relationships at 0t . Otherwise we assumed that what happened at
0t was a switch rather than the beginning of multiple relationships.
28 Apart from the debatable capability of those variables to measure banking competition, it is also worth noting that these
are exactly the two variables with the lowest variability (Tables 2 and 3), which raises some questions concerning theirperformance.
29 Recall that we proxy growth opportunities by the firm size, growth rate and investments.

17
initiate multiple relationships.30 These two results in fact suggest an alternative reason for firms to
initiate multiple relationships: the incumbent bank may not be willing to increase its credit exposure to
those firms because of their poor performance in the past.
A study of the ex post effects of the substitution of single with multiple relationships can help us
ascertain the plausibility of those hypotheses. If a firm initiates multiple relationships because it has
many growth opportunities and therefore is concerned with the future costs of becoming locked in,
then we would expect it to borrow a significant amount from the new bank in order to promote
competition with the incumbent bank and to implement some of its growth opportunities, leading, for
example, to an increase in its indebtedness and investment. In contrast, if the firm initiates multiple
relationships because the incumbent bank refuses to increase its exposure to the firm due to its past
poor performance, then we should not observe an increase in the firm’s investment and we should
observe an increase in the firm’s reliance on the funding sources, such as trade credit, that come lower
than bank debt in the pecking order. Moreover, in this case we should also not observe an
improvement in the firm’s performance, as this would mean that the incumbent bank systematically
misevaluated the firms with which it had an exclusive relationship.
5.4 Ex post effects
We start by studying the number of relationships that firms choose to maintain in each of the four
subsequent years after they start to borrow from multiple banks. The results are reported in Table 10.
They show that during that period of time the majority of firms borrow from only two banks. We
ascertain the importance of the new relationship by studying the share of bank debt provided by the
incumbent bank in each of those four years. As the results in table 10 show, the share of bank debt
provided by the incumbent bank decreases to 63% in the year the firm starts to borrow from a second
bank and it reaches 50% 3 years latter. These results suggest that the second relationship is an
important one from its very beginning.
We then use regression analysis to identify some effects of the firm’s substitution of a single with
multiple relationships on investment, debt ratios and profitability.31 The results obtained with the
fixed-effects estimator are reported in Table 11. They seem to confirm that firms do not initiate
multiple relationships because they are planing to implement many growth opportunities and therefore
30 Our result that poorly performing firms, that is firms with lower profitability and those that had past-due loans more
often, are more likely to initiate multiple relationships is consistent with Harhoff and Körting (1998b) finding based on asample of German firms that those which experience financial distress are more likely to increase their number of bankrelationships. They are also consistent with the evidence in Foglia, Laviola, Reedtz.(1998) based on Italian firms thatthose which have more bank relationships are more likely to fail in the near future.
31 The reported F-statistics suggest a statistically significant improvement in the model fit when the regression includes
firm-specific effects. The value of the Hausman statistic on the hypothesis of orthogonality between the individual effectsand the regressors is rejected, thus indicating that one should chose the fixed-effects estimator.
18
want to protect themselves against the hold-up rents inherent to a single relationship, as we do not find
an increase in firms’ investments and indebtedness in the years after they started to borrow from
multiple banks.
The ex post results, in contrast, appear to support the hypothesis that it is the incumbent bank’s
potential reluctance to increase its exposure to the firm because of its poor past performance that leads
it to start borrowing from another bank. Despite the fact that after initiating multiple relationships the
firm increases its usage of bank debt, it also increases its reliance on trade credit.32 Given that trade
credit usually comes lower than bank debt in the pecking order, this suggests that the firm is not able
to meet its demand for funding in the banking sector even after it initiates multiple relationships. Still
compatible with that assertion, we find no improvement in the firm’s performance afterwards and we
also find a continuous decline in the subsequent years in the portion of the firm’s bank debt that is
provided by the incumbent bank (Table 10).
6. Final remarks
The empirical evidence presented in this paper on bank lending relationships shows that nearly all
firms borrow for the first time from one bank and that the majority of them continue to do so for many
years. Some firms, however, choose to borrow from multiple banks after some time. Duration analysis
of a firm’s decision to substitute a single relationship with multiple relationships shows that the older
the single relationship the more likely it is for firms to start multiple relationships.
Our investigation into the determinants of the conditional likelihood of initiating multiple relationships
finds that the incumbent bank’s characteristics and those of the banking market where the firm is
headquartered do not play a role in the firm’s decision to substitute a single with multiple
relationships. In contrast we find that firms with more growth opportunities, more bank debt and less
liquidity are more likely to initiate multiple relationships. We also find that firms with lower
profitability and those that more often have bank loans that were past due are more likely to initiate
multiple relationships.
The analysis of the ex post effects of the initiation of multiple relationships shows an increase in the
firm’s bank debt, but no increase in its overall indebtedness and investment. That analysis also shows
an increase in the firm’s reliance on trade credit, a reduction in the importance of the incumbent bank
as a provider of funding and no improvement in the firm’s performance. These results led us to argue
that a potential unwillingness by the incumbent bank to increase its exposure to the firm because of its
32 It is worth noting here that Houston and James (1996a) also find that firms in their sample increase significantly their use
of bank debt once they substitute a single with multiple banking relationships. Their results, however, report to a sampleof listed firms and thus with well-established track records.

19
past poor performance appears to explain better the firms’ decision to initiate multiple relationships
than the hypothesis that they do so to protect themselves against the hold-up rents inherent to
exclusive relationships because they are dependent on banks for funding and have many growth
opportunities.
Finally, it is worth noting that our results, as other research has shown, suggest that there is value in a
firm’s relationship with a bank. Our result that exclusive bank relationships with firms that perform
well generally last longer than exclusive relationships with poorly performing firms suggests that a
relationship is more valuable to the former firms than to the latter ones. But even the latter firms
appear to value their relationships with the incumbent bank because the majority of them continue to
borrow from it afterwards. We find, for example, that one year after the initiation of multiple
relationships 75% of the firms still borrow from the bank with which they had an exclusive
relationship, and two years later 54% of them still borrow from that bank. Evidence on the existence
of value in a bank-firm relationship is important because it suggests that the substitutability of these
relationships depends on their duration, in which case changes to the banking sector that perturb the
established relationships, such as those resulting from bank mergers and acquisitions, will have
implications far beyond the short term.

20

21
Tables
Table 1 Number of bank lending relationships at the end of 1995 (relative frequencies) ................ 22
Table 2 Number of bank lending relationships given the age of the firm ......................................... 23
Table 3 Firms that borrow for the first time from a single bank but later initiate multiple
relationships ......................................................................................................................... 24
Table 4 Firms that borrow for the first time from a single bank but later either switch banks or
initiate multiple relationships ............................................................................................... 25
Table 5 Duration of single relationships: full parametric models (Weibull distribution) ................. 26
Table 6 Duration of single relationships: semi-parametric model (Cox model) ............................... 27
Table 7 Duration of single relationships: parametric models (Weibull distribution) with
time-varying explanatory variables ...................................................................................... 28
Table 8 Duration of single relationships for firms that do not switch banks before they start
multiple relationships: parametric models (Weibull distribution) with time-varying
explanatory variables ........................................................................................................... 29
Table 9 Duration of single relationships: parametric models (Weibull distribution) with
time-varying explanatory variables ...................................................................................... 30
Table 10 Importance of the relationship with the incumbent bank after the firm changes from single
to multiple relationships ....................................................................................................... 31
Table 11 Effects of firms’ substitution of single with multiple relationships.
Models estimated with fixed effects .................................................................................... 32

22
Table 1
Number of bank lending relationships at the end of 1995 (relative frequencies)1
Relationships by firm size Relationships by firm ageNumber ofrelationships
Total sample< 10 employees < 100 employees < 5 years < 10 years
1 57.30 69.60 58.80 69.60 64.10
2 22.70 20.50 22.90 20.50 22.10
3 9.70 6.50 9.60 6.30 8.00
4 4.60 1.90 4.30 2.10 3.00
5 2.50 0.80 2.20 0.80 1.40
6 1.30 0.40 1.10 0.30 0.60
7 0.80 0.10 0.60 0.20 0.30
8 0.50 0.00 0.30 0.10 0.10
9 0.30 0.00 0.20 0.10 0.10
10 0.20 0.00 0.10 0.10 0.10
>10 0.30 0.00 0.10 0.00 0.10
Mean 1.87 1.46 1.78 1.47 1.61
Median 1 1 1 1 1
Mode 1 1 1 1 1
N2 54,182 31,926 52,203 13,436 29,1091 The statistics presented in the table relate to a sample of 54,182 firms. These are the firms in the credit reports for whichwe have information on their age and on their size as measured by the number of employees. Data on the number ofemployees is from Quadros de Pessoal, a Ministry of Employment publication. 2 Number of firms.

23
Table 2
Number of bank lending relationships given the age of the firm1
Age ofthe firm
Number offirms
Mean Median ModeCoefficient of
variation
% of firmswith a singlerelationship
0 18,046 1.15 1 1 0.40 87.93
1 50,383 1.28 1 1 0.51 79.11
2 59,676 1.40 1 1 0.58 72.82
3 60,479 1.50 1 1 0.63 68.33
4 57,916 1.58 1 1 0.66 65.11
5 54,506 1.64 1 1 0.68 62.90
6 50,805 1.69 1 1 0.69 61.04
7 46,248 1.75 1 1 0.71 59.48
8 41,852 1.79 1 1 0.72 58.20
9 37,359 1.83 1 1 0.73 56.92
10 33,636 1.87 1 1 0.74 55.93
11 30,259 1.91 1 1 0.75 55.61
12 28,067 1.93 1 1 0.76 54.86
13 26,014 1.95 1 1 0.77 54.47
14 24,543 1.99 1 1 0.77 53.80
15 22,211 2.01 1 1 0.78 53.07
16 19,648 2.04 1 1 0.78 52.51
17 17,498 2.07 1 1 0.79 52.33
18 15,681 2.12 1 1 0.80 51.71
19 13,778 2.15 1 1 0.81 51.27
20 11,928 2.18 1 1 0.82 51.00
21 10,607 2.21 1 1 0.82 50.79
22 9,787 2.22 1 1 0.83 50.99
23 9,058 2.22 1 1 0.83 50.42
24 8,244 2.23 1 1 0.84 51.16
25 7,529 2.25 1 1 0.84 50.72
>25 100,469 2.49 2 1 0.86 47.201 The statistics presented in the table relate to a panel covering the years 1980-96 and a set of 127,743 firms. These are thefirms in the credit files for which we have information on their age.

24
Table 3
Firms that borrow for the first time from a single bank but later initiate multiple relationships
Variables
Firms that did notswitch banks beforeinitiating multiple
relationships(512 firms)1
Firms that switchedbanks before initiatingmultiple relationships
(195 firms)1
Firm Mean CV3 Mean CV3
t-test fordifferenceof means2
Age (years) 3.92 0.70 4.45 0.64 2.25**
Conglomerate dummy4 0.03 5.40 0.03 6.19 –0.52
Size (sales)5 0.67 8.56 0.13 3.25 –1.30
Size (employees) 58.83 4.75 41.78 2.99 –0.83
Sales growth (%) 50.73 2.42 32.62 3.09 –1.84*
Liquidity/assets 0.09 1.34 0.12 1.26 2.17**
Intangibles/assets 0.01 4.08 0.01 4.13 –0.44
Tangibles/total debt 0.53 1.58 0.55 1.11 0.36
Investments/assets 0.09 1.52 0.10 1.26 0.27
Investments/sales 0.09 1.95 0.11 2.97 1.31
Investments/(intangibles + tangibles)
0.31 1.07 0.33 1.03 0.50
Cash flow/assets 0.10 1.11 0.11 1.01 1.68*
Equity/assets 0.24 0.75 0.28 0.70 2.25**
Bank loans/assets 0.12 1.29 0.09 1.47 –2.46***
Trade credit/assets 0.29 0.74 0.26 0.77 –1.80*
Insider loans/assets6 0.18 1.22 0.17 1.20 –0.58
Bank
Size (assets)5 572.31 0.73 591.92 0.87 0.53
Growth of assets (%) 15.05 2.55 19.62 2.04 1.40
Total lending/assets 0.53 0.22 0.55 0.24 1.95*
Liquidity/assets 0.16 0.83 0.15 0.88 –1.35
Profits/assets 0.01 0.89 0.01 1.00 –0.50
Bank-firm relationship
Number of relationships7 1 – 2.13 0.18 –
Single relationship duration (months) 22.00 0.73 29.46 0.51 5.46***
Bank long-term loans/bank debt 0.11 2.63 0.08 3.20 –1.38
Past due loans dummy8 0.02 6.75 0.02 8.01 –0.52
Past due loans (accumulated) dummy9 0.07 3.75 0.06 4.10 –0.49
Risk exposure10 0.001 7.17 0.0004 5.49 –1.24
Banking market
Bank location dummy11 0.85 0.41 0.82 0.47 –1.031 Statistics computed at the time before the single relationship is substituted with multiple relationships. 2 The nullhypothesis of equal means is rejected at: *** 1%, ** 5%, * 10%. 3 Coefficient of variation. 4 Dummy equals 1 if the firmbelongs to a conglomerate and 0 otherwise. 5 Value in billion escudos, 1986 prices. 6 Insider loans are defined as the sumof loans extended by the firm’s shareholders and associated firms. 7 Number of single relationships the firm had before itreplaced a single with multiple relationships. 8 Dummy equals 1 if the firm has past due loans with its bank when itswitches banks for the first time and 0 otherwise. 9 Dummy equals 1 if the firm had past due loans with its bank at anytime before it switched banks for the first time and 0 otherwise. 10 Ratio of bank loans to a single firm over bank’sequity. 11 Dummy equals 1 if the firm’s single bank has a branch in the region where the firm isheadquartered.

25
Table 4
Firms that borrow for the first time from a single bank butlater either switch banks or initiate multiple relationships
Variables
Firms that switchbanks but retain asingle relationship
(295 firms)1
Firms that substitute asingle with multiple
relationships(707 firms)2
Firm Mean CV4 Mean CV4
t-test fordifferenceof means3
Age (years) 4.68 0.62 4.07 0.68 –3.15***
Conglomerate dummy5 0.02 6.43 0.03 5.59 0.64
Size (sales)6 0.09 4.25 0.52 9.36 1.51
Size (employees) 27.34 3.37 54.13 4.54 1.82*
Sales growth (%) 30.31 3.08 45.73 2.57 2.01**
Liquidity/assets 0.13 1.27 0.10 1.32 –2.66***
Intangibles/assets 0.003 5.39 0.01 4.13 1.80*
Tangibles/total debt 0.54 1.07 0.54 1.45 –0.11
Investments/assets 0.10 1.25 0.09 1.45 –0.89
Investments/sales 0.10 2.22 0.09 2.42 –0.22
Investment/(intangibles + tangibles)
0.34 1.00 0.32 1.06 –0.73
Cash flow/assets 0.12 0.91 0.10 1.08 –2.10**
Equity/assets 0.28 0.73 0.25 0.74 –1.88*
Bank loans/assets 0.06 1.83 0.11 1.34 4.58***
Trade credit/assets 0.26 0.80 0.32 0.75 1.34
Insider loans/assets7 0.19 1.20 0.18 1.22 –0.89
BankSize (assets)6 586.85 0.87 577.72 0.77 –0.28
Growth of assets (%) 18.57 2.24 16.31 2.38 –0.82
Total lending/assets 0.57 0.22 0.54 0.23 –4.13***
Liquidity/assets 0.13 0.96 0.16 0.84 2.67***
Profits/assets 0.01 1.31 0.01 0.93 1.14
Bank-firm relationshipNumber of relationships8 1.00 – 1.31 0.42 –
Single relationship duration (months) 24.76 0.65 24.06 0.69 –0.61
Bank long-term loans/bank debt 0.05 4.19 0.10 2.76 2.88***
Past due loans dummy9 0.01 12.09 0.02 7.04 1.50
Past due loans (accumulated)dummy10
0.06 3.93 0.06 3.84 0.16
Risk exposure11 0.0001 3.82 0.001 7.53 1.98**
Banking marketBank location dummy12 0.83 0.45 0.85 0.43 0.65
Banks in the market (number) 12.57 0.63 11.71 0.62 –1.621 Statistics computed at the time before the firm switches banks for the first time. 2 Statistics computed at the time beforethe firm initiates multiple relationships. 3 The null hypothesis of equal means is rejected at: *** 1%, ** 5%, * 10%.4 Coefficient of variation. 5 Dummy equals 1 if the firm belongs to a conglomerate and 0 otherwise. 6 Value in billionescudos, 1986 prices. 7 Insider loans are defined as the sum of loans extended by the firm’s shareholders and associatedfirms. 8 Number of single relationships that the firm had before it replaced a single with multiple relationships. 9 Dummyequals 1 if the firm has past due loans with its bank when it switches banks for the first time and 0 otherwise. 10 Dummyequals 1 if the firm had past due loans with its bank at any point in time before it switches banks for the first time and 0otherwise. 11 Ratio of bank loans to a single firm over bank’s equity. 12 Dummy equals 1 if the firm’s single bank has abranch in the region where the firm is headquartered.

26
Table 5
Duration of single relationships: full parametric models (Weibull distribution)1
Variables Model 1(1,519 firms)
Model 2(1,577 firms)
Model 3(1,577 firms)
Constant 3.7905.122***
3.5005.378***
4.24117.141***
FirmConglomerate dummy2 –0.497
–3.024***–0.527–3.253***
–0.516–3.130***
Log of sales (thousand escudos,1986 prices)
–0.110–5.479***
–0.108–5.414***
–0.120–6.545***
Sales growth (%) –0.001–6.110***
–0.001–6.386***
–0.001–6.532***
Liquidity/assets 0.4292.048**
0.4312.112**
0.4262.107**
Intangibles /assets –1.682–1.423
–1.707–1.470
–1.748–1.599
Tangibles/total debt –0.038–0.651
–0.048–0.934
–0.046–0.891
Investments/(intangibles+tangibles)
–0.223–2.879***
–0.220–2.889***
–0.228–3.025***
Cash flow/assets 0.3121.273
0.2380.980
0.2441.016
Bank loans/assets –0.223–4.634***
–1.020–4.780***
–1.087–5.464***
Trade credit/assets –0.112–0.614
–0.152–0.882
–0.153–0.901
Insider debt/assets –0.110–0.701
–0.099–0.654
–0.116–0.775
BankLog of assets (million escudos,1986 prices)
0.0451.020
0.0421.021
_
Age dummy –0.108–1.136
–0.125–1.341
_
Assets growth (%) 0.0010.892
0.0010.997
_
Liquidity/assets –0.532–0.057
0.1570.222
_
Profits/assets 7.2851.214
8.1721.442
_
Bank-firm relationshipNumber of switches3 0.058
1.1070.0651.266
0.0631.272
Bank long-term loans/bank debt 0.1201.159
0.1041.019
0.1111.100
Past due loans dummy4 –0.383–1.810*
–0.398–1.973*
–0.386–1.881*
Risk exposure5 –0.011–1.960**
–0.009–1.260
_
Banking marketBank location dummy6 0.166
1.873*_ _
Banks in the market (number) 0.0010.245
_ _
P
H0 : p ≤ 1
1.53510.524***
1.53611.013***
1.52010.862***
Median of the duration (months) 56.014 52.786 53.147LR7 (degrees of freedom) 21.000***(2) 15.776**(6) –1 Models estimated with time dummies. The null hypothesis is rejected at: *** 1%, ** 5%, * 10%. 2 Dummy equals 1 ifthe firm belongs to a conglomerate. 3 Number of times firms switch banks before they initiate multiple relationships.4 Dummy equals 1 if the firm had past due bank loans before it changed from single to multiple relationships. 5 Ratio ofbank loans to a single firm over the bank’s equity. 6 Dummy equals 1 if the firm’s single bank has a branch in theregion where the firm is headquartered. 7 Model 1 versus model 2, and model 2 versus model 3, respectively.
27
Table 6
Duration of single relationships: semi-parametric model (Cox model)1
Variables Model 1(1,519 firms)
Model 2(1,577 firms)
Model 3(1,577 firms)
FirmConglomerate dummy2 –0.705
–2.826***–0.755–3.057***
–0.756–3.053***
Log of sales (thousandescudos, 1986 prices)
–0.182–5.623***
–0.177–5.375***
–0.181–5.944***
Sales growth (%) –0.002–5.632***
–0.002–5.763***
–0.002–5.872***
Liquidity/assets 0.6602.125**
0.6662.214**
0.6402.129**
Intangibles/assets –2.292–1.495
–2.328–1.575
–2.369–1.673
Tangibles/total debt –0.059–1.145
–0.074–1.472
–0.070–1.377
Investments/(intangibles +tangibles)
–0.339–2.702***
–0.337–2.697***
–0.339–2.700***
Cash flow/assets 0.5391.629*
0.4351.310
0.4251.303
Bank loans/assets –1.629–4.785***
–1.587–4.921***
–1.595–5.034***
Trade credit/assets –0.145–0.577
–0.186–0.783
–0.212–0.893
Insider debt/assets –0.174–0.768
–0.147–0.677
0.1700.792
BankLog of assets (millionescudos, 1986 prices)
0.0911.380
0.0921.529
_
Age dummy –0.128–0.961
–0.150–1.156
_
Assets growth (%) 0.0010.603
0.0010.665
_
Liquidity/assets –0.137–0.110
0.0840.089
_
Profits/assets 8.9850.966
9.1651.055
_
Bank-firm relationshipNumber of switches3 0.088
1.1660.0991.332
0.0891.219
Bank long-term loans/bankdebt
0.1861.169
0.1531.007
0.1551.016
Past due loans dummy4 –0.552–1.905*
–0.573–2.064**
–0.543–1.968*
Banking marketBank location dummy5 0.227
1.743*_ _
Banks in the market(number)
0.002
0.278
_ _
LR6 (degrees of freedom) 4.302 (2) 8.910 (5) –1 Models estimated with time dummies. The null hypothesis is rejected at: *** 1%, ** 5%, * 10%.2 Dummy equals 1 if the firm belongs to a conglomerate. 3 Number of times firms switch banks beforethey initiate multiple relationships. 4 Dummy equals 1 if the firm had past due bank loans before itchanged from single to multiple relationships. 5 Dummy equals 1 if the firm’s single bank has abranch in the region where the firm is headquartered. 6 Model 1 versus model 2, and model 2 versusmodel 3, respectively.

28
Table 7
Duration of single relationships: parametric models (Weibull distribution)with time-varying explanatory variables1
Variables Model 1(1,471 firms)
Model 2(1,577 firms)
Model 3(1,577 firms)
Constant 4.8115.483***
4.7906.522***
5.96318.495***
FirmConglomerate dummy2 –0.262
–1.337–0.345–1.767*
–0.337–1.695*
Log of sales (thousand escudos,1986 prices)
–0.213–8.065***
–0.199–8.128***
–0.210–9.158***
Sales growth (%) –0.001–4.343***
–0.001–4.830***
–0.001–4.894***
Liquidity/assets 0.7583.015***
0.6732.739***
0.6702.717***
Intangibles/assets –0.910–0.749
–0.869–0.717
–0.837–0.690
Tangibles/total debt 0.0451.010
0.0350.781
0.0370.858
Investments/(intangibles +tangibles)
–0.147–1.947*
–0.156–2.044**
–0.155–2.032**
Cash flow/assets 0.6802.482***
0.5892.055**
0.5722.012**
Bank loans/assets –1.517–5.978***
–1.608–6.509***
–1.699–6.911***
Trade credit/assets –0.113–0.582
–0.144–0.779
–0.145–0.779
Insider debt/assets –0.109–0.581
–0.074–0.417
–0.087–0.494
BankLog of assets (million escudos,1986 prices)
0.0551.146
0.0501.111
_
Age dummy –0.012–0.111
0.0090.077
_
Assets growth (%) 0.0010.637
0.0010.802
_
Liquidity/assets 1.3921.308
1.1851.609
_
Profits/assets 0.9610.137
0.8580.132
_
Bank-firm relationshipNumber of switches3 –0.175
–2.733***–0.146–2.349**
–0.143–2.334**
Bank long-term loans/Bank debt 0.1321.128
0.1130.993
0.1271.111
Past due loans dummy4 –0.676–3.569***
–0.787–4.152***
–0.847–4.346***
Risk exposure5 –0.010–1.187
–0.009–1.007
_
Banking marketBank location dummy6 –0.042
–0.395_ _
Banks in the market (number) 0.0050.853
_ _
PH0 : p ≤ 1
1.3706.939***
1.3446.927***
1.3366.876***
Median of the duration (months) 57.050 54.663 54.843LR7 (degrees of freedom) 0.874 (2) 8.648 (6) –1 Models estimated with time dummies. The null hypothesis is rejected at: *** 1%, ** 5%, * 10%. 2 Dummy equals 1 ifthe firm belongs to a conglomerate. 3 Number of times firms switch banks before they initiate multiple relationships4 Dummy equals 1 if the firm had past due bank loans before it changed from single to multiple relationships. 5 Ratio ofbank loans to a single firm over the bank’s equity. 6 Dummy equals 1 if the firm’s single bank has a branch in theregion where the firm is headquartered. 7 Model 1 versus model 2, and model 2 versus model 3, respectively.
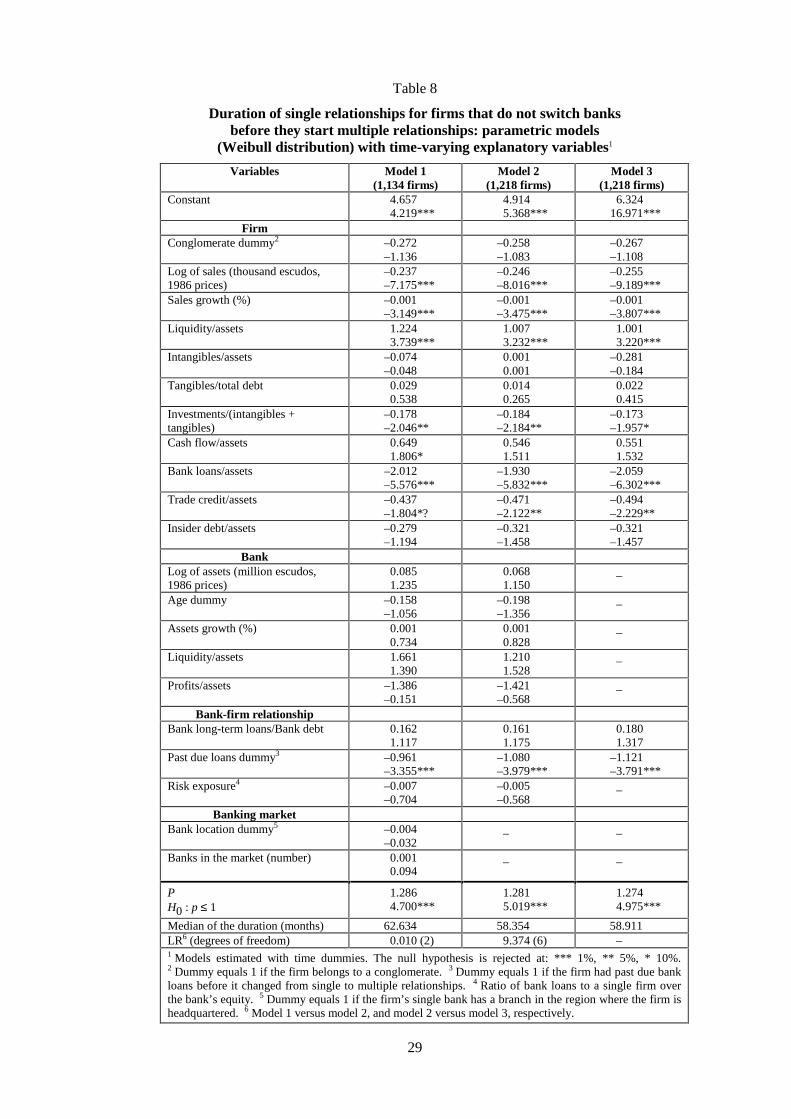
29
Table 8
Duration of single relationships for firms that do not switch banksbefore they start multiple relationships: parametric models
(Weibull distribution) with time-varying explanatory variables1
Variables Model 1(1,134 firms)
Model 2(1,218 firms)
Model 3(1,218 firms)
Constant 4.6574.219***
4.9145.368***
6.32416.971***
FirmConglomerate dummy2 –0.272
–1.136–0.258–1.083
–0.267–1.108
Log of sales (thousand escudos,1986 prices)
–0.237–7.175***
–0.246–8.016***
–0.255–9.189***
Sales growth (%) –0.001–3.149***
–0.001–3.475***
–0.001–3.807***
Liquidity/assets 1.2243.739***
1.0073.232***
1.0013.220***
Intangibles/assets –0.074–0.048
0.0010.001
–0.281–0.184
Tangibles/total debt 0.0290.538
0.0140.265
0.0220.415
Investments/(intangibles +tangibles)
–0.178–2.046**
–0.184–2.184**
–0.173–1.957*
Cash flow/assets 0.6491.806*
0.5461.511
0.5511.532
Bank loans/assets –2.012–5.576***
–1.930–5.832***
–2.059–6.302***
Trade credit/assets –0.437–1.804*?
–0.471–2.122**
–0.494–2.229**
Insider debt/assets –0.279–1.194
–0.321–1.458
–0.321–1.457
BankLog of assets (million escudos,1986 prices)
0.0851.235
0.0681.150
_
Age dummy –0.158–1.056
–0.198–1.356
_
Assets growth (%) 0.0010.734
0.0010.828
_
Liquidity/assets 1.6611.390
1.2101.528
_
Profits/assets –1.386–0.151
–1.421–0.568
_
Bank-firm relationshipBank long-term loans/Bank debt 0.162
1.1170.1611.175
0.1801.317
Past due loans dummy3 –0.961–3.355***
–1.080–3.979***
–1.121–3.791***
Risk exposure4 –0.007–0.704
–0.005–0.568
_
Banking marketBank location dummy5 –0.004
–0.032_ _
Banks in the market (number) 0.0010.094
_ _
PH0 : p ≤ 1
1.2864.700***
1.2815.019***
1.2744.975***
Median of the duration (months) 62.634 58.354 58.911LR6 (degrees of freedom) 0.010 (2) 9.374 (6) –1 Models estimated with time dummies. The null hypothesis is rejected at: *** 1%, ** 5%, * 10%.2 Dummy equals 1 if the firm belongs to a conglomerate. 3 Dummy equals 1 if the firm had past due bankloans before it changed from single to multiple relationships. 4 Ratio of bank loans to a single firm overthe bank’s equity. 5 Dummy equals 1 if the firm’s single bank has a branch in the region where the firm isheadquartered. 6 Model 1 versus model 2, and model 2 versus model 3, respectively.
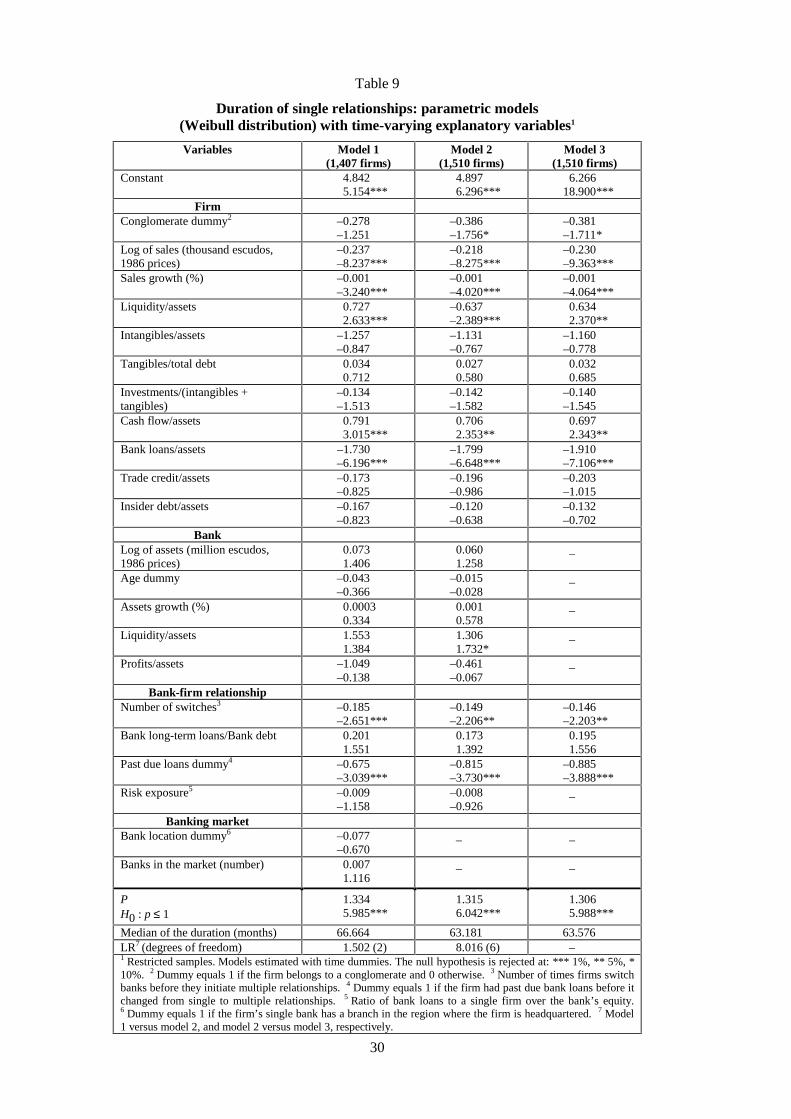
30
Table 9
Duration of single relationships: parametric models(Weibull distribution) with time-varying explanatory variables1
Variables Model 1(1,407 firms)
Model 2(1,510 firms)
Model 3(1,510 firms)
Constant 4.8425.154***
4.8976.296***
6.26618.900***
FirmConglomerate dummy2 –0.278
–1.251–0.386–1.756*
–0.381–1.711*
Log of sales (thousand escudos,1986 prices)
–0.237–8.237***
–0.218–8.275***
–0.230–9.363***
Sales growth (%) –0.001–3.240***
–0.001–4.020***
–0.001–4.064***
Liquidity/assets 0.7272.633***
–0.637–2.389***
0.6342.370**
Intangibles/assets –1.257–0.847
–1.131–0.767
–1.160–0.778
Tangibles/total debt 0.0340.712
0.0270.580
0.0320.685
Investments/(intangibles +tangibles)
–0.134–1.513
–0.142–1.582
–0.140–1.545
Cash flow/assets 0.7913.015***
0.7062.353**
0.6972.343**
Bank loans/assets –1.730–6.196***
–1.799–6.648***
–1.910–7.106***
Trade credit/assets –0.173–0.825
–0.196–0.986
–0.203–1.015
Insider debt/assets –0.167–0.823
–0.120–0.638
–0.132–0.702
BankLog of assets (million escudos,1986 prices)
0.0731.406
0.0601.258
_
Age dummy –0.043–0.366
–0.015–0.028
_
Assets growth (%) 0.00030.334
0.0010.578
_
Liquidity/assets 1.5531.384
1.3061.732*
_
Profits/assets –1.049–0.138
–0.461–0.067
_
Bank-firm relationshipNumber of switches3 –0.185
–2.651***–0.149–2.206**
–0.146–2.203**
Bank long-term loans/Bank debt 0.2011.551
0.1731.392
0.1951.556
Past due loans dummy4 –0.675–3.039***
–0.815–3.730***
–0.885–3.888***
Risk exposure5 –0.009–1.158
–0.008–0.926
_
Banking marketBank location dummy6 –0.077
–0.670_ _
Banks in the market (number) 0.0071.116
_ _
PH0 : p ≤ 1
1.3345.985***
1.3156.042***
1.3065.988***
Median of the duration (months) 66.664 63.181 63.576LR7 (degrees of freedom) 1.502 (2) 8.016 (6) –1 Restricted samples. Models estimated with time dummies. The null hypothesis is rejected at: *** 1%, ** 5%, *10%. 2 Dummy equals 1 if the firm belongs to a conglomerate and 0 otherwise. 3 Number of times firms switchbanks before they initiate multiple relationships. 4 Dummy equals 1 if the firm had past due bank loans before itchanged from single to multiple relationships. 5 Ratio of bank loans to a single firm over the bank’s equity.6 Dummy equals 1 if the firm’s single bank has a branch in the region where the firm is headquartered. 7 Model1 versus model 2, and model 2 versus model 3, respectively.

31
Table 10
Importance of the relationship with the incumbent bankafter the firm changes from single to multiple relationships1
Number of banks that the firmborrows from
% of the firm’s bank debtborrowed from the incumbent
bank
Months afterfirms startmultiple
relationships
Numberof firms
Mean Median CV2 Mean Median CV2
0-12 707 2.0 2 0.35 62.6 66.8 0.51
12-24 560 2.2 2 0.51 60.0 62.5 0.57
24-36 407 2.4 2 0.61 56.4 56.3 0.62
>36 322 2.8 2 0.59 50.4 44.5 0.681 Computations based on monthly observations. 2 Coefficient of variation.
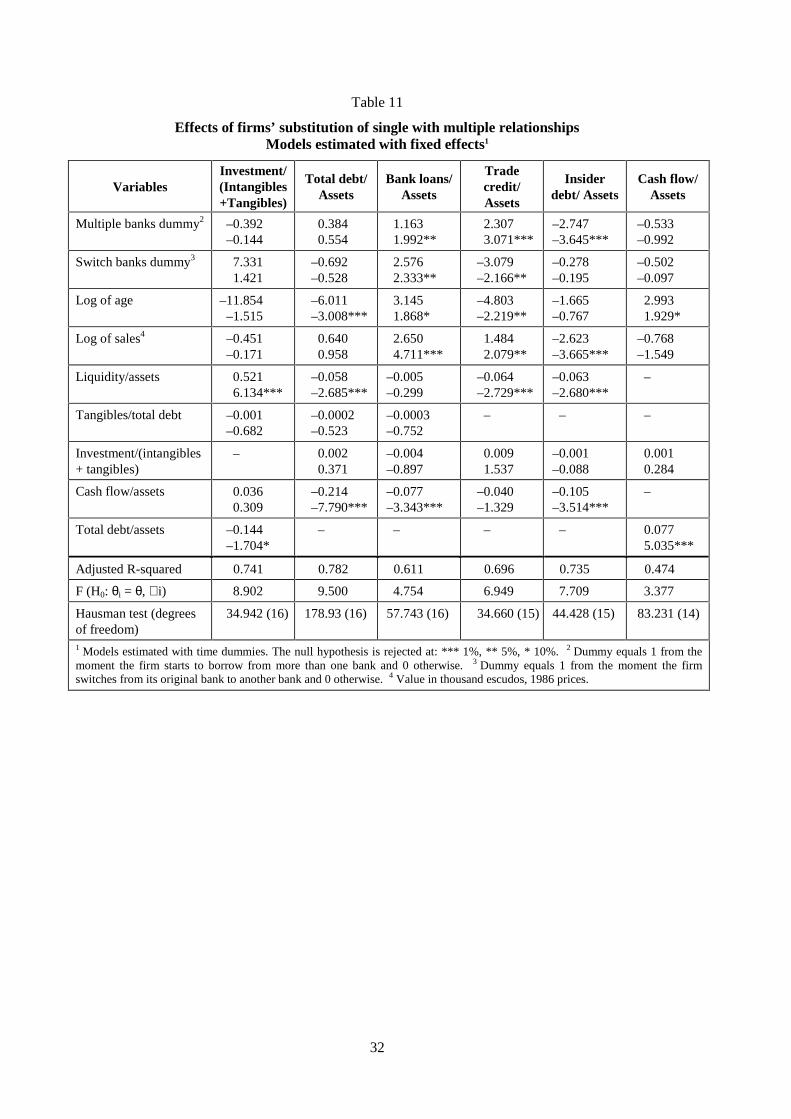
32
Table 11
Effects of firms’ substitution of single with multiple relationshipsModels estimated with fixed effects1
VariablesInvestment/(Intangibles+Tangibles)
Total debt/Assets
Bank loans/Assets
Tradecredit/Assets
Insiderdebt/ Assets
Cash flow/Assets
Multiple banks dummy2 –0.392–0.144
0.3840.554
1.1631.992**
2.3073.071***
–2.747–3.645***
–0.533–0.992
Switch banks dummy3 7.3311.421
–0.692–0.528
2.5762.333**
–3.079–2.166**
–0.278–0.195
–0.502–0.097
Log of age –11.854–1.515
–6.011–3.008***
3.1451.868*
–4.803–2.219**
–1.665–0.767
2.9931.929*
Log of sales4 –0.451–0.171
0.6400.958
2.6504.711***
1.4842.079**
–2.623–3.665***
–0.768–1.549
Liquidity/assets 0.5216.134***
–0.058–2.685***
–0.005–0.299
–0.064–2.729***
–0.063–2.680***
–
Tangibles/total debt –0.001–0.682
–0.0002–0.523
–0.0003–0.752
– – –
Investment/(intangibles+ tangibles)
– 0.0020.371
–0.004–0.897
0.0091.537
–0.001–0.088
0.0010.284
Cash flow/assets 0.0360.309
–0.214–7.790***
–0.077–3.343***
–0.040–1.329
–0.105–3.514***
–
Total debt/assets –0.144–1.704*
– – – – 0.0775.035***
Adjusted R-squared 0.741 0.782 0.611 0.696 0.735 0.474
F (H0: θi = θ, ∀i) 8.902 9.500 4.754 6.949 7.709 3.377
Hausman test (degreesof freedom)
34.942 (16) 178.93 (16) 57.743 (16) 34.660 (15) 44.428 (15) 83.231 (14)
1 Models estimated with time dummies. The null hypothesis is rejected at: *** 1%, ** 5%, * 10%. 2 Dummy equals 1 from themoment the firm starts to borrow from more than one bank and 0 otherwise. 3 Dummy equals 1 from the moment the firmswitches from its original bank to another bank and 0 otherwise. 4 Value in thousand escudos, 1986 prices.

33
References
Agelini, P, R Di Salvo and G Ferri (1998): “Availability and Cost of credit for Small Businesses:Customer Relationships and Credit Co-operatives”. Journal of Banking and Finance, Vol. 22,pp. 925-954.
Berger, A N and G F Udell (1995): “Relationship Lending and Lines of Credit in Small FirmFinance”. Journal of Business, Vol. 68, pp. 351-381.
Bhattacharya, S and G Chiesa (1995): “Proprietary Information, Financial Intermediation, andResearch Incentives”. Journal of Financial Intermediation, Vol. 4, pp. 328-357.
Bhattacharya, S and Thakor, A V (1993): “Contemporary Banking Theory”. Journal of FinancialIntermediation, Vol. 3, pp. 2-50.
Blackwell, D W and D B Winters (1997) “Banking Relationships and the Effect of Monitoring onLoan Pricing”. Journal of Financial Research, Vol. 20, pp. 275-289.
Blackwell, N R and A M Santomero (1982): “Bank Credit Rationing and the Customer Relation”.Journal of Monetary Economics, Vol. 9, pp. 121-129.
Bolton, P and D S Scharfstein (1996): “Optimal Debt Structure and the Number of Creditors”. Journalof Political Economy, Vol. 104, No. 1, pp. 1-25.
Boot, A W A, and Thakor, A V (forthcoming): “Can Relationship Banking survive Competition?”.Journal Finance.
Boot, A W A and Thakor, A V (1994): “Moral Hazard and Secured Lending in an Infinitely RepeatedCredit Market Game”. International Economic Review, Vol. 35, No. 4, pp. 899-920.
Broecker, T (1990): “Credit-Worthiness Tests and Interbank Competition”. Econometrica, Vol. 58,pp. 429-452.
Bulow, J and J Shoven (1978): “The Bankruptcy Decision”. Bell Journal of Economics, Vol. 9,pp. 437-456.
Cole, R (1998): “The Importance of Relationships to the Availability of Credit”. Journal of Bankingand Finance, Vol. 22, pp. 959-977.
D’Auria, C, A Foglia and P M Reedtz (1999): “Bank Interest Rates and Credit Relationships in Italy”.Journal of Banking and Finance, Vol. 23, pp. 1067-1093.
Degryse, H and P van Cayseele (1998) “Relationship Lending within a Bank-Based System: Evidencefrom European Small Business Data”. Mimeo Tilburg University.
Detragiache, E, P G Garella and L Guiso (1997): “Multiple versus Single Banking Relationships”.CEPR, Financial Economics, Discussion Papers Series, No. 1649.
Diamond, D W (1984): “Financial Intermediation and Delegated Monitoring”. Review of EconomicStudies, Vol. 51, No. 3, pp. 393-414.
Elliehausen, G E and J D Wolken (1993): “The Demand for Trade Credit: An Investigation of Motivesfor Trade Credit use by Small Businesses”. Board of Governors of the Federal Reserve System,Study No. 165.
Elsas, R and J P Krahnen (1998): “Is Relationship Lending Special? Evidence from Credit-File Data inGermany”. Journal of Banking and Finance, Vol. 22, pp. 1283-1316.
Farinha, L A and J A C Santos (2000): “Cross Section and Over Time Changes in the Mix of a Firm’sFunding Sources”. Mimeo, Bank for International Settlements.
Farrell, J and N Gallini (1988): “Second-Sourcing as a Commitment Device: Monopoly Incentives toAttract competition”, Quarterly Journal of Economics, Vol. 103, pp. 673-694.

34
Foglia, A, S Laviola and P Marullo Reedtz (1998): “Multiple Banking Relationships and the Fragilityof Corporate Borrowers”. Journal of Banking and Finance, Vol. 22, pp. 1441-1456.
Freixas, X and J C Rochet (1997): Microeconomics of Banking, Cambridge, Mass.: MIT Press.
Greenbaum, S I, G Kanatas and I Venezia (1989) “Equilibrium Loan Pricing Under the Bank-ClientRelationship”. Journal of Banking and Finance, Vol. 13, No. 2, pp. 221-235.
Hannan, T (1991): “Bank Commercial Loan Markets and the Role of Market Structure: Evidence fromSurveys of Commercial Lending”. Journal of Banking and Finance, Vol. 15, pp. 133-149.
Harhoff, D and T Körting (1998a): “Lending Relationships in Germany: Empirical Evidence fromSurvey Data”. Journal of Banking and Finance, Vol. 22, pp. 1317-1354.
Harhoff, D and T Körting (1998b): “How Many Creditors does it take to Tango?”. Mimeo,Wissenschaftszentrum, Berlin.
Haubrich, J G (1989): “Financial Intermediation, Delegated Monitoring, and Long-termRelationships”. Journal of Banking and Finance, Vol. 13, No. 1, pp. 19-20.
Hausman, J (1978): “Specification Tests in Econometrics”. Econometrica, Vol. 46, pp. 1251-1271.
Houston, J F and C James (1996a): “Bank Information Monopolies and the Mix of Private and PublicDebt Claims”. Journal of Finance, Vol. 51, No. 5, pp. 1863-1889.
Houston, J F and C James (1996b): “Banking Relationships, Financial Constraints and Investment:Are Bank Dependent Borrowers more Financially Constrained?”. Working Paper, Graduate School ofBusiness Administration, University of Florida.
Lancaster, T (1990): The Econometric Analysis of Transition Data, Cambridge University Press.
Ongena, S and D C Smith (1999a): “Bank Relationships: A Review”. Forthcoming in ThePerformance of Financial Institutions, P Harker and S A Zenios eds. Cambridge University Press.
Ongena, S and D C Smith (1999b): “What Determines the Number of Bank Relationships? CrossCountry Evidence”. Mimeo, Norwegian School of Management.
Ongena, S and D C Smith (1998): “Empirical Evidence on the Duration of Bank Relationships”.Mimeo, Norwegian School of Management.
Petersen, M A and R G Rajan (1997): “Trade Credit Theories and evidence”. Review of FinancialStudies, Vol. 10, No. 3, pp. 661-691.
Petersen, M A and R G Rajan (1995): “The Effect of Credit Market Competition on LendingRelationships”. Quarterly Journal of Economics, Vol. 110, pp. 406-443.
Petersen, M A and R G Rajan (1994): “The Benefits of Lending Relationships: Evidence from SmallBusiness Data.”. Journal of Finance, Vol. 49, No. 1, pp. 3-37.
Rajan, R G (1992): “Insiders and Outsiders: The Choice between Informed and Arm’s-Length Debt”.Journal of Finance, Vol. 47, No. 4, pp. 1367-1400.
Santos, J A C (1998); “Banking and Commerce: How does the United States Compare to otherCountries?”. Federal Reserve Bank of Cleveland Economic Review, Vol. 34, No. 4, pp. 14–26.
Sharpe, S A (1990): “Asymmetric Information, Bank Lending and Implicit Contracts: A StylisedModel of Customer Relationships”. Journal of Finance, Vol. 45, No. 4, pp. 1069-1087.
Shepard, A (1987): “Licensing to Enhance Demand for New Technologies”. Rand Journal ofEconomics, Vol. 18, pp. 360-368.
von Rheinbaben, J and M Ruckes (1998): “A Firm’s Optimal Number of Bank Relationships and theExtent of Information Disclosure”. Mimeo, Universität Mannheim.
von Thadden, E L (1998): “Asymmetric Information, Bank Lending and Implicit Contracts: TheWinner’s Curse”. Mimeo, University of Lausanne.

35
von Thadden, E L (1995): “Long-Term Contracts, Short-Term Investment and Monitoring”. Review ofEconomic Studies, Vol. 62, No. 4, pp. 557-575.
von Thadden, E L (1992): “The Commitment of Finance, Duplicated Monitoring, and the InvestmentHorizon”. WWZ Discussion Papers No. 9207.
Yosha, O (1995): “Information Disclosure Costs and the Choice of Financing Source”. Journal ofFinancial Intermediation, Vol. 4, pp. 3-20.


Recent BIS Working Papers
No. Title Author
67May 1999
The cyclical sensitivity of seasonality in USemployment
Spencer Krane andWilliam Wascher
68May 1999
The evolution of determinants of emerging marketcredit spreads in the 1990s
Steven B Kamin andKarsten von Kleist
69June 1999
Credit channels and consumption in Europe: empiricalevidence
Gabe de Bondt
70June 1999
Interbank exposures: quantifying the risk of contagion Craig H Furfine
71June 1999
The term structure of announcement effects Michael J Flemingand Eli M Remolona
72August 1999
Reserve currency allocation: an alternative methodology SrichanderRamaswamy
73August 1999
The Taylor rule and interest rates in the EMU area: anote
Stefan Gerlach andGert Schnabel
74August 1999
The dollar-mark axis Gabriele Galati
75August 1999
A note on the Gordon growth model with nonstationarydividend growth
Henri Pagès
76October 1999
The price of risk at year-end: evidence from interbanklending
Craig H Furfine
77October 1999
Perceived central bank intervention and marketexpectations: an empirical study of the yen/dollarexchange rate, 1993-96
Gabriele Galati andWilliam Melick
78October 1999
Banking and commerce: a liquidity approach Joseph G Haubrichand João A C Santos
79November 1999
Pass-through of exchange rates and import prices todomestic inflation in some industrialised economies
Jonathan McCarthy
80November 1999
A note on alternative measures of real bond rates Palle S Andersen
81November 1999
Interbank interest rates and the risk premium Henri Pagès
82November 1999
Sacrifice ratios and the conduct of monetary policy inconditions of low inflation
Palle S Andersen andWilliam L Wascher