Embed Size (px)
Citation preview
2009 Third International Conference on Power Systems, Kharagpur, INDIA December 27-29 >Paper #122<
978-1-4244-4331-4/09/$25.00 ©2009 IEEE
D Thukaram, SM IEEE, K Ravishankar, Rajendra Kumar A Department of Electrical Engineering
Indian Institute of science, Bangalore-560012, INDIA e-mail: [email protected],
[email protected], [email protected]
S R Kolla, SM IEEE Electronics and Computer Technology,
Bowling Green State University Bowling Green, Ohio 43403, USA
e-mail: [email protected]
Abstract— The analysis of electromagnetic transients arising in EHV/UHV power networks gives necessary information about the possible stresses on the different network components, which will determine their proper design, limits of operation as well as their pertinent protection strategies. This paper describes the transient analysis of 765 kV EHV transmission system which is a typical expansion in Indian power grid system. Considering various conditions, switching transient and fault transient studies are carried out. A FORTRAN version of EMTP is developed, to study a practical example, then a comparison with the results available in the literature is made.
Keywords- EMTP, Overvoltages, Transients.
I. INTRODUCTION The insulation level of EHV and UHV ac systems is largely
determined by the magnitude of switching over voltages. The reliable operation of any electrical power system is determined to a great extent by the amplitude, duration and frequency of the transient voltages appearing in different places in the network. Therefore switching over voltages and fault transients are a focal point in carrying studies for these systems. Switching transients are fast transients that occur in the process of energizing transmission line, load capacitances immediately after a power source is connected to the network. Power transformers, surge arresters and circuit breakers are equipments which are first affected by over voltages. At the planning stage of the 765 kV systems, the insulation level of apparatus is to be decided on the basis of peak value of transient over voltages, so enormous numbers of cases are considered to arrive at the maximum magnitude. Methods are proposed for reducing the over voltages, of the several methods to mitigate transient over voltages, pre-insertion resistors are used. This paper presents switching transient and fault transient studies for a typical 765 kV EHV transmission systems. A FORTRAN version of EMTP [1] is developed, to study a practical example, and then a comparison with the results available in the literature is made.
II. SWTCHING TRANSIENT ANALYSIS In EHV and UHV systems there are a number of switching
operations, such as over voltages produced during the switching of reactors, capacitors and transformers. Transient over voltages are usually a significant factor at transmission
voltages above 400 kV. These can readily be limited by surge diverters and are therefore not considered here. Of the other switching operations, line closing and re-closing generally produce the larger over voltages and consequently we concentrate on line energization [2] and fault transients in this paper. At higher transmission volt ages, over voltages caused by switching may become significant, because arrester operating voltages are relatively close to normal system voltage and lines are usually long so that the energy stored on the lines may be large. Over voltages will put the transformers into saturation, causing core heating and copious harmonic current generation. Circuit breaker called upon to operate during periods of high voltage will have reduced interrupting capability. At some voltage even the ability to interrupt line-charging current will be lost. Thus transient voltage magnitudes must be restricted to a safe value less than or equal to withstand capacity of the apparatus. In practical system a number of factors affect the over voltages due to energization or re-closing. The influence of various factors on switching over voltages (SOV) has been discussed in [3]. Magnitude of SOV can be controlled by using any one or combination of the following methods:
• Circuit breaker with Pre-Insertion Resistor (PIR)
• Metal Oxide Arrester (MOA)
• Point on wave controlled switching
Because of higher power consumption, space adequacy, significant addition of transients due to opening and closing of PIR’s and greater mechanical complexity, PIR usage is being reduced. On the other hand PIR’s are cheaper when compared to others like metal oxide arresters. Nevertheless, the resistor equipped circuit breakers are more expensive. These complex breakers show mechanical malfunctions as the most common cause of circuit breaker failures. Controlled switching is being used which reduces magnitude of switching over voltages considerably.
III. FAULT TRANSIENT ANALYSIS When a short circuit occurs on a transmission line, voltage
and current signals develop a transient DC offset component and high-frequency transient components in addition to the power frequency components. The analysis of electromagnetic transients arising in power networks gives necessary
Switching and Fault Transient Analysis of 765 kV Transmission Systems
Indian Institute of Technology Kharagpur, INDIA
2009 Third International Conference on Power Systems, Kharagpur, INDIA December 27-29 >Paper #122<
978-1-4244-4331-4/09/$25.00 ©2009 IEEE
information about the possible stresses on the different network components, which will determine their proper design, limits of operation as well as their pertinent protection strategies [4].
The analysis of electromagnetic fault transients on long power lines is carried out. The results of such studies will give information about the transient stresses on the different system components. The transient wave shapes of voltage and currents observed at the relay locations can be significantly vary for various possible combinations of faults on transmission lines [5-6].
Four different types of faults i.e. A-G (phase A to ground fault), A-B (phase A to phase B fault), B-C-G (phase B to phase C to ground fault) and 3Φ-G (three phase to ground fault) were applied to the transmission line. The study of fault transient is carried out considering, fault position at various distances from the sub-station and fault inception on the voltage wave.
IV. SIMULATED STUDIES AND RESULTS
A. Switching Transient Performance Analysis: As the interconnecting systems are large networks, for
transient analysis the systems with an equivalent source, transmission line and a load are considered. Thus, sample system represented is shown in Fig. 1 with base MVA as 100 and phase voltage of 765*√2/√3 kV. Studies are carried out by considering the range of various parameters such as,
• Source Strength: 4000-10000 MVA in steps of 1000 MVA
• Switching angle: 0-900 in steps of 300
• PIR: 0-400 ohms in steps of 50 ohms
• Reactor: 0, 50, 63, 80, 100, 120 and 150 MVAR
Switching transient analyses are carried out for 400 km. and 500 km. (Fig. 1) line 765 kV system for following cases:
• Without shunt reactor and without PIR
• With shunt reactor and without PIR
• Without shunt reactor and with PIR
• With shunt reactor and with PIR
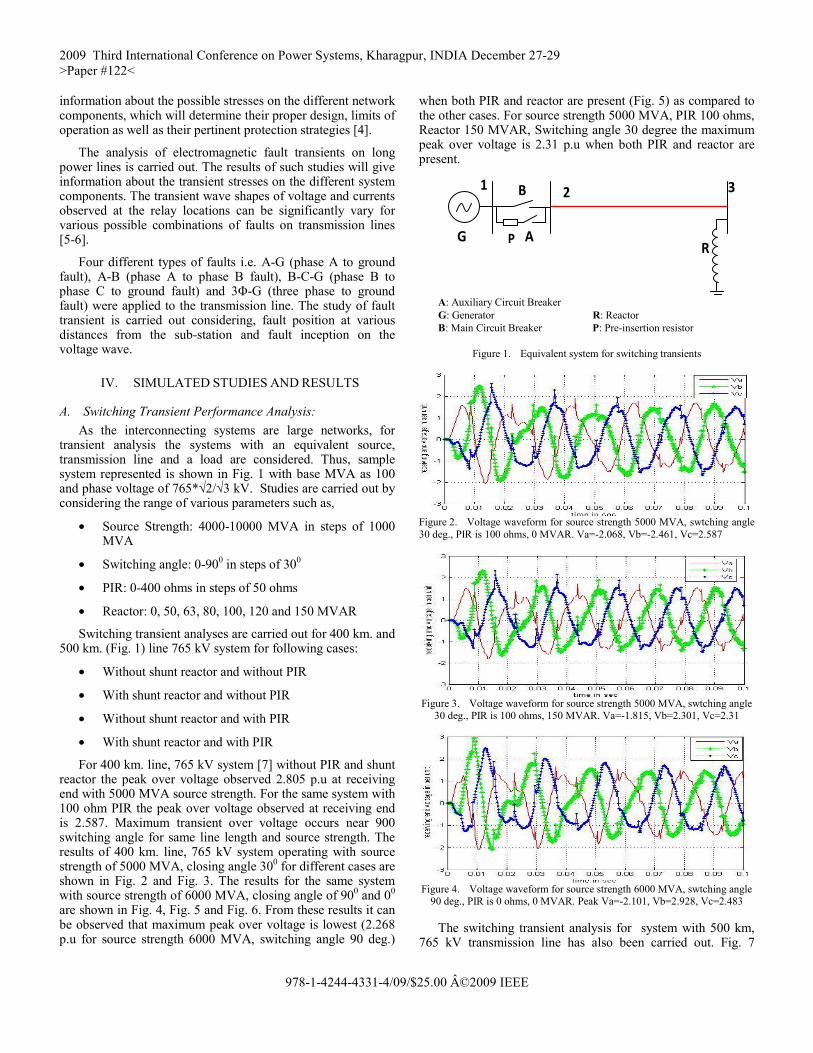
For 400 km. line, 765 kV system [7] without PIR and shunt reactor the peak over voltage observed 2.805 p.u at receiving end with 5000 MVA source strength. For the same system with 100 ohm PIR the peak over voltage observed at receiving end is 2.587. Maximum transient over voltage occurs near 900 switching angle for same line length and source strength. The results of 400 km. line, 765 kV system operating with source strength of 5000 MVA, closing angle 300 for different cases are shown in Fig. 2 and Fig. 3. The results for the same system with source strength of 6000 MVA, closing angle of 900 and 00 are shown in Fig. 4, Fig. 5 and Fig. 6. From these results it can be observed that maximum peak over voltage is lowest (2.268 p.u for source strength 6000 MVA, switching angle 90 deg.)
when both PIR and reactor are present (Fig. 5) as compared to the other cases. For source strength 5000 MVA, PIR 100 ohms, Reactor 150 MVAR, Switching angle 30 degree the maximum peak over voltage is 2.31 p.u when both PIR and reactor are present.
Figure 1. Equivalent system for switching transients
Figure 2. Voltage waveform for source strength 5000 MVA, swtching angle 30 deg., PIR is 100 ohms, 0 MVAR. Va=-2.068, Vb=-2.461, Vc=2.587
Figure 3. Voltage waveform for source strength 5000 MVA, swtching angle
30 deg., PIR is 100 ohms, 150 MVAR. Va=-1.815, Vb=2.301, Vc=2.31
Figure 4. Voltage waveform for source strength 6000 MVA, swtching angle
90 deg., PIR is 0 ohms, 0 MVAR. Peak Va=-2.101, Vb=2.928, Vc=2.483
The switching transient analysis for system with 500 km, 765 kV transmission line has also been carried out. Fig. 7
3
RG
1 2 B
AP
A: Auxiliary Circuit Breaker G: Generator R: Reactor B: Main Circuit Breaker P: Pre-insertion resistor
2009 Third International Conference on Power Systems, Kharagpur, INDIA December 27-29 >Paper #122<
978-1-4244-4331-4/09/$25.00 ©2009 IEEE
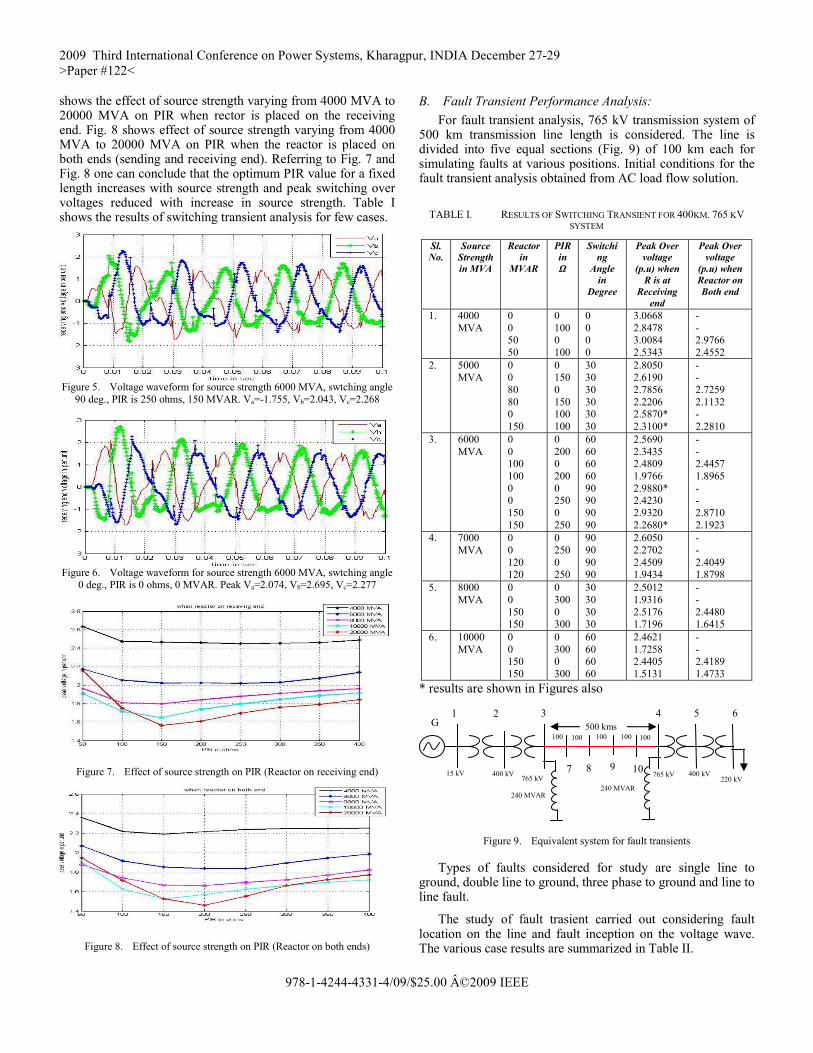
shows the effect of source strength varying from 4000 MVA to 20000 MVA on PIR when rector is placed on the receiving end. Fig. 8 shows effect of source strength varying from 4000 MVA to 20000 MVA on PIR when the reactor is placed on both ends (sending and receiving end). Referring to Fig. 7 and Fig. 8 one can conclude that the optimum PIR value for a fixed length increases with source strength and peak switching over voltages reduced with increase in source strength. Table I shows the results of switching transient analysis for few cases.
Figure 5. Voltage waveform for source strength 6000 MVA, swtching angle
90 deg., PIR is 250 ohms, 150 MVAR. Va=-1.755, Vb=2.043, Vc=2.268
Figure 6. Voltage waveform for source strength 6000 MVA, swtching angle
0 deg., PIR is 0 ohms, 0 MVAR. Peak Va=2.074, Vb=2.695, Vc=2.277
Figure 7. Effect of source strength on PIR (Reactor on receiving end)
Figure 8. Effect of source strength on PIR (Reactor on both ends)
B. Fault Transient Performance Analysis: For fault transient analysis, 765 kV transmission system of
500 km transmission line length is considered. The line is divided into five equal sections (Fig. 9) of 100 km each for simulating faults at various positions. Initial conditions for the fault transient analysis obtained from AC load flow solution.
TABLE I. RESULTS OF SWITCHING TRANSIENT FOR 400KM. 765 KV SYSTEM
Sl. No.
Source Strength in MVA
Reactor in
MVAR
PIR in Ω
Switching
Angle in
Degree
Peak Over voltage
(p.u) when R is at
Receiving end
Peak Over voltage
(p.u) when Reactor on Both end
1. 4000 MVA
0 0 50 50
0 100 0 100
0 0 0 0
3.0668 2.8478 3.0084 2.5343
- - 2.9766 2.4552
2. 5000 MVA
0 0 80 80 0 150
0 150 0 150 100 100
30 30 30 30 30 30
2.8050 2.6190 2.7856 2.2206 2.5870* 2.3100*
- - 2.7259 2.1132 - 2.2810
3. 6000 MVA
0 0 100 100 0 0 150 150
0 200 0 200 0 250 0 250
60 60 60 60 90 90 90 90
2.5690 2.3435 2.4809 1.9766 2.9880* 2.4230 2.9320 2.2680*
- - 2.4457 1.8965 - - 2.8710 2.1923
4. 7000 MVA
0 0 120 120
0 250 0 250
90 90 90 90
2.6050 2.2702 2.4509 1.9434
- - 2.4049 1.8798
5. 8000 MVA
0 0 150 150
0 300 0 300
30 30 30 30
2.5012 1.9316 2.5176 1.7196
- - 2.4480 1.6415
6. 10000 MVA
0 0 150 150
0 300 0 300
60 60 60 60
2.4621 1.7258 2.4405 1.5131
- - 2.4189 1.4733
* results are shown in Figures also
Figure 9. Equivalent system for fault transients
Types of faults considered for study are single line to ground, double line to ground, three phase to ground and line to line fault.
The study of fault trasient carried out considering fault location on the line and fault inception on the voltage wave. The various case results are summarized in Table II.
1 2 3 4 5 6
8 10 9 7
240 MVAR 240 MVAR
15 kV 400 kV
500 kms
400 kV
G
220 kV765 kV 765 kV
100 100 100 100 100
2009 Third International Conference on Power Systems, Kharagpur, INDIA December 27-29 >Paper #122<
978-1-4244-4331-4/09/$25.00 ©2009 IEEE
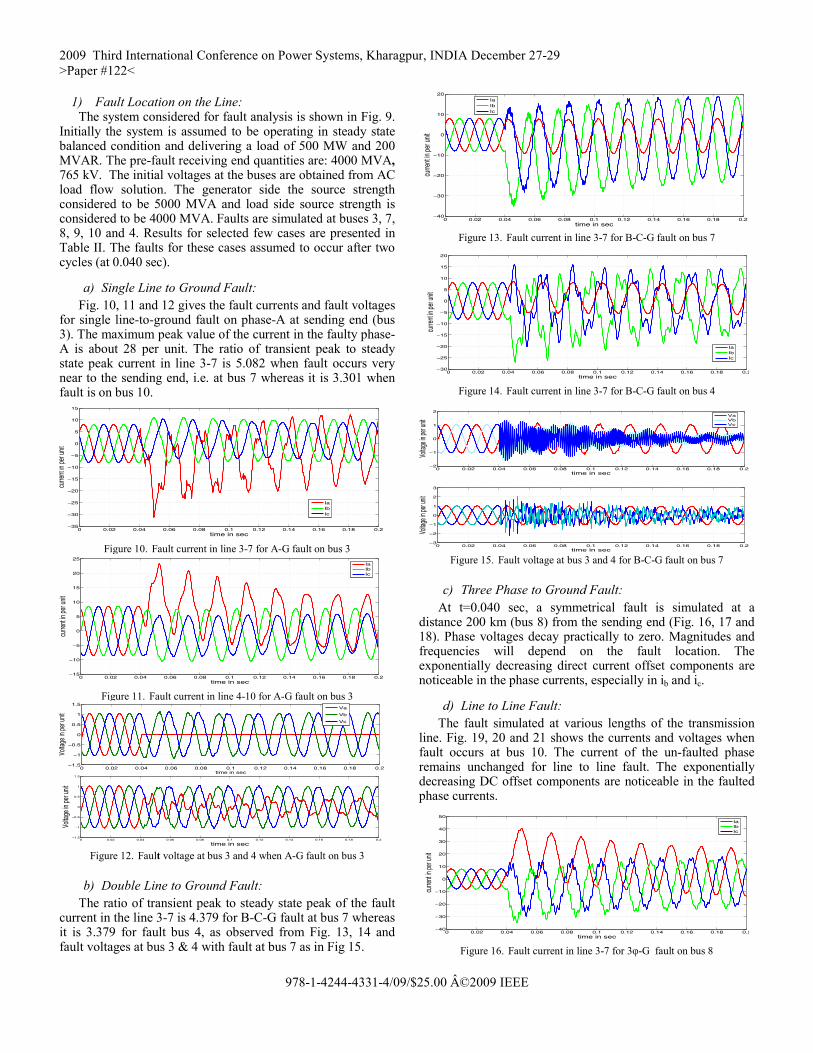
1) Fault Location on the Line: The system considered for fault analysis is shown in Fig. 9.
Initially the system is assumed to be operating in steady state balanced condition and delivering a load of 500 MW and 200 MVAR. The pre-fault receiving end quantities are: 4000 MVA, 765 kV. The initial voltages at the buses are obtained from AC load flow solution. The generator side the source strength considered to be 5000 MVA and load side source strength is considered to be 4000 MVA. Faults are simulated at buses 3, 7, 8, 9, 10 and 4. Results for selected few cases are presented in Table II. The faults for these cases assumed to occur after two cycles (at 0.040 sec).
a) Single Line to Ground Fault: Fig. 10, 11 and 12 gives the fault currents and fault voltages
for single line-to-ground fault on phase-A at sending end (bus 3). The maximum peak value of the current in the faulty phase-A is about 28 per unit. The ratio of transient peak to steady state peak current in line 3-7 is 5.082 when fault occurs very near to the sending end, i.e. at bus 7 whereas it is 3.301 when fault is on bus 10.
0 0.02 0.04 0.06 0.08 0.1 0.12 0.14 0.16 0.18 0.2−35
−30
−25
−20
−15
−10
−5
0
5
10
15
time in sec
curre
nt in
per u
nit
IaIbIc
Figure 10. Fault current in line 3-7 for A-G fault on bus 3
0 0.02 0.04 0.06 0.08 0.1 0.12 0.14 0.16 0.18 0.2−15
−10
−5
0
5
10
15
20
25
time in sec
curre
nt in
per u
nit
IaIbIc
Figure 11. Fault current in line 4-10 for A-G fault on bus 3
0 0.02 0.04 0.06 0.08 0.1 0.12 0.14 0.16 0.18 0.2−1.5
−1
−0.5
0
0.5
1
1.5
time in sec
Volta
ge in
per u
nit
Va
Vb
Vc
0 0.02 0.04 0.06 0.08 0.1 0.12 0.14 0.16 0.18 0.2−1.5
−1
−0.5
0
0.5
1
1.5
time in sec
Volta
ge in
per u
nit
Figure 12. Fault voltage at bus 3 and 4 when A-G fault on bus 3
b) Double Line to Ground Fault: The ratio of transient peak to steady state peak of the fault
current in the line 3-7 is 4.379 for B-C-G fault at bus 7 whereas it is 3.379 for fault bus 4, as observed from Fig. 13, 14 and fault voltages at bus 3 & 4 with fault at bus 7 as in Fig 15.
0 0.02 0.04 0.06 0.08 0.1 0.12 0.14 0.16 0.18 0.2−40
−30
−20
−10
0
10
20
time in sec
curre
nt in
per u
nit
IaIbIc
Figure 13. Fault current in line 3-7 for B-C-G fault on bus 7
0 0.02 0.04 0.06 0.08 0.1 0.12 0.14 0.16 0.18 0.2−30
−25
−20
−15
−10
−5
0
5
10
15
20
time in sec
curre
nt in
per u
nit
IaIbIc
Figure 14. Fault current in line 3-7 for B-C-G fault on bus 4
0 0.02 0.04 0.06 0.08 0.1 0.12 0.14 0.16 0.18 0.2−2
−1
0
1
2
time in sec
Volta
ge in
per u
nitVaVbVc
0 0.02 0.04 0.06 0.08 0.1 0.12 0.14 0.16 0.18 0.2−3
−2
−1
0
1
2
3
time in sec
Volta
ge in
per u
nit
Figure 15. Fault voltage at bus 3 and 4 for B-C-G fault on bus 7
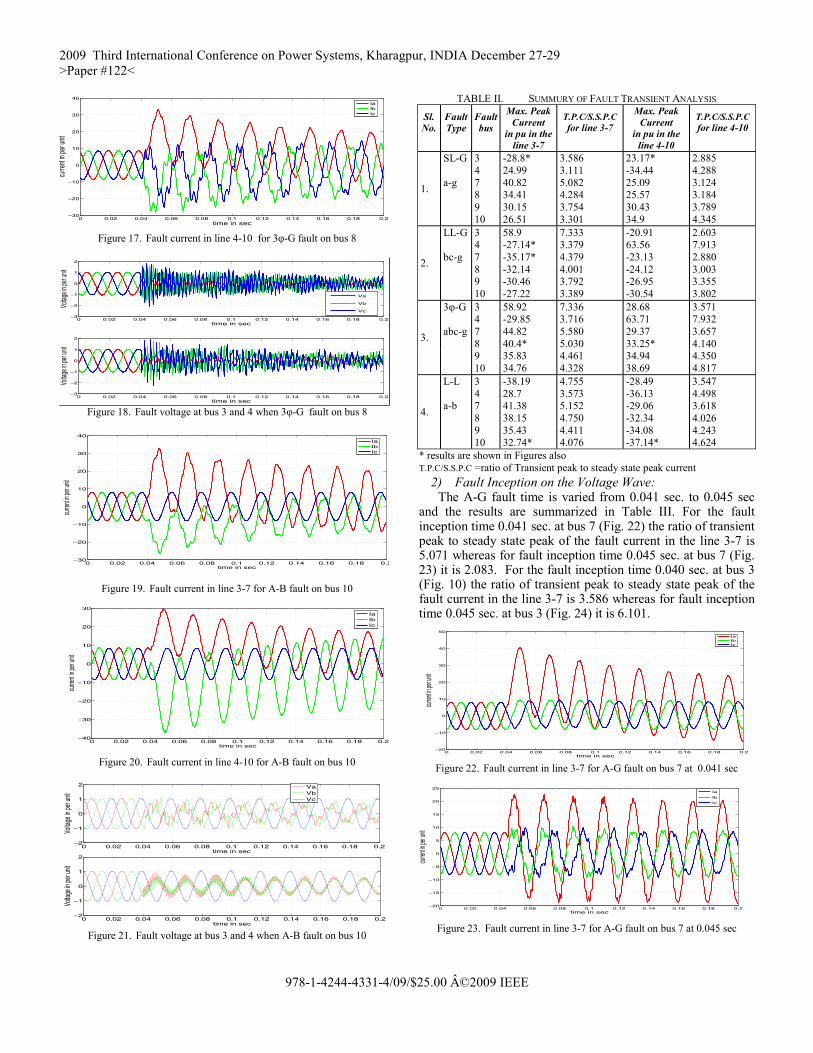
c) Three Phase to Ground Fault: At t=0.040 sec, a symmetrical fault is simulated at a
distance 200 km (bus 8) from the sending end (Fig. 16, 17 and 18). Phase voltages decay practically to zero. Magnitudes and frequencies will depend on the fault location. The exponentially decreasing direct current offset components are noticeable in the phase currents, especially in ib and ic.
d) Line to Line Fault: The fault simulated at various lengths of the transmission
line. Fig. 19, 20 and 21 shows the currents and voltages when fault occurs at bus 10. The current of the un-faulted phase remains unchanged for line to line fault. The exponentially decreasing DC offset components are noticeable in the faulted phase currents.
0 0.02 0.04 0.06 0.08 0.1 0.12 0.14 0.16 0.18 0.2−40
−30
−20
−10
0
10
20
30
40
50
time in sec
curre
nt in
per u
nit
IaIbIc
Figure 16. Fault current in line 3-7 for 3φ-G fault on bus 8
2009 Third International Conference on Power Systems, Kharagpur, INDIA December 27-29 >Paper #122<
978-1-4244-4331-4/09/$25.00 ©2009 IEEE
0 0.02 0.04 0.06 0.08 0.1 0.12 0.14 0.16 0.18 0.2−30
−20
−10
0
10
20
30
40
time in sec
curre
nt in
per u
nit
IaIbIc
Figure 17. Fault current in line 4-10 for 3φ-G fault on bus 8
0 0.02 0.04 0.06 0.08 0.1 0.12 0.14 0.16 0.18 0.2−3
−2
−1
0
1
2
time in sec
Volta
ge in
per u
nit
Va
Vb
Vc
0 0.02 0.04 0.06 0.08 0.1 0.12 0.14 0.16 0.18 0.2−3
−2
−1
0
1
2
time in sec
Volta
ge in
per u
nit
Figure 18. Fault voltage at bus 3 and 4 when 3φ-G fault on bus 8
0 0.02 0.04 0.06 0.08 0.1 0.12 0.14 0.16 0.18 0.2−30
−20
−10
0
10
20
30
40
time in sec
curre
nt in
per u
nit
IaIbIc
Figure 19. Fault current in line 3-7 for A-B fault on bus 10
0 0.02 0.04 0.06 0.08 0.1 0.12 0.14 0.16 0.18 0.2−40
−30
−20
−10
0
10
20
30
time in sec
curre
nt in
per u
nit
IaIbIc
Figure 20. Fault current in line 4-10 for A-B fault on bus 10
0 0.02 0.04 0.06 0.08 0.1 0.12 0.14 0.16 0.18 0.2−2
−1
0
1
2
time in sec
Volta
ge in
per u
nit
VaVbVc
0 0.02 0.04 0.06 0.08 0.1 0.12 0.14 0.16 0.18 0.2−2
−1
0
1
2
time in sec
Volta
ge in
per u
nit
Figure 21. Fault voltage at bus 3 and 4 when A-B fault on bus 10
TABLE II. SUMMURY OF FAULT TRANSIENT ANALYSIS
Sl. No.
FaultType
Faultbus
Max. Peak Current
in pu in the line 3-7
T.P.C/S.S.P.C for line 3-7
Max. Peak Current
in pu in the line 4-10
T.P.C/S.S.P.C for line 4-10
1.
SL-G a-g
3 4 7 8 9 10
-28.8* 24.99 40.82 34.41 30.15 26.51
3.586 3.111 5.082 4.284 3.754 3.301
23.17* -34.44 25.09 25.57 30.43 34.9
2.885 4.288 3.124 3.184 3.789 4.345
2.
LL-G bc-g
3 4 7 8 9 10
58.9 -27.14* -35.17* -32.14 -30.46 -27.22
7.333 3.379 4.379 4.001 3.792 3.389
-20.91 63.56 -23.13 -24.12 -26.95 -30.54
2.603 7.913 2.880 3.003 3.355 3.802
3.
3φ-G abc-g
3 4 7 8
58.92 -29.85 44.82 40.4*
7.336 3.716 5.580 5.030
28.68 63.71 29.37 33.25*
3.571 7.932 3.657 4.140
9 10
35.83 34.76
4.461 4.328
34.94 38.69
4.350 4.817
4.
L-L a-b
3 4 7 8 9 10
-38.19 28.7 41.38 38.15 35.43 32.74*
4.755 3.573 5.152 4.750 4.411 4.076
-28.49 -36.13 -29.06 -32.34 -34.08 -37.14*
3.547 4.498 3.618 4.026 4.243 4.624
* results are shown in Figures also T.P.C/S.S.P.C =ratio of Transient peak to steady state peak current
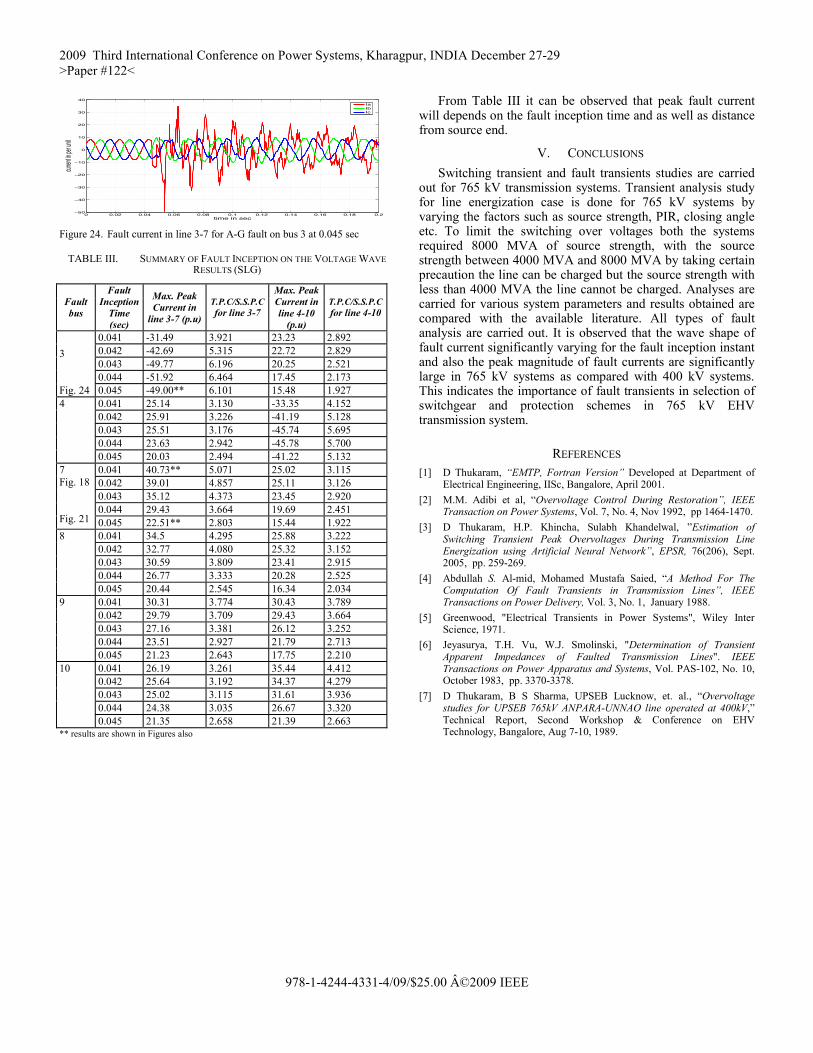
2) Fault Inception on the Voltage Wave: The A-G fault time is varied from 0.041 sec. to 0.045 sec
and the results are summarized in Table III. For the fault inception time 0.041 sec. at bus 7 (Fig. 22) the ratio of transient peak to steady state peak of the fault current in the line 3-7 is 5.071 whereas for fault inception time 0.045 sec. at bus 7 (Fig. 23) it is 2.083. For the fault inception time 0.040 sec. at bus 3 (Fig. 10) the ratio of transient peak to steady state peak of the fault current in the line 3-7 is 3.586 whereas for fault inception time 0.045 sec. at bus 3 (Fig. 24) it is 6.101.
0 0.02 0.04 0.06 0.08 0.1 0.12 0.14 0.16 0.18 0.2−20
−10
0
10
20
30
40
50
time in sec
curren
t in pe
r unit
IaIbIc
Figure 22. Fault current in line 3-7 for A-G fault on bus 7 at 0.041 sec
0 0.02 0.04 0.06 0.08 0.1 0.12 0.14 0.16 0.18 0.2−20
−15
−10
−5
0
5
10
15
20
25
time in sec
curren
t in pe
r unit
Ia
Ib
Ic
Figure 23. Fault current in line 3-7 for A-G fault on bus 7 at 0.045 sec
2009 Third International Conference on Power Systems, Kharagpur, INDIA December 27-29 >Paper #122<
978-1-4244-4331-4/09/$25.00 ©2009 IEEE
0 0.02 0.04 0.06 0.08 0.1 0.12 0.14 0.16 0.18 0.2−50
−40
−30
−20
−10
0
10
20
30
40
time in sec
curren
t in pe
r unit
IaIbIc
Figure 24. Fault current in line 3-7 for A-G fault on bus 3 at 0.045 sec
TABLE III. SUMMARY OF FAULT INCEPTION ON THE VOLTAGE WAVE RESULTS (SLG)
Fault bus
Fault Inception
Time (sec)
Max. Peak Current in
line 3-7 (p.u)
T.P.C/S.S.P.C for line 3-7
Max. Peak Current in line 4-10
(p.u)
T.P.C/S.S.P.C for line 4-10
3 Fig. 24
0.041 -31.49 3.921 23.23 2.892 0.042 -42.69 5.315 22.72 2.829 0.043 -49.77 6.196 20.25 2.521 0.044 -51.92 6.464 17.45 2.173 0.045 -49.00** 6.101 15.48 1.927
4 0.041 25.14 3.130 -33.35 4.152 0.042 25.91 3.226 -41.19 5.128 0.043 25.51 3.176 -45.74 5.695 0.044 23.63 2.942 -45.78 5.700 0.045 20.03 2.494 -41.22 5.132
7 Fig. 18 Fig. 21
0.041 40.73** 5.071 25.02 3.115 0.042 39.01 4.857 25.11 3.126 0.043 35.12 4.373 23.45 2.920 0.044 29.43 3.664 19.69 2.451 0.045 22.51** 2.803 15.44 1.922
8
0.041 34.5 4.295 25.88 3.222 0.042 32.77 4.080 25.32 3.152 0.043 30.59 3.809 23.41 2.915 0.044 26.77 3.333 20.28 2.525 0.045 20.44 2.545 16.34 2.034
9 0.041 30.31 3.774 30.43 3.789 0.042 29.79 3.709 29.43 3.664 0.043 27.16 3.381 26.12 3.252 0.044 23.51 2.927 21.79 2.713 0.045 21.23 2.643 17.75 2.210
10 0.041 26.19 3.261 35.44 4.412 0.042 25.64 3.192 34.37 4.279 0.043 25.02 3.115 31.61 3.936 0.044 24.38 3.035 26.67 3.320 0.045 21.35 2.658 21.39 2.663
** results are shown in Figures also
From Table III it can be observed that peak fault current will depends on the fault inception time and as well as distance from source end.
V. CONCLUSIONS Switching transient and fault transients studies are carried
out for 765 kV transmission systems. Transient analysis study for line energization case is done for 765 kV systems by varying the factors such as source strength, PIR, closing angle etc. To limit the switching over voltages both the systems required 8000 MVA of source strength, with the source strength between 4000 MVA and 8000 MVA by taking certain precaution the line can be charged but the source strength with less than 4000 MVA the line cannot be charged. Analyses are carried for various system parameters and results obtained are compared with the available literature. All types of fault analysis are carried out. It is observed that the wave shape of fault current significantly varying for the fault inception instant and also the peak magnitude of fault currents are significantly large in 765 kV systems as compared with 400 kV systems. This indicates the importance of fault transients in selection of switchgear and protection schemes in 765 kV EHV transmission system.
REFERENCES [1] D Thukaram, “EMTP, Fortran Version” Developed at Department of
Electrical Engineering, IISc, Bangalore, April 2001. [2] M.M. Adibi et al, “Overvoltage Control During Restoration”, IEEE
Transaction on Power Systems, Vol. 7, No. 4, Nov 1992, pp 1464-1470. [3] D Thukaram, H.P. Khincha, Sulabh Khandelwal, ”Estimation of
Switching Transient Peak Overvoltages During Transmission Line Energization using Artificial Neural Network”, EPSR, 76(206), Sept. 2005, pp. 259-269.
[4] Abdullah S. Al-mid, Mohamed Mustafa Saied, “A Method For The Computation Of Fault Transients in Transmission Lines”, IEEE Transactions on Power Delivery, Vol. 3, No. 1, January 1988.
[5] Greenwood, "Electrical Transients in Power Systems", Wiley Inter Science, 1971.
[6] Jeyasurya, T.H. Vu, W.J. Smolinski, "Determination of Transient Apparent Impedances of Faulted Transmission Lines". IEEE Transactions on Power Apparatus and Systems, Vol. PAS-102, No. 10, October 1983, pp. 3370-3378.
[7] D Thukaram, B S Sharma, UPSEB Lucknow, et. al., “Overvoltage studies for UPSEB 765kV ANPARA-UNNAO line operated at 400kV,” Technical Report, Second Workshop & Conference on EHV Technology, Bangalore, Aug 7-10, 1989.