Embed Size (px)
Citation preview
Page 1 of 12
Swing Structure
Introduction
Swing structure is core and critical to your trading decisions.
Swing structure is the defining element of forecasting pure raw price action. If you have never
studied swing structure, this video will be a true ah ha moment for you.
If this is old hat for you, do yourself a favor and watch this video anyway its only 8 minutes long.
Enjoy!

Page 2 of 12
I have already mentioned swing structure previously in other videos, but I think this topic is important
enough to make a separate video.
An understanding of the knowledge in this video is not only necessary, it is absolutely critical. If you do
not fully understand the concepts of swing structure, and if you do not let it be the foundation that guides
your trading, you are not going to be a successful trader.
If you do not completely understand swing structure, if it does not make sense, if it is confusing at all,
then watch this video repeatedly until it becomes second nature to you.
Page 3 of 12
What makes up the move going up, and what makes up the down move?
There is actually a lot going on here.
Page 4 of 12
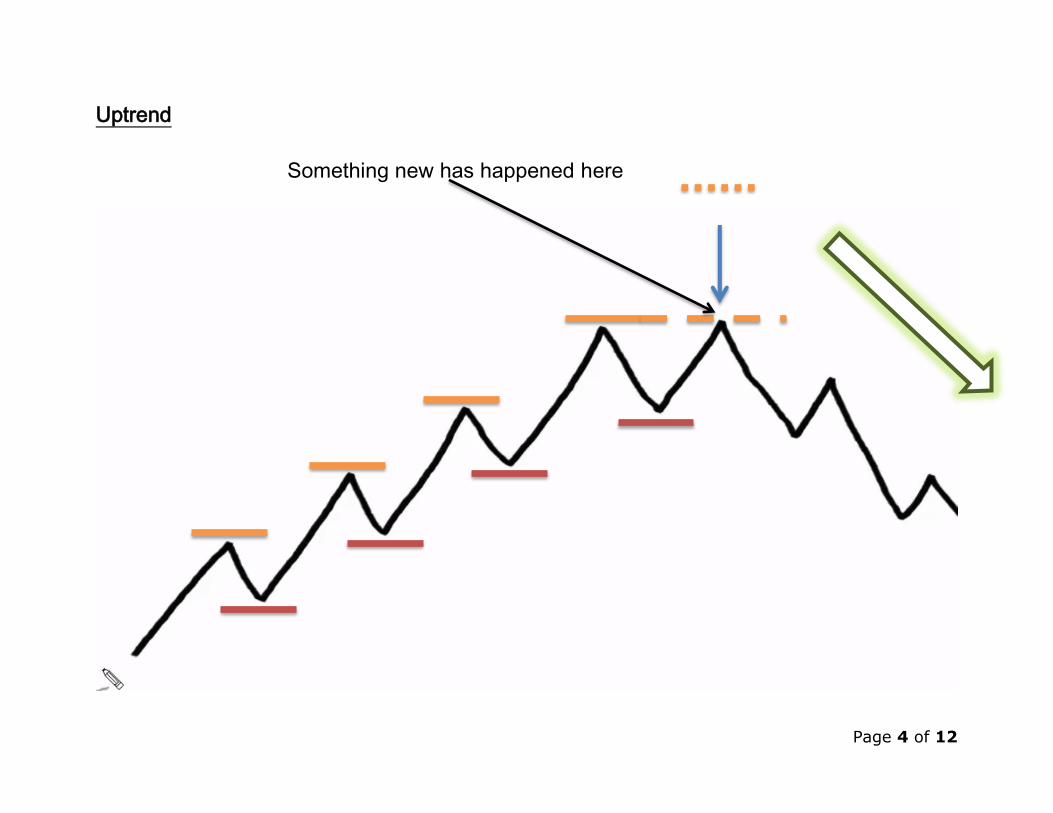
Uptrend
Something new has happened here

Page 5 of 12
An uptrend is always a series of higher swing highs and higher swing lows.
The top identified by the blue arrow is our 1st indication of weakness in the uptrend.
Why do we say this?
We say this because at the top (identified by the blue arrow), we have not made a higher high.
In a continuing trend where the bullish strength remains, we would see an impulse move that would
have made a clear new high.
But instead of a new high we have a double top and this is our first clue to a change in momentum
which means the trend might be changing.
Keep in mind we are looking at a text book example of swing structure and in real life this is not typical.
Price action in real life is not normally this perfect.
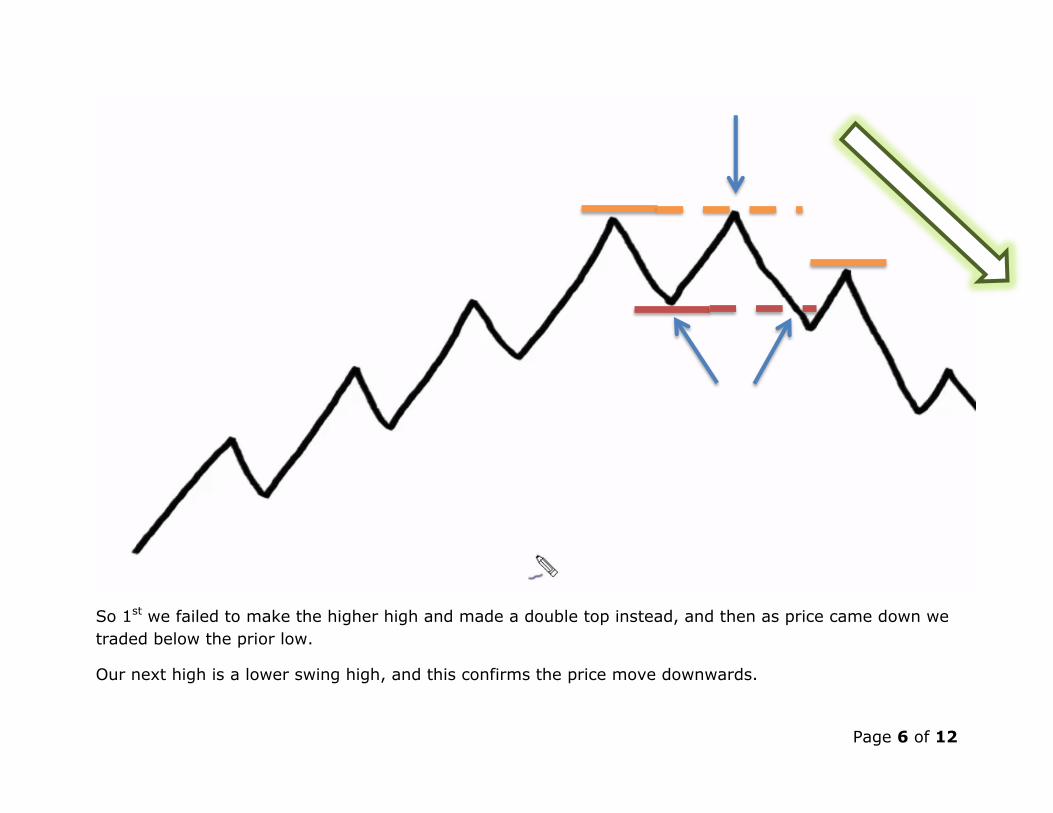
Our next clue that price is reversing, is that our prior swing low gets taken out.
Page 6 of 12
So 1st we failed to make the higher high and made a double top instead, and then as price came down we
traded below the prior low.
Our next high is a lower swing high, and this confirms the price move downwards.
Page 7 of 12
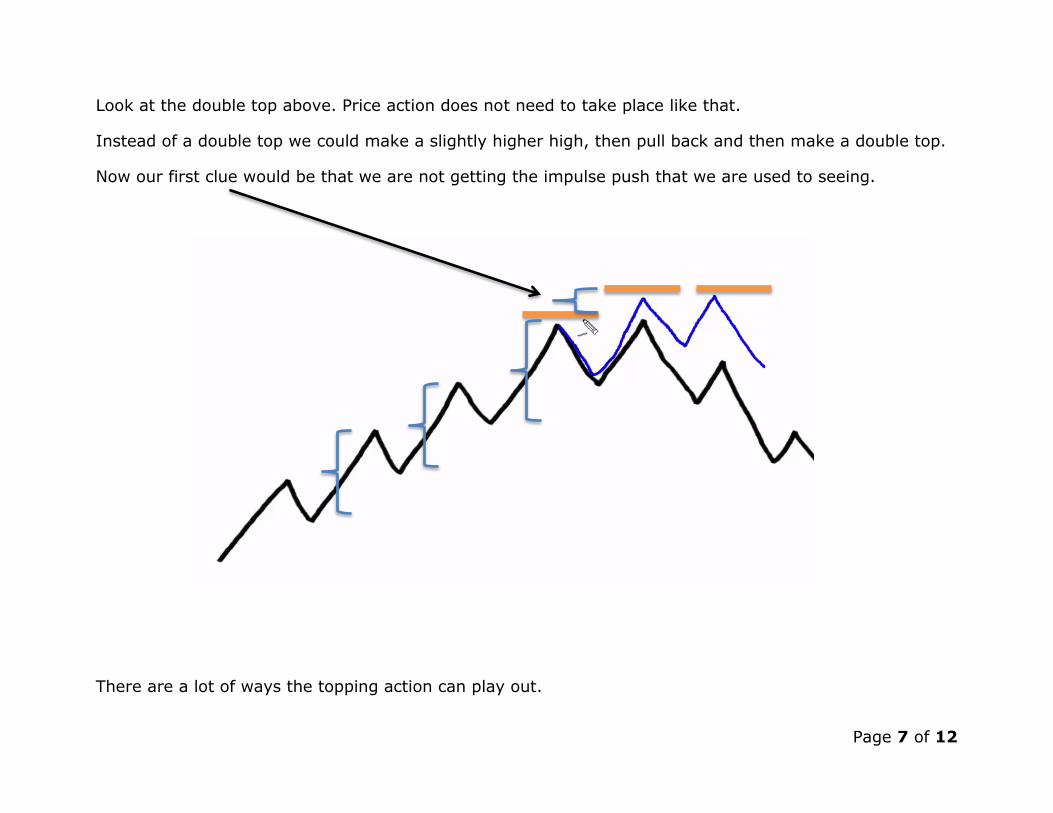
Look at the double top above. Price action does not need to take place like that.
Instead of a double top we could make a slightly higher high, then pull back and then make a double top.
Now our first clue would be that we are not getting the impulse push that we are used to seeing.
There are a lot of ways the topping action can play out.
Page 8 of 12
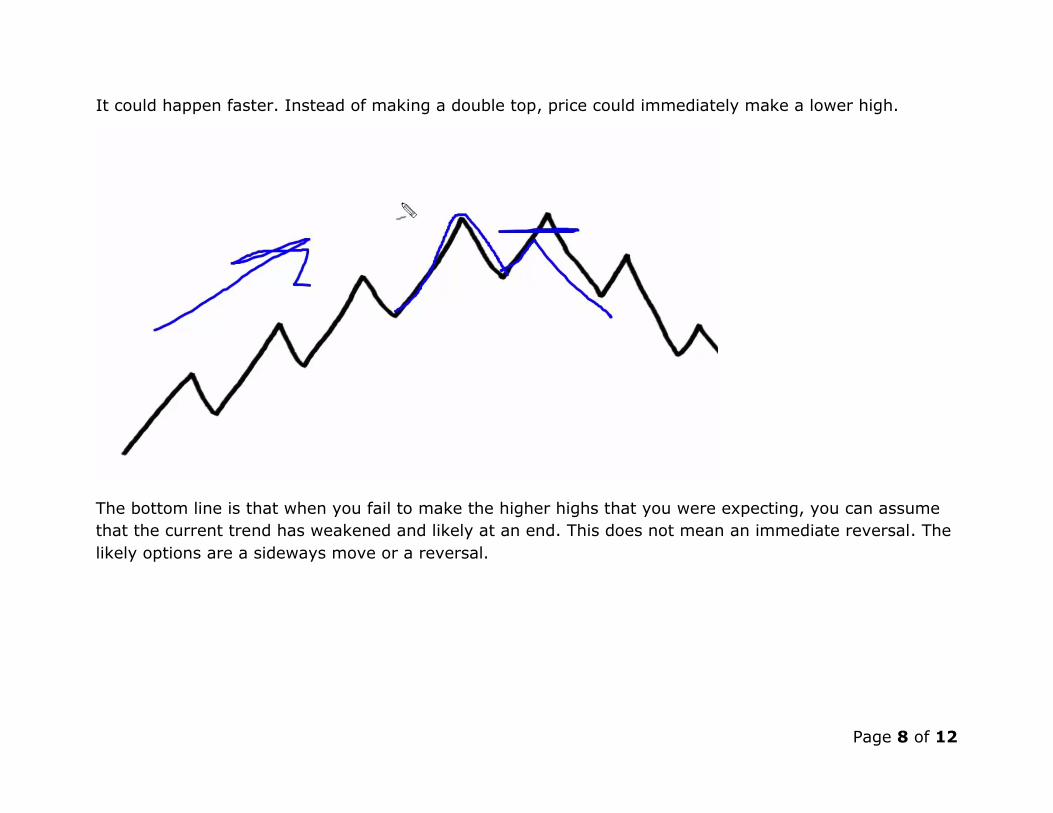
It could happen faster. Instead of making a double top, price could immediately make a lower high.
The bottom line is that when you fail to make the higher highs that you were expecting, you can assume
that the current trend has weakened and likely at an end. This does not mean an immediate reversal. The
likely options are a sideways move or a reversal.
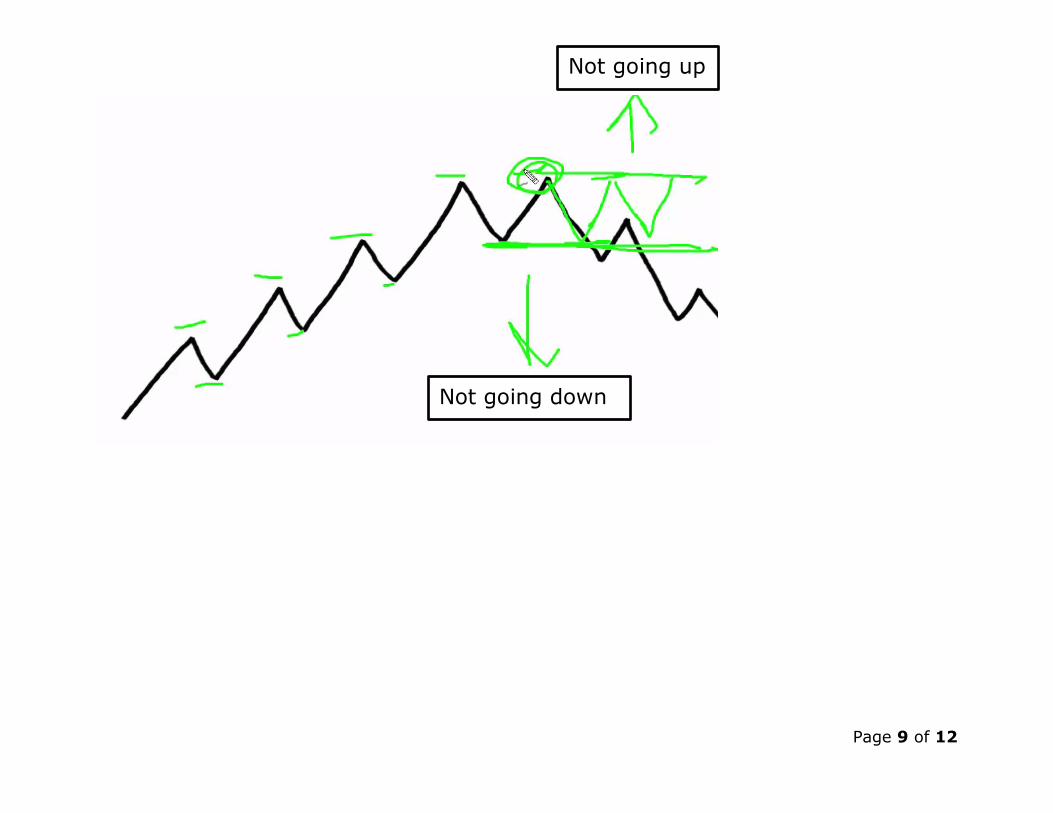
Page 9 of 12
Not going down
Not going up
Page 10 of 12
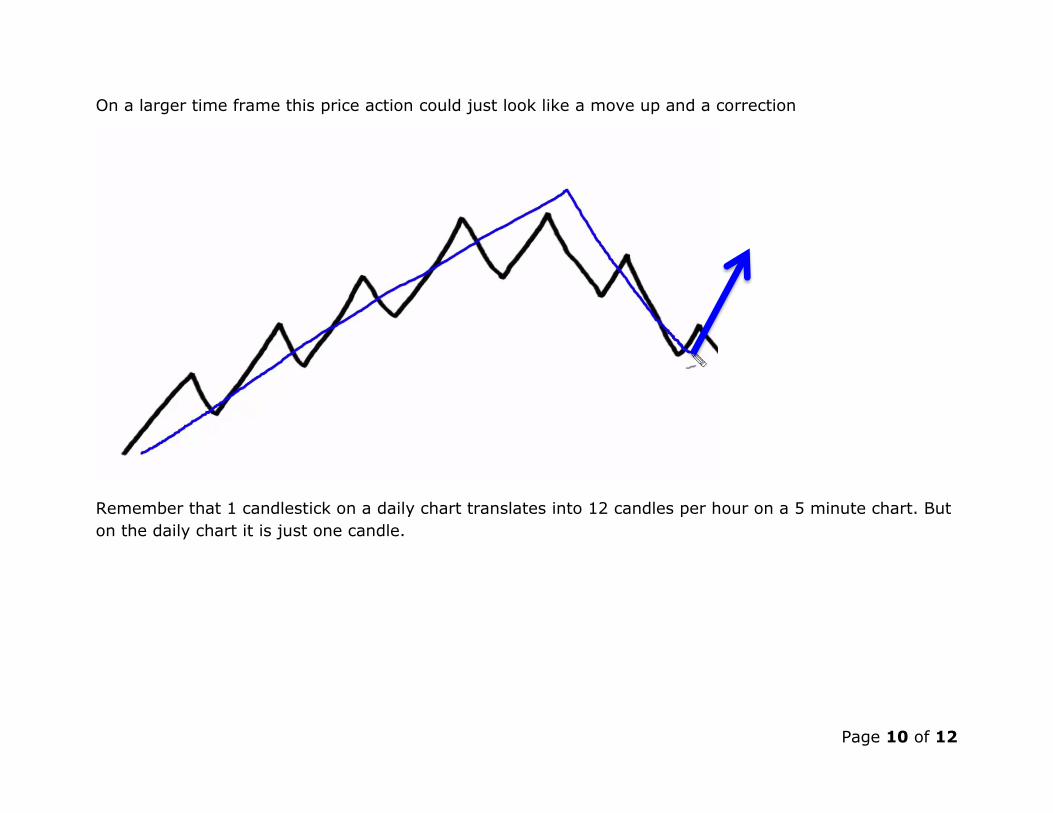
On a larger time frame this price action could just look like a move up and a correction
Remember that 1 candlestick on a daily chart translates into 12 candles per hour on a 5 minute chart. But
on the daily chart it is just one candle.
Page 11 of 12
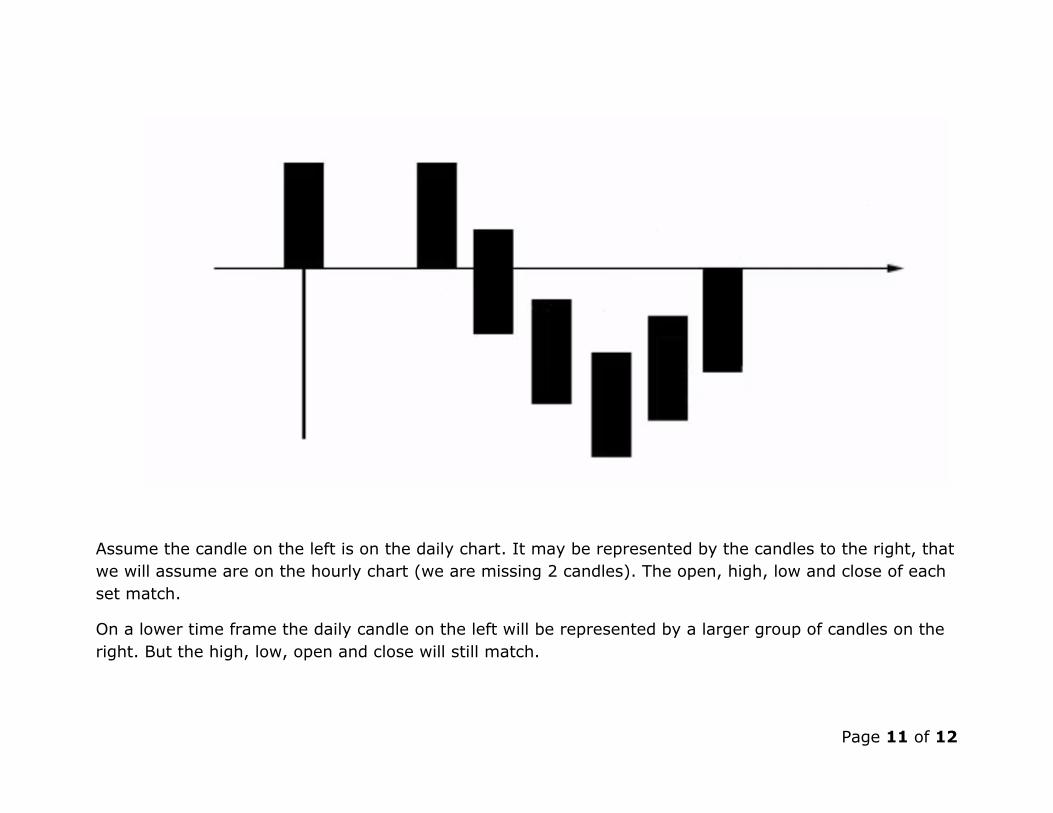
Assume the candle on the left is on the daily chart. It may be represented by the candles to the right, that
we will assume are on the hourly chart (we are missing 2 candles). The open, high, low and close of each
set match.
On a lower time frame the daily candle on the left will be represented by a larger group of candles on the
right. But the high, low, open and close will still match.
Page 12 of 12
Swing structure is important
Watch this video several times if you have any confusion at all.
Hope you enjoyed this video . . . I will see you in the next one.