Embed Size (px)
Citation preview

www.swickmining.com
Swick Mining Services Ltd
FY17 Investor Presentation
13th September 2017
ASX: SWKFor
per
sona
l use
onl
y
Disclaimer
This presentation has been prepared by Swick Mining Services Ltd (“the Company”) for the sole purpose of providing corporate, financial,
operational and other information to enable recipients to review the Company and its business activities. The information provided is in
summary format and is not intended to provide a full and complete picture of the Company and its business activities.
This presentation is not intended as an offer, invitation, solicitation or recommendation with respect to the purchase or sale of any securities.
Nothing in this presentation should be construed as financial product advice, whether personal or general, for the purposes of section 766B of
the Corporations Act 2001.
This presentation may contain forward looking information, statements or forecasts that are subject to risks and other factors outside of the
control of the Company. Any forward looking information, statements or forecasts provided is/are considered reasonable in the
circumstances and has/have been prepared in good faith and with all due care, but may differ materially from actual future results and
performance. The Company and its affiliates or any of its directors, agents, officers or employees do not make any representation or
warranty, express or implied, as to or endorsement of, the accuracy or completeness of any information, statements or forecasts contained in
this presentation, and they do not accept any liability for any statement made in, or omitted from, this presentation.
This presentation should not be relied upon as a representation of any matter that an investor should consider in evaluating the Company or
its business activities. Investors must make and rely upon their own enquiries and due diligence in relation to the subject matter of this
presentation and an investment in the Company. A potential investor must assess the merits or otherwise of an investment in the Company
having regard to their own personal, financial and other circumstances.
Unless otherwise started all the currency disclosures in this presentation are Australian Dollars.
Information included in this presentation is dated 12 September 2017.
2FY17 Investor Presentation
For
per
sona
l use
onl
y
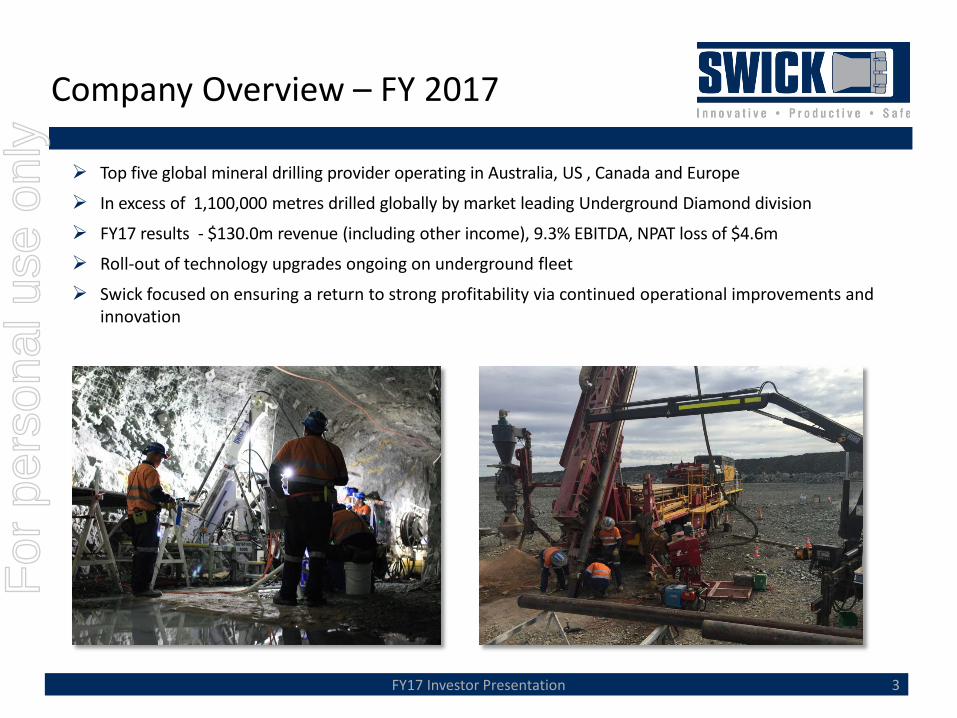
Company Overview – FY 2017
Top five global mineral drilling provider operating in Australia, US , Canada and Europe
In excess of 1,100,000 metres drilled globally by market leading Underground Diamond division
FY17 results - $130.0m revenue (including other income), 9.3% EBITDA, NPAT loss of $4.6m
Roll-out of technology upgrades ongoing on underground fleet
Swick focused on ensuring a return to strong profitability via continued operational improvements and innovation
3FY17 Investor Presentation
For
per
sona
l use
onl
y

Corporate Snapshot
Corporate Structure ASX: SWK - Listed Nov 2006 Shares outstanding: 231.5m Share Price 01 Sep 17: $0.30 Market Cap 01 Sep 17: $69.4m
Board and Executive Management• Andrew Simpson - NEC• Kent Swick - MD• Phil Lockyer - NED• David Nixon - NED• Ian McCubbing – NED• Jitu Bhudia– CFO
Substantial shareholders*• Kent Swick (14.3%)• Hercules Int. Pty Ltd (12.6%) • IOOF Holdings Ltd (10.2%)• Vanshap Capital LLC (9.4%)• Rosanne Swick (6.0%)
*As at 14th August 2017
4
Share price relative to ASX and Global peers Aug 2016 to currentSWK is up 23% YOY
FY17 Investor Presentation
ASX listed peers include Mitchell Services, Boart Longyear
For
per
sona
l use
onl
y
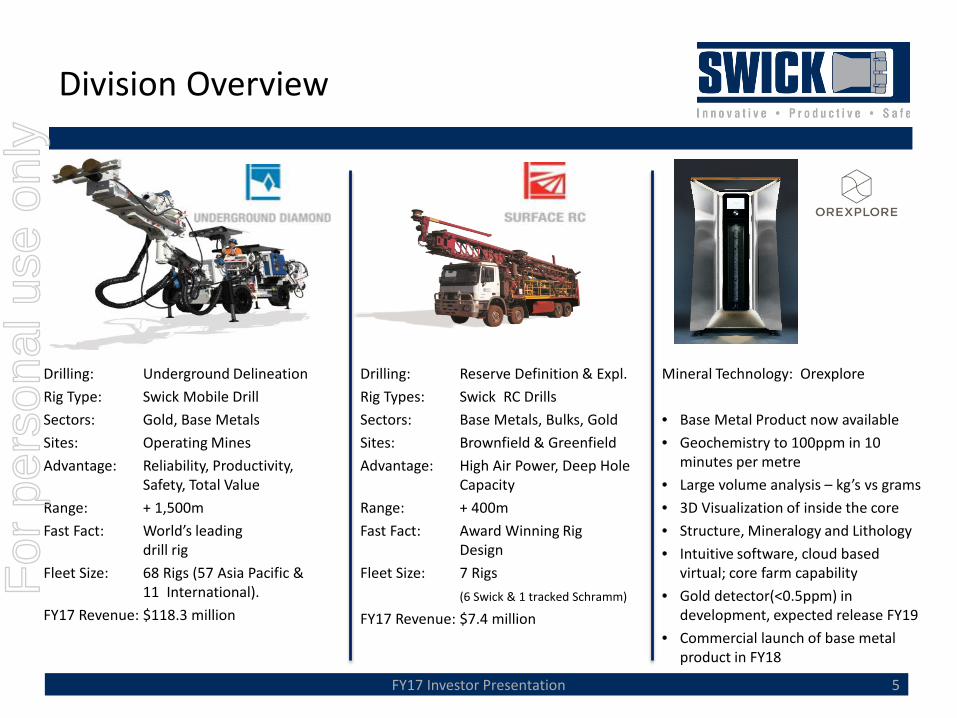
Division Overview
Drilling: Underground DelineationRig Type: Swick Mobile DrillSectors: Gold, Base MetalsSites: Operating MinesAdvantage: Reliability, Productivity,
Safety, Total ValueRange: + 1,500mFast Fact: World’s leading
drill rigFleet Size: 68 Rigs (57 Asia Pacific &
11 International).FY17 Revenue: $118.3 million
5
Drilling: Reserve Definition & Expl.Rig Types: Swick RC DrillsSectors: Base Metals, Bulks, GoldSites: Brownfield & GreenfieldAdvantage: High Air Power, Deep Hole
CapacityRange: + 400mFast Fact: Award Winning Rig
DesignFleet Size: 7 Rigs
(6 Swick & 1 tracked Schramm)
FY17 Revenue: $7.4 million
Mineral Technology: Orexplore
• Base Metal Product now available• Geochemistry to 100ppm in 10
minutes per metre• Large volume analysis – kg’s vs grams• 3D Visualization of inside the core• Structure, Mineralogy and Lithology • Intuitive software, cloud based
virtual; core farm capability• Gold detector(<0.5ppm) in
development, expected release FY19• Commercial launch of base metal
product in FY18
FY17 Investor Presentation
For
per
sona
l use
onl
y

Safety in FY 2017 – Towards Zero Harm
6FY17 Investor Presentation
• Safety improvements over the last four years now stabilised with TRIFR of 11.1 at year end
• Commissioned a purpose built testing, training and induction facility
• 100% implementation of IPAD technology with HSE tools and training videos
• Continued investment in Project Implementation and Technical trainers (PITT)
• Focus now on early intervention and biomechanical studies
Swick Training & Induction Facility
0
10
20
30
40
50
60
1Q13 2Q13 3Q13 4Q13 1Q14 2Q14 3Q14 4Q14 1Q15 2Q15 3Q15 4Q15 1Q16 2Q16 3Q16 4Q16 1Q17 2Q17 3Q17 4Q17
TRIFRTRIFR Linear (TRIFR)
For
per
sona
l use
onl
y
Financial Performance
7FY17 Investor Presentation
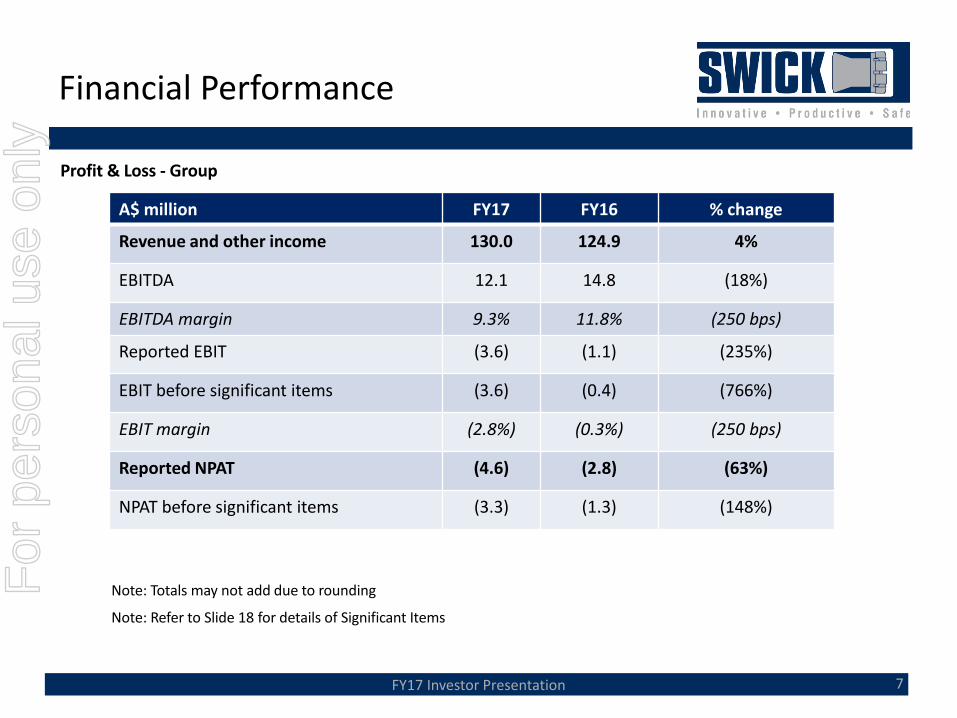
Profit & Loss - Group
A$ million FY17 FY16 % change
Revenue and other income 130.0 124.9 4%
EBITDA 12.1 14.8 (18%)
EBITDA margin 9.3% 11.8% (250 bps)
Reported EBIT (3.6) (1.1) (235%)
EBIT before significant items (3.6) (0.4) (766%)
EBIT margin (2.8%) (0.3%) (250 bps)
Reported NPAT (4.6) (2.8) (63%)
NPAT before significant items (3.3) (1.3) (148%)
Note: Totals may not add due to rounding
Note: Refer to Slide 18 for details of Significant Items
For
per
sona
l use
onl
y
Financial Performance
8FY17 Investor Presentation
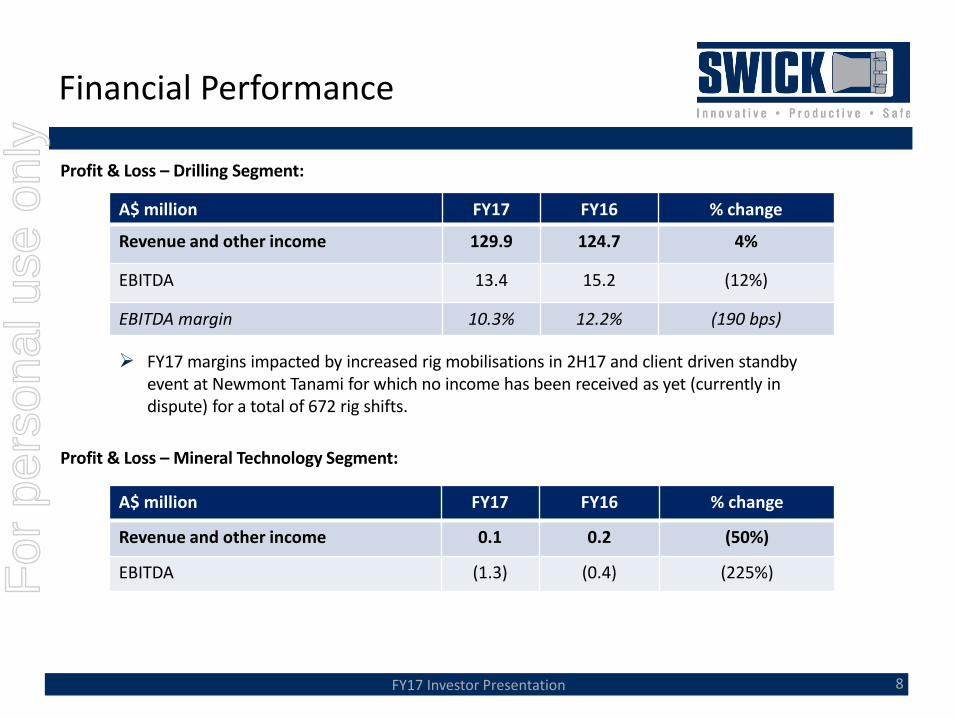
Profit & Loss – Drilling Segment:
Profit & Loss – Mineral Technology Segment:
A$ million FY17 FY16 % change
Revenue and other income 129.9 124.7 4%
EBITDA 13.4 15.2 (12%)
EBITDA margin 10.3% 12.2% (190 bps)
A$ million FY17 FY16 % change
Revenue and other income 0.1 0.2 (50%)
EBITDA (1.3) (0.4) (225%)
FY17 margins impacted by increased rig mobilisations in 2H17 and client driven standby event at Newmont Tanami for which no income has been received as yet (currently in dispute) for a total of 672 rig shifts.
For
per
sona
l use
onl
y

Financial Performance
9FY17 Investor Presentation
Balance Sheet
A$ million FY17 FY16
Cash 8.8 4.7
Receivables 16.7 19.1
Inventories 15.1 13.0
Property, plant and equipment 77.8 77.6
Other assets 16.1 14.7
Total assets 134.5 129.1
Payables 19.3 14.6
Borrowings 26.0 20.1
Employee obligations 5.4 6.4
Total liabilities 50.8 41.1
Shareholders’ equity 83.7 88.0
Note: Totals may not add due to rounding
Strong balance sheet provides flexibility and liquidity.
Increase in debt to fund increased capital and working capital spend due to increase in rig utilisation.
Gearing (Net Debt/Equity) increased from 17.5% to 20.5%.
1.3 million SWK shares bought back at an average price of 22.0c.
Net tangible asset (NTA) per share decreased from 36.7c to 30.9c.
For
per
sona
l use
onl
y
Financial Performance
10FY17 Investor Presentation
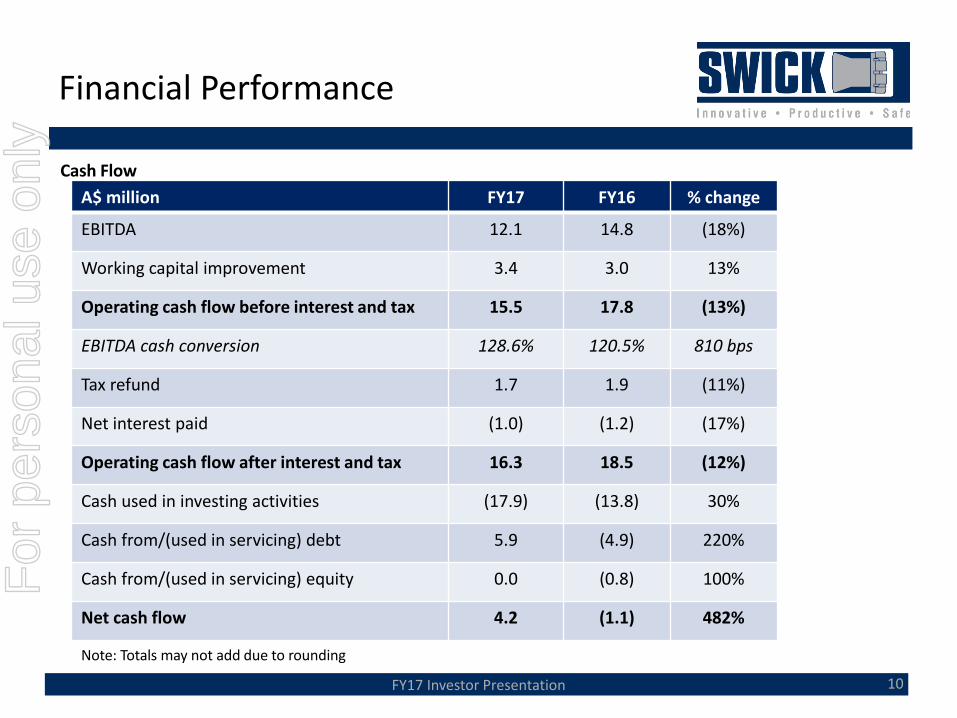
Cash FlowA$ million FY17 FY16 % change
EBITDA 12.1 14.8 (18%)
Working capital improvement 3.4 3.0 13%
Operating cash flow before interest and tax 15.5 17.8 (13%)
EBITDA cash conversion 128.6% 120.5% 810 bps
Tax refund 1.7 1.9 (11%)
Net interest paid (1.0) (1.2) (17%)
Operating cash flow after interest and tax 16.3 18.5 (12%)
Cash used in investing activities (17.9) (13.8) 30%
Cash from/(used in servicing) debt 5.9 (4.9) 220%
Cash from/(used in servicing) equity 0.0 (0.8) 100%
Net cash flow 4.2 (1.1) 482%
Note: Totals may not add due to rounding
For
per
sona
l use
onl
y
What Drives Swick as a Company
11FY17 Investor Presentation
Market Share of Australian Underground Coring Current market leader in Australia with significant upside potential
Market Leading Status in Underground Coring - Globally Operational Performance unmatched – Safety, Productivity, Quality, Reliability
Competitive Advantage continues to widen – technology, power, automation
Establishing new product offering in USA Developing underground RC capability to be interchangeable with UD feed rails on same rig (Multi Purpose)
Established in Nevada with opportunities in a world class mining district
Strategic Objective – Efficiency – More metres, less manning Metres per man-hour increasing, metres per shift increasing, costs per shift decreasing
Rates – appetite for production over costs Current sentiment is changing from lower costs to increased production, mining is becoming relevant to the market again
Swick is the most productive, professional and reliable of all underground coring contractors – plays to our strengths
Disruptive Technology – Orexplore Mineral Analysis Potential to disrupt mineral analysis technology and benefit every operating mine globally
For
per
sona
l use
onl
y
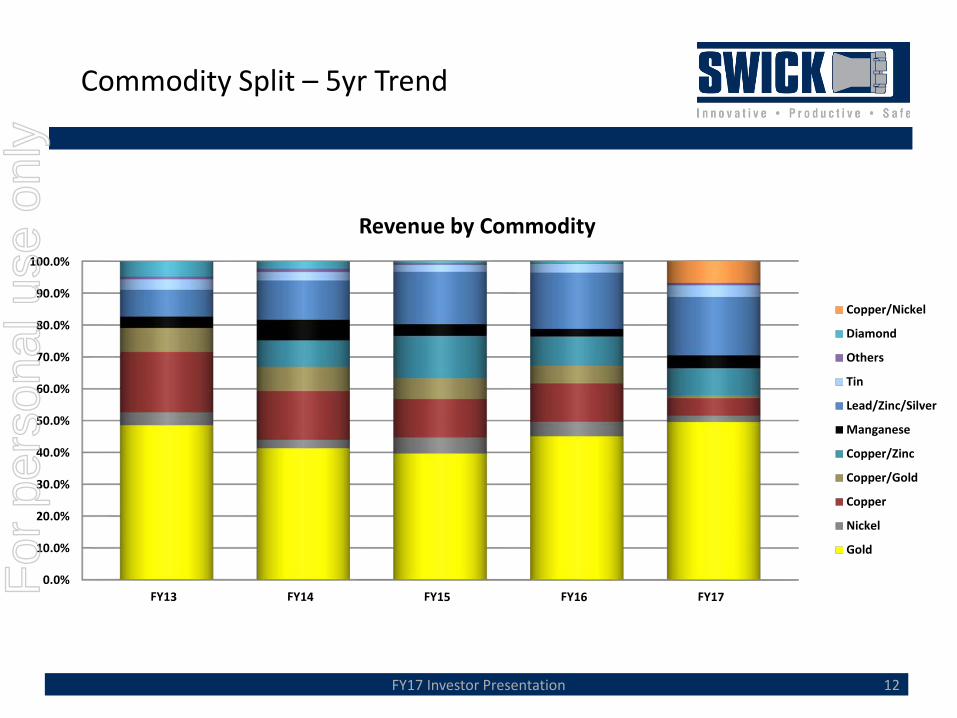
Commodity Split – 5yr Trend
12FY17 Investor Presentation
0.0%
10.0%
20.0%
30.0%
40.0%
50.0%
60.0%
70.0%
80.0%
90.0%
100.0%
Revenue by Commodity
Copper/Nickel
Diamond
Others
Tin
Lead/Zinc/Silver
Manganese
Copper/Zinc
Copper/Gold
Copper
Nickel
Gold
For
per
sona
l use
onl
y
Fleet Utilisation
13FY17 Investor Presentation
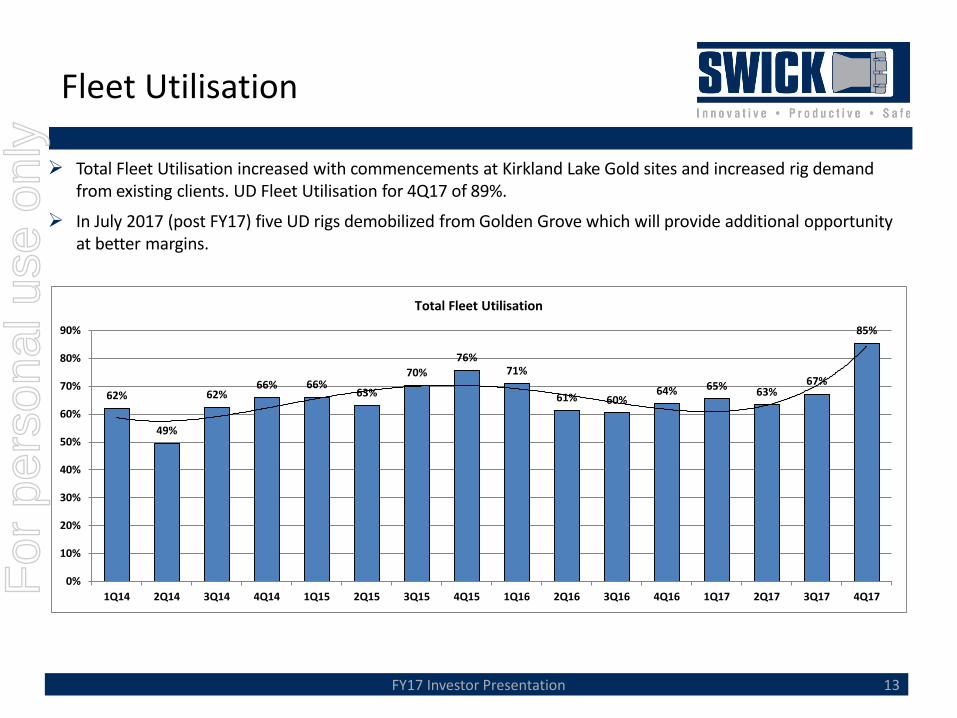
Total Fleet Utilisation increased with commencements at Kirkland Lake Gold sites and increased rig demand from existing clients. UD Fleet Utilisation for 4Q17 of 89%.
In July 2017 (post FY17) five UD rigs demobilized from Golden Grove which will provide additional opportunity at better margins.
62%
49%
62%66% 66%
63%
70%76%
71%
61% 60%64% 65% 63%
67%
85%
0%
10%
20%
30%
40%
50%
60%
70%
80%
90%
1Q14 2Q14 3Q14 4Q14 1Q15 2Q15 3Q15 4Q15 1Q16 2Q16 3Q16 4Q16 1Q17 2Q17 3Q17 4Q17
Total Fleet Utilisation
For
per
sona
l use
onl
y

UD APAC Productivity
14FY17 Investor Presentation
For
per
sona
l use
onl
y
Disruptive Technology– Orexplore AB
15FY17 Investor Presentation
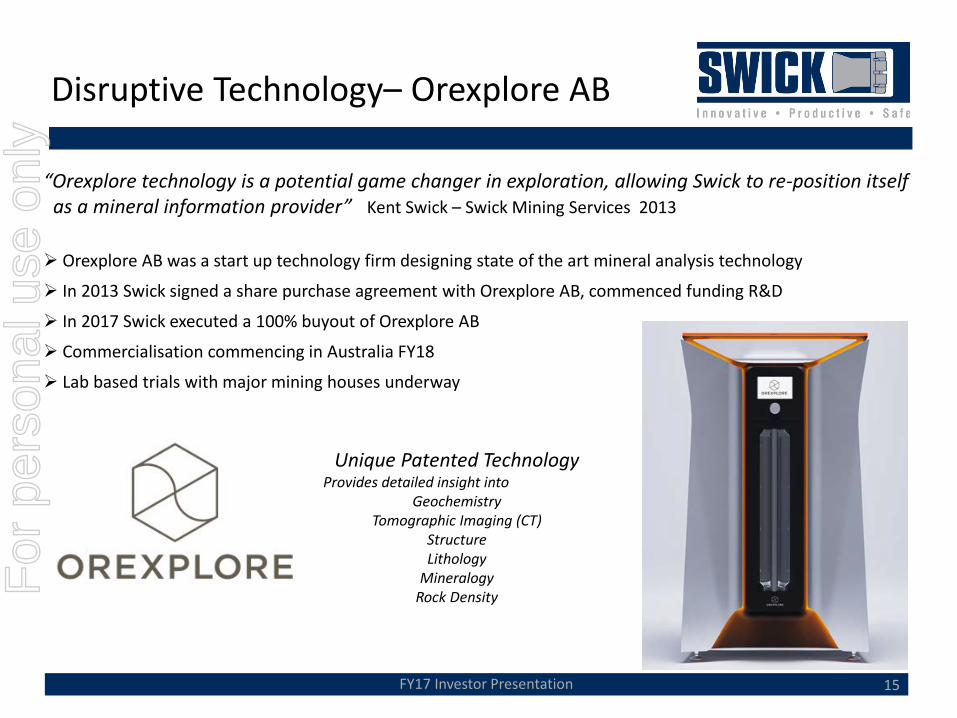
“Orexplore technology is a potential game changer in exploration, allowing Swick to re-position itself as a mineral information provider” Kent Swick – Swick Mining Services 2013
Orexplore AB was a start up technology firm designing state of the art mineral analysis technology
In 2013 Swick signed a share purchase agreement with Orexplore AB, commenced funding R&D
In 2017 Swick executed a 100% buyout of Orexplore AB
Commercialisation commencing in Australia FY18
Lab based trials with major mining houses underway
Unique Patented TechnologyProvides detailed insight into
GeochemistryTomographic Imaging (CT)
StructureLithology
MineralogyRock DensityF
or p
erso
nal u
se o
nly
Disruptive Technology – Orexplore
16FY17 Investor Presentation
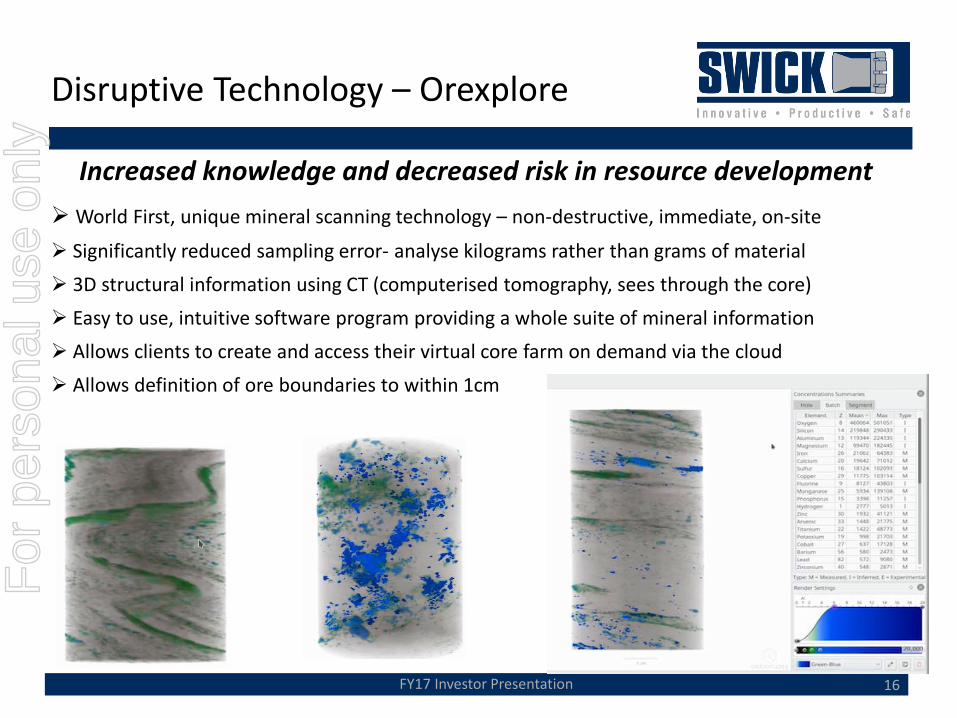
Increased knowledge and decreased risk in resource developmentWorld First, unique mineral scanning technology – non-destructive, immediate, on-site
Significantly reduced sampling error- analyse kilograms rather than grams of material 3D structural information using CT (computerised tomography, sees through the core) Easy to use, intuitive software program providing a whole suite of mineral information Allows clients to create and access their virtual core farm on demand via the cloud Allows definition of ore boundaries to within 1cm
For
per
sona
l use
onl
y
Potential for Shareholders
17FY17 Investor Presentation
Swick is a brownfield, operating mine supplier – limited downside to volume even in commodity price downturns
Large footprint of clients and sites (19) – heavily exposed to drilling budget rebounds
Technical leader in the space – automation, telemetry, safety and lower manning levels
Well managed through the worst mineral drilling downturn in living history
Strong Balance Sheet – cash generation and debt reduction through down cycle (net debt $17m)
Culture of innovation and desire to move up the value chain to being a mineral information provider
High potential from Orexplore mineral assay technology to materially benefit holders in medium term
FY18 mix of drilling income and rig utilisation rates will lead to increased profitability and cashflow
For
per
sona
l use
onl
y
Significant Items
18FY17 Investor Presentation
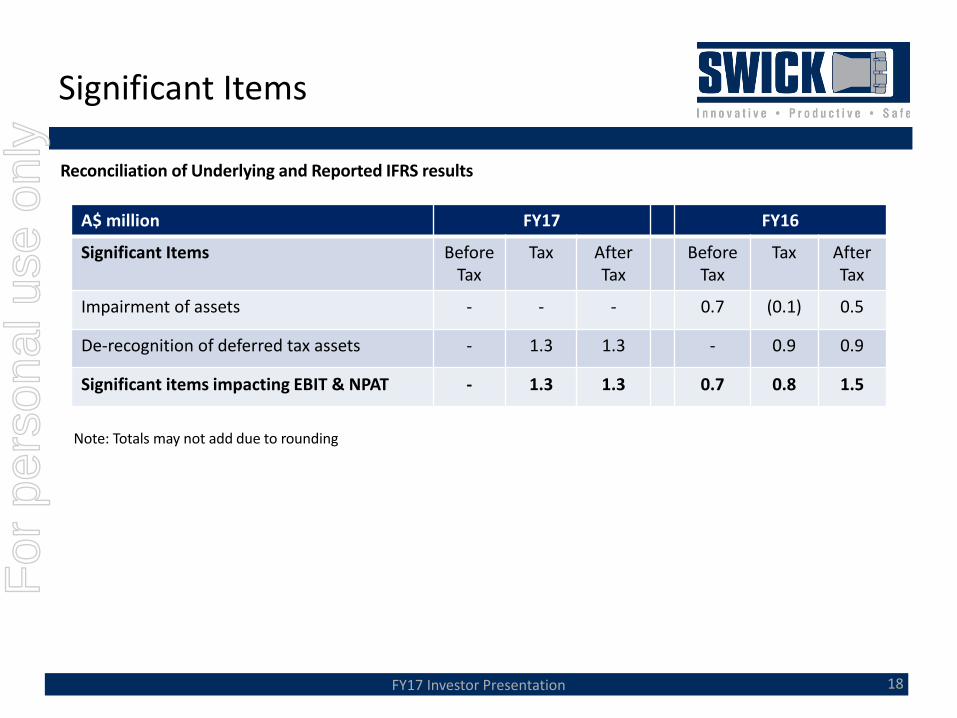
Reconciliation of Underlying and Reported IFRS results
A$ million FY17 FY16
Significant Items BeforeTax
Tax AfterTax
BeforeTax
Tax AfterTax
Impairment of assets - - - 0.7 (0.1) 0.5
De-recognition of deferred tax assets - 1.3 1.3 - 0.9 0.9
Significant items impacting EBIT & NPAT - 1.3 1.3 0.7 0.8 1.5
Note: Totals may not add due to rounding
For
per
sona
l use
onl
y
19
Thank You
FY17 Investor Presentation
For
per
sona
l use
onl
y