Embed Size (px)
Citation preview

S1
Supporting information for “Reaction mechanisms in
swelling clays under ionizing radiation: influence of the
water amount and of the nature of the clay”
M. Lainé,a E. Balan,b T. Allard,b E. Paineau,c P. Jeunesse,d M. Mostafavi,d J.-L. Robert,b S. Le
Caëra*
aLIONS, NIMBE, CEA, CNRS, Université Paris Saclay, CEA Saclay, F-91191 Gif-sur-
Yvette Cedex, France.
bIMPMC, Sorbonne Universities, UPMC, CNRS UMR-7590, MNHN, IRD, 4 Place Jussieu,
F-75252 Paris Cedex 05, France.
cLaboratoire de Physique des Solides, CNRS, Univ. Paris-Sud, Université Paris-Saclay, F-
91405 Orsay Cedex, France
dLaboratoire de Chimie Physique, CNRS/Université Paris-Sud, Bâtiment 349, F-91405
Orsay, France
*Corresponding author: [email protected]
Electronic Supplementary Material (ESI) for RSC Advances.This journal is © The Royal Society of Chemistry 2016
S2
SI-1: Infrared spectroscopy of synthetic montmorillonite and saponite
Infrared (IR) spectra were recorded in the 4000-500 cm-1 energy range with a Bruker Tensor
27 FT-IR spectrophotometer using the ATR (attenuated total reflectance) technique equipped
of a Golden Gate accessory with a diamond crystal. All the spectra were collected with a 4
cm-1 resolution from 100 scans and data were analyzed using the OPUS software. The
background (ambient atmosphere, no sample on the ATR accessory) was subtracted in all
cases. A standard correction of the ATR signal was performed by multiplying the ATR signal
by the corresponding wavenumber in order to take into account the variation of the
penetration depth of the evanescent wave into the sample.
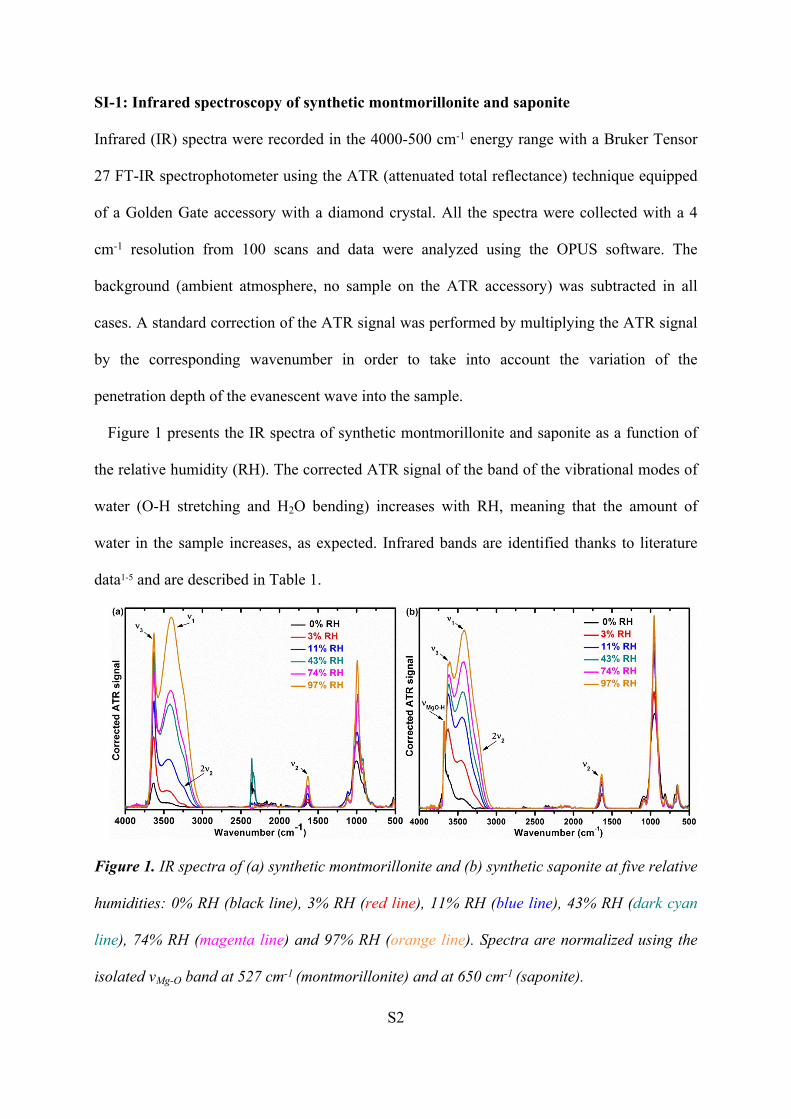
Figure 1 presents the IR spectra of synthetic montmorillonite and saponite as a function of
the relative humidity (RH). The corrected ATR signal of the band of the vibrational modes of
water (O-H stretching and H2O bending) increases with RH, meaning that the amount of
water in the sample increases, as expected. Infrared bands are identified thanks to literature
data1-5 and are described in Table 1.
Figure 1. IR spectra of (a) synthetic montmorillonite and (b) synthetic saponite at five relative
humidities: 0% RH (black line), 3% RH (red line), 11% RH (blue line), 43% RH (dark cyan
line), 74% RH (magenta line) and 97% RH (orange line). Spectra are normalized using the
isolated νMg-O band at 527 cm-1 (montmorillonite) and at 650 cm-1 (saponite).
S3
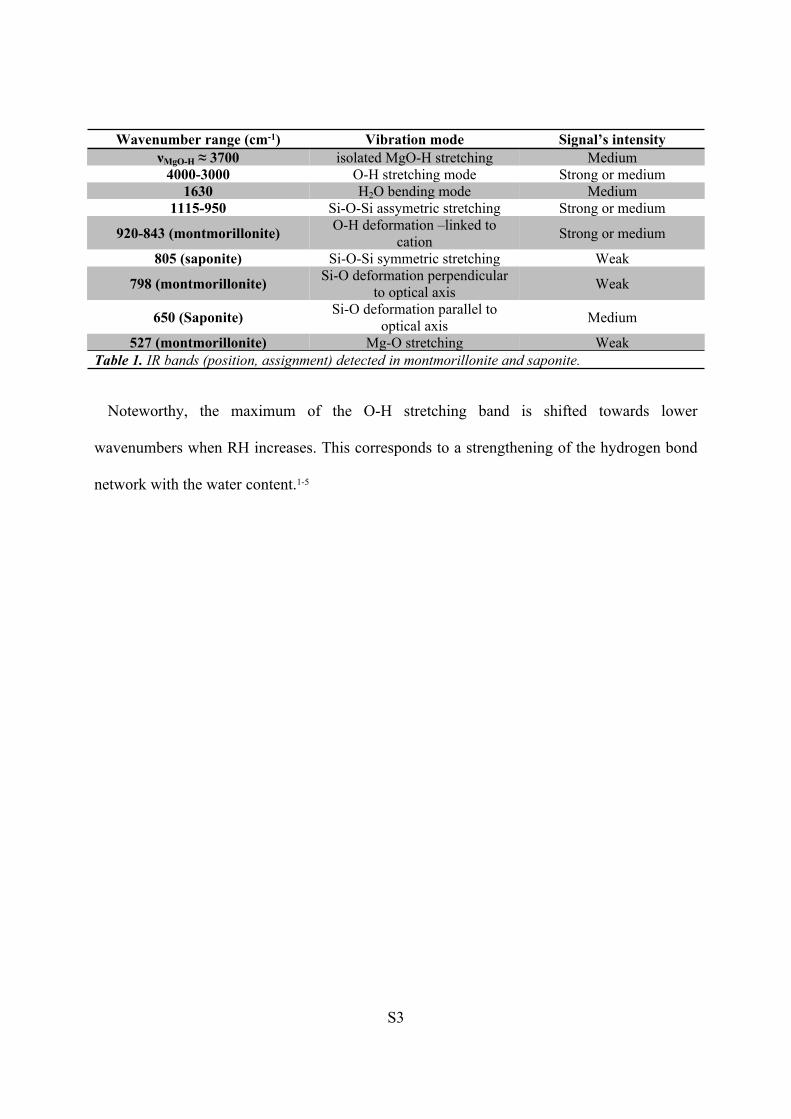
Wavenumber range (cm-1) Vibration mode Signal’s intensityνMgO-H ≈ 3700 isolated MgO-H stretching Medium
4000-3000 O-H stretching mode Strong or medium1630 H2O bending mode Medium
1115-950 Si-O-Si assymetric stretching Strong or medium
920-843 (montmorillonite) O-H deformation –linked to cation Strong or medium
805 (saponite) Si-O-Si symmetric stretching Weak
798 (montmorillonite) Si-O deformation perpendicular to optical axis Weak
650 (Saponite) Si-O deformation parallel to optical axis Medium
527 (montmorillonite) Mg-O stretching WeakTable 1. IR bands (position, assignment) detected in montmorillonite and saponite.
Noteworthy, the maximum of the O-H stretching band is shifted towards lower
wavenumbers when RH increases. This corresponds to a strengthening of the hydrogen bond
network with the water content.1-5
S4
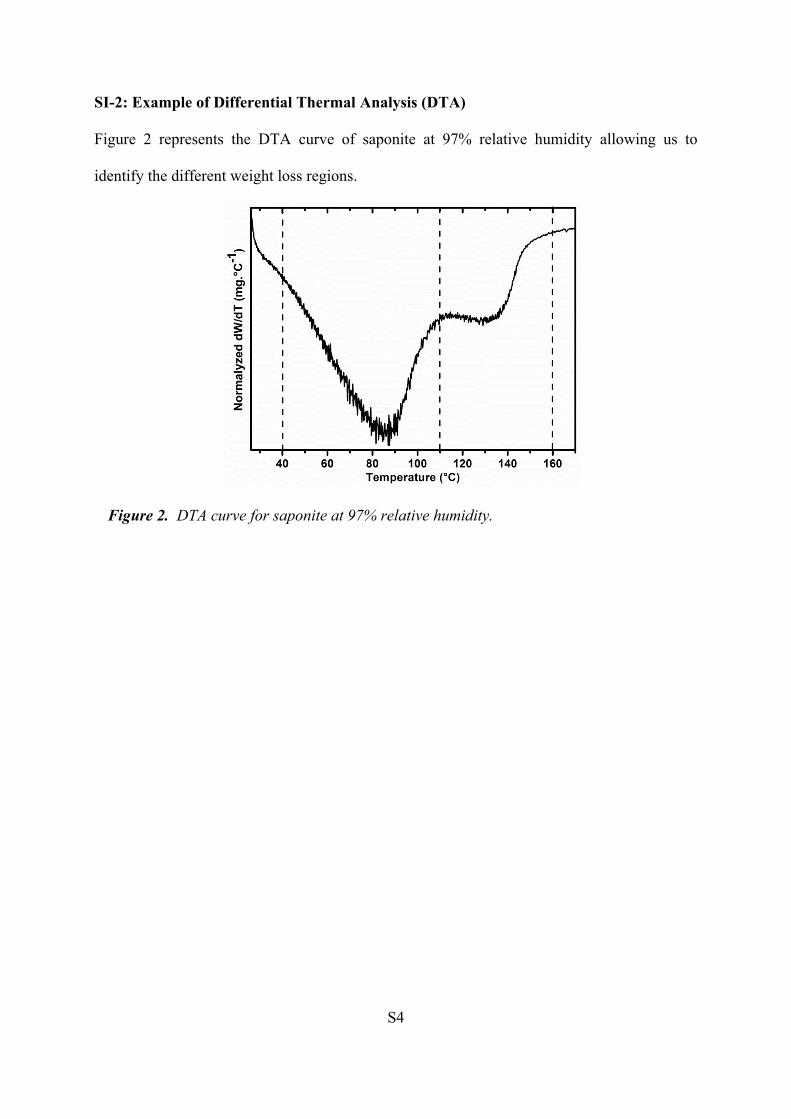
SI-2: Example of Differential Thermal Analysis (DTA)
Figure 2 represents the DTA curve of saponite at 97% relative humidity allowing us to
identify the different weight loss regions.
Figure 2. DTA curve for saponite at 97% relative humidity.
S5
SI-3: X-Ray Diffraction (XRD) of synthetic montmorillonite and saponite
A Bruker D8 Advance diffractometer equipped with a grazing parabolic Göbel mirror, a Cu
emitter (λCuKα = 1.541 Å, 40 kV/40 mA) and a Vantek detector (position sensitive detector)
was used to collect powder X-ray patterns of synthetic montmorillonite and saponite.
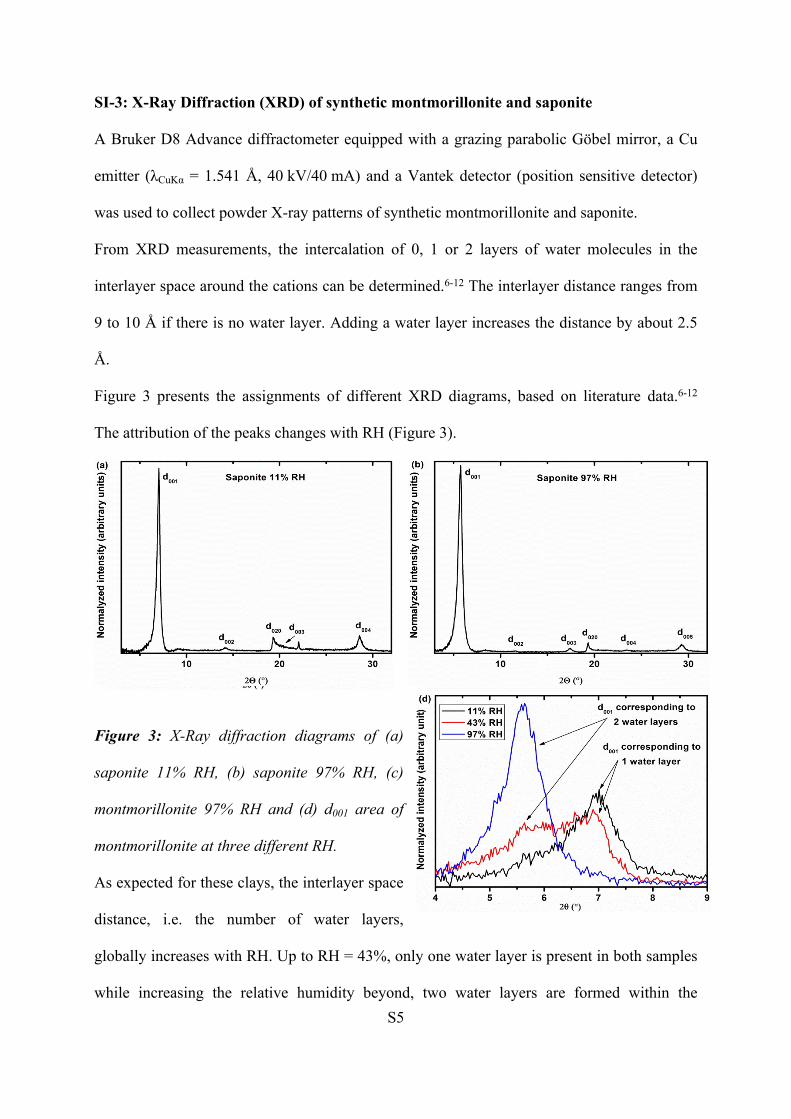
From XRD measurements, the intercalation of 0, 1 or 2 layers of water molecules in the
interlayer space around the cations can be determined.6-12 The interlayer distance ranges from
9 to 10 Å if there is no water layer. Adding a water layer increases the distance by about 2.5
Å.
Figure 3 presents the assignments of different XRD diagrams, based on literature data.6-12
The attribution of the peaks changes with RH (Figure 3).
Figure 3: X-Ray diffraction diagrams of (a)
saponite 11% RH, (b) saponite 97% RH, (c)
montmorillonite 97% RH and (d) d001 area of
montmorillonite at three different RH.
As expected for these clays, the interlayer space
distance, i.e. the number of water layers,
globally increases with RH. Up to RH = 43%, only one water layer is present in both samples
while increasing the relative humidity beyond, two water layers are formed within the

S6
interlayer space. The threshold of 43% RH is very particular for montmorillonite, as XRD
results evidence the coexistence of 1 and 2 water layers (Figure 3d).

S7
SI-4: Comparison of hydration of samples before and after irradiation
The influence of irradiation on the water content was monitored by TGA and XRD (Figures
4-5). All the results evidence that irradiation at a dose of 200 kGy has no influence on the
water content of the sample.
Figure 4. Total water content determined by TGA for non-irradiated (reference) and
irradiated (200 kGy) synthetic: montmorillonite (a) and saponite (b) as a function of RH.
Figure 5. d001 distance determined by XRD as a function of RH for non-irradiated (reference)
and irradiated (200 kGy) synthetic: (a) montmorillonite and (b) saponite.

S8
SI-5: Measurements of dihydrogen radiolytic yield
The cumulated H2 production as a function of the dose is presented in Figure 6 for synthetic
montmorillonite and saponite. The H2 production evolves linearly with the dose which
enables us to deduce the corresponding H2 radiolytic yield, expressed in mol.J-1, from the
slopes of the different lines.
Figure 6. Cumulated H2 production (symbols) for synthetic montmorillonite (a) and saponite
(b) as a function of the dose at six different relative humidities. The corresponding linear fits
are given.

S9
SI-6: Electron paramagnetic resonance (EPR) of synthetic saponite
Figure 7 presents EPR spectra at 90 K of synthetic saponite at three different RH.
Observations and conclusions are the same as in the case of montmorillonite.
Figure 7. EPR spectra of synthetic montmorillonite at (a) 0% RH, (b) 11% RH and (c) 97%
RH irradiated at 15 kGy. The spectra are recorded at 90 K. Effective experimental g-values
are given directly on the figure.

S10
References
1. J. E. Bertie, M. K. Ahmed and H. H. Eysel, J. Phys. Chem., 1989, 93, 2210-2218.2. J. L. Bishop, C. M. Pieters and J. O. Edwards, Clays Clay Miner., 1994, 42, 702-716.3. J. L. Robert and H. Kodama, Am. J. Sci., 1988, 288-A, 196-212.4. G. Sposito and R. Prost, Chem. Rev., 1982, 82, 553-573.5. W. Xu, C. T. Johnston, P. Parker and S. F. Agnew, Clays Clay Miner., 2000, 48, 120-131.6. G. W. Brindley and G. Brown, Crystal Structures of Clay Minerals and their X-Ray
Identification, Mineralogical Society of Great Britain and Ireland, 1980.7. E. Ferrage, B. Lanson, L. J. Michot and J.-L. Robert, J. Phys. Chem. C, 2010, 114, 4515-4526.8. E. Ferrage, B. Lanson, A. Sakharov Boris and A. Drits Victor, Am. Mineral., 2005, 90, 1358.9. E. Ferrage, B. A. Sakharov, L. J. Michot, A. Delville, A. Bauer, B. Lanson, S. Grangeon, G.
Frapper, M. Jiménez-Ruiz and G. J. Cuello, J. Phys. Chem. C, 2011, 115, 1867-1881.10. E. Ferrage, C. Tournassat, E. Rinnert and B. Lanson, Geochim. Cosmochim. Acta, 2005, 69,
2797-2812.11. M. S. Karmous, H. Ben Rhaiem, J. L. Robert, B. Lanson and A. Ben Haj Amara, Appl. Clay Sci.,
2009, 46, 43-50.12. M. S. Karmous and J. L. Robert, Bull. Mater. Sci., 2011, 34, 1263-1266.