Embed Size (px)
Citation preview

Swedish Real Estate Market 2015FEDESSA Swedish Self Storage Association Conference September 3, 2015
FEDESSA | Cushman & Wakefield
More money than ever targeting European and Nordic CRE
Investors are still more risk-averse than previous cyclical peak
Need for new products and markets to satisfy investment targets
Investment themes Transaction market characteristics
FEDESSA | Cushman & Wakefield
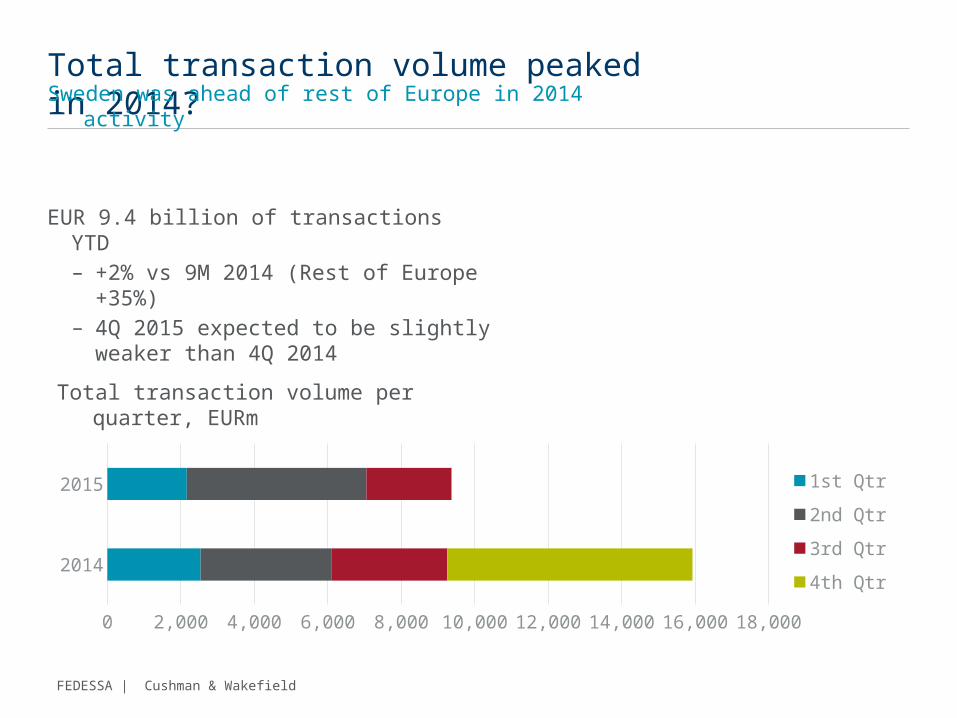
EUR 9.4 billion of transactions YTD– +2% vs 9M 2014 (Rest of Europe +35%)– 4Q 2015 expected to be slightly weaker
than 4Q 2014
2014
2015
0 2,000 4,000 6,000 8,000 10,000 12,000 14,000 16,000 18,000
1st Qtr
2nd Qtr
3rd Qtr
4th Qtr
Total transaction volume per quarter, EURm
Total transaction volume peaked in 2014?Sweden was ahead of rest of Europe in 2014 activity
FEDESSA | Cushman & Wakefield
RETAIL
OFFICEIN-
DUS-TRIAL
HOS-PITAL-
ITY
RESI-DENTIAL
LAND
OTHER
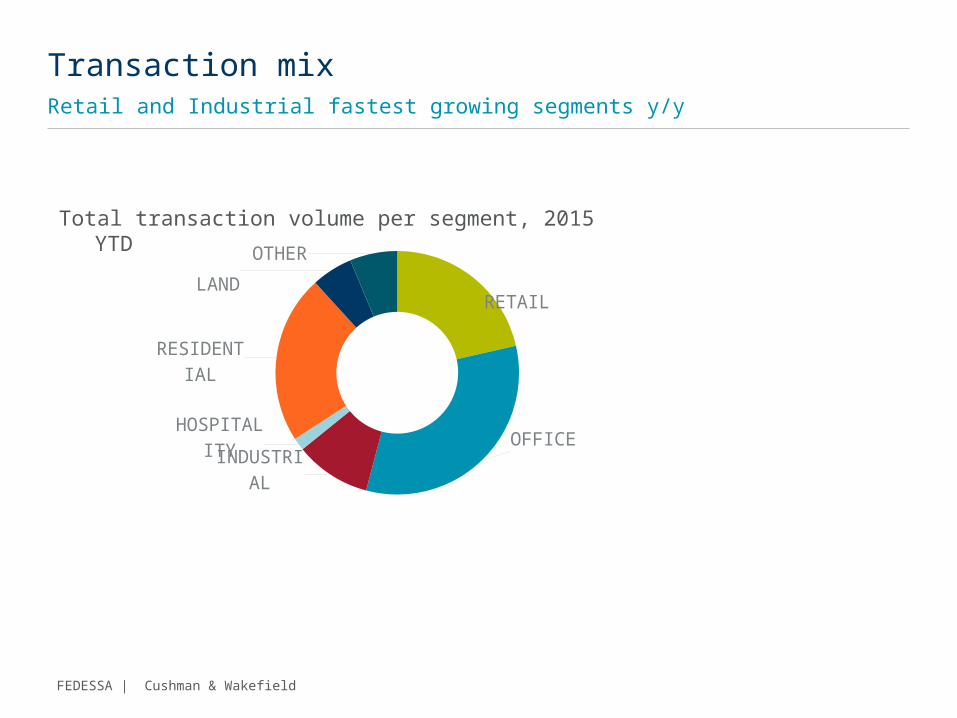
Total transaction volume per segment, 2015 YTD
Transaction mix Retail and Industrial fastest growing segments y/y
FEDESSA | Cushman & Wakefield
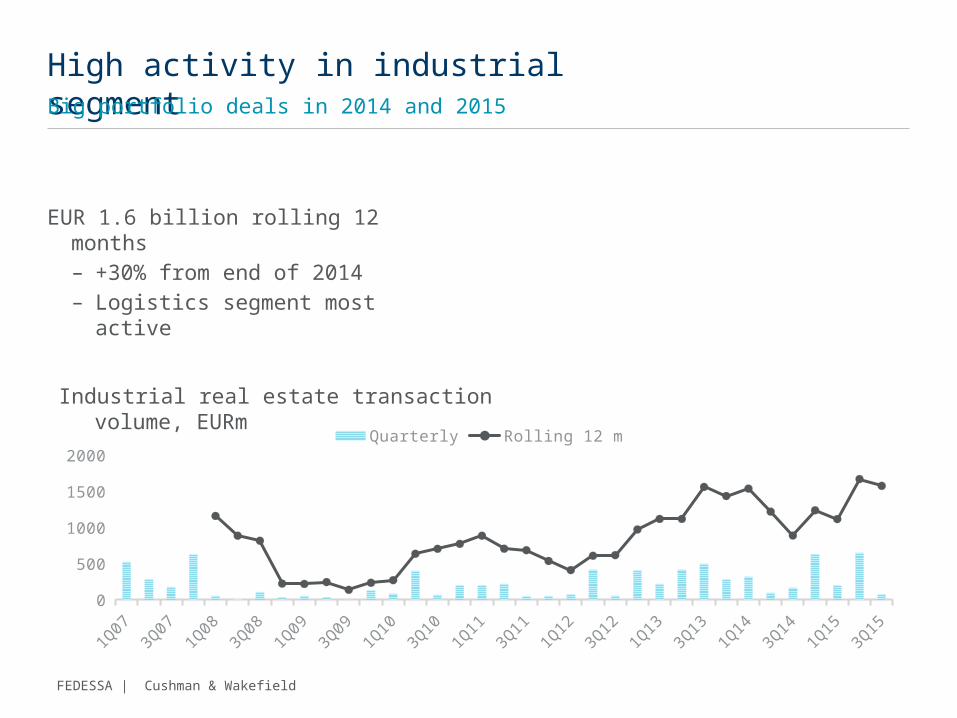
EUR 1.6 billion rolling 12 months– +30% from end of 2014– Logistics segment most active
High activity in industrial segment Big portfolio deals in 2014 and 2015
Industrial real estate transaction volume, EURm
1Q07
3Q07
1Q08
3Q08
1Q09
3Q09
1Q10
3Q10
1Q11
3Q11
1Q12
3Q12
1Q13
3Q13
1Q14
3Q14
1Q15
3Q15
0200400600800
10001200140016001800
Quarterly Rolling 12 m
FEDESSA | Cushman & Wakefield
Real estate transaction volume in Europe totaled EUR 135 billion in the first half of 2015
European comparisonSweden and Stockholm top 5 most liquid market in last ten years
Sweden accounted for 5.2 percent of the European total
Stockholm dropped from 5th busiest transaction market in 2014 to 10th in 2015
FEDESSA | Cushman & Wakefield
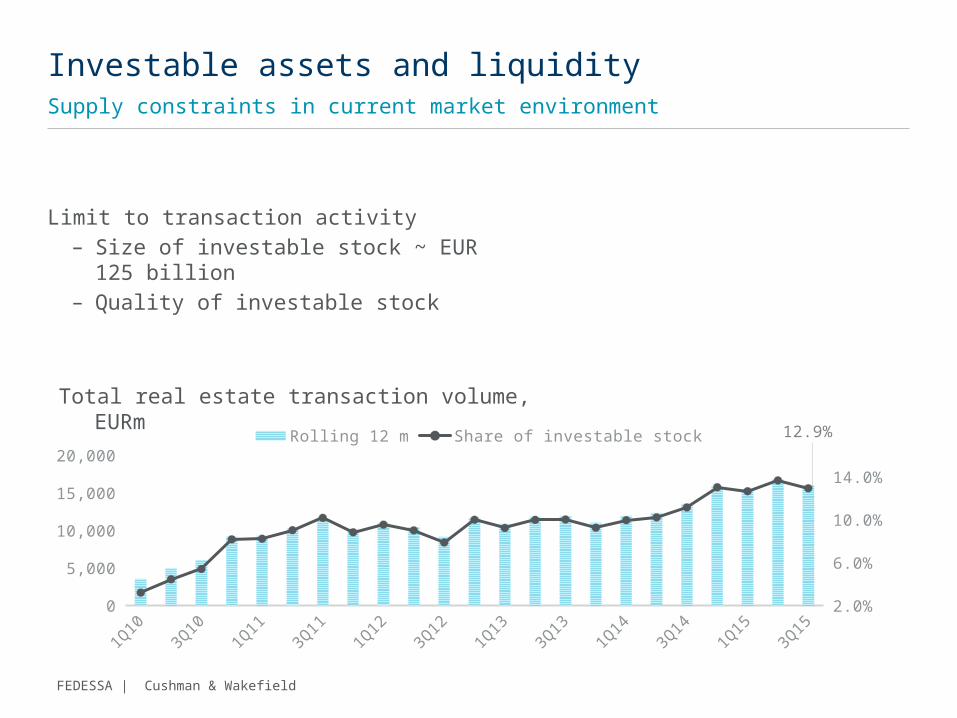
Limit to transaction activity– Size of investable stock ~ EUR 125 billion– Quality of investable stock
Investable assets and liquiditySupply constraints in current market environment
Total real estate transaction volume, EURm
1Q10
2Q10
3Q10
4Q10
1Q11
2Q11
3Q11
4Q11
1Q12
2Q12
3Q12
4Q12
1Q13
2Q13
3Q13
4Q13
1Q14
2Q14
3Q14
4Q14
1Q15
2Q15
3Q15
02,0004,0006,0008,000
10,00012,00014,00016,00018,000
2.0%
4.0%
6.0%
8.0%
10.0%
12.0%
14.0%
16.0%12.9%Rolling 12 m Share of investable stock
FEDESSA | Cushman & Wakefield
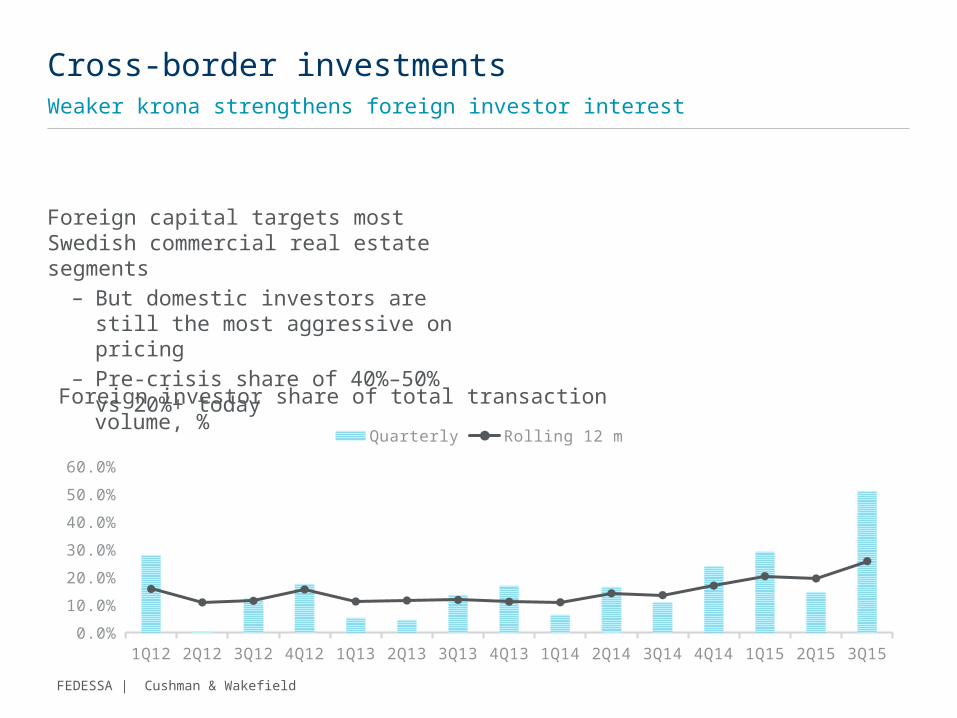
Foreign capital targets most Swedish commercial real estate segments
– But domestic investors are still the most aggressive on pricing
– Pre-crisis share of 40%–50% vs 20%+ today
Cross-border investmentsWeaker krona strengthens foreign investor interest
Foreign investor share of total transaction volume, %
1Q12 2Q12 3Q12 4Q12 1Q13 2Q13 3Q13 4Q13 1Q14 2Q14 3Q14 4Q14 1Q15 2Q15 3Q150.0%
10.0%
20.0%
30.0%
40.0%
50.0%
60.0%
Quarterly Rolling 12 m
FEDESSA | Cushman & Wakefield
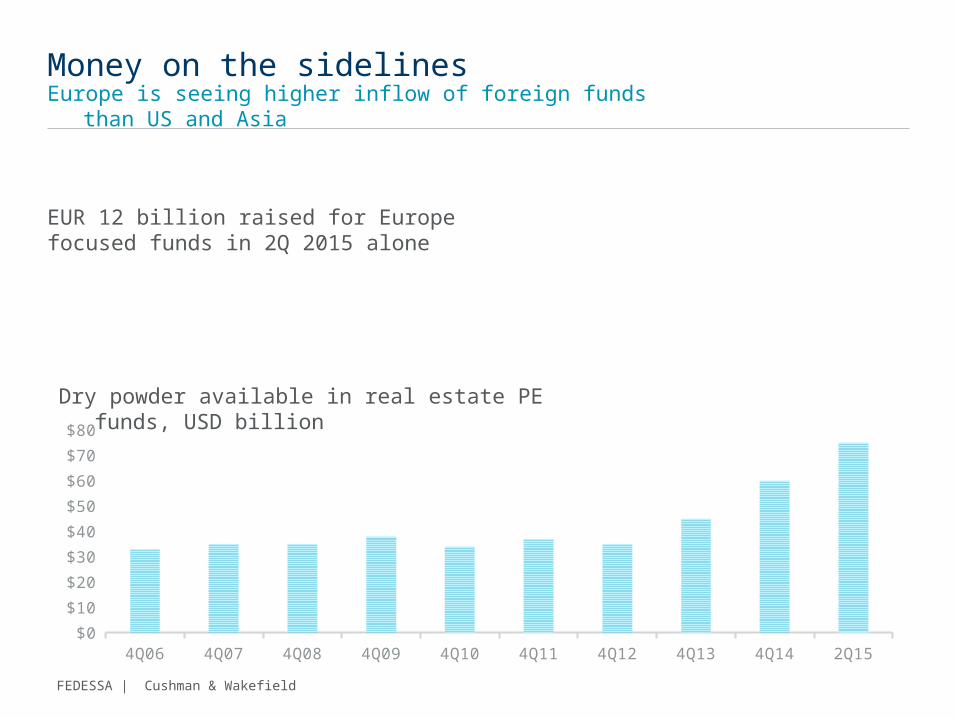
EUR 12 billion raised for Europe focused funds in 2Q 2015 alone
Money on the sidelinesEurope is seeing higher inflow of foreign funds than US and Asia
Dry powder available in real estate PE funds, USD billion
4Q06 4Q07 4Q08 4Q09 4Q10 4Q11 4Q12 4Q13 4Q14 2Q15$0
$10
$20
$30
$40
$50
$60
$70
$80
FEDESSA | Cushman & Wakefield
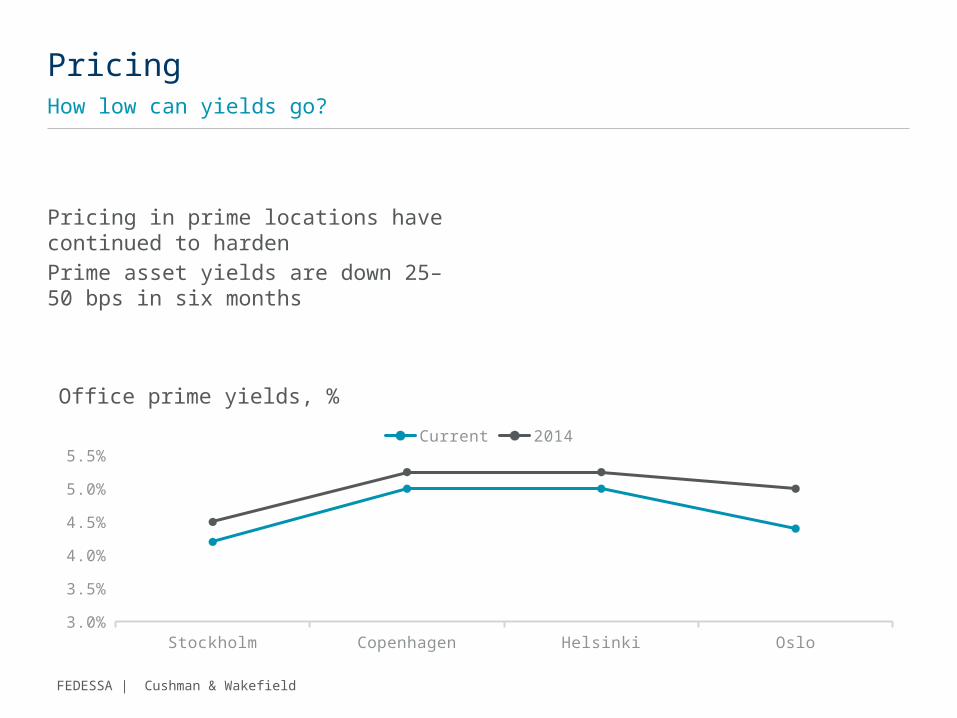
Pricing in prime locations have continued to harden
Prime asset yields are down 25–50 bps in six months
PricingHow low can yields go?
Office prime yields, %
Stockholm Copenhagen Helsinki Oslo3.0%
3.5%
4.0%
4.5%
5.0%
5.5%
Current 2014
FEDESSA | Cushman & Wakefield
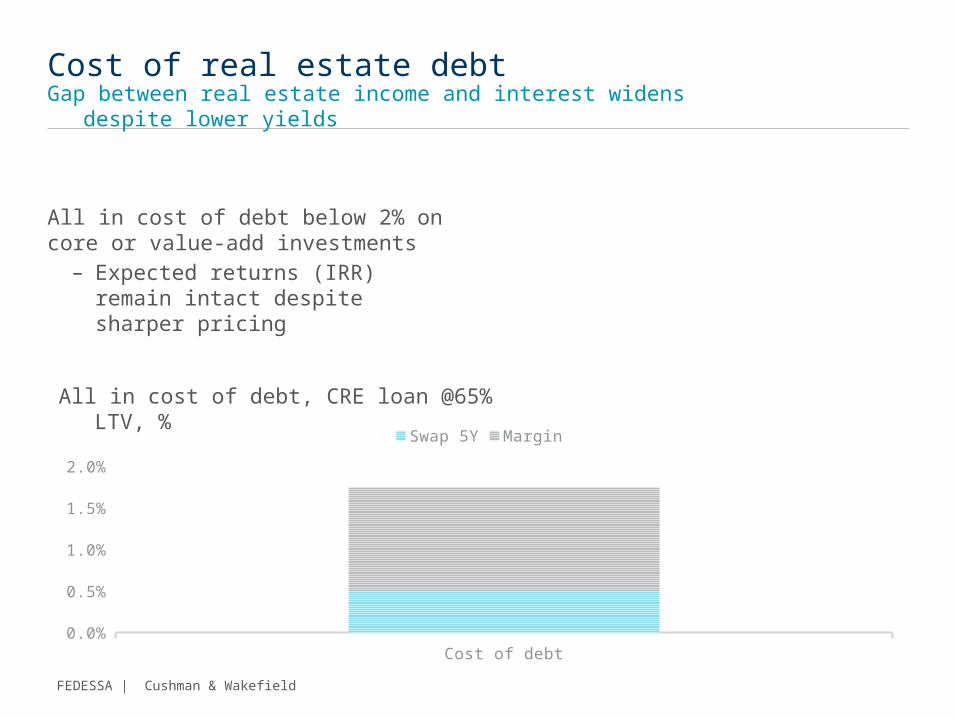
Cost of real estate debtGap between real estate income and interest widens despite lower yields
All in cost of debt, CRE loan @65% LTV, %
Cost of debt0.0%0.2%0.4%0.6%0.8%1.0%1.2%1.4%1.6%1.8%2.0%
Swap 5Y Margin
All in cost of debt below 2% on core or value-add investments
– Expected returns (IRR) remain intact despite sharper pricing
FEDESSA | Cushman & Wakefield
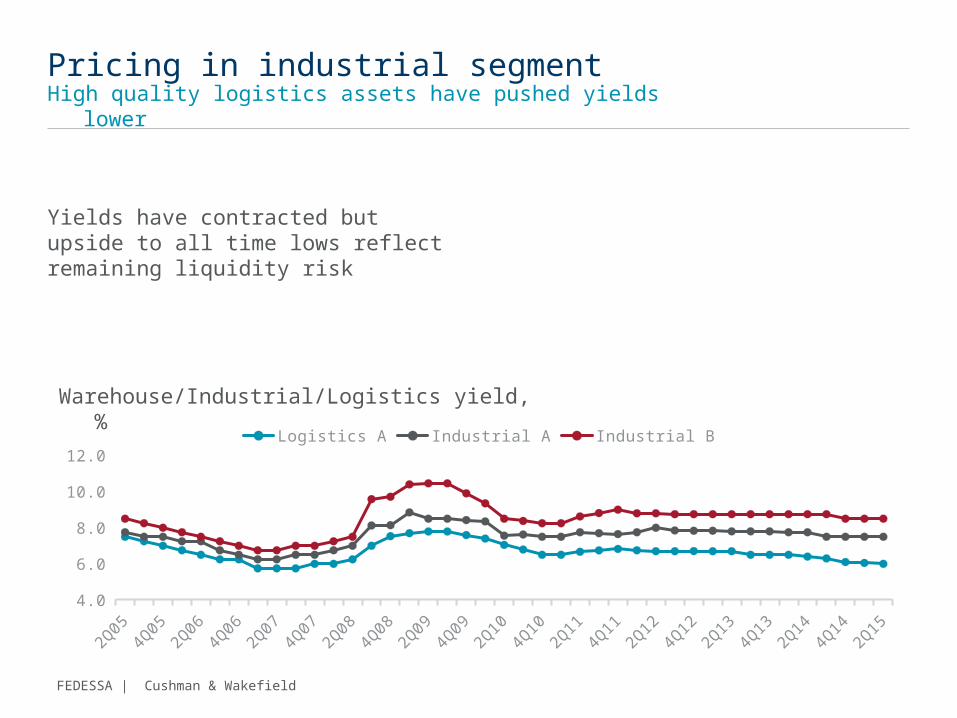
Yields have contracted but upside to all time lows reflect remaining liquidity risk
Pricing in industrial segmentHigh quality logistics assets have pushed yields lower
Warehouse/Industrial/Logistics yield, %
2Q05
4Q05
2Q06
4Q06
2Q07
4Q07
2Q08
4Q08
2Q09
4Q09
2Q10
4Q10
2Q11
4Q11
2Q12
4Q12
2Q13
4Q13
2Q14
4Q14
2Q15
4.05.06.07.08.09.0
10.011.012.0
Logistics A Industrial A Industrial B
FEDESSA | Cushman & Wakefield
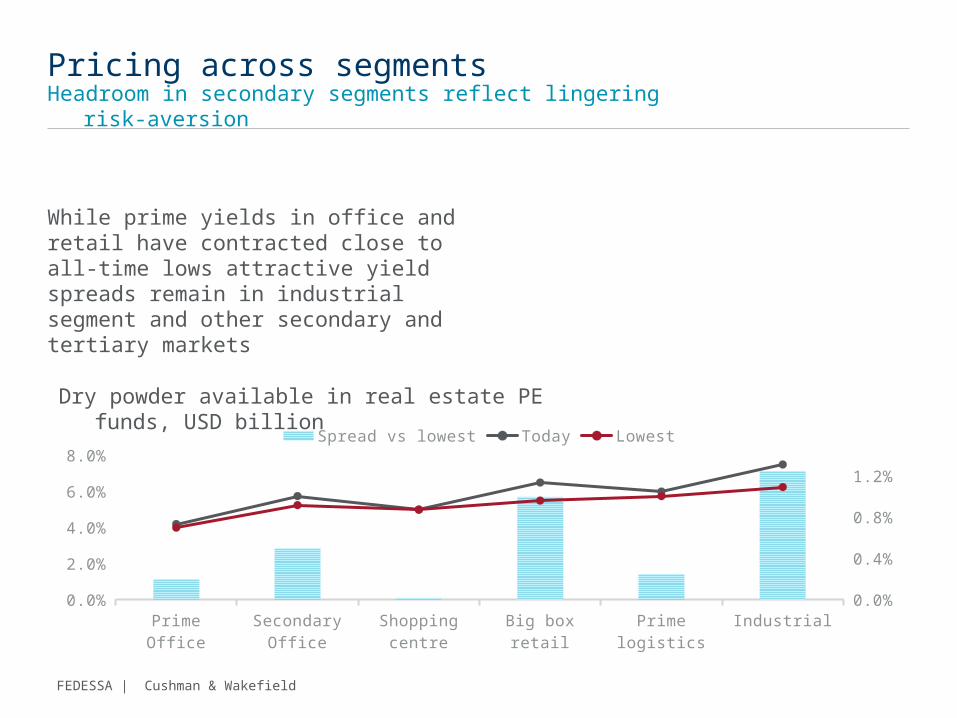
While prime yields in office and retail have contracted close to all-time lows attractive yield spreads remain in industrial segment and other secondary and tertiary markets
Pricing across segmentsHeadroom in secondary segments reflect lingering risk-aversion
Dry powder available in real estate PE funds, USD billion
Prime Office Secondary Office Shopping centre Big box retail Prime logistics Industrial0.0%
1.0%
2.0%
3.0%
4.0%
5.0%
6.0%
7.0%
8.0%
0.0%
0.2%
0.4%
0.6%
0.8%
1.0%
1.2%
1.4%
Spread vs lowest Today Lowest
FEDESSA | Cushman & Wakefield
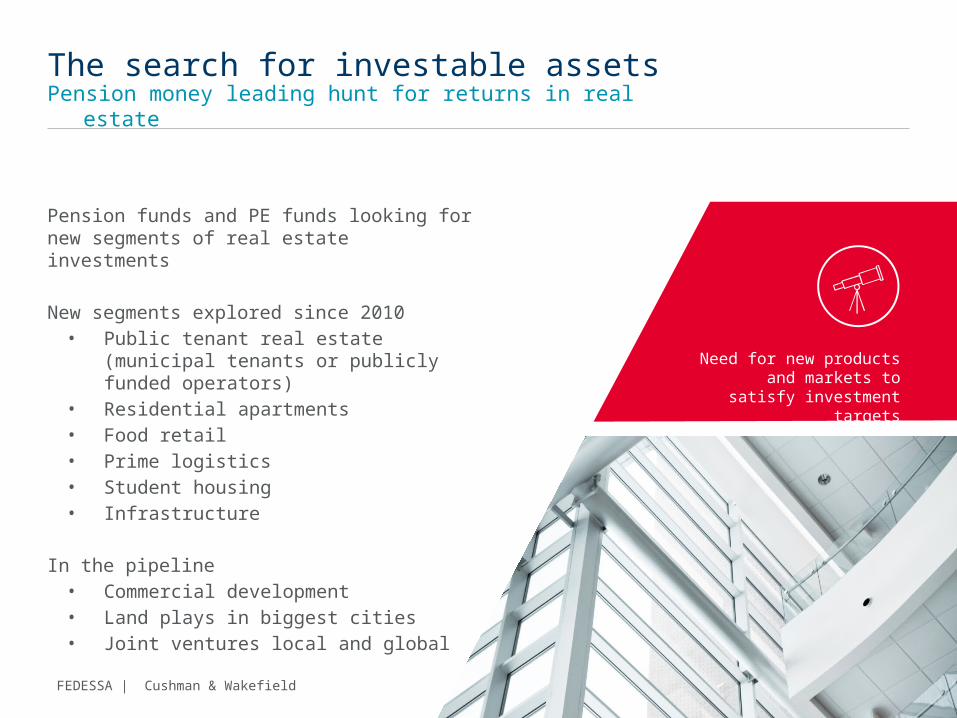
Need for new products and markets to satisfy
investment targets
The search for investable assetsPension money leading hunt for returns in real estate
Pension funds and PE funds looking for new segments of real estate investments
New segments explored since 2010• Public tenant real estate (municipal tenants
or publicly funded operators)• Residential apartments• Food retail• Prime logistics• Student housing• Infrastructure
In the pipeline• Commercial development• Land plays in biggest cities• Joint ventures local and global
FEDESSA | Cushman & Wakefield
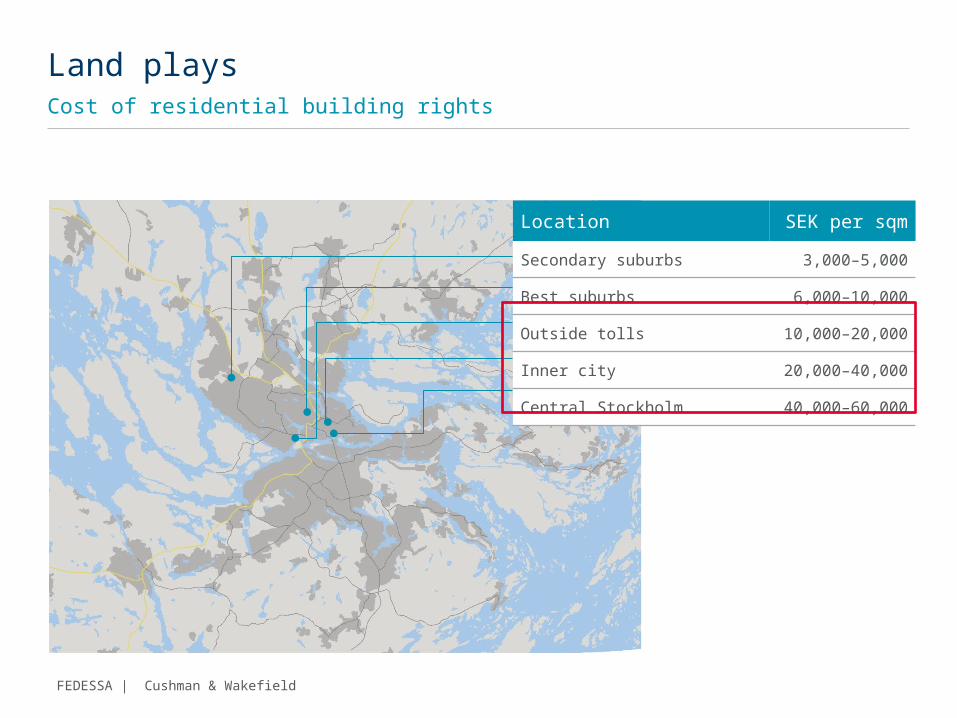
Land playsCost of residential building rights
Location SEK per sqm
Secondary suburbs 3,000–5,000
Best suburbs 6,000–10,000
Outside tolls 10,000–20,000
Inner city 20,000–40,000
Central Stockholm 40,000–60,000
FEDESSA | Cushman & Wakefield
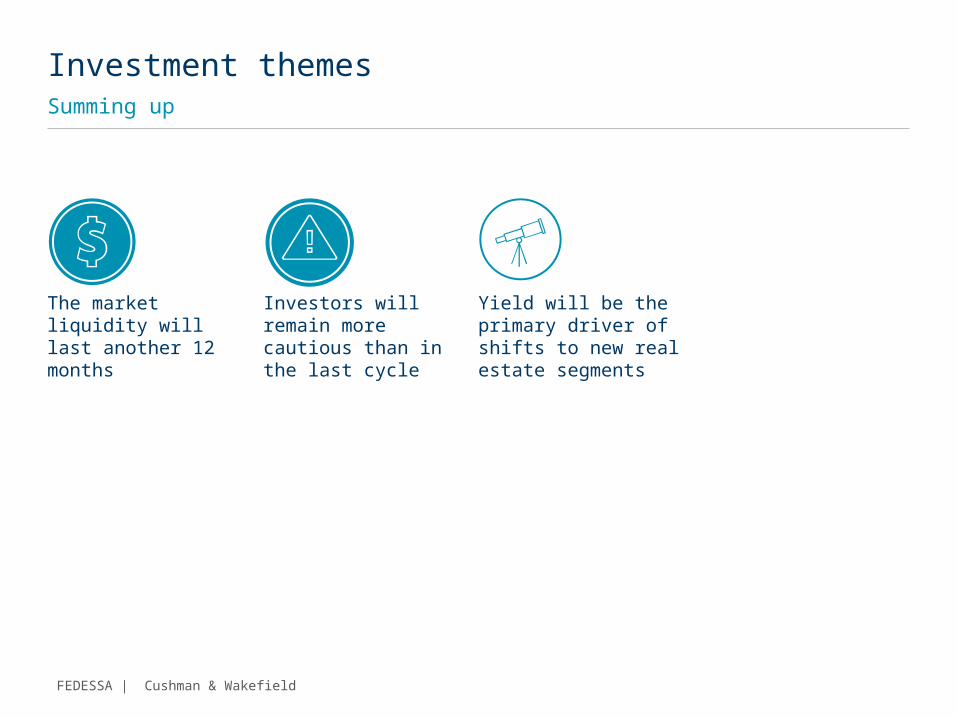
The market liquidity will last another 12 months
Investors will remain more cautious than in the last cycle
Yield will be the primary driver of shifts to new real estate segments
Investment themes Summing up

SELF STORAGE SECTORREAL ESTATE OVERVIEW
OLIVER CLOSESEPTEMBER 2015
19
Agenda
MARKET STATUS – MAJOR SELF STORAGE REITS
TRANSACTIONS
PROPERTY VALUATIONS
DRIVERS OF VALUE
SUMMARY & CONCLUSIONS

20
Market Status
US REITS
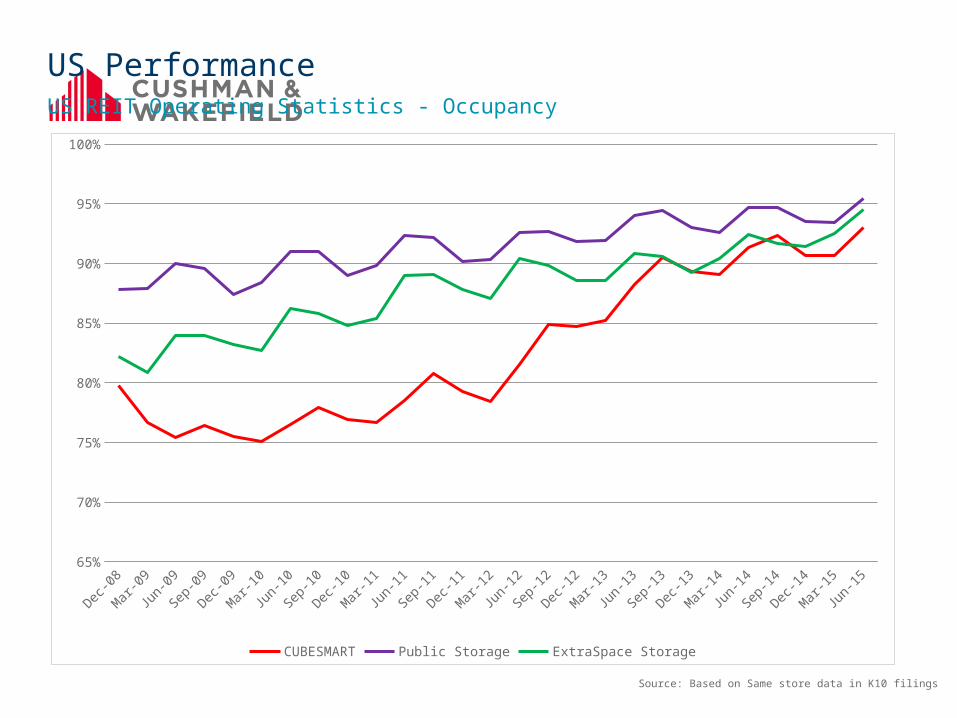
US PerformanceUS REIT Operating Statistics - Occupancy
Dec-0
8
Mar
-09
Jun-
09
Sep-0
9
Dec-0
9
Mar
-10
Jun-
10
Sep-1
0
Dec-1
0
Mar
-11
Jun-
11
Sep-1
1
Dec-1
1
Mar
-12
Jun-
12
Sep-1
2
Dec-1
2
Mar
-13
Jun-
13
Sep-1
3
Dec-1
3
Mar
-14
Jun-
14
Sep-1
4
Dec-1
4
Mar
-15
Jun-
1565%
70%
75%
80%
85%
90%
95%
100%
CUBESMART Public Storage ExtraSpace Storage
Source: Based on Same store data in K10 filings
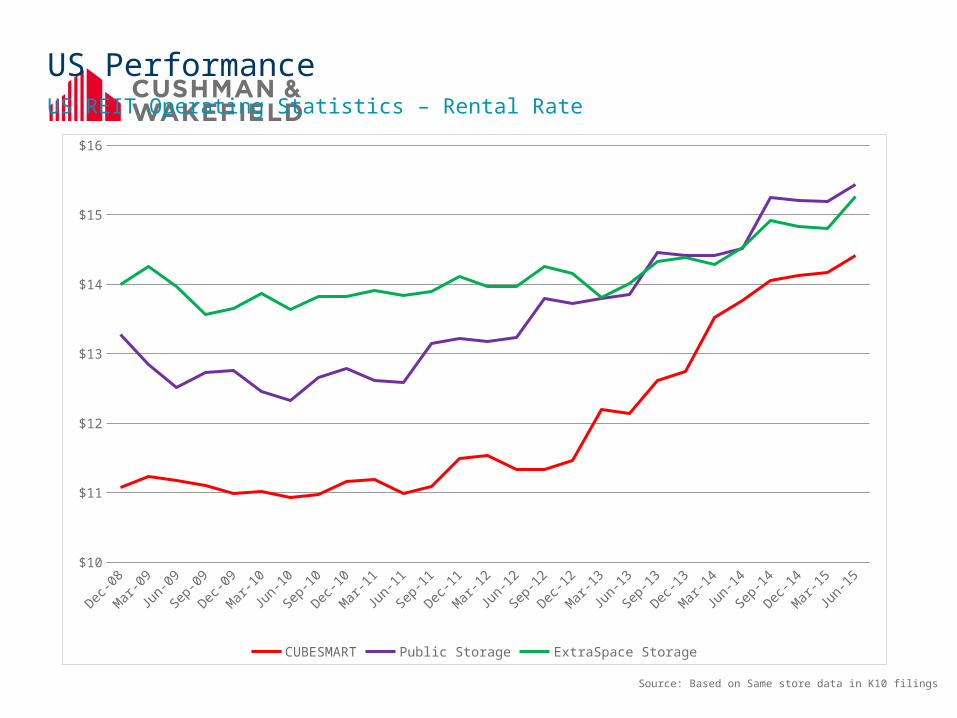
US PerformanceUS REIT Operating Statistics – Rental Rate
Dec-0
8
Mar
-09
Jun-
09
Sep-0
9
Dec-0
9
Mar
-10
Jun-
10
Sep-1
0
Dec-1
0
Mar
-11
Jun-
11
Sep-1
1
Dec-1
1
Mar
-12
Jun-
12
Sep-1
2
Dec-1
2
Mar
-13
Jun-
13
Sep-1
3
Dec-1
3
Mar
-14
Jun-
14
Sep-1
4
Dec-1
4
Mar
-15
Jun-
15$10
$11
$12
$13
$14
$15
$16
CUBESMART Public Storage ExtraSpace Storage
Source: Based on Same store data in K10 filings
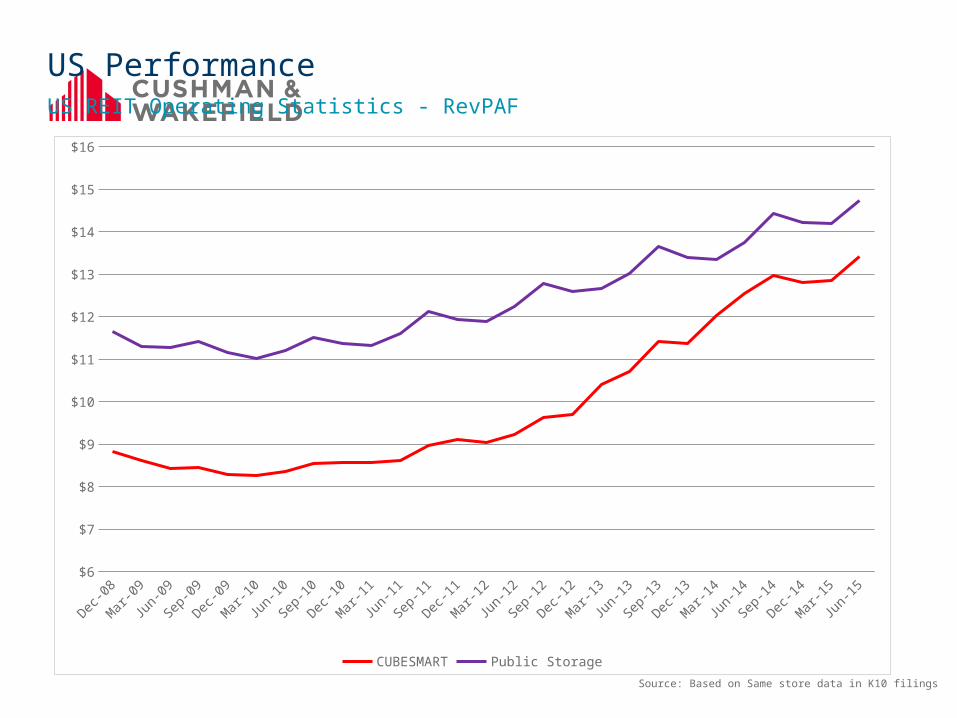
US PerformanceUS REIT Operating Statistics - RevPAF
Source: Based on Same store data in K10 filings
Dec-0
8
Mar
-09
Jun-
09
Sep-0
9
Dec-0
9
Mar
-10
Jun-
10
Sep-1
0
Dec-1
0
Mar
-11
Jun-
11
Sep-1
1
Dec-1
1
Mar
-12
Jun-
12
Sep-1
2
Dec-1
2
Mar
-13
Jun-
13
Sep-1
3
Dec-1
3
Mar
-14
Jun-
14
Sep-1
4
Dec-1
4
Mar
-15
Jun-
15$6
$7
$8
$9
$10
$11
$12
$13
$14
$15
$16
CUBESMART Public Storage
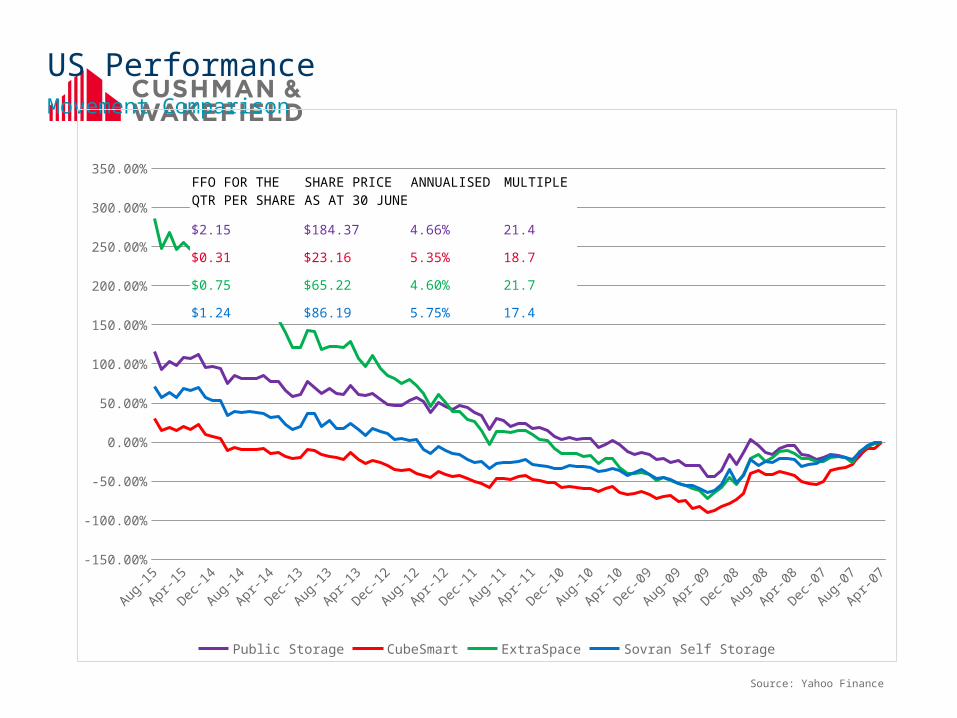
US PerformanceMovement Comparison
Source: Yahoo Finance
Apr-0
7
Jul-0
7
Oct-0
7
Jan-
08
Apr-0
8
Jul-0
8
Oct-0
8
Jan-
09
Apr-0
9
Jul-0
9
Oct-0
9
Jan-
10
Apr-1
0
Jul-1
0
Oct-1
0
Jan-
11
Apr-1
1
Jul-1
1
Oct-1
1
Jan-
12
Apr-1
2
Jul-1
2
Oct-1
2
Jan-
13
Apr-1
3
Jul-1
3
Oct-1
3
Jan-
14
Apr-1
4
Jul-1
4
Oct-1
4
Jan-
15
Apr-1
5
Jul-1
5-150.00%
-100.00%
-50.00%
0.00%
50.00%
100.00%
150.00%
200.00%
250.00%
300.00%
350.00%
Public Storage CubeSmart ExtraSpace Sovran Self Storage
FFO FOR THE QTR PER SHARE
SHARE PRICE AS AT 30 JUNE
ANNUALISED MULTIPLE
$2.15 $184.37 4.66% 21.4
$0.31 $23.16 5.35% 18.7
$0.75 $65.22 4.60% 21.7
$1.24 $86.19 5.75% 17.4

25
Market Status
EUROPE
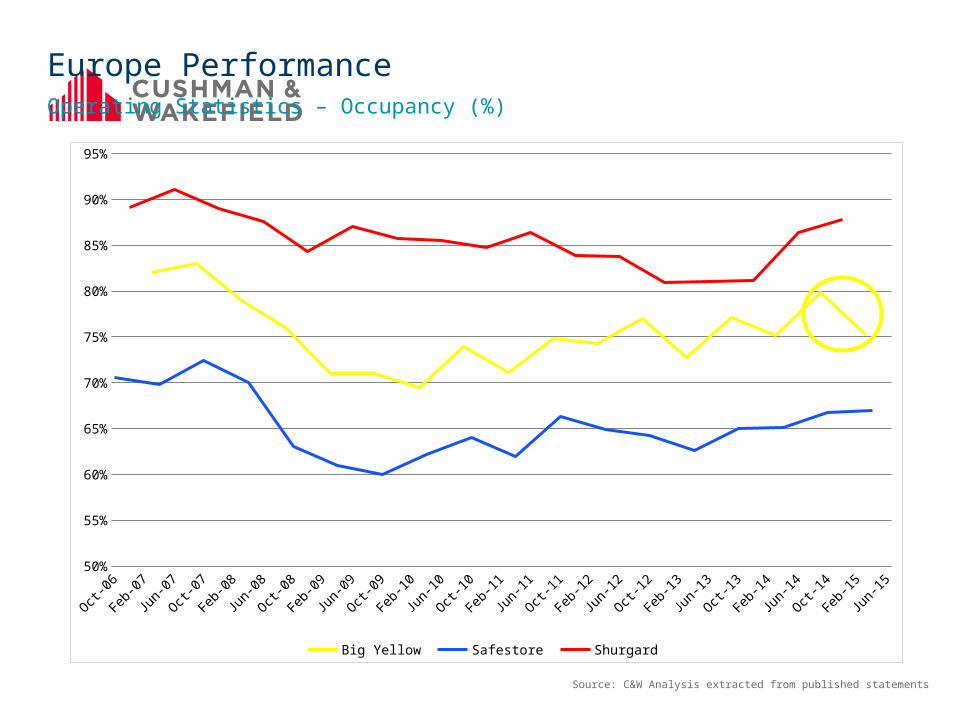
Europe PerformanceOperating Statistics – Occupancy (%)
Source: C&W Analysis extracted from published statements
Oct-0
6
Dec-0
6
Apr-0
7
Jul-0
7
Sep-
07
Dec-0
7
Mar-0
8
Jun-
08
Sep-
08
Dec-0
8
Mar-0
9
Jun-
09
Sep-
09
Dec-0
9
Mar-1
0
Jun-
10
Sep-
10
Dec-1
0
Mar-1
1
Jun-
11
Sep-
11
Dec-1
1
Mar-1
2
Jun-
12
Sep-
12
Dec-1
2
Mar-1
3
Jun-
13
Sep-
13
Dec-1
3
Mar-1
4
Jun-
14
Sep-
14
Dec-1
4
Mar-1
550%
55%
60%
65%
70%
75%
80%
85%
90%
95%
Big Yellow Safestore Shurgard

Europe PerformanceOperating Statistics – Rental Rate (Mixed Currency)
Source: C&W Analysis extracted from published statements
Oct-0
6
Dec-0
6
Mar-0
7
Jun-
07
Sep-
07
Nov-0
7
Feb-
08
May-0
8
Aug-0
8
Oct-0
8
Jan-
09
Apr-0
9
Jul-0
9
Sep-
09
Dec-0
9
Mar-1
0
Jun-
10
Aug-1
0
Nov-1
0
Feb-
11
May-1
1
Jul-1
1
Oct-1
1
Jan-
12
Apr-1
2
Jul-1
2
Sep-
12
Dec-1
2
Mar-1
3
Jun-
13
Aug-1
3
Nov-1
3
Feb-
14
May-1
4
Jul-1
4
Oct-1
4
Jan-
15
Apr-1
514
16
18
20
22
24
26
28
30
Big Yellow (£/ Sq ft) Safestore (£/ Sq ft) Shurgard (€/ Sq ft)
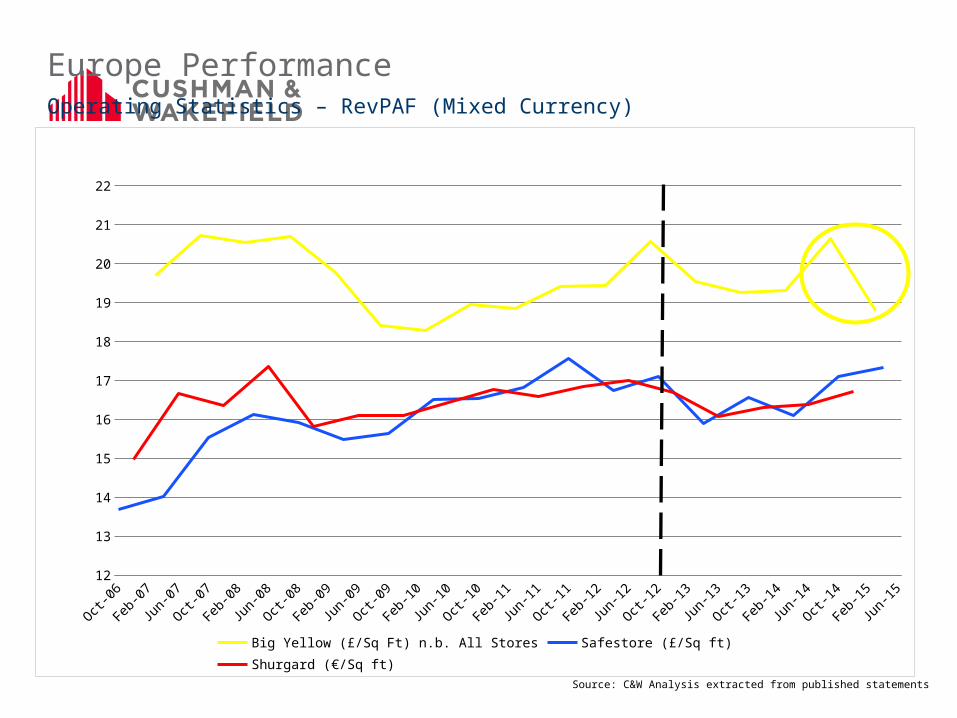
Europe PerformanceOperating Statistics – RevPAF (Mixed Currency)
Source: C&W Analysis extracted from published statements
Oct-0
6
Dec-0
6
Apr-0
7
Jul-0
7
Sep-
07
Dec-0
7
Mar-0
8
Jun-
08
Sep-
08
Dec-0
8
Mar-0
9
Jun-
09
Sep-
09
Dec-0
9
Mar-1
0
Jun-
10
Sep-
10
Dec-1
0
Mar-1
1
Jun-
11
Sep-
11
Dec-1
1
Mar-1
2
Jun-
12
Sep-
12
Dec-1
2
Mar-1
3
Jun-
13
Sep-
13
Dec-1
3
Mar-1
4
Jun-
14
Sep-
14
Dec-1
4
Mar-1
512
13
14
15
16
17
18
19
20
21
22
Big Yellow (£/Sq Ft) n.b. All Stores Safestore (£/Sq ft) Shurgard (€/Sq ft)
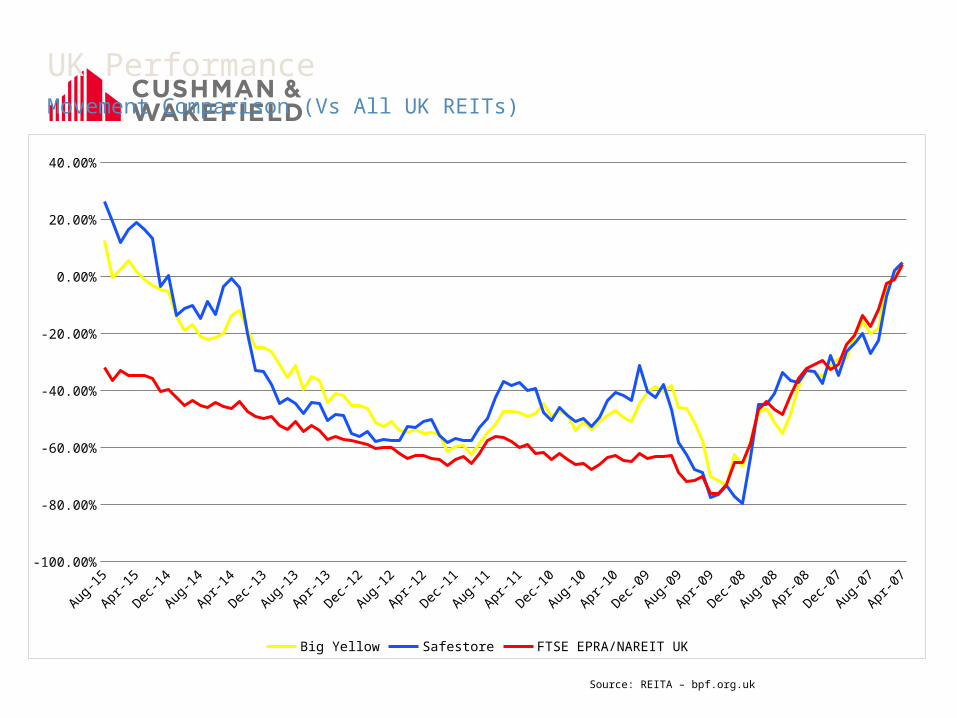
UK PerformanceMovement Comparison (Vs All UK REITs)
Source: REITA – bpf.org.uk
Apr-0
7
Jul-0
7
Oct-0
7
Jan-
08
Apr-0
8
Jul-0
8
Oct-0
8
Jan-
09
Apr-0
9
Jul-0
9
Oct-0
9
Jan-
10
Apr-1
0
Jul-1
0
Oct-1
0
Jan-
11
Apr-1
1
Jul-1
1
Oct-1
1
Jan-
12
Apr-1
2
Jul-1
2
Oct-1
2
Jan-
13
Apr-1
3
Jul-1
3
Oct-1
3
Jan-
14
Apr-1
4
Jul-1
4
Oct-1
4
Jan-
15
Apr-1
5
Jul-1
5-100.00%
-80.00%
-60.00%
-40.00%
-20.00%
0.00%
20.00%
40.00%
Big Yellow Safestore FTSE EPRA/NAREIT UK

30
Supply

Supply ComparisonBubble graph 2: EU - selected countries
0 50 100 150 200 250 300 3500
100,000
200,000
300,000
400,000
500,000
600,000
700,000
800,000
900,000
1,000,000
0
0
0
0
0
0
0
0
0
Source: FEDESSA
UKNUMBER OF FACILITIES - 975TOTAL SQ M - 3,200,000SQ M PER PERSON – 0.05

32
Transactions
DEAL OR NO DEAL?
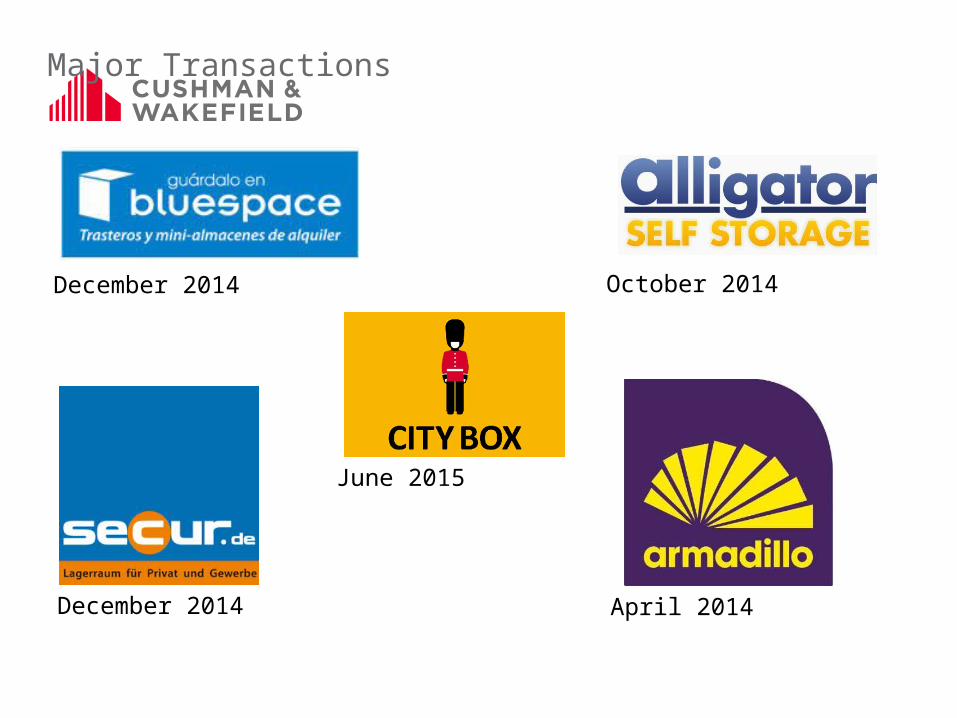
Major Transactions
December 2014
April 2014December 2014
October 2014
June 2015

Transactions – a problem?

35
Valuation Approach• DCF Valuations• Analysis of the trading data• Model set up and process• Freehold -v- Leasehold• Capitalisation rate• Portfolio analysis
Principal Drivers of ValueCashflow
• REVENUE – THE BIG 5 DRIVERS
• MLA
• Stable occupancy assumption
• Fill rate
• Rental rate
• Additional income
• OPERATING COSTS
• RENT, MANAGEMENT FEES & CAPITAL RESERVES
Principal Drivers of ValueCapitalisation
• LOCATION
• BUILDING & PROMINENCE
• TENURE
• GEARING
• TRACK RECORD
• ABSORBTION RISK
• GROWTH AND DISCOUNT RATE
• RESULTING RETURNS ANALYSIS
Principal Drivers of ValueOther
• PROPERTY SELECTION & STRATEGY
• PORTFOLIO PREMIUM
• ALTERNATIVE USE POTENTIAL
• LEASE RE-GEARS ETC
• MARKET CYCLE
• HOLD PERIOD

39
Q & A

OLIVER CLOSE
PARTNER, VALUATION & ADVISORY
43/45 Portman Square
London
W1A 3BG
+44 (0)20 7152 5156