Embed Size (px)
Citation preview
SVENSKA KRAFTNÄT SWEDISH NATIONAL GRID
February 14*, 2014 2014/228
Swedish Interconnectors COMP Case No 39351
Monitoring Report No 10

Introduction This report is submitted to comply with section 5 (Monitoring provisions) of Svenska kraftnät' s Commitments (26 January 2010) under Artide 9 of Council Regulation No. 1/2003 in connection with the European Commission investigation in Case COMP/39351 - Swedish Interconnectors. The Commitments were adopted and made binding by decision of the Commission on 14 April 2010. Regarding this, Svenska kraftnät would like to emphasize that that we are monitoring the development of the European Network Codes continuously and how they will reläte to our Commitment.
The report is prepared in good faith and aims at providing any information the Commission may need in order to judge whether Svenska kraftnät is proceeding in accordance with the Commitments. Additional information can be provided to the Commission upon request.
In accordance with what was stated in last (ninth) monitoring report this tenth monitoring report has been submitted before 14 February 2014.
In order to have sufficient time for proper assessments (in line with what is stated in the Commitment) and internal processes the next (eleventh) monitoring report will be submitted by 13 February 2015 at latest, covering the whole year of 2014.
Svenska kraftnät confirms that the report does not contain any confidential information and may be freely distributed to third parties.
Sundbyberg, February 14* 2014
^m Mikael Odeiroerg

Table of Contents
i Capacities and prices after introduction of bidding zones 7
1.1 2013 Qi 7 1.1.1 Allocation of trading capacity 8 1.1.2 Comments on each interconnector 12
1.2 2013 Q2 14 1.2.1 Allocation of trading capacity 15 1.2.2 Comments on each interconnector 19
1.3 2013Q3 21
1.3.1 Allocation of trading capacity 22 1.3.2 Comments on each interconnector 26
1.4 2013 Q4 2& 1.4.1 Allocation of trading capacity 29 1.4.2 Comments on each interconnector 33
Appendix A - 2 0 1 3 Qi 35
Appendix B - 2013 Q2 42
Appendix C - 2013 Q3 49
Appendix D - 2013 Q4 55

i Capacities and prices after introduction of bidding zones
As committed, Svenska kraftnät has subdivided the Swedish part of the Nordic electricity märket into several bidding zones and the Swedish Transmission System is operated on this basis since November i, 2011. Congestion in the Swedish Transmission System, with exception of Congestion in the West Coast Corridor, is generally managed without limiting Trading Capacity on Interconnectors. This can be seen in subsequent chapters, and is particularly evident in Table 3, Table 8, Table 13 and Table 18.
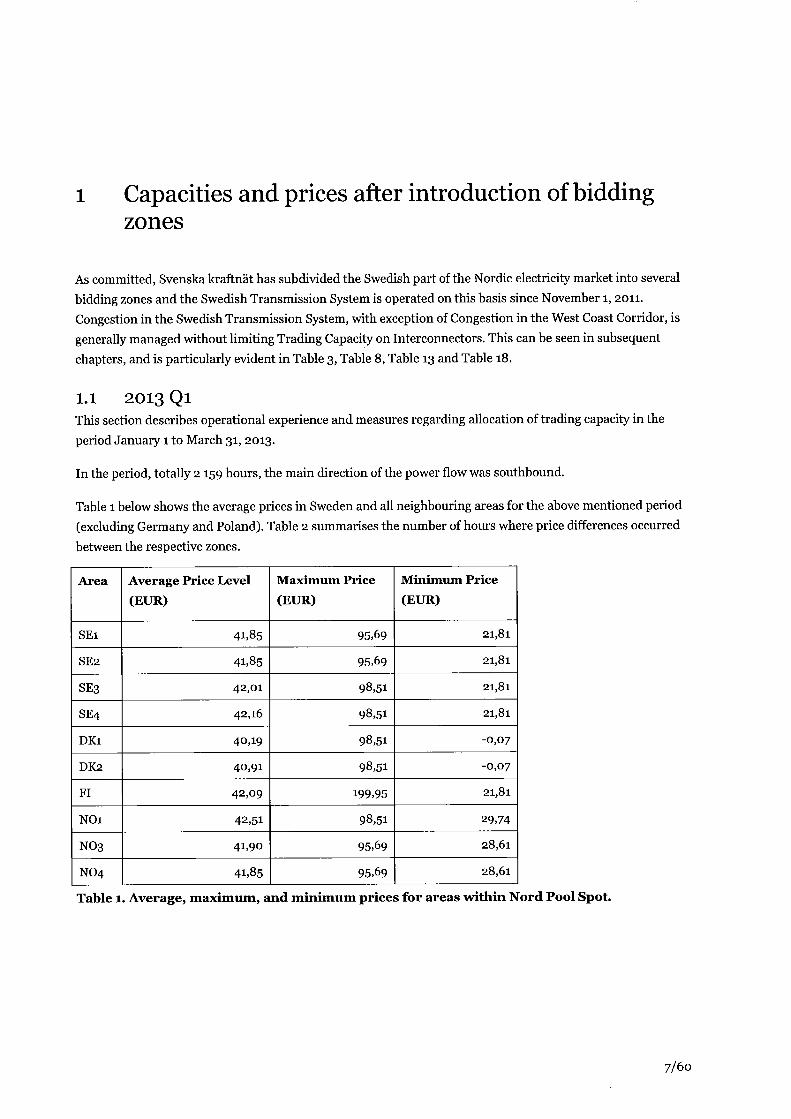
1.1 2013 Qi This section describes operational experience and measures regarding allocation of trading capacity in the period January 1 to March 31, 2013.
In the period, totally 2 159 hours, the main direction of the power flow was southbound.
Table 1 below shows the average prices in Sweden and all neighbouring areas for the above mentioned period (excluding Germany and Poland). Table 2 summarises the number of hours where price differences occurred between the respective zones.
Area
SEi
SE2
SE3
SE4
DKi
DK2
Fl
NOi
NO3
NO4
Average Price Level
(EUR)
41,85
41,85
42,01
42,16
40,19
40,91
42,09
42,51
41,90
41,85
Maximum Price
(EUR)
95,69
95,69
98,51
98,51
98,51
98,51
199,95
98,51
95,69
95,69
Minimum Price
(EUR)
21,81
21,8l
21,81
21,81
-0,07
-0,07
21,8l
29,74
28,61
28,61
Table l. Average, maximum, and minimum prices for areas within Nord Pool Spöt.
7/60
N o of h o u r s w h e r e p r i c e f o r r o w a r e a > c o l u m n a r e a
SEi
SE2
S E 3
SE4
DKi
DK2
F l
N O i
N O 3
NO4
S E i
-
0
32
100
264
254
125
678
74
54
SE2
0
-
32
100
264
254
125
678
74
54
SE3
0
0
-
6 8
234
224
121
646
74
54
SE4
0
0
0
-
219
2 0 3
114
646
74
54
DKi
644
644
644
657
-
339
701
918
6 6 0
659
DK2
392
392
392
392
6 8
-
476
738
414
4 0 7
F l
8
8
34
101
262
250
-
667
79
61
N O i
16
16
16
75
231
225
123
-
27
26
NO3
0
0
32
100
264
254
125
668
-
0
NO4
25
25
56
122
282
275
150
6 9 0
46
-
Table 2. Number of hours where the price for the area in the row was higher than for the area in the column.
Summary of Table 1 and 2:
• NOi had the highest average price, followed by SE4, Fl, SE3, NO3, NO4, SEi, SE2, DK2 and DKi respectively
• SEi and SE2 had a common price during all hours.
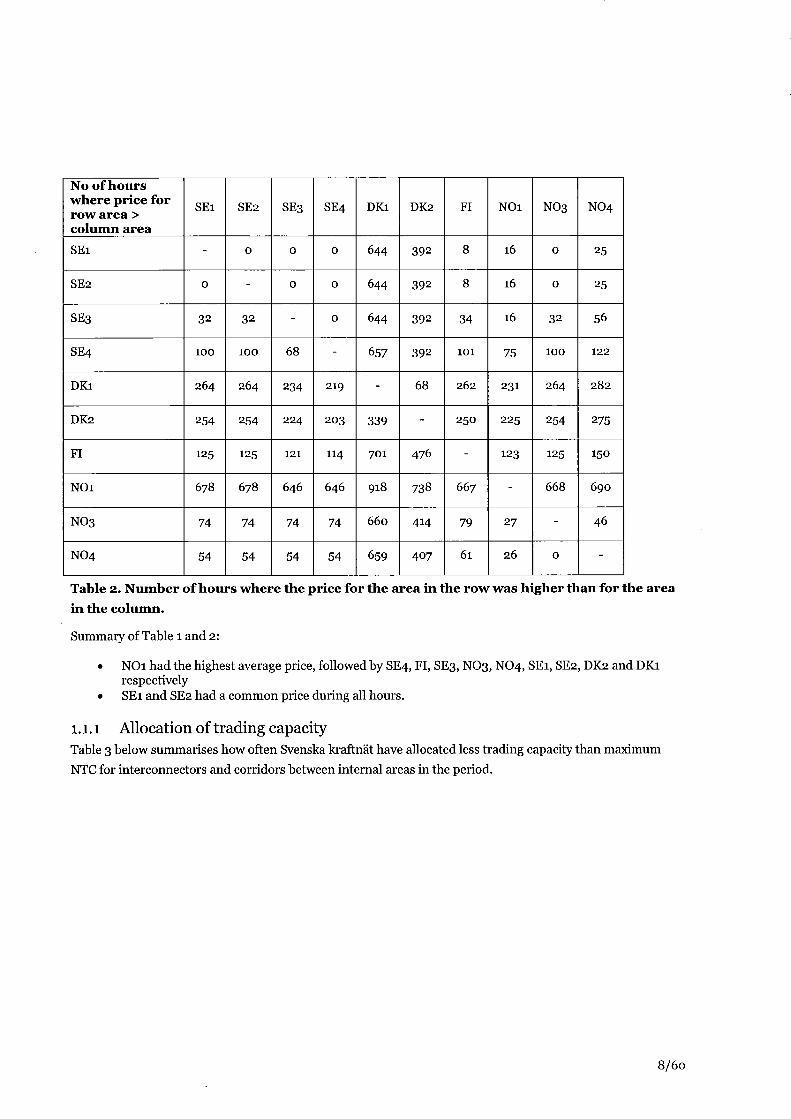
1.1.1 Allocation of trading capacity Table 3 below summarises how often Svenska kraftnät have allocated less trading capacity than maximum NTC for interconnectors and corridors between internal areas in the period.
8/60
Interconnectors /
corridors b e t w e e n
internal areas
SE1-SE2
SE2-SE3
SE3-SE4
SEl-FI
SE1-NO4
SE2-NO3
SE2-NO4
SE3-DK1
SE3-FI
SE3-NO1
SE4-DE
SE4-DK2
SE4-PL
N o of l imited hours
Export/ Southbound
109
2159
2159
2159
1 0
0
0
354
2159
1257
0
264
0
Import / Northb o u n d
0
0
0
0
10
0
0
1429
2159
0
1180
1361
1144
N o of days with l imitat ion
Export/ Southb o u n d
5
90
90
90
1
0
0
15
90
89
0
11
0
Import / Northbound
0
0
0
0
1
0
0
90
90
0
89
90
89
Average reduct ion
Export/ Southb o u n d
0%
5 %
7%
4%
0%
0%
0%
8%
3 5 %
19%
0 %
3 %
0%
Import / Northb o u n d
0 %
0 %
0%
-5%
0%
0%
0%
27%
3 5 %
0 %
18%
2 1 %
16%
Table 3. Limitations in trading capacity on interconnectors and corridors between internal areas as enforced by Svenska kraftnät. The columns with average reductions shows the average NTC divided by maximum NTC.
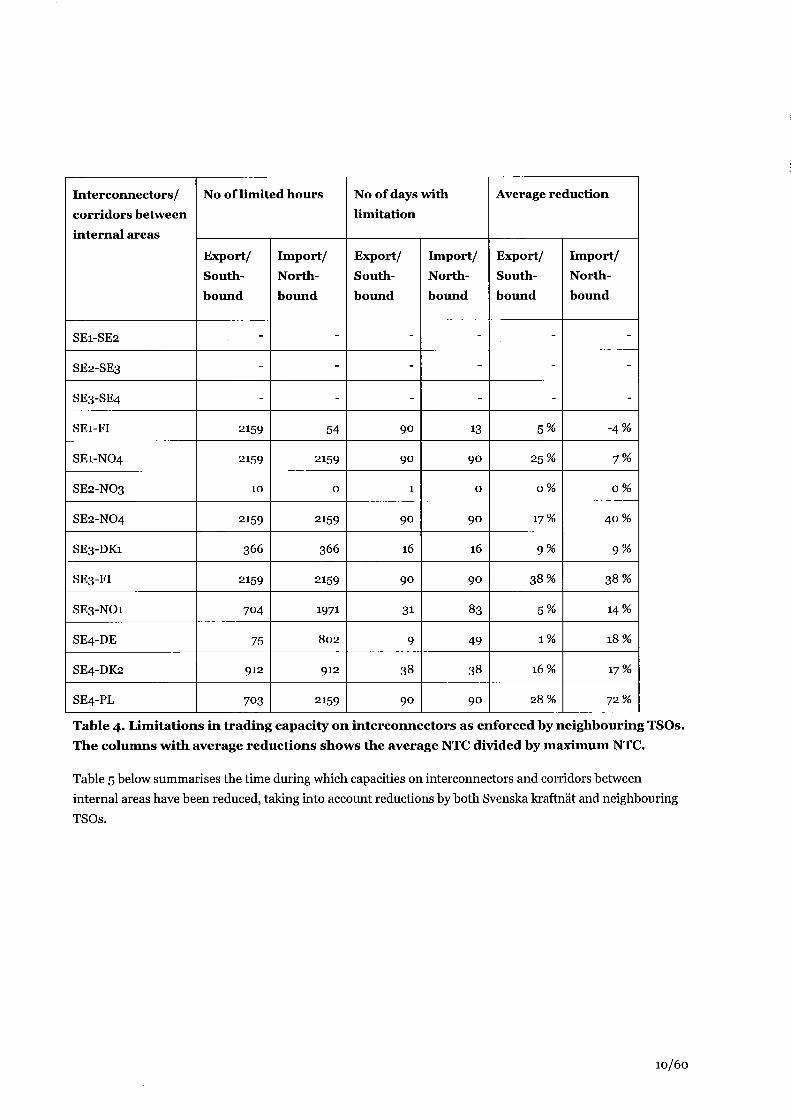
The majority of the limitations of export capacity on the interconnector SEl-FI, enforced by Svenska kraftnät during the period, are because of that the NTC depends on forecasted transfer between Kalix - Ossauskoski and Ivalo - Varangerbotn. The forecasted transfer can both increase and decrease the NTC (which also explains the negative average reduction for SEi-FI in Table 4).
Table 4 below summarises the time during which neighbouring TSOs have allocated less trading capacity than maximum NTC to interconnectors in the period.
9/60
Interconnectors /
corridors be tween
internal areas
SE1-SE2
SE2-SE3
SE3-SE4
SEi-FI
SE1-NO4
SE2-NO3
SE2-NO4
SE3-DK1
SE3-FI
SE3-NO1
SE4-DE
SE4-DK2
SE4-PL
N o of l imited h o u r s
Export/ Southb o u n d
-
-
-
2159
2159
10
2159
366
2159
704
75
912
703
Import / Northb o u n d
-
-
-
54
2159
0
2159
366
2159
1971
802
912
2159
N o of days with l imitat ion
Export/ Southb o u n d
-
-
-
90
90
1
90
16
90
31
9
38
90
Import / Northb o u n d
-
-
-
13
90
0
90
16
90
83
49
38
90
Average reduction
Export/ Southb o u n d
-
-
-
5%
25%
0%
17%
9%
38%
5%
1%
16%
28%
Import / Northb o u n d
-
-
-
-4%
7%
0%
40%
9%
38%
14%
18%
17%
72%
Table 4. Limitations in trading capacity on interconnectors as enforced by neighbouring TSOs. The columns with average reductions shows the average NTC divided by maximum NTC.
Table 5 below summarises the time during which capacities on interconnectors and corridors between internal areas have been reduced, taking into account reductions by both Svenska kraftnät and neighbouring TSOs.
10/60

Interconnectors /
corridors be tween
internal areas
SE1-SE2
SE2-SE3
SE3-SE4
SEl-FI
SE1-NO4
SE2-NO3
SE2-NO4
SE3-DK1
SE3-FI
SE3-NO1
SE4-DE
SE4-DK2
SE4-PL
N o of l imited hours
Export/ Southb o u n d
109
2159
2159
2159
2159
10
2159
366
2159
1562
75
912
720
Import /
North
b o u n d
0
0
0
54
2159
0
2159
1441
2159
1971
1577
1674
2159
N o of days wi th
l imitation
Export/ Southb o u n d
5
9 0
9 0
9 0
9 0
1
9 0
16
9 0
89
9
38
9 0
Import / Northb o u n d
0
0
0
13
9 0
0
9 0
9 0
9 0
8 3
9 0
9 0
9 0
Average reduction
Export/ Southb o u n d
0 %
5 %
7 %
5 %
2 5 %
0%
1 7 %
9 %
3 8 %
2 1 %
1 %
1 6 %
2 9 %
Import / Northb o u n d
0 %
0 %
0%
- 4 %
8 %
0 %
4 0 %
2 8 %
3 8 %
1 4 %
3 0 %
2 8 %
7 3 %
Table 5. Final limitations in trading capacity on interconnectors and corridors between internal areas as enforced by both Svenska kraftnät and neighbouring TSOs. The columns with average reductions shows the average NTC divided by maximum NTC.
Detailed information for each limitation is provided in the attached Tables A2 to A5 in Appendix A and in the attachment. This information includes the reason for each limitation.
11/60
1.1.2 Comments on each interconnector
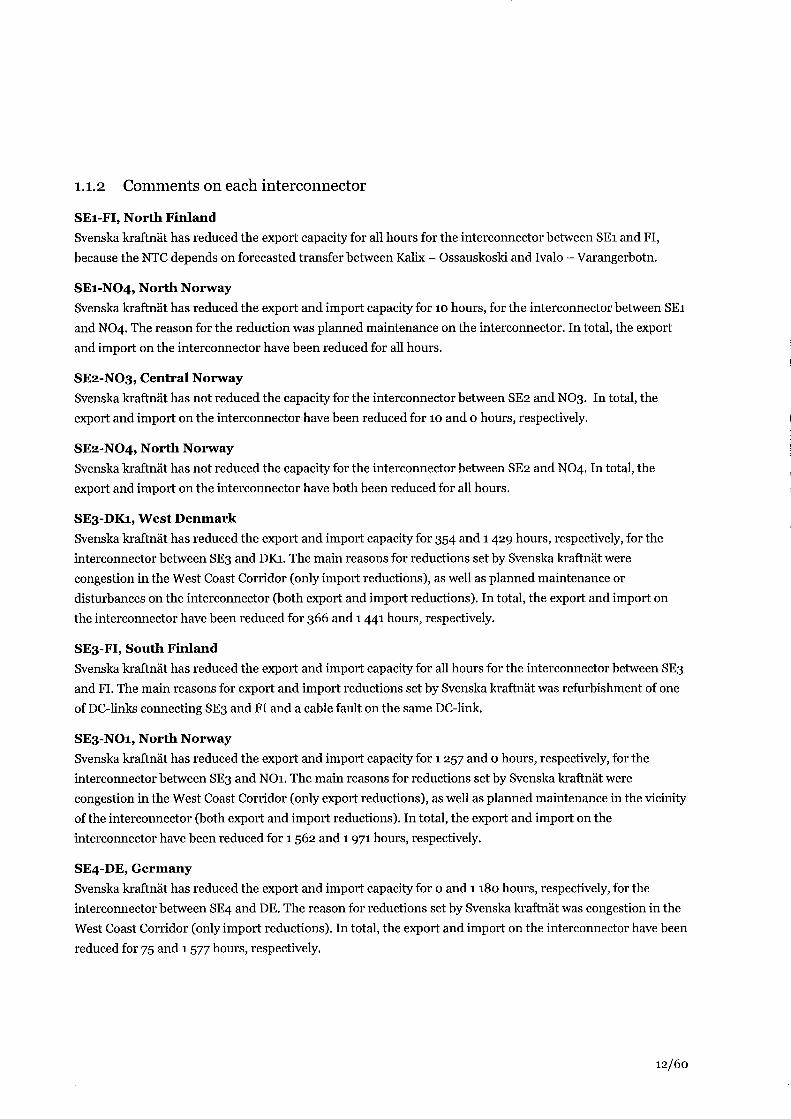
SEl-FI, North Finland Svenska kraftnät has reduced the export capacity for all hours for the interconnector between SEi and Fl, because the NTC depends on forecasted transfer between Kalix - Ossauskoski and Ivalo - Varangerbotn.
SE1-NO4, North Norway Svenska kraftnät has reduced the export and import capacity for 10 hours, for the interconnector between SEi and NO4. The reason for the reduction was planned maintenance on the interconnector. In total, the export and import on the interconnector have been reduced for all hours.
SE2-NO3, Central Norway Svenska kraftnät has not reduced the capacity for the interconnector between SE2 and NO3. In total, the export and import on the interconnector have been reduced for 10 and o hours, respectively.
SE2-NO4, North Norway Svenska kraftnät has not reduced the capacity for the interconnector between SE2 and NO4. In total, the export and import on the interconnector have both been reduced for all hours.
SE3-DK1, West Denmark Svenska kraftnät has reduced the export and import capacity for 354 and 1429 hours, respectively, for the interconnector between SE3 and DKi. The main reasons for reductions set by Svenska kraftnät were congestion in the West Coast Corridor (only import reductions), as well as planned maintenance or disturbances on the interconnector (both export and import reductions). In total, the export and import on the interconnector have been reduced for 366 and 1441 hours, respectively.
SE3-FI, South Finland Svenska kraftnät has reduced the export and import capacity for all hours for the interconnector between SE3 and Fl. The main reasons for export and import reductions set by Svenska kraftnät was refurbishment of one of DC-links connecting SE3 and Fl and a cable fault on the same DC-link.
SE3-NO1, North Norway Svenska kraftnät has reduced the export and import capacity for 1257 and o hours, respectively, for the interconnector between SE3 and NOi. The main reasons for reductions set by Svenska kraftnät were congestion in the West Coast Corridor (only export reductions), as well as planned maintenance in the vicinity of the interconnector (both export and import reductions). In total, the export and import on the interconnector have been reduced for 1562 and 1971 hours, respectively.
SE4-DE, Germany Svenska kraftnät has reduced the export and import capacity for o and 1180 hours, respectively, for the interconnector between SE4 and DE. The reason for reductions set by Svenska kraftnät was congestion in the West Coast Corridor (only import reductions). In total, the export and import on the interconnector have been reduced for 75 and 1 577 hours, respectively.
12/60
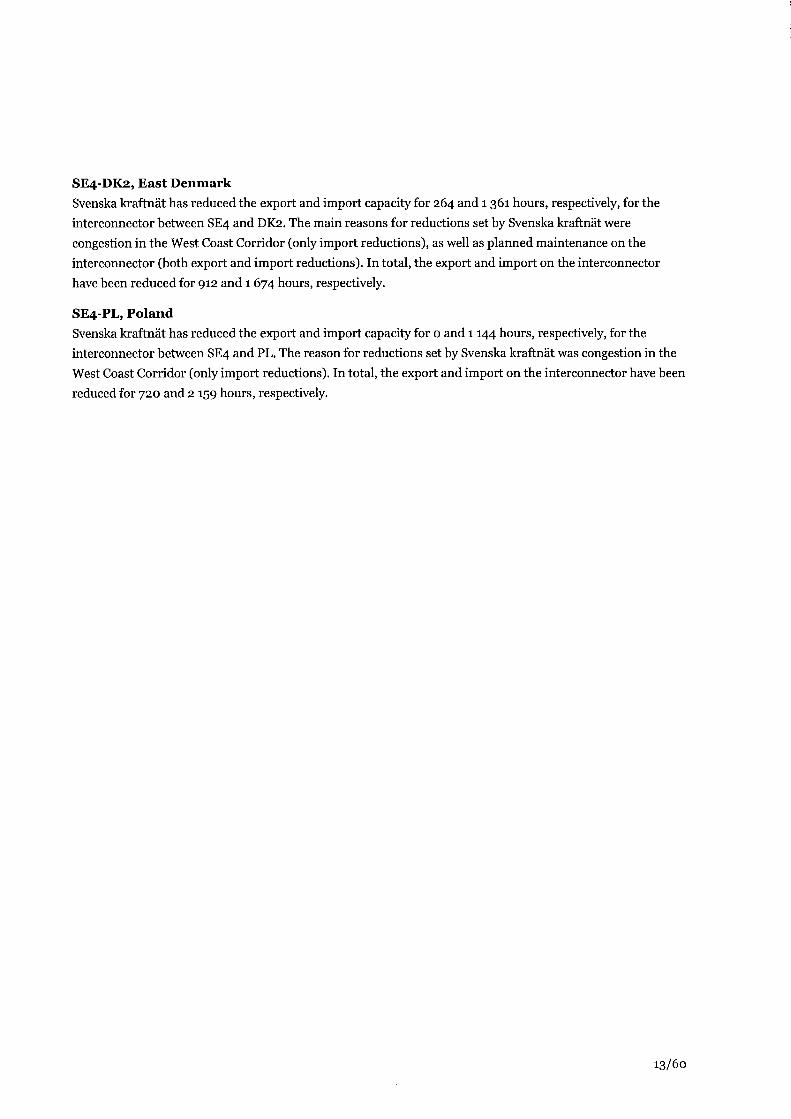
SE4-DK2, East Denmark Svenska kraftnät has reduced the export and import capacity for 264 and 1361 hours, respectively, for the interconnector between SE4 and DK2. The main reasons for reductions set by Svenska kraftnät were congestion in the West Coast Corridor (only import reductions), as well as planned maintenance on the interconnector (both export and import reductions). In total, the export and import on the interconnector have been reduced for 912 and 1674 hours, respectively.
SE4-PL, Poland Svenska kraftnät has reduced the export and import capacity for o and 1144 hours, respectively, for the interconnector between SE4 and PL. The reason for reductions set by Svenska kraftnät was congestion in the West Coast Corridor (only import reductions). In total, the export and import on the interconnector have been reduced for 720 and 2 159 hours, respectively.
13/60
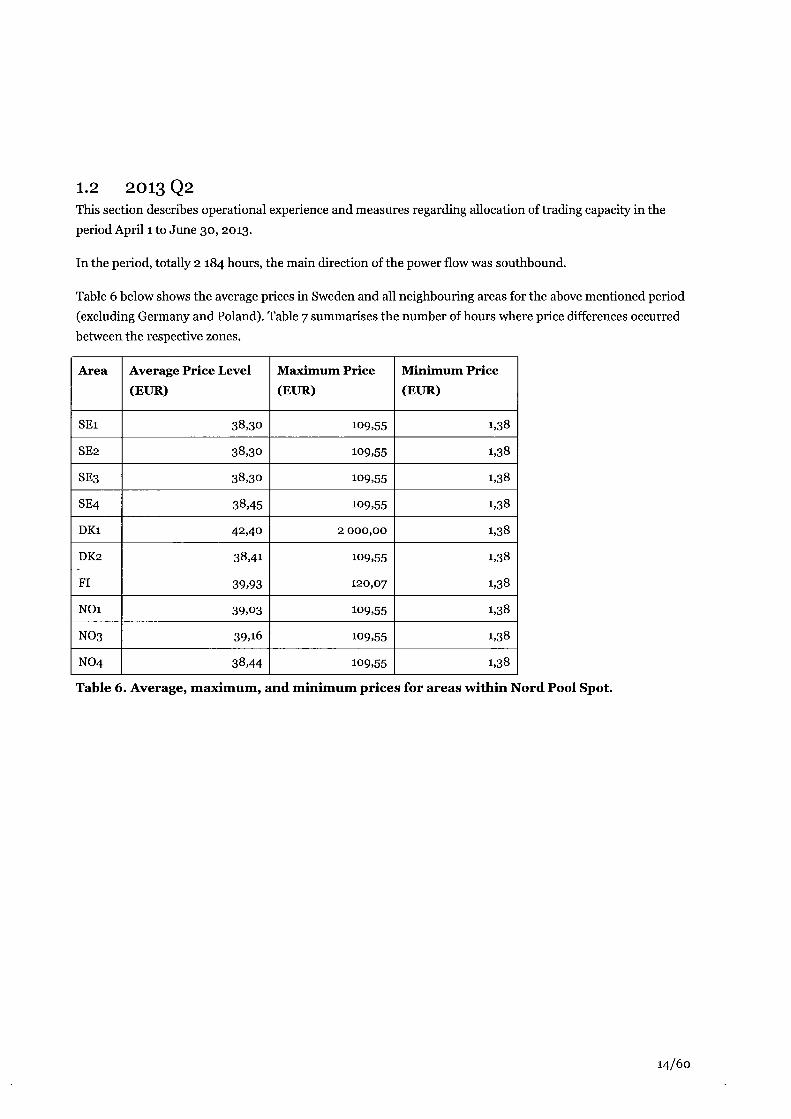
1.2 2013 Q2 This section describes operational experience and measures regarding allocation of trading capacity in the period April i to June 30, 2013.
In the period, totally 2 184 hours, the main direction of the power flow was southbound.
Table 6 below shows the average prices in Sweden and all neighbouring areas for the above mentioned period (excluding Germany and Poland). Table 7 summarises the number of hours where price differences occurred between the respective zones.
A r e a
SEi
SE2
SE3
SE4
DKi
DK2
Fl
NOi
NO3
NO4
Average P r i c e Level
(EUR)
38,30
38,30
38,30
38,45
42,40
38,41
39,93
39,03
39,16
38,44
M a x i m u m Pr i ce
(EUR)
109,55
109,55
109,55
109,55
2 000,00
109,55
120,07
109,55
109,55
109,55
M i n i m u m P r i c e
(EUR)
1,38
1,38
1,38
1,38
1,38
1,38
1,38
1,38
1,38
1,38
Table 6. Average, maximum, and minimum prices for areas within Nord Pool Spöt.
14/60
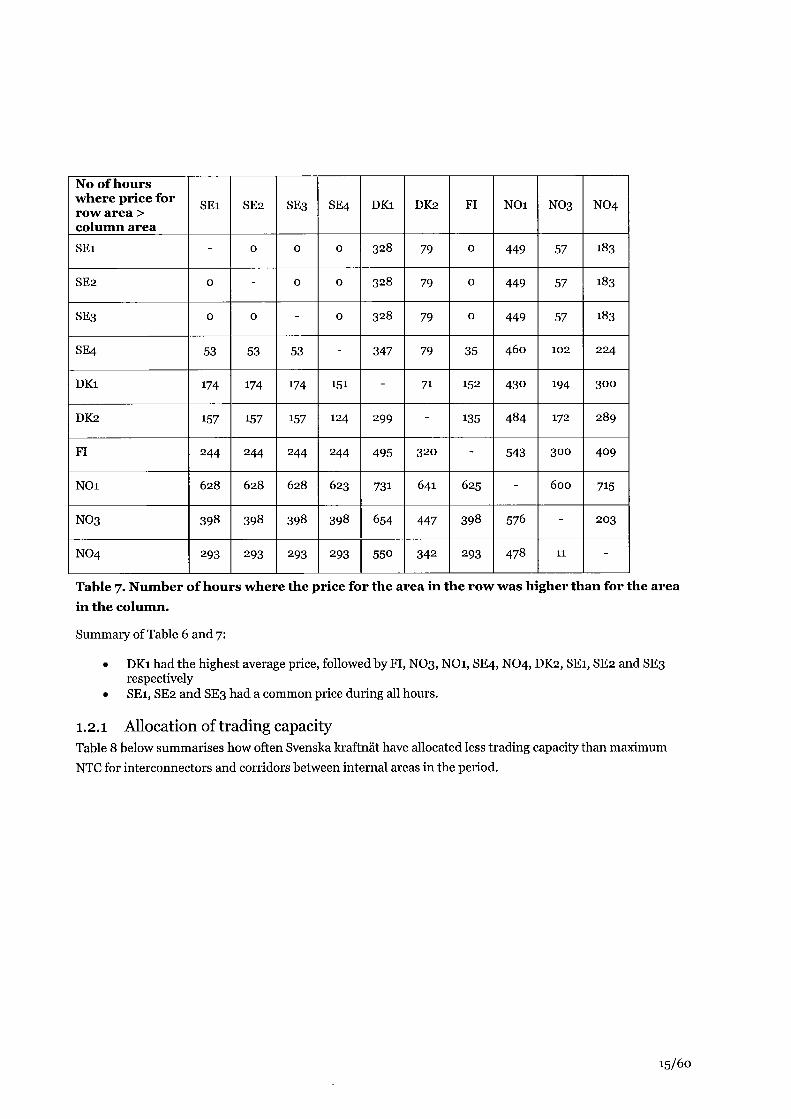
No of hours where price for row area > column area SEi
SE2
S E 3
SE4
DKi
DK2
F l
N O i
N O 3
NO4
S E i
-
0
0
53
174
157
244
6 2 8
3 9 8
293
SE2
0
-
0
53
174
157
244
6 2 8
3 9 8
2 9 3
SE3
0
0
-
53
174
157
244
6 2 8
3 9 8
293
SE4
0
0
0
-
151
124
244
623
3 9 8
293
DKi
3 2 8
3 2 8
3 2 8
347
-
299
495
731
654
550
DK2
79
79
79
79
71
-
3 2 0
641
447
342
F l
0
0
0
35
1 5 2
135
-
625
3 9 8
2 9 3
N O i
449
449
449
4 6 0
4 3 0
4 8 4
543
-
576
478
NO3
57
57
57
1 0 2
194
172
3 0 0
6 0 0
-
11
NO4
183
183
183
224
3 0 0
289
4 0 9
715
2 0 3
-
Table 7. Number of hours where the price for the area in the row was higher than for the area in the column.
Summary of Table 6 and 7:
• DKi had the highest average price, followed by Fl, NO3, NOi, SE4, NO4, DK2, SEi, SE2 and SE3 respectively
• SEi, SE2 and SE3 had a common price during all hours.
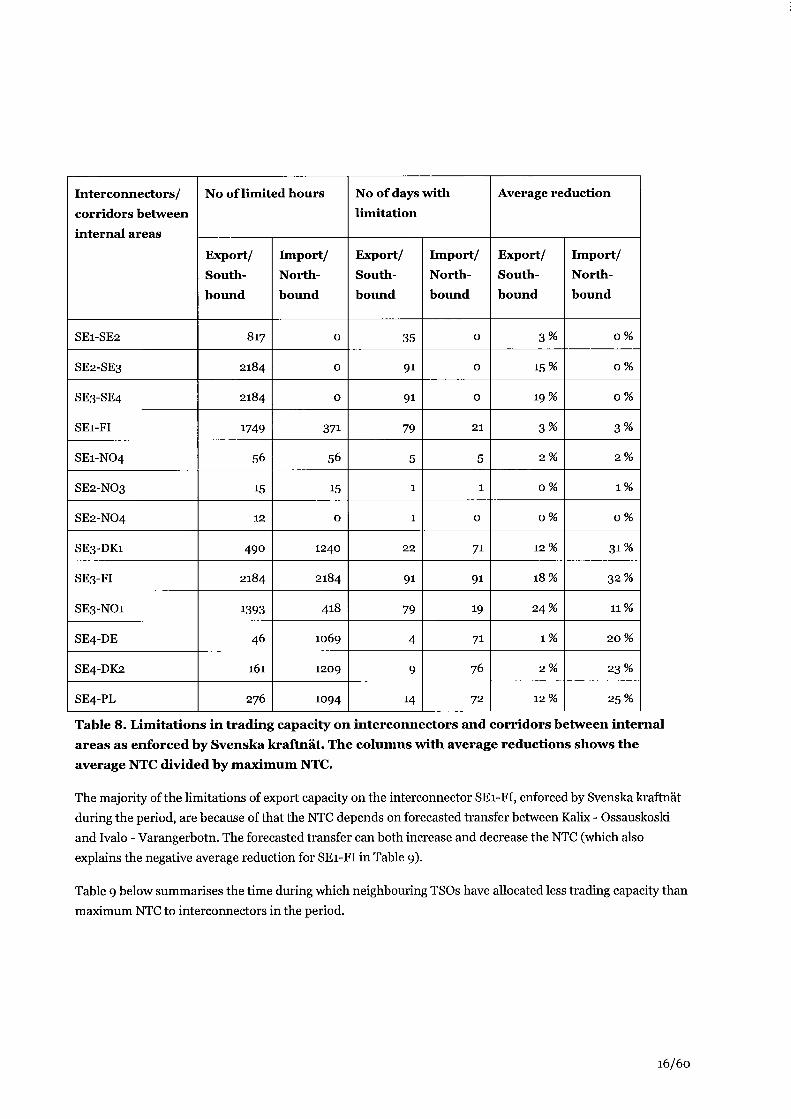
1.2.1 Allocation of trading capacity Table 8 below summarises how often Svenska kraftnät have allocated less trading capacity than maximum NTC for interconnectors and corridors between internal areas in the period.
15/60
Interconnectors /
corridors be tween
internal areas
SE1-SE2
SE2-SE3
SE3-SE4
SEl-FI
SE1-NO4
SE2-NO3
SE2-NO4
SE3-DK1
SE3-FI
SE3-NO1
SE4-DE
SE4-DK2
SE4-PL
N o of l imited hours
Export/ Southb o u n d
817
2184
2184
1749
56
15
12
490
2184
1393
46
161
276
Import / Northb o u n d
0
0
0
371
56
15
0
1240
2184
418
1069
1209
1094
N o of days wi th l imitat ion
Export/ Southb o u n d
35
91
91
79
5
1
1
2 2
91
79
4
9
14
Import / Northb o u n d
0
0
0
2 1
5
1
0
71
91
19
71
76
72
Average reduction
Export/ Southb o u n d
3 %
15%
19%
3%
2 %
0 %
0 %
1 2 %
18%
24%
1 %
2 %
1 2 %
Import / Northb o u n d
0%
0%
0%
3%
2 %
1 %
0 %
31%
3 2 %
1 1 %
2 0 %
23%
25%
Table 8. Limitations in trading capacity on interconnectors and corridors between internal areas as enforced by Svenska kraftnät. The columns with average reductions shows the average NTC divided by maximum NTC.
The majority of the limitations of export capacity on the interconnector SEl-FI, enforced by Svenska kraftnät during the period, are because of that the NTC depends on forecasted transfer between Kalix - Ossauskoski and Ivalo - Varangerbotn. The forecasted transfer can both increase and decrease the NTC (which also explains the negative average reduction for SEl-FI in Table 9).
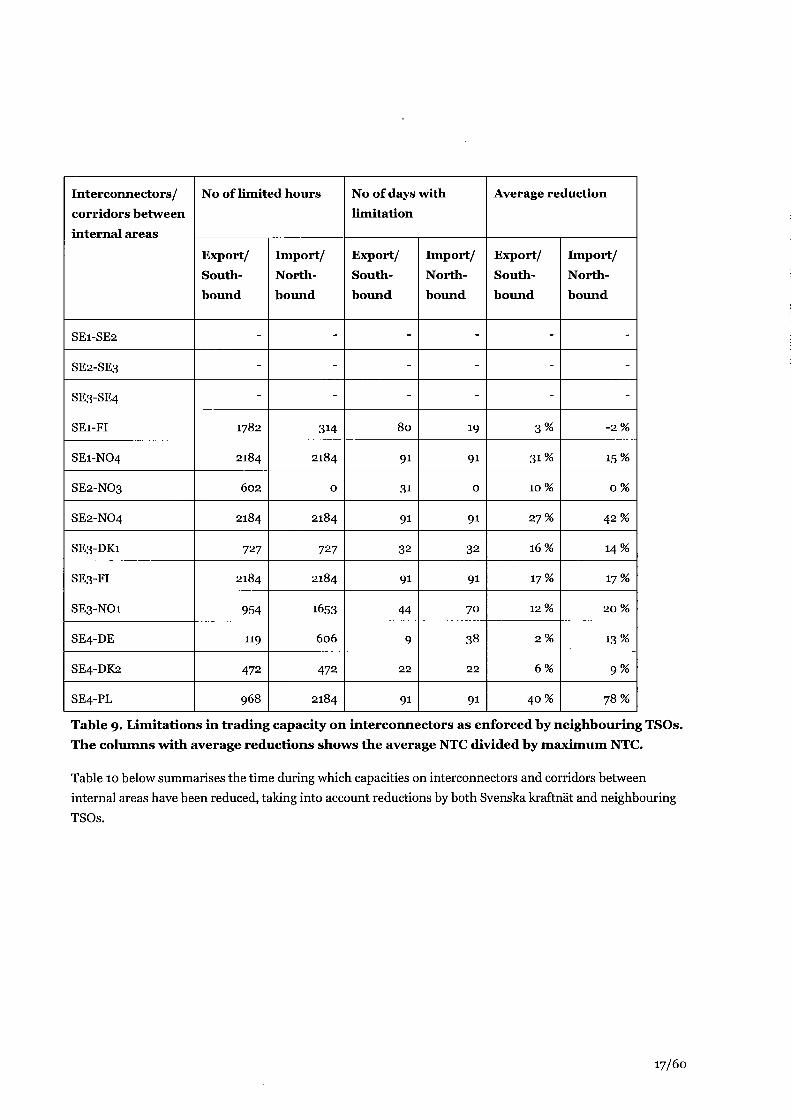
Table 9 below summarises the time during which neighbouring TSOs have allocated less trading capacity than maximum NTC to interconnectors in the period.
16/60
Interconnectors / corridors be tween internal areas
SE1-SE2
SE2-SE3
SE3-SE4
SEl-FI
SE1-NO4
SE2-NO3
SE2-NO4
SE3-DK1
SE3-FI
SE3-NO1
SE4-DE
SE4-DK2
SE4-PL
N o of l imited hours
Export/ Southbound
-
-
-
1782
2184
602
2184
727
2184
954
119
472
968
Import / Northb o u n d
-
-
-
314
2184
0
2184
727
2184
1653
606
472
2184
N o of days with l imitation
Export/ Southb o u n d
-
-
-
80
91
31
91
32
91
44
9
2 2
91
Import /
North
b o u n d
-
-
-
19
91
0
91
32
91
70
38
2 2
91
Average reduction
Export/ Southb o u n d
-
-
-
3%
31%
1 0 %
27%
16%
17%
1 2 %
2 %
6%
40%
Import / Northb o u n d
-
-
-
- 2 %
15%
0 %
4 2 %
14%
17%
2 0 %
13%
9%
78%
Table 9. Limitations in trading capacity on interconnectors as enforced by neighbouring TSOs. The columns with average reductions shows the average NTC divided by maximum NTC.
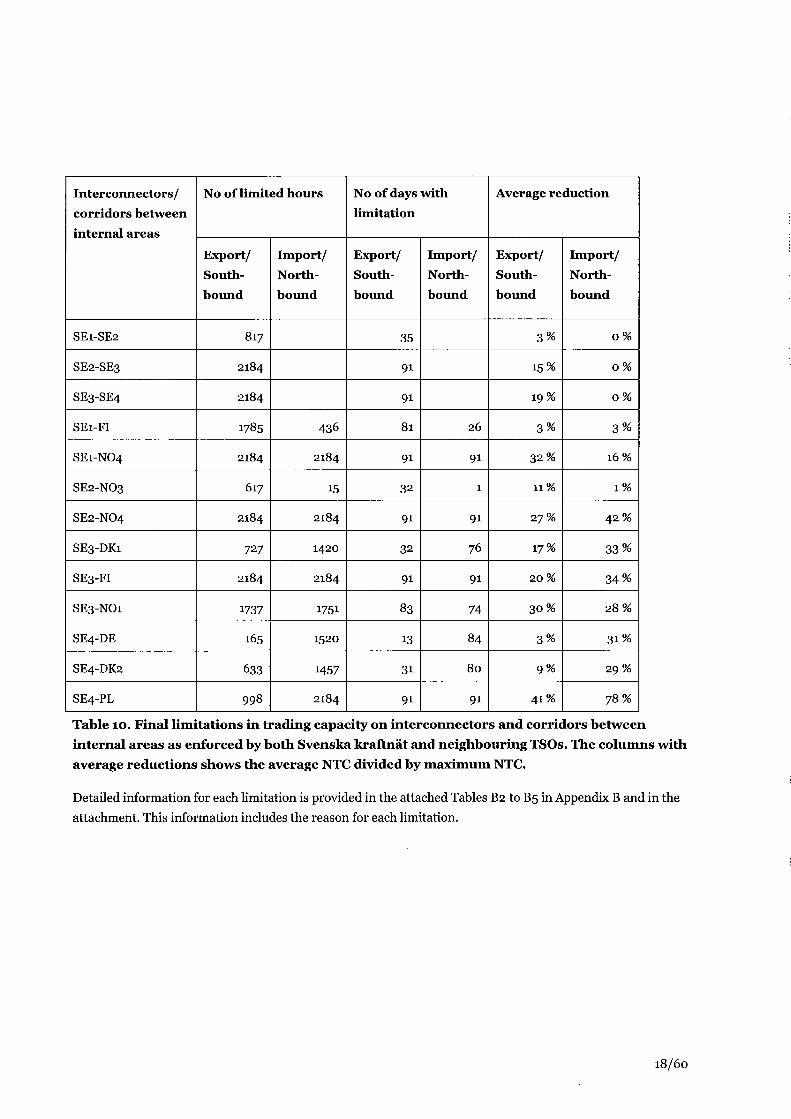
Table 10 below summarises the time during which capacities on interconnectors and corridors between internal areas have been reduced, taking into account reductions by both Svenska kraftnät and neighbouring TSOs.
17/60
Interconnectors / corridors b e t w e e n internal areas
SE1-SE2
SE2-SE3
SE3-SE4
SEl-FI
SE1-NO4
SE2-NO3
SE2-NO4
SE3-DK1
SE3-FI
SE3-NO1
SE4-DE
SE4-DK2
SE4-PL
N o of l imited hours
Export/ Southb o u n d
817
2184
2184
1785
2184
617
2184
727
2184
1737
165
633
998
Import / Northb o u n d
436
2184
15
2184
1420
2184
1751
1520
1457
2184
N o of days with l imitation
Export/ Southb o u n d
35
91
91
81
91
32
91
32
91
83
13
31
91
Import / Northb o u n d
26
91
1
91
76
91
74
84
80
91
Average reduct ion
Export/ Southb o u n d
3%
15%
19%
3%
32%
11%
27%
17%
20%
30%
3%
9%
4 1 %
Import / Northb o u n d
0%
0%
0%
3 %
16%
1%
42%
3 3 %
3 4 %
28%
3 1 %
29%
7 8 %
Table 10. Final limitations in trading capacity on interconnectors and corridors between internal areas as enforced by both Svenska kraftnät and neighbouring TSOs. The columns with average reductions shows the average NTC divided by maximum NTC.
Detailed information for each limitation is provided in the attached Tables B2 to B5 in Appendix B and in the attachment. This information includes the reason for each limitation.
18/60
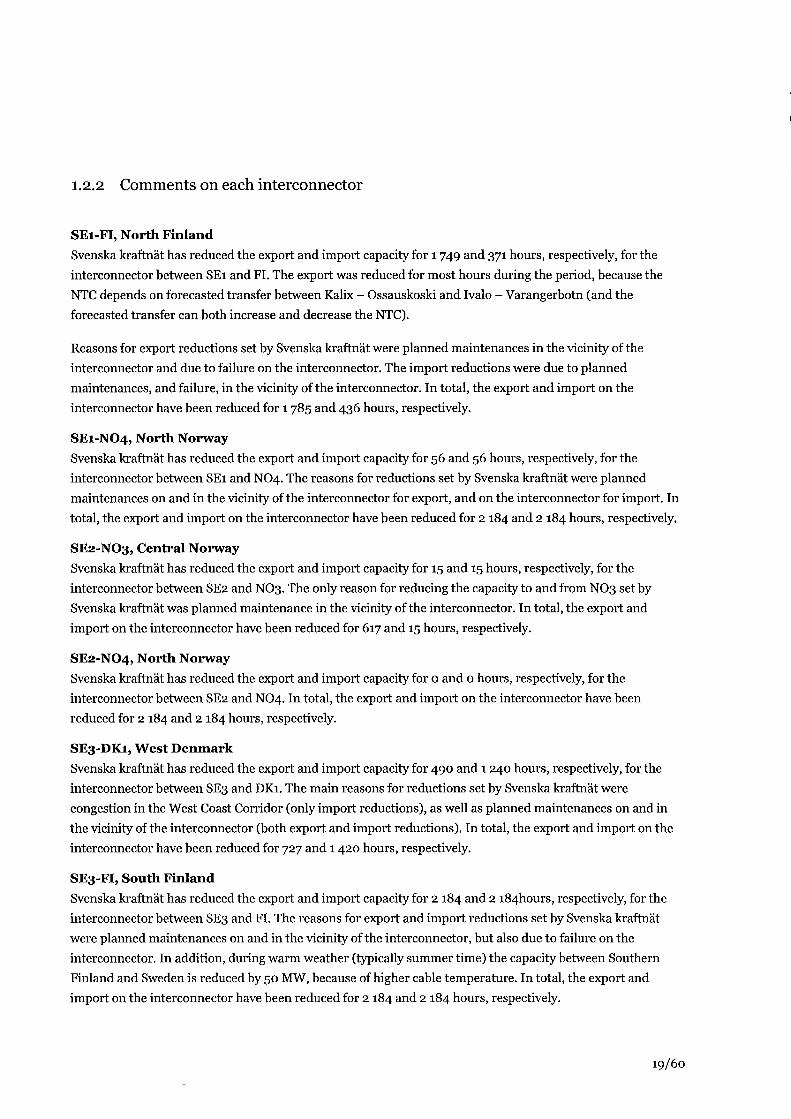
1.2.2 Comments on each interconnector
SEl-FI, North Finland Svenska kraftnät has reduced the export and import capacity for 1749 and 371 hours, respectively, for the interconnector between SEi and FL The export was reduced for most hours during the period, because the NTC depends on forecasted transfer between Kalix - Ossauskoski and Ivalo - Varangerbotn (and the forecasted transfer can both increase and decrease the NTC).
Reasons for export reductions set by Svenska kraftnät were planned maintenances in the vicinity of the interconnector and due to failure on the interconnector. The import reductions were due to planned maintenances, and failure, in the vicinity of the interconnector. In total, the export and import on the interconnector have been reduced for 1785 and 436 hours, respectively.
SE1-NO4, North Norway Svenska kraftnät has reduced the export and import capacity for 56 and 56 hours, respectively, for the interconnector between SEi and NO4. The reasons for reductions set by Svenska kraftnät were planned maintenances on and in the vicinity of the interconnector for export, and on the interconnector for import. In total, the export and import on the interconnector have been reduced for 2 184 and 2 184 hours, respectively.
SE2-NO3, Central Norway Svenska kraftnät has reduced the export and import capacity for 15 and 15 hours, respectively, for the interconnector between SE2 and NO3. The only reason for reducing the capacity to and from NO3 set by Svenska kraftnät was planned maintenance in the vicinity of the interconnector. In total, the export and import on the interconnector have been reduced for 617 and 15 hours, respectively.
SE2-NO4, North Norway Svenska kraftnät has reduced the export and import capacity for o and o hours, respectively, for the interconnector between SE2 and NO4. In total, the export and import on the interconnector have been reduced for 2 184 and 2 184 hours, respectively.
SE3-DK1, West Denmark Svenska kraftnät has reduced the export and import capacity for 490 and 1240 hours, respectively, for the interconnector between SE3 and DKi. The main reasons for reductions set by Svenska kraftnät were congestion in the West Coast Corridor (only import reductions), as well as planned maintenances on and in the vicinity of the interconnector (both export and import reductions). In total, the export and import on the interconnector have been reduced for 727 and 1420 hours, respectively.
SE3-FI, South Finland Svenska kraftnät has reduced the export and import capacity for 2 184 and 2 i84hours, respectively, for the interconnector between SE3 and Fl. The reasons for export and import reductions set by Svenska kraftnät were planned maintenances on and in the vicinity of the interconnector, but also due to failure on the interconnector. In addition, during warm weather (typically summer time) the capacity between Southern Finland and Sweden is reduced by 50 MW, because of higher cable temperature. In total, the export and import on the interconnector have been reduced for 2 184 and 2 184 hours, respectively.
19/60
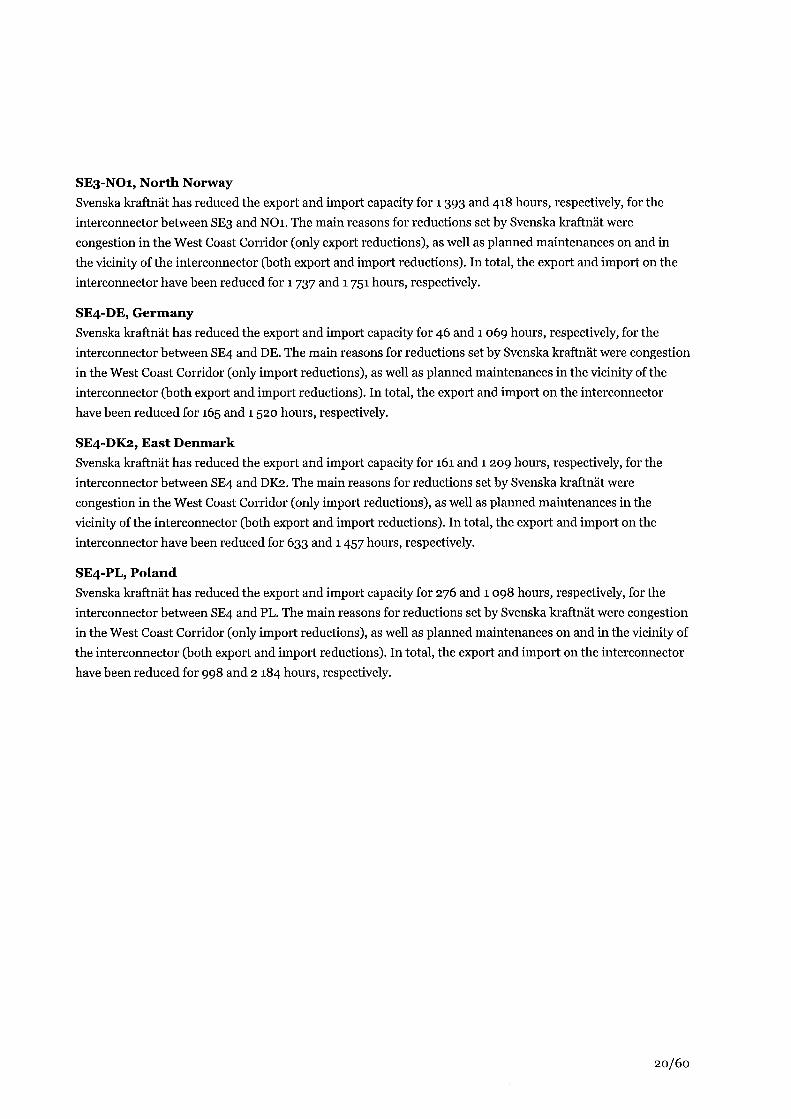
SE3-NO1, North Norway Svenska kraftnät has reduced the export and import capacity for 1393 and 418 hours, respectively, for the interconnector between SE3 and NOi. The main reasons for reductions set by Svenska kraftnät were congestion in the West Coast Corridor (only export reductions), as well as planned maintenances on and in the vicinity of the interconnector (both export and import reductions). In total, the export and import on the interconnector have been reduced for 1737 and 1751 hours, respectively.
SE4-DE, Germany Svenska kraftnät has reduced the export and import capacity for 46 and 1069 hours, respectively, for the interconnector between SE4 and DE. The main reasons for reductions set by Svenska kraftnät were congestion in the West Coast Corridor (only import reductions), as well as planned maintenances in the vicinity of the interconnector (both export and import reductions). In total, the export and import on the interconnector have been reduced for 165 and 1520 hours, respectively.
SE4-DK2, East Denmark Svenska kraftnät has reduced the export and import capacity for 161 and 1 209 hours, respectively, for the interconnector between SE4 and DK2. The main reasons for reductions set by Svenska kraftnät were congestion in the West Coast Corridor (only import reductions), as well as planned maintenances in the vicinity of the interconnector (both export and import reductions). In total, the export and import on the interconnector have been reduced for 633 and 1457 hours, respectively.
SE4-PL, Poland Svenska kraftnät has reduced the export and import capacity for 276 and 1098 hours, respectively, for the interconnector between SE4 and PL. The main reasons for reductions set by Svenska kraftnät were congestion in the West Coast Corridor (only import reductions), as well as planned maintenances on and in the vicinity of the interconnector (both export and import reductions). In total, the export and import on the interconnector have been reduced for 998 and 2 184 hours, respectively.
20/60

1.3 2013 Q3 This section describes operational experience and measures regarding allocation of trading capacity in the period July i to September 30, 2013.
In the period, totaUy 2 208 hours, the main direction of the power flow was southbound.
Table 11 below shows the average prices in Sweden and all neighbouring areas for the above mentioned period (excluding Germany and Poland). Table 12 summarises the number of hours where price differences occurred between the respective zones.
A r e a
SEi
SE2
SE3
SE4
DKi
DK2
Fl
NOi
NO3
NO4
Average Pr ice Level
(EUR)
39,68
39,68
40,04
40,37
39,99
41,32
42,70
33,73
37,78
37,18
M a x i m u m Pr ice
(EUR)
74,33
74,33
79,98
79,98
130,27
130,27
120 ,00
39,68
64,51
64,51
M i n i m u m P r i c e
(EUR)
9,84
9,84
9,84
9,84
5,83
5,83
9,84
16,12
10,66
10,66
Table 11. Average, maximum, and minimum prices for areas within Nord Pool Spöt.
21/60
No of hours where price for row area > column area S E i
SE2
S E 3
SE4
DKi
DK2
F l
N O i
N O 3
N O 4
S E i
-
0
8 9
199
4 6 7
465
678
46
14
14
SE2
0
-
89
199
467
465
678
4 6
14
14
SE3
0
0
-
1 2 0
411
4 0 7
6 0 8
46
14
14
SE4
0
0
0
-
376
362
5 8 8
46
14
14
DKi
644
644
644
655
-
6 0 9
1090
3 3 3
642
642
DK2
63
63
63
63
2 8
-
624
8 3
74
74
F l
0
0
9
79
3 2 8
316
-
46
14
14
N O i
1563
1563
1563
1598
1214
1576
1739
-
1564
1564
NO3
636
636
687
770
825
872
1070
46
-
1
NO4
734
734
763
8 3 8
8 6 5
9 2 3
1135
46
229
-
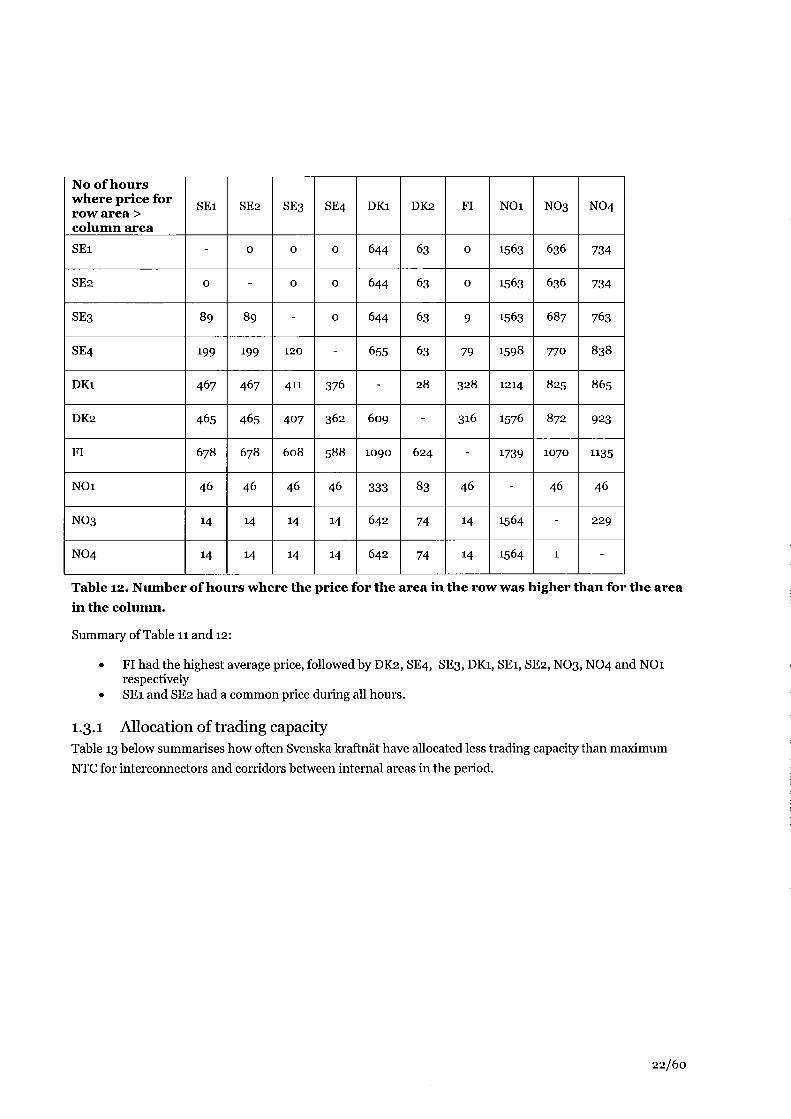
Table 12. Number of hours where the price for the area in the row was higher than for the area in the column.
Summary of Table 11 and 12:
• Fl had the highest average price, followed by DK2, SE4, SE3, DKi, SEi, SE2, NO3, NO4 and NOi respectively
• SEi and SE2 had a common price during all hours.
1.3.1 Allocation of trading capacity Table 13 below summarises how often Svenska kraftnät have allocated less trading capacity than maximum NTC for interconnectors and corridors between internal areas in the period.
22/60
Interconnectors / corridors be tween internal areas
SE1-SE2
SE2-SE3
SE3-SE4
SEl-FI
SE1-NO4
SE2-NO3
SE2-NO4
SE3-DK1
SE3-FI
SE3-NO1
SE4-DE
SE4-DK2
SE4-PL
N o of l imited hours
Export/ Southbound
7 6 1
2 2 0 8
2 2 0 8
2 0 4 0
0
0
87
948
2 2 0 8
8 0 7
1 8 4
2 1 6
101
Import / Northbound
0
0
0
5 4 0
537
0
6 1
1433
2 2 0 8
3 2 9
5 4 1
547
4 5 1
N o of days with l imitat ion
Export/ Southb o u n d
34
9 2
9 2
85
0
0
7
4 1
9 2
5 2
10
11
5
Import / Northb o u n d
0
0
0
2 6
2 9
0
3
79
9 2
16
44
43
39
Average reduction
Export/ Southbound
8%
1 8 %
2 5 %
5%
0%
0%
3%
2 5 %
1 6 %
1 3 %
6%
5%
2 %
Import /
North
b o u n d
0 %
0 %
0 %
1 %
6%
0 %
3 %
3 8 %
3 8 %
5 %
1 2 %
1 0 %
8 %
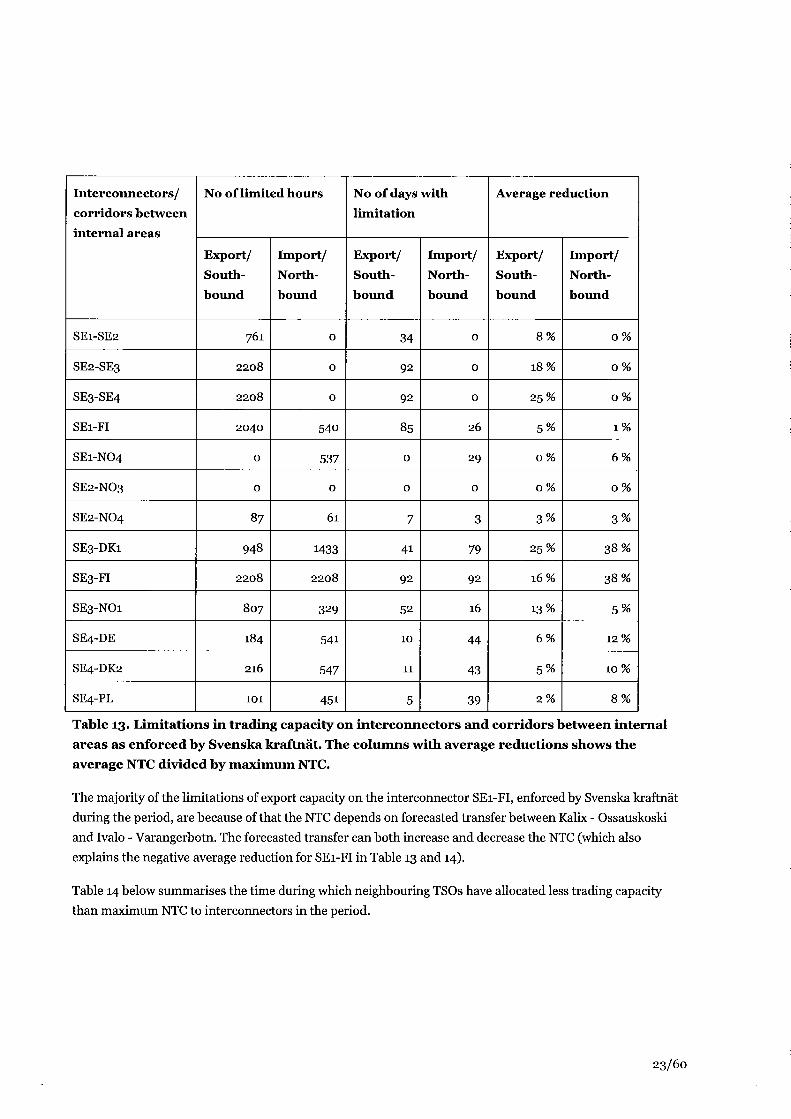
Table 13. Limitations in trading capacity on interconnectors and corridors between internal areas as enforced by Svenska kraftnät. The columns with average reductions shows the average NTC divided by maximum NTC.
The majority of the limitations of export capacity on the interconnector SEl-FI, enforced by Svenska kraftnät during the period, are because of that the NTC depends on forecasted transfer between Kalix - Ossauskoski and Ivalo - Varangerbotn. The forecasted transfer can both increase and decrease the NTC (which also explains the negative average reduction for SEl-FI in Table 13 and 14).
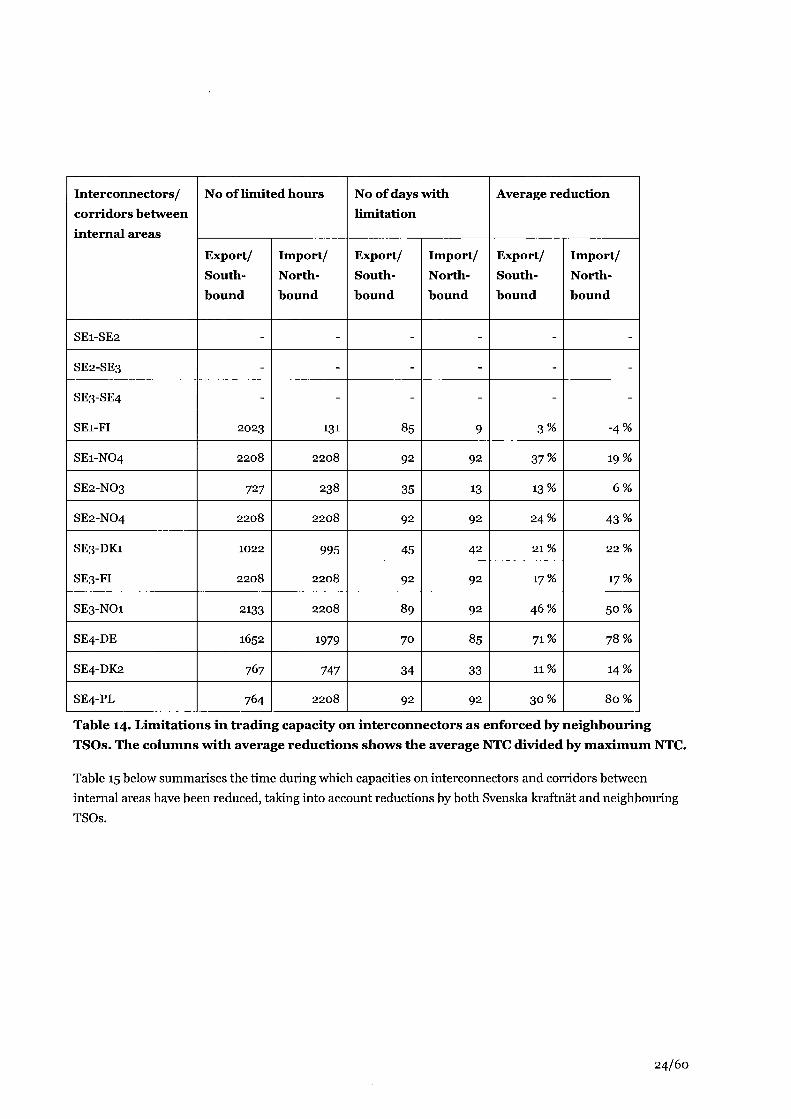
Table 14 below summarises the time during which neighbouring TSOs have allocated less trading capacity than maximum NTC to interconnectors in the period.
23/60
Interconnectors / corridors b e t w e e n internal areas
SE1-SE2
SE2-SE3
SE3-SE4
SEl-FI
SE1-NO4
SE2-NO3
SE2-NO4
SE3-DK1
SE3-FI
SE3-NO1
SE4-DE
SE4-DK2
SE4-PL
N o of l imited hours
Export/ Southb o u n d
-
-
-
2023
2208
727
2208
1022
2208
2133
1652
767
764
Import / Northb o u n d
-
-
-
131
2208
238
2208
995
2208
2208
1979
747
2208
N o of days with l imitation
Export/ Southb o u n d
-
-
-
85
92
35
92
45
92
89
70
34
92
Import / Northb o u n d
-
-
-
9
92
13
92
42
92
92
85
33
92
Average reduction
Export/
South
b o u n d
-
-
-
3 %
37%
13%
2 4 %
2 1 %
17%
46%
71%
11%
3 0 %
Import / Northb o u n d
-
-
-
-4%
19%
6%
43%
2 2 %
17%
50%
78%
14%
8 0 %
Table 14. Limitations in trading capacity on interconnectors as enforced by neighbouring TSOs. The columns with average reductions shows the average NTC divided by maximum NTC.
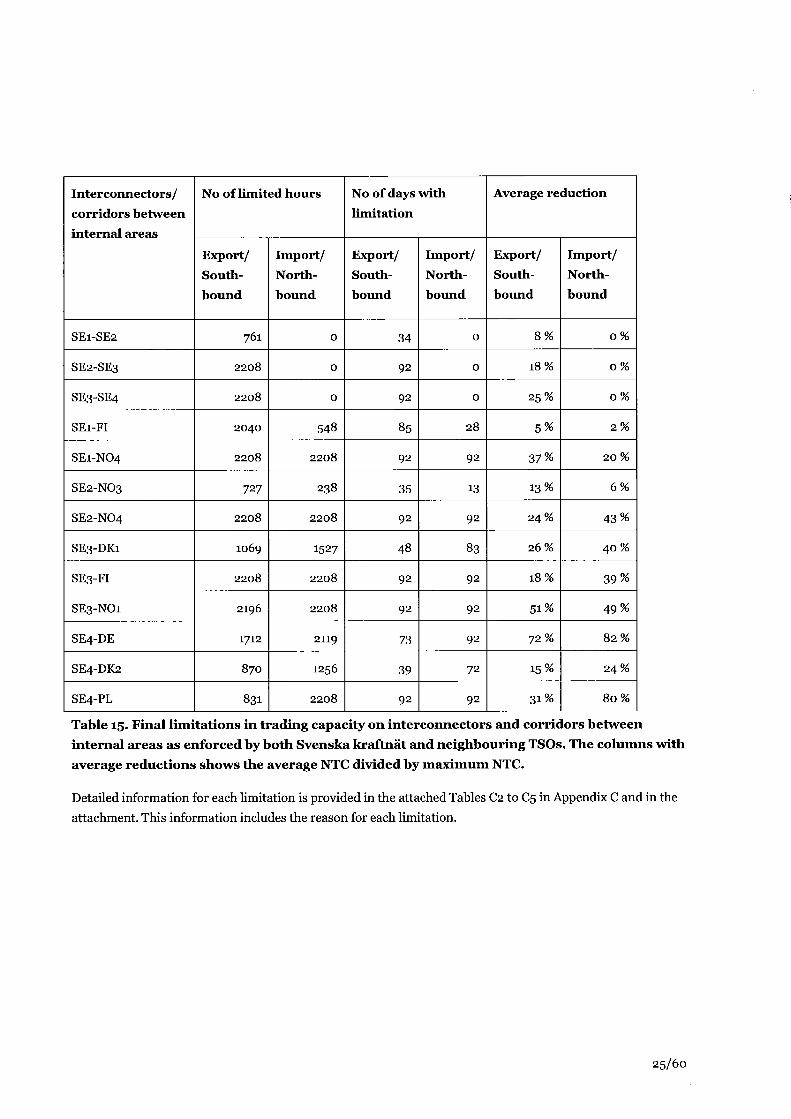
Table 15 below summarises the time during which capacities on interconnectors and corridors between internal areas have been reduced, taking into account reductions by both Svenska kraftnät and neighbouring TSOs.
24/60
Interconnectors /
corridors b e t w e e n
internal areas
SE1-SE2
SE2-SE3
SE3-SE4
SEl-FI
SE1-NO4
SE2-NO3
SE2-NO4
SE3-DK1
SE3-FI
SE3-NO1
SE4-DE
SE4-DK2
SE4-PL
N o of l imited hours
Export/ Southb o u n d
761
2208
2208
2040
2208
727
2208
1069
2208
2196
1712
870
831
Import / Northb o u n d
0
0
0
548
2208
238
2208
1527
2208
2208
2119
1256
2208
N o of days with
l imitation
Export/ Southbound
34
92
92
85
92
35
92
48
92
92
73
39
92
Import / Northb o u n d
0
0
0
28
92
13
92
83
92
92
92
72
92
Average reduction
Export/ Southbound
8%
18%
25%
5%
37%
13%
24%
26%
18%
51%
72%
15%
3 1 %
Import / Northb o u n d
0%
0%
0%
2%
2 0 %
6%
43%
4 0 %
39%
49%
8 2 %
24%
80%
Table 15. Final limitations in trading capacity on interconnectors and corridors between internal areas as enforced by both Svenska kraftnät and neighbouring TSOs. The columns with average reductions shows the average NTC divided by maximum NTC.
Detailed information for each limitation is provided in the attached Tables C2 to C5 in Appendix C and in the attachment. This information includes the reason for each limitation.
25/60
1.3-2 Comments on each interconnector
SEl-FI, North Finland Svenska kraftnät has reduced the export and import capacity for 2 040 and 540 hours, respectively, for the interconnector between SEi and Fl. The majority of the export reductions are because the NTC depends on forecasted transfer between Kalix - Ossauskoski and Ivalo - Varangerbotn (and the forecasted transfer can both increase and decrease the NTC). Besides that, the reasons for both import and export reductions set by Svenska kraftnät were planned maintenances in the vicinity of the interconnector. In total, the export and import on the interconnector have been reduced for 2 040 and 548 hours, respectively.
SE1-NO4, North Norway Svenska kraftnät has reduced the export and import capacity for o and 537 hours, respectively, for the interconnector between SEi and NO4. The reasons for import reductions set by Svenska kraftnät were planned maintenances in the vicinity of the interconnector. In total, the export and import on the interconnector have both been reduced for all hours.
SE2-NO3, Central Norway Svenska kraftnät has not reduced the capacity for the interconnector between SE2 and NO3. In total, the export and import on the interconnector have been reduced for 727 and 238 hours, respectively.
SE2-NO4, North Norway Svenska kraftnät has reduced the export and import capacity for 87 and 61 hours, respectively, for the interconnector between SE2 and NO4. The reasons for import reductions set by Svenska kraftnät were planned maintenances in the vicinity of the interconnector. In total, the export and import on the interconnector have both been reduced all hours.
SE3-DK1, West Denmark Svenska kraftnät has reduced the export and import capacity for 948 and 1433 hours, respectively, for the interconnector between SE3 and DKi. The main reasons for export reductions set by Svenska kraftnät were failure and maintenance on the interconnector. The main reasons for import reductions set by Svenska kraftnät were failure on the interconnector, maintenance on and in the vicinity of the interconnector, and congestion in the West Coast Corridor. In total, the export and import on the interconnector have been reduced for 1069 and 1527 hours, respectively.
SE3-FI, South Finland Svenska kraftnät has reduced both the export and import capacity for all hours for the interconnector between SE3 and Fl. The reasons for export and import reductions set by Svenska kraftnät were maintenance and thermal limitation on the interconnector, and maintenance in the vicinity of the interconnector.
SE3-NO1, North Norway Svenska kraftnät has reduced the export and import capacity for 807 and 329 hours, respectively, for the interconnector between SE3 and NOi. The main reasons for export reductions set by Svenska kraftnät were congestion in the West Coast Corridor (only export reductions), but for some hours also due to maintenance on the interconnector and maintenance in the vicinity of the interconnector. The reasons for import
26/60
reductions set by Svenska kraftnät were maintenance on the interconnector and maintenance in the vicinity of the interconnector. In total, the export and import on the interconnector have been reduced for 2 196 and 2 208 hours, respectively.
SE4-DE, Germany Svenska kraftnät has reduced the export and import capacity for 184 and 541 hours, respectively, for the interconnector between SE4 and DE. The reason for export reductions set by Svenska kraftnät was maintenance in the vicinity of the interconnector, and for import reductions congestion in the West Coast Corridor. In total, the export and import on the interconnector have been reduced for 1712 and 2 119 hours, respectively.
SE4-DK2, East Denmark Svenska kraftnät has reduced the export and import capacity for 216 and 547 hours, respectively, for the interconnector between SE4 and DK2. The reasons for export reductions set by Svenska kraftnät were planned maintenance in the vicinity of the interconnector. The reason for import reductions set by Svenska kraftnät was mainly due to congestion in the West Coast Corridor and maintenance in the vicinity of the interconnector. In total, the export and import on the interconnector have been reduced for 870 and 1256 hours, respectively.
SE4-PL, Poland Svenska kraftnät has reduced the export and import capacity for 101 and 451 hours, respectively, for the interconnector between SE4 and PL. The reason for export reductions set by Svenska kraftnät was due to maintenance in the vicinity of the interconnector, and for import reductions due to congestion in the West Coast Corridor and maintenance in the vicinity of the interconnector. In total, the export and import on the interconnector have been reduced for 831 and 2 208 hours, respectively.
27/60
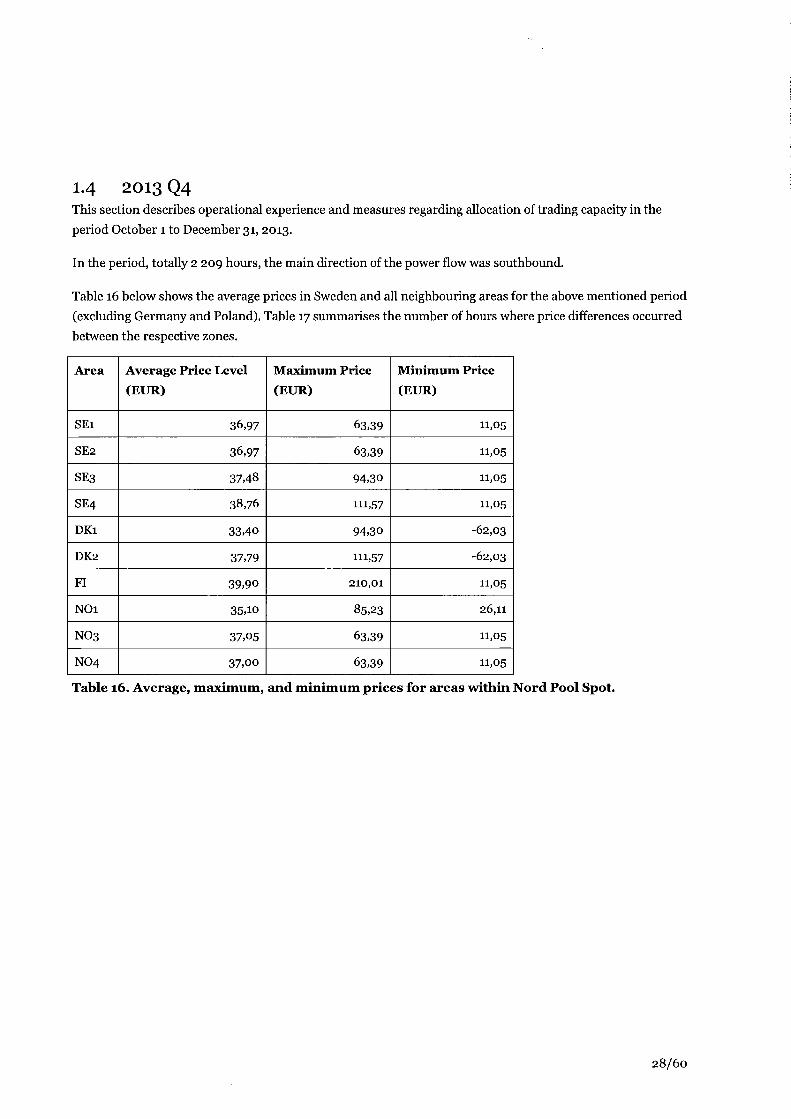
1.4 2013 Q4 This section describes operational experience and measures regarding allocation of trading capacity in the period October i to December 31, 2013.
In the period, totally 2 209 hours, the main direction of the power flow was southbound.
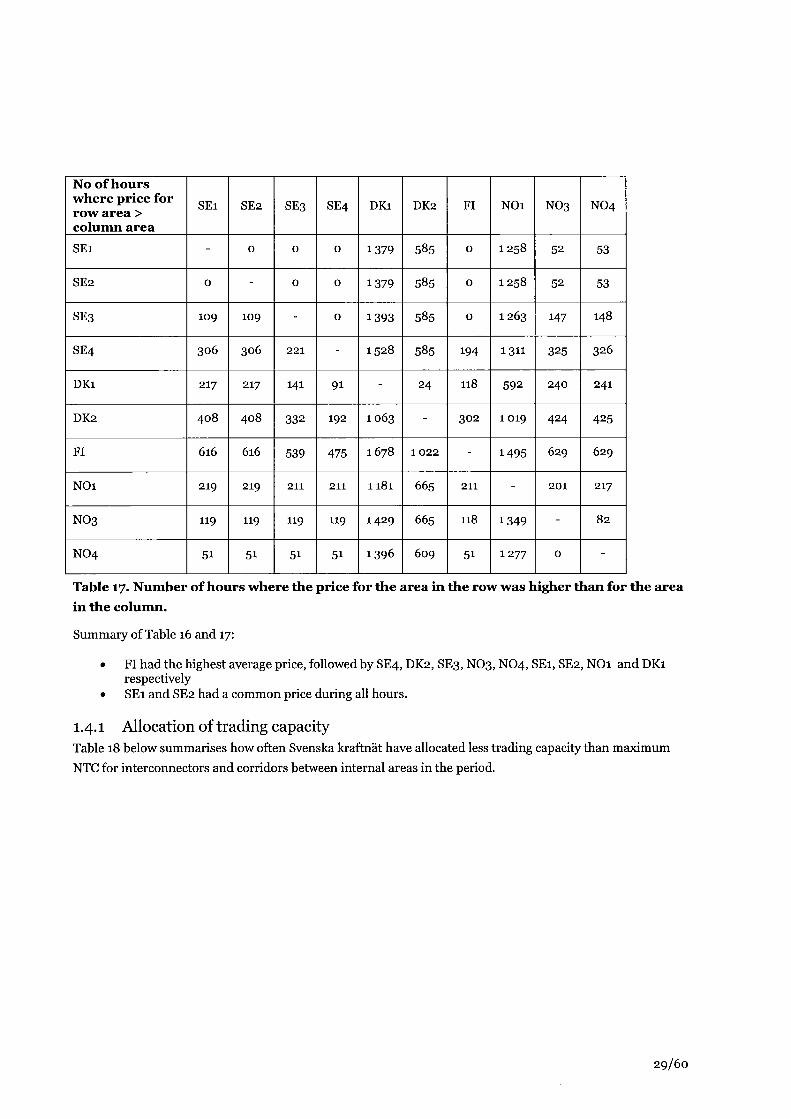
Table 16 below shows the average prices in Sweden and all neighbouring areas for the above mentioned period (excluding Germany and Poland). Table 17 summarises the number of hours where price differences occurred between the respective zones.
Area
SEi
SE2
SE3
SE4
DKi
DK2
Fl
NOi
NO3
NO4
Average Price Level (EUR)
36,97
36,97
37,48
38,76
33,40
37,79
39,90
35,io
37,05
37,oo
Maximum Price (EUR)
63,39
63,39
94,30
m , 5 7
94,30
in ,57
210,01
85,23
63,39
63,39
Minimum Price
(EUR)
11,05
11,05
11,05
11,05
-62,03
-62,03
11,05
26,11
11,05
11,05
Table 16. Average, maximum, and minimum prices for areas within Nord Pool Spöt.
28/60
No of hours where price for row area > column area S E i
SE2
S E 3
SE4
DKi
DK2
Fl
N O i
N O 3
N O 4
S E i
-
0
109
3 0 6
217
4 0 8
616
219
119
51
SE2
0
-
109
3 0 6
217
4 0 8
616
219
119
51
SE3
0
0
-
2 2 1
141
332
539
211
119
51
SE4
0
0
0
-
91
192
475
211
119
51
DKi
1379
1379
1393
1528
-
1063
1678
1181
1429
1396
DK2
585
585
585
585
24
-
1 0 2 2
665
665
609
Fl
0
0
0
194
118
3 0 2
-
211
118
51
N O i
1258
1258
1263
1311
592
1019
1495
-
1349
1277
NO3
52
52
147
325
240
424
629
2 0 1
-
0
NO4
53
53
148
326
241
425
629
2 1 7
82
-
Table 17. Number of hours where the price for the area in the row was higher than for the area in the column.
Summary of Table 16 and 17:
• Fl had the highest average price, followed by SE4, DK2, SE3, NO3, NO4, SEi, SE2, NOi and DKi respectively
• SEi and SE2 had a common price during all hours.
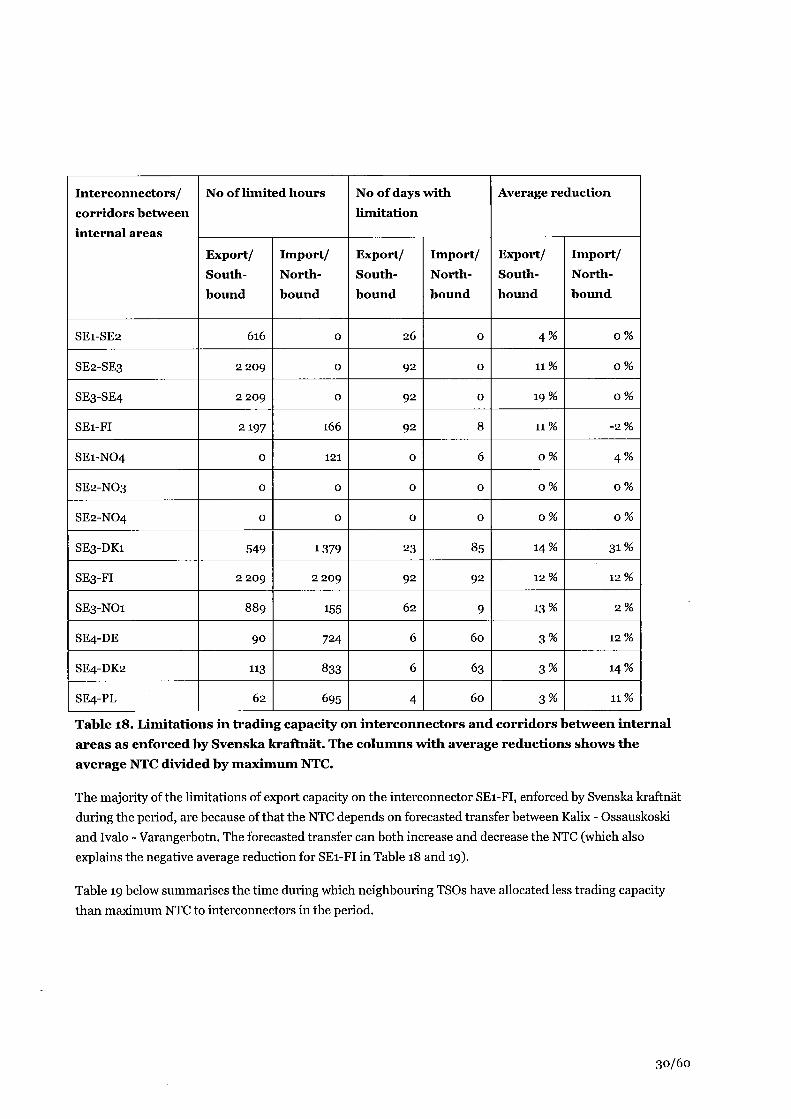
1.4.1 Allocation of trading capacity Table 18 below summarises how often Svenska kraftnät have allocated less trading capacity than maximum NTC for interconnectors and corridors between internal areas in the period.
29/60
Interconnectors / corridors b e t w e e n internal areas
SE1-SE2
SE2-SE3
SE3-SE4
SEl-FI
SE1-NO4
SE2-NO3
SE2-NO4
SE3-DK1
SE3-FI
SE3-NO1
SE4-DE
SE4-DK2
SE4-PL
N o of l imited hours
Export/ Southb o u n d
616
2209
2209
2 197
0
0
0
549
2209
8 8 9
9 0
" 3
62
Import / Northb o u n d
0
0
0
166
121
0
0
1379
2209
155
724
833
695
N o of days wi th l imitat ion
Export/ Southb o u n d
26
92
92
92
0
0
0
23
92
62
6
6
4
Import / Northb o u n d
0
0
0
8
6
0
0
85
92
9
60
63
6 0
Average reduct ion
Export/ Southb o u n d
4%
11%
1 9 %
1 1 %
0 %
0 %
0 %
14%
1 2 %
1 3 %
3 %
3%
3%
Import / Northb o u n d
0 %
0 %
0%
- 2 %
4%
0%
0%
3 1 %
1 2 %
2 %
1 2 %
14%
1 1 %
Table 18. Limitations in trading capacity on interconnectors and corridors between internal areas as enforced by Svenska kraftnät. The columns with average reductions shows the average NTC divided by maximum NTC.
The majority of the limitations of export capacity on the interconnector SEi-FI, enforced by Svenska kraftnät during the period, are because of that the NTC depends on forecasted transfer between Kalix - Ossauskoski and Ivalo - Varangerbotn. The forecasted transfer can both increase and decrease the NTC (which also explains the negative average reduction for SEi-FI in Table 18 and 19).
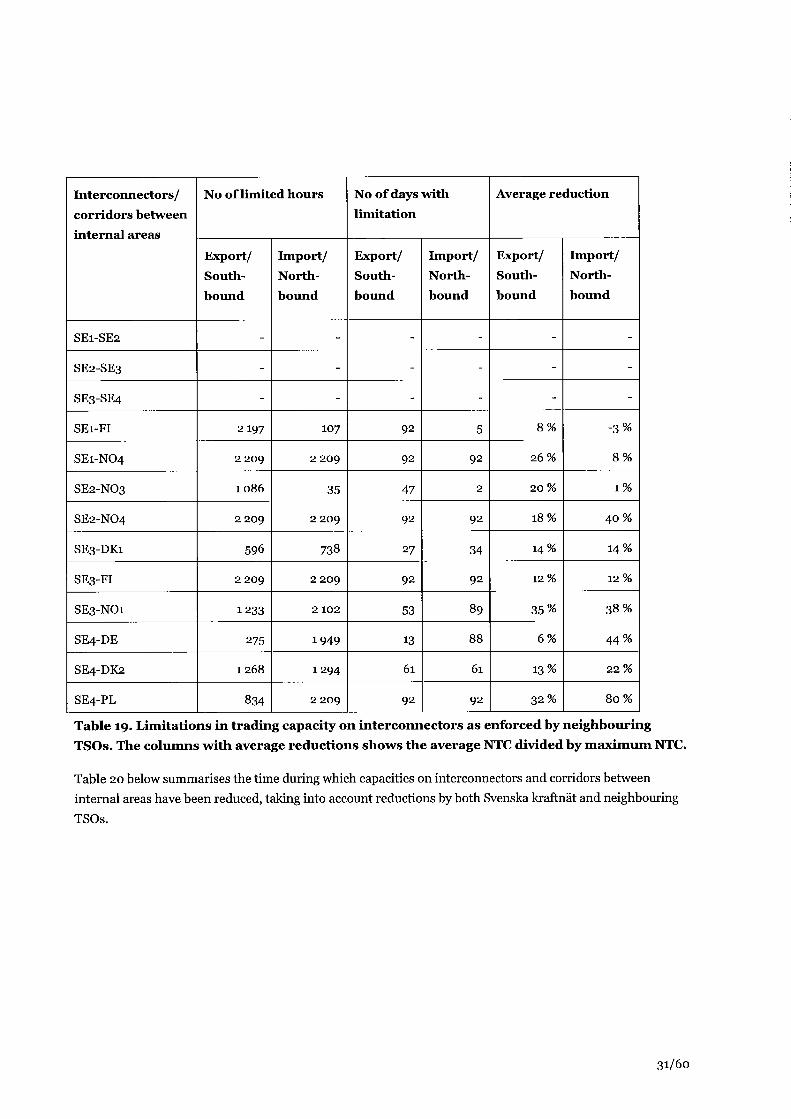
Table 19 below summarises the time during which neighbouring TSOs have allocated less trading capacity than maximum NTC to interconnectors in the period.
30/60
Interconnectors /
corridors be tween
internal areas
SE1-SE2
SE2-SE3
SE3-SE4
SEi-FI
SE1-NO4
SE2-NO3
SE2-NO4
SE3-DK1
SE3-FI
SE3-NO1
SE4-DE
SE4-DK2
SE4-PL
N o of l imited hours
Export/ Southb o u n d
-
-
-
2197
2209
1086
2209
596
2209
1233
275
1268
834
Import / Northb o u n d
-
-
-
107
2209
35
2209
738
2209
2102
1949
1294
2209
N o of days wi th l imitat ion
Export/ Southb o u n d
-
-
-
92
92
47
92
27
92
53
13
61
92
Import / Northb o u n d
-
-
-
5
92
2
92
34
92
89
88
61
92
Average reduction
Export/ Southb o u n d
-
-
-
8%
26%
2 0 %
18%
14%
12%
35%
6%
13%
32%
Import / Northb o u n d
-
-
-
-3%
8%
1%
4 0 %
14%
12%
38%
4 4 %
22%
80%
Table 19. Limitations in trading capacity on interconnectors as enforced by neighbouring TSOs. The columns with average reductions shows the average NTC divided by maximum NTC.
Table 20 below summarises the time during which capacities on interconnectors and corridors between internal areas have been reduced, taking into account reductions by both Svenska kraftnät and neighbouring TSOs.
31/60

Interconnectors /
corridors be tween
internal areas
SE1-SE2
SE2-SE3
SE3-SE4
SEl-FI
SE1-NO4
SE2-NO3
SE2-NO4
SE3-DK1
SE3-FI
SE3-NO1
SE4-DE
SE4-DK2
SE4-PL
N o of l imited hours
Export/ Southb o u n d
616
2209
2209
2 197
2209
1086
2209
597
2209
1773
344
1381
844
Import /
North
b o u n d
0
0
0
166
2209
35
2209
1522
2209
2102
2 149
1892
2 2 0 9
N o of days with l imitat ion
Export/ Southb o u n d
26
92
92
92
92
47
92
27
92
8 8
17
67
92
Import / Northbound
0
0
0
8
92
2
92
8 8
92
89
92
89
92
Average reduction
Export/ Southb o u n d
4%
1 1 %
1 9 %
1 1 %
2 6 %
2 0 %
1 8 %
15%
1 2 %
4 4 %
9%
16%
3 4 %
Import / Northb o u n d
0 %
0 %
0 %
- 2 %
1 2 %
1%
4 0 %
3 2 %
1 2 %
3 9 %
4 9 %
3 3 %
8 0 %
Table 20. Final limitations in trading capacity on interconnectors and corridors between internal areas as enforced by both Svenska kraftnät and neighbouring TSOs. The columns with average reductions shows the average NTC divided by maximum NTC.
Detailed information for each limitation is provided in the attached Tables D2 to D5 in Appendix D and in the attachment. This information includes the reason for each limitation.
32/60
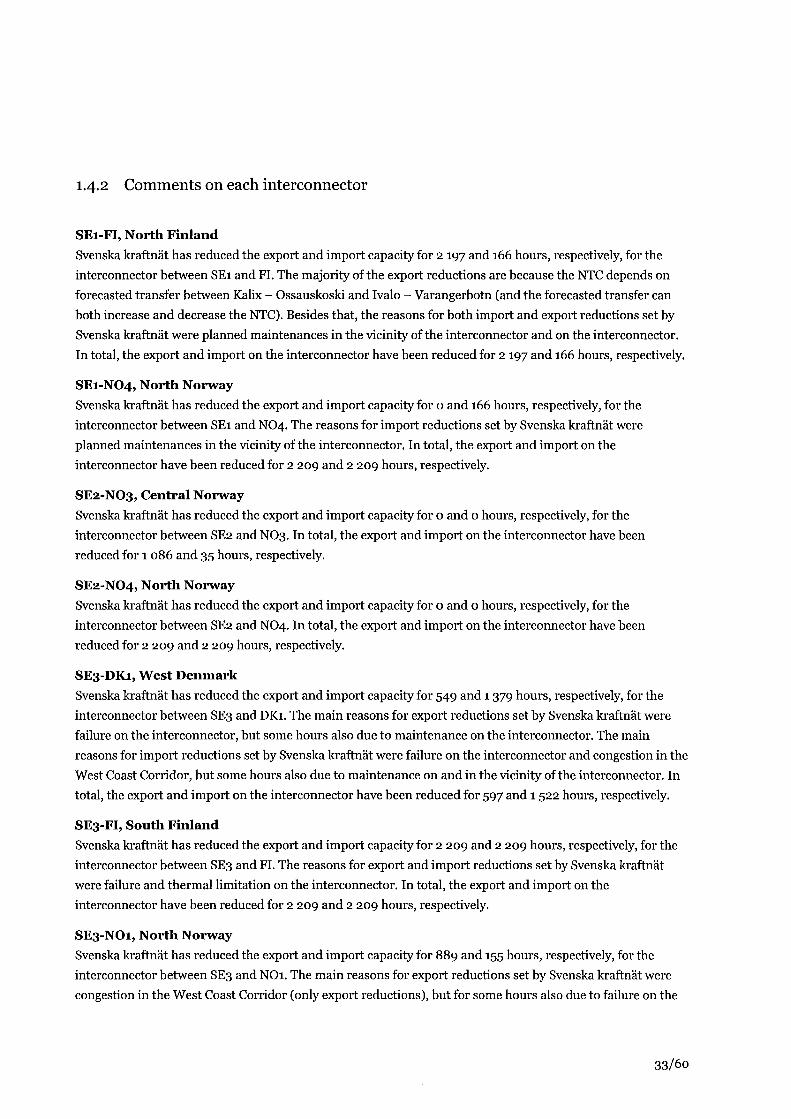
1.4-2 Comments on each interconnector
SEl-FI, North Finland Svenska kraftnät has reduced the export and import capacity for 2 197 and 166 hours, respectively, for the interconnector between SEi and FL The majority of the export reductions are because the NTC depends on forecasted transfer between Kalix - Ossauskoski and Ivalo - Varangerbotn (and the forecasted transfer can both increase and decrease the NTC). Besides that, the reasons for both import and export reductions set by Svenska kraftnät were planned maintenances in the vicinity of the interconnector and on the interconnector. In total, the export and import on the interconnector have been reduced for 2 197 and 166 hours, respectively.
SE1-NO4, North Norway Svenska kraftnät has reduced the export and import capacity for o and 166 hours, respectively, for the interconnector between SEi and NO4. The reasons for import reductions set by Svenska kraftnät were planned maintenances in the vicinity of the interconnector. In total, the export and import on the interconnector have been reduced for 2 209 and 2 209 hours, respectively.
SE2-NO3, Central Norway Svenska kraftnät has reduced the export and import capacity for o and o hours, respectively, for the interconnector between SE2 and NO3. In total, the export and import on the interconnector have been reduced for 1 086 and 35 hours, respectively.
SE2-NO4, North Norway Svenska kraftnät has reduced the export and import capacity for o and o hours, respectively, for the interconnector between SE2 and NO4. In total, the export and import on the interconnector have been reduced for 2 209 and 2 209 hours, respectively.
SE3-DK1, West Denmark Svenska kraftnät has reduced the export and import capacity for 549 and 1379 hours, respectively, for the interconnector between SE3 and DKi. The main reasons for export reductions set by Svenska kraftnät were failure on the interconnector, but some hours also due to maintenance on the interconnector. The main reasons for import reductions set by Svenska kraftnät were failure on the interconnector and congestion in the West Coast Corridor, but some hours also due to maintenance on and in the vicinity of the interconnector. In total, the export and import on the interconnector have been reduced for 597 and 1522 hours, respectively.
SE3-FI, South Finland Svenska kraftnät has reduced the export and import capacity for 2 209 and 2 209 hours, respectively, for the interconnector between SE3 and Fl. The reasons for export and import reductions set by Svenska kraftnät were failure and thermal limitation on the interconnector. In total, the export and import on the interconnector have been reduced for 2 209 and 2 209 hours, respectively.
SE3-NO1, North Norway Svenska kraftnät has reduced the export and import capacity for 889 and 155 hours, respectively, for the interconnector between SE3 and NOi. The main reasons for export reductions set by Svenska kraftnät were congestion in the West Coast Corridor (only export reductions), but for some hours also due to failure on the
33/6o
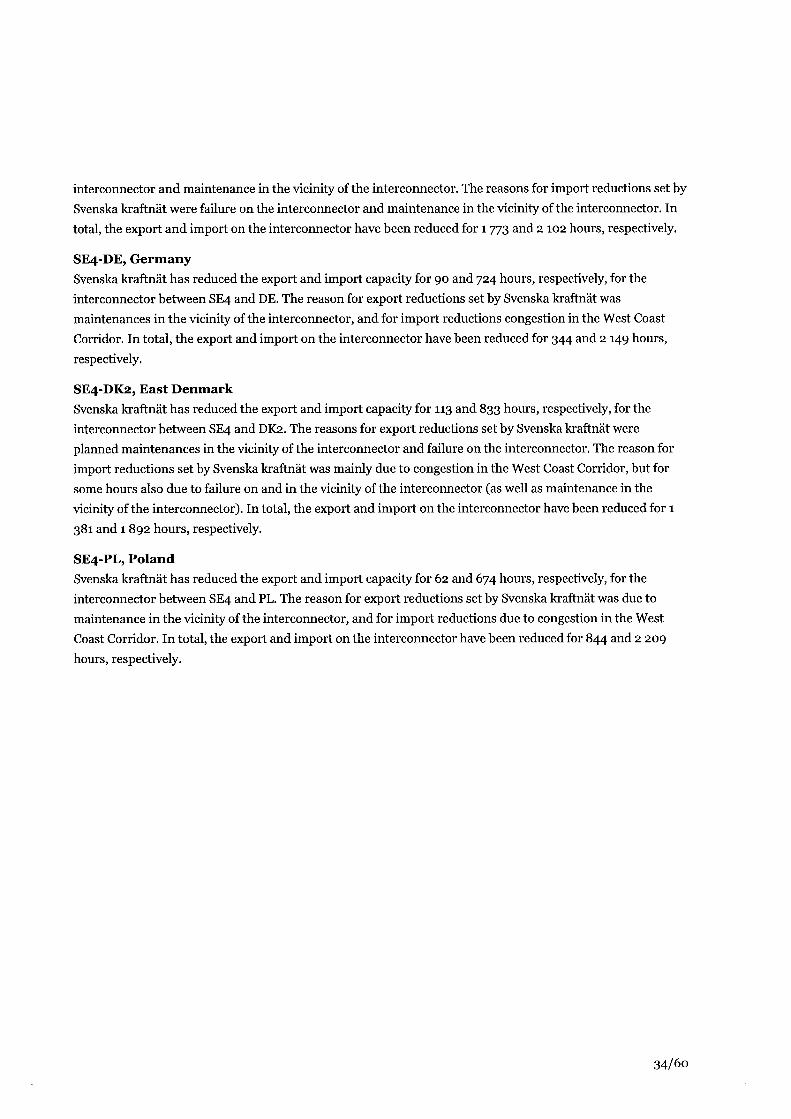
interconnector and maintenance in the vicinity of the interconnector. The reasons for import reductions set by Svenska kraftnät were failure on the interconnector and maintenance in the vicinity of the interconnector. In total, the export and import on the interconnector have been reduced for 1773 and 2 102 hours, respectively.
SE4-DE, Germany Svenska kraftnät has reduced the export and import capacity for 90 and 724 hours, respectively, for the interconnector between SE4 and DE. The reason for export reductions set by Svenska kraftnät was maintenances in the vicinity of the interconnector, and for import reductions congestion in the West Coast Corridor. In total, the export and import on the interconnector have been reduced for 344 and 2 149 hours, respectively.
SE4-DK2, East Denmark Svenska kraftnät has reduced the export and import capacity for 113 and 833 hours, respectively, for the interconnector between SE4 and DK2. The reasons for export reductions set by Svenska kraftnät were planned maintenances in the vicinity of the interconnector and failure on the interconnector. The reason for import reductions set by Svenska kraftnät was mainly due to congestion in the West Coast Corridor, but for some hours also due to failure on and in the vicinity of the interconnector (as well as maintenance in the vicinity of the interconnector). In total, the export and import on the interconnector have been reduced for 1 381 and 1892 hours, respectively.
SE4-PL, Poland Svenska kraftnät has reduced the export and import capacity for 62 and 674 hours, respectively, for the interconnector between SE4 and PL. The reason for export reductions set by Svenska kraftnät was due to maintenance in the vicinity of the interconnector, and for import reductions due to congestion in the West Coast Corridor. In total, the export and import on the interconnector have been reduced for 844 and 2 209 hours, respectively.
34/60
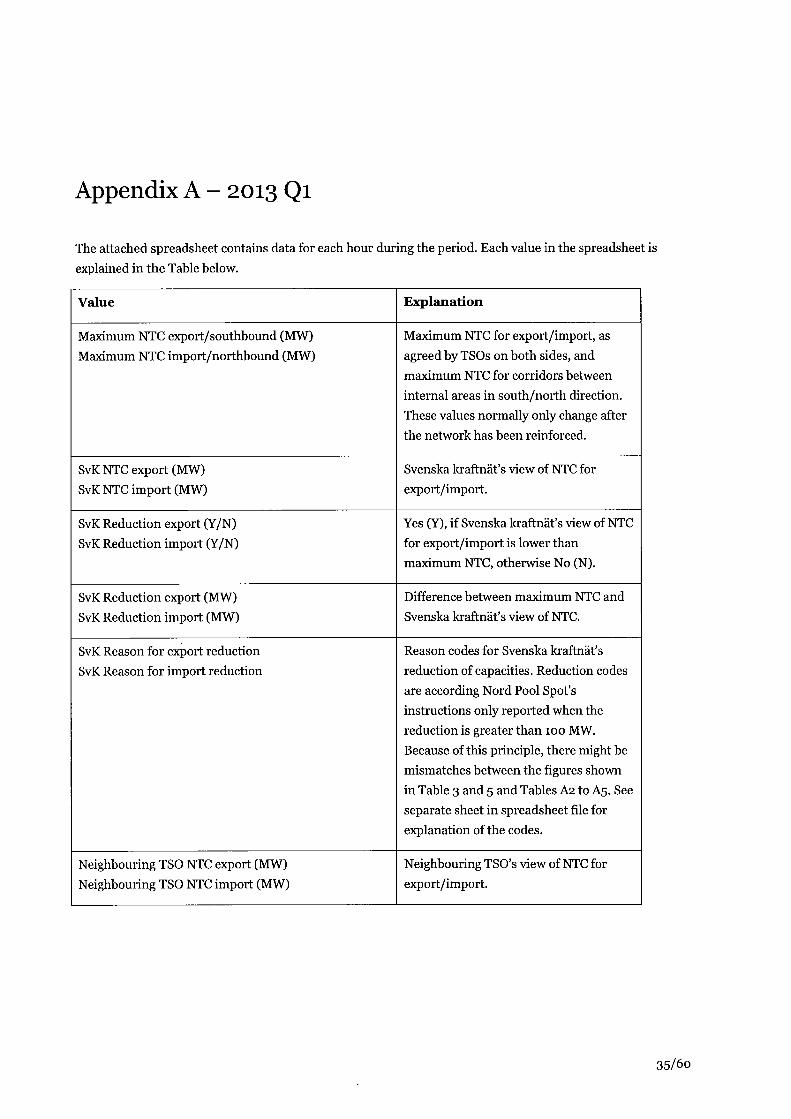
Appendix A - 2013 Qi
The attached spreadsheet contains data for each hour during the period. Each value in the spreadsheet is explained in the Table below.
Value
Maximum NTC export/southbound (MW) Maximum NTC import/northbound (MW)
SvK NTC export (MW) SvK NTC import (MW)
SvK Reduction export (Y/N) SvK Reduction import (Y/N)
SvK Reduction export (MW) SvK Reduction import (MW)
SvK Reason for export reduction SvK Reason for import reduction
Neighbouring TSO NTC export (MW) Neighbouring TSO NTC import (MW)
Explanation
Maximum NTC for export/import, as agreed by TSOs on both sides, and maximum NTC for corridors between internal areas in south/north direction. These values normally only change after the network has been reinforced.
Svenska kraftnäfs view of NTC for export/import.
Yes (Y), if Svenska kraftnäfs view of NTC for export/import is lower than maximum NTC, otherwise No (N).
Difference between maximum NTC and Svenska kraftnäfs view of NTC.
Reason codes for Svenska kraftnäfs reduction of capacities. Reduction codes are according Nord Pool Spof s instructions only reported when the reduction is greater than 100 MW. Because of this principle, there might be mismatches between the figures shown in Table 3 and 5 and Tables A2 to A5. See separate sheet in spreadsheet file for explanation of the codes.
Neighbouring TSO's view of NTC for export/import.
35/60
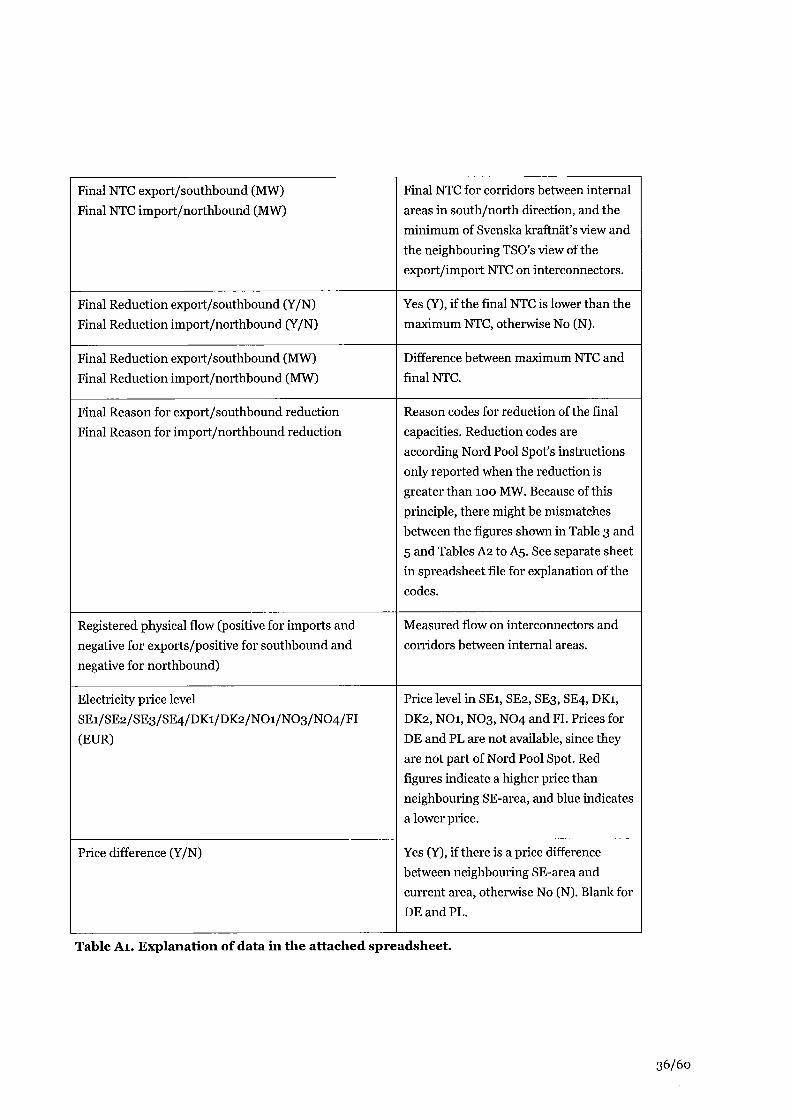
Final NTC export/southbound (MW) Final NTC import/northbound (MW)
Final Reduction export/southbound (Y/N) Final Reduction import/northbound (Y/N)
Final Reduction export/southbound (MW) Final Reduction import/northbound (MW)
Final Reason for export/southbound reduction Final Reason for import/northbound reduction
Registered physical flow (positive for imports and negative for exports/positive for southbound and negative for northbound)
Electricity price level SE1/SE2/SE3/SE4/DK1/DK2/NO1/NO3/NO4/FI (EUR)
Price difference (Y/N)
Final NTC for corridors between internal areas in south/north direction, and the minimum of Svenska kraftnäfs view and the neighbouring TSO's view of the export/import NTC on interconnectors.
Yes (Y), if the final NTC is lower than the maximum NTC, otherwise No (N).
Difference between maximum NTC and final NTC.
Reason codes for reduction of the final capacities. Reduction codes are according Nord Pool Spof s instructions only reported when the reduction is greater than 100 MW. Because of this principle, there might be mismatches between the figures shown in Table 3 and 5 and Tables A2 to A5. See separate sheet in spreadsheet file for explanation of the codes.
Measured flow on interconnectors and corridors between internal areas.
Price level in SEi, SE2, SE3, SE4, DKi, DK2, NOi, NO3, NO4 and FL Prices for DE and PL are not available, since they are not part of Nord Pool Spöt. Red figures indicate a higher price than neighbouring SE-area, and blue indicates a lower price.
Yes (Y), if there is a price difference between neighbouring SE-area and current area, otherwise No (N). Blank for DE and PL.
Table Al. Explanation of data in the attached spreadsheet.
36/60
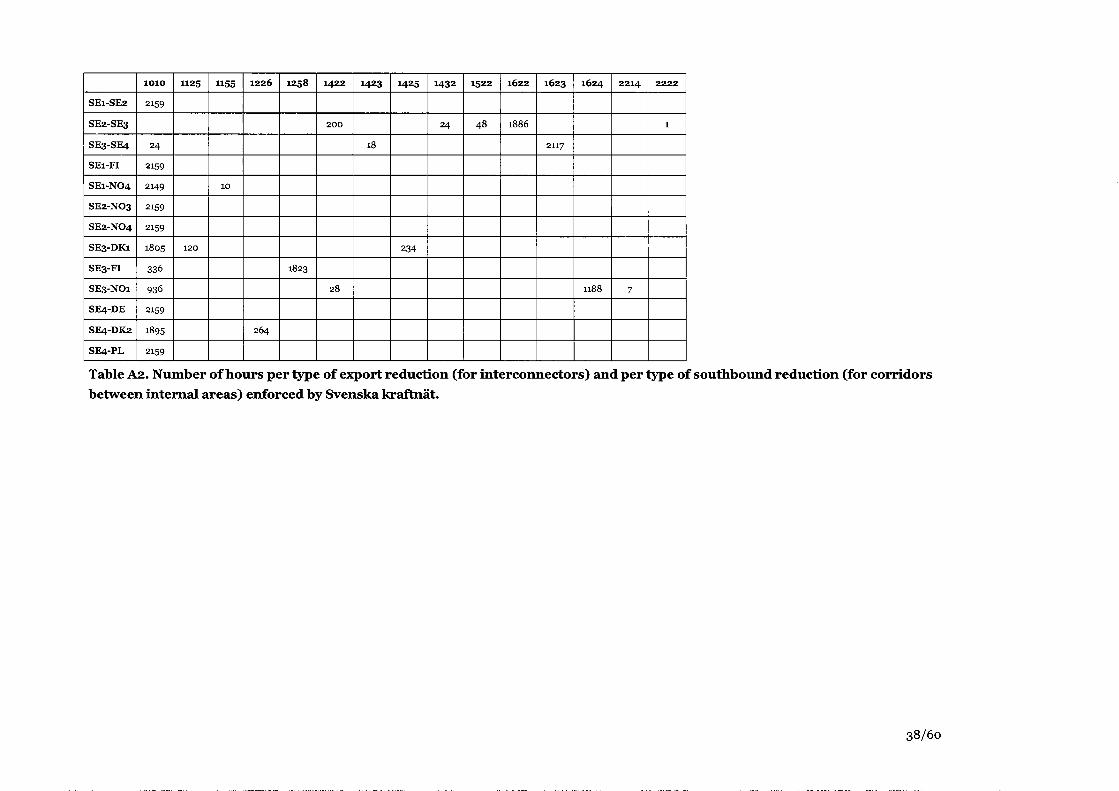
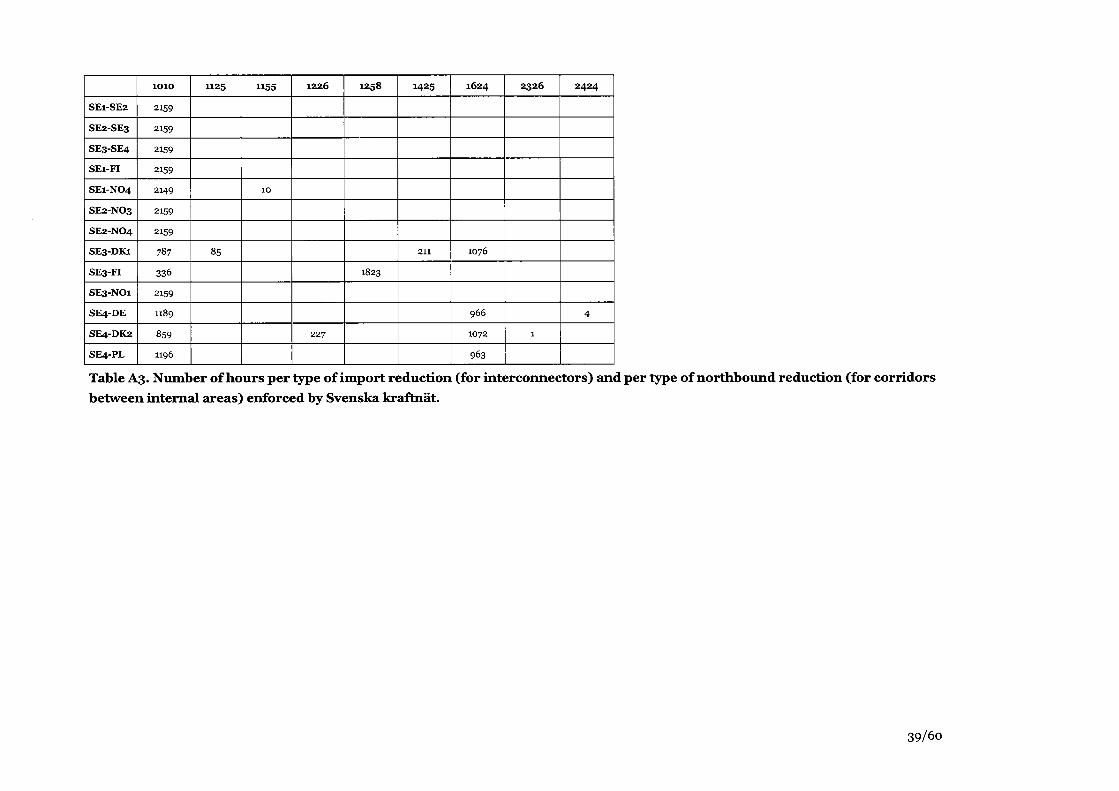
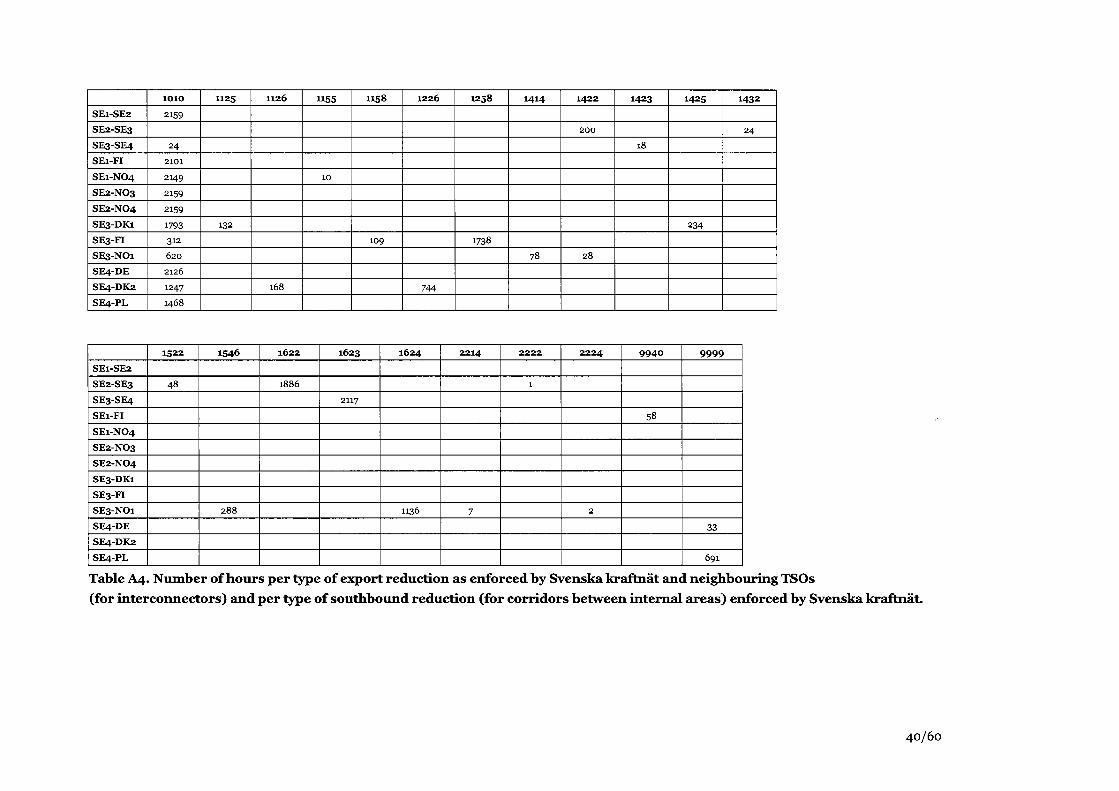
Tables A2 to A5 shows how of many hours the capacities have been reduced per type of reduction for each interconnector and corridor between internal areas. The reason codes are explained in the attached spreadsheet.
37/6o
SE1-SE2
SE2-SE3
SE3-SE4
SEl-FI
SE1-NO4
SE2-NO3
SE2-NO4
SE3-DK1
SE3-FI
SE3-NO1
SE4-DE
SE4-DK2
SE4-PL
1010
2159
24
2159
2149
2159
2159
1805
336
936
2159
1895
2159
1125
120
1155
10
1226
264
1258
1823
1422
200
28
1423
18
1425
234
1432
24
1522
48
1622
1886
1623
2117
1624
1188
2214
7
2222
1
Table A2. Number of hours per type of export reduction (for interconnectors) and per type of southbound reduction (for corridors between internal areas) enforced by Svenska kraftnät.
38/60
SE1-SE2
SE2-SE3
SE3-SE4
SEl-FI
SE1-NO4
SE2-NO3
SE2-NO4
SE3-DK1
SE3-FI
SE3-NO1
SE4-DE
SE4-DK2
SE4-PL
IOIO
2159
2159
2159
2159
2149
2159
2159
787
336
2159
1189
859
1196
1125
85
1155
10
1226
227
1258
1823
1425
211
1624
IO76
966
1072
963
2326
1
2424
4
Table A3. Number of hours per type of import reduction (for interconnectors) and per type of northbound reduction (for corridors between internal areas) enforced by Svenska kraftnät.
39/60
SE1-SE2
SE2-SE3
SE3-SE4 SEl-FI
SE1-NO4 SE2-NO3
SE2-NO4 SE3-DK1
SE3-FI
SE3-NO1 S E 4 D E
SE4-DK2
SE4-PL
IOIO
2159
24 2101
2149
2159
2159
1793 312 620
2126
1247
1468
1125
132
1126
168
W55
10
1158
109
1226
744
1258
1738
1414
78
1422
200
28
1423
18
1425
234
1432
24
SE1-SE2
SE2-SE3
SE3-SE4
SEl-FI
SE1-NO4
SE2-NO3
SE2-NO4 SE3-DK1
SE3-FI
SE3-NO1 SE4-DE
SE4-DK2
SE4-PL
1522
48
1546
288
1622
1886
1623
2117
1624
1136
2214
7
2 2 2 2
1
2 2 2 4
2
9 9 4 0
58
9999
33
691
Table A4. Number of hours per type of export reduction as enforced by Svenska kraftnät and neighbouring TSOs (for interconnectors) and per type of southbound reduction (for corridors between internal areas) enforced by Svenska kraftnät.
40/60
SE1-SE2
SE2-SE3
SE3-SE4 SEl-FI
SE1-NO4
SE2-NO3 SE2-NO4
SE3-DK1
SE3-FI
SE3-NO1 SE4-DE
SE4-DK2
SE4-PL
SE1-SE2
SE2-SE3
SE3-SE4 SEl-FI
SE1-NO4
SE2-NO3
SE2-NO4 SE3-DK1
SE3-FI
SE3-NO1 SE4-DE
SE4-DIC2
SE4-PL
IOIO
2159
2159
2159 2108
2149
2159
2159
775 312 862
803
519
1414
104
1125
97
1425
211
1126
65
1546
180
1155
10
1624
IO76
755
929 107
1158
110
1745
1012
1226
646
1258
1737
2214
1
9940
51
9999
601
2052
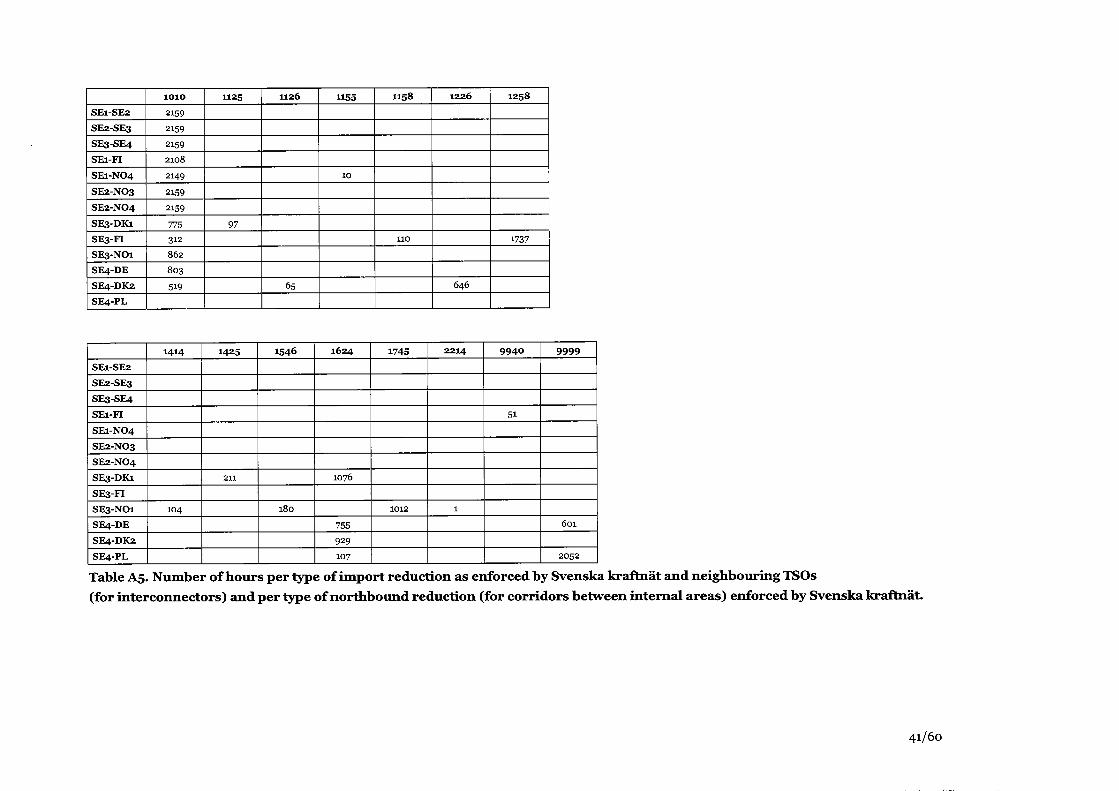
Table A5. Number of hours per type of import reduction as enforced by Svenska kraftnät and neighbouring TSOs (for interconnectors) and per type of northbound reduction (for corridors between internal areas) enforced by Svenska kraftnät.
41/60
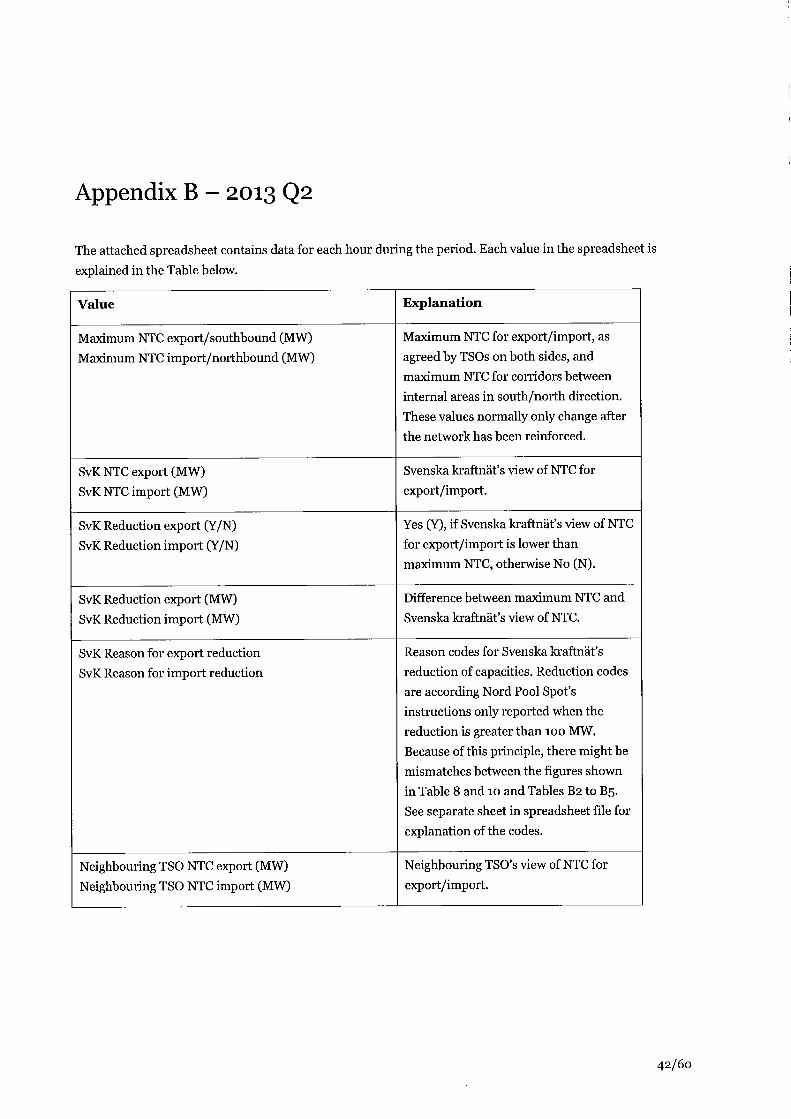
Appendix B - 2013 Q2
The attached spreadsheet contains data for each hour during the period. Each value in the spreadsheet is explained in the Table below.
Value
Maximum NTC export/southbound (MW) Maximum NTC import/northbound (MW)
SvK NTC export (MW) SvK NTC import (MW)
SvK Reduction export (Y/N) SvK Reduction import (Y/N)
SvK Reduction export (MW) SvK Reduction import (MW)
SvK Reason for export reduction SvK Reason for import reduction
Neighbouring TSO NTC export (MW) Neighbouring TSO NTC import (MW)
Explanation
Maximum NTC for export/import, as agreed by TSOs on both sides, and maximum NTC for corridors between internal areas in south/north direction. These values normally only change after the network has been reinforced.
Svenska kraftnäfs view of NTC for export/import.
Yes (Y), if Svenska kraftnäfs view of NTC for export/import is lower than maximum NTC, otherwise No (N).
Difference between maximum NTC and Svenska kraftnäfs view of NTC.
Reason codes for Svenska kraftnäfs reduction of capacities. Reduction codes are according Nord Pool Spof s instructions only reported when the reduction is greater than 100 MW. Because of this principle, there might be mismatches between the figures shown in Table 8 and 10 and Tables B2 to B5. Seé separate sheet in spreadsheet file for explanation of the codes.
Neighbouring TSO's view of NTC for export/import.
42/60
Final NTC export/southbound (MW) Final NTC import/northbound (MW)
Final Reduction export/southbound (Y/N) Final Reduction import/northbound (Y/N)
Final Reduction export/southbound (MW) Final Reduction import/northbound (MW)
Final Reason for export/southbound reduction Final Reason for import/northbound reduction
Registered physical flow (positive for imports and negative for exports/positive for southbound and negative for northbound)
Electricity price level SE1/SE2/SE3/SE4/DK1/DK2/NO1/NO3/NO4/FI (EUR)
Price difference (Y/N)
Final NTC for corridors between internal areas in south/north direction, and the minimum of Svenska kraftnäfs view and the neighbouring TSO's view of the export/import NTC on interconnectors.
Yes (Y), if the final NTC is lower than the maximum NTC, otherwise No (N).
Difference between maximum NTC and final NTC.
Reason codes for reduction of the final capacities. Reduction codes are according Nord Pool Spof s instructions only reported when the reduction is greater than 100 MW. Because of this principle, there might be mismatches between the figures shown in Table 8 and 10 and Tables B2 to B5. See separate sheet in spreadsheet file for explanation of the codes.
Measured flow on interconnectors and corridors between internal areas.
Price level in SEi, SE2, SE3, SE4, DKi, DK2, NOi, N03, NO4 and Fl. Prices for DE and PL are not available, since they are not part of Nord Pool Spöt. Red figures indicate a higher price than neighbouring SE-area, and blue indicates a lower price.
Yes (Y), if there is a price difference between neighbouring SE-area and current area, otherwise No (N). Blank for DE and PL.
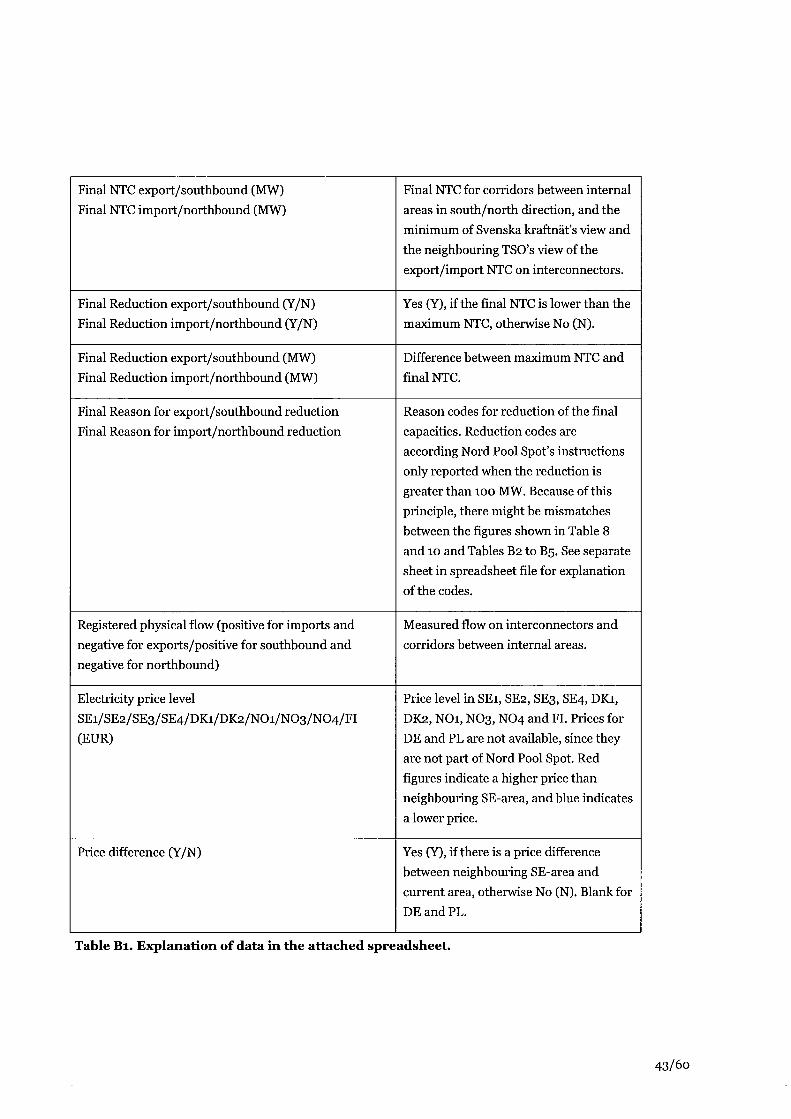
Table Bl. Explanation of data in the attached spreadsheet.
43/6o
Tables B2 to B5 shows how of many hours the capacities have been reduced per type of reduction for each interconnector and corridor between internal areas. The reason codes are explained in the attached spreadsheet.
44/60
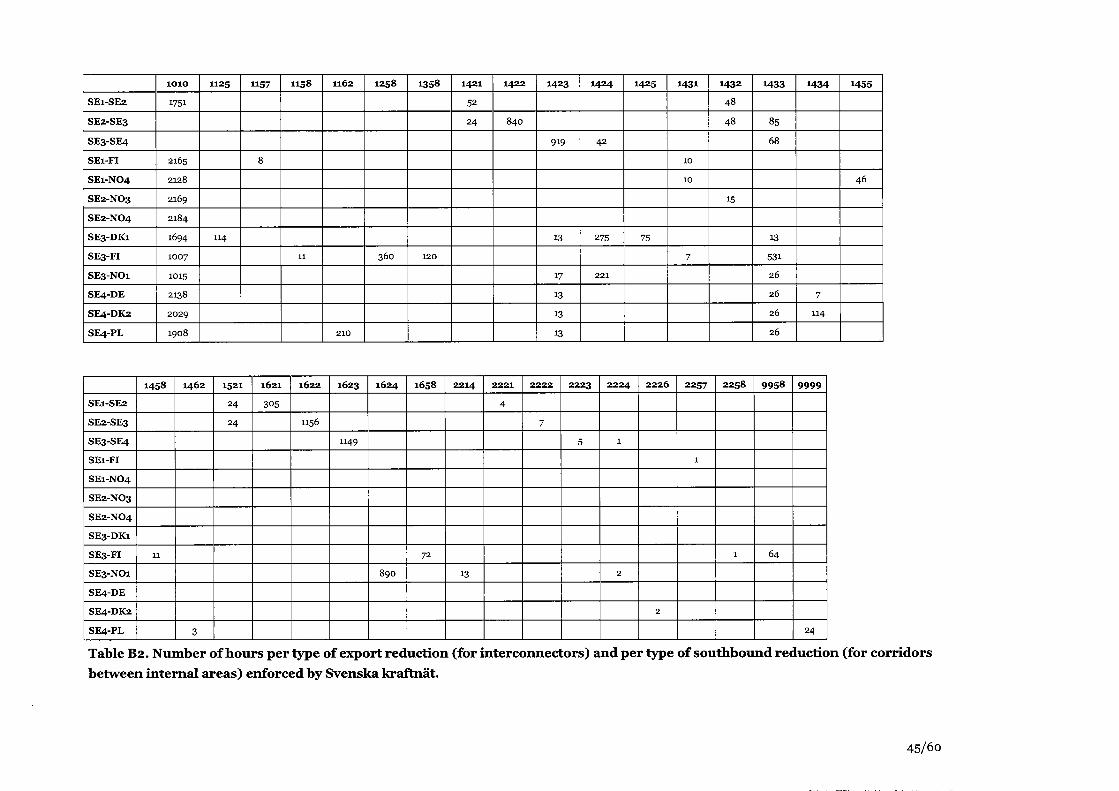
SE1-SE2
SE2-SE3
SE3-SE4
SEl-FI
SE1-NO4
SE2-NO3
SE2-NO4
SE3-DK1
SE3-FI
SE3-NO1
SE4-DE
SE4-DK2
SE4-PL
1010
1751
2165
2128
2169
2184
1694
1007
1015
2138
2029
1908
1125
114
1157
8
1158
11
1162
210
1258
3 6 0
1358
120
1421
52
2 4
1422
8 4 0
1423
919
13
17
13
13
13
1424
4 2
275
2 2 1
1425
75
1431
10
10
7
1432
4 8
4 8
15
1433
8 5
6 8
13
5 3 1
2 6
2 6
26
2 6
1434
7
114
1455
4 6
SE1-SE2
SE2-SE3
SE3-SE4
SEl-FI
SE1-NO4
SE2-NO3
SE2-NO4
SE3-DK1
SE3-FI
SE3-NO1
SE4-DE
SE4-DK2
SE4-PL
1458
11
1462
3
1521
2 4
2 4
1621
3 0 5
1622
1156
1623
1149
1624
8 9 0
1658
72
2214
13
2221
4
2222
7
2223
5
2 2 2 4
1
2
2226
2
2257
1
2258
1
9 9 5 8
6 4
9 9 9 9
2 4
Table B2. Number of hours per type of export reduction (for interconnectors) and per type of southbound reduction (for corridors between internal areas) enforced by Svenska kraftnät.
45/60
SE1-SE2
SE2-SE3
SE3-SE4
SEl-FI
SE1-NO4
SE2-NO3
SE2-NO4
SE3-DK1
SE3-FI
SE3-NO1
SE4-DE
SE4-DK2
SE4-PL
SE1-SE2
SE2-SE3
SE3-SE4
SEl-FI
SE1-NO4
SE2-NO3
SE2-NO4
SE3-DK1
SE3-FI
SE3-NO1
SE4-DE
SE4-DK2
SE4-PL
IOIO
2184
2184
2184
2062
2138
2169
2184
979
983
1854
1260
1013
1212
1455
4 6
1125
88
1458
11
1158
11
1462
3
1162
2 5 0
1521
48
1258
2 6 4
1624
741
7 8 0
898
656
1358
120
1626
1
1423
13
17
13
13
13
I658
72
1424
2 6 2
275
98
104
2 4
2214
10
1425
75
1431
73
7
1432
15
1433
26
651
2 6
2 6
2 6
26
1434
7
114
2223
2
2 2 2 4
2
2226
13
2257
1
2258
1
9958
64
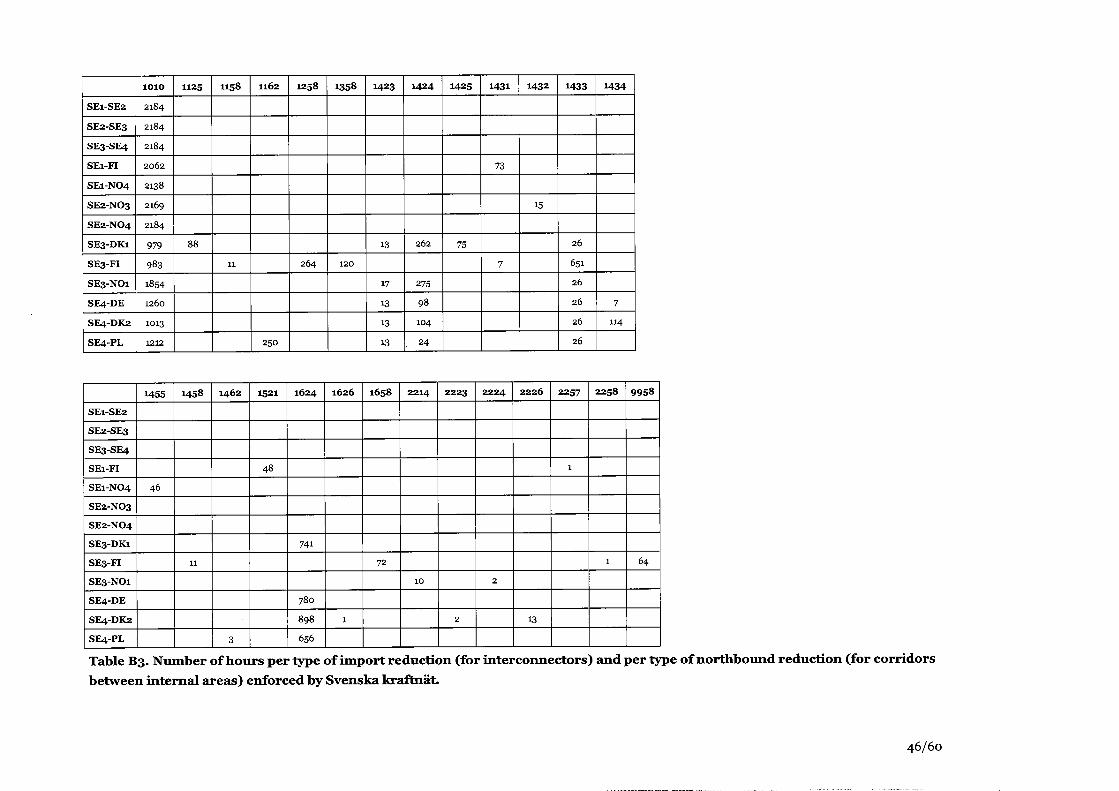
Table B3. Number of hours per type of import reduction (for interconnectors) and per type of northbound reduction (for corridors between internal areas) enforced by Svenska kraftnät.
46/60
SE1-SE2
SE2-SE3
SE3-SE4 SEl-FI
SE1-NO4 SE2-NO3
SE2-NO4 SE3-DK1
SE3-FI
SE3-NO1 SE4-DE
SE4-DK2
SE4-PL
1010
1751
2081
1943 1581 2101
1457
9 4 9
4 6 7
2044 1550
1196
1125
2 6 7
1126
114
1157
8
1158
26
1162
2 4
1225
48
1258
4 3 2
1325
152
1358
120
1414
125
1418
8 2
8 2
1421
52
2 4
1422
8 4 0
1423
919
13
17
13
13
13
1424
4 2
8 2
221
1425
66
1431
94 10
7
1432
4 8
48
15
1433
85
68
13
5 2 6
26
26
26
9
1434
7
114
1442
8 6
1443
3 5 8
1445
2 2 9
SE1-SE2
SE2-SE3
SE3-SE4
SEl-FI
SE1-NO4
SE2-NO3 SE2-NO4
SE3-DK1
SE3-FI
SE3-NO1 SE4-DE
SE4-DK2
SE4-PL
1447
31
4 3 9
31
2 3 5
1450
59
67
52
1455
59
1458
11
1462
3
1521
24
2 4
1545
4 3
1614
18
1621
3 0 5
1622
1156
1623
1149
1624
7 8 9
6
1658
4 8
2214
12
2221
4 2222
7
2223
5
2 2 2 4
1
2
2226
3
2257
1
2258
1
2 4 2 4
7
9958
64
9999
94
9 3 2
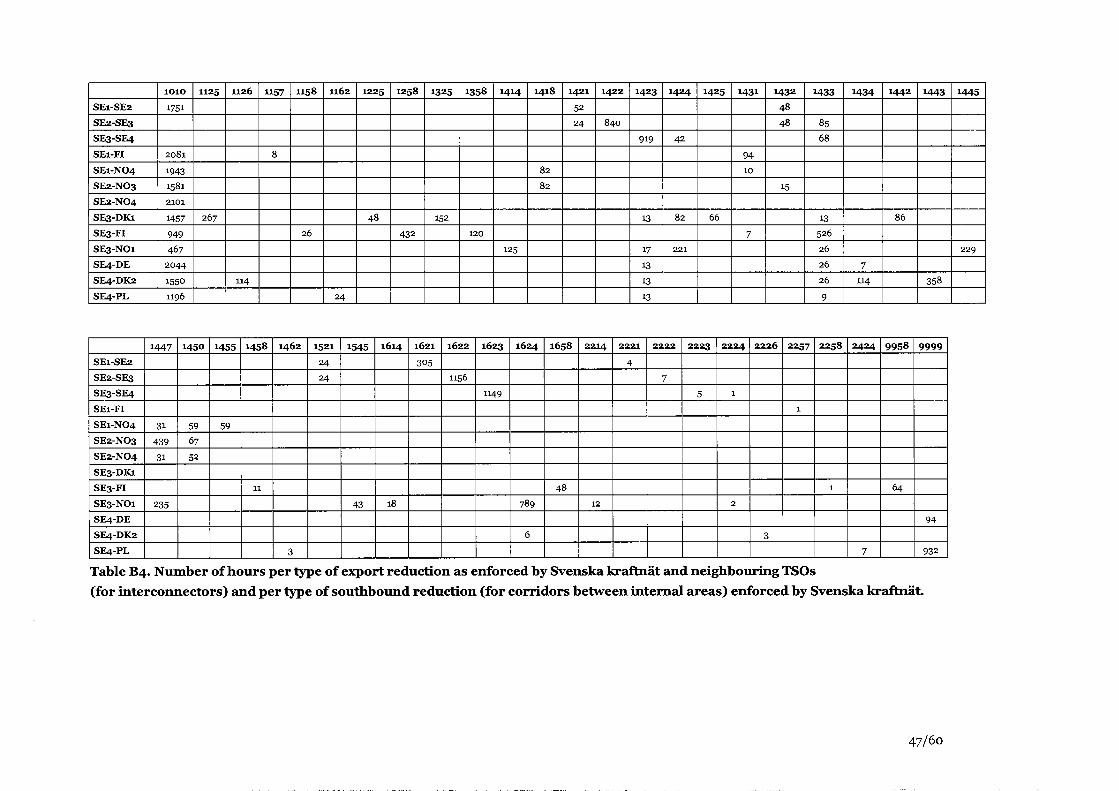
Table B4. Number of hours per type of export reduction as enforced by Svenska kraftnät and neighbouring TSOs (for interconnectors) and per type of southbound reduction (for corridors between internal areas) enforced by Svenska kraftnät.
47/60
SE1-SE2
SE2-SE3
SE3-SE4 SEl-FI
SE1-NO4 SE2-NO3
SE2-NO4 SE3-DK1
SE3-FI
SE3-NO1
SE4-DE SE4-DK2
SE4-PL
SE1-SE2
SE2-SE3 SE3-SE4
SEl-FI
SE1-NO4
SE2-NO3
SE2-NO4 SE3-DK1
SE3-FI
SE3-NO1
SE4-DE SE4-DK2
SE4-PL
IOIO
2184
2184
2184
1978
1938
2169
2101
779
9 2 5
672
815
767
1450
74
52
1125
166
1455
59
1126
8 2
1458
11
1158
21
1521
48
1162
54
1545
122
1225
37
1614
32
1258
336
1624
753
751
869 132
1325
139
1626
1
1358
120
1658
4 8
1414
125
1745
348
1418
8 2
2214
11
1423
13
17
13
13
2223
2
1424
2 0 2
275
98 89 10
2 2 2 4
2
1425
69
2226
9
1431
157
7
2245
10
1432
15
2257
1
1433
2 6
651
2 6
2 6
2 6
2258
1
1434
7
114
2 4 2 4
2 4
1443
212
9958
64
1445
3 0 9
9 9 9 9
4 7 4
1964
1447
31
31
2 3 5
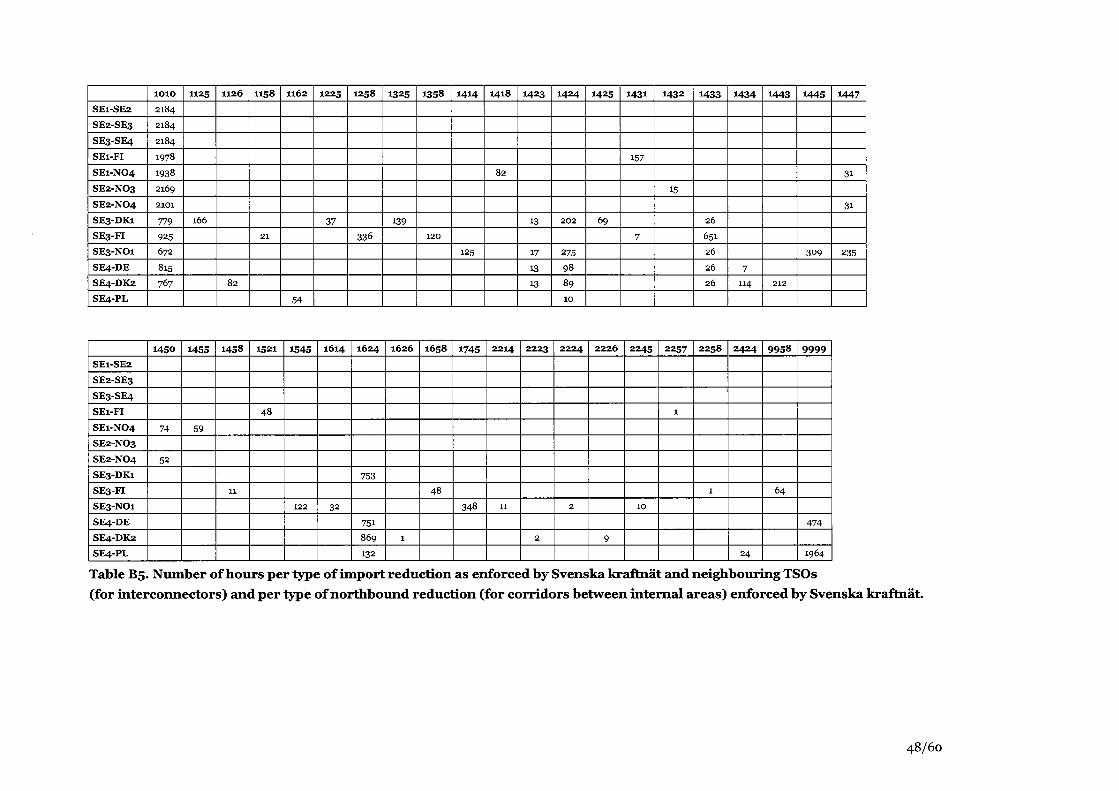
Table B5. Number of hours per type of import reduction as enforced by Svenska kraftnät and neighbouring TSOs (for interconnectors) and per type of northbound reduction (for corridors between internal areas) enforced by Svenska kraftnät.
48/60
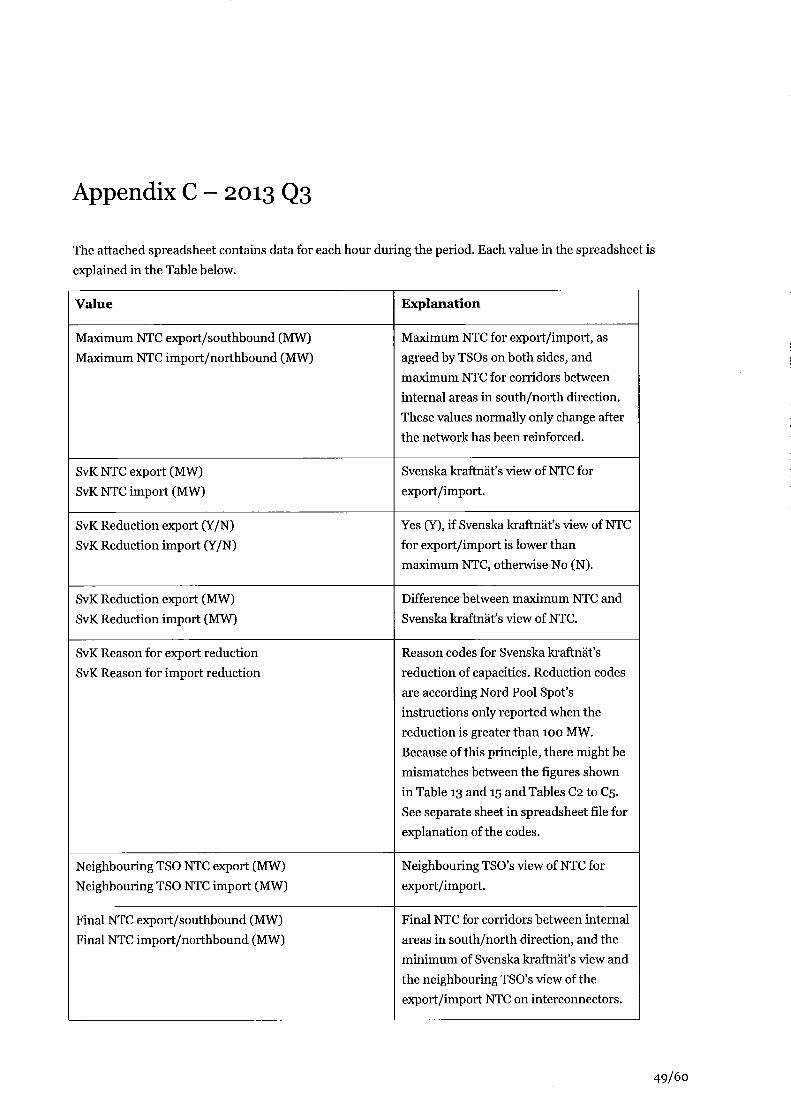
Appendix C - 2013 Q3
The attached spreadsheet contains data for each hour during the period. Each value in the spreadsheet is explained in the Table below.
Value
Maximum NTC export/southbound (MW) Maximum NTC import/northbound (MW)
SvK NTC export (MW) SvK NTC import (MW)
SvK Reduction export (Y/N) SvK Reduction import (Y/N)
SvK Reduction export (MW) SvK Reduction import (MW)
SvK Reason for export reduction SvK Reason for import reduction
Neighbouring TSO NTC export (MW) Neighbouring TSO NTC import (MW)
Final NTC export/southbound (MW) Final NTC import/northbound (MW)
Explanation
Maximum NTC for export/import, as agreed by TSOs on both sides, and maximum NTC for corridors between internal areas in south/north direction. These values normally only change after the network has been reinforced.
Svenska kraftnäfs view of NTC for export/import.
Yes (Y), if Svenska kraftnäfs view of NTC for export/import is lower than maximum NTC, otherwise No (N).
Difference between maximum NTC and Svenska kraftnäfs view of NTC.
Reason codes for Svenska kraftnäfs reduction of capacities. Reduction codes are according Nord Pool Spof s instructions only reported when the reduction is greater than 100 MW. Because of this principle, there might be mismatches between the figures shown in Table 13 and 15 and Tables C2 to C5. See separate sheet in spreadsheet file for explanation of the codes.
Neighbouring TSO's view of NTC for export/import.
Final NTC for corridors between internal areas in south/north direction, and the minimum of Svenska kraftnäfs view and the neighbouring TSO's view of the export/import NTC on interconnectors.
49/60
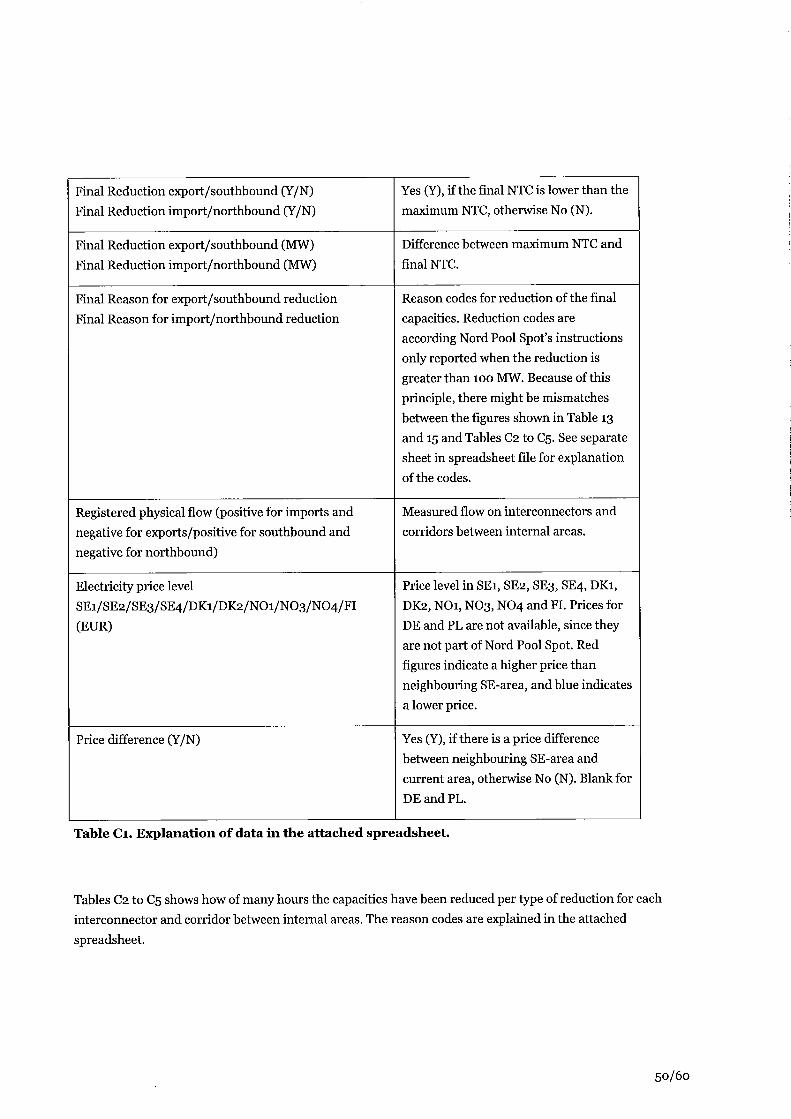
Final Reduction export/southbound (Y/N) Final Reduction import/northbound (Y/N)
Final Reduction export/southbound (MW) Final Reduction import/northbound (MW)
Final Reason for export/southbound reduction Final Reason for import/northbound reduction
Registered physical flow (positive for imports and negative for exports/positive for southbound and negative for northbound)
Electricity price level SE1/SE2/SE3/SE4/DK1/DK2/NO1/NO3/NO4/FI (EUR)
Price difference (Y/N)
Yes (Y), if the final NTC is lower than the maximum NTC, otherwise No (N).
Difference between maximum NTC and final NTC.
Reason codes for reduction of the final capacities. Reduction codes are according Nord Pool Spof s instructions only reported when the reduction is greater than 100 MW. Because of this principle, there might be mismatches between the figures shown in Table 13 and 15 and Tables C2 to C5. See separate sheet in spreadsheet file for explanation of the codes.
Measured flow on interconnectors and corridors between internal areas.
Price level in SEi, SE2, SE3, SE4, DKi, DK2, NOi, NO3, NO4 and FL Prices for DE and PL are not available, since they are not part of Nord Pool Spöt. Red figures indicate a higher price than neighbouring SE-area, andblue indicates a lower price.
Yes (Y), if there is a price difference between neighbouring SE-area and current area, otherwise No (N). Blank for DE and PL.
Table Cl. Explanation of data in the attached spreadsheet.
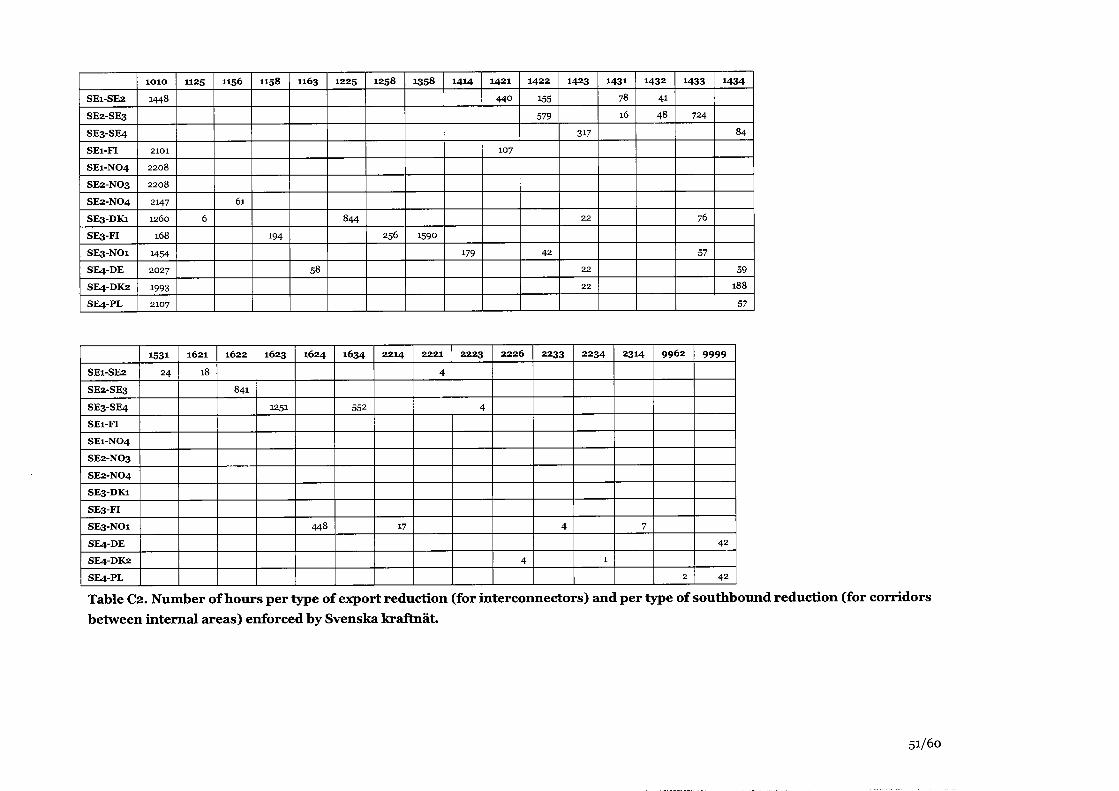
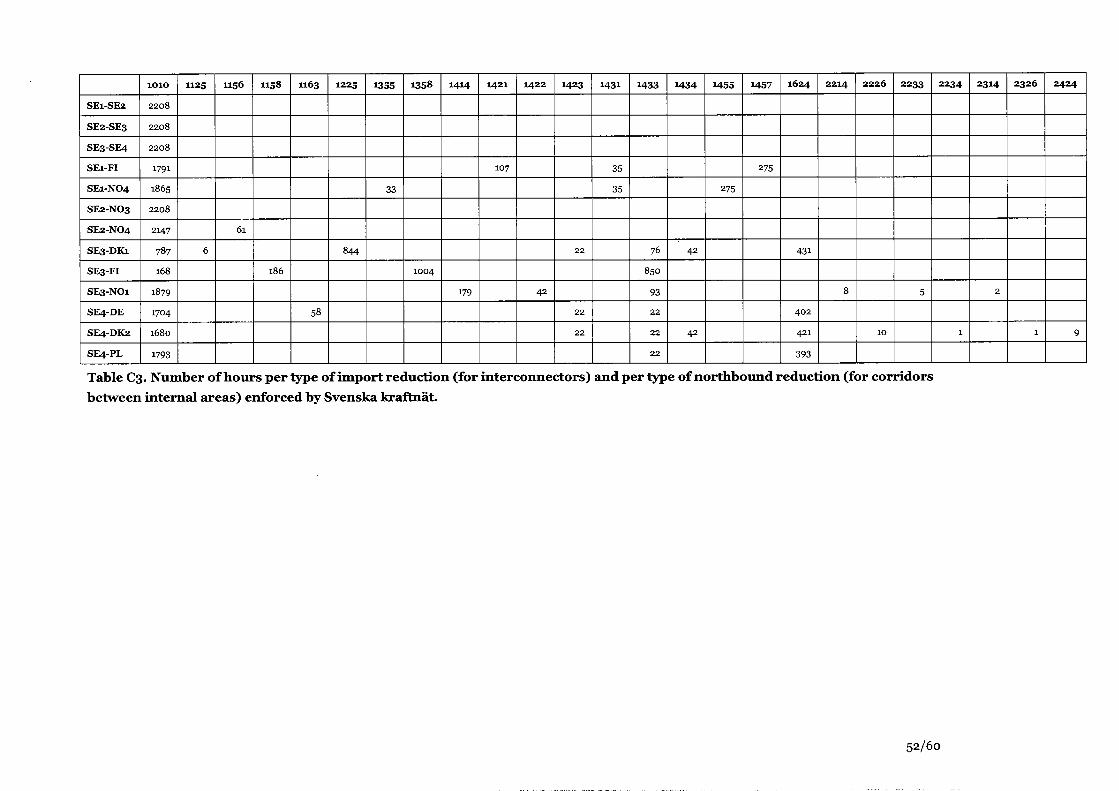
Tables C2 to C5 shows how of many hours the capacities have been reduced per type of reduction for each interconnector and corridor between internal areas. The reason codes are explained in the attached spreadsheet.
50/60
SE1-SE2
SE2-SE3
SE3-SE4
SEl-FI
SE1-NO4
SE2-NO3
SE2-NO4
SE3-DK1
SE3-FI
SE3-NO1
SE4-DE
SE4-DK2
SE4-PL
1010
1448
2101
2208
2208
2147
1260
168
1454
2027
1993
2107
1125
6
1156
61
1158
194
1163
5 8
1225
8 4 4
1258
2 5 6
1358
1590
1414
179
1421
4 4 0
107
1422
155
579
4 2
1423
317
22
22
22
1431
78
16
1432
4 1
4 8
1433
724
76
57
1434
8 4
59
188
57
SE1-SE2
SE2-SE3
SE3-SE4
SEl-FI
SE1-NO4
SE2-NO3
SE2-NO4
SE3-DK1
SE3-FI
SE3-NO1
SE4-DE
SE4-DK2
SE4-PL
1531
2 4
1621
18
1622
8 4 1
1623
1251
1624
4 4 8
1634
552
2214
17
2221
4
2223
4
2226
4
2233
4
2 2 3 4
1
2314
7
9 9 6 2
2
9999
4 2
4 2
Table C2. Number of hours per type of export reduction (for interconnectors) and per type of southbound reduction (for corridors between internal areas) enforced by Svenska kraftnät.
51/60
SE1-SE2
SE2-SE3
SE3-SE4
SEl-FI
SE1-NO4
SE2-NO3
SE2-NO4
SE3-DK1
SE3-FI
SE3-NO1
SE4-DE
SE4-DK2
SE4-PL
1010
2208
2208
2208
1791
1865
2208
2147
7 8 7
168
1879
1704
1680
1793
1125
6
1156
61
1158
186
1163
5 8
1225
8 4 4
1355
3 3
1358
1004
1414
179
1421
107
1422
4 2
1423
22
22
22
1431
35
35
1433
76
8 5 0
9 3
22
22
22
1434
4 2
4 2
1455
275
1457
275
1624
431
4 0 2
4 2 1
3 9 3
2214
8
2226
10
2233
5
2 2 3 4
1
2314
2
2326
1
2 4 2 4
9
Table C3. Number of hours per type of import reduction (for interconnectors) and per type of northbound reduction (for corridors between internal areas) enforced by Svenska kraftnät.
52/60
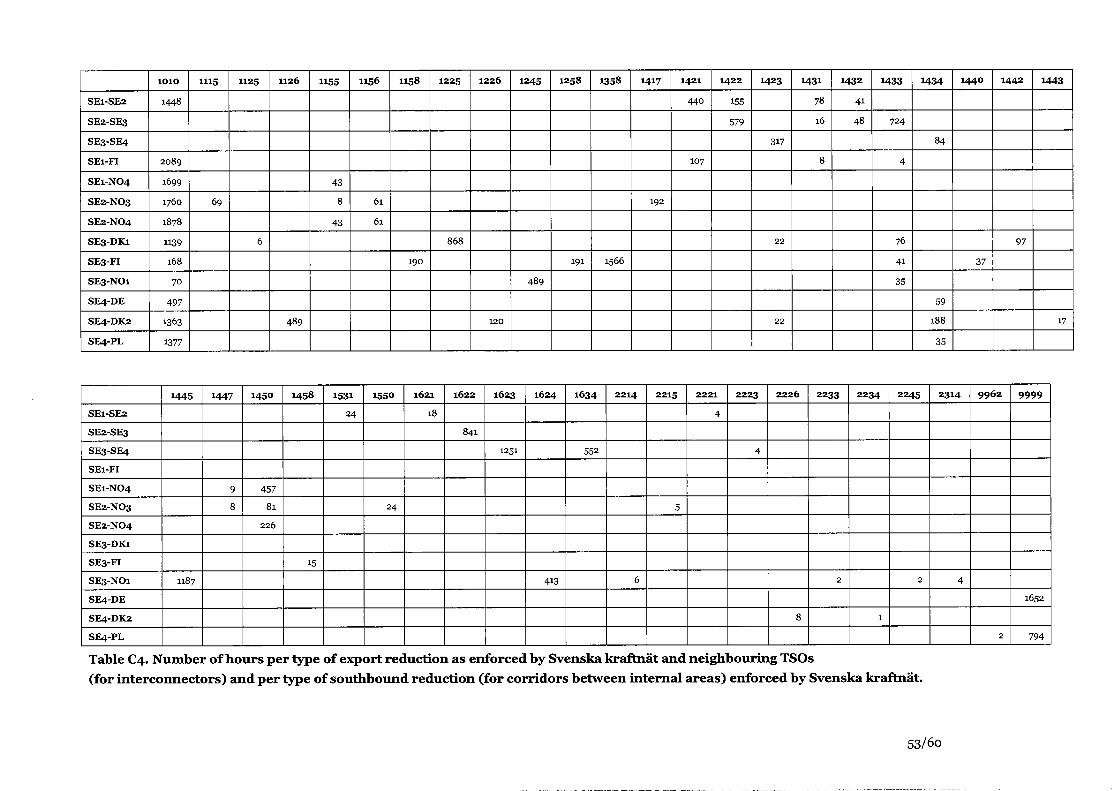
SE1-SE2
SE2-SE3
SE3-SE4
SEl-FI
SE1-NO4
SE2-NO3
SE2-NO4
SE3-DK1
SE3-FI
SE3-NO1
SE4-DE
SE4-DK2
SE4-PL
1010
1448
2089
1699
1760
1878
1139
168
70
4 9 7
1363
1377
1115
69
1125
6
1126
489
1155
4 3
8
4 3
1156
61
61
1158
190
1225
868
1226
120
1245
4 8 9
1258
191
1358
1566
1417
192
1421
4 4 0
107
1422
155
579
1423
317
22
22
1431
78
16
8
1432
41
4 8
1433
724
4
76
41
35
1434
8 4
59
188
35
1440
3 7
1442
97
1443
17
SE1-SE2
SE2-SE3
SE3-SE4
SEl-FI
SE1-NO4
SE2-NO3
SE2-NO4
SE3-DK1
SE3-FI
SE3-NO1
SE4-DE
SE4-DK2
SE4-PL
1445
1187
1447
9 8
1450
4 5 7
8 1
2 2 6
1458
15
1531
2 4
1550
24
1621
18
1622
8 4 1
1623
1251
1624
413
1634
552
2214
6
2215
5
2221
4
2223
4
2226
8
2233
2
2 2 3 4
1
2245
2
2314
4
9 9 6 2
2
9999
1652
7 9 4
Table C4. Number of hours per type of export reduction as enforced by Svenska kraftnät and neighbouring TSOs (for interconnectors) and per type of southbound reduction (for corridors between internal areas) enforced by Svenska kraftnät.
53/6o
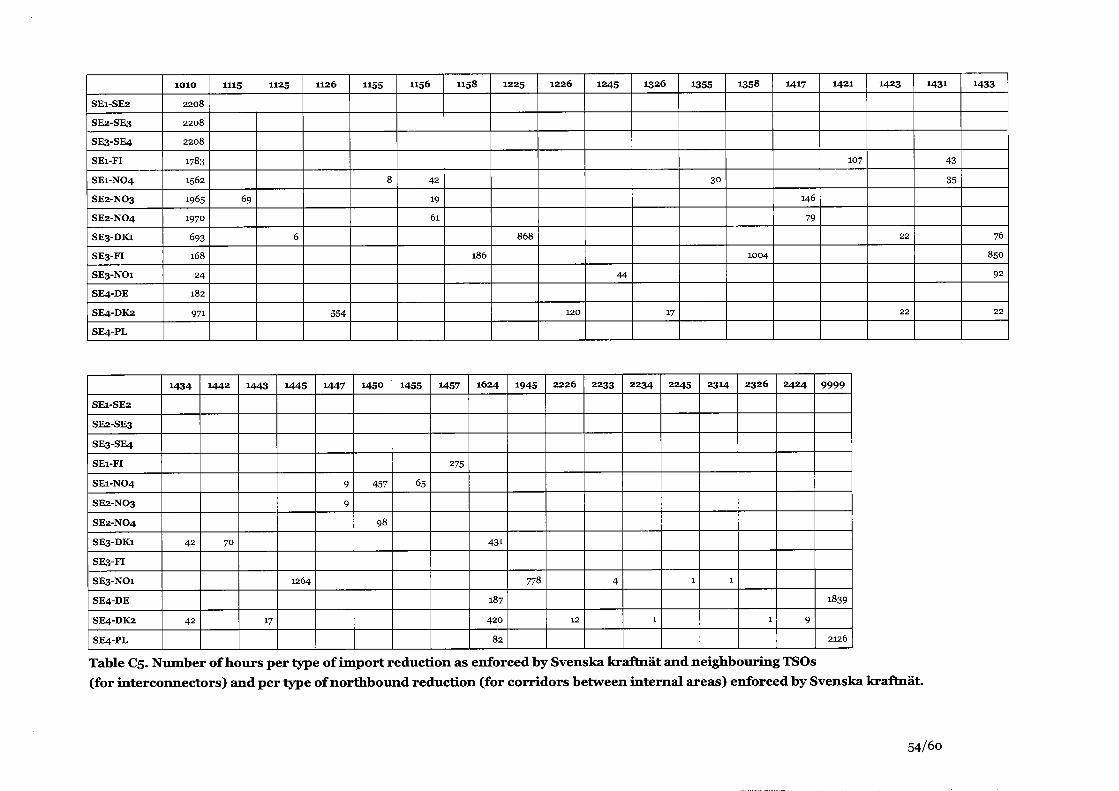
SE1-SE2
SE2-SE3
SE3-SE4
SEl-FI
SE1-NO4
SE2-NO3
SE2-NO4
SE3-DK1
SE3-FI
SE3-NO1
SE4-DE
SE4-DK2
SE4-PL
1010
2208
2208
2208
1783
1562
1965
1970
6 9 3
168
2 4
182
971
1115
69
1125
6
1126
5 5 4
1155
8
1156
4 2
19
61
1158
186
1225
8 6 8
1226
120
1245
4 4
1326
17
1355
3 0
1358
1004
1417
146
79
1421
107
1423
22
22
1431
4 3
35
1433
76
8 5 0
92
22
SE1-SE2
SE2-SE3
SE3-SE4
SEl-FI
SE1-NO4
SE2-NO3
SE2-NO4
SE3-DK1
SE3-FI
SE3-NO1
SE4-DE
SE4-DK2
SE4-PL
1434
4 2
4 2
1442
70
1443
17
1445
1264
1447
9
9
1450
4 5 7
9 8
1455
65
1457
275
1624
4 3 1
187
4 2 0
8 2
1945
778
2226
12
2233
4
2 2 3 4
1
2245
1
2314
1
2326
1
2 4 2 4
9
9 9 9 9
1839
2126
Table C5. Number of hours per type of import reduction as enforced by Svenska kraftnät and neighbouring TSOs (for interconnectors) and per type of northbound reduction (for corridors between internal areas) enforced by Svenska kraftnät.
54/6o
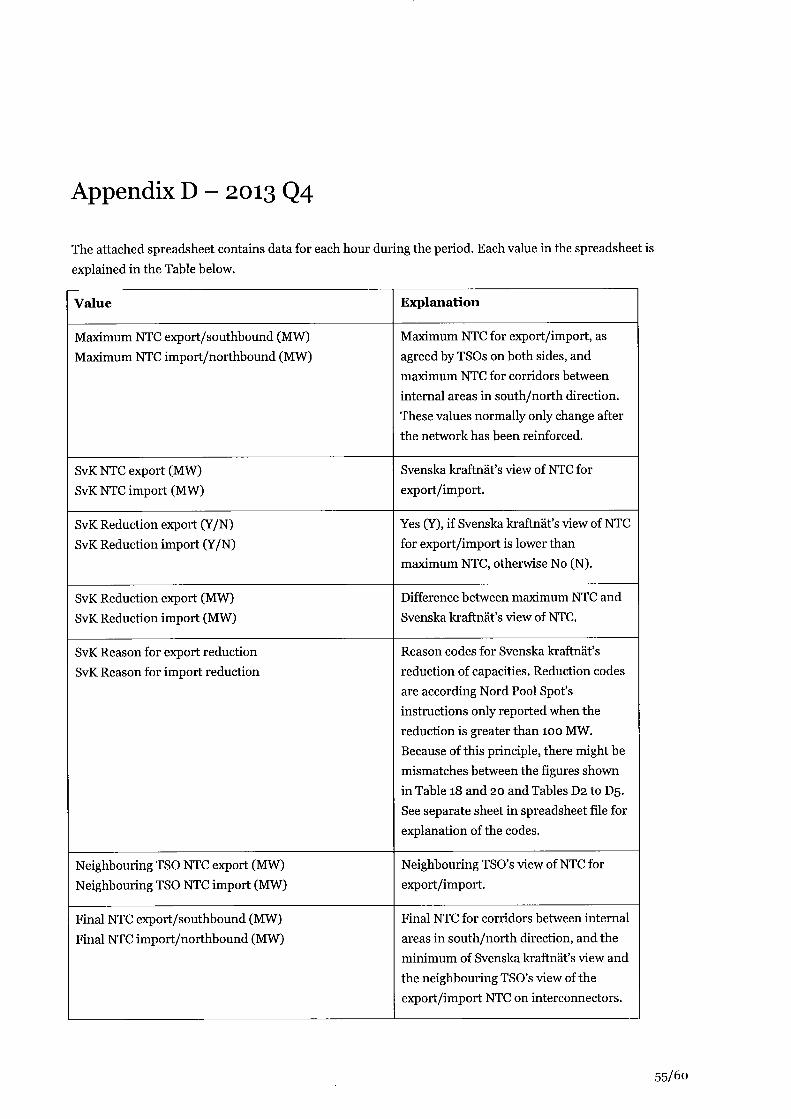
Appendix D - 2013 Q4
The attached spreadsheet contains data for each hour during the period. Each value in the spreadsheet is explained in the Table below.
Value
Maximum NTC export/southbound (MW) Maximum NTC import/northbound (MW)
SvK NTC export (MW) SvK NTC import (MW)
SvK Reduction export (Y/N) SvK Reduction import (Y/N)
SvK Reduction export (MW) SvK Reduction import (MW)
SvK Reason for export reduction SvK Reason for import reduction
Neighbouring TSO NTC export (MW) Neighbouring TSO NTC import (MW)
Final NTC export/southbound (MW) Final NTC import/northbound (MW)
Explanation
Maximum NTC for export/import, as agreed by TSOs on both sides, and maximum NTC for corridors between internal areas in south/north direction. These values normally only change after the network has been reinforced.
Svenska kraftnäfs view of NTC for export/import.
Yes (Y), if Svenska kraftnäfs view of NTC for export/import is lower than maximum NTC, otherwise No (N).
Difference between maximum NTC and Svenska kraftnäfs view of NTC.
Reason codes for Svenska kraftnäfs reduction of capacities. Reduction codes are according Nord Pool Spof s instructions only reported when the reduction is greater than 100 MW. Because of this principle, there might be mismatches between the figures shown in Table 18 and 20 and Tables D2 to D5. See separate sheet in spreadsheet file for explanation of the codes.
Neighbouring TSO's view of NTC for export/import.
Final NTC for corridors between internal areas in south/north direction, and the minimum of Svenska kraftnäfs view and the neighbouring TSO's view of the export/import NTC on interconnectors.
55/60
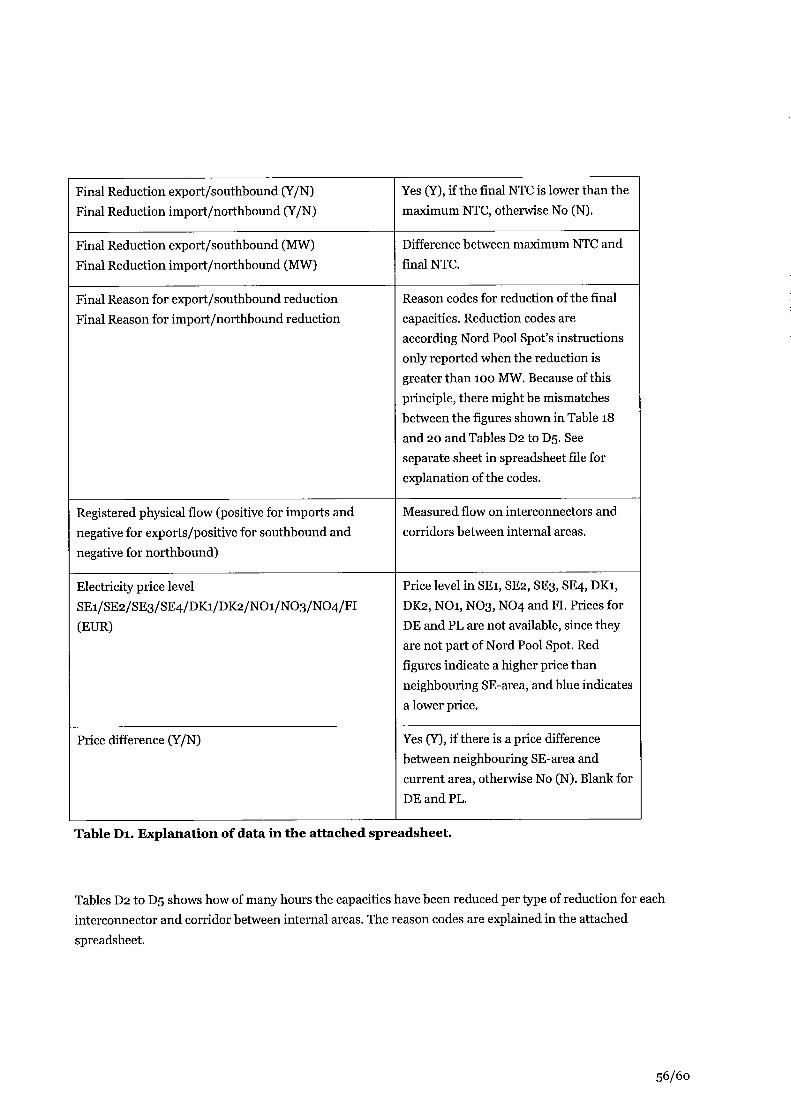
Final Reduction export/southbound (Y/N) Final Reduction import/northbound (Y/N)
Final Reduction export/southbound (MW) Final Reduction import/northbound (MW)
Final Reason for export/southbound reduction Final Reason for import/northbound reduction
Registered physical flow (positive for imports and negative for exports/positive for southbound and negative for northbound)
Electricity price level SE1/SE2/SE3/SE4/DK1/DK2/NO1/NO3/NO4/FI (EUR)
Price difference (Y/N)
Yes (Y), if the final NTC is lower than the maximum NTC, otherwise No (N).
Difference between maximum NTC and final NTC.
Reason codes for reduction of the final capacities. Reduction codes are according Nord Pool Spof s instructions only reported when the reduction is greater than 100 MW. Because of this principle, there might be mismatches between the figures shown in Table 18 and 20 and Tables D2 to D5. See separate sheet in spreadsheet file for explanation of the codes.
Measured flow on interconnectors and corridors between internal areas.
Price level in SEi, SE2, SE3, SE4, DKi, DK2, NOi, NO3, NO4 and FL Prices for DE and PL are not available, since they are not part of Nord Pool Spöt. Red figures indicate a higher price than neighbouring SE-area, and blue indicates a lower price.
Yes (Y), if there is a price difference between neighbouring SE-area and current area, otherwise No (N). Blank for DE and PL.
Table Dl. Explanation of data in the attached spreadsheet.
Tables D2 to D5 shows how of many hours the capacities have been reduced per type of reduction for each interconnector and corridor between internal areas. The reason codes are explained in the attached spreadsheet.
56/60
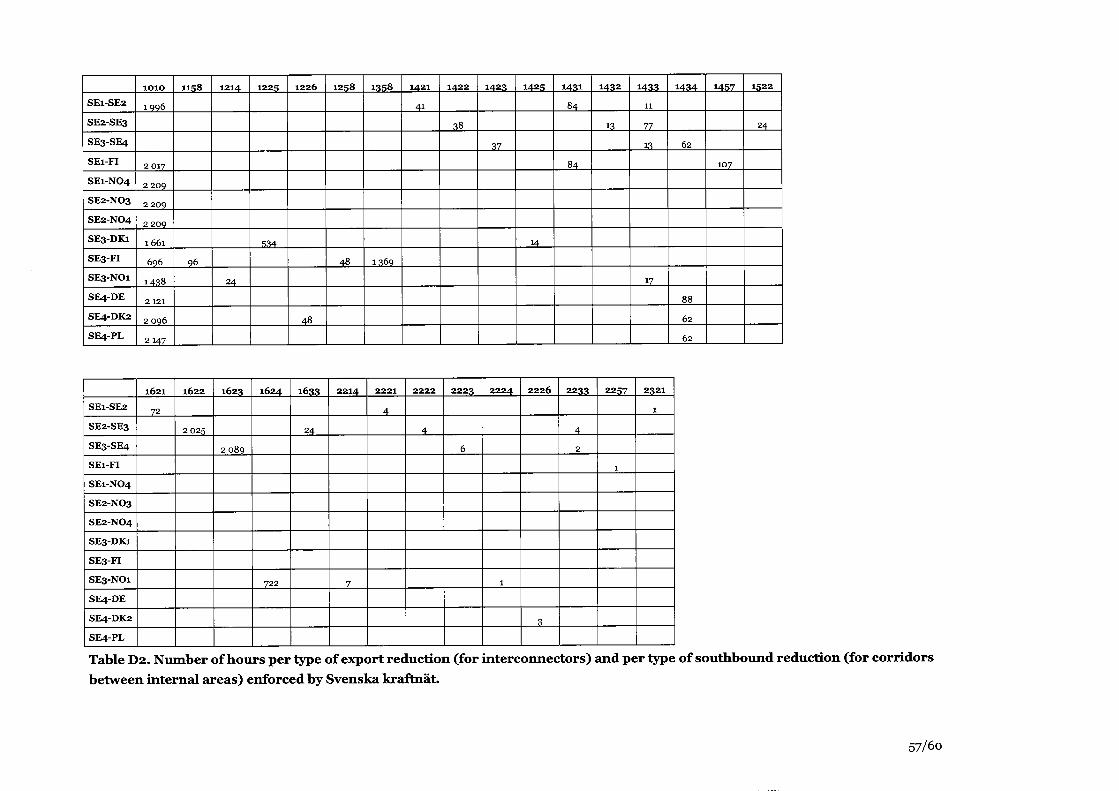
SE1-SE2
SE2-SE3
SE3-SE4
SEl-FI
SE1-NO4
SE2-NO3
SE2-NO4
SE3-DK1
SE3-FI
SE3-NO1
SE4-DE
SE4-DK2
S E 4 P L
1010
1996
2017
2209
2209
2209
1661
6 9 6
1438
2121
2 096
2 147
1158
9 6
1214
24
1225
5 3 4
1226
4 8
1258
4 8
1358
1369
1421
41
1422
38
1423
37
1425
14
1431
8 4
8 4
1432
13
1433
11
77
13
17
1434
62
88
62
6 2
1457
107
1522
24
SE1-SE2
SE2-SE3
SE3-SE4
SEl-FI
SE1-NO4
SE2-NO3
SE2-NO4
SE3-DK1
SE3-FI
SE3-NO1
SE4-DE
SE4-DK2
SE4-PL
1621
72
1622
2025
1623
2 0 8 9
1624
722
1633
2 4
2214
7
2221
4
2222
4
2223
6
2 2 2 4
1
2226
3
2233
4
2
2257
1
2321
1
Table D2. Number of hours per type of export reduction (for interconnectors) and per type of southbound reduction (for corridors between internal areas) enforced by Svenska kraftnät.
57/6o
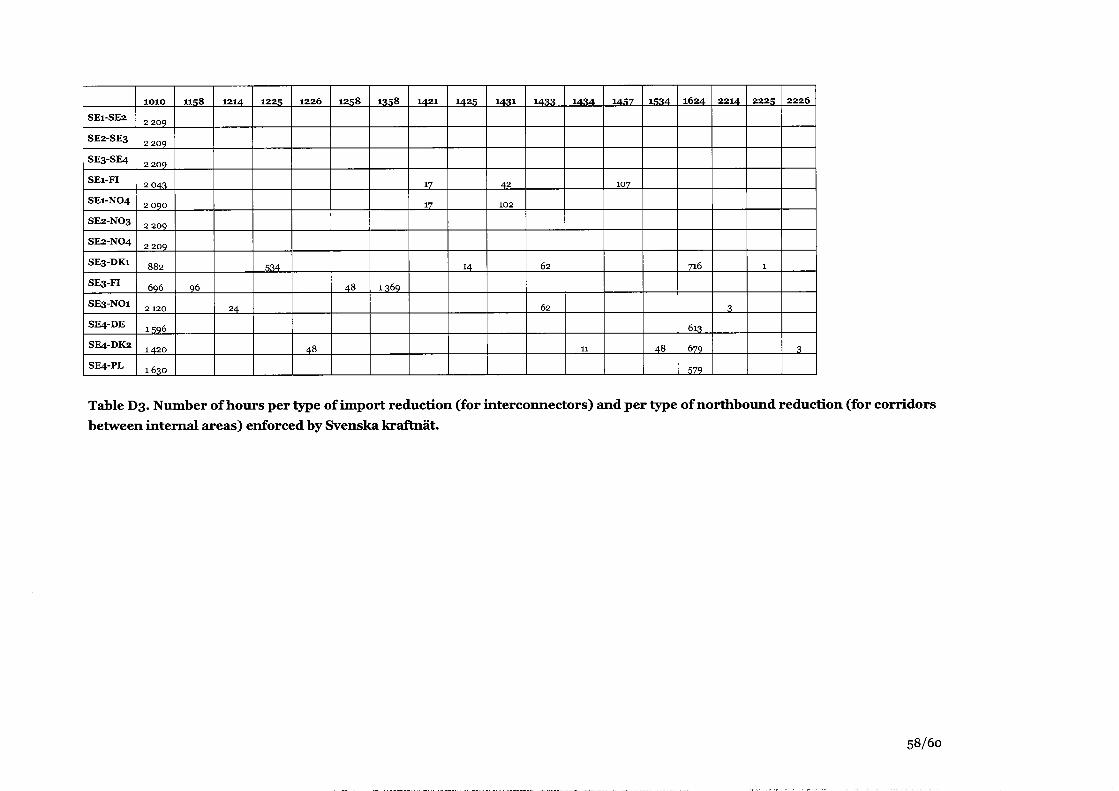
SE1-SE2
SE2-SE3
SE3-SE4
SEl-FI
SE1-NO4
SE2-NO3
SE2-NO4
SE3-DK1
SE3-FI
SE3-NO1
SE4-DE
SE4-DK2
SE4-PL
IOIO
2209
2209
2209
2 0 4 3
2 0 9 0
2209
2 209
8 8 2
6 9 6
2 120
1596
1420
1630
1158
9 6
1214
2 4
1225
5 3 4
1226
4 8
1258
4 8
1358
1369
1421
17
17
1425
14
1431
4 2
102
1433
62
6 2
1434
11
1457
107
1534
4 8
1624
716
613
679
579
2214
3
2225
1
2226
3
Table D3. Number of hours per type of import reduction (for interconnectors) and per type of northbound reduction (for corridors between internal areas) enforced by Svenska kraftnät.
58/60
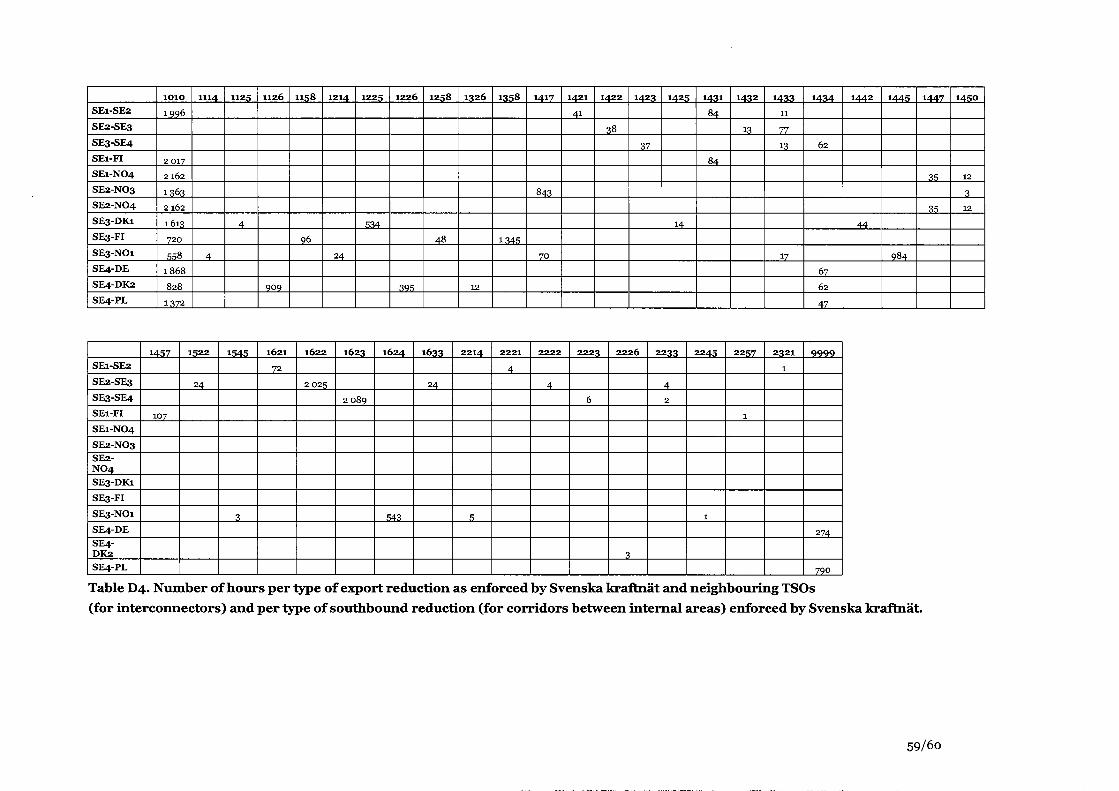
SE1-SE2
SE2-SE3
SE3-SE4 SEl-FI
SE1-NO4 SE2-NO3
SE2-NO4 SE3-DK1
SE3-FI
SE3-NO1
SE4-DE
SE4-DK2
SE4-PL
1010
1996
2 017 2162
1363 2162
1613 7 2 0
W» 1868
8 2 8
1372
1114
4
1125
4
1126
9 0 9
1158
9 6
1214
2 4
1225
5 3 4
1226
3 9 5
1258
48
1326
12
1358
1345
1417
8 4 3
70
1421
41
1422
38
1423
37
1425
14
1431 84
84
1432
13
1433 11
77
13
17
1434
62
67
6 2
4 7
1442
4 4
1445
9 8 4
1447
35
35
1450
12
3
12
SE1-SE2
SE2-SE3
SE3-SE4
SEl-FI
SE1-NO4
SE2-NO3 SE2-NO4 SE3-DK1
SE3-FI
SE3-NO1 SE4-DE SE4-DK2 SE4-PL
1457
107
1522
2 4
1545
3
1621
72
1622
2025
1623
2 0 8 9
1624
5 4 3
1633
24
2214
5
2221
4
2222
4
2223
6
2226
3
2233
4
2
2245
1
2257
1
2321
1
9 9 9 9
274
7 9 0
Table D4. Number of hours per type of export reduction as enforced by Svenska kraftnät and neighbouring TSOs (for interconnectors) and per type of southbound reduction (for corridors between internal areas) enforced by Svenska kraftnät.
59/60
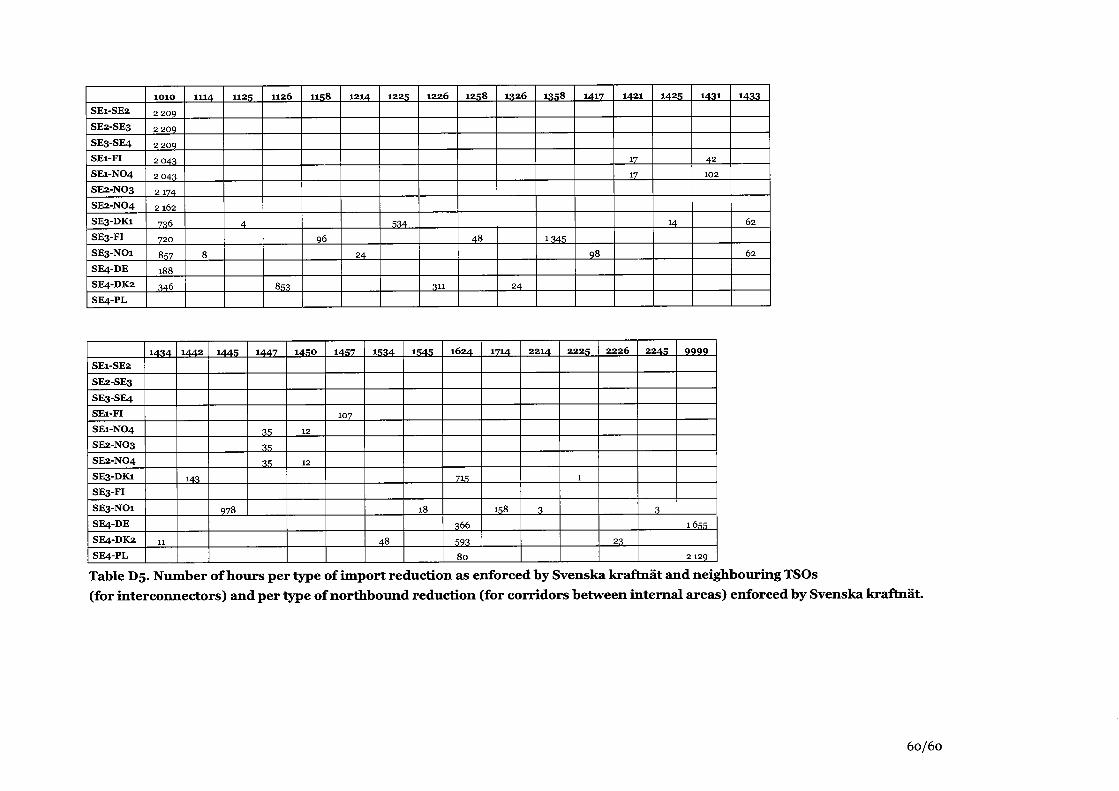
SE1-SE2
SE2-SE3
SE3-SE4 SEl-FI
SE1-NO4 SE2-NO3
SE2-NO4 SE3-DK1
SE3-FI
SE3-NO1 SE4-DE
SE4-DK2
SE4-PL
1010
2209
2209
2209
2 0 4 3
2 0 4 3
2 174 2162
736
720
8 5 7
188
3 4 6
1114
8
1125
4
1126
8 5 3
1158
9 6
1214
2 4
1225
5 3 4
1226
311
1258
4 8
1326
2 4
1358
1345
1417
9 8
1421
17
17
1425
14
1431
4 2
102
1433
62
62
SE1-SE2
SE2-SE3
SE3-SE4 SEl-FI
SE1-NO4
SE2-NO3
SE2-NO4 SE3-DK1
SE3-FI
SE3-NO1
SE4-DE
SE4-DK2
SE4-PL
1434
11
1442
143
1445
9 7 8
1447
3 5
3 5
3 5
1450
12
12
1457
107
1534
4 8
1545
18
1624
715
3 6 6
5 9 3
8 0
1714
158
2214
3
2225
1
2226
2 3
2245
3
9 9 9 9
1 655
2129
Table D5. Number of hours per type of import reduction as enforced by Svenska kraftnät and neighbouring TSOs (for interconnectors) and per type of northbound reduction (for corridors between internal areas) enforced by Svenska kraftnät.
60/60