Embed Size (px)
Citation preview
Swedish Institute for Social Research (SOFI) ____________________________________________________________________________________________________________
Stockholm University ________________________________________________________________________ WORKING PAPER 8/2005
NARROW-TENT DEMOCRATS AND FRINGE OTHERS: THE POLICY VIEWS OF SOCIAL SCIENCE PROFESSORS
by
Daniel B. Klein and Charlotta Stern
Narrow-Tent Democrats and Fringe Others:
The Policy Views of Social Science Professors
By
Daniel B. Klein Charlotta Stern Department of Economics Institute for Social Research George Mason University Stockholm University Fairfax, VA 22030 S-106 91 Stockholm, Sweden and, Ratio Institute, Stockholm Tel. 46-8-162645 Email: [email protected] Email: [email protected]
21 October 2005
To appear in Critical Review (www.criticalreview.com)
ABSTRACT: This paper provides copious results from a 2003 survey of academics. We analyze the responses of 1208 academics from six scholarly associations (in anthropology, economics, history, legal and political philosophy, political science, and sociology) with regard to their views on 18 policy issues. The issues include economic regulations, personal-choice restrictions, and military action abroad. We find that the academics overwhelmingly vote Democratic and that the Democratic dominance has increased significantly since 1970. A multivariate analysis shows strongly that Republican scholars are more likely to land outside of academia. On the 18 policy questions, the Democratic-voter responses have much less variation than do the Republicans. The left has a narrow tent. The Democratic and Republican policy views of academics are somewhat in line with the ideal types, except that across the board both groups are simply more statist than the ideal types might suggest. Regarding disciplinary consensus, we find that the discipline with least consensus is economics. We do a cluster analysis, and the mathematical technique sorts the respondents into groups that nicely correspond to familiar ideological categories: establishment left, progressive, conservative, and libertarian. The conservative group and the libertarian group are equal in size (35 individuals, each), suggesting that academics who depart from the leftist ranks are as likely to be libertarian as conservative. We also find that conservatives are closer to the establishment left than they are to the libertarians. Acknowledgements: We are grateful to the Leavey School of Business and the Robert Finocchio Fund at Santa Clara University for assistance in meeting the costs of the survey, and especially to Ms. Donna Perry, Assistant Dean, Leavey School of Business, Santa Clara University, for acting as independent controller and certifying the results. Also, we would like to thank Niclas Berggren for comments.
Americans are asking themselves why they pay so much money to professors
whose work is often purely “academic” and whose political ideas typically are left-wing.
This paper presents results from a large survey of academics. We look at the data from
many different angles, using detailed figures, cross-tabulations, multivariate analysis, and
cluster analysis. The chief goal of this paper is to see what the data say about the
ideological composition of academia.
Not addressed in this paper is the big question: Why are academics so left-wing,
and so uniformly so?
We find that to best analyze the ideological character of cultural institutions we
necessarily take sides. The numbers are what they are, but we have developed the
numbers in a research process and present them here in particular ways. The reader will
want to know where ideologically we are coming from. Thus, we think it useful to say
upfront that our sensibilities are classical liberal/libertarian.
U.S. Professors under the Microscope
In their 1975 work The Divided Academy, Everett Carll Ladd, Jr. and Seymour
Martin Lipset wrote that the empirical record has sustained Richard Hofstadter’s
generalization that from the late nineteenth century “the political weight of American
intellectuals, including leading academics, has been disproportionately on the
progressive, liberal, and leftist side” (p. 14). Survey evidence as early as 1937 showed
1
that social science professors were disproportionately Democratic (Ladd and Lipset 1975,
27f; on Canadian professors using 1987 data see Nakhaie and Brym 1999).
But the professors went contrary to what Charles B. Spaulding and Henry A.
Turner (1968) called “a well established empirical finding,” namely that “persons
occupying the favored positions in American society tend on the whole to be Republicans
and to exhibit conservative political attitudes” (p. 247). It was conjectured that social-
science professors exhibited critical thinking and an interest in social criticism, and hence
were “liberal” and Democratic. From 1959 to 1964, Spaulding and Turner conducted
surveys of scholarly associations. They found that philosophers, sociologists, political
scientists, historians, and psychologists were on the whole about 3-to-1 Democrat to
Republican, while botanists, geologists, mathematicians, and engineers were much more
likely to be Republican (Spaulding and Turner 1968, 253). The findings were “consistent
with the idea that an important element in explaining the difference is the degree to which
the perspectives of the members of each profession tend to be oriented toward social
criticism or [like the botanists etc.] the application of knowledge in the business world”
(p. 247). The early sociology literature projected the idea that elites were tied into the
status-quo and hence were conservative, while college professors and others posed a
challenge to the system. Sometimes the literature (e.g., Gouldner 1970) accused the
professoriate, especially the academic elites, of being too tied into the system and too
conservative.
The Carnegie Commission on Higher Education in 1969 and 1975 and the
Carnegie Foundation for the Advancement of Teaching in 1984 conducted national
surveys of U. S. professors (Carnegie Council 1978; Carnegie Foundation 1989). A
2
major figure in bringing the survey data and other evidence to bear on previous
conjectures was Seymour Martin Lipset, who, with E.C. Ladd, strove to integrate
interpretation and evidence (Lipset and Ladd 1972; Ladd and Lipset 1975). Lipset and
his collaborators challenged hypotheses floated by sociologists, and found that most
academics are “liberal” or left, and the more eminent members especially so (Lipset and
Ladd 1972; Lipset 1982). Lipset’s take on the subject was somewhat blurry. In his early
years he comes across as an earnest leftist sociologist interested in getting a better
empirical handle on the matter, but in later years he despairs over the state of sociology
(Lipset 1994), and his work sustains complaints about academia being too leftwing.1
In economics, surveying the tribe emerged later, but when it did, it was much
more attentive to specific policy questions and it had a different emphasis. Kearl et al
(1979) initiated the tradition. Their study asked public-policy questions, and many of
their questions were reproduced by subsequent studies seeking to track trends in opinion
(see for instance Alston et al 1992, Fuller and Geide-Stevenson 2003, Blendon et al 1997;
Caplan 2001, 2002; Fuchs 1996; Fuchs, Krueger, and Poterba 1998; Whaples 1995;
1996; Moorhouse, Morriss, and Whaples 1999; on graduate students see Colander 2005).
There have also been surveys of economists in other countries, with many similar
questions (Frey et al 1984; Block and Walker 1988; Ricketts and Shoesmith 1990; 1992;
Anderson and Blandy 1992; Anderson et al 1993). One of the main themes in the
economics tradition has been to ascertain whether the discipline displays “consensus,” a
hallmark of science. The surveys have generally shown little concern for party support or
ideological self-description.
1 For criticism of Ladd and Lipset, see Hamilton and Hargens (1993). In our opinion, much of the controversy (and opacity) stems from problems with “liberal vs. conservative.”
3
In fields other than sociology and economics, there seem to be little tradition of
self-investigation. But scholars are now being placed under the microscope, for example
in political science by Heckelman and Whaples (2003) and psychology by Ray (1989)
and Redding (2001).
Stanley Rothman, Robert Lichter and Neil Nevitte (2005) continue in the
Carnegie/Lipset tradition, and show that the ideological homogeneity in academia has
intensified in the past few decades. Other surveys that reinforce these conclusions
include work by the Brookings Institution (2001) and the Higher Education Research
Institute at University of California, Los Angeles (Lindholm et al 2003). The results are
further bolstered by voter registration investigations, such as Zinsmeister (2002),
Horowitz and Lehrer (2002), Klein and Western (2005), and Cardiff and Klein (2006).
The politics of academia is now a major topic in public discourse and increasingly among
intellectuals themselves; for example, a recent issue of this journal contained the
proceedings of a conference at Boston University on the state of the social sciences, with
a session specifically on the political leanings of the social sciences (Critical Review
2005: 187-208).
Here we draw on a 2003 survey designed by Daniel Klein, but handled and
certified by an independent controller. We (Klein and Charlotta Stern) have published
several papers that make narrower use of the survey data.2
2 2005a focus on the Democrat-to-Republican ratio throughout the social sciences and humanities, 2004 focus on the policy views of anthropologists and sociologists, 2005b and 2005c focus on the policy views of economists; 2005d focuses on the policy views of political scientists; 2006 draws on the survey results for sociologists in calling for a place for classical liberalism in sociology.
4
There is one way in which our investigation is quite unique. Most surveys that
ask about ideology employ the conventional “liberal v. conservative” formulation. We
feel that that formulation is confining and often either insubstantive or misleading. In our
survey, we used a format that lends itself to a “statist v. libertarian” formulation. This
formulation is more substantive and more flexible, in that the raw material it generates
can be used to construct and identify familiar ideological categories, as the cluster
analysis here shows.
Description of Data
The data comes from a survey taken in the Spring of 2003. It was designed so as
to achieve the following goals: (1) to elicit an overall judgment of support or opposition
on 18 types of government activism; (2) to make the format uniform so that an
individual’s set of responses could be combined into an index; and (3) to illuminate
ideological divisions within disciplines, especially by voting behavior.3
We surveyed members of six nationwide scholarly associations:
American Anthropological Association American Economics Association American Historical Association American Political Science Association American Society for Political and Legal Philosophy4 American Sociological Association
3 In all three respects, sections of both of the two specialized surveys (one of labor economists, one of public economists) in Fuchs et al. 1998 are very much like our survey in design and spirit (see pp. 1416, 1420). 4 The American Philosophical Association declined to sell us an address lists, based on a general policy of not giving out addresses except for matters of special interest to philosophers. We surveyed all 486 members of the American Society for Political and Legal Philosophy. Their membership base is smaller and more specialized and we have chosen to exclude them in some of the analyses that follows.
5
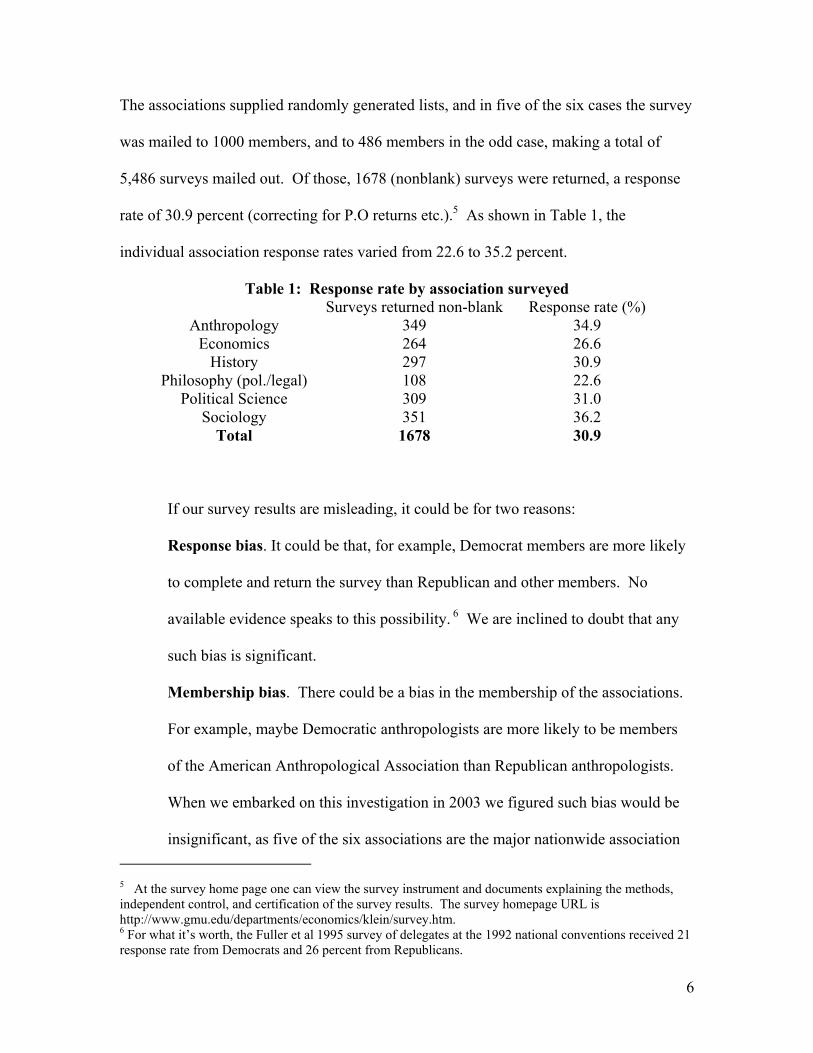
The associations supplied randomly generated lists, and in five of the six cases the survey
was mailed to 1000 members, and to 486 members in the odd case, making a total of
5,486 surveys mailed out. Of those, 1678 (nonblank) surveys were returned, a response
rate of 30.9 percent (correcting for P.O returns etc.).5 As shown in Table 1, the
individual association response rates varied from 22.6 to 35.2 percent.
Table 1: Response rate by association surveyed Surveys returned non-blank Response rate (%)
Anthropology 349 34.9 Economics 264 26.6
History 297 30.9 Philosophy (pol./legal) 108 22.6
Political Science 309 31.0 Sociology 351 36.2
Total 1678 30.9
If our survey results are misleading, it could be for two reasons:
Response bias. It could be that, for example, Democrat members are more likely
to complete and return the survey than Republican and other members. No
available evidence speaks to this possibility. 6 We are inclined to doubt that any
such bias is significant.
Membership bias. There could be a bias in the membership of the associations.
For example, maybe Democratic anthropologists are more likely to be members
of the American Anthropological Association than Republican anthropologists.
When we embarked on this investigation in 2003 we figured such bias would be
insignificant, as five of the six associations are the major nationwide association 5 At the survey home page one can view the survey instrument and documents explaining the methods, independent control, and certification of the survey results. The survey homepage URL is http://www.gmu.edu/departments/economics/klein/survey.htm. 6 For what it’s worth, the Fuller et al 1995 survey of delegates at the 1992 national conventions received 21 response rate from Democrats and 26 percent from Republicans.
6
of the discipline. But the more we have learned about the associations the more
we suspect that there is a Democrat/left tilt in the membership, although we doubt
that it is very large (on the American Economic Association, see McEachern
2006; Klein 2006). We anticipate having a better handle on this question in the
near future.
At present, we suspect that there is some membership bias, but that it is only small to
moderate. One reason to doubt that the biases are large is that our findings here for the
Democrat-to-Republican ratios generally agree with other D to R estimates, notably the
voter registration studies (which depend neither on response nor association membership)
and the survey reported by Rothman et al (2005). Note that even if it were the case that
the associations do have a moderate social-democratic tilt, it would not much affect the
general importance of the results. The major nationwide associations are the leading
organizational and publishing institutions of the discipline, and members generally have
more influence than non-members. Put differently, the more clout that someone of an
ideology has, the more likely it is that she is a member of the major association.
Academics’ Voting Patterns
The present article is concerned with respondents with academic careers. One
survey question asked:
7
Pleased check your primary employment (if retired, kindly answer
retrospectively):
□ □ □ □ ________ academic public private independent other
sector sector research
The percentages reporting7 academic were anthropology 73.1 percent, economics
48.5 percent, history 71.4 percent, philosophy 76.6 percent, political science 86.4 percent,
and sociology 74.9 percent. In this paper we focus on those respondents who reported
being or having been primarily employed in academia, 1208 individuals constituting 72
percent of the sample.
A question asked the respondent to check highest degree held, and the frequency
of responses for those in academics is shown in Table 2.
Table 2: Frequency of highest degree for academic sample Highest degree Frequency % of this
samplePh.D. 1151 95.28 Masters 47 3.89 Bachelor’s 4 0.33 J.D. 3 0.25 Other 3 0.25
The voting question was as follows:
7 42 respondents marked either public sector, private sector, or independent research, but we included them as academic based on their comments and answers to the two immediately ensuing questions, which are predicated on academic employment.
8
To which political party have the candidates you’ve voted for in the past ten years
mostly belonged?
□ □ □ □ ________ Democratic Green Libertarian Republican other
Among the 1208 academic respondents reported voting as follows: 962 (79.6 %)
Democratic (D), 112 (9.3 %) Republican (R), 17 (1.4 %) Green, 13 (1.1 %) Libertarian,
29 (2.4 %) checked two or more responses, 16 ( 1.3 %) wrote in another party, 17 (1.4 %)
said they cannot or do not vote, and 42 (3.5 %) did not respond to the question.
The D-to-R ratios of the six groups are shown in Figure 1.8 We combine
anthropology and sociology because in those groups the number of Republicans was very
low and because the response patterns to the policy questions were very similar (see
Klein and Stern
8 These ratios differ from those determined by Klein and Stern 2004c, which includes academic respondents only up to the age of 70.
9
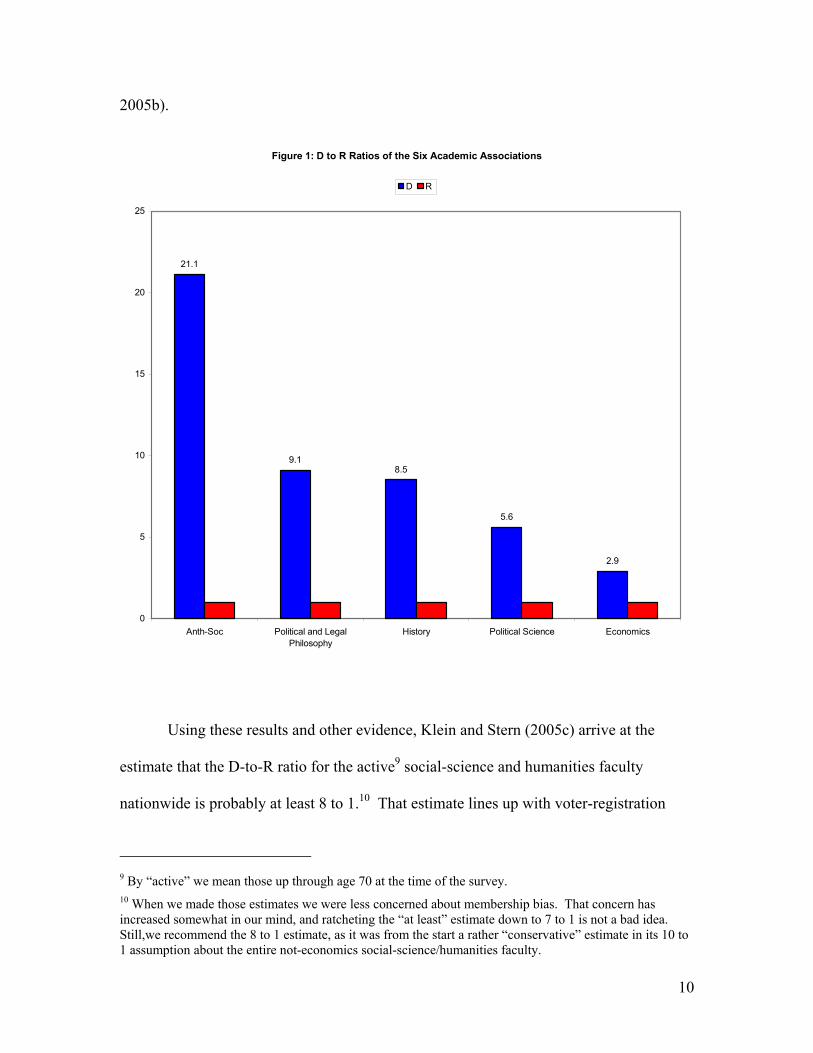
2005b).
Figure 1: D to R Ratios of the Six Academic Associations
21.1
9.18.5
5.6
2.9
0
5
10
15
20
25
Anth-Soc Political and LegalPhilosophy
History Political Science Economics
D R
Using these results and other evidence, Klein and Stern (2005c) arrive at the
estimate that the D-to-R ratio for the active9 social-science and humanities faculty
nationwide is probably at least 8 to 1.10 That estimate lines up with voter-registration
9 By “active” we mean those up through age 70 at the time of the survey. 10 When we made those estimates we were less concerned about membership bias. That concern has increased somewhat in our mind, and ratcheting the “at least” estimate down to 7 to 1 is not a bad idea. Still,we recommend the 8 to 1 estimate, as it was from the start a rather “conservative” estimate in its 10 to 1 assumption about the entire not-economics social-science/humanities faculty.
10
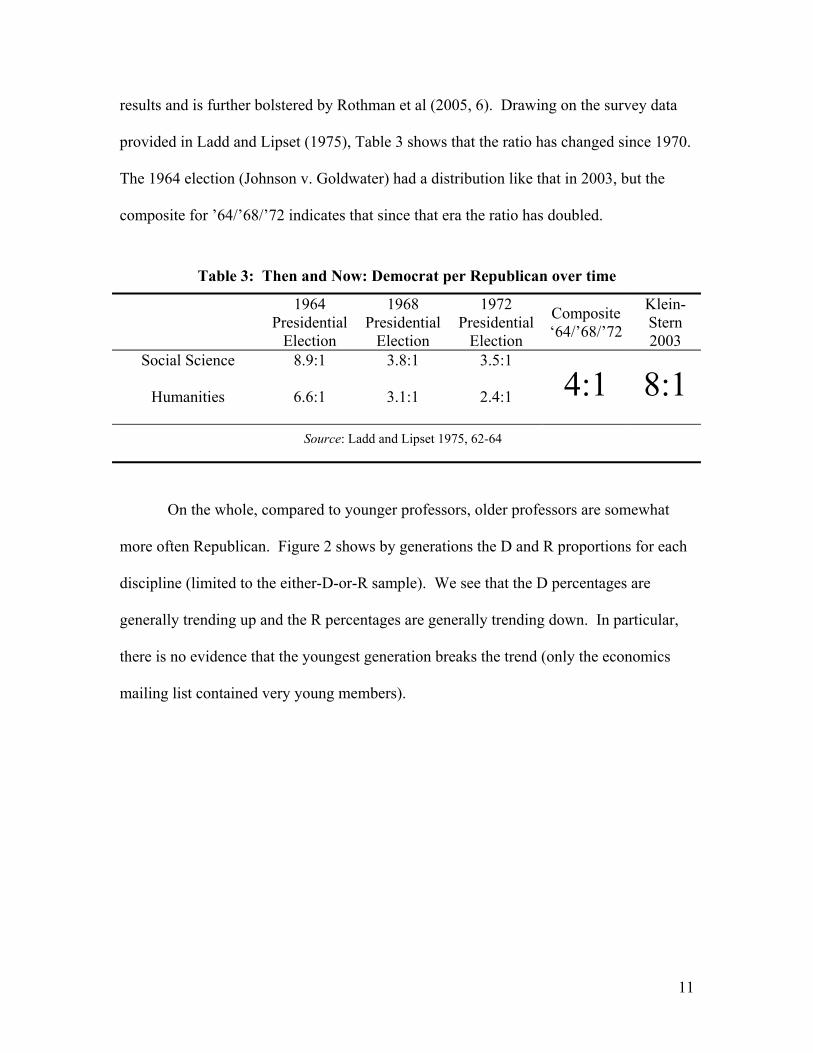
results and is further bolstered by Rothman et al (2005, 6). Drawing on the survey data
provided in Ladd and Lipset (1975), Table 3 shows that the ratio has changed since 1970.
The 1964 election (Johnson v. Goldwater) had a distribution like that in 2003, but the
composite for ’64/’68/’72 indicates that since that era the ratio has doubled.
Table 3: Then and Now: Democrat per Republican over time
1964
Presidential Election
1968 Presidential
Election
1972 Presidential
Election
Composite ‘64/’68/’72
Klein- Stern 2003
Social Science 8.9:1 3.8:1 3.5:1
Humanities 6.6:1 3.1:1 2.4:1 4:1 8:1 Source: Ladd and Lipset 1975, 62-64
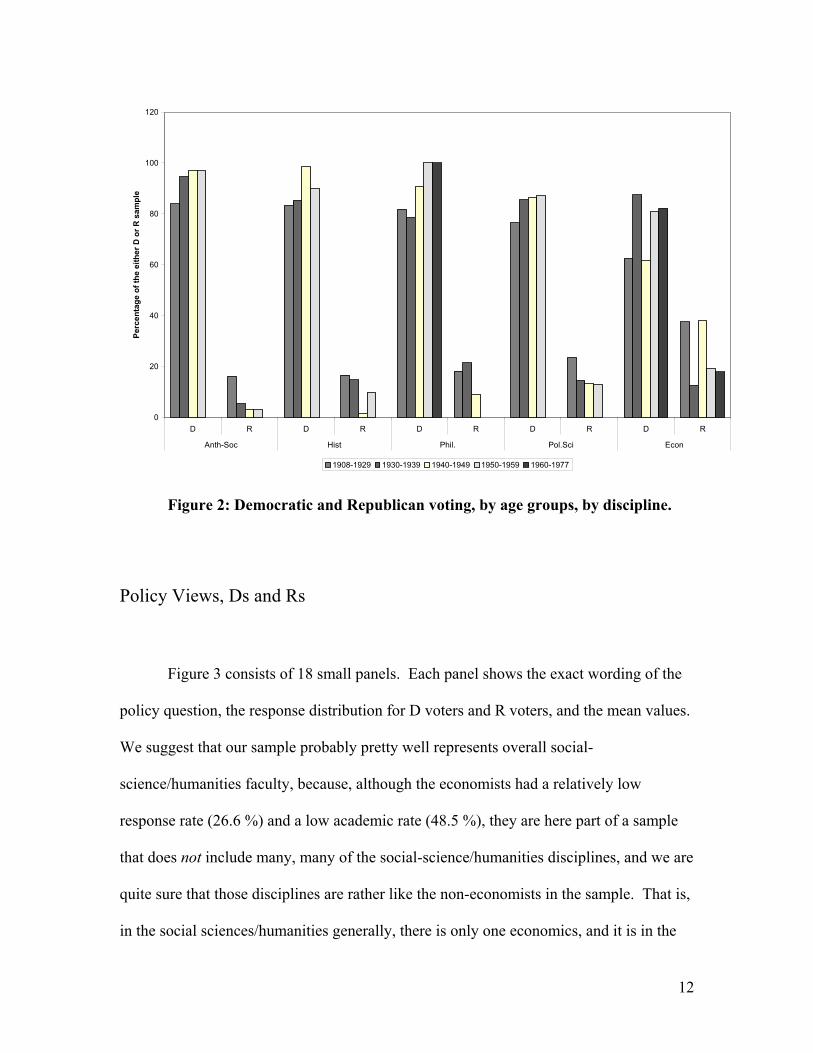
On the whole, compared to younger professors, older professors are somewhat
more often Republican. Figure 2 shows by generations the D and R proportions for each
discipline (limited to the either-D-or-R sample). We see that the D percentages are
generally trending up and the R percentages are generally trending down. In particular,
there is no evidence that the youngest generation breaks the trend (only the economics
mailing list contained very young members).
11
0
20
40
60
80
100
120
D R D R D R D R D R
Anth-Soc Hist Phil. Pol.Sci Econ
Perc
enta
ge o
f the
eith
er D
or R
sam
ple
1908-1929 1930-1939 1940-1949 1950-1959 1960-1977
Figure 2: Democratic and Republican voting, by age groups, by discipline.
Policy Views, Ds and Rs
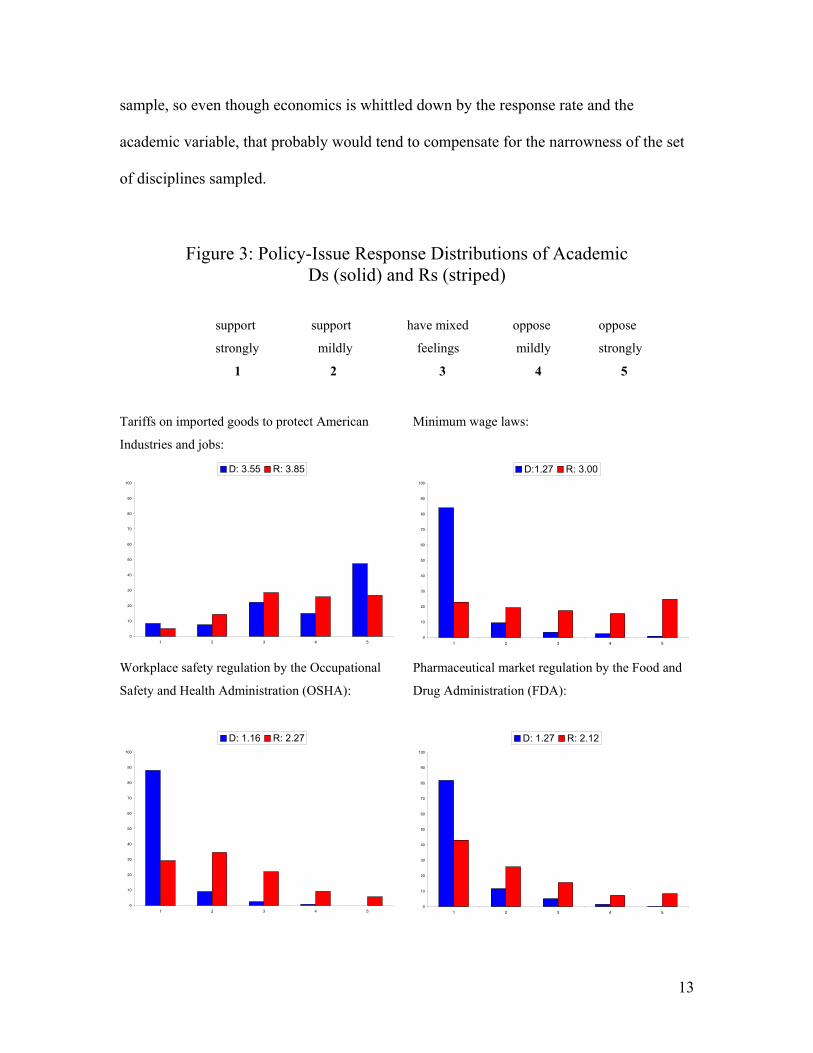
Figure 3 consists of 18 small panels. Each panel shows the exact wording of the
policy question, the response distribution for D voters and R voters, and the mean values.
We suggest that our sample probably pretty well represents overall social-
science/humanities faculty, because, although the economists had a relatively low
response rate (26.6 %) and a low academic rate (48.5 %), they are here part of a sample
that does not include many, many of the social-science/humanities disciplines, and we are
quite sure that those disciplines are rather like the non-economists in the sample. That is,
in the social sciences/humanities generally, there is only one economics, and it is in the
12
sample, so even though economics is whittled down by the response rate and the
academic variable, that probably would tend to compensate for the narrowness of the set
of disciplines sampled.
Figure 3: Policy-Issue Response Distributions of Academic Ds (solid) and Rs (striped)
support support have mixed oppose oppose
strongly mildly feelings mildly strongly
1 2 3 4 5
Tariffs on imported goods to protect American
Industries and jobs:
0
10
20
30
40
50
60
70
80
90
100
1 2 3 4 5
D: 3.55 R: 3.85
Minimum wage laws:
0
10
20
30
40
50
60
70
80
90
100
1 2 3 4 5
D:1.27 R: 3.00
Workplace safety regulation by the Occupational
Safety and Health Administration (OSHA):
0
10
20
30
40
50
60
70
80
90
100
1 2 3 4 5
D: 1.16 R: 2.27
Pharmaceutical market regulation by the Food and
Drug Administration (FDA):
0
10
20
30
40
50
60
70
80
90
100
1 2 3 4 5
D: 1.27 R: 2.12
13
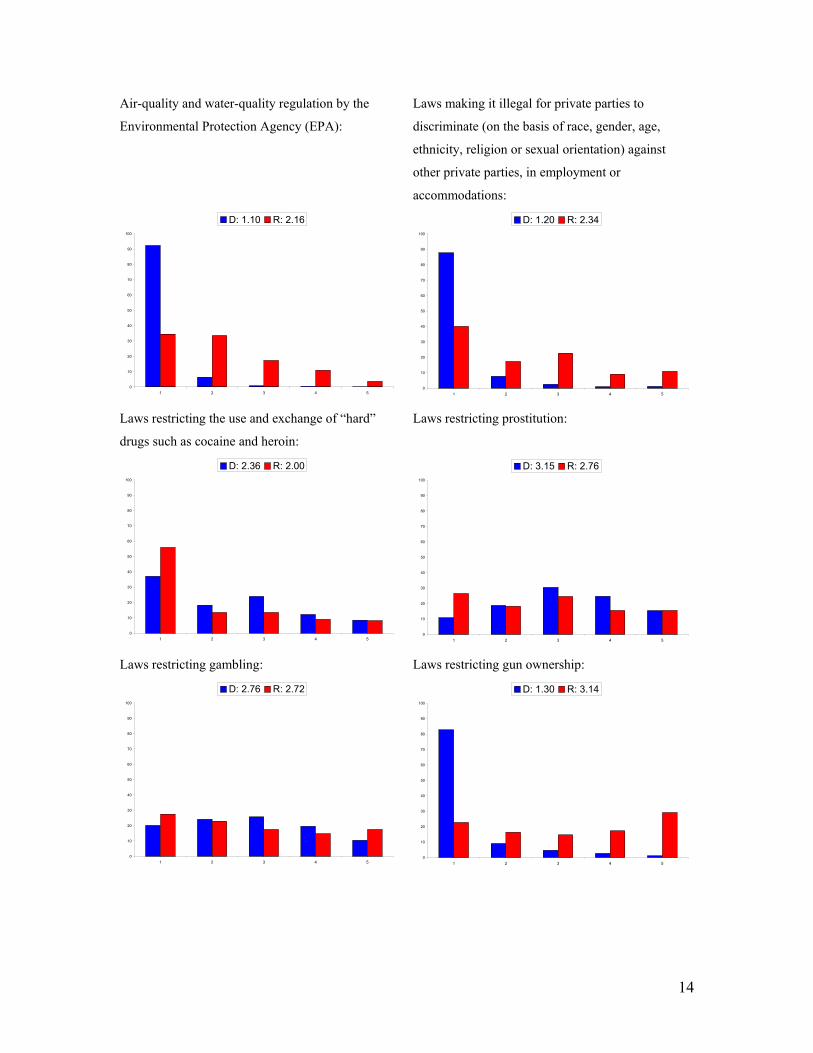
Air-quality and water-quality regulation by the
Environmental Protection Agency (EPA):
0
10
20
30
40
50
60
70
80
90
100
1 2 3 4 5
D: 1.10 R: 2.16
Laws making it illegal for private parties to
discriminate (on the basis of race, gender, age,
ethnicity, religion or sexual orientation) against
other private parties, in employment or
accommodations:
0
10
20
30
40
50
60
70
80
90
100
1 2 3 4 5
D: 1.20 R: 2.34
Laws restricting the use and exchange of “hard”
drugs such as cocaine and heroin:
0
10
20
30
40
50
60
70
80
90
100
1 2 3 4 5
D: 2.36 R: 2.00
Laws restricting prostitution:
0
10
20
30
40
50
60
70
80
90
100
1 2 3 4 5
D: 3.15 R: 2.76
Laws restricting gambling:
0
10
20
30
40
50
60
70
80
90
100
1 2 3 4 5
D: 2.76 R: 2.72
Laws restricting gun ownership:
0
10
20
30
40
50
60
70
80
90
100
1 2 3 4 5
D: 1.30 R: 3.14
14
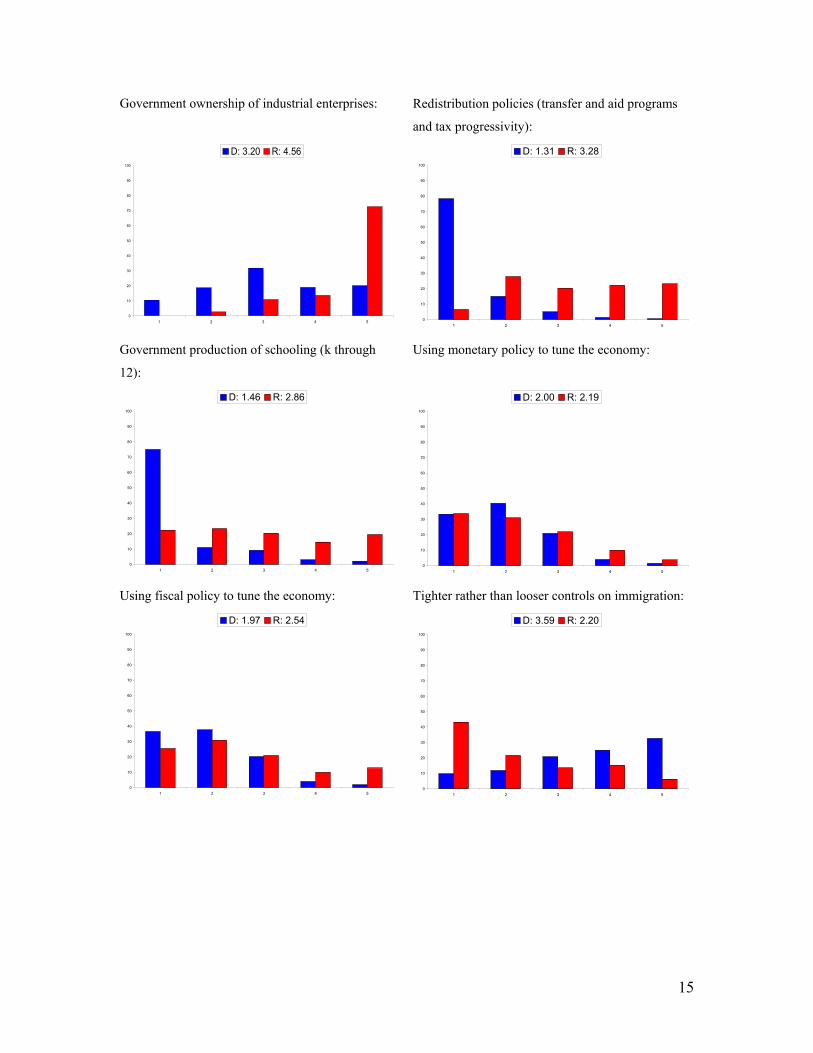
Government ownership of industrial enterprises:
0
10
20
30
40
50
60
70
80
90
100
1 2 3 4 5
D: 3.20 R: 4.56
Redistribution policies (transfer and aid programs
and tax progressivity):
0
10
20
30
40
50
60
70
80
90
100
1 2 3 4 5
D: 1.31 R: 3.28
Government production of schooling (k through
12):
0
10
20
30
40
50
60
70
80
90
100
1 2 3 4 5
D: 1.46 R: 2.86
Using monetary policy to tune the economy:
0
10
20
30
40
50
60
70
80
90
100
1 2 3 4 5
D: 2.00 R: 2.19
Using fiscal policy to tune the economy:
0
10
20
30
40
50
60
70
80
90
100
1 2 3 4 5
D: 1.97 R: 2.54
Tighter rather than looser controls on immigration:
0
10
20
30
40
50
60
70
80
90
100
1 2 3 4 5
D: 3.59 R: 2.20
15

American military aid or presence abroad to
promote democracy and the rule of law:
0
10
20
30
40
50
60
70
80
90
100
1 2 3 4 5
D: 3.50 R: 2.13
Foreign aid and assistance by such organizations as
the World Bank, the International Monetary Fund,
and US Aid:
0
10
20
30
40
50
60
70
80
90
100
1 2 3 4 5
D: 2.02 R: 2.44
The 18 panels of Figure 3 are a good opportunity to make some basic points about
the data.
A. Do the Ds and Rs Conform to Ideal Types?
The ideal-typical Democrat is suspicious of private business and market forces
(“capitalism”). She tends to be permissive on “deviant” life-styles and choices (Ladd and
Lipset 1975, 39; Redding 2001, 205). She is likely to support government policies to
protect the poor and the excluded, and to believe in government regulation as a means to
correct social problems such as racism or school segregation. The Democrat tends to be
pacifist and more critical of American military interventions abroad. The ideal-typical
Republican is friendly to private business and market forces. He tends to be restrictive on
“depraved” life-styles and choices. He is suspicious toward government, and believes in
self-reliance rather than government protection. He is a patriot and believes that the
government should protect the American people from external threats. Thus, the
Republican is more favorable to military action and immigration restrictions.
16
Do the results in the 18 panels generally support the ideal types? In terms of the
differences between Democrats and Republicans, the results line up with the ideal types.
But both groups of academics are more quite statist even where they are supposed to be
somewhat libertarian. Though less enthusiastic than Democrats, Republicans are not
opponents of economic regulation and redistribution. And, though (only slightly) less
paternalistic than Republicans, Democrats are not opponents of restrictions on hard
drugs, prostitution, and gambling, nor are they preponderantly strong opponents of
military action abroad.
B. The Democratic Tent Is Narrow
The social-sciences/humanities faculty is pretty much a one-party system. But if
the Democratic tent were a broad tent, then a one-party system may have intellectual
diversity. The 18 panels show, however, that the Democrats have almost no diversity of
opinion on minimum wage, occupational safety, FDA regulation, the EPA,
discrimination, gun control, redistribution, and schooling. On an issue-by-issue basis, the
Democrats show much less diversity than the Republicans. Table 4 shows the sum of the
18 policy-response standard deviations:
Table 4: The Democratic tent is narrower
Σ 18 policy-response
standard deviations Democrats 17.1 Republicans 23.1
17
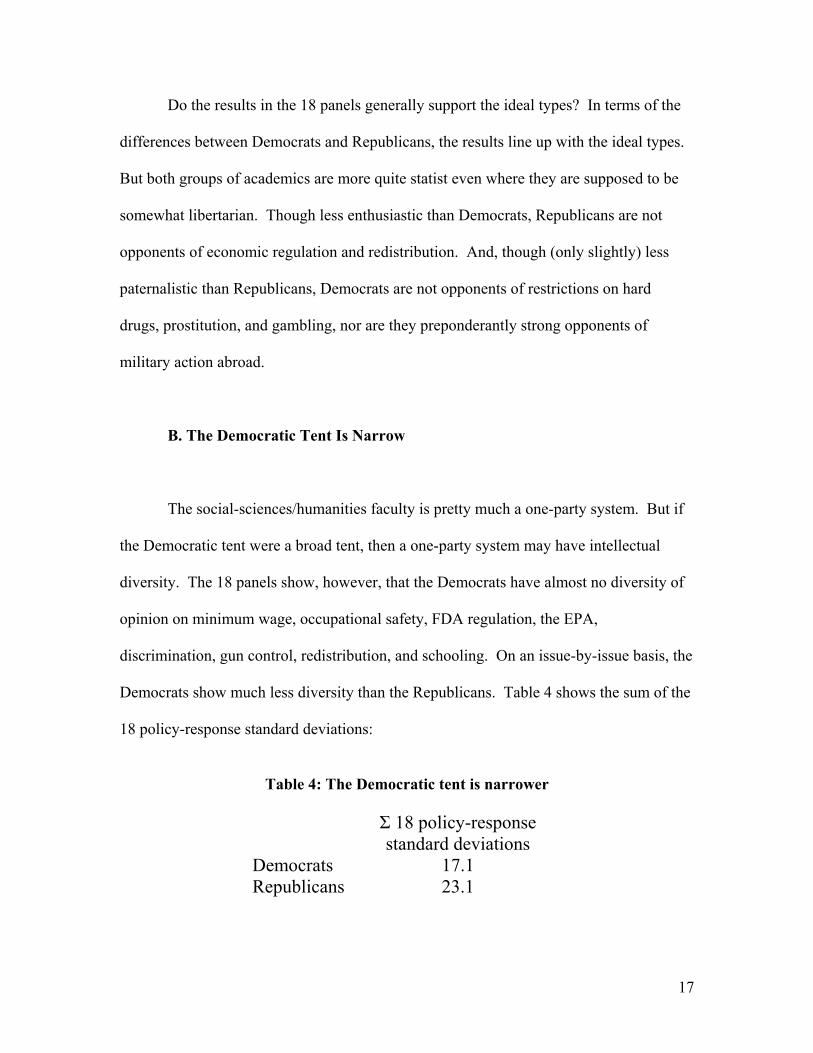
The point can be shown another way. For each respondent we can compute an
overall score on the 18 policy issues: the strong statist would have a score of 1, and the
strong libertarian would have a score close to 5.11 Figure 4 shows the Republicans’
distribution by discipline by 0.5 intervals. (The figure and ensuing presentations omit the
data from the survey of the American Society for Political Legal Philosophy, because
doing so reduces clutter and because the ASPLP sample is small, had a low response rate,
and does not clearly correspond to a particular department on campus. Including the data
would not change the character of the results.)
Figure 4:
Distribution of 18-issue policy index scores of Republican academics in the disciplines
0
10
20
30
40
50
60
1.0 - 1.5 1.5 - 2.0 2.0 - 2.5 2.5 - 3.0 3.0 - 3.5 3.5 - 4.0 4.0 - 4.5 4.5 - 5.0
0.5 interval of 18-issue policy index
Perc
ent o
f res
pond
ents
Anthsoc History Political Science Economics
11 We say “close to” (rather than “equal to”) because some of the policy issues admit of disagreement over what the more or less statist (or libertarian) answer would be. Notably, some would say that toppling an exceptionally oppressive government abroad, despite being activist on the part of the U.S. government, is not anti-libertarian, because it reduces government coercion on net. Reasonable disagreement over what is more or less libertarian would also be found for the questions on monetary policy and perhaps immigration (because of how immigrants supposedly alter the political culture and hence future policy).
18
We see in Figure 4 that the preponderance of Republicans are in the 1.5 to 3.0
range, but that there are some scattered further to the right, particular among economists.
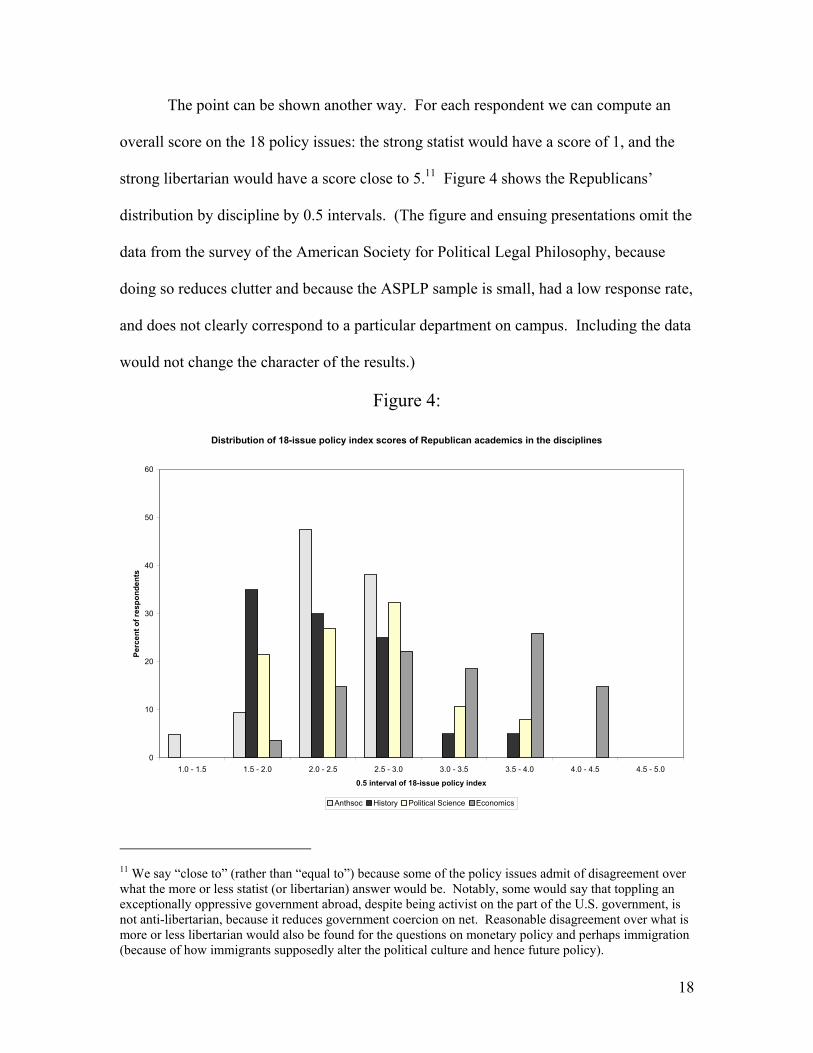
Figure 5 shows the same for the Democrats. They are much more tightly packed.
Almost none had scores above 3.0, and, in fact, not one above 3.5. Not only do the
Democrats utterly dominate the social sciences and humanities, but they have a narrow
tent of belief. Clearly, campus diversity does not extend to political/policy ideas and
values.
Figure 5:
Distribution of 18-issue policy index scores of Democratic academics in the disciplines
0
10
20
30
40
50
60
1.0 - 1.5 1.5 - 2.0 2.0 - 2.5 2.5 - 3.0 3.0 - 3.5 3.5 - 4.0 4.0 - 4.5 4.5 - 5.0
0.5 interval of 18-issue policy index
Perc
ent o
f res
pond
ents
Anthsoc History Political Science Economics
C. Statism v. Libertarianism
The 18 panels show that the vast majority of academics are quite statist. On 12 of
the 18 policy issues, the average D response and the average R response are both 3.00 or
19
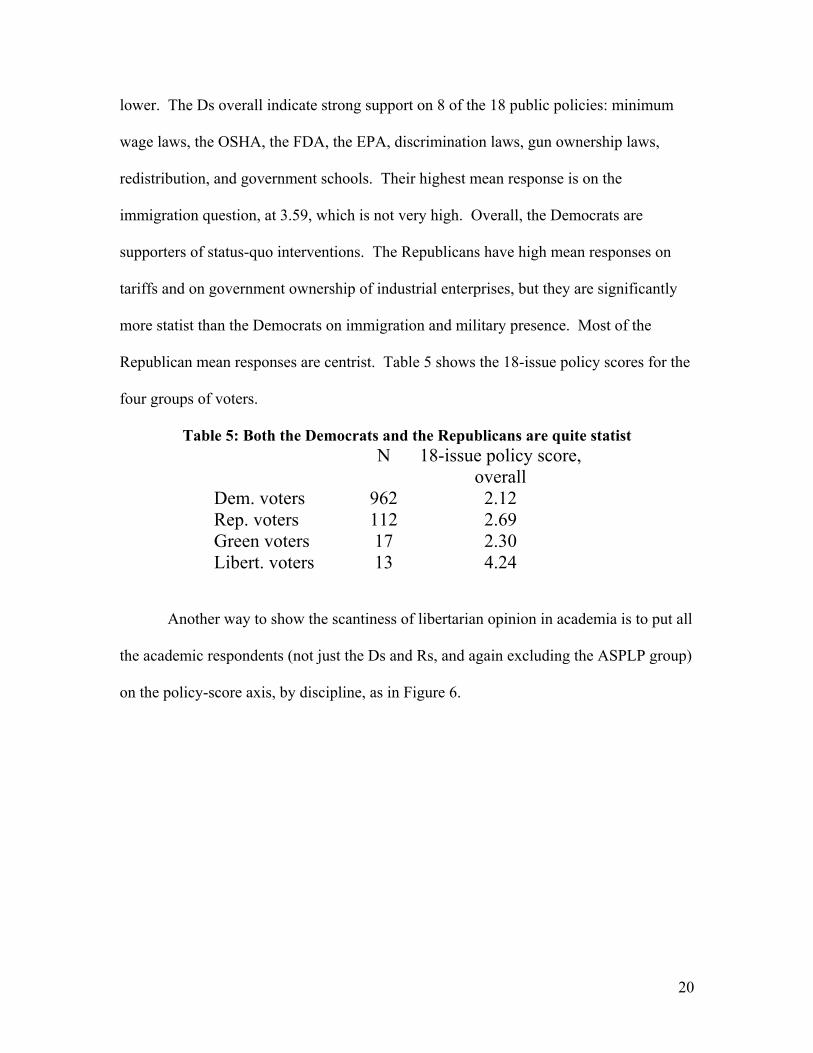
lower. The Ds overall indicate strong support on 8 of the 18 public policies: minimum
wage laws, the OSHA, the FDA, the EPA, discrimination laws, gun ownership laws,
redistribution, and government schools. Their highest mean response is on the
immigration question, at 3.59, which is not very high. Overall, the Democrats are
supporters of status-quo interventions. The Republicans have high mean responses on
tariffs and on government ownership of industrial enterprises, but they are significantly
more statist than the Democrats on immigration and military presence. Most of the
Republican mean responses are centrist. Table 5 shows the 18-issue policy scores for the
four groups of voters.
Table 5: Both the Democrats and the Republicans are quite statist N 18-issue policy score,
overall Dem. voters 962 2.12 Rep. voters 112 2.69 Green voters 17 2.30 Libert. voters 13 4.24
Another way to show the scantiness of libertarian opinion in academia is to put all
the academic respondents (not just the Ds and Rs, and again excluding the ASPLP group)
on the policy-score axis, by discipline, as in Figure 6.
20

Figure 6: Most academics are highly statist. Distribution of 18-issue policy index scores of academics in the disciplines
0
10
20
30
40
50
60
1.0 - 1.5 1.5 - 2.0 2.0 - 2.5 2.5 - 3.0 3.0 - 3.5 3.5 - 4.0 4.0 - 4.5 4.5 - 5.0
0.5 interval of 18-issue policy index
Perc
ent o
f res
pond
ents
Anthsoc History Political Science Economics
Figure 6 shows that, in all the fields except economics, most respondents lay in
the interval 1.5 to 2.5, indicating that the majority of social scientists support government
activism on the 18 issues.12
Republicans Scholars Are More Likely to Land Outside Academia
Again, we asked whether the respondent’s primary employment has been
academic or various non-academic options. As shown in Tables 6, non-academic 12 Fuller et al (1995) provide survey data comparing American Economics Association members with Republican delegates and Democratic delegates at the 1992 national conventions. The survey contains many policy questions, though not immigration or military action. The Republican delegates appear to be significantly more libertarian than economists, while the Democratic delegates do not appear to be noticeably more libertarian or more statist than the economists.
21
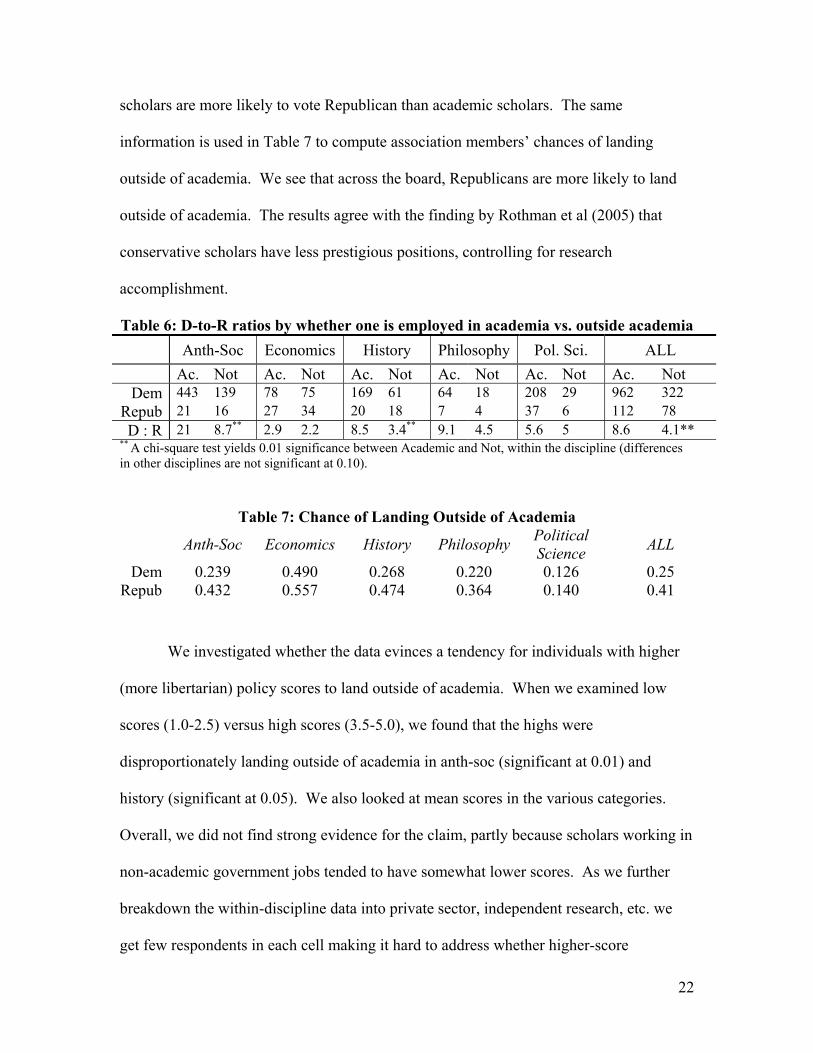
scholars are more likely to vote Republican than academic scholars. The same
information is used in Table 7 to compute association members’ chances of landing
outside of academia. We see that across the board, Republicans are more likely to land
outside of academia. The results agree with the finding by Rothman et al (2005) that
conservative scholars have less prestigious positions, controlling for research
accomplishment.
Table 6: D-to-R ratios by whether one is employed in academia vs. outside academia Anth-Soc Economics History Philosophy Pol. Sci. ALL
Ac. Not Ac. Not Ac. Not Ac. Not Ac. Not Ac. Not Dem 443 139 78 75 169 61 64 18 208 29 962 322
Repub 21 16 27 34 20 18 7 4 37 6 112 78 D : R 21 8.7** 2.9 2.2 8.5 3.4** 9.1 4.5 5.6 5 8.6 4.1**
** A chi-square test yields 0.01 significance between Academic and Not, within the discipline (differences in other disciplines are not significant at 0.10).
Table 7: Chance of Landing Outside of Academia Anth-Soc Economics History Philosophy Political
Science ALL
Dem 0.239 0.490 0.268 0.220 0.126 0.25 Repub 0.432 0.557 0.474 0.364 0.140 0.41
We investigated whether the data evinces a tendency for individuals with higher
(more libertarian) policy scores to land outside of academia. When we examined low
scores (1.0-2.5) versus high scores (3.5-5.0), we found that the highs were
disproportionately landing outside of academia in anth-soc (significant at 0.01) and
history (significant at 0.05). We also looked at mean scores in the various categories.
Overall, we did not find strong evidence for the claim, partly because scholars working in
non-academic government jobs tended to have somewhat lower scores. As we further
breakdown the within-discipline data into private sector, independent research, etc. we
get few respondents in each cell making it hard to address whether higher-score
22
individuals tend to get sorted out. One may conjecture that the relative-likelihood of
membership is higher for an anti-left scholar in academia than for such scholar outside
academia, because such a scholar joins mainly for professional reasons, which could
mean that our data fail to evince a sorting-out that nonetheless exists.
Younger Professors Are Slightly Less Statist
The six panels of Figure 7 show the scatter of points for all academic respondents
(not just the Ds and Rs) with horizontal birth-year and vertical individual’s score on the
18 issues. Every trend line is rising slightly. That is, younger professors tend to be
slightly less statist than older professors.13 Similar scatter-plots (not presented here)
show that Democrats in all six associations are trending upward in policy index, and
Republicans in four of the six. That is, almost across the board, the younger academics
tend to be slightly less statist than their aged counterparts.
13 Regressions using birthyear to predict policy scores turn out to be statistically significant in history (0.01 percent level), in sociology (0.03) and in anthropology (0.10).
23
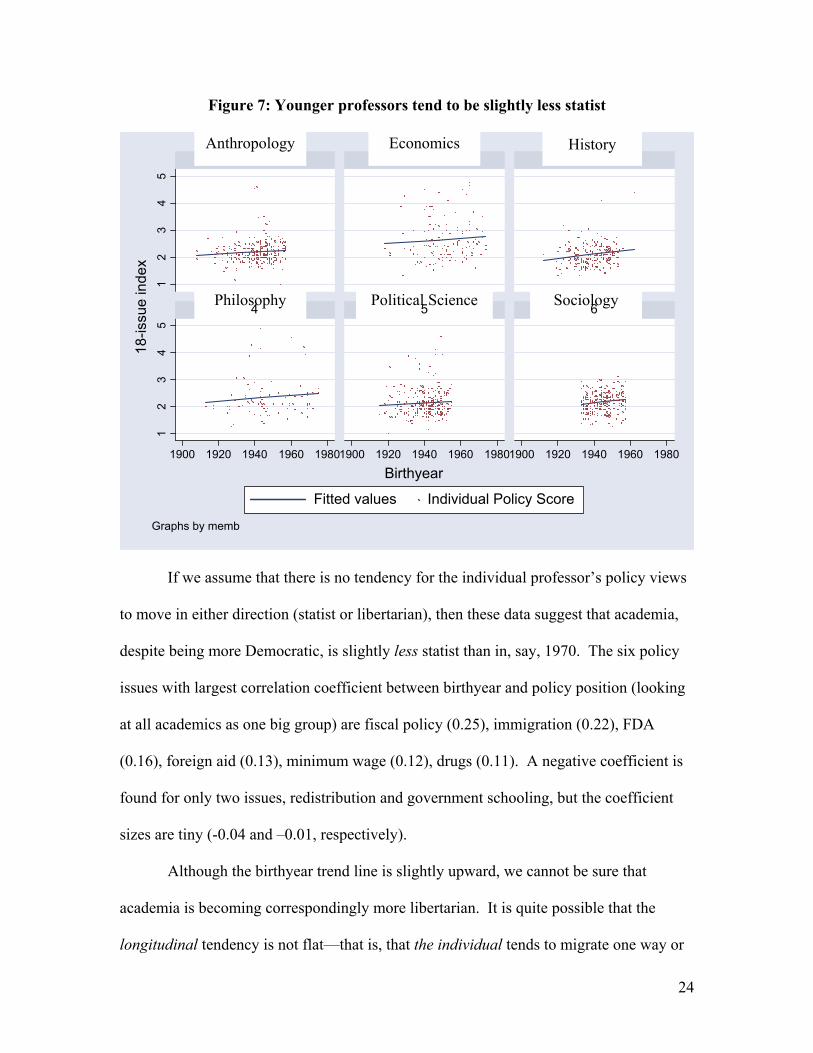
Figure 7: Younger professors tend to be slightly less statist
12
34
51
23
45
1900 1
1 2 318
-issu
e in
dex
Graphs by
s
If we a
to move in eit
despite being
issues with lar
at all academi
(0.16), foreign
found for only
sizes are tiny
Althou
academia is b
longitudinal t
Philosophy
920 1940 1960 19801900
Fitted va
memb
4
ssume that there is no te
her direction (statist or li
more Democratic, is slig
gest correlation coefficie
cs as one big group) are
aid (0.13), minimum w
two issues, redistributio
(-0.04 and –0.01, respect
gh the birthyear trend lin
ecoming correspondingly
endency is not flat—that
Political Science
1920 1940 1960 19801900
lues Individual Policy S
Birthyear
5
ndency for the individual pro
bertarian), then these data su
htly less statist than in, say,
nt between birthyear and po
fiscal policy (0.25), immigra
age (0.12), drugs (0.11). A n
n and government schooling
ively).
e is slightly upward, we can
more libertarian. It is quite
is, that the individual tends t
Sociology
Economic
Anthropology192
co
fe
gg
19
lic
tio
eg
, b
no
po
o
History
0 1940 1960 1980
re
6
ssor’s policy views
est that academia,
70. The six policy
y position (looking
n (0.22), FDA
ative coefficient is
ut the coefficient
t be sure that
ssible that the
migrate one way or
24
the other over time. One theory is that ideological migrants tend to go in the libertarian
direction, because collectivistic instincts and sentiments get “mugged by reality” and
illusions about government and the political process tend to disintegrate. A
countervailing theory is that after years of immersion in the academy, the professor tends
to move in the statist direction.14 All we know for sure is that, today, younger professors
tend to be slightly less statist than older professors.
Cross-tabulation of policy scores
In the tables below, we tabulate policy scores by discipline and political party.
The 18 policy issues are separated into five sub-groups: economic interventions,
government protection of the disadvantaged, gun control, cross-national government
activism, and personal choice controls. The disciplines are ordered by their D-to-R
ratios.
14 The survey asked the respondent what she thought on each issue when she was 25 years old. The
retrospective question is one we will be addressing when we get around to analyzing the when-25 data from
our survey.
25
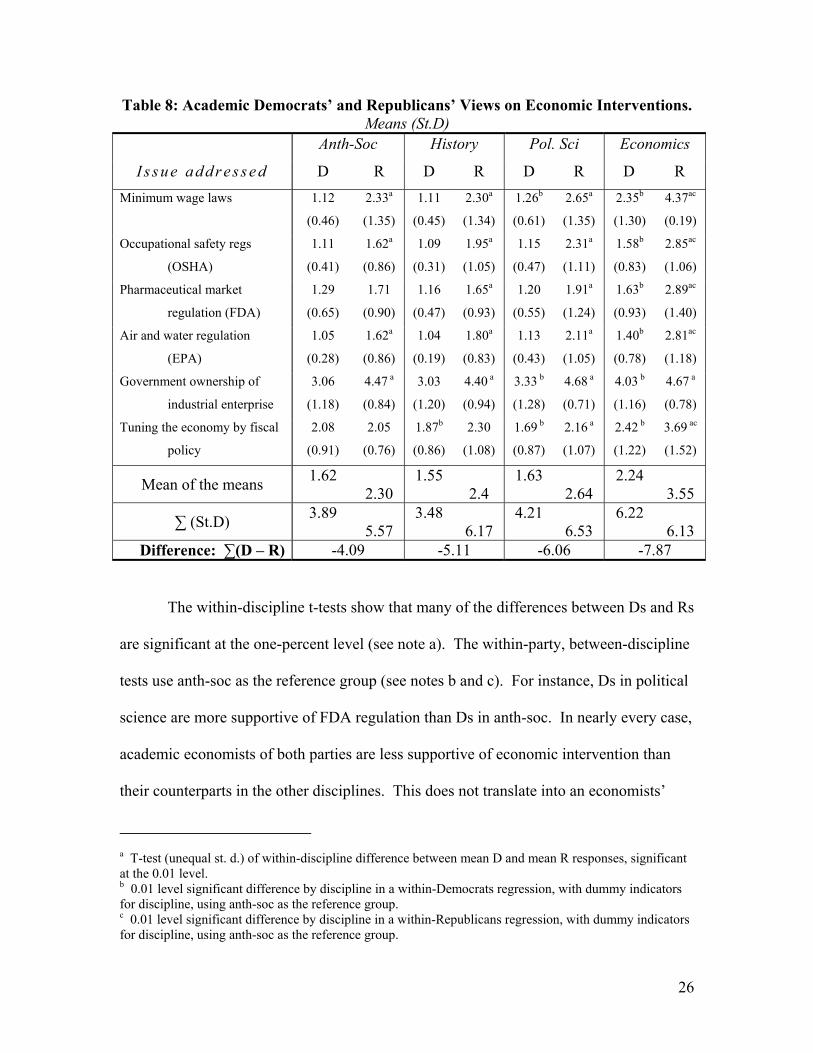
Table 8: Academic Democrats’ and Republicans’ Views on Economic Interventions. Means (St.D)
Anth-Soc History Pol. Sci Economics
I s s u e a d dr e s s e d D R D R D R D R Minimum wage laws 1.12
(0.46)
2.33a
(1.35)
1.11
(0.45)
2.30a
(1.34)
1.26b
(0.61)
2.65a
(1.35)
2.35b
(1.30)
4.37ac
(0.19)
Occupational safety regs
(OSHA)
1.11
(0.41)
1.62a
(0.86)
1.09
(0.31)
1.95a
(1.05)
1.15
(0.47)
2.31a
(1.11)
1.58b
(0.83)
2.85ac
(1.06)
Pharmaceutical market
regulation (FDA)
1.29
(0.65)
1.71
(0.90)
1.16
(0.47)
1.65a
(0.93)
1.20
(0.55)
1.91a
(1.24)
1.63b
(0.93)
2.89ac
(1.40)
Air and water regulation
(EPA)
1.05
(0.28)
1.62a
(0.86)
1.04
(0.19)
1.80a
(0.83)
1.13
(0.43)
2.11a
(1.05)
1.40b
(0.78)
2.81ac
(1.18)
Government ownership of
industrial enterprise
3.06
(1.18)
4.47 a
(0.84)
3.03
(1.20)
4.40 a
(0.94)
3.33 b
(1.28)
4.68 a
(0.71)
4.03 b
(1.16)
4.67 a
(0.78)
Tuning the economy by fiscal
policy
2.08
(0.91)
2.05
(0.76)
1.87b
(0.86)
2.30
(1.08)
1.69 b
(0.87)
2.16 a
(1.07)
2.42 b
(1.22)
3.69 ac
(1.52)
Mean of the means 1.62 2.30
1.55 2.4
1.63 2.64
2.24 3.55
∑ (St.D) 3.89 5.57
3.48 6.17
4.21 6.53
6.22 6.13
Difference: ∑(D – R) -4.09 -5.11 -6.06 -7.87
The within-discipline t-tests show that many of the differences between Ds and Rs
are significant at the one-percent level (see note a). The within-party, between-discipline
tests use anth-soc as the reference group (see notes b and c). For instance, Ds in political
science are more supportive of FDA regulation than Ds in anth-soc. In nearly every case,
academic economists of both parties are less supportive of economic intervention than
their counterparts in the other disciplines. This does not translate into an economists’
a T-test (unequal st. d.) of within-discipline difference between mean D and mean R responses, significant at the 0.01 level. b 0.01 level significant difference by discipline in a within-Democrats regression, with dummy indicators for discipline, using anth-soc as the reference group. c 0.01 level significant difference by discipline in a within-Republicans regression, with dummy indicators for discipline, using anth-soc as the reference group.
26
consensus, however. Adding up the differences between the Ds and Rs (the last row of
Table 8) suggest that the difference between the two parties is largest in economics.
Comparing the standard deviations of the Ds (the larger of the two groups) indicate that
on most economic policy issues, the Ds in economics show more variation than those in
the other disciplines.
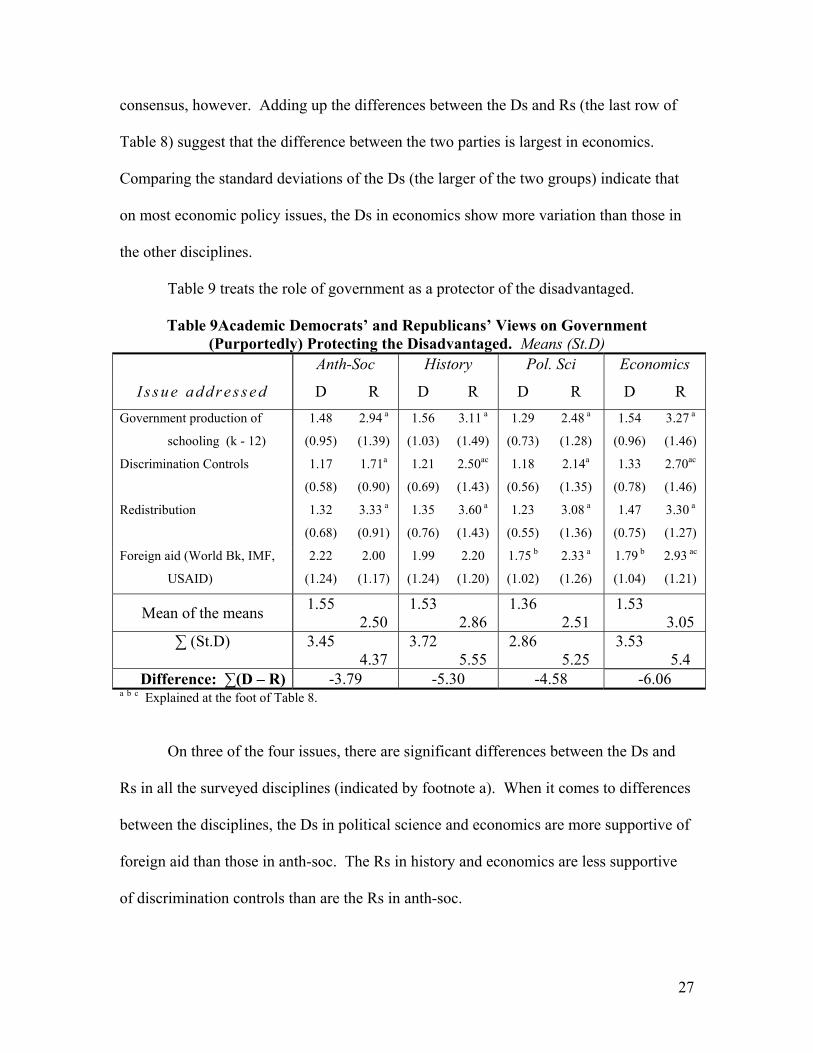
Table 9 treats the role of government as a protector of the disadvantaged.
Table 9Academic Democrats’ and Republicans’ Views on Government (Purportedly) Protecting the Disadvantaged. Means (St.D)
Anth-Soc History Pol. Sci Economics
I s s u e a d dr e s s e d D R D R D R D R Government production of
schooling (k - 12)
1.48
(0.95)
2.94 a
(1.39)
1.56
(1.03)
3.11 a
(1.49)
1.29
(0.73)
2.48 a
(1.28)
1.54
(0.96)
3.27 a
(1.46)
Discrimination Controls 1.17
(0.58)
1.71a
(0.90)
1.21
(0.69)
2.50ac
(1.43)
1.18
(0.56)
2.14a
(1.35)
1.33
(0.78)
2.70ac
(1.46)
Redistribution 1.32
(0.68)
3.33 a
(0.91)
1.35
(0.76)
3.60 a
(1.43)
1.23
(0.55)
3.08 a
(1.36)
1.47
(0.75)
3.30 a
(1.27)
Foreign aid (World Bk, IMF,
USAID)
2.22
(1.24)
2.00
(1.17)
1.99
(1.24)
2.20
(1.20)
1.75 b
(1.02)
2.33 a
(1.26)
1.79 b
(1.04)
2.93 ac
(1.21)
Mean of the means 1.55 2.50
1.53 2.86
1.36 2.51
1.53 3.05
∑ (St.D)
3.45 4.37
3.72 5.55
2.86 5.25
3.53 5.4
Difference: ∑(D – R) -3.79 -5.30 -4.58 -6.06 a b c Explained at the foot of Table 8.
On three of the four issues, there are significant differences between the Ds and
Rs in all the surveyed disciplines (indicated by footnote a). When it comes to differences
between the disciplines, the Ds in political science and economics are more supportive of
foreign aid than those in anth-soc. The Rs in history and economics are less supportive
of discrimination controls than are the Rs in anth-soc.
27
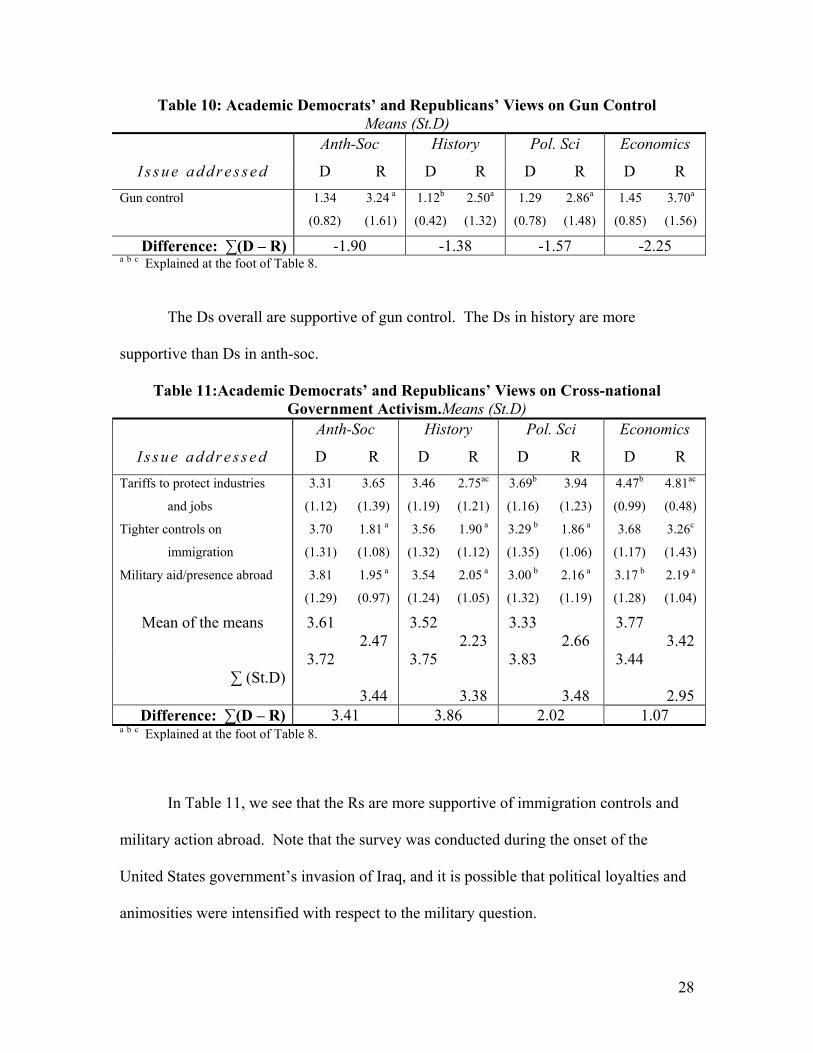
Table 10: Academic Democrats’ and Republicans’ Views on Gun Control Means (St.D)
Anth-Soc History Pol. Sci Economics
I s s u e a d dr e s s e d D R D R D R D R Gun control 1.34
(0.82)
3.24 a
(1.61)
1.12b
(0.42)
2.50a
(1.32)
1.29
(0.78)
2.86a
(1.48)
1.45
(0.85)
3.70a
(1.56)
Difference: ∑(D – R) -1.90 -1.38 -1.57 -2.25 a b c Explained at the foot of Table 8.
The Ds overall are supportive of gun control. The Ds in history are more
supportive than Ds in anth-soc.
Table 11:Academic Democrats’ and Republicans’ Views on Cross-national Government Activism.Means (St.D)
Anth-Soc History Pol. Sci Economics
I s s u e a d dr e s s e d D R D R D R D R Tariffs to protect industries
and jobs
3.31
(1.12)
3.65
(1.39)
3.46
(1.19)
2.75ac
(1.21)
3.69b
(1.16)
3.94
(1.23)
4.47b
(0.99)
4.81ac
(0.48)
Tighter controls on
immigration
3.70
(1.31)
1.81 a
(1.08)
3.56
(1.32)
1.90 a
(1.12)
3.29 b
(1.35)
1.86 a
(1.06)
3.68
(1.17)
3.26c
(1.43)
Military aid/presence abroad 3.81
(1.29)
1.95 a
(0.97)
3.54
(1.24)
2.05 a
(1.05)
3.00 b
(1.32)
2.16 a
(1.19)
3.17 b
(1.28)
2.19 a
(1.04)
Mean of the means 3.61 2.47
3.52 2.23
3.33 2.66
3.77 3.42
∑ (St.D)
3.72
3.44
3.75
3.38
3.83
3.48
3.44
2.95 Difference: ∑(D – R) 3.41 3.86 2.02 1.07
a b c Explained at the foot of Table 8.
In Table 11, we see that the Rs are more supportive of immigration controls and
military action abroad. Note that the survey was conducted during the onset of the
United States government’s invasion of Iraq, and it is possible that political loyalties and
animosities were intensified with respect to the military question.
28
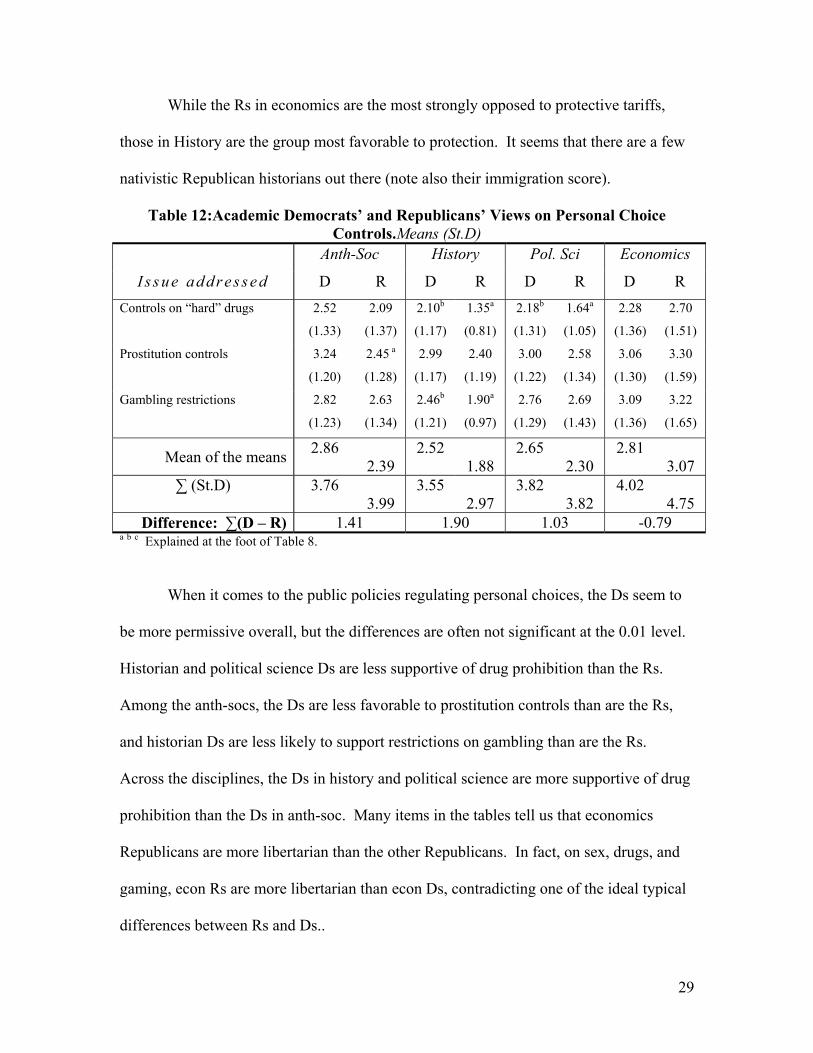
While the Rs in economics are the most strongly opposed to protective tariffs,
those in History are the group most favorable to protection. It seems that there are a few
nativistic Republican historians out there (note also their immigration score).
Table 12:Academic Democrats’ and Republicans’ Views on Personal Choice Controls.Means (St.D)
Anth-Soc History Pol. Sci Economics
I s s u e a d dr e s s e d D R D R D R D R Controls on “hard” drugs 2.52
(1.33)
2.09
(1.37)
2.10b
(1.17)
1.35a
(0.81)
2.18b
(1.31)
1.64a
(1.05)
2.28
(1.36)
2.70
(1.51)
Prostitution controls 3.24
(1.20)
2.45 a
(1.28)
2.99
(1.17)
2.40
(1.19)
3.00
(1.22)
2.58
(1.34)
3.06
(1.30)
3.30
(1.59)
Gambling restrictions 2.82
(1.23)
2.63
(1.34)
2.46b
(1.21)
1.90a
(0.97)
2.76
(1.29)
2.69
(1.43)
3.09
(1.36)
3.22
(1.65)
Mean of the means 2.86 2.39
2.52 1.88
2.65 2.30
2.81 3.07
∑ (St.D)
3.76 3.99
3.55 2.97
3.82 3.82
4.02 4.75
Difference: ∑(D – R) 1.41 1.90 1.03 -0.79 a b c Explained at the foot of Table 8.
When it comes to the public policies regulating personal choices, the Ds seem to
be more permissive overall, but the differences are often not significant at the 0.01 level.
Historian and political science Ds are less supportive of drug prohibition than the Rs.
Among the anth-socs, the Ds are less favorable to prostitution controls than are the Rs,
and historian Ds are less likely to support restrictions on gambling than are the Rs.
Across the disciplines, the Ds in history and political science are more supportive of drug
prohibition than the Ds in anth-soc. Many items in the tables tell us that economics
Republicans are more libertarian than the other Republicans. In fact, on sex, drugs, and
gaming, econ Rs are more libertarian than econ Ds, contradicting one of the ideal typical
differences between Rs and Ds..
29
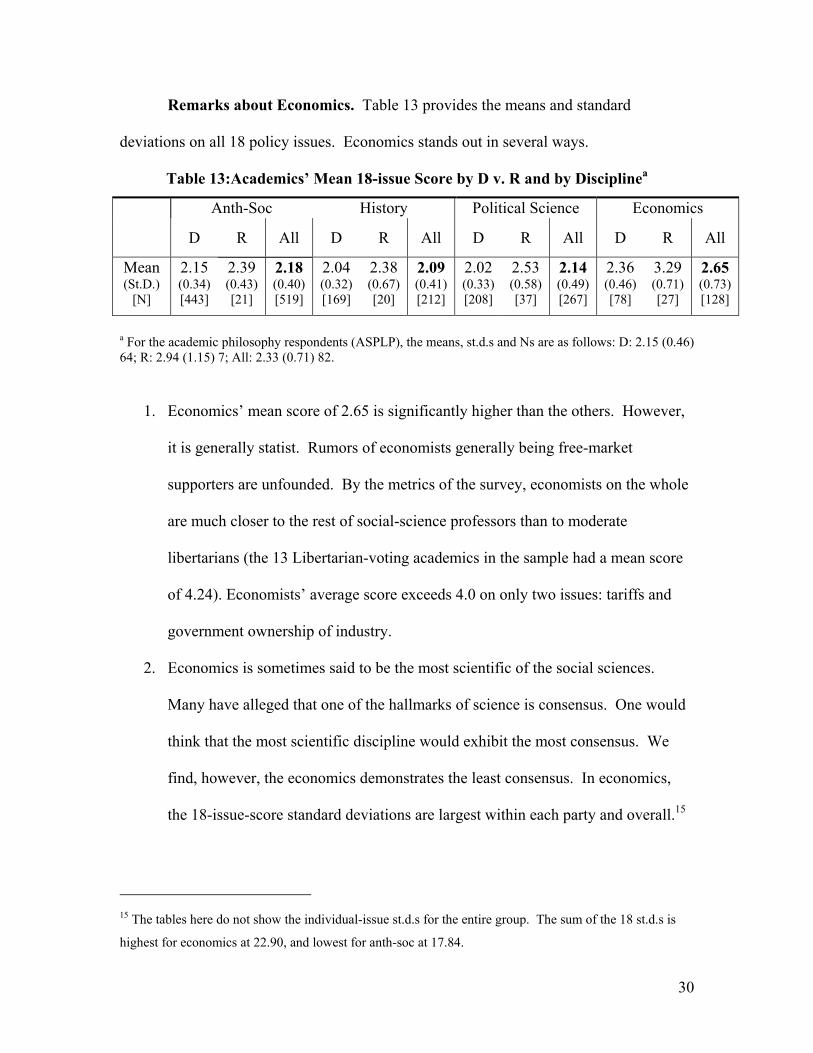
Remarks about Economics. Table 13 provides the means and standard
deviations on all 18 policy issues. Economics stands out in several ways.
Table 13:Academics’ Mean 18-issue Score by D v. R and by Disciplinea
Anth-Soc History Political Science Economics
D R All D R All D R All D R All
Mean (St.D.)
[N]
2.15 (0.34) [443]
2.39 (0.43) [21]
2.18 (0.40) [519]
2.04 (0.32) [169]
2.38 (0.67) [20]
2.09 (0.41) [212]
2.02 (0.33) [208]
2.53 (0.58) [37]
2.14 (0.49) [267]
2.36 (0.46) [78]
3.29 (0.71) [27]
2.65 (0.73) [128]
a For the academic philosophy respondents (ASPLP), the means, st.d.s and Ns are as follows: D: 2.15 (0.46) 64; R: 2.94 (1.15) 7; All: 2.33 (0.71) 82.
1. Economics’ mean score of 2.65 is significantly higher than the others. However,
it is generally statist. Rumors of economists generally being free-market
supporters are unfounded. By the metrics of the survey, economists on the whole
are much closer to the rest of social-science professors than to moderate
libertarians (the 13 Libertarian-voting academics in the sample had a mean score
of 4.24). Economists’ average score exceeds 4.0 on only two issues: tariffs and
government ownership of industry.
2. Economics is sometimes said to be the most scientific of the social sciences.
Many have alleged that one of the hallmarks of science is consensus. One would
think that the most scientific discipline would exhibit the most consensus. We
find, however, the economics demonstrates the least consensus. In economics,
the 18-issue-score standard deviations are largest within each party and overall.15
15 The tables here do not show the individual-issue st.d.s for the entire group. The sum of the 18 st.d.s is
highest for economics at 22.90, and lowest for anth-soc at 17.84.
30
Indeed, of the five scholarly groups,16 economists exhibit the least consensus on
13 of the 18 issues: minimum wage, OSHA, FDA, EPA, discrimination, drugs,
prostitution, gambling, guns, redistribution, government schooling, monetary
policy, and fiscal policy. It is frequently on their own scientific turf that
economists’ collective judgment least satisfies the supposed hallmark of science.
Our own (libertarian) interpretation of the finding is one that is favorable to
economics, relative to the other disciplines: Better to have a lack of consensus
than a misguided consensus.
3. However, on four issues where Democrats have a relatively high score, especially
tariffs and government ownership of industry, but also immigration and military,
the economists have the most consensus. A crude way of reading the consensus
(st.d.) results is that economic thinking goes with higher policy scores, and when
general academic (i.e., Democratic) opinion is very statist, that spells less
consensus, but when general academic opinion is moderate, that spells more
consensus. (The only issue on which economists have neither the highest nor the
lowest st.d. is foreign aid.)
Statistical Investigation of Voting
Here we report multivariate regressions to determine statistical correlations with
voting D (and D-and/or-Green). The analysis includes the data from the philosophy
group (the ASPLP). The analysis drops respondents with missing data for one or more of
16 That is, continuing to treat anth-soc as one group, and including also the philosophers as a separate
group.
31
the variables (however, the policy-index variable is computed and intact so long as the
respondent answered at least one of the 18 policy questions). The first two statistical
models make the dependent variable voting D as opposed to voting R; that is, Models 1
and 2 are confined to respondents who vote either D or R. Model 3 makes the dependent
variable voting D-and/or-Green17 (“left”), as opposed to voting R-and/or-Libertarian
(“right”), and hence is confined to that slightly enlarged set of respondents. The Ns for
each model are reported in Table 14.
We use several independent variables. To check whether voting D corresponds
with generally being statist on the issues, we include the 18-issue policy index as an
independent variable.
Another independent variable is political socialization. Political socialization has
been studied mostly in terms of parents-to-child transfer of political party identification
(see for instance Tedin 1974, , Glass et al 1986, Niemi and Jennings 1991,Beck and
Jennings 1975, 1991, Sears and Funk 1999, Jennings, Stoker and Bowers 1999,). Our
survey asked: “How would you describe the overall political-party affiliation of the
family you grew up in” and offered the options “mostly Democratic,” “mostly
Republican,” “A mixture,” and “non-political.” In the statistical model, we include two
indicators of parental influence. One indicates that the respondent reported parents being
mostly Democratic, and the other mostly Republican. The reference category is
respondents who record their parents being either a mixture of the two or non-political.
17 We say D-and/or-Green, rather than D-or-Green, because 16 respondents checked both D and Green (and similarly, 3 checked R and Libertarian). Such double-checking respondents (some of which are non-academics) are included in Model 3.
32
We test to see whether non-academic scholars are less likely to vote Democratic
than academic scholars. A positive correlation between voting D and being an academic
would suggest sorting effects.
Respondents in anthropology and sociology had the highest D-to-R ratios, while
respondents in economics had the lowest D-to-R ratio and the lowest academic
frequency. To control for such extremities by discipline, we include as independent
variables both anth-soc and economics.
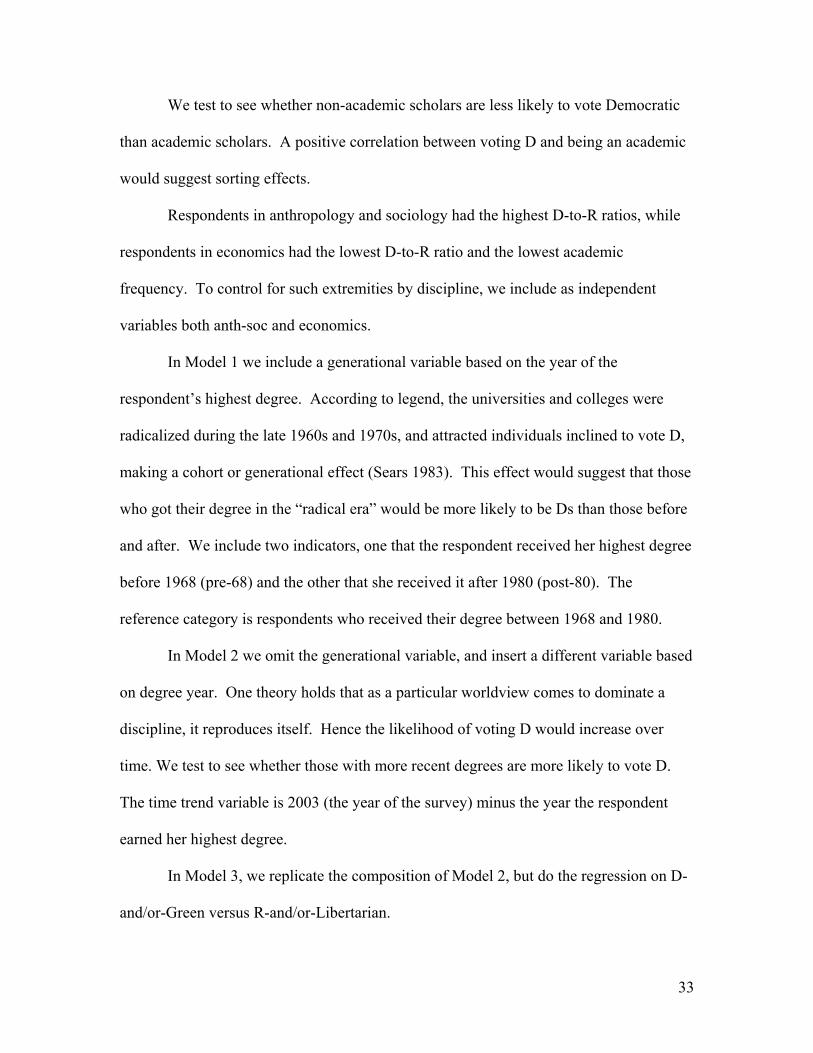
In Model 1 we include a generational variable based on the year of the
respondent’s highest degree. According to legend, the universities and colleges were
radicalized during the late 1960s and 1970s, and attracted individuals inclined to vote D,
making a cohort or generational effect (Sears 1983). This effect would suggest that those
who got their degree in the “radical era” would be more likely to be Ds than those before
and after. We include two indicators, one that the respondent received her highest degree
before 1968 (pre-68) and the other that she received it after 1980 (post-80). The
reference category is respondents who received their degree between 1968 and 1980.
In Model 2 we omit the generational variable, and insert a different variable based
on degree year. One theory holds that as a particular worldview comes to dominate a
discipline, it reproduces itself. Hence the likelihood of voting D would increase over
time. We test to see whether those with more recent degrees are more likely to vote D.
The time trend variable is 2003 (the year of the survey) minus the year the respondent
earned her highest degree.
In Model 3, we replicate the composition of Model 2, but do the regression on D-
and/or-Green versus R-and/or-Libertarian.
33
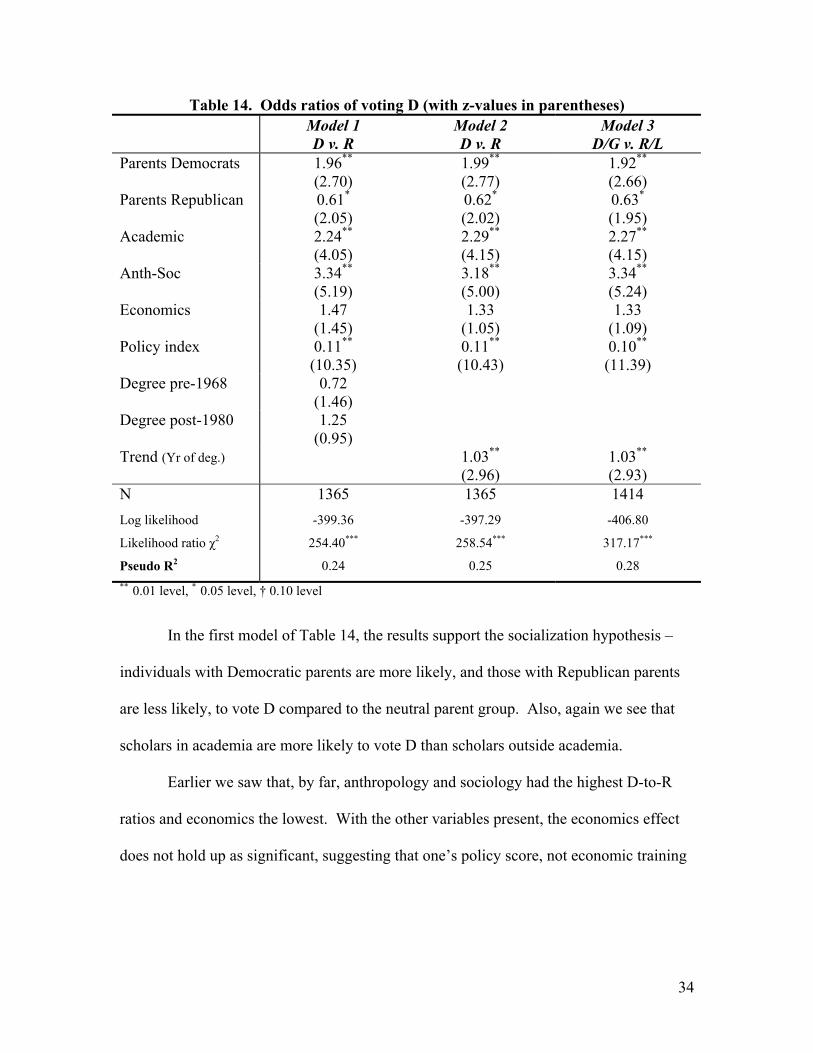
Table 14. Odds ratios of voting D (with z-values in parentheses) Model 1
D v. R Model 2 D v. R
Model 3 D/G v. R/L
Parents Democrats 1.96** (2.70)
1.99** (2.77)
1.92** (2.66)
Parents Republican 0.61* (2.05)
0.62* (2.02)
0.63* (1.95)
Academic 2.24** (4.05)
2.29** (4.15)
2.27** (4.15)
Anth-Soc 3.34** (5.19)
3.18** (5.00)
3.34** (5.24)
Economics 1.47 (1.45)
1.33 (1.05)
1.33 (1.09)
Policy index 0.11** (10.35)
0.11** (10.43)
0.10** (11.39)
Degree pre-1968 0.72 (1.46)
Degree post-1980 1.25 (0.95)
Trend (Yr of deg.) 1.03** (2.96)
1.03** (2.93)
N 1365 1365 1414 Log likelihood -399.36 -397.29 -406.80
Likelihood ratio χ2 254.40*** 258.54*** 317.17***
Pseudo R2 0.24 0.25 0.28 ** 0.01 level, * 0.05 level, † 0.10 level
In the first model of Table 14, the results support the socialization hypothesis –
individuals with Democratic parents are more likely, and those with Republican parents
are less likely, to vote D compared to the neutral parent group. Also, again we see that
scholars in academia are more likely to vote D than scholars outside academia.
Earlier we saw that, by far, anthropology and sociology had the highest D-to-R
ratios and economics the lowest. With the other variables present, the economics effect
does not hold up as significant, suggesting that one’s policy score, not economic training
34
per se, correlates inversely with voting D.18 However, anth-soc continues to be
significant, suggesting that there is something especially left-wing about the
anthropology and sociology professions.
Model 1 does not find a “radical era” effect. Respondents with pre-1968 degrees
and post-1980 degrees do not differ significantly from the “radical era” respondents.
Model 2, however, introduces the trend effect (year of degree), and it is significant. The
longer ago the respondent got her degree, the less likely she is to vote D. One
interpretation is self-reinforcing Democratic domination.
Model 3 separates by “left” and “right,” and the results are unchanged.
In summary, voting D is significantly correlated with each of the following:
having Democratic parents, being employed in academia, being an anthropologist or
sociologist, having statist policy views, and having a more recent degree.
Exploring Ideological Groupings Using Cluster Analysis
Cluster analysis is a mathematical technique to identify groupings of observations
(Everitt 1993, 10). There are many ways to perform cluster analysis and what we present
here is the result of one particular cluster analysis that we found to be intuitive and
interesting. However, the results presented here were typical of the many variations we
investigated.19
18 We also ran Model 1 without the policy index. In that case, being an economist has a negative effect on
voting D and is significant at the 0.01 level. 19 We have created a large unpublished pdf-file appendix where we show results from alternative methods of performing the analysis. The appendix shows that all the methods generally results either very much like
35
Using STATA 8, we performed a clustering technique in which the N
observations start out as N separate groups each of size one. The two closest groups are
merged into one group and so on until all observations are merged into one large group.
To define the closest two groups to be merged, we use complete linkage clustering, a
technique that determines the farthest observations between two groups and merge
groups accordingly.20 The technique drops any observations with missing values. To
reduce the loss of data, we excluded three policy issues: monetary and fiscal policy
because many respondents indicated “have no opinion,” and the “government production
of schooling” question, because a substantial number of respondents did not answer the
question.21
or compatible with the results of the single analysis presented here. The appendix is available online at http://www.gmu.edu/departments/economics/klein/survey/Alternative_cluster_analyses_appendix.doc. 20 The cluster analysis uses the default L2 Euclidean distance. 21 In the online appendix we have an alternative strategy were we treat “have no opinion” as “have mixed feelings” answers (hence coding them as 3 rather than missing) and keep fiscal and monetary policy items in the analyses. The results are similar.
36
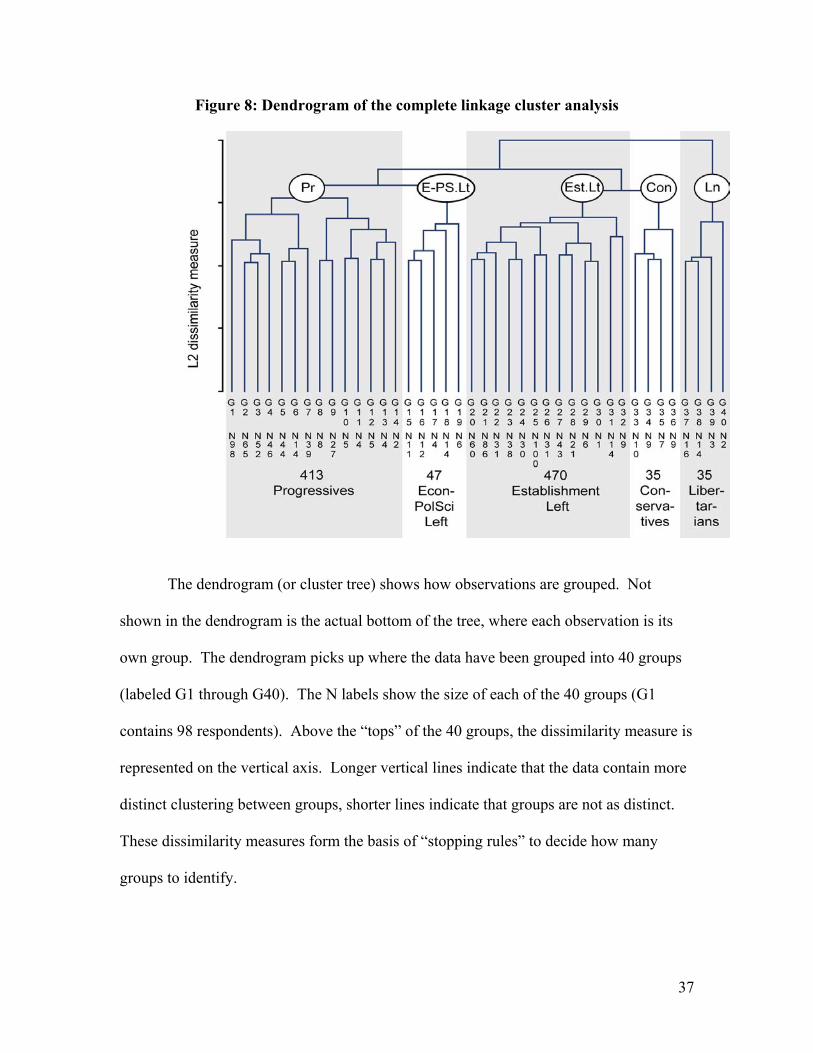
Figure 8: Dendrogram of the complete linkage cluster analysis
The dendrogram (or cluster tree) shows how observations are grouped. Not
shown in the dendrogram is the actual bottom of the tree, where each observation is its
own group. The dendrogram picks up where the data have been grouped into 40 groups
(labeled G1 through G40). The N labels show the size of each of the 40 groups (G1
contains 98 respondents). Above the “tops” of the 40 groups, the dissimilarity measure is
represented on the vertical axis. Longer vertical lines indicate that the data contain more
distinct clustering between groups, shorter lines indicate that groups are not as distinct.
These dissimilarity measures form the basis of “stopping rules” to decide how many
groups to identify.
37
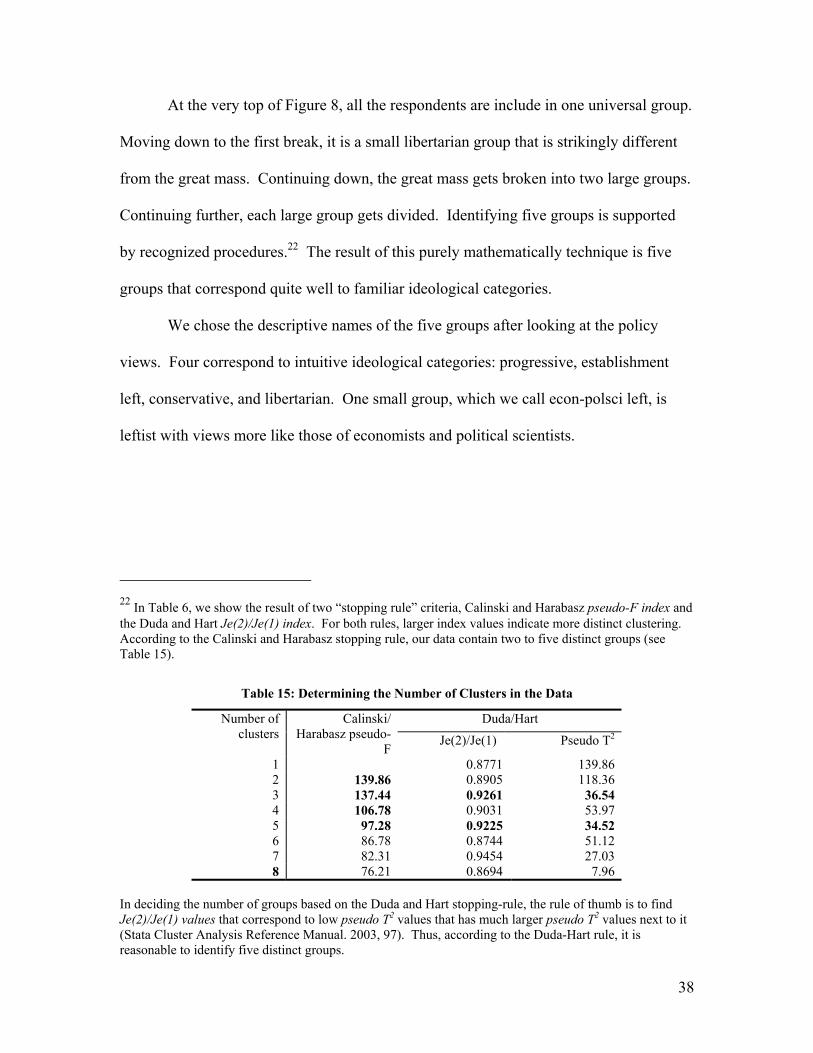
At the very top of Figure 8, all the respondents are include in one universal group.
Moving down to the first break, it is a small libertarian group that is strikingly different
from the great mass. Continuing down, the great mass gets broken into two large groups.
Continuing further, each large group gets divided. Identifying five groups is supported
by recognized procedures.22 The result of this purely mathematically technique is five
groups that correspond quite well to familiar ideological categories.
We chose the descriptive names of the five groups after looking at the policy
views. Four correspond to intuitive ideological categories: progressive, establishment
left, conservative, and libertarian. One small group, which we call econ-polsci left, is
leftist with views more like those of economists and political scientists.
22 In Table 6, we show the result of two “stopping rule” criteria, Calinski and Harabasz pseudo-F index and the Duda and Hart Je(2)/Je(1) index. For both rules, larger index values indicate more distinct clustering. According to the Calinski and Harabasz stopping rule, our data contain two to five distinct groups (see Table 15).
Table 15: Determining the Number of Clusters in the Data
Duda/Hart Number of clusters
Calinski/ Harabasz pseudo-
FJe(2)/Je(1) Pseudo T2
1 0.8771 139.86 2 139.86 0.8905 118.36 3 137.44 0.9261 36.54 4 106.78 0.9031 53.97 5 97.28 0.9225 34.52 6 86.78 0.8744 51.12 7 82.31 0.9454 27.03
8 76.21 0.8694 7.96 In deciding the number of groups based on the Duda and Hart stopping-rule, the rule of thumb is to find Je(2)/Je(1) values that correspond to low pseudo T2 values that has much larger pseudo T2 values next to it (Stata Cluster Analysis Reference Manual. 2003, 97). Thus, according to the Duda-Hart rule, it is reasonable to identify five distinct groups.
38
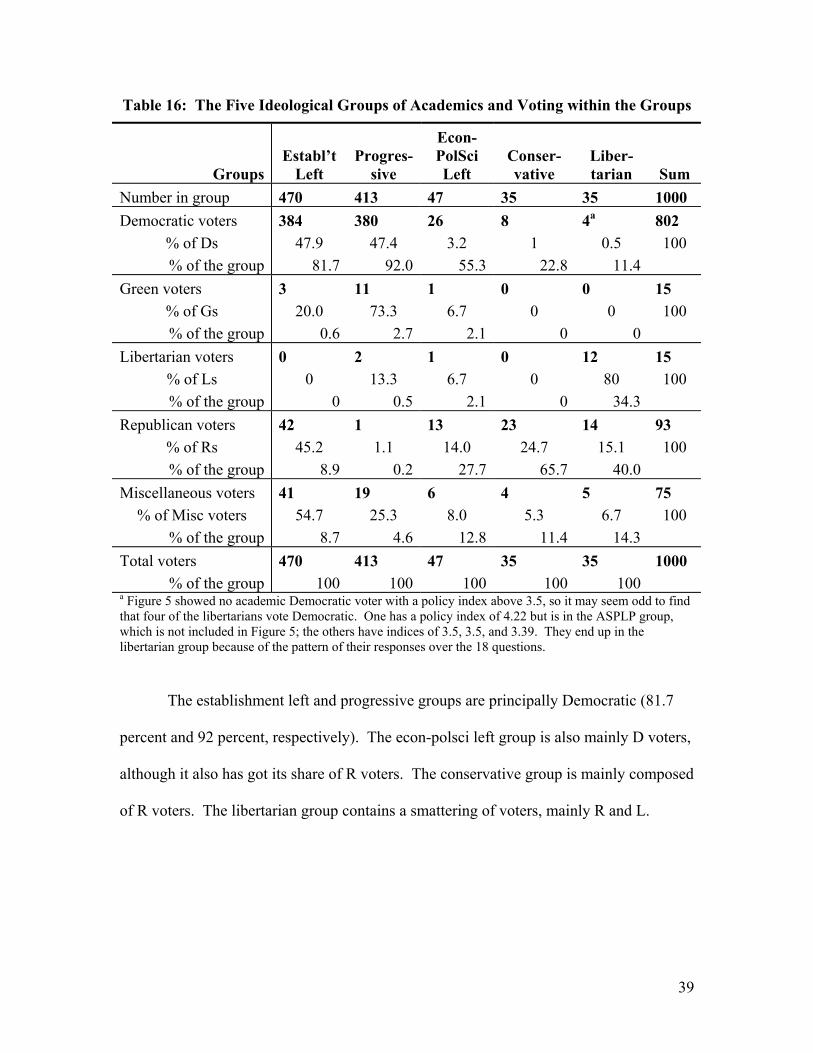
Table 16: The Five Ideological Groups of Academics and Voting within the Groups
Groups Establ’t
Left Progres-
sive
Econ-PolSci Left
Conser-vative
Liber-tarian Sum
Number in group 470 413 47 35 35 1000 Democratic voters
% of Ds % of the group
384 47.9
81.7
380 47.4
92.0
26 3.2
55.3
8 1
22.8
4a 0.5
11.4
802 100
Green voters
% of Gs % of the group
3 20.0
0.6
11 73.3
2.7
1 6.7
2.1
0 0
0
0 0
0
15 100
Libertarian voters % of Ls % of the group
0 0
0
2 13.3
0.5
1 6.7
2.1
0 0
0
12 80
34.3
15 100
Republican voters % of Rs % of the group
42 45.2
8.9
1 1.1
0.2
13 14.0
27.7
23 24.7
65.7
14 15.1
40.0
93 100
Miscellaneous voters % of Misc voters
% of the group
41 54.7
8.7
19 25.3
4.6
6 8.0
12.8
4 5.3
11.4
5 6.7
14.3
75 100
Total voters % of the group
470 100
413 100
47 100
35 100
35 100
1000
a Figure 5 showed no academic Democratic voter with a policy index above 3.5, so it may seem odd to find that four of the libertarians vote Democratic. One has a policy index of 4.22 but is in the ASPLP group, which is not included in Figure 5; the others have indices of 3.5, 3.5, and 3.39. They end up in the libertarian group because of the pattern of their responses over the 18 questions.
The establishment left and progressive groups are principally Democratic (81.7
percent and 92 percent, respectively). The econ-polsci left group is also mainly D voters,
although it also has got its share of R voters. The conservative group is mainly composed
of R voters. The libertarian group contains a smattering of voters, mainly R and L.
39
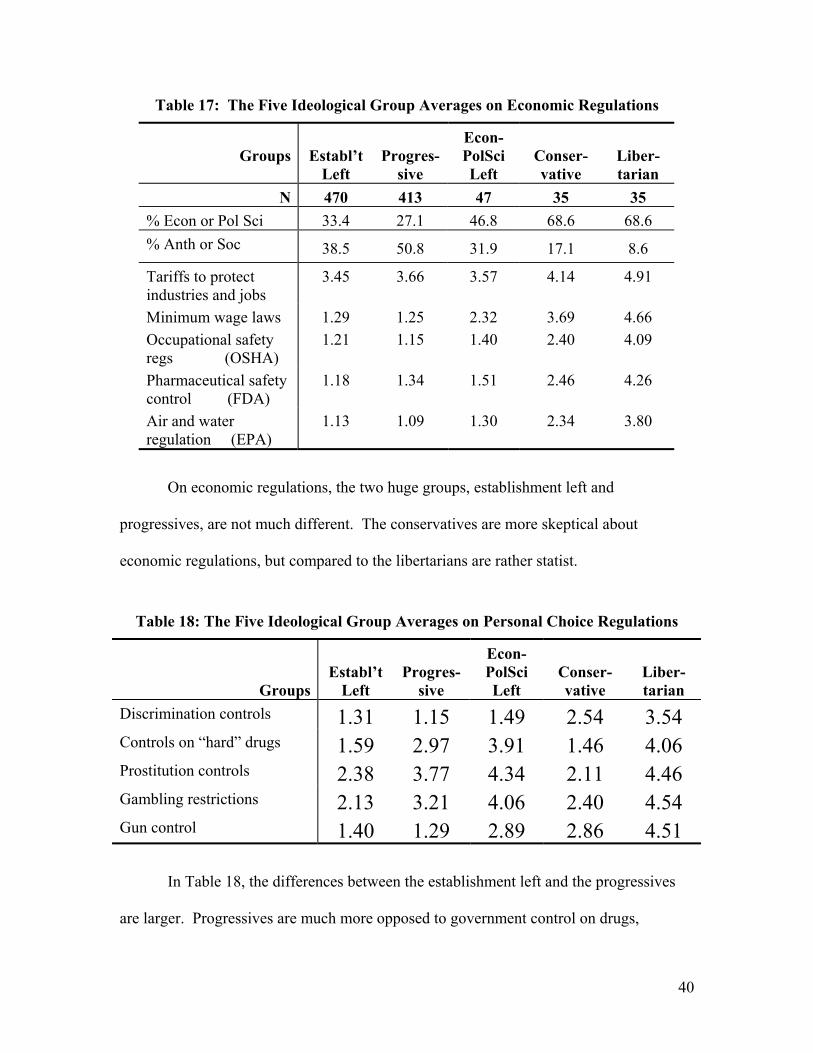
Table 17: The Five Ideological Group Averages on Economic Regulations
Groups Establ’t Left
Progres-sive
Econ-PolSci Left
Conser-vative
Liber-tarian
N 470 413 47 35 35 % Econ or Pol Sci 33.4 27.1 46.8 68.6 68.6 % Anth or Soc 38.5 50.8 31.9 17.1 8.6
Tariffs to protect industries and jobs
3.45 3.66 3.57 4.14 4.91
Minimum wage laws 1.29 1.25 2.32 3.69 4.66 Occupational safety regs (OSHA)
1.21 1.15 1.40 2.40 4.09
Pharmaceutical safety control (FDA)
1.18 1.34 1.51 2.46 4.26
Air and water regulation (EPA)
1.13 1.09 1.30 2.34 3.80
On economic regulations, the two huge groups, establishment left and
progressives, are not much different. The conservatives are more skeptical about
economic regulations, but compared to the libertarians are rather statist.
Table 18: The Five Ideological Group Averages on Personal Choice Regulations
Groups Establ’t
Left Progres-
sive
Econ-PolSci Left
Conser-vative
Liber-tarian
Discrimination controls 1.31 1.15 1.49 2.54 3.54 Controls on “hard” drugs 1.59 2.97 3.91 1.46 4.06 Prostitution controls 2.38 3.77 4.34 2.11 4.46 Gambling restrictions 2.13 3.21 4.06 2.40 4.54 Gun control 1.40 1.29 2.89 2.86 4.51
In Table 18, the differences between the establishment left and the progressives
are larger. Progressives are much more opposed to government control on drugs,
40
prostitution, and gambling, and they are slightly more supportive of control on guns and
discrimination. The conservatives are highly statist on drugs, prostitution, and gambling.
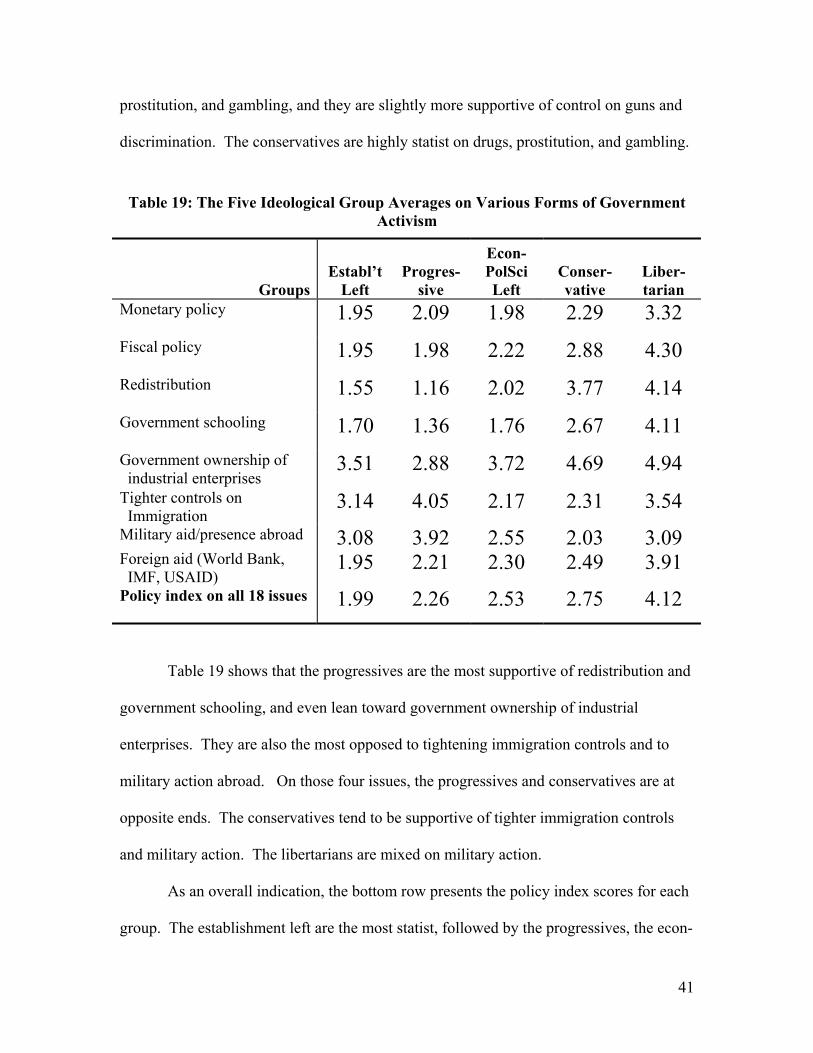
Table 19: The Five Ideological Group Averages on Various Forms of Government Activism
Groups Establ’t
Left Progres-
sive
Econ-PolSci Left
Conser-vative
Liber-tarian
Monetary policy 1.95 2.09 1.98 2.29 3.32 Fiscal policy 1.95 1.98 2.22 2.88 4.30 Redistribution 1.55 1.16 2.02 3.77 4.14 Government schooling 1.70 1.36 1.76 2.67 4.11 Government ownership of industrial enterprises
3.51 2.88 3.72 4.69 4.94 Tighter controls on Immigration
3.14 4.05 2.17 2.31 3.54 Military aid/presence abroad 3.08 3.92 2.55 2.03 3.09 Foreign aid (World Bank, IMF, USAID)
1.95 2.21 2.30 2.49 3.91 Policy index on all 18 issues 1.99 2.26 2.53 2.75 4.12
Table 19 shows that the progressives are the most supportive of redistribution and
government schooling, and even lean toward government ownership of industrial
enterprises. They are also the most opposed to tightening immigration controls and to
military action abroad. On those four issues, the progressives and conservatives are at
opposite ends. The conservatives tend to be supportive of tighter immigration controls
and military action. The libertarians are mixed on military action.
As an overall indication, the bottom row presents the policy index scores for each
group. The establishment left are the most statist, followed by the progressives, the econ-
41
polsci left, the conservatives, and the libertarians. It is clear that the libertarian group is
the outlier, a fact that was highlighted at the top of the dendrogram by the libertarian
group’s being the last group to join the whole.
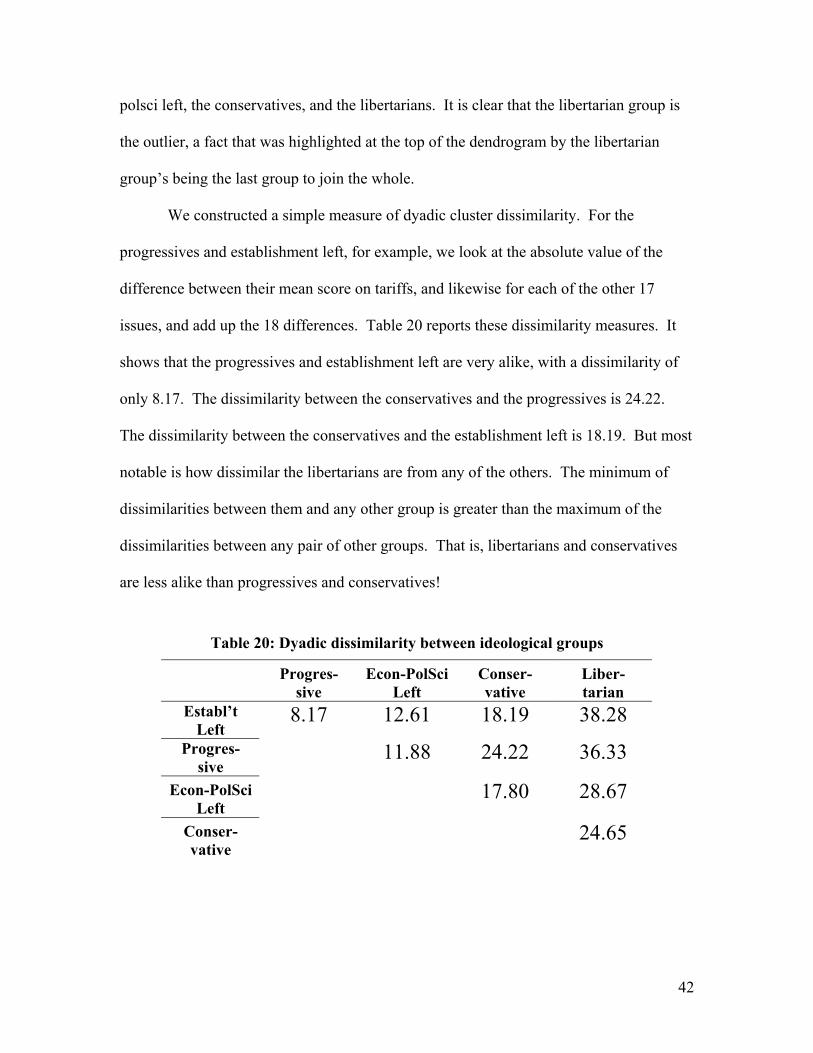
We constructed a simple measure of dyadic cluster dissimilarity. For the
progressives and establishment left, for example, we look at the absolute value of the
difference between their mean score on tariffs, and likewise for each of the other 17
issues, and add up the 18 differences. Table 20 reports these dissimilarity measures. It
shows that the progressives and establishment left are very alike, with a dissimilarity of
only 8.17. The dissimilarity between the conservatives and the progressives is 24.22.
The dissimilarity between the conservatives and the establishment left is 18.19. But most
notable is how dissimilar the libertarians are from any of the others. The minimum of
dissimilarities between them and any other group is greater than the maximum of the
dissimilarities between any pair of other groups. That is, libertarians and conservatives
are less alike than progressives and conservatives!
Table 20: Dyadic dissimilarity between ideological groups
Progres-sive
Econ-PolSci Left
Conser-vative
Liber-tarian
Establ’t Left
8.17 12.61 18.19 38.28 Progres-
sive 11.88 24.22 36.33
Econ-PolSci Left
17.80 28.67
Conser-vative
24.65
42
Summary
This article has presented a plethora of results from a large survey of six scholarly
associations. The main results may be summarized as follows:
• Democrats dominate the social sciences. Anthropology and sociology are
the most lopsided, with D-to-R ratios upwards of 20 to 1, and economics
is the least lopsided, about 3 to 1. Among professors up through age 70,
the overall Democrat-to-Republican ratio is probably about 8 to 1.
• The Democratic domination has increased significantly since 1970.
Republicans are being eliminated.
• On most of the 18 policy issues, the Democrats are more statist than the
Republicans. But on the whole Republicans were more statist on
immigration, military action, drug prohibition, prostitution restrictions.
• Generally, the Democrats and Republicans fit the ideal-types. Perhaps the
greatest departure from the ideal types is that neither group is very
libertarian on the issues they are supposedly more libertarian on.
• The Democrats not only dominate, but they have a narrow tent. Whereas
the Republicans usually have diversity on an issue, the Democrats very
often have a party line. It is clear that there is significantly more diversity
under the Republican tent.
• On the whole, the Democrats and Republicans are quite statist.
• Economists are measurably less statist, but most of them are still quite
statist.
43
• Economists show the least consensus on policy issues. The differences
between Democrats and Republicans are largest in economics, and the
standard deviations are largest. A lack of consensus is a curious thing for
the “queen of the social sciences.”
• Younger professors tend to be slightly less statist than older professors.
• We find strong evidence that Republican scholars are more likely to be
sorted out of academia.
• Voting D is significantly correlated with having Democratic parents, being
employed in academia, being an anthropologist or sociologist, having
statist policy views, and having a more recent degree.
• The cluster analysis sorted the respondents into five groups, four of which
correspond to familiar and distinct ideological categories: establishment
left, progressive, conservative, and libertarian.
• On three issues (drugs, prostitution, and military), the conservatives are
the most statist of the five groups. On five issues—drugs, prostitution,
gambling, immigration, military action—the distance between the average
conservative score and the average libertarian score was greater than that
between progressive and libertarian.
• Simple measures show that the libertarians are quite exceptional. The
minimum of the dissimilarities between them and any other group is
greater than the maximum of dissimilarity between any pair of other
groups.
44
The “liberal versus conservative” formulation of American politics omits the
libertarians from the landscape, yet the libertarian and conservative groups appear to be
equal in size in the social disciplines (each cluster-group consisted of 35 individuals). If
freedom is a core political value, then there is something very wrong with a formulation
that omits the ideology most aligned with that value.
References
Alston, Richard M., James R. Kearl, and Michael B. Vaughan. 1992. “Is There a
Consensus among Economists in the 1990s? American Economic Review, Papers
and Proceedings, 82 (May): 203-209.
Anderson, M. and R. Blandy. 1992. “What Australian Economics Professors Think.”
Australian Economic Review, October-December: 17-40.
Anderson, M., R. Blandy, and S. Carne. 1993. “Academic Economic Opinion in East
Asia.” Australian Economic Review, July-September: 5-19.
Beck, Paul A. and M. Kent Jennings. 1975. “Parents as ‘Middlepersons’ in Political
Socialization.” Journal of Politics 37, Feb: 83-107.
Beck, Paul A. and M. Kent Jennings. 1991. “Family Traditions, Political Periods, and the
Development of Partisan Organizations.” Journal of Politics 53: 742-63.
Blendon, Robert J. et al. 1997. ”Bridging the Gap Between the Public’s and Economists’
Views of the Economy.” Journal of Economic Perspectives, 11 (3), Summer: 105-
118.
Block, W. and M. Walker. 1988. “Entropy in the Canadian Economics Profession:
Sampling Consensus on the Major Issues.” Canadian Public Policy, April: 137-
150.
Brookings Institution. 2001. “National Survey on Government Endeavors,” Prepared by
Princeton Survey Research Associates, dated November 9, online at:
http://www.brookings.edu/comm/reformwatch/rw04/surveydata.pdf.
45
Caplan, Bryan. 2001. “What Makes People Think Like Economists? Evidence on
Economic Cognition from the ‘Survey of Americans and Economists on the
Economy’.” Journal of Law and Economics, 44, October: 395-426.
Caplan, Bryan. 2002. “Systematically Biased Beliefs about Economics: Robust Evidence
of Judgemental Anomalies from the Survey of Americans and Economists on the
Economy.” Economic Journal, 112, April: 1-26.
Cardiff, Christopher and Daniel B. Klein. 2006. Voter-Registration of College Faculty.
Ms., Department of Economics, George Mason University (in progress).
Carnegie Council on Policy Studies in Higher Education. 1978. “Carnegie Council
National Surveys, 1975-1976: Faculty Marginals.” (Volume 2), September.
Carnegie Foundation for the Advancement of Teaching. 1989. The Condition of the
Professoriate: Attitudes and Trends. Princeton, NJ: The Carnegie Foundation for
the Advancement of Teaching.
Colander, David. 2005. “The Making of an Economist Redux.” Journal of Economic
Perspectives 19(1): 175-198.
Critical Review. 2005. “The State of the Social Sciences, Conference Proceedings (held
at Boston University, 2002).” Critical Review 16 (2-3): 147-322.
Everitt, B. S. 1993. Cluster Analysis. 3d ed. London: Edward Arnold.
Frey, Bruno. S., Werner W. Pommerehne, Schneider, Friedrich and Guy Gilbert. 1984.
“Consensus and dissension among economists: An Empirical Inquiry.” American
Economic Review, 74 (5): 986-993.
Fuchs, Victor R. 1996. “Economics, Values, and Health Care Reform.” American
Economic Review, 86(1) 1-24.
Fuchs, Victor. R., Alan B. Krueger, and James M. Poterba. 1998. “Economists’ Views
about Parameters, Values, and Policies: Survey Results in Labor and Public
Economics.” Journal of Economic Literature, 36 (3): 1387-1425.
Fuller, D. A., R. M. Alston, and M. B. Vaughan. 1995. “The Split between Political
Parties on Economic Issues: A Survey of Republicans, Democrats, and
economists. Eastern Economic Journal, 21 (2): 227-237.
Fuller, D. A., and D. Geide-Stevenson. 2003. “Consensus among Economists: Revisited.”
Journal of Economic Education, 34 (4): 369-387.
46
Glass, Jennifer, Vern L. Bengtson, and Charlotte Chorn Dunham. 1986. “Attitude
Similarity in Three-Generation Families: Socialization, Status Inheritance, or
Reciprocal Influence?” American Sociological Review 51(5), Oct: 685-698.
Hamilton, Richard F. and Lowell L. Hargens. 1993. “The Politics of the Professors: Self-
Identifications, 1969-1984.” Social Forces 71(3), March: 603-627.
Heckelman, Jac C. and Robert Whaples. 2003. “Are Public Choice Scholars Different”
PS, Oct: 797-799.
Horowitz, David and Eli Lehrer. 2002. Political Bias in the Administrations and Faculties
of 32 Elite Colleges and Universities. A Report of the Center for the Study of
Popular Culture. Online http://www.frontpagemag.com/Content/read.asp?ID=55.
Accessed May 3, 2004.
Jennings, M. Kent, Laura Stoker, and and Jake Bowers. 2001. Politics Across
Generations: Family Transmission Reexamined. Institute of Governmental
Studies, UC-Berkeley Working Paper 2001-15.
Kearl, J. R., Clayne L. Pope, Gordon C. Whiting, and Larry T. Wimmer. 1979. “A
Confusion of Economists?” American Economic Review, Papers and
Proceedings, 69 (May): 28-37.
Klein, Daniel B. 2006. “Sense and Sensibilities: Myrdal’s Plea for Self-Disclosure and
Some Disclosures About AEA Member.” Econ Journal Watch, 3 (1), January:
xxx-xxx.
Klein, Daniel B. and Charlotta Stern. 2005a. “Economists’ Policy Views and Voting.”
Public Choice, forthcoming.
Klein, Daniel B. and Charlotta Stern. 2004. “Democrats and Republicans in
Anthropology and Sociology: How Do They Differ on Public Policy Issues?” The
American Sociologist 35(4): 79-86.
Klein, Daniel B. and Charlotta Stern. 2005b. “Political Diversity in Six Disciplines.”
Academic Questions 18(1), Winter: 40-52
Klein, Daniel B. and Charlotta Stern. 2005c. “Is There a Free-Market Economist in the
House? The Policy Views of American Economics Association Members.”
American Journal of Economics and Sociology, forthcoming.
47
Klein, Daniel B. and Charlotta Stern. 2005d. “Political Scientists’ Policy Views and
Voting.” The Political Science Reviewer, forthcoming.
Klein, Daniel B. and Charlotta Stern. 2006. “Sociology and Classical Liberalism.” The
Independent Review: A Journal of Political Economy, forthcoming.
Klein, Daniel B. and Andrew Western. 2005. Voter Registration of Berkeley and
Stanford Faculty. Academic Questions, 18(1): 53-65.
Ladd, Everett Carll, Jr. and Seymour Martin Lipset. 1975. The Divided Academy:
Professors & Politics. New York: McGraw-Hill.
Light, Paul C. 2001. “Government’s Greatest Priorities of the Next Half Century,”
Reform Watch, No. 4, Brookings Institution, December, online at:
http://www.brookings.edu/dybdocroot/comm/reformwatch/rw04/rw4.pdf.
Lipset, Seymour Martin. 1972. “The Politics of American Sociologist.” American
Journal of Sociology, 78 (1), June: 67-104.
Lipset, Seymour Martin. 1982. “The Academic Mind at the Top: The Political Behavior
and Values of Faculty Elites.” Public Opinion Quarterly, 46 (2), Summer: 143-
168.
Lipset, Seymour Martin. 1982. “The Academic Mind at the Top: The Political Behavior
and Values of Faculty Elites.” Public Opinion Quarterly, 46 (2), Summer: 143-
168.
Lipset, Seymour Martin. 1994. “The State of American Sociology.” Sociological Forum,
9 (2), June: 199-220.
Lipset, Seymour Martin and Everett Carll Ladd, Jr. 1972. “The Politics of American
Sociologists.” American Journal of Sociology 78(1), July: 67-104.
Lindholm, Jennifer A., Alexander W. Astin, Linda J. Sax and William S. Korn. 2003.
The American College Teacher: National Norms for 2001-2002 HERI Faculty
Survey. Higher Education Research Institute, University of California, Los
Angeles.
McEachern, William A. 2006. “AEA Ideology: Campaign Contributions of American
Economic Association Members, Committee Members, Officers, Editors,
Referees, Authors, and Acknowledgees.” Econ Journal Watch 3(1), January: xx-
xx.
48
Moorhouse, J., A. Morris, and R. Whaples. 1999. “Economics and the Law: Where Is
There Consensus?” The American Economist, 43(2): 81-88.
Nakhaie, M. Reza and Robert J. Brym. 1999. “The Political Attitudes of Canadian
Professors.” Canadian Journal of Sociology 24(3): 329-353.
Niemi, Richard G. and M. Kent Jennings. 1991. “Issues and Inheritance in the Formation
of Party Identification.” American Journal of Political Science 35(4), Nov: 970-
988.
Ray, J. J. 1989. “he Scientific Study of Ideology Is Too Often More Ideological than
Scientific.” Personality and Individual Differences 10(3): 331-336.
Redding, Richard E. 2001. “Sociopolitical Diversity in Psychology: The Case for
Pluralism.” American Psychologist 56(3): 205-215.
Ricketts, Martin and Edward Shoesmith. 1990. British Economic Opinion: A Survey of a
Thousand Economists. London: Institute of Economic Affairs.
Ricketts, Martin and Edward Shoesmith. 1992. “British economic opinion: Positive
science or normative judgment?” American Economic Review, Papers and
Proceedings, 82 (May): 210-215.
Rothman, Stanley, S. Robert Lichter, Neil Nevitte. 2005. “Politics and Professional
Advancement Among College Faculty.” The Forum 3(1), article 2.
Sears, David O. and Carolyn L. Funk. 1999. “Evidence of the Long-Term Persistence of
Adults’ Political Predispositions.” Journal of Politics 61(1), Feb: 1-28.
Spaulding, Charles B. and Henry A. Turner. 1968. “Political Orientation and Field of
Specialization Among College Professors.” Sociology of Education 41(3): 247-
262.
Stata Cluster Analysis. Reference Manual. 2003. College Station, Tx: Stata Press.
Tedin, Kent L. 1974. “The Influence of Parents on the Political Attitudes of
Adolescents.” American Political Science Review 68(4), Dec: 1579-1592.
Vedder, Richard. 2004. Going Broke by Degree: Why College Costs Too Much.
Washington, DC: American Enterprise Institute.
Washington Post/Kaiser Family Foundation/Harvard University Economics Polls. 1996.
Survey of Americans and Economists on the Economy. Storrs, Conn.: Roper
Center for Public Opinion Research.
49
50
Whaples, R. 1995. “Where Is There Consensus among American Economic Historians?
The Results of a Survey on Forty Propositions.” Journal of Economic History, 55
(1): 139-154.
---. 1996. “Is There Consensus among American Labor Economists? Survey Results on
Forty propositions.” Journal of Labor Research, 17 (4): 725-734.
Zinsmeister, Karl. 2002. “The Shame of America’s One-Party Campuses.” The American
Enterprise 13(6), September: 18-25.