Embed Size (px)
Citation preview

Sweden’s Position in the Global Economy
Swedish Globalization ForumMay 2012
Christian Ketels
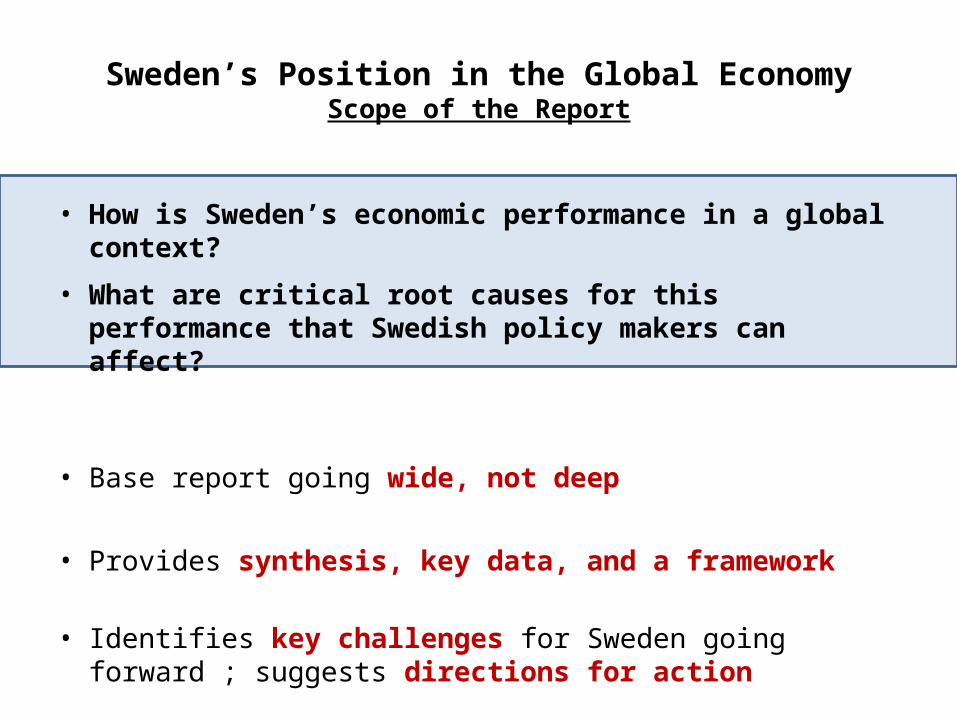
Sweden’s Position in the Global EconomyScope of the Report
• How is Sweden’s economic performance in a global context?
• What are critical root causes for this performance that Swedish policy makers can affect?
• Base report going wide, not deep
• Provides synthesis, key data, and a framework
• Identifies key challenges for Sweden going forward ; suggests directions for action

The Conceptual Framework
Prosperity Outcomes
Global Economic Activity
Institutions
Performance
Fundamentals Macro-economic Policies
Business Environment Conditions
Company Operations
and Strategy
MACRO MICRO

4 © Sweden Globalization Council 2007 04-17-07.ppt
Long-Term Trends in Prosperity
0
5,000
10,000
15,000
20,000
25,000
30,000
35,000
40,000
45,000
50,000
1950 1955 1960 1965 1970 1975 1980 1985 1990 1995 2000 2005 2010
EU-15United States
GDP per capita, US-$, PPP-adjusted
Source: Groningen Growth and Development Center, The Conference Board, 2006
Sweden
Countries that have surpassed Swedenin terms of prosperity:
1970s: Canada, Iceland, Norway1980s: Austria, Denmark1990s: Australia, Ireland
Countries that Sweden has surpassed in terms of prosperity:
2000s: Germany, Denmark, Ireland,Canada, Iceland

Labor MobilizationHours worked per Capita
1999 2000 2001 2002 2003 2004 2005 2006 2007 2008 2009 2010 2011640
660
680
700
720
740
760
780
800
820
840
SwedenEU-27OECD
Source: Conference Board (2012)
Annual hours worked per Capita

6 Copyright 2011 © Christian Ketels
Swedish World Market Export Shares
2000 2001 2002 2003 2004 2005 2006 2007 2008 2009 20100.50
0.75
1.00
1.25
1.50
1.75
2.00
Total exports
Service exports
Goods exports
Source: WTO (2011)
Swedish World Market Export Share, in %

7 Copyright 2011 © Christian Ketels
Relative Change in World Export Market Share, 2000 – 2010Change in Market Share 2010 to 2000 as % of 2000 Market Share
China
Lith
uani
a
Roman
ia
Latvi
a
Bulga
ria
Brazil
Hunga
ry
Austra
lia
Luxe
mbo
urg
South
Kor
ea
Icela
nd
Nethe
rland
s
Cypru
s
Belgi
um
New Z
eala
nd
Portu
gal
Sweden Ita
lyIsr
ael
Mex
ico
Japa
n
Unite
d Kin
gdom
-50%
0%
50%
100%
150%
200%
Source: WTO (2011)

8 © Sweden Globalization Council 2007 04-17-07.ppt
SwedenExport Portfolio By Cluster, 2000-2010
Note: Bubble size is proportional to total export value in 2010Source: Prof. Michael E. Porter, International Cluster Competitiveness Project, Institute for Strategy and Competitiveness, Harvard Business School; Richard Bryden, Project Director. Underlying data drawn from the UN Commodity Trade Statistics Database and the IMF BOP statistics.
Sw
eden
’s w
orl
d e
xpo
rt m
arke
t sh
are,
201
0
0%
1%
2%
3%
4%
5%
6%
7%
8%
-4.0% -3.0% -2.0% -1.0% 0.0% 1.0% 2.0% 3.0%
Change In Sweden’s Overall World Export Share: -0.02%
Sweden’s Average World Export Share: 1.2%
Forest Products
Business Services
Communications Equipment
Furniture
Communications Services
Biopharmaceuticals Power and Power Generation Equipment
Fishing and Fishing Products
Hospitality and Tourism
Aerospace Engines
Aerospace Vehicles and Defense
Metals and Metal Manufacturing
Change in Sweden’s world export market share, 2000 – 2010
Construction Services Automotive
Transportation and Logistics
Oil and Gas
Heavy Machinery

9 © Sweden Globalization Council 2007 04-17-07.ppt
Change of Share of Chinese ImportsSelected European Countries
2000 2005 20100.00
0.50
1.00
1.50
2.00
Source: UNCTAD (2011), author’s analysis.
Sweden
Germany
Switzerland
Finland
NorwayDenmark
Share of Country in Chinese Imports, Level in
2000 = 1

10 © Sweden Globalization Council 2007 04-17-07.ppt
Chinese Imports from SwedenShare by Product Group
Ma-chin-ery,
Transport
Equip; 81.6%
Manu-fac-tured
goods; 8.8%
Chem-icals; 3.9%
Misc manuf.; 3.5%
Primary produces; 2.0%
Machinery, Transport
Equip; 47.0%
Manufac-tured
goods; 22.0%
Chem-icals; 13.0%
Misc manuf.; 9.0%
Primary produces; 9.0%
Source: UNCTAD (2011), author’s analysis.
2000 2010

11 © Sweden Globalization Council 2007 04-17-07.ppt
Swedish Exports by Firm SizeSelected Markets
0% 1% 2% 3% 4% 5% 6% 7% 8%0%
10%
20%
30%
40%
50%
60%
Germany
BRIC
Norway
US
All Swedish exports: + 6.9%
All Swedish exports: 31.7%
Change in SMEs share in total Swedish exports, 2000 - 2007
SMEs share in total Swedish export value,
2007
Note: SMEs defined as <200 employees, bubble size proportional to total export valueSource: Statistics Sweden, KTH (2012), author’s analysis

12 © Sweden Globalization Council 2007 04-17-07.ppt
Sweden’s Foreign Direct Investment Position
Source: UNCTAD (2011), author’s analysis.
World market share
2000 2001 2002 2003 2004 2005 2006 2007 2008 2009 20100%
1%
2%
3%
4%
Outward FDI
Inward FDI
Stocks
Flows (3-year moving average)

The Shifting Face of GlobalizationThe Role of Trade and FDI in the Swedish Economy
2000 2010 2000 20100%
25%
50%
75%
100%
125%
150%
175%
+7.5%+62%
TRADE FDI
Relative to GDP
Exports
Imports
InwardStock
OutwardStock
Source: UNCTAD (2011), Statistics Sweden (2011), author’s analysis.
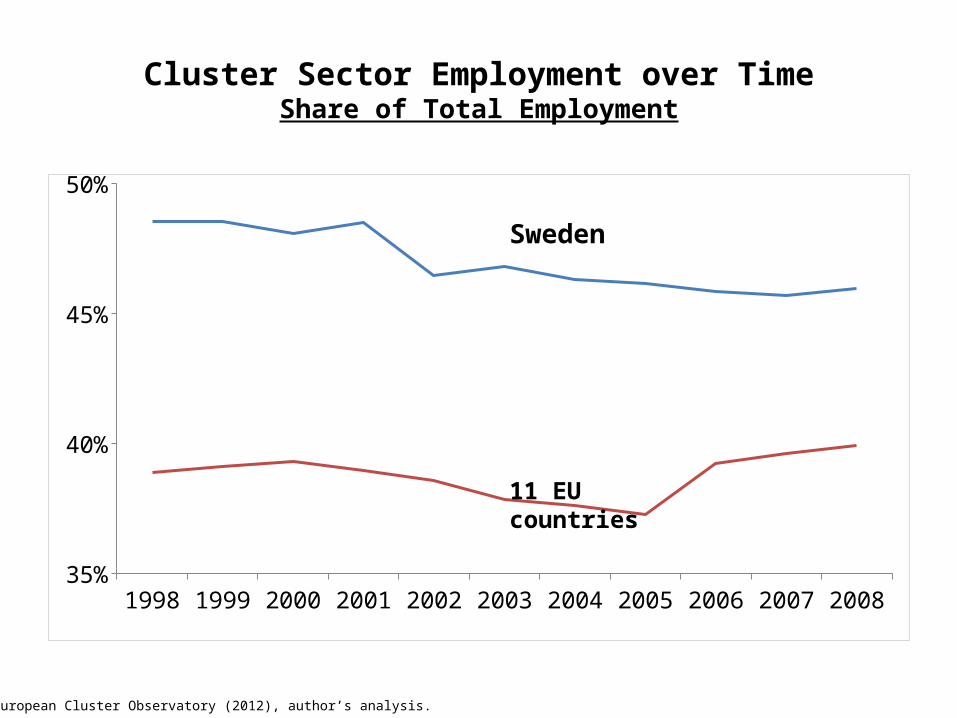
Cluster Sector Employment over TimeShare of Total Employment
1998 1999 2000 2001 2002 2003 2004 2005 2006 2007 200835%
40%
45%
50%
Source: European Cluster Observatory (2012), author’s analysis.
Sweden
11 EU countries

15 © Sweden Globalization Council 2007 04-17-07.ppt
Employment by ClusterSweden, 2000-2008
Sw
eden
’s E
U e
mp
loym
ent
shar
e, 2
008
0.00
0.50
1.00
1.50
2.00
2.50
3.00
-1.5 -1.0 -0.5 0.0 0.5 1.0
Total employees, 2008:Change in LQ (fixed country sample), 2000 - 2008
Paper products
Information TechnologyAutomotive
Heavy MachineryAnalytical Instruments
Telecom products
Business Services
Metal Manufacturing
Medical Devices
Lightning and Electrical Products
Production Technology
Transportation and Logistics Construction
Entertainment Products
Farming and animal husbandry
Oil and Gas
Absolute Job Gains
Absolute Job Losses
Processed FoodPharmaceuticals
Aerospace
Source: European Cluster Observatory (2012), author’s analysis.

Macro
Political Institutions
Rule of Law
Human Development
Context for Strategy and Rivalry
Related and Supporting Industries
DemandConditions
Factor InputConditions
Micro
Capital
Comm. Skills Innov.
Admin.
Social Infra-structure and Pol.
Institutions
Macroeconomic Policy
Business Environment
Quality
Company Sophistication
Source: Unpublished data from the Global Competitiveness Report (2011), author’s analysis.
Competitiveness Profile of Sweden2011
Logistic.
<5
5-8
9-11
12-15
>15
Significant advantage
Moderateadvantage
Neutral
Moderate disadvantage
Significant disadvantage
Global Rank

Doing Business in Sweden
Doing Business 2012 Rank
Change in Rank vs. 2011
Getting Electricity 8 -2
Trading Across Borders 8 -1
Registering Property 19 -3
Resolving Insolvency 19 -1
Dealing with Construction Permits 23 No change
Protecting Investors 29 -1
Starting a Business 46 -6
Getting Credit 48 -3
Paying Taxes 50 -3
Enforcing Contracts 54 -2
Source: World Bank (2012)
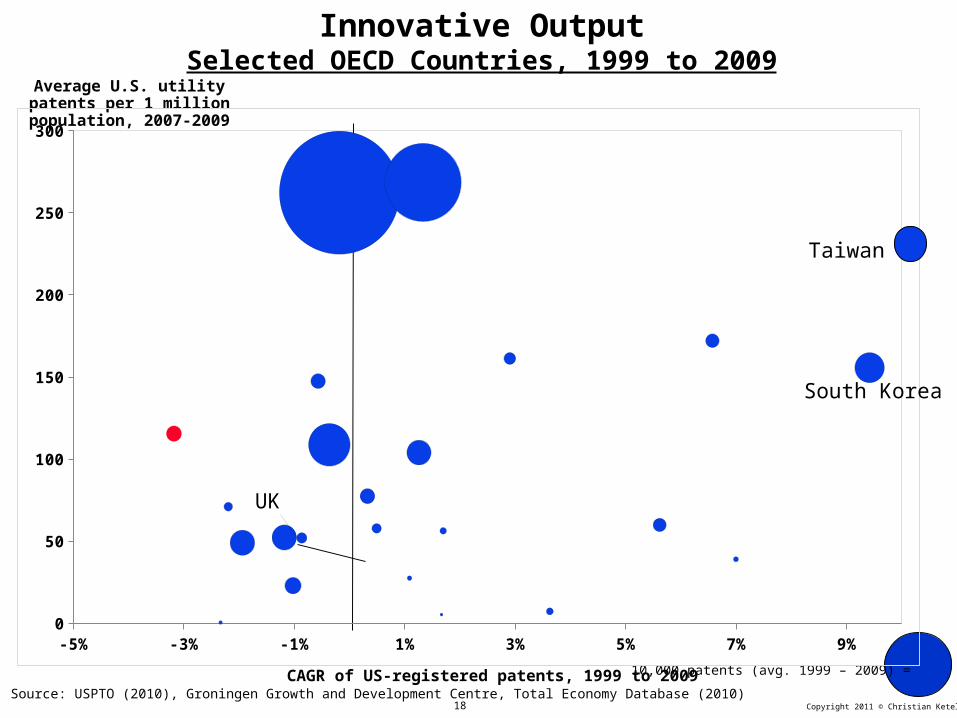
18 Copyright 2011 © Christian KetelsSource: USPTO (2010), Groningen Growth and Development Centre, Total Economy Database (2010)
Average U.S. utility patents per 1 million population, 2007-2009
CAGR of US-registered patents, 1999 to 2009
Innovative OutputSelected OECD Countries, 1999 to 2009
10,000 patents (avg. 1999 – 2009) =
-5% -3% -1% 1% 3% 5% 7% 9%0
50
100
150
200
250
300
UK
South Korea
Taiwan

19 Copyright 2011 © Christian Ketels
Innovation PerformanceSweden’s Rank among European countries
Enablers Firm Activities Outputs
Human resources
New doctorate graduates per 1000 population aged 25-34 1
Percentage population aged 30-34 having completed tertiary education 5
Percentage youth aged 20-24 having attained at least upper secondary level education 9
Open, excellent and attractive research system
International scientific co-publications per million population 4
Scientific publications among top 10% most cited publications worldwide 6Non-EU doctorate students as % of all doctorate students 8
Finance and supportPublic R&D expenditures (% of GDP) 3
VC (% of GDP) 2
Firm investmentsBusiness R&D expenditures (% of GDP) 1Non-R&D innovation expenditures (% of turnover) 18
Linkages & entrepreneurshipSMEs innovating in-house (% of SMEs) 8Innovative SMEs collaborating with others (% of SMEs) 6Public-private co-publications per million population 4
Intellectual assetsPCT patents pplications per billion GDP 1PCT patent applications in societal challenges per billion GDP 1Community trademarks per billion GDP 9
Community designs per billion GDP 7
Innovators
SMEs introducing product or process innovations (% of SMEs) 9
SMEs introducing product or process innovations (% of SMEs) 16
Economic effects
Employment in knowledge -intensive activities (% of workforce) 5
Medium-tech and high-tech exports (% of total exports) 12
Knowledge-intensive services exports (% of total service exports) 12New-to-market and new-to-firm sales (% of turnover) 30Licence and patent revenues from abroad (% of GDP) 4
Note: Coloring indicates relative strengths and weaknessesSource: Innovation Union Scoreboard (2012), author’s analysis.

20 Copyright 2011 © Christian Ketels
Learning Outcomes Across Countries2009
Hong Kong
Singapore
Japan
New Zealand
Australia
Liechtenstein
Estonia
Belgium
Iceland
UK Slovenia
France
US Sweden
Portugal
Latvia
ItalyLuxem
bourg
Croatia
Russia
Israel
Serbia
Bulgaria
Romania
Mexico
Montenegro
Brazil
Kazakhstan
Tunisia
Indonesia
Qatar
Peru
300
350
400
450
500
550
600
Reading
Math
Science
SWEDEN
Finland
Germany
Norway
Denmark
Source: OECD, Pisa 2009 database
Proficiency Score, 2009

21 Copyright 2011 © Christian Ketels
Key Issues
Impact of Policy Reforms• Level of educational attainment is modest compared to international
peers• Labor market reforms have had an impact but worked largely through
increasing labor supply• Innovation systems remains highly ranked but structural challenges
are growing
Impact of Changes in the Global Economy• Smaller companies become increasingly important for exports and
innovation. • Foreign markets are increasingly served through FDI• The majority of net job creation occurs in sectors that serve local
markets

22 Copyright 2011 © Christian Ketels
Action Areas
Integrate reform efforts
across individual policy areas Realign
policy tools with changing patterns
of firm behavior
Position Sweden in the
global economy
Impact of Policy Reforms
Impact of Changes in the Global Economy
23 Copyright 2011 © Christian Ketels
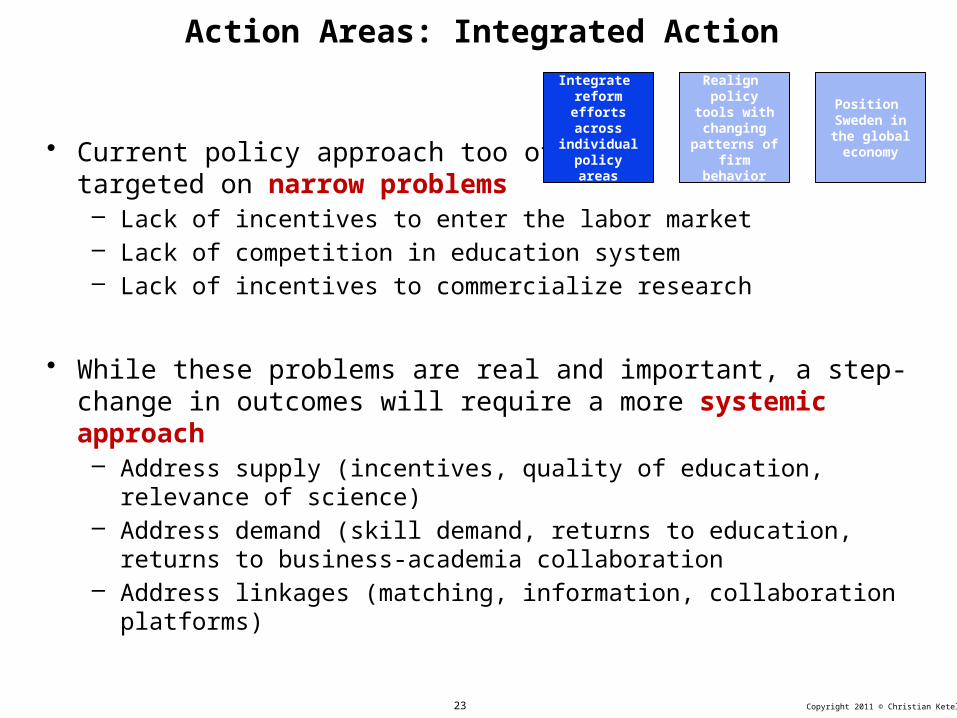
Action Areas: Integrated Action
• Current policy approach too often targeted on narrow problems – Lack of incentives to enter the labor market– Lack of competition in education system– Lack of incentives to commercialize research
• While these problems are real and important, a step-change in outcomes will require a more systemic approach– Address supply (incentives, quality of education, relevance of science)– Address demand (skill demand, returns to education, returns to business-
academia collaboration– Address linkages (matching, information, collaboration platforms)
Integrate reform efforts
across individual
policy areas
Realign policy tools
with changing patterns of
firm behavior
Position Sweden in the
global economy
24 Copyright 2011 © Christian Ketels
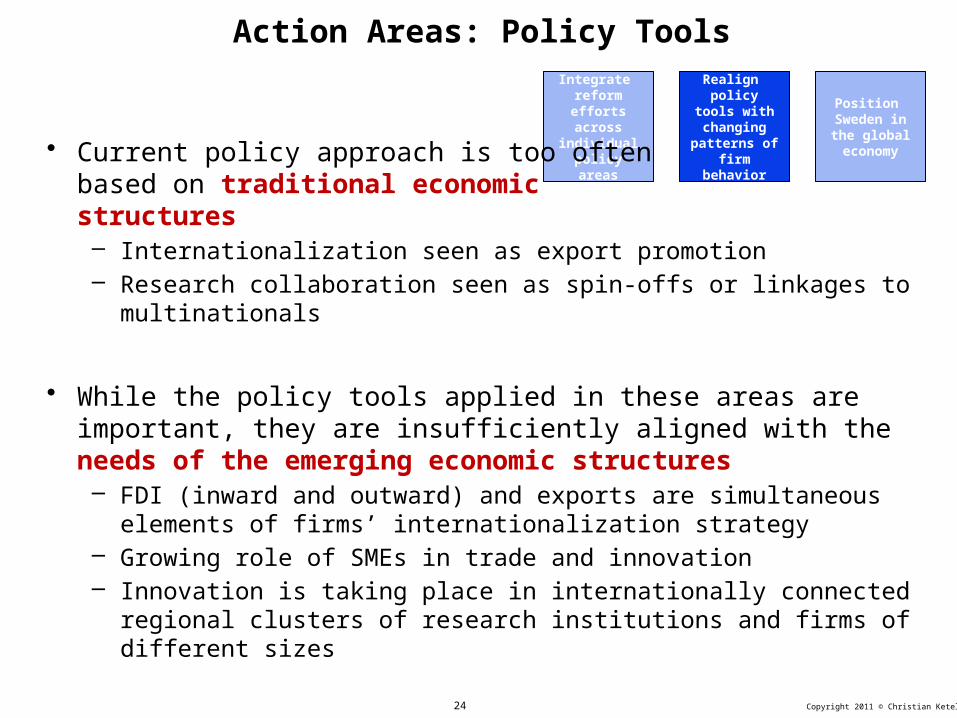
Action Areas: Policy Tools
Integrate reform efforts
across individual
policy areas
Realign policy tools
with changing patterns of
firm behavior
Position Sweden in the
global economy• Current policy approach is too often
based on traditional economic structures– Internationalization seen as export promotion– Research collaboration seen as spin-offs or linkages to multinationals
• While the policy tools applied in these areas are important, they are insufficiently aligned with the needs of the emerging economic structures– FDI (inward and outward) and exports are simultaneous elements of firms’
internationalization strategy– Growing role of SMEs in trade and innovation– Innovation is taking place in internationally connected regional clusters of
research institutions and firms of different sizes

25 Copyright 2011 © Christian Ketels
Action Areas: Global Positioning
Integrate reform efforts
across individual
policy areas
Realign policy tools
with changing patterns of
firm behavior
Position Sweden in the
global economy
• Current policy approach is too oriented on doing what is good in general rather than on what benefits Sweden most in particular– Focus of policy reforms on weaknesses– Focus on cross-cutting dimensions
• Positioning is not about picking winners, but about focusing policy on creating competitive advantages for the location– Specific business environment strengths– Specific clusters– Integrated policy packages in high-priority areas