Embed Size (px)
Citation preview
SWAT Model Overview and Application in
the Upper Mississippi
Jeff Arnold USDA-ARS - Temple, Texas
y Readily available input – Physically based
y Computer efficient y y
Model Philosophy
Comprehensive – Process Interactions Simulate Management
1

Stream Delineation
y Continuous Time Daily Time Step (Sub-hourly) One Day Hundreds of Years
y
y y
General Description
y Subwatersheds y Hydrologic Response Units y y
Possible Configurations
Distributed Parameter Unlimited Number of Subwatersheds
Comprehensive – Process Interactions Simulate Management
Output from other Models - APEX, SWAT Point Sources - Treatment Plants
2

3
Non-CultivatedLands
CEAP Watershed System
Channel/Flood PlainProcesses
Point Sources
APEX CultivatedFields
Root Zone
Shallow (unconfined)
Aquifer
Vadose(unsaturated)
Zone
Confining Layer
Deep (confined) Aquifer
Precipitation
Evaporation and Transpiration
Infiltration/plant uptake/ Soil moisture redistribution
Surface Runoff
Lateral Flow
Return FlowRevap from
shallow aquiferPercolation to
shallow aquifer
Recharge to deep aquifer
Flow out of watershed
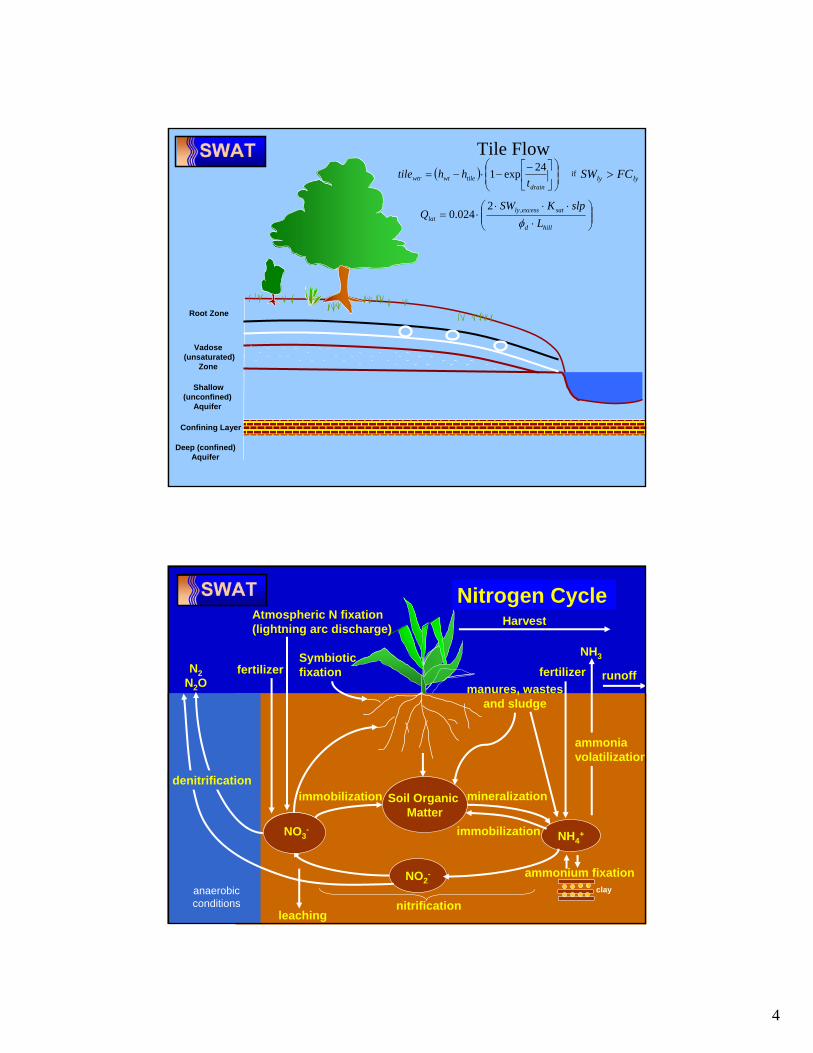
Hydrologic Balance
(Zone
( ) ⎟⎟ ⎠
⎞ ⎜⎜ ⎝
⎛ ⎥ ⎦
⎤ ⎢ ⎣
⎡ − −⋅−=
drain tilewtwtr t
hhtile 24 exp1 lyly FCSW >if
⎟⎟ ⎠
⎞ ⎜⎜ ⎝
⎛ ⋅
⋅ ⋅ ⋅ ⋅ =
hilld
sat lat L
slpKSWQ
φ , 2
Tile Flow
Root Zone
Shallow (unconfined)
Aquifer
Vadose unsaturated)
Confining Layer
Deep (confined) Aquifer
excess ly 024.0
NO3 - NH4
+
Soil Organic Matter
NO2 -
clay
mineralization
nitrification
Symbiotic
NO3 -
anaerobic conditions
N2 N2O
NH3
)
fertilizer fertilizer
denitrification
n
runoff manures, wastes
and sludge
ammonium fixation
immobilization
immobilization
fixation
Atmospheric N fixation (lightning arc discharge
leaching
Harvest
Nitrogen Cycle
ammonia volatilizatio
4

Pesticide Dynamics
Runoff
Foliar Application
Degradation
Washoff
Infiltration
Leaching
Surface Application
Degradation
• • Removal of Biomass as Harvest/
• • • • Pesticide Applications • • Water Impoundment (Wetlands, Rice) • Subsurface (Tile) Drainage
Management Crop Rotations
Conversion of Biomass to Residue Tillage / Biomixing of Soil Fertilizer and Manure Applications Edge-of-Field Buffers
Irrigation
5

Topographic InputsSubbasin DelineationRouting StructureChannel Slopes & LengthsOverland Slopes & Lengths
Land Use Inputs• Type – Ag, Forests,
Range, Urban• Management – Rotations
Tillage, Irrigation, Fertilizer
Soil Physical PropertiesTextureBulk DensityWater CapacityConductivityOrganic Carbon
Channel Processes
• • •
•
• Pesticide Toxic balance
Channel Processes
Flood Routing Transmission Losses, Evaporation Sediment Routing
Degradation and deposition Nutrients
modified QUAL2E
Weather
Max/Min Temp
ArcView GIS Interface
• Daily Precip and
• Monthly Radiation, Windspeed, Humidity
6

Calibration and Uncertainty
•
• Auto Calibration Shuffled Complex Evolution Algorithm Multi-Objective Optimization
• Uncertainty Analysis
Uncertainty Analysis
• Parameter Uncertainty Separate SCE optimization into “Good” and “Not Good” Sets χ2 and Bayesian Methods
•Predictive Uncertainty
Assessment using Split SamplES (SUNGLASSES)
Sensitivity Analysis Latin Hypercube – One-factor-at-a-time
Sources of UNcertainty GLobal
7
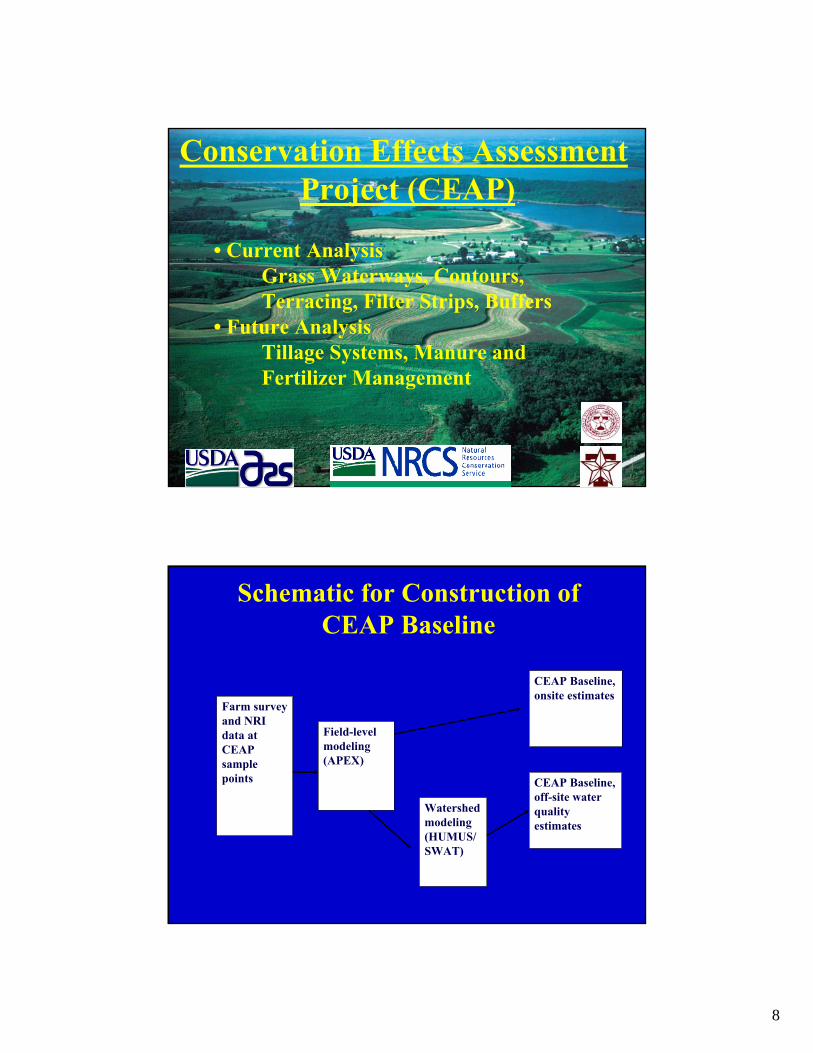
Conservation Effects Assessment Project (CEAP)
• Current Analysis Grass Waterways, Contours, Terracing, Filter Strips, Buffers
• Future Analysis Tillage Systems, Manure and Fertilizer Management
CEAP Baseline
and NRI data at CEAP sample points
modeling )
CEAP Baseline, onsite estimates
modeling (HUMUS/ SWAT)
CEAP Baseline, off-site water quality estimates
Schematic for Construction of
Farm survey
Field-level
(APEX
Watershed
8
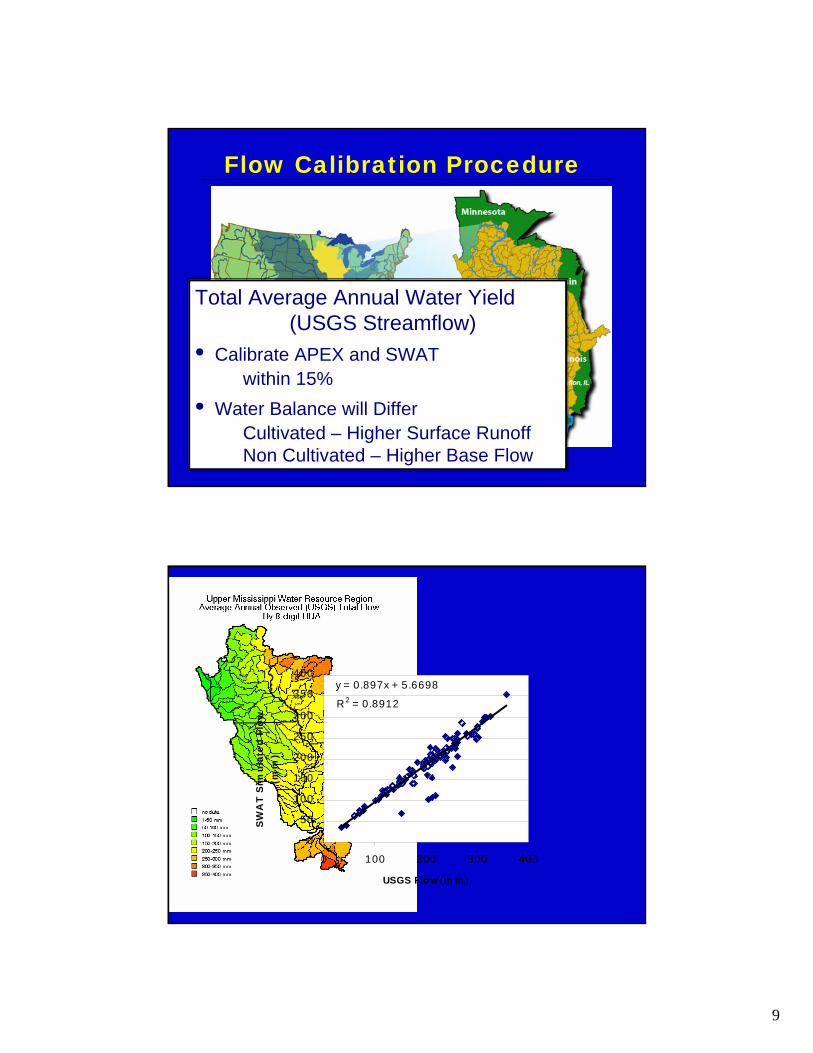
Flow Calibration Procedure
Total Average Annual Water Yield (USGS Streamflow)
• Calibrate APEX and SWAT within 15%
• Water Balance will Differ Cultivated – Higher Surface Runoff Non Cultivated – Higher Base Flow
R 2
0
50
0 100 200
( )
(mm
)
= 0.89 12
y = 0.897x + 5.6698
100
150
200
250
300
350
400
300 4 00
USGS Flow m m
SW
AT
Sim
ula
ted
Flo
w
9

Flow Validation of SWAT
0
low
(
l
l l i i
0
25
50
75
100
l(m
m)
2000
4000
6000
8000
10000
12000
Year
Stre
am F
cubi
c m
eter
s pe
r sec
ond)
USGS Measured Streamf ow
SWAT Simulated Streamflow
Average month y stream f ow for Illinois r ver at Valley c ty, IL
1961
1962
1963
1964
1965
1966
1967
1968
1969
1970
1971
1972
1973
1974
1975
1976
1977
1978
1979
1980
1981
1982
1983
1984
1985
1986
1987
1988
1989
1990
Mon
thy
mea
n st
ream
flow
Observed Predicted
•
•
Sediment and nutrient calibration/validation Assembled USGS-SPARROW annual nutrient loads
Sediment and nutrient data at USGS-Gages
10
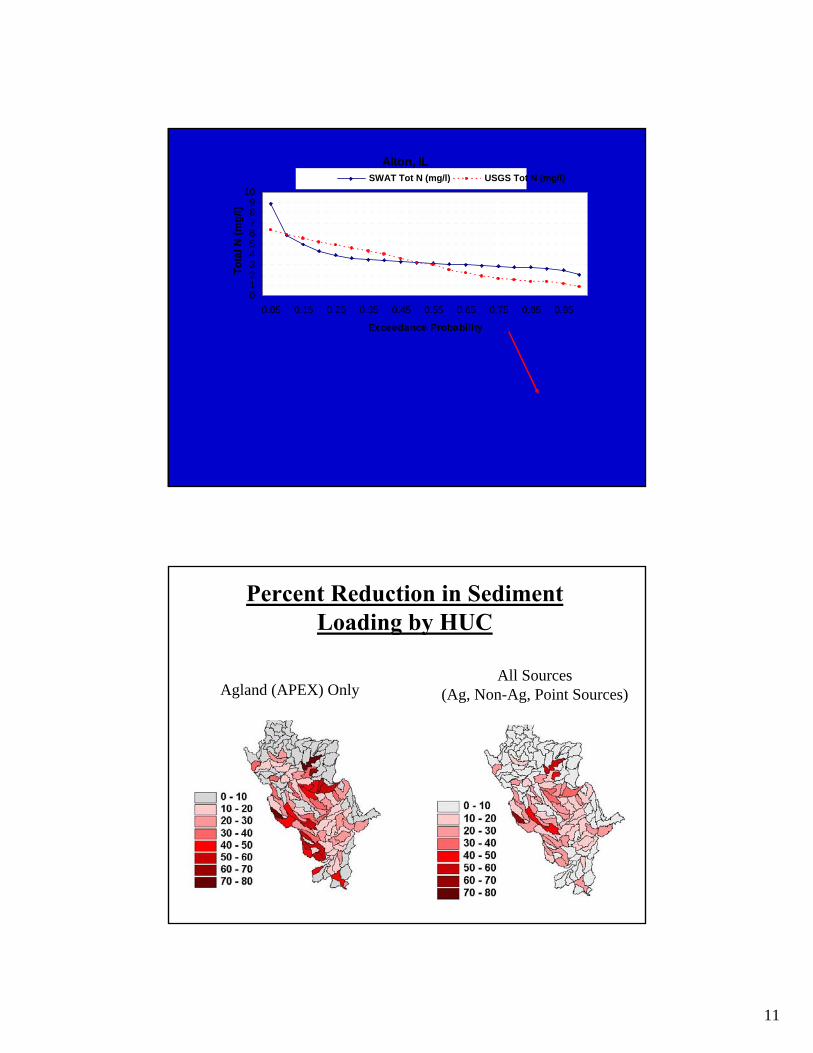
Nitrogen Validation of SWATAlton, IL
012345678
0.05 0.15 0.25 0.35 0.45 0.55 0.65 0.75 0.85 0.95
Exceedance Probability
SWAT NO3 (mg/l) USGS NO3 (mg/l)
Nitr
ate
Con
c. (m
g/l)
Alton, IL
012345678
0.05 0.15 0.25 0.35 0.45 0.55 0.65 0.75 0.85 0.95
Exceedance Probability
SWAT NO3 (mg/l) USGS NO3 (mg/l)
Nitr
ate
Con
c. (m
g/l)
SWAT Tot N (mg/l)
Alton, IL
0123456789
10
0.05 0.15 0.25 0.35 0.45 0.55 0.65 0.75 0.85 0.95
Exceedance Probability
SWAT Tot N (mg/l) USGS Tot N (mg/l)
Tota
l N (m
g/l)
SWAT Tot N (mg/l)
0123456789
10 /l)
(/l)
Alton, IL
0.05 0.15 0.25 0.35 0.45 0.55 0.65 0.75 0.85 0.95
Exceedance Probability
SWAT Tot N (mg USGS Tot N (mg/l)
Tota
l Nm
g
Percent Reduction in Sediment Loading by HUC
All Sources Agland (APEX) Only (Ag, Non-Ag, Point Sources)
11
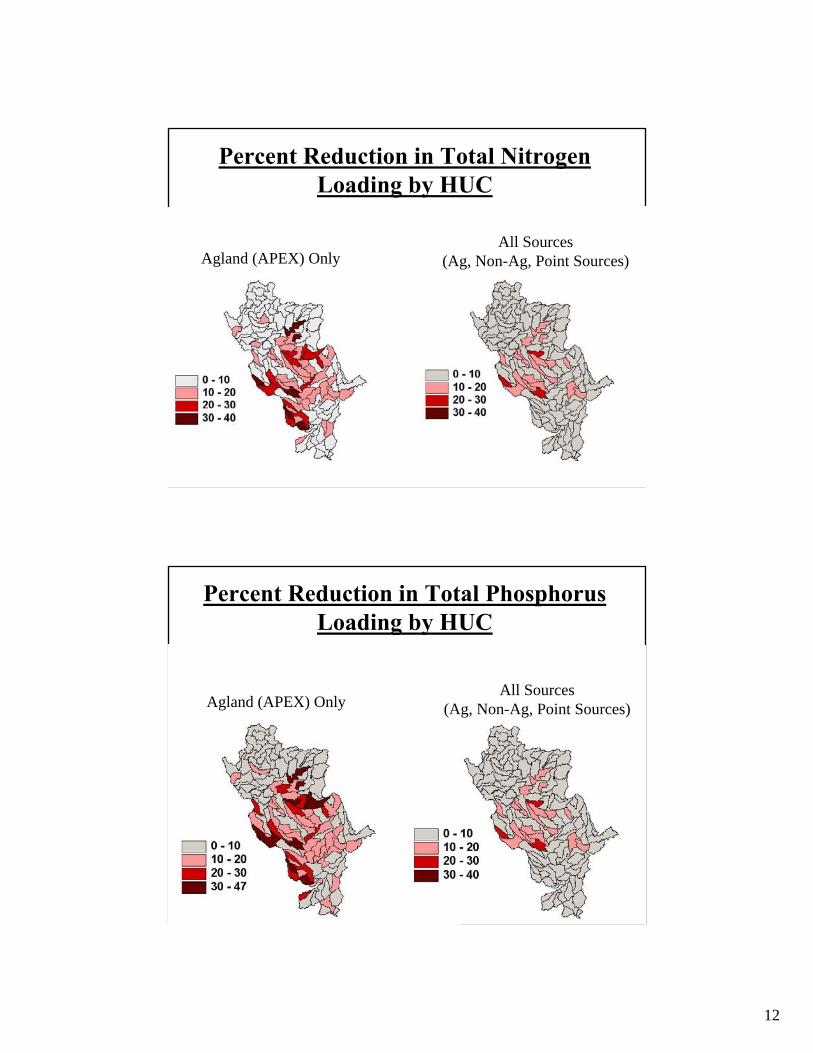
Percent Reduction in Total NitrogenLoading by HUC
All Sources (Ag, Non-Ag, Point Sources) Agland (APEX) Only
Percent Reduction in Total PhosphorusLoading by HUC
All SourcesAgland (APEX) Only (Ag, Non-Ag, Point Sources)
12

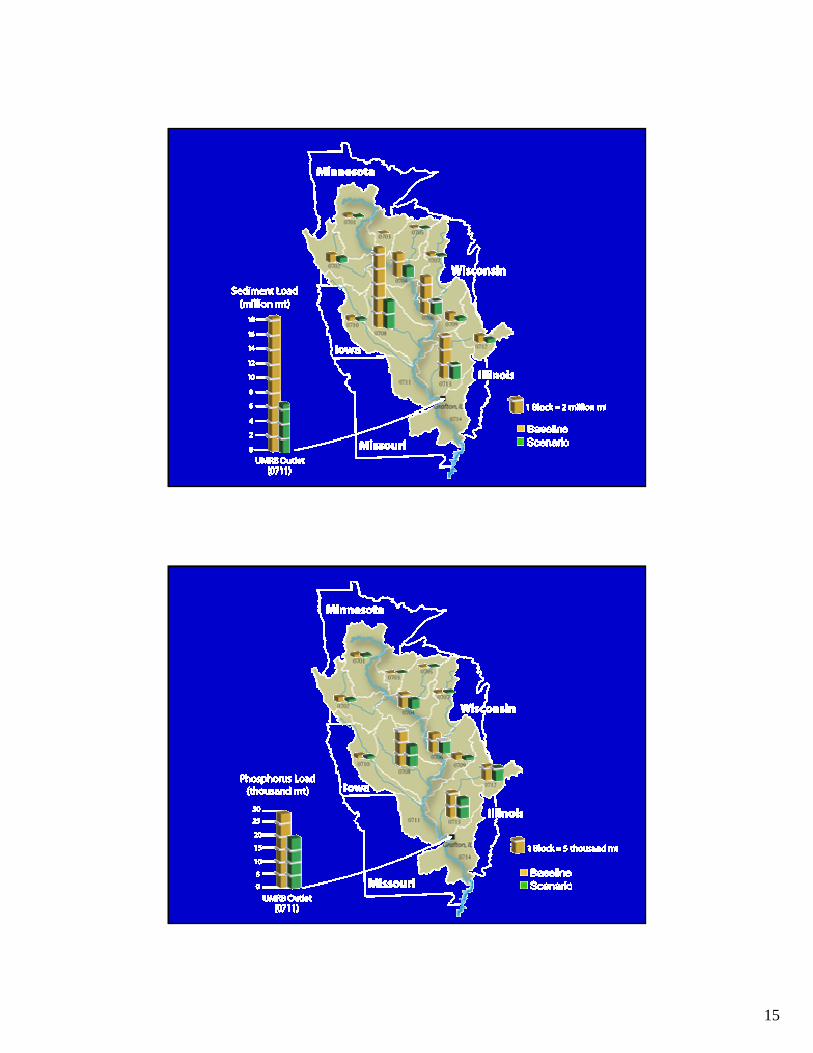
Preliminary Reduction ResultsPreliminary Results Grafton, IL
• Sediment Reduction 820,000 tons/yr
• Total Nitrogen 11,036 tons/yr
• 2,351 tons/yr
4.2%
5.1% Total Phosphorus
4.8%
Development (CARD) Iowa State University
)
Center for Agricultural and Rural
14 4-digit watersheds & 131 8-digit watersheds
(111 above Grafton
13

Key Model Components •
•
practices, etc.
•
SWAT model – configured with 8-digit subwatersheds & HRUs
1997 USDA NRI database – 114,000 UMRB points representing baseline land use, conservation
Other tillage, fertilizer, climate, & soil data
Conservation Practices
• Retire Land • Terracing and Contouring • Grassed Waterways • Conservation Tillage
14
15
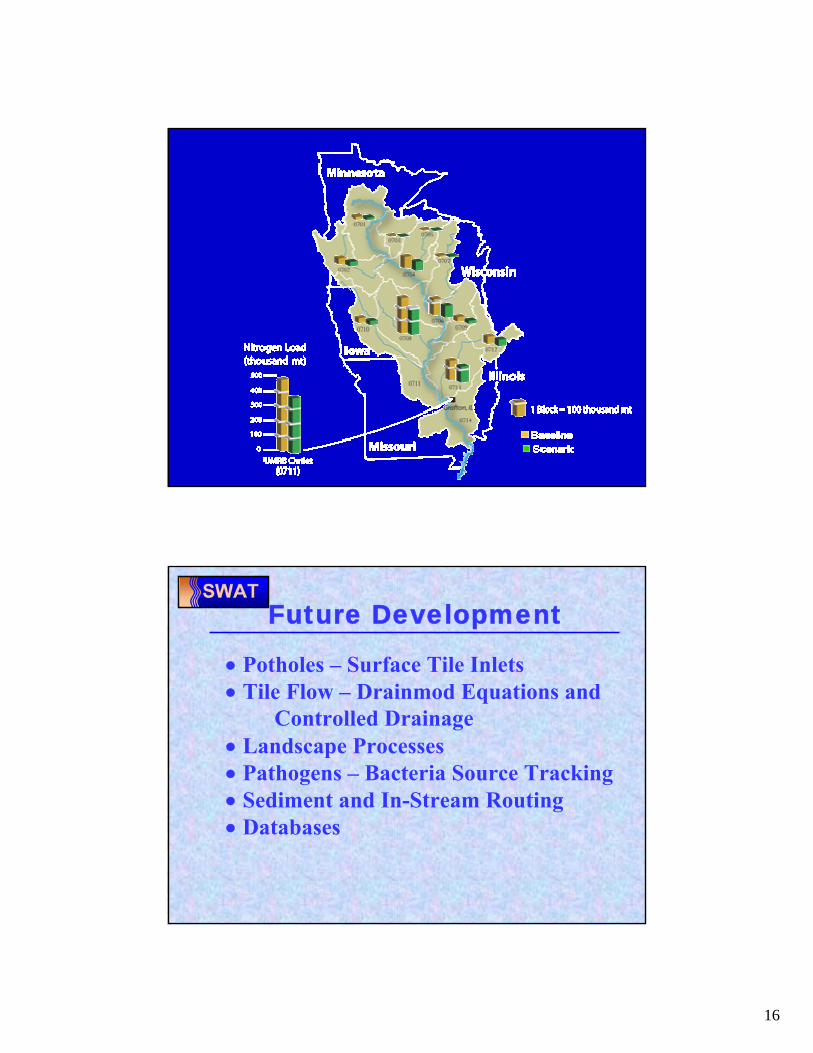
Future Development
• •
Controlled Drainage • Landscape Processes • • • Databases
Potholes – Surface Tile Inlets Tile Flow – Drainmod Equations and
Pathogens – Bacteria Source Tracking Sediment and In-Stream Routing
16