Embed Size (px)
Citation preview

ii
Swan Hills Special WasteTreatment Center
Human Health Impact Assessment
Volume 1: Final Report
Prepared byHealth Surveillance
Alberta HealthEdmonton, Alberta
October, 1997

iii
For more information contact:
Health SurveillanceAlberta HealthP.O. Box 136010025 Jasper AvenueEdmonton, AlbertaT5J 2P4
Phone: 403-427-4518Fax: 403-427-6663
ISBN (0-7785-0031-4)

iv
Executive Summary
The Swan Hills Waste Treatment Centre (SHWTC) is a facility for the safe disposal of special
wastes located approximately 12 kilometres north-east of the Town of Swan Hills. On October
16, 1996, a malfunction of a transformer furnace was discovered which had caused the flow of a
portion of process gases containing polychlorinated biphenyls (PCBs), dioxins and furans
(PCDD/Fs) into the ambient air. In order to estimate human exposure to these chemicals, a detailed human
impact assessment was carried out by Alberta Health from December 1996 to October 1997. The specific goals
were to evaluate the potential for human exposure to PCBs and dioxins/furans through wild game and fish
consumption and to estimate the existing levels of these contaminants in the human population.
The current report describes:
1. sampling and chemical analyses of fresh and frozen deer and moose samples, and
fish samples collected from the vicinity of the SHWTC;
2. sampling and chemical analyses of target chemicals in human blood samples;
3. a questionnaire interview process and resulting estimates of dietary patterns of the
potentially exposed population;
4. the estimation of the daily intake of PCBs and dioxin/furans expected in segments
of the population through wild game and fish consumption, comparisons of these
figures with relevant guidelines, and consumption limits based upon these
guidelines; and
5. recommendations for further monitoring and research activities.
Briefly, the results of the study indicate that :
1. levels of PCBs and PCDD/Fs were elevated in deer and moose from the area immediately
surrounding the Swan Hills Waste Treatment Centre;
2. levels of PCBs and PCDD/Fs were elevated in the liver and muscle tissues of brook trout sampled
from Chrystina Lake compared to northern pike sampled from Roche Lake and Chip Lake;
3. human blood serum levels of PCBs and PCDD/Fs for study participants were below
the levels reported in other jurisdictions, but follow similar age and gender patterns;

v
4. human blood serum levels of PCBs and PCDD/Fs for residents of Swan Hills and its
surrounding communities did not exceed the levels found in Edmonton residents;
5. no differences in levels of PCBs and PCDD/Fs were observed between individuals who
consumed wild game and fish from the Swan Hills area and those who did not; and
6. about forty percent of local residents consume local wild game and fish although only
a small portion of the residents consume large quantities.
Based on estimated daily intake and exposure ratio calculations, daily and weekly consumption of
wild game meat and fish taken near the SHWTC may result in increased exposure and potential
health risk over a person’s lifetime. Thus, restrictions on the consumption of wild game and fish
contaminated with PCBs and dioxins/furans are warranted.
The following consumption guidelines are recommended:
1. limit consumption of wild game taken from a 30 km radius of the SHWTC to 13
ounces (370 grams) per month
2. avoid eating organ meat or using fat harvested from within a 30 km radius of the
SHWTC
3. pregnant or breast feeding women should avoid eating wild game taken from within a
30 km radius of the SHWTC
4. young children should avoid eating wild game taken from within a 30 km radius of the
SHWTC
5. limit consumption of fish taken from Chrystina Lake to 6 ounces (178 grams) per
week
6. avoid eating fish organs or using fat harvested from Chrystina Lake
7. pregnant or breast feeding women should avoid eating wild game taken from Chrystina
Lake
8. young children should avoid eating fish taken from Chrystina Lake

vi
The next phase of the Swan Hills health assessment is the implementation of a longer term human
health monitoring plan which includes continued environmental monitoring, on-going human
health surveillance, and research activities. Alberta Health, Aspen and Keeweetinook Regional
Health Authorities, Alberta Environmental Protection and Alberta Labor, in collaboration with
Bovar Waste Management, will ensure the implementation of further human-exposure-related
activities including fish monitoring, wildlife monitoring, human blood monitoring as warranted,
health outcome monitoring (including special risk groups as warranted), specific research
initiatives, and the establishment of a joint computerized database of monitoring information. The
risk management process will include review and interpretation of information by an independent
Science Advisory Committee and by the Provincial Health Officer and Medical Officers of Health,
timely dissemination of information, and the ongoing review of fish and game consumption
advisories.

vii

viii
ACKNOWLEDGMENTS
To meet the Alberta Health’s mandate and in response to public concern on accidental andfugitive emissions of PCBs and dioxins/furans from the Swan Hills Waste Treatment Center, theHealth Surveillance branch of Alberta Health conducted the Swan Hills Human HealthAssessment between December of 1996 and October of 1997. The study was led by Senior TeamLeader Stephan Gabos. The study would not have been possible without the participation andsubstantial efforts of numerous members from various groups and reviewers (listed below). Thefinal report was prepared by Weiping Chen and Donald Schopflocher. The Alberta Health StudyTeam conducted the study design, sampling strategies, field collection, data analysis, datainterpretation and presentation. The Science Advisory Committee provided direction, technicalinformation, reviews and recommendations throughout the study. The Public Health AdvisoryCommittee, chaired by Dr. John Waters, carried out the health risk management function. TheCommunications Branch, Alberta Health developed the communication strategies.
Laboratory analysis was conducted by MAXXAM Laboratory under the overall coordination ofproject manager Dr. Sub Ramamoorthy. Dr. Ken Froese and Dr. Siu Chan provided independentreviews throughout the study. The Alberta Health Study Team was substantially helped in itsactivities by strong support from Alberta Environmental Protection, Alberta Agriculture, AlbertaLabour, the Regional Health Authorities, Health Canada and the Canadian Red Cross Society.The assistance by wild game meat donors, blood donors and all study participants from localcommunities is gratefully acknowledged. Involvement and cooperation from members of theSwan Hills community, the Lesser Slave Lake Indian Regional Council, BOVAR WasteManagement, Edmonton Friends of the North, and local citizens are gratefully appreciated.
Alberta Health Study Team Members
Dr. S. Gabos Senior Team Leader (Chair)Dr. D. Schopflocher BiostatisticianW. Chen Environmental Health ConsultantS. Shaw Research OfficerK. McLeod Manager, Environmental HealthE. Ellehoj GIS ConsultantS. Bernard Research AssistantJ. Robb Research Assistant
Chemical Laboratory
Dr. S. Ramamoorthy Project managerMAXXAM Laboratory, Edmonton
Independent Toxicological Review

ix
Dr. K. Froese Chemist, University of Alberta
Dr. S. Chan Toxicologist, University of Calgary
Science Advisory Committee Members
Dr. Pierre Band Senior Medical EpidemiologistEnvironmental Health Directorate, Health Canada, Ottawa
Dr. Tee Guidotti Director of Occupational and Environmental MedicineDepartment of Public Health SciencesUniversity of Alberta, Edmonton
Dr. Cornelia Kreplin Acting Head, Animal Health LaboratoriesFood and Rural DevelopmentAlberta Agriculture
Dr. Derek Muir Research ScientistNational Water Research InstituteEnvironmental Canada, Burlington, Ontario
Dr. Detlef Onderka PathologistFood and Rural DevelopmentAlberta Agriculture
Dr. Margo Pybus Wildlife Disease Research BiologistFish and Wildlife DivisionForestry, Lands and WildlifeEdmonton, Alberta
Dr. Arnold Schecter Professor of Preventive MedicineCollege of MedicineState University of New YorkBinghamton, New York
Dr. David Schindler Killam ProfessorDepartment of BiologyUniversity of AlbertaEdmonton, Alberta
Public Health Advisory Committee

x
Committee Members:
Dr. John Waters Provincial Health Officer (Chair)Alberta Health
Dr. Karen Grimsrud Deputy Provincial Health OfficerAlberta Health
Dr. Stephan Gabos Senior Team Leader, Health Surveillance,Alberta Health
Dr. Paul Schnee Medical Officer of HealthAspen Regional Health Authority
Dr. Ken Hodgins Medical Officer of HealthKeeweetinook Regional Health Authority
Kevin McLeod Manager, Environmental Health,Alberta Health
Dr. Harry Hodes Assistant Regional DirectorMedical Service Branch, Health Canada
Jerry Lack Director, Standards and Approvals,Environmental Regulatory ServiceAlberta Environmental Protection
Vonn Bricker Manager, Fish and Wildlife,Natural Resources Service,Alberta Environmental Protection
Other Participants:
Garth Norris Director, Communications,Alberta Health
Stacey Little PAOCommunications, Alberta Health
Glenn Guenther Director, Communications,Alberta Environmental Protection
Surinder Grewal Senior Environmental Health OfficerHealth Canada
Jay Nagendran Industrial Wastewater,Environmental Regulatory Service,Alberta Environmental Protection

xi
xii
TABLE OF CONTENTS
1. INTRODUCTION ..................................................................................................................1
2. STUDY FRAMEWORK.........................................................................................................3
3. ENVIRONMENTAL MONITORING: WILD GAME AND FISH..........................................8
3.1 Materials and Methods ......................................................................................................8
3.1.1 Samples ......................................................................................................................8
3.1.1.1 Fresh Deer ...........................................................................................................8
3.1.1.2 Freezer Deer and Moose Meats.......................................................................... 10
3.1.1.3 Fish.................................................................................................................... 13
3.1.1.4 Other Animals.................................................................................................... 15
3.1.2 Laboratory Methods ................................................................................................. 16
3.1.2.1 Selection of Individual Congeners for Analysis ................................................... 17
3.1.2.2 Basic Quality Assurance /Quality Control Criteria .............................................. 18
3.1.2.3 Analytical Procedure .......................................................................................... 18
3.1.3 Data Analysis............................................................................................................ 20
3.2 Results ............................................................................................................................ 22
3.2.1 Fresh Deer Meat ....................................................................................................... 22
3.2.2 Freezer Meat Samples............................................................................................... 27
3.2.3 Fish .......................................................................................................................... 31
3.3 Discussion ....................................................................................................................... 32
3.4 Conclusion ...................................................................................................................... 36
4. HUMAN TISSUE MONITORING: BLOOD........................................................................ 37
4.1 Materials and Methods .................................................................................................... 37
4.1.1 Sampling Strategy..................................................................................................... 37
4.1.2 Selection of Target Population.................................................................................. 38
4.1.3 Recruitment Procedures............................................................................................ 40
4.1.4 Specimen Collection Procedures ............................................................................... 43
4.1.5 Laboratory Methods ................................................................................................. 44
4.1.6 Data Analysis............................................................................................................ 45
4.2 Results ............................................................................................................................ 45
4.3 Discussion ....................................................................................................................... 48

xiii
4.4 Conclusion ...................................................................................................................... 52
5. DIET AND ACTIVITY SURVEY........................................................................................ 53
5.1 Materials and Methods .................................................................................................... 53
5.2 Results ............................................................................................................................ 54
5.2.1 Outdoor Activities and Diet ...................................................................................... 54
5.2.1.1 Outdoor Activities ............................................................................................. 54
5.2.1.2 Wild Game Consumption ................................................................................... 54
5.2.1.3 Fish Consumption .............................................................................................. 56
5.2.2 Additional Information from Questionnaire 2 ............................................................ 58
5.2.2.1 Demographic Information .................................................................................. 58
5.2.2.2 Consumption of Food from Markets .................................................................. 60
5.3 Discussion ....................................................................................................................... 60
5.4 Conclusion ...................................................................................................................... 61
6. ESTIMATION OF DAILY INTAKE AND EXPOSURE RATIO......................................... 62
6.1 Estimation of Average Daily Intake ................................................................................. 62
6.1.1 Development of Exposure Scenario .......................................................................... 62
6.1.2 Definition and Documentation of Parameters ............................................................ 65
6.2 Quantitative Estimates of Risk - Exposure Ratio.............................................................. 68
6.2.1.1 Fresh and Freezer Meat...................................................................................... 72
6.2.1.2 Fish.................................................................................................................... 73
6.3 Development of Consumption Limit ................................................................................ 74
6.4 Discussion ....................................................................................................................... 76
6.5 Conclusion ...................................................................................................................... 77
7. RISK MANAGEMENT AND COMMUNICATION ............................................................ 78
7.1 Initial Identification.......................................................................................................... 79
7.2 Initial Response ............................................................................................................... 79
7.3 Development of a Risk Management Plan ........................................................................ 79
7.4 Public Health Advisories.................................................................................................. 81
7.5 Communication ............................................................................................................... 84
7.6 Public Response and Perception....................................................................................... 85
7.7 Implications of Cultural Values........................................................................................ 87

xiv
8. LONG TERM MONITORING PLAN .................................................................................. 88
9. BIBLIOGRAPHY................................................................................................................. 90

xv

xvi
List of Tables
Table 3-1 Summary of Fresh Deer Samples ............................................................................... 10
Table 3-2 Summary of Freezer Meat Sample ............................................................................. 13
Table 3-3 Summary of Fish Samples.......................................................................................... 16
Table 3-4 Proportion of Non-detect in Fresh Deer Samples ....................................................... 22
Table 3-5 Mean Levels of PCBs and PCDD/Fs in Fresh Deer Samples....................................... 24
Table 3-6 Proportion of Non-detect in Freezer Meat Samples.................................................... 28
Table 3-7 Mean Levels of PCBs and PCDD/Fs in Freezer Meat Samples ................................... 28
Table 3-8 Mean Levels of PCBs and PCDD/Fs in Fish Muscle................................................... 32
Table 3-9 Mean Levels of PCBs and PCDD/Fs in Fish Liver...................................................... 32
Table 3-10 Concentrations of Total PCBs (mean, µg/kg) in Large Terrestrial Herbivores........... 33
Table 4-1 Distribution of the Population and Sampling Frame for Phase I Study ........................ 40
Table 4-2 Sampling Frame for Phase II study............................................................................. 42
Table 4-3 Demographic Characteristics of Blood Donors .......................................................... 43
Table 4-4 Consumption Rates of Wild Game and Fish .............................................................. 43
Table 4-5 Total PCB and PCDD/F Levels in Communities and Pooled Samples......................... 46
Table 4-6 Average Levels of PCBs (µg/kg or ppb) in Human Blood for Selected Nations.......... 49
Table 4-7 Average Levels of PCDD/Fs (ng/kg or ppt) in Human Blood for Selected Nations..... 50
Table 5-1 Summary of Outdoor Activities in the Swan Hills Area .............................................. 54
Table 5-2 Proportion of Individuals Consuming Wild Game From the Swan Hills Area.............. 55
Table 5-3 Wild Game Consumption Rate (g/d) .......................................................................... 55
Table 5-4 Proportion of Individuals Consumed Wild Fish From the Swan Hills Area ................. 57
Table 5-5 Fish Consumption Rate (g/d) ..................................................................................... 57
Table 5-6 Demographic Characteristics of Participants .............................................................. 59
Table 5-7 Consumption Rates for Commercially Available Food Items ...................................... 60
Table 6-1 Levels of PCBs and PCDD/Fs in Fresh and Freezer Meat from Swan Hills................. 64
Table 6-2 Concentrations of PCBs and PCDD/Fs in Fish Muscle from Swan Hills ..................... 64
Table 6-3 Definition of Parameters in the Daily Intake Equation ................................................ 66
Table 6-4 Estimated Daily Intake a of PCBs, PCDD/Fs in Fresh Deer Muscle ............................ 67
Table 6-5 Estimated Daily Intake of PCBs, PCDD/Fs In Fresh Deer Liver................................. 67
Table 6-6 Estimated Daily Intake of PCBs, PCDD/Fs in Freezer Muscle.................................... 67
xvii
Table 6-7 Estimated Daily Intake of PCBs, PCDD/Fs in Fish Muscle......................................... 68
Table 6-8 Health Canada Guidelines/Tolerances for PCBs and TCDD in Foods........................ 69
Table 6-9 Summary of TDI and RfD/RSD for PCB and TCDD ................................................. 70
Table 6-10 Exposure Ratios for Consuming Fresh Deer Muscle................................................. 72
Table 6-11 Exposure Ratios of PCBs, PCDD/Fs for Consuming Fresh Deer Liver..................... 73
Table 6-12 Exposure Ratios for Consuming Freezer Muscle ...................................................... 73
Table 6-13 Exposure Ratios for Consuming Fish Muscle from Chrystina Lake........................... 74
Table 6-14 Species-Specific Consumption Limit ........................................................................ 75
Table 7-1 Evaluating the Need for a Public Health Advisory...................................................... 82
Table 7-2 Public Health Advisories............................................................................................ 83
Table 7-3 Sources of Public Awareness of Public Health Advisory ............................................ 86

xviii
List of Figures
Figure 1-1 Location of Swan Hills ...............................................................................................2
Figure 2-1 Basic Health Risk Assessment Framework..................................................................4
Figure 2-2 Framework of Site-Specific Health Risk Assessment .................................................5
Figure 2-3 Study Design for Measuring Human Exposure ...........................................................6
Figure 3-1 Locations of Fresh Deer Collection in the Swan Hills Area .........................................9
Figure 3-2 Locations of Freezer Meat Collection in the Swan Hills Area.................................... 12
Figure 3-3 Locations of Fish Collection in the Swan Hills Area.................................................. 14
Figure 3-4 Concentrations of Total PCBs in Fresh Deer Samples............................................... 25
Figure 3-5 Concentrations of Total PCDD/Fs in Fresh Deer Samples......................................... 25
Figure 3-6 TEQ Levels of PCDD/F in Fresh Deer Samples........................................................ 26
Figure 3-7 Total TEQ Levels of PCDD/F+PCB in Fresh Deer Samples ..................................... 26
Figure 3-8 TEQ, PCDD/F levels for the Four Deer from Swan Hills .......................................... 27
Figure 3-9 Concentrations of Total PCBs in Freezer Muscle Samples ........................................ 29
Figure 3-10 Concentrations of Total PCDD/F in Freezer Muscle Samples ................................. 30
Figure 3-11 TEQ Levels of PCDD/Fs in Freezer Muscle Samples.............................................. 30
Figure 3-12 Total TEQ Levels of PCDD/F +PCB in Freezer Muscle Samples............................ 31
Figure 4-1 Communities in the Swan Hills and its Surrounding Areas ........................................ 39
Figure 4-2 Relationship between PCB levels & Age-gender for Community Sample .................. 47
Figure 4-3 Relationship between PCDD/F levels & Age-gender for Community Samples........... 47
Figure 5-1 Proportion of Four Wild Game Consumption Groups ............................................... 56
Figure 5-2 Proportion of Four Fish Consumption Group ........................................................... 57
Figure 7-1 Risk Management Framework .................................................................................. 78
Figure 7-2 Stakeholder Involvement in the Swan Hills Health Assessment ................................. 80

xix

1
1. INTRODUCTION
The Swan Hills Waste Treatment Centre (SHWTC) is a facility for the safe disposal of special
wastes. It is located approximately 12 kilometres (km) north-east of the Town of Swan Hills, at
the geographic centre of Alberta (54o N, 115o W) (Figure 1-1). During 1996, several odour
incidents, accidental emissions and spills were reported by the management company (BOVAR,
Inc.). On October 16, 1996, a malfunction of a transformer furnace was discovered which had
caused the flow of a portion of process gases containing polychlorinated biphenyls (PCBs),
dioxins and furans (PCDD/Fs) into the ambient air. A preliminary risk assessment indicated that
this incident might have resulted in an unacceptable exposure risk to inhabitants in the immediate
area. Therefore, as a precautionary measure, Alberta Health issued a food consumption advisory
for wild game and fish taken within a 30 km radius of the plant in December of 1996.
In order to estimate actual human exposure and to evaluate the effectiveness of public health interventions, a
detailed human impact assessment was carried out by Alberta Health from December 1996 to October 1997. The
human impact assessment was designed to document the current status of exposure and to address questions about
population exposures arising from accidental and fugitive emissions of PCBs, dioxins and furans from the waste
treatment plant. The following questions were specifically addressed:
• To what extent are human food sources in the Swan Hills area contaminated with PCBs
and dioxins/furans? What is the geographic range of this contamination?
• To what extent does the consumption of these foods pose health risks?
• Do individuals in the Swan Hills area show evidence of exposure to PCBs and
dioxins/furans?
• What public health advisories need to be established for public safety?

2
Figure 1-1 Location of Swan Hills

3
2. STUDY FRAMEWORK
A total human exposure model provided the framework for the human impact assessment (Figure 2-1). In general,
human exposure is any contact between a substance, biological agent or radiation and an individual or community.
While all people are exposed to low levels of contaminants in air, food, drinking water, and consumer products,
sufficiently high levels of contaminants can interfere with normal biological functions. Such effects can range from
very subtle biochemical changes to clinical disease. Determining the risk posed by environmental contaminants to
populations requires knowledge about the following fundamental components:
• source(s) of contaminants;
• transport of agents in the environment;
• exposure of individuals and population to agents;
• doses received by those exposed (biological markers of exposure);
• early biological effects resulting from these doses (biological markers of effect); and
• health outcomes (clinical disease).
Since the output of each component in the chain of events serves as input to the next, the lack of information on
any one component impairs the ability to make accurate assessments of the associated population health risks. It
should be noted that present knowledge of health effects caused by long term exposure(s) to low levels of
contaminants is based on incomplete toxicological and epidemiological information. Thus, many questions cannot
be definitively answered by current health assessments.

4
Figure 2-1 Basic Health Risk Assessment Framework
The specific goals of the current study were to evaluate the potential for human exposure to PCBs and
dioxins/furans through wild game and fish consumption and to estimate the existing levels of these contaminants
in the human population. The study was designed to meet the requirements of public health intervention in the
short term. To serve medium and longer term surveillance and research objectives, a plan for further monitoring
will need to be developed. In line with the mandate and responsibilities of Alberta Health, assessment emphasized
human-related exposure and focused on selected components of a site-specific health risk assessment (Figure 2-2).
Separate ecological exposure assessments were carried out by Alberta Environment Protection and by BOVAR
Inc. Highlights of these assessments are presented in Appendix A.

5
Hazard IdentificationChemical Analysis
Inventory of Agents
Inventory of sourcesStack Emission
Fugitive Emission
Human Blood
Internal Dose
Fish Wild Game AnimalsDeer
Moose
Human Food
Air SoilSediment
Vegetations Surface waterGroundwater
Snowpack
Environmental media
External Concentrations
Exposure Source Concentrations Estimated Release RateDurationIntensity
Exposure Assessment Dose-response AsessmentGuidelines porposed by Regulatory agencies
Site-Specific Health Risk Assessment
Risk Characterization
Risk Management
Figure 2-2 Framework of Site-Specific Health Risk Assessment
Three measurement methods were used (Figure 2-3). Environmental concentration
measurement was used to assess contaminant concentrations in potentially exposed food
sources; human body burden measurement was used to assess contaminant concentrations in
the blood of potentially exposed human beings, and survey measurement was used to assess the
demographic characteristics, dietary habits and activity patterns of potentially exposed human
beings. For the environmental concentration and human body burden components, a sampling
strategy was developed, samples were collected, and laboratory analysis of the samples was
conducted. Summary measures were then calculated and analyzed using statistical methods.
For the survey component, a sampling strategy was developed, interviews were conducted, and
the data was analyzed to provide consumption rate estimates for potentially exposed food
sources. Finally all information was combined in order to review and revise the current food
consumption advisory. The remaining sections of this report present the detailed results of
these activities.

6
Sampling Strategy Sample Collection Laboratory Analysis
Environmental Concentration Measurements
Sampling Strategy Sample Collection Laboratory Analysis
Human Body Burden Measurements
Consumption Rate
Dietary and Activity Survey
Human Exposure surveillance
Estimate of Exposure RatioEstimate of Total Body Burden
Dose Estimate
Revise of Public Health Advisory
Figure 2-3 Study Design for Measuring Human Exposure
Section 3, Environmental Monitoring, describes the sampling and chemical analyses of fresh
and frozen deer and moose samples, and fish samples collected from the vicinity of the
SHWTC. These analyses were used to develop an estimate of exposure potential through
consumption of these foods.
Section 4, Human Tissue Monitoring, describes the sampling and chemical analyses of target
chemicals in human blood samples. This analysis was used to assess previous exposure and
internal doses in the population.
Section 5, Diet and Activity Survey, describes the questionnaire interview process and the
resulting estimates of dietary patterns of the potentially exposed population.
Section 6, Estimation of Daily Intake and Exposure Ratio, combines the information discussed
in sections 3,4 and 5 to estimate the daily intake of PCBs and dioxin/furans that would be
expected in segments of the population through wild game and fish consumption, provides
comparisons of these figures with relevant guidelines proposed by different regulatory
agencies, and develops consumption limits based upon these guidelines.

7
Section 7, Risk Management and Communication, describes the context of the current study
and discusses specific issues of interpretation of, communication of, and compliance with
Public Health Advisories.
Finally, Section 8, Long Term Monitoring Plan, presents recommendations and plans for
further monitoring and research activities stemming from the study.

8
3. ENVIRONMENTAL MONITORING: WILD GAME AND FISH
The purpose of environmental monitoring was to estimate the concentrations of contaminants
in wild game and fish used for human consumption, and to establish the geographic extent of
contamination in wildlife surrounding the SHWTC site.
3.1 Materials and Methods
3.1.1 Samples
3.1.1.1 Fresh Deer
Meat samples from deer (white-tail and mule) collected within a 30 km radius of the plant
were selected for wild game monitoring. Animals were obtained from other locations in
Alberta to be used as study control samples. Muscle, liver and fat samples were targeted for
analysis.
One deer was collected near the fence of the SHWTC by BOVAR, Inc. on November 23, 1996. Field collections
of additional deer were conducted by Alberta Environmental Protection in cooperation with local hunters during
January and February 1997 under a standard protocol (Appendix B). Three white-tail deer were collected at
distance 10 km, 20 km, 30 km to the east of the SHWTC, respectively. Figure 3-1 illustrates the collection
locations of deer taken within a 30 km radius of the SHWTC.
One control deer was collected by BOVAR, Inc. in November 1996. Eleven road-kill adult deer carcasses (7
white-tail and 4 mule deer) were collected from outside the Swan Hills area. Collection locations included Alberta
Beach, Calgary, Lethbridge, Medicine Hat, Ministik, North of Consort, and Redcliff.

9
Boulder
Louise
Judy
River
Inve
rnes
s
River
Edi
th
Creek
Cr.
FreemanCreek
Creek
Sarah
Creek
RainbowMorse
Moose
Cre
ek
Suthe
rland
Moosehorn
Cr.
Slo
anC
r.
Riv
er
River
Sw
anC
r.
Henry
Creek
Chalm
ers
Creek
Freeman
River
River
Doris
Cr
Clearwater
Saulteaux
Cr
Timeu
Creek
Creek
Ethel
Coutts
River
River
Donnelly
Creek
Cr
Allan
River
CaribouLake
L.
SwartzLakeMarigold
LakeSarah
L.
Krause L.
L.Freeman
Lake
Morse Lois
EdithLake
EthelLake
ArchieLake
AnnaL.
IslandLake
LakeRoche
LakeKathryn
JaneLake
TeaLakes
JessieLake
LakeAgnes
Erickson
FoleyLake
Lake
WindfallLake
32
33
32
33
33
HILLSSWAN
CreekCr
Mabel
Island
R
Redbeaver
Inverness
Shann
on
Cr
Cr
Boulder Cr
Jerry
Sw
an
Stoney
Cr
Otauwau
LakeOtauwau
Swan HillsWaste TreatmentPlant
Bovar 127214
60022
60021
KM
1086420
Fresh Samples - Deer(with Lab Numbers)
Figure 3-1 Locations of Fresh Deer Collection in the Swan Hills Area

10
For each animal, information was recorded on the species, sex and age, date and location of collection, and the
types of specimens extracted. Each specimen weighed approximately 500 g. Teeth were used for aging by tooth
cementum analysis. The age of the animals ranged from 2.5 to 6.5 years.
A total of 42 deer specimens were collected (Table 3-1). The six specimens collected by BOVAR, Inc. consisted of
a muscle sample, a liver sample and a fat sample from each of two animals. The thirty six deer specimens collected
by Alberta Environmental Protection consisted of 14 muscle samples, 14 liver samples and 8 fat sample samples.
Table 3-1 Summary of Fresh Deer Samples
Collection Agency Scientific Name Muscle Liver Fat Location Total
Alberta Health Whitetail DeerOdocoileus virginianus
3 3 2 Swan Hills 8
BOVAR. Inc unknown 1 1 1 Swan Hills 3
Alberta Health Whitetail DeerOdocoileus virginianus orMule DeerOdocoileus hemionus
11 11 6 Control areas 28
BOVAR. Inc. Unknown 1 1 1 Control area 3
Total 16 16 10 42
The specimens collected by BOVAR, Inc. were shipped to the Enviro-Test Laboratory for analysis in December
1996. The specimens collected by Alberta Environmental Protection were placed in clean polyethylene bags and
kept frozen (at -18 oC) in the Food Laboratory, Animal Health Laboratory Branch, Alberta Agriculture. On March
11, 1997, the specimens were packed with dry-ice and shipped to the MAXXAM laboratory for analysis.
3.1.1.2 Freezer Deer and Moose Meats
Deer and moose collected by hunters from areas surrounding the SHWTC and preserved in home freezers were
also selected for analysis.
In December, 1996, Alberta Health issued a public notice requesting that individuals who had hunted in the Swan
Hills area after October 1996 notify their Regional Health Authority if they could provide meat samples for
analysis. The Environmental Health Service in cooperation with the Regional Health Authority (RHA) undertook
wild game meat collection between January and March 1997 under a standard protocol (Appendix C).
Approximately 40 people who had offered to provide samples of meat and who had taken animals between

11
October 1996 and February 1997 from within an approximately 30 kilometer radius of the SHWTC were
contacted by RHA Health Inspectors who made an appointment to pick up the samples.
Each sample weighed approximately 500 g. and was packed in an individual zip-lock freezer bag with an
identification code. Each meat donor completed a form for each sample submission and marked the sampling
location on a map in relation to the SHWTC site (Figure 3-2). Information was recorded on the sample owner
(name, date, address and telephone number) and on the sample (species, age and sex of animals, sample weight,
cut of meat, conditions of sample e.g. fresh, frozen, thawed, date the animal was killed, location of kill site, and
wildlife identification number, if applicable). The completed forms and maps were sent to the Manager,
Environmental Health Services, Alberta Health.
A total of 60 deer and moose specimens were collected (Table 3-2). The collected specimens consisted of 14
samples of deer meat (11 muscles, 2 livers and 1 heart) and 46 samples of moose meat (37 muscles, 6 livers, 1 fat,
1 heart and 1 kidney). Thirty four of the 60 samples were collected during October, November and December of
1996. The remaining 26 samples were obtained during January and February of 1997.

12
Figure 3-2 Locations of Freezer Meat Collection in the Swan Hills Area

13
Table 3-2 Summary of Freezer Meat Sample
Species Scientific Name Muscle Liver Fat Heart Kidney Total
Deer Whitetail DeerOdocoileus virginianus orMule DeerOdocoileus hemionus
11 2 0 1 0 14
Moose Alces americana 37 6 1 1 1 46
Total 48 8 1 2 1 60
All specimens were shipped to the Food Laboratory, Animal Health Laboratory Branch, Alberta Agriculture and
stored frozen until ready for shipping to the laboratory. Fifty specimens were packed with dry ice and shipped to
the MAXXAM laboratory for analysis via next-day courier on February 21 and an additional 10 specimens were
shipped on March 11, 1997.
3.1.1.3 Fish
Fish sampling strategies were developed by Alberta Health in cooperation with the Science
Advisory Committee and Alberta Environmental Protection. Selection of target species was based
on the following considerations:
1) the species of fish consumed most frequently in the Swan Hills area;
2) the species which are of recreational or traditional value;
3) the species which have the potential to bio-accumulate high concentrations of PCBs
and PCDD/Fs;
4) the feeding habits of the fish (e.g. bottom feeder, predator); and
5) the lakes which are located near the waste treatment plant.
Two lakes near the plant were selected for fish sampling: Chrystina (Windy) Lake, approximately
1.5 km northeast of the plant, and Roche Lake, approximate 20 km southeast of the plant (Figure
3-3). Chrystina Lake contains a stocked, non-native population of eastern brook trout (Salvelinus
fontinalis). The lake has been stocked every year with brook trout reared at the Sam Livingston
hatchery in Calgary. The latest stocking date was May 1997. Brown trout and white suckers form
only a small portion of the lake’s fish population. All Alberta brook trout populations feed strictly

14
on benthic and planktonic invertebrates. Thus, brook trout were selected for chemical analysis.
Roche Lake contains northern pike (Esox lucius), a predatory fish commonly consumed by local
people. This species was selected for monitoring. As a control, northern pike were also selected
for analysis from Chip Lake, located between Edmonton and Edson.
Edith
Creek
RainbowMorse
Moose
Creek
Swan
Saulteaux
Cr
Timeu
Creek
Creek
Coutts
River
Creek
L.
SarahL.
Lois
EdithLake
EthelLake
ArchieLake
AnnaL. Lake
Kathryn
Lake
TeaLakes
33
32
33
HILLSSWAN
Swan HillsWaste TreatmentPlant
Chrystina (Windy)Lake
RocheLake
KM
1086420
Chrystina (Windy) and Roche Lake
Figure 3-3 Locations of Fish Collection in the Swan Hills Area
Field collection was carried out by Alberta Environmental Protection during June and July, 1997
under a protocol developed previously for the Northern River Basin Study [NRBS] (Appendix
D). For each fish, the species, length, weight, and age were recorded. A total of 16 brook trout
were collected from Chrystina Lake with an average age of 2.0 years and 17 northern pike
were collected from Roche Lake with an average age of 4.4 years (Figure 3-3). A total of 32
northern pike were collected from Chip Lake with an average age of 5.4 years. All fish
samples were shipped to and stored at -18 oC at the MAXXAM laboratory in Edmonton.

15
Both fish fillet and liver were analyzed. For Chrystina and Roche Lake samples, composite
samples were formed from 4 (or 5) fish from a single species from the same lake with
approximately the same length and weight. For Chip Lake samples, composite samples were
formed from 6 or 7 fish. A total of 26 composite samples were formed (Table 3-3).
3.1.1.4 Other Animals
One lynx, one marten and two black bears were killed near the SHWTC. Because control
groups for these animals are not available and because of the small number of samples, results
of the analysis are not reported here.

16
Table 3-3 Summary of Fish Samples
Sample ID(composite)
Species Lake Location Tissue Length(mean, cm)
Weight(mean, g)
Number offish
7655-1 n. pike Roche Swan Hills Muscle 50.48 906 4
7655-5 n. pike Roche Swan Hills liver 50.48 906 4
7655-2 n. pike Roche Swan Hills muscle 56.22 1090 4
7655-6 n. pike Roche Swan Hills liver 56.22 1090 4
7655-3 n. pike Roche Swan Hills muscle 55.81 1266 4
7655-7 n. pike Roche Swan Hills liver 55.81 1266 4
7655-4 n. pike Roche Swan Hills muscle 59.69 1615 5
7655-8 n. pike Roche Swan Hills liver 59.69 1615 5
7655-9 bk. tr. Chrystina Swan Hills muscle 18.26 71 4
7655-13 bk. tr. Chrystina Swan Hills liver 18.26 71 4
7655-10 bk. tr. Chrystina Swan Hills muscle 19.85 82 4
7655-14 bk. tr. Chrystina Swan Hills liver 19.85 82 4
7655-11 bk. tr. Chrystina Swan Hills muscle 21.59 108 4
7655-15 bk. tr. Chrystina Swan Hills liver 21.59 108 4
7655-12 bk. tr. Chrystina Swan Hills muscle 24.77 187 4
7655-16 bk. tr. Chrystina Swan Hills liver 24.77 187 4
7655-17 n. pike Chip outside SH muscle 45.30 636 6
7655-22 n. pike Chip outside SH liver 45.30 636 6
7655-18 n. pike Chip outside SH muscle 48.26 701 6
7655-23 n. pike Chip outside SH liver 48.26 701 6
7655-19 n. pike Chip outside SH muscle 50.62 745 7
7655-24 n. pike Chip outside SH liver 50.62 745 7
7655-20 n. pike Chip outside SH muscle 53.55 861 6
7655-25 n. pike Chip outside SH liver 53.55 861 6
7655-21 n. pike Chip outside SH muscle 57.33 1156 7
7655-26 n. pike Chip outside SH liver 45.30 1156 7
Total 55n. pike = Northern Pike, bk. tr. = Brook Trout
3.1.2 Laboratory Methods

17
The MAXXAM Laboratory, in Mississauga, Ontario, was selected to analyze the samples for PCB and PCDD/F
concentrations. The MAXXAM Laboratory is accredited by the Standards Council of Canada to ISO Guide 25. (It
should be noted that the fresh deer samples collected by BOVAR, Inc. were tested under a different protocol by
Enviro-Test Laboratories. A smaller number of congeners were analyzed. Data from these samples were combined
with data analyzed by MAXXAM where appropriate).
3.1.2.1 Selection of Individual Congeners for Analysis
Commercial use, environmental occurrence, abundance in the environmental media and biological matrices, and
potential toxicity need to be considered in the selection of specific congeners of PCBs for analysis [McFarland and
Clarke, 1989; Sonzogni et al, 1991; Borlakoglu and Walker, 1989; Battershill, 1994; and Seegal, 1996].
According to McFarland and Clarke, a total of 36 of the 209 PCB congeners are environmentally relevant. The
Canadian Association of Pest Control Offices recommends 12 specific congeners for regular analysis. Based upon
the literature review, the laboratory capacity, and financial considerations, a total of 44 specific congeners of PCBs
were selected for analysis:
8, 18, 28, 33, 37, 44, 49, 52, 70, 74, 77, 81, 87, 99, 101, 105, 114, 118, 119, 123, 126, 128, 137, 138, 151,
153, 156, 157, 158, 167, 168, 169, 170, 177, 180, 183, 187, 189, 191, 194, 201, 202, 205, 209
The composition of PCBs in most environmental extracts does not resemble the composition of commercial
products. Individual PCB congeners have different physico-chemical properties that influence their rates of
partitioning, uptake and retention in the environmental matrices and their rates of absorption, distribution,
metabolism and elimination in the biological matrices [Safe 1994]. Health risk assessment of PCBs should
consider the potential adverse impact of individual PCB congeners and their levels in the environmental, food and
human blood samples. Health Canada's current policy is to provide congener analyses and also to sum the
concentrations of the individual congeners to arrive at a total PCB level [Dr. Jake Ryan. Personal communication].
This policy was also followed in the current study and a total PCB level calculated by summing the concentrations
of the 44 selected congeners is reported.
Availability of toxic equivalency factors determined the individual congeners of polychlorinated dibenzo-p-dioxins
(PCDDs) and polychlorinated dibenzofurans (PCDFs) selected for analysis:
PCDD PCDF
2,3,7,8-TCDD 2,3,7,8-TCDF
1,2,3,7,8-PeCDD 1,2,3,7,8-PeCDF
2,3,4,7,8-PxCDF
1,2,3,4,7,8-HxCDD 1,2,3,4,7,8-HxCDF

18
1,2,3,6,7,8-HxCDD 1,2,3,6,7,8-HxCDF
1,2,3,7,8,9-HxCDD
1,2,3,7,8,9-HxCDF
2,3,4,6,7,8-HxCDF
1,2,3,4,6,7,8-HpCDD 1,2,3,4,6,7,8-HpCDF
1,2,3,4,7,8,9-HxCDF
OCDD OCDF
3.1.2.2 Basic Quality Assurance /Quality Control Criteria
The following QA/QC criteria were in place for the current analyses:
a) Analysis of a certified reference material every batch of samples i.e. 10-20 samples
b) Analysis of blanks every 10 samples
c) Confirmation of standard by another reputable (certified) lab
d) Analysis of a duplicate sample every 20 samples
e) Reporting of internal standard recoveries (added during extraction of the sample)
f) Review and evaluation by an independent chemist
3.1.2.3 Analytical Procedure
The analytical approach for the analysis of PCBs, PCDDs and PCDFs is based on the in-house Standard
Operating Procedure SOP# TO.1013.02 (Revised on 08/27/94). This SOP is based on Environment Canada
methods EPS 1/RM/19 and EPS 1/RM/23 with specific references to equipment and instrumentation that are used
in MAXXAM Laboratory. Methods highlights include:
a) soxhlet or liquid-liquid extraction with methylene chloride/hexane for solids or liquids
b) acid wash
c) four stage Chromatographic clean-up
d) High-Resolution Gas Chromatographic/High Resolution Mass spectrometer Analysis
(HRGC/HRMS)
e) built-in Quality Assurance/Quality Control (QA/QC)
f) detection limit:
PCDD/PCDF (HRGC/MS) 0.1 - 1.3 pg/g
PCB congeners (HRGC/MS) 1 - 3 ng/g

19
After the necessary sample work-up, the extracts are analyzed on a VG AutoSpec Ultima Magnetic Sector, HRMS
with a 60 meter DB 5 column. Some AutoSpec capability highlights include: variable mass resolution to 60 000,
sub parts per quadrillion (ppq) sensitivity for PCDDs/Fs, EPA dioxin quantitative package and a NIST 49 000
compound library. The published instrument sensitivity for TCDD is 100 femtograms (fg) with a signal to noise
ratio of 50:1, three to one signal to noise ratio would therefore equal instrument detection of 6 fg.
Spiking
Prior to the initial extraction, all samples were fortified with fifteen 13C12-labeled PCDD/F with exception of
OCDF and eight 13C12-labeled PCBs (IUPAC nos. 31, 52, 118, 153, 180, 194, 206 and 209). These internal
standards represent each of the PCDD, PCDF and PCB homologues. The solutions were prepared from purified
crystaline compounds (chemical: >98%, isotopic: >99%), analyzed by HRGC/HRMS and confirmed to be free of
native PCDD/Fs and PCBs. Surrogate recovery limits range from 30% to 130%.
Extraction
A 20 g homogenized sample was extracted with 100 ml of pre-cleaned hydrochloric acid for 30 min in a tared 240
ml extraction jar. Twenty ml of 25% DCM/Hexane (v/v) was added to allow the sample to digest overnight. The
extract was centrifuged for 45 minutes and the upper layer removed by suction into a 250 ml filtering flask. The
extraction was repeated with 20 ml 25% DCM/Hexane (v/v) solution. The extract was concentrated to
approximately 2 ml using a rotary evaporator. The combined and dried extracts were collected in a 40 ml glass
VOC bottle. The weight of the lipid portion residue was obtained to determine the percent lipid content.
The extracts were reconstituted with 10 ml hexane and then 20 ml concentrated sulphuric acid. After shaking and
allowing the layers to separate, the acid layer was removed. The acid-wash process was repeated until the extract
was clear and colorless. The acid-washed extract was concentrated to 2 ml and then fortified with 20 µl of the
clean-up surrogate standard.
Clean-up and separation
The extracts were cleaned up using an acid/base silica column. The concentrated extracts were transferred to the
column, which was eluted with 30 ml hexane into a 250 ml round-bottom flask. The eluent was concentrated on a
rotary evaporator.
The extracts were cleaned up using an alumina column, collecting four separate fractions. The concentrated
extracts were transferred to the column, which was eluted with 7 ml hexane into a 15 ml conical test tube (fraction
one), 15 ml 4% DCM/Hexane (v/v) into a new 15 ml tube (fraction two), 15 ml 65% DCM/Hexane (v/v) into a
20
new tube (fraction three) and 15 ml of DCM into a new tube (fraction four). Fractions 1, 2 and 4 were placed in
storage. Fraction 3 was concentrated under a gentle stream of nitrogen gas. The concentrated extracts were
quantitatively transferred to an autosampler vial and reconstituted to a final volume of 20 µl via the addition of 20
µl of the performance standard.
Identification
A FISONS VG Ultima High Resolution Mass spectrometer is utilized for analysis of ultra-trace levels of organic
contaminants. This mass spectrometer is coupled to a Hewlett Packard gas chromatograph. The sample extracts
were injected into a Hewlett Packard 5890 Gas Chromatograph via a FISONS A200S automatic sample injection
system. The GC is equipped with a split/splitless injection port.
The GC is equipped with a 60 meter, 0.25 mm ID., 0.25 µm film thickness DB-5 capillary column. Alternative
column includes a DB-225 (30 m, 0.25 mm ID, 0.25 µm film thickness). Injector temperature was 265 oC. The
GC temperature program was as follows: initial temp 80 oC, hold 1 min; ramp to 205 oC @ 40 oC/min; ramp to
220 oC @ 3 oC/min, hold 16 min; ramp to final temp of 310 oC @ 15 oC/min, hold 15 min. The total time of the
GC run was 50 min.
The autosampler and gas chromatograph operations are controlled by the analyst from the Vax 4000 work station,
using the experiment method "EPA”. The retention time windows for the EPA method program were adjusted
using the experiment “ZONE CHECK”. The run sequence includes a check standard which is analyzed at 12 hour
intervals and the end of a run sequence. The host system for mass spectral data collection is the Digital Vax
4000.60 work station. The Vax work station is interfaced with a second personal computer (IBM 486).
Quantitation
Relative response factors (RRFs) were calculated for the native compounds in relation to the C-13-labeled
surrogates of the same homologue group. Surrogate compound RRFs were calculated based on their relation to the
performance standards. All RRFs fell within ±25% of the mean relative response calculated from the calibration
curve. The calculations of concentrations were based on separate quantitation of peak areas for all the homologues
and individual isomers corresponding to the amount of the internal standards.
3.1.3 Data Analysis
Data analysis was conducted on both individual and summary measures of PCBs and PCDD/Fs. Additional
variables designating species, specimen type, and location were included in analyses where required. Individual

21
measures included whole weight concentrations, lipid-adjusted concentrations (where applicable), and Toxic
Equivalencies (TEQs) for each of the 44 PCB congeners, each of the 7 PCDD congeners, and each of the 10
PCDF congeners. International Toxic Equivalency factors [I-TEFs] (WHO-IPCS for PCBs and
NATO-CCMS for dioxins/furans) were used for calculating TEQ values. The concentration of a
congener below detection level was assigned a value of 0 (“zero”). Summary measures included
a) Detect/Non-Detect status (formed separately for PCBs, PCDD/Fs, and both PCBs and PCDD/Fs
together). A sample was designated detect if any congener value was above detection limits, and was
designated non-detect if all congeners were below detection limits.
b) Total PCB Concentration calculated by summing the values for each of the 44 individual PCB
congeners, for whole weight and lipid-adjusted concentrations (where applicable).
c) Total PCDD/F Concentration calculated by summing the values for each of the 17 individual PCDD
and PCDF congeners, for whole weight and lipid-adjusted concentrations (where applicable).
d) Total TEQ calculated by summing the TEQ values for each of the individual PCBs, PCDDs, and
PCDFs, for whole weight and lipid-adjusted concentrations (where applicable).
It should be noted that the fresh deer samples collected by BOVAR, Inc. were tested under a different protocol by
Enviro-Test Laboratories. These samples were excluded from the analysis of individual congeners. In order to
compare the analyses of these samples with the analysis of samples analyzed by the MAXXAM laboratories,
summary measures for total PCBs were calculated as the sum of the concentrations of 9 homologous groups (di-,
tri-, tetra-, penta-, hexa-, hepta-, octa, nona-, and deca-), and summary measures for total PCDD/Fs were
calculated as the sum of the concentrations of 10 homologous groups (octa CDD, total tetra CDD, total penta
CDD, total hexa CDD, total hepta CDD, octa CDF, total tetra CDF, total penta CDF, total hexa CDF, total hepta
CDF).
Appendices E, F, and G present the summary concentrations of PCBs and PCDD/Fs for the individual samples for
fresh deer meat samples, freezer meat samples, and composite fish samples, respectively.
The examination of individual congener distributions can, in the ideal case, serve to locate anomalous analyses as
part of a Quality Assurance/Quality Control process and can serve to allow the development of hypotheses about
contaminant source localization. In the current case, the small number of individual samples, the large number of
congener variables, and the generally skewed distributions of congeners make such examinations speculative.
Consequently this analysis is presented primarily for scientific interest and should be interpreted with due caution.
Appendix H presents the PCB and PCDD/F congener patterns for selected samples and sample types in graphical
form.

22
3.2 Results
3.2.1 Fresh Deer Meat
The proportion of samples in which measurable levels of PCBs and PCDD/Fs were not
detected is shown by sample type in Table 3-4.
Table 3-4 Proportion of Non-detect in Fresh Deer Samples
Parameter Swan Hills Area Control Areas in Alberta
Liver
total PCBs 0/4 4/12
total PCDD/Fs 0/4 1/12
both PCBs and PCDD/Fs 0/4 0/12
Fat
total PCBs 1/3 4/7
total PCDD/Fs 0/3 0/7
both PCBs and PCDD/Fs 0/3 0/7
Muscle
total PCBs 2/4 6/12
total PCDD/Fs 1/4 7/12
both PCBs and PCDD/Fs 1/4 4/12
Statistical comparisons of the summary measures were conducted using two non-parametric procedures: the Mann-
Whitney U test and a Randomization test. Significance levels are reported for the Randomization test. Because the
randomization test was applied to sample means, these were tabulated in Table 3-5. Briefly, all measures for liver
are significantly elevated in the Swan Hills samples relative to the Alberta control samples. All measures are
significantly elevated for fat (except the PCDD/F whole weight concentration and total PCB lipid adjusted
concentration which approach significance); and the whole weight PCDD/F TEQ and both whole weight and lipid
adjusted PCDD/F + PCB TEQ measures for the muscle samples are significantly elevated. However, the skewed
nature of the data should be considered in the interpretation of these means. Also, caution should be exercised in
interpreting the results from fresh deer samples since the sample size was small, the number of comparisons was
high, and the tests for liver, fat and muscle were not independent (since the same animals contributed liver, fat, and
23
muscle samples).
Because the distributions of the summary measures were skewed, selected graphical comparisons
are presented in Figures 3-4 to 3-7 which employ box-plots showing the 5th, 25th, 50th, 75th, and
95th percentiles of each distribution and separately indicating extreme values located substantially
above or below the outer percentiles. The pattern is similar for whole weight concentrations,
whole weight TEQ, and lipid adjusted TEQ.

24
Table 3-5 Mean Levels of PCBs and PCDD/Fs in Fresh Deer Samples
Parameter Swan Hills ControlAreas
Statisticaldifference
Liver
total PCBs,µg/kg, whole weight 73.63 15.48 P < 0.02*
total PCDD/Fs, pg/g, whole weight 2348.95 153.31 P < 0.02*
PCDD/F TEQ, pg/g, whole weight 495.53 4.40 P < 0.01*
PCDD/F + PCB TEQ, pg/g, whole weight 558.09 5.19 P < 0.01*
total PCBs, µg/kg, lipid weight 2 408.81 457.05 P < 0.01*
PCDD/F + PCB TEQ, pg/g, lipid weight 12 471.58 120.44 P < 0.001*
Fat
total PCBs, µg/kg, whole weight 253.10 33.24 P < 0.05*
total PCDD/Fs, pg/g, whole weight 131.50 47.14 P < 0.10
PCDD/F TEQ, pg/g, whole weight 45.19 0.55 P < 0.05*
PCDD/F + PCB TEQ, pg/g, whole weight 66.08 1.42 P < 0.05*
total PCBs, µg/kg, lipid weight 286.00 38.76 P < 0.10
PCDD/F + PCB TEQ, pg/g, lipid weight 75.40 1.71 P < 0.05*
Muscle
total PCBs, µg/kg, whole weight 21.53 3.48 P < 0.15
total PCDD/Fs, pg/g, whole weight 4.85 17.76 P > 0.50
PCDD/F TEQ, pg/g, whole weight 1.27 0.14 P < 0.05*
PCDD/F + PCB TEQ, pg/g, whole weight 17.98 0.15 P < 0.05*
total PCBs, µg/kg, lipid weight 890.15 475.93 P > 0.25
PCDD/F + PCB TEQ, pg/g, lipid weight 766.01 13.27 P < 0.05** statistically significant differences

25
124 73 124N =
600
500
400
300
200
100
0
-100
Swan Hills Control areas of Alberta
liver
fat
muscleCon
cent
rati
on o
f P
CB
( µµg/
kg, w
hole
wei
ght)
Figure 3-4 Concentrations of Total PCBs in Fresh Deer Samples
124 73 124N =
6000
5000
4000
3000
2000
1000
0
-1000Con
cent
rati
on o
f P
CD
D/F
(ng
/kg,
who
le w
eigh
t)
liver
fat
muscle
Swan Hills Control area of Alberta
Figure 3-5 Concentrations of Total PCDD/Fs in Fresh Deer Samples

26
124 73 124N =
2000
1750
1500
1250
1000
750
500
250
0
-250TE
Q L
evel
of
PC
DD
/F (
ng/k
g, w
hole
wei
ght)
liver
fat
muscle
Swan Hills Control areas of Alberta
Figure 3-6 TEQ Levels of PCDD/F in Fresh Deer Samples
124 73 124N =
2000
1750
1500
1250
1000
750
500
250
0
-250
Tot
al T
EQ
Lev
el o
f P
CD
D/F
+PC
B(n
g/kg
, who
le w
eigh
t)
liver
fat
muscle
Swan Hills Control areas of Alberta
Figure 3-7 Total TEQ Levels of PCDD/F+PCB in Fresh Deer Samples

27
Figure 3-8 shows the PCDD/F whole weight TEQ measures for the four deer from the Swan Hills area as a
function of the distance from the SHWTC at which they were captured. When the samples are standardized within
tissue type and then correlated with distance across all samples, a statistically significant correlation emerges (r= -
0.849, P <0.005) indicating that PCDD/F whole weight TEQ increases as distance from the SHWTC decreases.
100005000
1000500
10050
105
1.5
.1TE
Q L
evel
of
PC
DD
/F (
ng/k
g, w
hole
wei
ght)
liver fat muscle
0 km
10 km
20 km
30 km
TISSUE
Figure 3-8 TEQ, PCDD/F levels for the Four Deer from Swan Hills
No other correlation emerged as significant. In particular there was no apparent relationship
between PCB or PCDD/F levels and age of the animals.
3.2.2 Freezer Meat Samples
Two sample categories for freezer meat samples were established based on the distance from the SHWTC.
Samples obtained with a 20 km radius were compared with samples taken outside the 20 km radius. Exploratory
analysis showed no significant differences between samples from deer and moose, and the two species were
combined for analysis. Given the small number of liver samples, the analysis focused on muscle samples.
Table 3-6 presents the proportion of samples in which no measurable levels of PCBs and PCDD/Fs were detected.

28
Table 3-6 Proportion of Non-detect in Freezer Meat Samples
Parameter within 20 km outside 20 km
total PCBs 11/22 21/28
total PCDD/Fs 15/22 19/28
both PCBs and PCDD/Fs 10/22 18/28
The mean concentrations of whole weight PCBs and PCDD/F; whole weight PCDD/F TEQ and
PCDD/F + PCB TEQ; lipid adjusted PCB concentration levels; and lipid adjusted PCDD/F + PCB
TEQ are presented in Table 3-7. The mean level of PCBs is significantly higher in samples taken
within the 20 km radius for both whole weight (p<0.02) and lipid adjusted (p<0.02) measures.
The mean PCDD/F level is significantly higher in samples taken within the 20 km radius (p<0.05)
and while the PCDD/F whole weight TEQ does not differ, the PCDD/F+PCB TEQ is significantly
higher for both whole weight (p<0.05) and lipid adjusted (p<0.05) measures.
Table 3-7 Mean Levels of PCBs and PCDD/Fs in Freezer Meat Samples
Parameterwithin 20 km
MeanOutside 20 km
MeanStatisticaldifference
total PCBs, µg/kg, whole weight 18.16 0.65 P < 0.02*
total PCDD/Fs, pg/g, whole weight 4.22 1.03 P < 0.05*
PCDD/F TEQ, pg/g, whole weight 0.07 0.11 P > 0.50
PCDD/F + PCB TEQ, pg/g, whole weight 9.89 0.11 P < 0.05*
total PCBs, µg/kg, lipid weight 3394.35 60.45 P < 0.02*
PCDD/F + PCB TEQ, pg/g, lipid weight 2077.27 7.17 P < 0.05* * statistically significant differences
Because the distributions of the summary measures were skewed, selected graphical comparisons are presented in
Figures 3-9 to 3-12. The distribution of PCB whole weight concentrations for muscle samples is illustrated in
Figure 3-9. Within the 20 km radius, 11 samples (50.0%) showed detectable levels of PCBs and 11 samples
(50.0%) were non-detects. Outside the 20 km radius, 7 samples (25%) showed detectable PCB level and 21
samples (75%) were non-detects. The distribution of PCDD/Fs is presented based on whole weight in Figure 3-10.

29
Within the 20 km radius, 7 samples (31.8%) showed detectable levels of PCDD/Fs and 15 samples were non-
detects (68.2%). Outside the 20 km radius 9 samples (32.1%) showed detectable levels and 19 samples (67.9%)
were non-detects. Figure 3-11 and 3-12 present the distribution of PCDD/f TEQ and PCDD/F plus coplanar PCB
TEQ in freezer meat muscle samples.
2111 711N =
200
175
150
125
100
75
50
25
0
-25
Con
cent
rati
on o
f P
CB
s ( µµ
g/kg
, who
le w
eigh
t)
Within 20 km Outside 20 km
Figure 3-9 Concentrations of Total PCBs in Freezer Muscle Samples

30
1915 97N =
40
30
20
10
0
-10
Con
cent
rati
on o
f P
CD
D/F
(ng
/kg,
who
le w
eigh
t)
Within 20 km Outside 20 km
Figure 3-10 Concentrations of Total PCDD/F in Freezer Muscle Samples
1915 97N =
3.0
2.5
2.0
1.5
1.0
.5
0.0
-.5TE
Q L
evel
of
PC
DD
/F (
ng/k
g, w
hole
wei
ght)
Within 20 km Outside 20 kmFi
gure 3-11 TEQ Levels of PCDD/Fs in Freezer Muscle Samples

31
1810 1012N =
160
140
120
100
80
60
40
20
0
-20
Tot
al T
EQ
Lev
el o
f P
CD
D/F
+PC
B
(ng/
kg, w
hole
wei
ght)
Within 20 km Outside 20 km
Figure 3-12 Total TEQ Levels of PCDD/F +PCB in Freezer Muscle Samples
Five out of 6 liver samples from within the 20 km radius (83.3%) showed detectable levels of PCBs and
PCDD/Fs. The mean PCB levels were 4.07 µg/kg in whole weight and 158.42 after lipid adjustment. The mean
PCDD/F levels were 170.18 pg/g in whole weight, 7.38 whole weight PCDD/F TEQ, 7.39 whole weight PCDD/F
+ PCB TEQ, and 439.64 lipid adjusted PCDD/F PCB TEQ. No statistical analysis could be performed because of
the small number of liver samples.
3.2.3 Fish
Levels of PCBs and PCDD/Fs for fish samples taken from the three lakes are shown for muscle in
Table 3-8 and for liver in Table 3-9. For all measures, levels in Chrystina Lake were higher than
levels in Roche and Chip lakes which did not differ from each other (One-way ANOVAs, Scheffe
tests, p<0.01). Because analysis was performed on composite samples, the distribution of
contaminants across particular fish is not known; in particular, if this distribution is skewed,
statistical tests may be liberal. This is likely to be more than offset by the use of composite
samples which substantially underestimate the variability of contamination across individual fish.

32
Table 3-8 Mean Levels of PCBs and PCDD/Fs in Fish Muscle
Parameter Chrystina Lake Roche Lake Chip Lake
total PCBs, µg/kg, whole weight 17.85 * 1.01 0.25
total PCDD/Fs, pg/g, whole weight 21.83 * 0.93 0.68
PCDD/F TEQ, pg/g, whole weight 2.74 * 0.003 0.002
PCB TEQ, pg/g, whole weight 9.67 * 0.24 0.002
PCDD/F + PCB TEQ, pg/g, whole weight 12.41 * 0.24 0.004
* difference statistically significant at p<0.01
Table 3-9 Mean Levels of PCBs and PCDD/Fs in Fish Liver
Parameter Chrystina Lake Roche Lake Chip Lake
total PCBs, µg/kg, whole weight 70.03 * 7.76 6.39
total PCDD/Fs, pg/g, whole weight 226.48 * 1.15 7.46
PCDD/F TEQ, pg/g, whole weight 16.63 * 0.24 0.12
PCB TEQ, pg/g, whole weight 44.98 * 3.03 2.36
PCDD/F + PCB TEQ, pg/g, whole weight 61.61 * 3.27 2.48
* difference statistically significant at p<0.01
Caution should be exercised in the interpretation of contaminant levels since the fish in Chrystina
lake are of a different species than the fish taken from Roche and Chip lakes.
3.3 Discussion
Wild Game
Limited information is available on PCBs and dioxins/furans in large terrestrial herbivores (Table 3-10). Direct
comparisons among these data can be misleading due to differences in analytical techniques, quantitative methods
and species of herbivores examined. In the Canadian North studies, the means of total PCBs was derived from the
sum of individual congeners (Muir et al., 1988; Thomas and Hamilton, 1988; Elkin and Bethke, 1995).

33
The mean level of PCBs in deer from control areas of Alberta (with one exception as noted below) are close to
those found in caribou from the Canadian North. These levels may be related to the presence of local industrial
effluence and/or to global atmospheric transport. For unknown reasons, a very high level of dioxins and furans was
presented in a single road-kill deer taken from a highway to the east of Edmonton.
Table 3-10 Concentrations of Total PCBs (mean, µµg/kg) in Large Terrestrial Herbivores
Species Muscle Liver FatQuantit-
ativemethod
Location Reference
WW LW WW LW WW LW
Caribou - - - - - 6-32 SIC CanadianNorth
Elkin & Bethke1995
Caribou 2 - 8 - 11 -52 - SIC CanadianNorth
Thomas &Hamilton 1988
Caribou 10 - - - 33 - SIC CanadianNorth
Muir et al 1988
Roe deer - - - - - 18 Aroclor1260/54
Poland Przybycin &Juszkiewicz 1993
Roe deer - - - - - 32 Kane-chlor
Poland Falandysz &Kannan 1992
Red deer - - - - - 21 Aroclor1260/54
Poland Przybycin &Juszkiewicz 1993
Stage - - - - - 23 Kane-chlor
Poland Falandysz &Kannan 1992
White-tail/mule deer(fresh)
22 890 74 2408 253 286 SHG SwanHills,
Canada
this study
Moose/deer (freezer)
18 3394 3.9 150 - - SHG SwanHills,
Canada
this study
White-tail/mule deer(fresh)
3.5 476 16 457 33 39 SHG Alberta,Canada(control)
this study
WW= Wet Weight; LW= Lipid-adjusted Weight; SIC= sum of individual congeners; SHG= sum of homologousgroups
Levels of PCBs and PCDD/Fs were significantly higher in deer from the Swan Hills area than other areas of
Alberta indicating that contamination has occurred in the ecosystems near the SHWTC. Specifically, an air-plant-

34
herbivore pathway of contamination is implicated. First, recent studies have shown that an increased
atmospheric deposition of PCBs contributes to an increased PCB burden in plant and herbivores (Larsson et al,
1990; Eisler and Belisle, 1995). Contaminants from the atmosphere are known to accumulate on the surface of
lichens (Thomas et al, 1992). Lichens and moss are abundant in the vicinity of the plant and are used to monitor
airborne pollutants. The data in the 1996 fall monitoring program of the company showed elevated levels of PCBs
in live moss and Labrador tea leaves. In these analyses, the predominant congeners were 28, 101, 105, 118, 138,
153 and 183 (based on analyses for 12 congeners). Three coplanar PCBs (77, 126 and 169) were detected, with
relatively higher levels for 77 and 126. Second, the current study shows similar patterns of PCB
bioaccumulation for deer and moose. Lower-chlorinated congeners were frequently detected in
deer and moose in the current study and lower-chlorinated congeners are known to persist in
vegetation (Larsson et al. 1990; Muir 1997). Third, research has shown that in harsh winters the
primary food source for white-tail and mule deer is browse. The average temperature in January
and February in the Swan Hills is about - 18oC. While moose may range farther, the mobility of
white-tail and mule deer is likely to be restricted to a radius of 4 to 5 km in the winter. These
findings offer a strong indication of an air-plant-herbivore pathway of PCB contamination in the
immediate area of the SHWTC.
Fish
Variability in lipid content, feeding habits, tropic structure of the food chains, biomagnification
rate, and fish age can attribute to variations of accumulations of PCB and dioxins/furans in
different fish species (de Wit et al. 1992; Whittle et al. 1993; Eisler and Belisle 1995).
Northern pike is a predator and can bioaccumulate PCBs and dioxins/furans to a relatively high
degree. The fish caught for chemical analysis were moderately large (ranging from 906 to 1615
gm for fish 3-6 years old for Roche Lake and from 636 to 1156 gm for fish 4-7 years old for Chip
Lake) and had low lipid content (ranging from between 0.1% and 0.77% in fillets). Comparable
chemical analyses from the Northern River Basin study showed average levels of dioxins/furans
ranging from non-detectable levels to 28.9 pg/g in northern pike fillets collected from 30 fishing
locations across Alberta (NRBS 1996). The levels of contaminants reported in the current study
are lower, though it is important to note that some rivers and lakes selected for monitoring in the
NRBS are contaminated, to a certain extent, with dioxins/furans.

35
In contrast, brook trout in Alberta eat benthic and plantonic invertebrate. Brook trout in Chrystina
Lake which is located near by the waste treatment plant is a stocked, non-productive population,
ranging in age between 1 and 3 years. Brook trout caught for chemical analysis were small
(ranging from 71 to 187 gram) and had low lipid content (between 0.15% to 0.66% in fillets).
Data on levels of PCBs and dioxins/furans in brook trout from other areas of the province are not
available.
Similar PCB congener patterns were observed in fillet samples of brook trout from Chrystina
Lake and northern pike from Roche Lake. In liver samples, the PCB congener patterns were
similar across all species and locations. Concentrations of individual PCB congeners were
generally one order of magnitude higher in brook trout compared to northern pike. The levels of
TCDD in fillets and livers were under detection limits in all species across all locations. The most
prominent isomer in fish from Chrystina Lake was 2,3,7,8-TCDF. This is consistent with the
results from the Canadian National Dioxins program (Whittle et al 1993) and the BOVAR
monitoring program (BOVAR, 1997).
PCB TEQ values in fillets and liver samples from Chrystina Lake were greater than PCDD/F TEQ
values. This supports results from fresh and frozen deer/moose monitoring. High levels of
congeners 126 and 169 contribute to the higher levels of PCB TEQs. This finding is consistent
with the results of the BOVAR monitoring program in which elevated levels of coplanar PCBs
were found in Labrador tea leaves, living moss and soils (BOVAR 1997). Combustion processes
could be the source of the increased environmental levels of congeners 169 and 126 (Brown et al
1995).

36
3.4 Conclusion
The results of wild game monitoring indicate elevated levels of PCBs and PCDD/Fs in deer and moose from the
area immediately surrounding the Swan Hills Waste Treatment Center. The results of fish monitoring indicate
elevated levels of PCBs and PCDD/Fs in the liver and muscle tissues of brook trout sampled from Chrystina Lake
compared to northern pike sampled from Roche Lake and Chip Lake. Air emissions from the waste treatment
facility are probably a significant source of contaminants. The pathway from air to plant to herbivore is probably
the source of deer and moose exposure to contaminants.

37
4. HUMAN TISSUE MONITORING: BLOOD
The purpose of blood sampling was to estimate the concentration of contaminants in human
blood in residents of the Swan Hills and the surrounding areas. This study provides
information on the absorption of PCBs and PCDD/Fs into the human body which indicates
exposure from all sources and long-term exposure in addition to current exposure. Special
efforts were made to determine the effects of regular consumption of wild game and fish, and
the effects of ethnic group (aboriginal vs. non-aboriginal) were examined. In addition, pooled
blood samples were obtained from blood donors at clinics in a large metropolitan area to serve
as control samples.
4.1 Materials and Methods
4.1.1 Sampling Strategy
Strategies for human serum sampling were developed by Health Surveillance, Alberta Health. A sufficient number
of samples for a study group must be collected to determine the mean level of PCBs precisely enough to evaluate
whether that observed level might simply be a chance fluctuation from levels found in the general population of
Alberta. To determine this number, an estimate of the variability of the PCB levels within humans is required.
Published reports provide estimates of the standard deviation of PCB levels ranging between 3.6 and 4.7 ppb in
exposed individuals. Using this figure, an estimate of the number of samples required for a confidence interval of a
particular width can be developed. Thus, in order to have a 95% confidence interval of about +/- 1 ppb on the
mean PCB level, a sample of about 100 is required. This also means that if the average PCB level in Swan Hills in
100 samples is 1.0 ppb higher than the level discovered in a pooled control sample, there would be reasonable
confidence that this difference did not occur by chance.

38
In order to provide information about laboratory analysis variability and further information about risk factors, a
control sample was formed for PCB levels from analyses of blood samples pooled across a number of individuals.
The following sampling protocol was employed (1) one sampling site (Edmonton) was chosen; (2) individual
pooled samples were collected by gender and by age group as follows: male 17-35, male 35-55, male 55+, female
17-35, female 35-55, and female 55+; (3) each pooled sample was composed of 25 samples; and (4) each pooled
sample was mixed and then split in two for purpose of analysis. This protocol resulted in 12 samples.
4.1.2 Selection of Target Population
Target Population
The target population consisted of individuals over the age of 18 years who resided in
communities in the Swan Hills area.
Criteria of selection
The Town of Swan Hills and all communities within a 100 km radius were chosen for study.
These included Fox Creek, Little Smoky, Sunset House, High Prairie, Enilda, Joussard, Driftpile,
Faust, Kinuso, Canyon Creek, Widewater, Slave Lake, Fort Assiniboine, and Swan Hills (Figure
4-1).
The source of the sampling frame was the Alberta Health Care Insurance Plan registration files.
Individuals were included in the frame if their recorded mailing address included a postal code
associated with one of the chosen communities and if their recorded age exceeded 18 years as of
January 1, 1997. All individuals whose postal code or age was missing from the registration file
were excluded. Because initial contact was to be made by telephone, individuals without a
recorded telephone number were also excluded from the frame. Since individuals rather than
households were placed in the frame, the possibility existed that two individuals living in one
household might have been included in the sample.

39
I.R. 150 (Driftpile)
East Prairie Metis
I.R. 150A (Sucker Creek)
I.R. 150H (Sawridge) I.R. 150G (Sawridge)
I.R. 150E (Swan River)
I.R. 150F (Swan River)
LITTLE SMOKY
FOX CREEK
Sweathouse Creek
SUNSET HOUSE
Little Smoky
LisburnHORNBACK LAC STE. ANNE COUNTY 28
SWAN HILLS
GOOSE LAKE
Lone Pine
ToplandFORT ASSINIBOINE
Freeman River
ROSS HAVEN
ALEXIS RESERVE
YELLOWSTONEARNDT ACRES
Doris
Timeu
EAST PRAIRIE
ENILDA
HIGH PRAIRIE
Arcadia
DriftpileFAUST
JOUSSARD
KINUSOWAGNERCANYON CREEK
WIDEWATER
OverleaMitsue
SLAVE LAKE
Saulteaux
I.R. 231 (Grouard)
km
6050403020100
Figure 4-1 Communities in the Swan Hills and its Surrounding Areas

40
The sampling frame was divided into two: Frame A included those living in the town of Swan
Hills (a total of 2,440 individuals), and Frame B included those living in surrounding communities
(a total of 10,361 individuals).
4.1.3 Recruitment Procedures
Recruitment for the study group was undertaken by Health Surveillance and Environmental Health Service,
Alberta Health in cooperation with Regional Health Authority (RHA) under a protocol (Appendix I). The
procedures included selection of a random sample, identification of potential participants, identification of eligible
participants and identification of study participants.
Random Sample
A random sample of 500 individuals from each sampling frame was selected.. The distribution of
the population of the target communities and of the randomly drawn samples by ethnic group is
presented in Table 4-1.
Table 4-1 Distribution of the Population and Sampling Frame for Phase I Study
Community Group Population Random sample
Town of Swan Hills unknown 249 33aboriginal 42 6non-aboriginal 2 149 461
Total 2 440 500
Surrounding Areas unknown 993 52aboriginal 1 326 66non-aboriginal 8 042 382
Total 10 361 500

41
Potential participants
A telephone interview (Phase I of the study) was conducted with individuals drawn randomly
from the sampling frame. During March and April 1997, two trained interviewers conducted
telephone interviews to identify individuals willing to provide a blood sample (Phase II of the
study). All selected subjects were dialled at least once. A total of 370 subjects were contacted in
the Town of Swan Hills and its surrounding areas. Of the remainder, 197 phone numbers were out
of service, 154 numbers were wrong numbers, and 279 individuals could not be reached. Of the
370 subjects, 88% individuals (327) agreed to participate in Phase I of the study. Of these, 91%
(296) completed Phase I of the study and also agreed to participate in Phase II of the study. These
296 individuals were considered potential participants.
Eligible participants
The Phase I interview included detailed questions about residence history, and wild game and fish
consumption. A total of 123 (38%) respondents had consumed wild game taken from the Swan
Hills, and 127 (39%) respondents had consumed wild fish. Of these, 90% had consumed wild
game and fish for two years and more. Based on the reported consumption rates, four
consumption categories were identified as showed in Table 5-4 and 5-6 in Section 5.2.2. Potential
participants were divided into two groups. The consumption group consisted of all individuals
who reported high, medium, or low intake of wild game; or high, medium, or low intake of wild
fish. The non-consumption group consisted of individuals who reported that they did not eat wild
game or fish. From these groups, 30 individuals who ate wild game or fish and 20 individuals who
did not eat wild game or fish were randomly selected from each of the sample populations (Table
4-2).

42
Table 4-2 Sampling Frame for Phase II study
Community Consumption Group Non-consumption Group Total
potentialparticipants
eligibleparticipants
potentialparticipants
eligibleparticipants
potentialparticipants
eligibleparticipants
Town of SwanHills
58 30 106 20 164 50
Surroundingareas
41 30 91 20 132 50
Total 99 60 191 40 296 100
A trained interviewer conducted a second telephone interview of these individuals during April,
1997. Verbal consent for participation in Phase II was obtained. Consenting individuals were
considered eligible participants and were informed about the sampling process, the volume of
blood required for chemical analysis and the specimen banking procedure.
Study Participants
Consent forms and a list of locations for providing a sample of blood were mailed out to eligible
participants. A total of 65 study participants contacted managers in the designated health care
centers during April and May of 1997. After the manager had discussed consent forms with them,
participants signed these forms under the manager’s witness, and blood samples were collected.
Sample collection took place at the following hospitals: Swan Hills General Hospital, Slave Lake
General Hospital, High Prairie Complex, Barrhead Hospital and Fox Creek Hospital.
Demographic characteristics of the participants are presented Table 4-3.
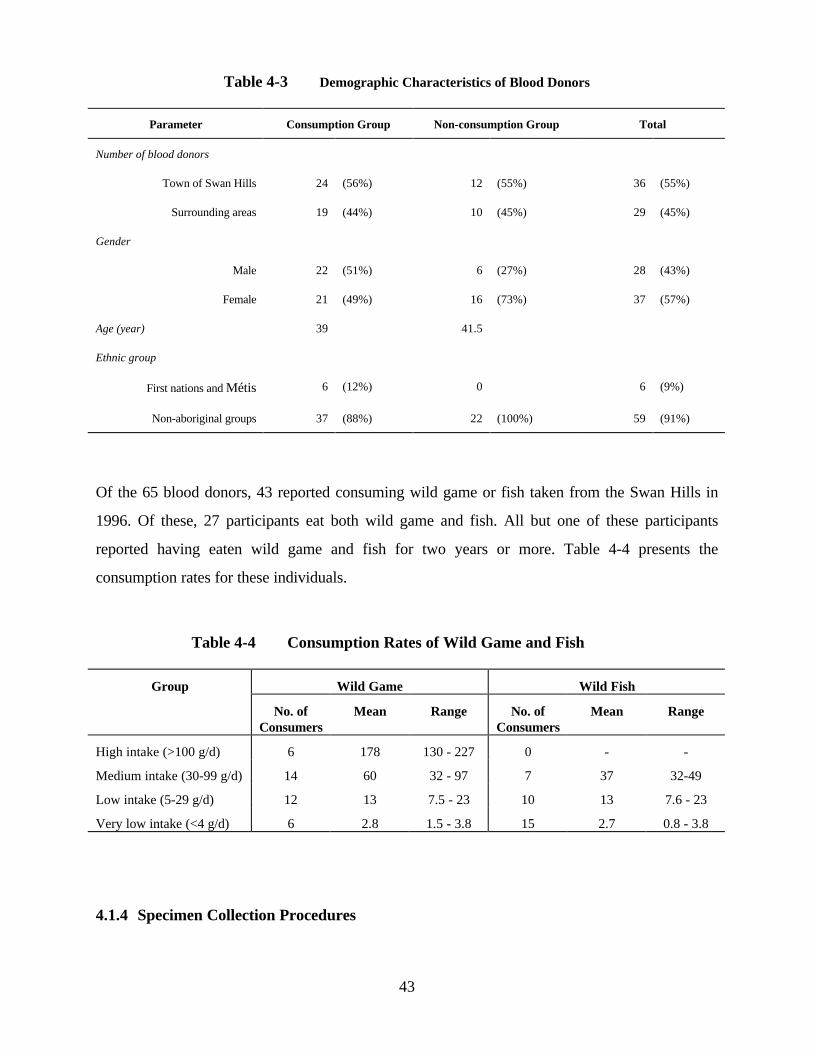
43
Table 4-3 Demographic Characteristics of Blood Donors
Parameter Consumption Group Non-consumption Group Total
Number of blood donors
Town of Swan Hills 24 (56%) 12 (55%) 36 (55%)
Surrounding areas 19 (44%) 10 (45%) 29 (45%)
Gender
Male 22 (51%) 6 (27%) 28 (43%)
Female 21 (49%) 16 (73%) 37 (57%)
Age (year) 39 41.5
Ethnic group
First nations and Métis 6 (12%) 0 6 (9%)
Non-aboriginal groups 37 (88%) 22 (100%) 59 (91%)
Of the 65 blood donors, 43 reported consuming wild game or fish taken from the Swan Hills in
1996. Of these, 27 participants eat both wild game and fish. All but one of these participants
reported having eaten wild game and fish for two years or more. Table 4-4 presents the
consumption rates for these individuals.
Table 4-4 Consumption Rates of Wild Game and Fish
Group Wild Game Wild Fish
No. ofConsumers
Mean Range No. ofConsumers
Mean Range
High intake (>100 g/d) 6 178 130 - 227 0 - -
Medium intake (30-99 g/d) 14 60 32 - 97 7 37 32-49
Low intake (5-29 g/d) 12 13 7.5 - 23 10 13 7.6 - 23
Very low intake (<4 g/d) 6 2.8 1.5 - 3.8 15 2.7 0.8 - 3.8
4.1.4 Specimen Collection Procedures

44
Study Group
Serum specimens were collected according to a standard protocol (Appendix J). Fifty ml of venous blood was
collected from each participant via venipuncture into five 10 ml-Red Top Vacutainers. The
specimens were allowed to clot for 30 minutes and then centrifuged for 15 to 20 minutes. Sera
were transferred with a glass pipette to an acetone-washed glass vial with a Teflon cap liner. All
serum specimens were packed with dry-ice and shipped to the MAXXAM Laboratory via next-
day courier on May 7-20, 1997. The completed consent forms and a copy of the shipping list were
mailed to Health Surveillance, Alberta Health.
Serum acidification was completed at the MAXXAM Laboratory. Five ml of serum without
acidification from each sample was transferred to a glass vial and shipped to the Toxicology
Laboratory in Calgary for specimen banking.
Control Group (Composite Samples)
The Canadian Red Cross Society undertook the pooled serum sample collection under a separate
protocol (Appendix K). Six composite samples were collected in Edmonton, Alberta. These
samples were formed from six age and gender specific groups: males aged 17-35, males aged 35-
55, males older than 55, females aged 17-35, females aged 35-55, and females older than 55. Each
composite sample contained 25 individual samples from individuals in the same age and gender
group for a total of 150 individual samples.
For each composite sample, 1 ml serum from each individual’s serum sample was transferred into
a clean vial, and an additional 1 ml serum was transferred into another vial labeled for the same
group. Each composite sample consisted of 2 vials containing 25 ml of serum. All specimens were
kept frozen prior to shipping to the laboratory. All specimens were packed with dry-ice and
shipped to MAXXAM Laboratory via next-day courier on May 23, 1997. The completed shipping
list was mailed to Alberta Health.
4.1.5 Laboratory Methods
The analytical methods were the same as those described in Section 3.1.5 with the exception of

45
lipid determination. Method detection limits were 0.03 µg/L for PCB congeners and 0.5 to 0.7 for
PCDD/Fs. Recovery rates of 44 PCB congeners for spiked blanks ranged from 77% to 122%.
Lipid content was determined by enzymatic methods in a clinical laboratory at the Alberta
University Hospital. The measured lipids included triglycerides and total cholesterol (expressed as
mmol/l). Total lipid concentration was calculated by summation of the amount of triglycerides and
total cholesterol. In these calculations, the average molecular weights of triglycerides and total
cholesterol were assumed to be 807 and 571 (Grimvall et al 1997). For instance, 1 mmol
triglycerides/liter serum equals 807 x 10-6 kg triglycerides/liter serum.
4.1.6 Data Analysis
Prior to analysis, summary measures for PCBs and PCDD/Fs were calculated. International TEFs
(WHO-IPCS for PCBs and NATO-CCMS for dioxins/furans) were used for calculating TEQ
values. The concentration of a congener below detection limits was assigned a value of 0 in
calculations. The summary measures included total PCB (summation of 44 congeners) and total
PCDD/F (summation of 17 congeners) across residence groups and wild game consumption
groups. The concentrations were reported in whole weight, lipid adjusted, and lipid adjusted TEQ
(PCBs plus PCDD/Fs).
Both non-parametric and parametric significance tests were performed to explore the relationships
between summary concentration measures, community of residence and wild game consumption.
Multiple linear regression analysis of summary measures in relation to age and sex were
conducted for the community samples and for the pooled blood samples. Exploratory analysis of
the pattern of congeners for PCB and PCDD/F was also undertaken.
4.2 Results
Means, medians and 90th percentiles for PCB and PCDD/F summary measures for the Swan Hills
and surrounding communities and the mean levels of PCBs and PCDD/Fs for the pooled blood
samples are shown in Table 4-5.

46
Table 4-5 Total PCB and PCDD/F Levels in Communities and Pooled Samples
Communities Pooled Samples
Parameter Mean Median 90th Percentile Mean
Total PCBa (µg/kg, whole weight) 0.14 0.06 0.29 0.16
Total PCBb (µg/kg, lipid weight) 31.07 10.01 55.99 32.90
Total PCDD/Fc (ng/kg, whole weight) 21.47 14.10 50.50 21.24
Total PCDD/F (ng/kg, lipid weight) 5112 2900 9668 4984
TEQ, PCB (ng/kg, lipid weight) 0.43 0.00 0.64 0.34
TEQ, PCDD/F (ng/kg, lipid weight) 18.30 8.96 38.65 14.36
Total TEQ (ng/kg, lipid weight) 18.73 8.96 39.29 14.70
a: total PCB is summation of 44 congener concentrations; b: average serum lipid content is 0.48%; c: totalPCDD/F is summation of 17 congener concentrations.
Statistical analysis revealed no statistically significant differences attributable to community of
residence or wild game consumption status on any of the summary variables. Similarly, there were
no significant differences between the target sample and the pooled blood samples levels on any
summary measures. Although the number of aboriginal participants was small, there is no
evidence to suggest that serum levels differ for this subgroup.
Regression analysis of the relationship between age and sex for summary measures were
conducted for the community samples and for the pooled samples separately. The pattern of
results is illustrated in Figure 4-2 and 4-3. In general, both PCB and PCDD/F measures showed
statistically significant increases with age. Sex differences were less stable but tended to show
relative elevations for males relative to females, most consistently for PCB measures.

47
Age in years
70605040302010
Tot
al P
CB
(µµ g
/L, w
hole
wei
ght)
.6
.5
.4
.3
.2
.1
0.0
-.1
Male
Female
Figure 4-2 Relationship between PCB levels & Age-gender for Community Sample
Age in years
70605040302010
TE
Q, P
CD
D/F
(ng
/kg,
lipi
d w
eigh
t)
140
120
100
80
60
40
20
0
-20
Male
Female
Figure 4-3 Relationship between PCDD/F levels & Age-gender for Community Samples

48
Appendix L presents the PCB and PCDD/F congener patterns for selected samples and sample
types in graphical form. An exploratory cluster analysis of these patterns isolated a small set of
profiles with a substantially different pattern, both in terms of the individual congeners isolated
and the levels of PCBs. Further examination of the phase II questionnaire data revealed that those
individuals were employees of the SHWTC.
4.3 Discussion
The average background blood levels of PCBs in the general population of Canada and U.S. in
the 1980s and 1990s ranged from non-detect to 7 µg/L (ppb) on a whole weight basis and from
non-detect to 330 µg/kg serum lipid (Table 4-6). In the scientific literature, the levels of dioxins
and furans in the blood are also reported as TCDD equivalents (TEQs) on a lipid basis. The
average background blood levels of dioxins/furans in the general population of Canada and U.S.
ranges between 20 and 40 pg TEQ/g serum lipid (ppt) (Table 4-7). An estimate of the total TEQ
value of dioxin-like compounds (PCBs, PCDDs and PCDFs) in the general population was
determined by the EPA to be between 40 and 60 pg/g serum lipid (EPA 1994). The EPA also
estimated that 10% of individuals may have three-fold higher levels compared to the average level
(EPA 1994). In Germany, the mean TEQ values in human blood decreased to 16.5 pg/g blood
lipid in 1996 from 43 pg/g reported for 1989. Although these estimates should be compared with
caution because of the different background exposures, laboratory analytical methods, and
quantitative methods, they can provide a context of background levels against which the estimates
derived from the Swan Hills samples can be considered.

49
Table 4-6 Average Levels of PCBs (µµg/kg or ppb) in Human Blood for Selected Nations
Location
Yearof
Study
Type ofsubjects
Type ofSpecimen
No. ofMeasuredCongener
Concentrationof Total PCBs(whole weight)
Concentrationof Total PCBs(lipid weight)
Reference
EastCanada
1994 generalpopulation
pooledplasma
30 - 300 Ryan et al1997
Quebec,CA
1989 generalpopulation
plasma(n=59)
7 - 239 Dewaillyet al 1994
Arcticcircum-polarcountries
1994-1996
indigenouspeople
maternalplasma
16-196 1.6 -14.8Aroclor 1260
- Muir 1997
Atlanta,U.S.
1988 generalpopulation
pooledserum
9 3.0 330 Pattersonet al 1994
U.S. generalpopulation
pooledwhole blood
17 - 123 Schecteret al1994a
CaliforniaU.S.
1982-1984
generalpopulation
plasma(n=738)
Aroclor1260
5.0 - Sahl 1985
Michigan,U.S.
1982-1989
generalpopulation
Serum(n=127)
Aroclor1260
6.8 - Hovingaet al 1993
Germany generalpopulation
blood(n=15)
12 - 740 Wuthe etal 1996
Sweden generalpopulation
plasma(n=123)
16 - 900 - 1 340 Svenssonet al 1995
Norway generalpopulation
whole blood(n=10)
20 - 1340 Johansenet al 1996
Canada &US
1980s people/workers(incidents)
serum Aroclor1254/1260
2 - 13 - Wolff &Schecter1992
Alberta,Canada(medicalguideline)
1994 workers inAlberta
blood - < 10 (noaction)
10-30 (action)
- AlbertaLabour1994

50
Table 4-7 Average Levels of PCDD/Fs (ng/kg or ppt) in Human Blood for Selected
Nations
Location Type of subjects Type of Specimen(number)
Concentration of TEQ,PCDD/Fs (lipid weight)
Reference
East Canada general population pooled plasma 18 - 21 Ryan et al 1997
Ontario, CA general population pooled plasma 25 - 37 Cole et al 1995
Ontario, CA sport fish consumers pooled plasma 21 - 41 Cole et al 1995
U.S. general population pooled whole blood 23 Schecter et al 1994a
U.S. general population pooled plasma 41 Schecter et al 1994b
U.S. general population serum 28 EPA 1991
Germany general population blood (n=15) 18 Wuthe et al 1996
Germany general population whole blood(n=100)
41 Päpke et al 1992
Germany general population whole blood(n=180)
16.5 Päpke et al 1997Schecter et al 1997
Sweden general population plasma (n=123) 37 - 54 Svensson et al 1995
Norway general population whole blood (n=10) 21 Johansen et al 1996
Vietnam general population pooled whole blood 12 - 49 Schecter et al 1994b
The results of the current study indicate that residents in Swan Hills and its surrounding areas
and residents in Edmonton have substantially lower PCB serum levels than do residents of
other jurisdictions, and have PCDD/F levels at the lower end of PCDD/F levels reported from
other jurisdictions. However, PCB and PCDD/F levels were positively correlated with age, as
was found by other studies. There was no significant association between wild game
consumption and blood levels of PCBs and PCDD/Fs in the sample population. It should be
noted that the total PCB levels reported for this study are based on a summation of 44 PCB
congener values and thus may underestimate levels obtained by different methods. Similarly,
the current study used 0 (‘zero’) as the value for non-detect samples rather than an estimate of

51
half of the method detection level. Because the detection limits were very low, using a value
equal to half the detection limit for samples where no contaminant was found would not
substantially change the current levels. However, if that method was used in studies with
larger detection limits, the reported levels would be higher than expected and the results would
not be comparable. In many Canadian studies (Derek Muir, personal communication), the
average PCB levels are about 1 to 1.5 µg/L whole weight when a total PCB level is calculated
based on comparison of peaks with Aroclor 1260. The correction factor between this method
and the current method is not known. As one component of the QA/QC protocol, it is planned
that an independent laboratory will reanalyze selected samples.
Blood levels of PCBs and PCDD/Fs frequently serve as surrogate measures for the individual’s
current level of exposure. The blood profile alone cannot be used to fully explain historical
exposures unless initial exposure and half-life elimination rates of contaminants are known.
The blood levels can be influenced by serum lipid content because these lipophilic
contaminants partition into serum lipid and adipose tissue.
A steady-state body burden in the general population represents the average background
exposures from all the environmental media at a given time. Background exposures in
industrialized nations mainly result from the food supply. In addition to the background
exposures, some individuals may be exposed to these contaminants from discrete sources
locally. Wild game consumers may not have eaten wild game meat contaminated with a high
level of chemicals because the contamination was unevenly distributed in deer and moose in
the vicinity of the facility. Furthermore, the blood levels might not reflect such a short-term
exposure to PCBs and PCDD/Fs.
Relatively high levels of PCB congeners 153 and 138 and of Octa-CDD were observed in this
study. This observation was also reported for the general populations in other studies (Feeley
1995). Serum levels reported in this study most likely reflect typical exposures, without
distinguishing discrete sources and pathways. In order to track down the specific exposures for
other individuals having unusual patterns of specific congeners, more detailed information such
as dietary habits and occupational histories would need to be collected.
52
Two comprehensive reviews of the scientific literature related to human exposure to PCBs
revealed that no well-established overt adverse health effects were observed from lower levels
of exposure [Kimbrough 1995; Swanson et al 1995]. However, in recent years, scientists have
begun investigating subtle effects which may arise in response to low levels of PCB exposure.
For PCDD/Fs, there is evidence that high-level exposure is associated with a variety of
adverse human health effects [DeVito et al 1995]. However, whether the background exposure
is associated with adverse effects remains to be determined.
In an occupational setting, the maximum allowable concentration of PCBs blood level is higher
than typical background levels. The medical guideline for PCBs required by Alberta Labour is
less than 10 µg/kg (ppb) in blood for occupational exposures, a level met by BOVAR
employees tested in this study.
4.4 Conclusion
Overall, the assessment of human blood serum from residents of Swan Hills and the
surrounding communities found that: a) Human blood serum levels of PCBs and PCDD/Fs for
study participants were below the levels reported in other jurisdictions, but follow similar age and
gender patterns; b) Human blood serum levels of PCBs and PCDD/Fs for residents of Swan Hills
and its surrounding communities did not exceed the levels found in Edmonton residents; and c)
No differences were observed between individuals who consumed wild game and fish from the
Swan Hills area and those who did not. This does not mean that individuals should feel free to
consume wild game captured in the Swan Hills area; rather, individuals should still observe the
Public Health Advisory regarding wild game consumption which suggests limits for rates of
consumption and advises against consumption for particular groups.

53
5. DIET AND ACTIVITY SURVEY
The purpose of the diet and activity survey was to obtain accurate information on the dietary habits and activities
of individuals living in the Swan Hills and surrounding areas.
5.1 Materials and Methods
As part of the human blood sampling study, a diet and activity survey was conducted through telephone interviews
during March and April 1997. The survey was divided into two phases. Questionnaires are presented in
Appendices M, N, and O. Eighty-eight percent (327) of 370 respondents participated in the first telephone
interview. A second telephone interview was then conducted with 100 participants selected from those who had
participated in the first telephone interview as described in the Human Blood Monitoring section.
Participants were asked to recall their consumption of wild game and fish and their outdoor recreational activities
for the previous 12 months. Specifically, the initial survey was used to determine types of outdoor activities within
the Swan Hills area; frequency, duration and amount of wild game and fish consumption; and the respondents’
awareness of and adherence to the existing health advisory.
The second survey requested demographic characteristics (age, gender, ethnic group, weight and height,
occupation, duration of residency, number of persons in the household); proportion of activity time spent indoors
and outdoors and detailed information about outdoor activities; detailed information about daily food consumption
including consumption of wild game, fish and wild fruit, vegetables and herbs, and cooking and preparation
techniques for wild game and fish; and more detailed information about lifestyle (use of alcohol and cigarettes,
health conditions and perception of the current health advisory).
For wild game and fish consumers, the typical meal size was obtained by comparison to a 4 oz portion of meat.
When participants estimated their meal size as less than 4 oz, a 2 oz size was assumed. When participants
estimated their meal size as greater than 4 oz, an 8 oz size was assumed.
In order to control the quality of the survey, similar questions on wild game consumption rate were presented in the
initial and second questionnaires. In the second questionnaire, different species such as deer, moose, elk and bear
were separately listed (rather than giving a general term “wild game”). The recall bias can be examined by
comparison of reported consumption rates in these two questionnaires. When the reported rates were not
consistent, the rates from the second questionnaires were used in analysis.

54
5.2 Results
5.2.1 Outdoor Activities and Diet
5.2.1.1 Outdoor Activities
The proportion of individuals who participated in outdoor activities in the Swan Hills area is summarized in Table
5-1. Twenty to forty percent of the respondents engaged in various recreational activities in the Swan Hills area
during 1996. Fishing, hiking and camping were the most popular activities.
Most participants brought drinking water from home or from taps/pumps to the activity sites. A few participants
took drinking water directly from lakes or rivers without filtering or boiling it. Some individuals ate wild berries
(blueberry, huckleberries and raspberries) picked from the Swan Hills area.
Table 5-1 Summary of Outdoor Activities in the Swan Hills Area
Parameters Town of Swan Hills (n=172) Surrounding areas (n=155) Total (n=327)
Hunting 34 (20%) 24 (15%) 58 (18%)
Trapping 2 (1%) 0 2 (0.6%)
Fishing 65 (38%) 48 (31%) 113 (35%)
Swimming 53 (31%) 41 (26%) 94 (29%)
Hiking 89 (52%) 41 (26%) 130 (40%)
Camping 88 (51%) 55 (35%) 143 (44%)
Canoeing 48 (28%) 26 (17%) 76 (23%)
Snowmobiling 56 (33%) 27 (17%) 83 (25%)
5.2.1.2 Wild Game Consumption
A total of 123 (38%) respondents had consumed wild game taken from the Swan Hills area (Table 5-2). Of these,
90% indicated they have consumed wild game meat for two years or more. Based on the reported consumption
rates, four consumption categories were identified: high intake (>100 grams per day [g/d]), medium intake (30-99
g/d), low intake (5-29 g/d) and very low intake (<4 g/d) (Table 5-3). The results correspond well to those based on
daily, weekly, monthly and yearly categories presented in the interim report (Alberta Health May, 1997). The
distribution of participants across the four categories is illustrated in Figure 5-1. Moose, deer and grouse are the
most common wild game for consumption. Some participants indicated they also eat elk, bear, duck, and rabbit.

55
Table 5-2 Proportion of Individuals Consuming Wild Game From the Swan Hills Area
ParametersTown of Swan Hills
(n=172)Surrounding areas
(n=155)Total
(n=327)
Individuals ever consumed wild game 75 (44%) 48 (31%) 123 (38%)
Individuals consumed both wild game/ fish 46 (27%) 34 (22%) 80 (24%)
Individuals only consumed wild game 29 (17%) 14 (9%) 43 (13%)
Duration of wild game consumption
less than 1 year - - 11 (9%)
2 to 5 years - - 26 (21%)
more than 5 years - - 86 (70%)
Table 5-3 Wild Game Consumption Rate (g/d)
Group Mean SD 95% CI Median Range Mean a
High Intake-muscle (>100) 191 47 162-220 227 130-227 210 (daily)
Medium Intake-muscle (30-99) 58 26 48-67 49 30-97 60 (weekly)
Low Intake-muscle (5-29) 13 6 1.87-12 13 7.5-23 12 (monthly)
Very Low Intake-muscle (<4) 2 0.98 1.95-2.54 1.71 0.3-3.8 2 (yearly)
Average Intake-liver 2 0.8 1.26-2.66 1.83 1.83-3.06 2 (yearly)a: mean reported in the interim report May, 1997 by Alberta Health based on daily, weekly, monthly and yearly categories.

56
high intake 8%
medium intake25%
low intake 31%
very low intake 36%
Figure 5-1 Proportion of Four Wild Game Consumption Groups
5.2.1.3 Fish Consumption
A total of 127 (39%) respondents indicated that they ate wild fish taken from the lakes surrounding the Swan Hills
area (Table 5-4). Of these, 98% have eaten wild fish for two years or more. Four fish consumption groups (high,
medium, low and very low) were identified (Table 5-5). The distribution of participants across the four
consumption groups is illustrated in Figure 5-2. The most commonly consumed species were walleye, northern
pike, perch, brook trout, lake whitefish and arctic grayling. The most popular fishing sites were Chrystina Lake,
Roche Lake, Edith Lake, Freeman Lake and Lesser Slave Lake. The most common cooking methods were frying
and baking.
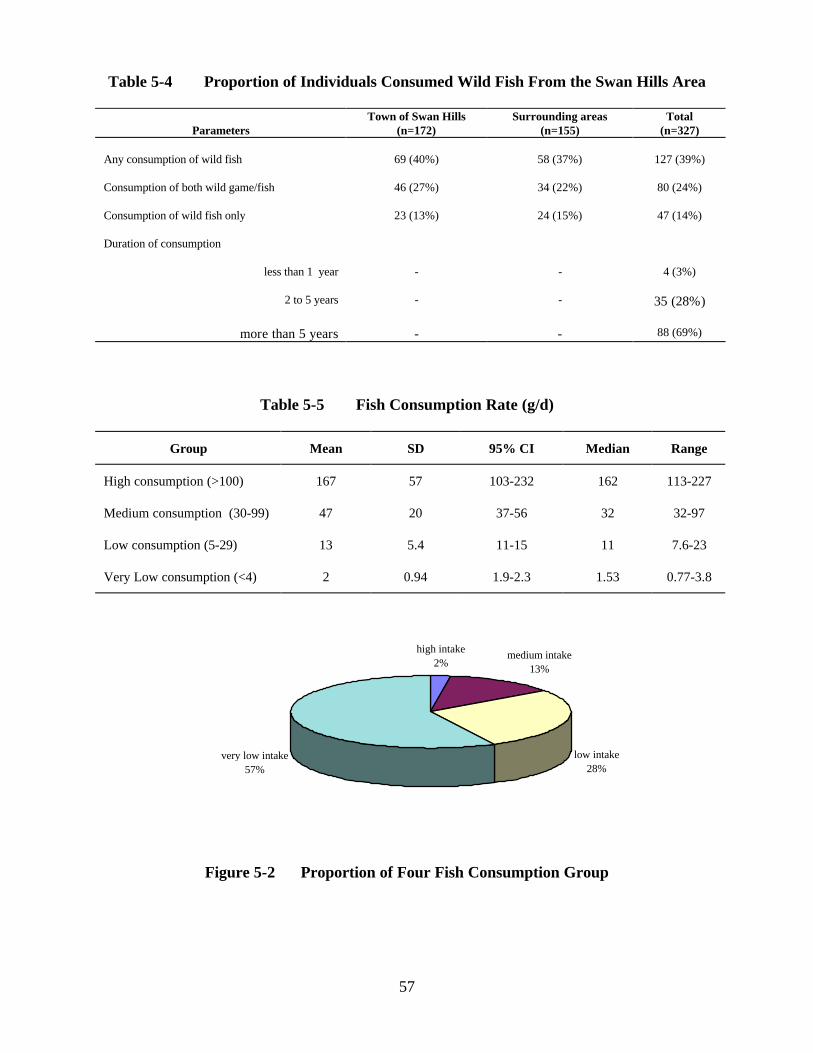
57
Table 5-4 Proportion of Individuals Consumed Wild Fish From the Swan Hills Area
ParametersTown of Swan Hills
(n=172)Surrounding areas
(n=155)Total
(n=327)
Any consumption of wild fish 69 (40%) 58 (37%) 127 (39%)
Consumption of both wild game/fish 46 (27%) 34 (22%) 80 (24%)
Consumption of wild fish only 23 (13%) 24 (15%) 47 (14%)
Duration of consumption
less than 1 year - - 4 (3%)
2 to 5 years - - 35 (28%)
more than 5 years - - 88 (69%)
Table 5-5 Fish Consumption Rate (g/d)
Group Mean SD 95% CI Median Range
High consumption (>100) 167 57 103-232 162 113-227
Medium consumption (30-99) 47 20 37-56 32 32-97
Low consumption (5-29) 13 5.4 11-15 11 7.6-23
Very Low consumption (<4) 2 0.94 1.9-2.3 1.53 0.77-3.8
high intake 2%
medium intake13%
low intake 28%
very low intake 57%
Figure 5-2 Proportion of Four Fish Consumption Group

58
5.2.2 Additional Information from Questionnaire 2
5.2.2.1 Demographic Information
The demographic characteristics of the 100 individuals who participated in the second telephone interview are
summarized in Table 5-6. Participants were grouped into a wild game/fish consumption group if they had
consumed any wild game or fish during 1996; otherwise they were classified into the non-consumption group.
About 55% of the wild game/fish consumption group were male while about 77% of the non-consumption group
were female. The average duration of residence was 12.5 years for participants in the Swan Hills area and 15.5
years for participants in the surrounding areas. Five First Nations and six métis individuals were included in the
consumption group. In the consumption group, 47% of participants in the Swan Hills and 20% in the surrounding
areas work outdoors in occupations such as oil and gas operator and truck driver. In the non-consumption group,
over 85% participants work in indoor occupations such as clerk in a grocery store, teacher and secretary. In the
consumption group, 60% of respondents in the Swan Hills area and 23% of respondents in the surrounding areas
had smoked cigarettes.
Respondents reported a variety of illnesses, but there was no consistently reported diagnosis or group of diagnostic
categories. Overall, 20% of the respondents in the consumption group reported a diagnosis of a chronic illness,
while 25% of the non-consumption group reported having a diagnosis of a chronic illness. In the consumption
group, two participants had ovarian cancer, two participants had heart conditions and one
participant had high cholesterol. Other chronic diseases mentioned included: bronchitis,
diabetes, gout, stroke, anaemia, hiatus hernia, and rheumatoid arthritis. In the non-consumption
group, participants reported various health problems such as thyroid, skin and cervical cancer, over-
stimulated thyroids, under-stimulated thyroid, high blood pressure, ulcerative colitis, adrenal
gland disorders, asthma, allergies and liver problems (high gamma - glutamyl transpeptidase
(GGTP)).

59
Table 5-6 Demographic Characteristics of Participants
Consumption Group Non-Consumption GroupParameter Swan Hills
(n=30)Surrounding areas
(n=30)Swan Hills
(n=20)Surrounding areas
(n=20)
Gender (number)male 17 (57%) 16 (53%) 4 (20%) 5 (25%)
female 13 (43%) 14 (47%) 16 (80%) 15 (75%)
Age (year) 37 39 40 41
Duration of Residence(year)
13 17 12 14
Body weight (kg) 79 81 71 73
Ethnic group (number)Caucasian 25 23 20 18
First Nations 1 4 - 1Μétis 3 3 - -
East Indian - - - 1Unknown 1 - - -
Family size (number) persons in one
household (range) 4 (1-7) 3 (1-7) 4 (1-6) 3 (1-6)children in one
household (range) 1 (0-5) 1 (0-5) 1 (0-4) 1 (0-4)
Occupation (number)indoor worker [>75%
time] 16 (53%) 24 (80%) 17 (85%) 19 (95%)outdoor worker [>35%
time] 14 (47%) 6 (20%) 3 (15%) 1 (5%)
Use of alcohol (number)ever 21 (70%) 21 (70%) 15 (75%) 14 (70%)
never 9 (30%) 9 (30%) 5 (25%) 6 (30%)
Cigarette smoking (number)ever 18 (60%) 7 (23%) 8 (40%) 7 (35%)
never 12 (40%) 23 (77%) 12 (60%) 13 (65%)

60
5.2.2.2 Consumption of Food from Markets
The rate of consumption of various food items obtained from commercial sources reported by
participants in the second telephone interview are presented in Table 5-7.
Table 5-7 Consumption Rates for Commercially Available Food Items
Food itemWild game
consumptiongroup (n=60)(g/person/day)
Non-wild gameconsumptiongroup (n=40)(g/person/day)
Food itemWild game
consumptiongroup
(g/person/day)
Non-wildgame
consumptiongroup
(g/person/day)
Ground beef 38 46 Margarine 20 19
Roast beef 10 14 Cheese 33 25
Beef steak 20 21 Cheese spread 6.9 3.3
Fresh pork 11 23 Cottage cheese 2.9 2.8
Poultry 20 39 Ice cream 32 29
Canned fish 15 10 Cream 14 7.8
Eggs 46 34 Shellfish 1.5 5.4
Butter 4.4 6.8 Fresh waterfish
3.0 5.2
5.3 Discussion
Because wild game meat and local fish are not a regular part of the diet for most residents in
the Swan Hills and surrounding areas, a 12-month recall questionnaire was used. Only five out
of 100 respondents provided different wild game consumption rates in the second questionnaire
than they reported in the initial questionnaire. The reported consumption rates are therefore
considered to be reliable.

61
The estimated daily intake varies with the consumption rate and body weight across
individuals. The average consumption rate was 35 grams/day of wild game and 15 grams/day
of fish. A small proportion of consumers eat a relatively large quantity of local wild game and
fish. Aboriginal people may have higher rates of consumption of food from local sources,
though specific data for aboriginal people living in Swan Hills and surrounding areas are not
available. The results from a study conducted for the NRBS Study indicated that people who
eat fish in the Northern River Basin area consume an average of 13.6 kg of fish per year (37
g/d) (MacLock and Thompson 1996). About two-thirds of people who fish in Northern Alberta
consume less than 10 kg of fish per year and 3% eat more than 100 kg of fish per year.
Another study reported that consumption rates for Native Canadians near Wood Buffalo
National Park were 55 g/d for wild meat and bird and 14 g/d for locally caught fish (Wein et
al. 1991). The 95th percentile of consumption rates were 175 g/d for meat and birds and 39 g/d
for fish. These respondents indicated that they ate locally caught or killed food more than 6
times per week. The average and high-end consumption rates are close to the survey data
reported by the participants from Swan Hills and the surrounding areas.
The current survey data indicated that meat from commercial markets is the primary food for
local residents. This observation is consistent with findings from the National Total Diet
survey (Conacher et al. 1989). In Canada, fresh meat products from commercial markets
contribute 90% of the total intake of PCBs and dioxins/furans (Birmingham et al. 1989;
Davies 1989; Mes et al. 1989; Gilman et al. 1991; Conacher and Mes 1993; Ryan et al.
1997). Thus, the primary dietary source of these contaminants for local residents may be daily
consumption of meat from commercial markets.
5.4 Conclusion
About forty percent of local residents consume local wild game and fish although the amount
varies considerably. Only a small portion of the residents consume large quantities of local wild
game and fish.

62
6. ESTIMATION OF DAILY INTAKE AND EXPOSURE RATIO
The purpose of estimating daily intake is to assess exposure levels resulting from consuming contaminated wild
game and fish. The resulting estimates can be compared to existing guidelines.
6.1 Estimation of Average Daily Intake
Assessment of human exposure to PCBs, PCDDs and PCDFs by consumption of wild game and fish requires
translating concentrations of the contaminants into quantities of the contaminants that come in contact with an
individual within the exposed population. Average daily intake (ADI) from wild game and fish consumption
represents the amount of a contaminant per unit of body weight per day that crosses the mouth of an exposed
individual and reaches the surface of the gastrointestinal tract.
6.1.1 Development of Exposure Scenario
According to their consumption frequency, people who eat locally caught wild game and fish were divided into
four groups: high, medium, low and very low intake (see Section 5.2.1). The concentrations of total PCB and total
TEQ, PCDD/Fs and coplanar PCBs at the 50th and 90th percentile in different types of meat samples were
calculated, using AEMPIRICAL methods (Table 6-1). For fish samples, the 90th percentile concentrations
and means for contaminants for fish in Roche and Chrystina Lake were estimated (Table 6-2).
Because all analyses were performed on composite samples, the distribution of contaminants in
individual fish is not known. For the current purposes, this distribution was assumed to be normal.
The variability of the contamination distribution was estimated from the variability between the
composite samples using assumptions derived from the central limit theorem.
Exposure scenarios were developed as follows:
• Exposure Scenario 1A (ES 1A): exposure to 90th percentile concentration of total PCB in fresh deer
muscle;
• Exposure Scenario 1B (ES 1B): exposure to 50th percentile concentration of total PCB in fresh deer
muscle;
• Exposure Scenario 1C (ES 1C): exposure to 90th percentile concentration of total TEQ, PCDD/F +
coplanar PCB in fresh deer muscle;

63
• Exposure Scenario 1D (ES 1D): exposure to 50th percentile concentration of total TEQ, PCDD/F +
coplanar PCB in fresh deer muscle.
• Exposure Scenario 2A (ES 2A): exposure to 90th percentile concentration of total PCB in fresh deer liver;
• Exposure Scenario 2B (ES 2B): exposure to 50th percentile concentration of total PCB in fresh deer liver;
• Exposure Scenario 2C (ES 2C): exposure to 90th percentile concentration of total TEQ, PCDD/F +
coplanar PCB in fresh deer liver;
• Exposure Scenario 2D (ES 2D): exposure to 50th percentile concentration of total TEQ, PCDD/F +
coplanar PCB in fresh deer liver.
• Exposure Scenario 3A (ES 3A): exposure to 90th percentile concentration of total PCB in freezer muscle;
• Exposure Scenario 3B (ES 3B): exposure to 50th percentile concentration of total PCB in freezer muscle;
• Exposure Scenario 3C (ES 3C): exposure to 90th percentile concentration of total TEQ, PCDD/F +
coplanar PCB in freezer muscle;
• Exposure Scenario 3D (ES 3D): exposure to 50th percentile concentration of total TEQ, PCDD/F +
coplanar PCB in freezer muscle.
• Exposure Scenario 4A (ES 4A): exposure to 90th percentile concentration of total PCB in fish muscle from
Chrystina Lake and Roche Lake;
• Exposure Scenario 4B (ES 4B): exposure to mean concentration of total PCB in fish muscle from
Christina Lake;
• Exposure Scenario 4C (ES 4C): exposure to 90th percentile concentration of total TEQ, PCDD/F + PCB in
fish muscle from Chrystina Lake and Roche Lake;
• Exposure Scenario 4D (ES 4D): exposure to mean concentration of total TEQ, PCDD/F + PCB in fish
muscle from Chrystina Lake.

64
Table 6-1 Levels of PCBs and PCDD/Fs in Fresh and Freezer Meat from Swan Hills
Muscle LiverParameter 50th percentile 90th percentile 50th percentile 90th percentile
Fresh Meat
Total PCB (µg/kg or ppb) 6.5 73 71 144
Coplanar PCB, TEQ (pg/g or ppt) 1.76 63.2 60 130
PCDD/Fs, TEQ (pg/g or ppt) 0.64 3.8 190 1600
Total TEQ (pg/g or ppt) a 2.4 67 250 1730
Freezer meat
Total PCB (µg/kg or ppb) - 42.2 - -
Coplanar PCB, TEQ (pg/g or ppt) - 13.93 - -
PCDD/Fs, TEQ (pg/g or ppt) - 0.07 - -
Total TEQ (pg/g or ppt) a - 14.0 - -a: Total TEQ = PCDD/Fs, TEQ + coplanar PCB TEQ (No.77 and No.126 congeners)
Table 6-2 Concentrations of PCBs and PCDD/Fs in Fish Muscle from Swan Hills
Parameter Chrystina Lake Roche Lake
90th
percentile
mean 90th percentile mean
Total PCB whole weight µg/kg 36.2 17.85 4.1 -
Total TEQ whole weight pg/g 28.7 12.41 1.5 -

65
6.1.2 Definition and Documentation of Parameters
Average daily intake was calculated as follows:
ADI = C * IR * CF* ED * BF/BW * AT (6-1)
Body weight is an important parameter in estimating daily intake. A default value of 60 kg
body weight was used by Health Canada to establish guidelines for levels of PCBs and
dioxins/furans in food. However, the average body weight for adults in Alberta is about 73 kg
based on 1994 National Population Health survey. The average body weight in the current
survey ranges from 72 kg for non-consumption group to 80 kg for the consumption group. The
Alberta average body weight was adopted for risk assessment in the current study. The
definitions for each parameter in this equation are summarized in Table 6-3.

66
Table 6-3 Definition of Parameters in the Daily Intake Equation
Parameter Specific Definition Unit
ADI = daily intakeLADI = lifetime averagedaily intake
average potential dose of PCBs and total TEQ,PCDD/Fs + PCBs received by an individual throughwild game consumption at units of microgram of thechemicals per day, normalized over body weight (bw)and averaged exposure time (or lifetime for PCDD/Fs)
µg PCB/kg bw/daypg TEQ/kg bw/day
C = concentration of acontaminant
concentrations of total PCB, or total TEQ, PCDD/F +PCB directly measured in tissues (wet weight, ww)
µg PCB/kg wwpg TEQ/kg ww
IR = ingestion rate average amount of each food item consumed by anindividual per day.
kg/day
CF = contact fraction the distribution of total contact rate betweencontaminated and uncontaminated tissue. For the worstcase scenario, all tissues are assumed to becontaminated with PCBs and PCDD/F.
1.0
ED = exposure duration the overall time period of exposure (length of time forconsuming contaminated meat).
Year
BF = bioavailabilityfactor
absorption fraction. Both PCBs and PCDD/Fs wereobserved to be efficiently absorbed through oralexposure in infants and experimental animals.
1.0
BW = body weight average body weight for Albertans at age of 20+
(source: NPHS 94-95, Statistic Canada)73 kg (SD=12)
AT = average ofexposure time period
average days of the overall time period of exposure.
average lifetime exposure days are derived from lifeexpectancy in Alberta (source: Alberta Health, HealthSurveillance)
year
78 years

67
6.1.3 Estimated Daily Intake
The estimated daily intakes (EDI) of total PCBs and total TEQ, PCDD/Fs + PCBs were
calculated, using equation 6-1, for fresh deer muscle (Table 6-4), fresh deer liver (Table 6-5),
freezer meat (Table 6-6) and fish muscle (Table 6-7).
Table 6-4 Estimated Daily Intake of PCBs, PCDD/Fs in Fresh Deer Muscle
Consumption Group High Medium Low Very LowConcentration 50th 90th 50th 90th 50th 90th 50th 90th
Total PCB (µg/Kg/d) .02 .2 .005 .06 .001 .01 .0002 .002
Planar PCB TEQ (pg/Kg/d) 4.5 165 1.5 50 .3 11 .05 1.7
PCDD/F TEQ (pg/Kg/d) 1.7 10 .5 3 .1 .7 .02 .1
Total TEQ (pg/Kg/d) 6.2 175 2.0 53 .4 12 .07 1.8
Table 6-5 Estimated Daily Intake of PCBs, PCDD/Fs In Fresh Deer Liver
Parameter 50th percentile concentration 90th percentileconcentration
Total PCB (µg/Kg/d) .002 .004
Planar PCB TEQ (pg/Kg/d) 1.6 3
PCDD/F TEQ (pg/Kg/d) 5.2 44
Total TEQ (pg/Kg/d) 6.8 47
Table 6-6 Estimated Daily Intake of PCBs, PCDD/Fs in Freezer Muscle
Consumption Group High Medium Low Very LowConcentration 50th 90th 50th 90th 50th 90th 50th 90th
Total PCB (µg/Kg/d) 7-4 .12 2-4 0.03 4-5 .007 7-6 .001
Planar PCB TEQ (pg/Kg/d) - 40 - 11.4 - 2.3 - .38
PCDD/F TEQ (pg/Kg/d) - .2 - .1 - .02 - .002
Total TEQ (pg/Kg/d)a - 40.2 - 11.5 - 2.3 - .38

68
Table 6-7 Estimated Daily Intake of PCBs, PCDD/Fs in Fish Muscle
Consumption Group High Medium Low Very Low
Concentration mean 90th mean 90th mean 90th mean 90th
Chrystina Lake
Total PCB (µg/Kg/d) .04 .08 .01 .02 .003 .007 .0005 .001
Total TEQ (pg/Kg/d) 28 66 8 18 2.2 5.1 .3 .8
Roche Lake
Total PCB (µg/Kg/d) - .01 - .003 - .001 - .0001
Total TEQ (pg/Kg/d) - 3.4 - .96 - .27 - .04
6.2 Quantitative Estimates of Risk - Exposure Ratio
The process for quantitative estimates of risk arising from consumption of contaminated wild
game and fish requires the combination of the information on estimated exposure (i.e.
estimated daily intake, EDI) with the information on dose-response (i.e. tolerable daily intake,
TDI) to set safety margins for exposure to PCBs, PCDDs and PCDFs. Estimates of risk are
expressed as an exposure ratio (ER).
6.2.1 Selection of the Existing Guidelines
The Health Canada Guidelines for PCBs and TCDD in food were established in the 1970s based not only on
toxicity data but also on food distribution in Canadian markets and national consumption patterns at that time
(Table 6-8). The guidelines are appropriate to commercial food such as beef, dairy products, eggs, poultry and
fish. Administrative guidelines for PCB mixtures are under review by Health Canada.

69
Table 6-8 Health Canada Guidelines/Tolerances for PCBs and TCDD in Foods
Chemicals Food Item Value
PCB Meat/Beef/Dairy products (fat basis) 200 ppb a
Egg (whole egg less shell basis) 100 ppb a
Poultry (fat basis) 500 ppb a
Fish (edible portion) 2 000 ppb a
TCDD Fish (edible portion) 20 ppt a
TEQ, PCDD/F Fish (edible portion, muscle) 15 ppt (40 g/d, 60 kg body weight)
Fish (viscera) 30 ppt (20 g/d, 60 kg body weight)
a: under review
In order to estimate risk arising from consuming local wild game containing PCBs and PCDD/Fs, relevant
guidelines that were established based on different health outcomes by a variety of regulatory agencies were
examined (Table 6-9). The guideline values range from 0.01 pg/kg/ to 10 pg/kg/d for TCDD and from 0.02
µg/kg/d to 1 µg/kg/d for PCBs. For TCDD, the Health Canada Tolerable Daily Intake (TDI) refers to a lifetime
dose through all exposure routes. Exposure to PCBs and PCDD/Fs in food accounts for 90% of total human
exposure in Canada [Birmingham et al 1989; Davies 1990; Gilman et al 1991]. The TDI for PCBs
proposed by Health Canada was established based on overt human effects and is currently under review. A
reference dose (RfD) proposed by USEPA and a minimal risk level (MRL) proposed by USATSDR for PCBs
were established on the basis of reproductive and immune effects. To provide insight into the potential
health risk posed from exposure to PCB mixtures, three PCB guidelines (as proposed by Health
Canada, USEPA and USATSDR) were used to calculate exposure ratios. For estimating exposure
ratio for PCDD/Fs, the Health Canada TDI for TCDD was adopted.

70
Table 6-9 Summary of TDI and RfD/RSD for PCB and TCDD
Agency Chemical Method Species End-pointNOAEL or
CPFUF orCA Dose
Health Canada TCDDa NOAEL-UF
femaleratb
malignanttumor inliver, lung,nasopharynx
1 ng/kg/d 100 10 pg/kg/d
(TDI) c
USEPA TCDD LMS same asabove
same asabove
1x 10⁻⁴ 0.01 pg/kg/d(RSD)
USFDA TCDD LMS same asabove
same asabove
1.75E4mg/kg/d
1x 10⁻⁶ 0.57 pg/kg/d
(TDI)
Netherlands TCDD NOAEL-UF
rhesusmonkeyd
cognitivedevelopment
100 pg/g 100 1 pg/kg/d
(TDI)
Health Canadaand USFDA
PCB
(Kane-chlor 400)
NOAEL-UF
humane chloracne,other signs/
symptoms
10 µg/kg/df 10 1 µg/kg/d
(TDI)
USEPA PCB(Aroclor1016 /1248)
NOAEL-UF
rhesusmonkeyg
reduced birthweight
0.007mg/kg/d
100 0.07 µg/kg/d
(RfDoral)
ATSDR PCB(Aroclor1254)
NOAEL-UF
femalerhesusmonkeyh
reduction inserum IgMand IgG
0.005mg/kg/d
LOAEL
300 0.02 µg/kg/d
(MRLoral)i
a: TDI of TCDD can apply to PCDD/PCDF and coplanar PCB;b: Kociba et al. 1978;c: lifetime exposure such as 70 years;d: Bowmen et al. 1989;e: Karatsune and Fukoka, 1971; Federal Register 38(129), July 6, 1973;f: NOAEL 10 µg/kg/d is based on Yusho data (200 µg/kg/d actual 50 day exposure) assuming 1000 dayexposure;g: Barsotti and van Miller, 1984; Levin et al., 1988; Schantz et al. 1989;h: Tryphonas et al. 1989, 199;i: minimal risk level for chronic-duration oral exposure (365 days or more)NOAEL= no-observed-adverse-effect-level;LOAEL= low-observed-adverse-effect-level;UF= uncertainty factor;CPF= cancer potency factor; CA= cancer risk;LMS = linearized multistage model;RfD=reference dose,TDI=tolerable daily intake;RSD=risk specific dose;MRL=minimal risk level

71
6.2.2 Point Estimates
The exposure ratio reflects the ratio between the actual level of exposure (external dose) in a
particular circumstance and a reference standard associated with observed toxicity in humans
or animals.
Point estimates are most commonly used in risk assessment for reasons of simplicity,
accessibility and acceptance by most regulatory agencies. Point estimates are determined by
assigning a single default value that would represent an average value or a high-end (worst-
case) value to each exposure model parameter in each exposure scenario In the past decades,
regulation and decision making in environmental health has relied on the simple point
estimates, including fractile-based summary (50th or 95th percentile) and the mean and variance
of the distribution with a statement of the potential for bias in these estimates. In order to be
conservative, the “worst case” or upper bound estimates are generated when the input
parameters are set at worst values. In many cases, uncertainty assessment is only a qualitative
statement of confidence in the results. When many conservative factors are involved in the
analysis, the risk estimates can be higher than those that are intended for risk management.
The limitations of this approach include: (1) bias in the estimates away from mean values; (2)
limited information about the degree of conservatism in risk assessment; (3) major sources of
uncertainty remain unidentified; (4) results of sensitivity analyses are less meaningful; and (5)
explicit indications are not provided for decision makers and the public.
Exposure ratios based on regulatory guidelines (TDI) were calculated by using the following
equation:
ER= EDI/TDI (6-2)
The TDI for PCBs is 1 µg/kg/d. From a public health perspective, an oral reference dose
proposed by USEPA (0.07 µg/kg/d) and a minimal risk level proposed by USATSDR
(µg/kg/d) were selected for comparison. The TDI for TCDD proposed by Health Canada is 10
pg/kg/d.

72
6.2.1.1 Fresh and Freezer Meat
The resulting estimates of exposure ratios were tabulated for fresh deer muscle (Table 6-10),
fresh deer liver (Table 6-11), and freezer muscle (Table 6-12).
The exposure ratios for all consumption groups are less than 1.0 as compared to all the
guidelines at the 50th concentration percentile of total PCBs. At the 90th concentration
percentile, in both fresh and freezer muscle, the estimated daily intakes for the high
consumption group exceed the USEPA and USATSDR standards. At the 90th percentile, the
estimated daily intake for the medium consumption group exceeds the USATSDR standard. At
the 90th concentration percentile of total TEQ, PCDD/F + PCBs, the estimated daily intake
for high and medium muscle consumption groups and the liver consumption group exceeds the
Health Canada TDI value.
Table 6-10 Exposure Ratios for Consuming Fresh Deer Muscle
Consumption Group High Medium Low Very LowConcentration 50th 90th 50th 90th 50th 90th 50th 90th
Guideline
HC and FDA - PCB .02 .2 .005 .06 .001 .01 .0002 .002
EPA - PCB .2 3 .07 .8 .01 .2 .003 .03
ATSDR - PCB 0.9 10 .25 3 .05 .7 .01 .1
HC - TCDD .6 18 .2 5 .04 1 .007 .2

73
Table 6-11 Exposure Ratios of PCBs, PCDD/Fs for Consuming Fresh Deer Liver
Guidelines 50th Percentile concentration90th Percentileconcentration
HC and FDA - PCB .002 .004
USEPA - PCB .03 .06
USATSDR - PCB .1 .2
HC - TCDD .7 4.7
Table 6-12 Exposure Ratios for Consuming Freezer Muscle
Consumption group High Medium Low Very LowConcentration 50c 90c 50c 90c 50c 90c 50c 90c
HC and FDA - PCB 7-4 .1 2-4 .03 4-5 .007 7-6 .001
USEPA - PCB .01 1.6 .003 .5 6-4 .1 1-4 .02
USATSDR - PCB .03 6 .01 1.7 .002 .4 3-4 .06
HC - TCDD - 4 - 1.2 - .2 - .04
6.2.1.2 Fish
Estimates of exposure ratios were tabulated for fish muscle from Chrystina lake (Table 6-13).
Exposure ratios for the high consumption group exceed 1.0 at the mean concentration in fish
muscle, as compared to the Health Canada TDI for TCDD and USATSDR MRL for PCBs. At
the 90th concentration percentile, the estimated daily intake for high and medium intake groups
exceed the Health Canada, USEPA and USATSDR guidelines. At the 90th concentration
percentile in fish liver, the estimated daily intake for high, medium and low intake groups exceeds
the Health Canada TDI value for TCDD.

74
Table 6-13 Exposure Ratios for Consuming Fish Muscle from Chrystina Lake
Consumption group High Medium Low Very Low
Concentration mean 90th mean 90th mean 90th mean 90th
Chrystina Lake
HC and FDA - PCB .04 .08 .01 .02 .003 .007 .0005 .001
USEPA - PCB .6 1.2 .2 .3 .05 .09 .007 .01
USATSDR - PCB 2 4 .6 1.2 .2 .3 .02 .05
HC - TCDD 2.8 6.6 .8 1.8 .2 .5 .03 .08
Roche Lake
HC and FDA - PCB - .01 - .003 - .001 - .0001
USEPA - PCB - .1 - .04 - .01 - .002
USATSDR - PCB - .5 - .1 - .04 - .006
HC - TCDD - .3 - .1 - .03 - .004
6.3 Development of Consumption Limit
The calculation of the consumption limit (CR) is based on the following equation:
CR = TDI * BW / C (6-3)
where: TDI is tolerable daily intake (which may, in some cases, be substituted by reference dose
or minimal risk level dose),
BW is human body weight and
C is measured concentrations of PCBs and PCDD/Fs.
The average adult body weight for Albertans is 73 kg (SD = 12) derived from National
Population Health survey, 1994. The 90th percentile concentrations of total PCB (whole weight)
and total TEQ (whole weight) were used for calculating consumption limits. Health Canada TDI
for TCDD (10 pg/kg/d) was adopted for estimating consumption limits.

75
The recommended consumption limits are presented in Table 6-14. These consumption limits
provide guidance on the evaluation of the potential risk associated with exposure to PCBs and
dioxins/furans for individuals who consume deer or moose meat taken within 30 km radius of the
plant and/or brook trout from Chrystina lake. The estimated values represent the amount of meat
from deer or moose and from edible portions of brook trout expected to generate a risk no
greater than the tolerable daily intake proposed by Health Canada, based on a lifetime of daily
consumption at that consumption limit. Because the contaminants tend to accumulate in the
internal organs in various animals and the measured levels of the contaminants were very high in
the liver samples, people should avoid consumption of viscera from wild game and fish.
Table 6-14 Species-Specific Consumption Limit
Parameter Wild Game Meat Fish
Species deer and moose brook trout
Location within 30 km radius of the SHWTC Chrystina lake
Type of tissue muscle muscle
Health Canada TDI for TCDD(pg/kg bw/day) 10 10
Body weight (kg) based on Alberta average 73 73
Consumption limit (g /day) 12 25
Consumption limit (g /week) 84 178
Consumption limit (oz /week) 3 6
Consumption limit (oz/month) 13 26

76
6.4 Discussion
The daily intake of PCBs and PCDD/Fs comes mainly from the diet through commercial food
sources, and to a lesser extent, from breathing air and drinking water. The daily intake from
background exposure for adult Canadians is estimated to be 2-4 pg PCDD/F/kg/d (Gilman et
al. 1991). The exposure ratio reflects the ratio between the actual level of exposure (external
dose) in a particular circumstance and a reference standard associated with observed toxicity in
humans or animals. In the current assessment, the estimated daily intake and exposure ratios
provide insight into additional exposure that might be expected from consuming local wild
game and fish.
Around the world, various regulatory guidelines have been developed for TCDD, the most
toxic dioxin in the group of dioxins/furans. The guidelines are expressed as a reference dose
(RfD) or a tolerable daily intake (TDI), that is, a lifetime daily dose for TCDD which is
believed to be without potential health effects to humans. In the past TCDD has been treated as
a threshold carcinogen by some regulatory agencies. Based on this assumption, a value of 10
pg/kg body weight/day has been adopted by Health Canada (Canada 1990). Some PCB and
dioxin/furan congeners produce similar toxic effects to humans and animals as TCDD. The
similarity of toxicity between these congeners and TCDD was assessed using toxic equivalency
factors (TEFs). The daily intake calculations in this study are based on the international dioxin
toxic equivalency factors (I-TEFs which assumes the additive toxicity of the congeners and
TCDD present in a sample.
Based on 90th concentration percentile of total TEQ values, individuals who consume over 13
ounces of deer or moose muscle per month or who consume over 26 ounces of brook trout fillet
per month will exceeded the Health Canada TDI. Limiting daily intake for local wild game and
fish should be considered as a precaution. The levels of PCBs and PCDD/Fs in the livers of deer
and brook trout were high. The consumption of the livers and other internal organs should be
avoided altogether.

77
The current Health Canada TDI for TCDD is based on the potential for cancer. The toxicity of
TCDD and related congeners also includes reproductive, developmental and immunotoxic effects
(DeVito et al. 1995). Humans are sensitive to the toxic effects of dioxin-like compounds.
Children and pregnant women or women who are breast-feeding are susceptible groups and
should avoid consuming wild game and fish.
6.5 Conclusion
Based on estimated daily intake and exposure ratio calculations, daily and weekly consumption of
wild game meat and fish taken near the SHWTC may result in increased exposure and potential
health risk over a person’s lifetime. Thus, restrictions on the consumption of wild game and fish
contaminated with PCBs and dioxins/furans are warranted.

78
7. RISK MANAGEMENT AND COMMUNICATION
Risk management is a cyclic process designed to identify problems in a broad context,
integrate scientific, social, cultural, economic and legal considerations in the evaluation and
selection of options, and implement actions to minimize public risk. The framework for risk
management is presented in Figure 7-1.
Problem/ContextIdentification
Risk Assessment
Option Development
Decision Making
Action Implementation
Evaluation ofEffectiveness
Collaboration
Figure 7-1 Risk Management Framework(after Commission’s final report, 1997)

79
7.1 Initial Identification
The potential of a health risk was identified after the October 1996 incident in which a large
quantity of PCBs and dioxins/furans were emitted into the air. The impacts on the ecosystem
and on public health due to this incident were of immediate concern to local residents, the
SHWTC, and the provincial government.
7.2 Initial Response
After the accident, the SHWTC transformer furnace was shut down. BOVAR conducted an
immediate monitoring of air, vegetation, soil, water, fish and wild game. Initial findings indicated
elevated concentrations of contaminants in air, vegetation, soil, voles and deer. BOVAR
informed Alberta Environmental Protection who in turn informed Alberta Health of the
incident and preliminary findings.
Under the Public Health Act, provincial health officials are responsible for protecting the public
from any harm resulting from hazardous substance release. A preliminary risk assessment
suggested a potential health risk from exposure for local residents and traditional/recreational
wilderness users in the Swan Hills area. The provincial health officer issued a public health
advisory on December 13, 1996. In accordance with the precautionary principle, this advisory
cautioned against consumption of any wild game and fish taken from within a 30 km radius of the
SHWTC.
7.3 Development of a Risk Management Plan
In order to obtain additional information for evaluating and refining the public health advisory, a
detailed health risk assessment was initiated in January, 1997 to provide the best available
scientific information about the degree and scope of contamination. The current report presents
the results of this assessment.

80
Alberta Health established a process to facilitate an exchange of information and ideas among all
affected parties during the health risk assessment (Figure 7-2). Stakeholders included various
groups that were potentially affected by the risks arising from the incident and by risk
management decisions, including the Swan Hills community, the Lesser Slave Lake Indian
Regional Council, BOVAR Waste Management, experts in various scientific fields, the Edmonton
Friends of the North, Alberta Environmental Protection, Alberta Health, Alberta Labour, Alberta
Agriculture, Alberta Justice, Environment Canada, and Health Canada.
Study Team(Health Surveillance in collaborationwith Alberta Environmental Protection,Alberta Agriculture, SAC and localcommunities )
• data collection• laboratory analysis• data analysis• data interpretation• data presentation
Science Advisory Committee (SAC)(experts in toxicology, biology,epidemiology, medicine, chemist andanimal pathology )
• advise on direction of the study• peer-review of science report• interpret results and findings• provide recommendations to Public
Health Advisory Committee
Public Health Advisory Committee(Provincial public health officers, representatives fromAlberta Health, Alberta Environmental Protection andHealth Canada, Medical Officers of Health for AspenRegional Health Authority)
• plan and administer public health assessment• develop public health advisories and other risk
management options• establish risk communication strategies
Communication Team(Provincial public health officers, staff incommunication branch, and regional MedicalOfficers of Health)
• public news release• exchange update information with all parties• public participation
Stakeholders(local residents in the Swan Hills andsurrounding areas, representatives of BOVAR,Provincial government staff, correspondents, representatives of other interested parties,citizens across Alberta )
• exchange opinions and ideas• provide recommendations
Figure 7-2 Stakeholder Involvement in the Swan Hills Health Assessment
81
Additional related activities included BOVAR’s submission of an assessment plan for continued
environmental monitoring to Alberta Environmental Protection, and the continuation of a blood
sampling program for BOVAR workers by Alberta Labour.
7.4 Public Health Advisories
A public health advisory is a non-regulatory risk management option intended to assist
individuals in making informed decisions although the guidelines presented in advisories
cannot ensure compliance. Considerations for evaluating the need for a public health advisory
are presented in Table 7-1.
Three public health advisories were issued by provincial public health officials between
December 1996 and October 1997 as information became progressively available (Table 7-2).
The Health Canada guidelines for PCBs and dioxins/furans were adopted in constructing these
advisories.

82
Table 7-1 Evaluating the Need for a Public Health Advisory
Criterion Issue Rescind Resource
Source environmental quality
indicator: compliance withregulations, guidelines andstandards
above below Health Canada Documents
indicator: magnitude andduration of contaminants inenvironmental media
upward trend downward trend BOVAR environmentalmonitoring program
Swan Hills health assessment(Alberta Health)
Manufacturing performance
indicator: manufacturingdeficiency
failure of industrialoperations
corrected or reduced
technological changes
BOVAR reports
Insurance of field collectionand laboratory analysis
indicator: basic QA/QCcriteria
good good Standard protocols
Local resource
indicator: human consumptionpatterns
heavy consumption oflocal food
average consumptionof local food
Dietary and activity survey(Alberta Health)
indicator: traditional orrecreational values
heavy land use inrecreational andtraditional lifestyles
average or less thanaverage level
Dietary and activity survey(Alberta Health)
indicator: commonlyconsumed fish and wild gamespecies
very common average or lesscommon
Dietary and activity survey(Alberta Health
Health Risk Assessment
indicator: estimated dailyintake and exposure ratio
above tolerable dailyintake proposed byHealth Canada
below tolerable dailyintake proposed byHealth Canada
risk-based consumptionmodel (Alberta Health)
Human health study
indicator: various healthendpoints
positive association negative association not available
Public value public anxiety public understanding media, community meeting
Scientific review consensus consensus Science advisory committee

83
Table 7-2 Public Health Advisories
Advisory Consideration Content
Public Health Advisory I:Wild Game and Fish
(December 13, 1996)
• accidental emissions inOctober, 1996
• failure of industrial process• large quantities of PCBs and
dioxins/furans released• elevated level of PCB in one
deer taken near the SHWTC
• avoid eating wild game and fish takenfrom a 30 km radius of the SHWTC
• avoiding eating any more of the meat ifwild game from the area has alreadybeen eaten
• no need to dispose of any wild meatuntil further information is available
Public Health Advisory II:Wild Game
(May 15, 1997)
• elevated levels of PCBs anddioxins/furan in fresh deermuscle and liver taken from a30 km radius of the SHWTC
• estimated daily intake exceededthe Health Canada TDI inheavy consumption groups
• PCBs and dioxins/furanspersist in the environmentalmedia
• PCBs and dioxins/furans areslowly removed from wildlifebodies
• limit consumption of wild game takenfrom a 30 km radius of the SHWTC to13 ounces (370 grams) per month
• avoid eating organ meat or using fatharvested from within a 30 km radius ofthe SHWTC
• pregnant or breast feeding womenshould avoid eating wild game takenfrom within a 30 km radius of theSHWTC
• young children should avoid eating wildgame taken from within a 30 km radiusof the SHWTC
• continue to avoid eating fish fromwithin a 30 km radius of the SHWTCuntil fish sample testing is complete
Public Health Advisory III:Fish
(October 30, 1997)
• elevated levels of PCBs anddioxins/furan in brook troutmuscle and liver taken fromChrystina Lake
• estimated daily intake exceededthe Health Canada TDI inheavy consumption groups
• PCBs and dioxins/furanspersist in the environmentalmedia
• PCBs and dioxins/furans areslowly removed from fish
• limit consumption of fish taken fromwithin a 20 km radius of the SHWTC to6 ounces (170 grams) per week.
• avoid eating fish organs or using fat.• pregnant or breast feeding women
should avoid eating fish taken fromwithin a 20 km radius of the SHWTC.
• young children should avoid eating fishtaken from within a 20 km radius of theSHWTC

84
7.5 Communication
The public health advisories were delivered to target audiences through various channels including
public media, local town hall meetings, and direct mail.
The public media was a major vehicle for information dissemination. The provincial health officer
held press conferences at each stage. Media packages included public news releases, interim
reports, detailed public health advisories, briefing background information and a brochure
outlining the potential health effects of PCBs and dioxins/furans (Appendices P- S). In addition, a
single large ad was placed in local paper, the Swan Hills Grizzly Gazette.
A fact sheet was provided to anyone purchasing a hunting license for the Swan Hills area for the
upcoming hunting season. Fish and Wildlife Officers received written information to assist them in
dealing with public inquiries. The news release, background information, and fact sheet were also
sent to Alberta Native Bands, the Medical Services Branch of Health Canada, and to the Regional
Health Authorities for distribution.
As well, briefing meetings were held with local residents to provide them with an opportunity to
ask questions and get all of the facts, and with regulators in other provincial government
departments.
The results of freezer meat and blood sampling were sent by direct mail to all individuals who had
supplied meat or blood samples. The letter and accompanying fact sheet included the levels of
PCBs, dioxins and furans in each type of sample, an explanation of regulatory guidelines and
background data, current public health advisories, and the names of individuals to contact for
further information (Appendix T and U). The regional Medical Officers of Health played a major
role in communicating with individuals.

85
7.6 Public Response and Perception
As part of the dietary and activity survey during February to May 1997, participants were
provided an opportunity to express their concerns about the situation and the processes for risk
management.
In the first telephone interview, participants were informed of the occurrence of the incident in
SHWTC, the public health advisory of December 1996, and the objectives of the risk assessment.
Most respondents understood the purpose of the study and recognized the need to conduct a
detailed assessment. Participants also appreciated that the Alberta Health assessment was being
conducted independently of the SHWTC. Many suggestions about the study structure were
provided including the importance of appropriate control groups, the importance of placing a
special emphasis on people who ate a large amount of wild game and fish, and proposals for
investigations of air quality, water quality, and livestock in the surrounding area.
Participants were asked how they had learned about the public health advisory (Table 7-3) and
whether they felt the advisory was effective. Fifty seven percent of respondents who were wild
game and fish consumers stated that the advisory was effective. A major reason for considering
the advisory ineffective was that the initial advisory was not based on clear evidence.

86
Table 7-3 Sources of Public Awareness of Public Health Advisory
Source Wild Game and Fish Consumers Non-Consumers
Media (newspaper, TV, radio) 47% 63%
Media + word of mouth 22% 13%
word of mouth 15% 8%
BOVAR company 3% 3%
current study (initial questionnaire) 7% 8%
community meetings or mail notice 6% 5%
Although the majority of people in the sample were aware of the public health advisory, only 12%
quit eating wild game and fish after the first public health advisory was issued. Participants who
chose to continue consuming wild game and fish were asked to provide the most important reason
that influenced this decision. One third indicated that the wild game and fish that they were
consuming were taken from outside a 30 km radius of SHWTC which reflects an understanding of
the advisory. An additional third of consumers believed that the contamination in the Swan Hills
area was less severe than had been estimated. Some of the responses suggested that the method of
communication used at the Town Hall meeting significantly impaired the effectiveness of the
public health advisory. Additional reasons provided for continuing to consume meat included:
• lack of evidence for contamination
• it is safe to eat small amount of local meat and fish
• I feel safe because Alberta Health is investigating
• local food is main food source for me
Participants were given the option to express their opinions about the incident and the current
study. Some participants noted the economic benefits of the SHWTC; some were disappointed by
the media’s portrayal of Swan Hills; many felt that the situation at the SHWTC had been
exaggerated. Some participants did not believe that they had been exposed to PCBs, dioxins and
furans, and some were concerned about contamination from other sources. However, the majority
of participants were strongly concerned about children and pregnant women being exposed to
PCBs, dioxins and furans. The local residents also seemed to have diverse attitudes towards the

87
Swan Hills Treatment Center itself. Overall, the mixed opinions of local residents likely reflect a
felt tension between economic stability and environmental health concerns.
7.7 Implications of Cultural Values
Wild game and fish may supplement the diet of a number of people living in the area surrounding
the SHWTC. Concern has been raised by both recreational users and traditional users because
these two groups consume more wild game and fish than the general population. The balance
between nutritional benefits and health risks arising from the consumption of contaminated food is
an important consideration in issuing public health advisories (Kimbrough, 1991; Burger and
Gochfeld, 1996).
The current advisories address this issue in three ways. First, the dietary survey attempted to
determine the extent of wild game and fish consumption by residents of the Swan Hills area.
Survey results indicate that only a small proportion of people ate fish caught in Chrystina Lake.
Second, the advisories provided consumption limits developed from risk estimates rather than an
outright ban on consumption. These limits do indicate that wild game and fish may still be safely
consumed in moderation. Third, the advisories are restricted to a 30 km radius of the SHWTC in
accordance with evidence that contamination with PCBs, dioxins and furans is restricted to areas
near the SHWTC. Therefore, traditional and recreational users can still safely consume wild game
and fish obtained from outside the affected area.
Finally, it should be noted that the consumption limits provided in the advisories were calculated
in reference to uncooked food. Many studies have shown that appropriate food preparation and
cooking techniques can reduce the concentrations of PCBs, dioxins and furans in fish and meat
(Zabik, 1995; USEPA 1996; Schecter et al 1997; Petroske et al. 1997). Thus, techniques such as
removing the skin prior to cooking, broiling and baking are recommended for individuals who
continue to consume wild game and fish taken from the areas immediately surrounding the
SHWTC.

88
8. LONG TERM MONITORING PLAN
The next phase of the Swan Hills health assessment is the implementation of a longer term human
health monitoring plan. This includes (a) continued environmental monitoring, (b) on-going
human health surveillance, and (c) research activities. A comprehensive environmental monitoring
program has already been developed by BOVAR Waste Management as a response to the Alberta
Environmental Protection Enforcement Order-97-01. This part of the program is focused on
ecosystems such as air, surface and ground water, soil, sediment, vegetation, aquatic life, and
wildlife in the area surrounding the Swan Hills Waste Treatment Center (BOVAR 1997). The
recommendations in this section emphasize the monitoring needs from a human health
perspective. In order to ensure the continued protection of the residents in the town of Swan Hills
and surrounding areas Alberta Health, Aspen and Keeweetinook Regional Health Authorities,
Alberta Environmental Protection and Alberta Labor, in collaboration with BOVAR Waste
Management, will ensure the implementation of the following activities:
1. Fish monitoring. PCBs and PCDD/Fs levels in brook trout fillet and liver from
Chrystina Lake will be analyzed each fall. The minimum sample size will consist of at
least four composite samples containing 16 to 20 large and older fish. Other fish
species in other lakes within the Swan Hills area will also be monitored.
2. Wildlife monitoring. PCBs and PCDD/Fs levels in wild game used for human
consumption will be analyzed each year. Samples will include deer muscle and liver,
and moose muscle and liver. Based upon the dietary survey conducted in the Swan
Hills area, wildlife monitoring will be extended to include the analysis of wild grouse.
Although not directly related to human health, predators should also be monitored to
gain a better understanding of the biomagnification of the contaminants in the food
chain.
3. Human blood monitoring. If warranted by the results of fish and wild game
monitoring, or any other unforeseen events, PCBs and PCDD/F levels in human serum

89
of the residents in the town of Swan Hills and the surrounding areas will be assessed
on as needed basis.
4. Workers health monitoring. Biological monitoring data from workers at the SWTC
will be analyzed and reviewed on a regular basis to detect any changes or trends in
blood levels of PCBs and PCDD/Fs.
5. Specific risk groups. If warranted by the on-going monitoring results, targeted studies
of specific risk groups (e.g., First Nations, children, women) should be conducted.
6. Research. Additional studies may be conducted to further understand the relationships
between PCBs and PCDD/F exposure and human health effects. Priorities should
include the assessment of total dietary exposure to PCBs and PCDD/Fs, the
development and assessment of biomarkers of effect, and the effect of freezer
temperatures and storage on wild game meet contaminant levels.
7. Common database. A computerized data repository for monitoring data will be jointly
established by Alberta Health, Alberta Environmental Protection, Alberta Labor,
BOVAR Waste Management, and other stakeholders to ensure the availability of high
quality data for the purpose of analysis, monitoring and research (Appendix V).
8. Review and interpretation of information. An independent Science Advisory
Committee will be used to provide scientific direction and to advise on the
interpretation of the monitoring results. The Provincial Health Officer and Medical
Officers of Health will review the findings from a human health perspective and make
health risk management decisions.
9. Dissemination of information All relevant monitoring information will be made public
in a timely fashion, in the form of periodic reports, or other means of communication.
10. Review of the fish and game consumption advisory. Alberta Health and Alberta
Environmental Protection establish a process for the on-going review of fish and game
consumption advisories. Changes to the advisory (e.g., lifting) will be made based on
the available scientific information.

90
9. BIBLIOGRAPHY
Alberta Labour. Occupational Health & Safety - Medical Guideline: Guideline for Medical
Monitoring of Workers Exposed to Polychlorinated Biphenyls (PCBs). MSB-13, 03/94.
Barsotti, D.A. and van Miller, J.P. Accumulation of a commercial polychlorinated biphenyl
mixture (Aroclor 1016) in adult rhesus monkeys and their nursing infants. Toxicology, 1984;
30: 31-44.
Battershill, J.M. Review of the Safety Assessment of PCBs with particular reference to
reproductive toxicity. Human & Experimental Toxicology 1994; 13:581-597.
BOVAR. Swan Hills Waste Treatment Center Environmental Monitoring Results 1996. March
1997.
BOVAR. Swan Hills Treatment Center: Assessment Plan Response to Enforcement Order-97-01,
1997.
Brown, Jr., J. F., Frame II, G. M., Olson, D. R., Webb, J. L. The sources of the coplanar
PCBs. . In: Clement, R. et al. (eds.) Organohalogen Compounds, Vol. 26. Opening plenary,
Human Exposure, Human Levels, Human Health Risk Assessment, Toxaphene, PCBs, and
Legal and Regulatory. 15th International Symposium on Chlorinated Dioxins and Related
compounds, Indianapolis, Indiana, USA, August 21-25, 1995, pp427-430.
Birmingham, B., Thorpe, B., Frank, R., Clement, R., Tosine, H., Fleming, G., Ashman, J.,
Wheeler, J., Ripley, B.D., and Ryan, J.J. Dietary intake of PCDD and PCDF from food in
Ontario, Canada. Chemosphere 1989; 19:507-512.
Borlakoglu, J.T. and Walker, C.H. Comparative aspects of congener specific PCB metabolism.
European. Journal of. Drug Metabolism and Pharmacokinetics 1989; 14:127-131.

91
Burger, J., Gochfeld, M. Fish advisories: useful or difficult to interpret? Risk, Safety and
Environ. 1996; 23: 7: 23-33.
Canada (Government of Canada, Environment Canada and Health Canada). Canadian
Environmental Protection Act. Priority Substances List Assessment Report No. 1:
Polychlorinated Dibenzodioxins and Polychlorinated Dibenzofurans. KE3619.P74 1990.
Cole, D.C., Kearney, J., Gilman, A.P. and Ryan, J.J. Serum PCB, dioxin and furan levels in
Ontario Great Lakes anglers. Volume 26, pp193-196. Presented in 15th International
Symposium on Chlorinated Dioxins and Related Compounds, August 21-25, 1995,
Edmonton, Canada.
Conacher, H. B. S., Graham, R. A., Newsome, W. H., Grham, G. F., Verdier, P. The health
protection branch total diet program: an overview. J. Inst. Can. Sci. technol. Aliment. 1989;
22: 322-326.
Conacher, H. B. S. and Mes. J. Assessment of human exposure to chemical contaminants in
foods. Food Add. Contam. 1993; 10: 5-15.
Davis, K. Human exposure pathways to selected organochlorines and PCBs in Toronto and
Southern Ontario. In: J.O. Nriagu and M.S. Simmons (Eds.), Food Contamination from
Environmental Sources. John Wiley and Son, New York, 1990, pp525-pp540.
DeVito, M.J., Birnbaum, L.S., Farland, W.H., and Gasiewicz, T.A. Comparisons of
estimated human body burdens of dioxinlike chemicals and TCDD body burdens in
experimentally exposed animals. Environ. Health Persp. 1995; 103:820-831.
Dewailly, E., Ryan, J.J., Laliberté, C., Bruneau, S., Weber, J-P., Gingras, S., and Carrier,
G. Exposure of remote maritime populations to coplanar PCBs. Environ. Health Persp. 1994;
102 (suppl. 1):205-209.

92
de Wit, C., Jansson, B., Bergek, S., Hjelt, M., Rappe, C., Olsson, M., Andersson, O.
Polichlorinated dibenzo-p-dioxin and polychlorinated dibenzofuran levels and patterns in fish
and fish-eating wildlife in the Baltic sea. Chemosphere 1992; 25: 185-188.
Eisler R. and Belisle AA. Planar PCB hazards to fish, wildlife, and invertebrates: a synoptic review. Biological
Report 1995; 31: 1-75.
Elkin BT and Bethke RW. Environmental contaminants in caribou in the Northwest Territories, Canada. Sic.
Total Environ. 1995; 160/162: 307-321.
EPA (U.S. Environmental Protection Agency). Chlorinated Dioxins and Furans in the General
U.S. Population: NHATS FY87 results. EPA-560/5-91/003. Washington, DC, 1991.
EPA (U.S. Environmental Protection Agency). Health Assessment Document for 2,3,7,8-
Tetrachlorodibenzo-p-dioxin (TCDD) and Related Compounds. Review Draft. Volume III, at
9-77 to 9-78, 1994.
EPA (U.S. Environmental Protection Agency). Guidance for Assessing Chemical Contaminant
Data for Use in Fish Advisories. Vol. III.: Risk Assessment and Fish Consumption Limits.
Office of Science and Technology, U.S. EPA, Washington, DC.
Falandysz, J. and Kannan, K. Organochlorine pesticide and polychlorinated biphenyl residues in slaughtered
and game animal fats from the northern part of Poland. Z Lebensm Unters Forsch 1992; 195: 17-21.
Feeley, M.M. Biomarkers for Great Lakes priority contaminants: halogenated aromatic hydrocarbons. Environ.
Health Perspect. 1995; 103(suppl 9):7-16.
Gilman, A., Newhook, R., and Birmingham, B. An update assessment of the exposure of
Canadians to dioxins and furans. Chemosphere 1991; 23: 1661-1667.

93
Grimvall, E., Rylander, L., Nilsson-Ehle, P., Nilsson, U., Strömberg, U., Hagmar, L.,
Östman, L.H. Monitoring of polychlorinated biphenyls in human blood plasma:
methodological developments and influence of age, lactation, and fish consumption. Arch.
Environ. Contamin. Toxicol. 1997; 32:329-336.
Hovinga, M.E., Sowers, M., Humphrey, H.E.B. Environmental exposure and lifestyle
predictors of lead, cadmium, PCB, and DDT levels in Great Lakes fish eater. Arch. Environ.
Health 1993; 48:98-104.
Johansen, H.R., Alexander, J., Rossland, O.J., Planting, S., Løvik, M., Gaarder, P.I.,
Gdynia, W., Bjerve, K.S., and Becher, G. PCDDs, PCDFs, and PCBs in human blood in
relation to consumption crabs from a contaminated Fjord area in Norway. Environ. Health
Persp. 1996; 104:756-764.
Kimbrough, R.D. Consumption of fish: benefits and perceived risk. J. Toxicol. Environ. Health
1991; 33: 81-91.
Kimbrough, R.D. Polychlorinated biphenyls (PCBs) and human health: an update. Cri. Rev.
Toxicol. 1995; 25:133-163.
Kociba, R.J., Keyes, D.J., Beyer, D.E., Carreon, R.M., Wade, C.E., Dittenber, D., Kalnins,
R., Frauson, L., Park, C.N., Barnard, S., Hummel, R., and Humiston, C.G. Results of a
two year chronic toxicity and oncogenicity study of 2,3,7,8-tetrachlorodibenzo-p-dioxin
(TCDD) in rats. Toxicol. Appl. Pharmacol. 1978; 46: 279-303.
Larsson P, Okla L, Woin P. Atmospheric transport of persistent pollutants governs uptake by
holarctic terrestrial biota. Environ. Sci. Technol. 1990; 24: 1599-1601.
Levin, E.D., Schantz, S.L., and Bowman, R.E. Delayed spatial alternation deficits resulting
from perinatal PCB exposure in monkey. Arch. Toxicol. 1988; 62: 267-273.

94
MacLock, R. B. and Thompson, J. P. Northern River Basins Study Synthesis Report No. 7:
Characterization of Aquatic Uses within the Peace, Athabasca and Slave Rivers. The Northern
River Basins Study, Edmonton, Alberta, May, 1996.
McFarland, V. A. And Clarke, J. U. Environmental Occurrence, Abundance, and Potential
Toxicity of Polychlorinated Biphenyl Congeners: Considerations for a Congener-specific
Analysis. Environ. Health Persp. 1989; 81: 225-239.
Mes, J., Newsome, H., Conacher, H. B. S. Determination of some specific isomers of
polychlorinated biphenyl congeners in fatty foods of the Canadian diet. Food Addi. Contam.
1989; 6: 365-375.
Miller FL, Broughton E, Gunn A. Mortality of Migratory Barren-Ground Caribou on the Calving Grounds of
the Beverly Herd, Northwest Territories, 1981-1983. Canadian Wildlife Service Occasional Paper No. 66,
Ottawa, Canada, pp26, 1988.
Muir DC, Ford C, Grift B. Analysis of Dietary Samples from Broughton Island (NWT) for
PCBs and Related Organochlorine Contaminants. Department of Fisheries and Oceans, central
and Arctic Region, winnipeg, 1988. (Cited by Thomas DC, Tracey B, Marshall H, Norstrom
RJ. Arctic terrestrial ecosystem contamination. Sci. Total Environ. 1992; 122: 135-164.)
Muir DC. (Personal communication), June, 1997.
NRBS (Northern River Basins Study). Project Report No. 142. A Database of Environmental
Samples Collected and Analyzed for the Northern River Basins Study. 1996.
Päpke, O., Ball, M. and Lis, A. Various PCDD/PCDF patterns in human blood resulting from
different occupational exposure. Chemosphere 1992; 25:1101-1108.
Päpke, O., Herrmann, T., Ball, M. PCDD/Fs in humans, follow up of background data for
Germany, 1996. In: Hites, R. (ed.) Organohalogen Compounds, Vol. 33. Toxaphene,
Transport and Fate, Ecotoxicology and Human Exposure. 17th International Symposium on

95
Chlorinated Dioxins and Related compounds, Indianapolis, Indiana, USA, August 25-29,
1997, pp530-534.
Patterson, D.G., Todd, Jr., D.D., Turner, W.E., Maggio, V., Alexander, L.R., and
Needham, L.L. Levels of non-oothor-subsituted (coplanar), mono- and di-ortho-substituted
polychlorinated biphenyls, dibenzo-p-dioxins, and dibenzofurans in human serum and adipose
tissue. Environ. Health Persp. 1994; 102 (suppl.1):195-204.
Petroske, E. P., Zaylskie, R. G., Feil, V. J. The effect of cooking on dioxin and furan
concentrations in beef. In: Hites, R. (ed.) Organohalogen Compounds, Vol. 33. Toxaphene,
Transport and Fate, Ecotoxicology and Human Exposure. 17th International Symposium on
Chlorinated Dioxins and Related compounds, Indianapolis, Indiana, USA, August 25-29,
1997, pp436-439.
Przybycin J. and Juszkiewicz T. Residues of polychlorinated biphenyl in game animals. Medycyna
Weterynaryjan 1993; 49: 318-319.
Ryan, J.J. and Gilman, A. Contemporary Canadian Exposure of the General population to
Dioxin-like and Organochlorine Compounds. Food and Environmental Health Directorates,
Health Protection Branch, Health Canada, Ottawa, May, 1997.
Ryan, J. J., Beaudoin, N., Mills, P. Patry, B. Dioxin-like compound in total diet food, Canada
1992-1993. In: Hites, R. (ed.) Organohalogen Compounds, Vol. 32 Levels in the
Environment, Levels in Food and Sources. 17th International Symposium on Chlorinated
Dioxins and Related compounds, Indianapolis, Indiana, USA, August 25-29, 1997, pp229-
231.
Safe, S.H. Polychlorinated Biphenyls (PCBs): Environmental Impact, Biochemical and Toxic
Responses, and Implications for Risk Assessment. Cri. Rew. Toxicol. 1994, 24(2): 87-149.

96
Sahl, J.D. Polychlorinated biphenyl concentrations in the blood plasma of a selected sample of
non-occupationally exposed southern California working adults. Sci. Total Environ. 1985;
46:9-18.
Schantz, S.L., Levin, E.D., and Bowman, R.E. et al. Effects of perinatal PCB exposure on
discrimination-reversal learning in monkeys. Neurotoxicol. Teratol. 1989; 11: 243-250.
Schantz, S.L., Levin, E.D., and Bowman, R.E. Long-term neurobehavioral effects of perinatal
polychlorinated biphenyl (PCB) exposure in monkeys. Environ. Toxicol. Chem. 1991; 10:
747-756.
Schecter, A., Stanley, J., Boggess, K., Masuda, Y., Mes, J., Wolff, M., Furst, P., Fust, C.,
Wilson-Yang, Chisholm B. Polychlorinated bipheny level in the tissues of exposed and
nonexposed humans. Environ. Health. Persp. 1994, 102 (Supp.1): 149-158.
Schecter, A., Fürst, P., Fürst, C., Päpke, O., Ball, M., Ryan, J.J., Cau, H.D., Dai, L.C.,
Quynh, H.T., Cuong, H.Q., Phuong, N.T.N., Phiet, P.H., Beim, A., Constable, J.,
Startin, J., Samedy, M. and Seng, Y.K. Chlorinated dioxins and dibenzofurans in human
tissue from general populations: a selective review. Environ. Health. Persp. 1994, 102
(Sup.1): 159-171.
Schecter, A., Päpke, O., Fürst, P., Ryan, J.J. Temporal changes in dioxin and dibenzofuran
levels in general population human blood and milk from Germany and the united states. In:
Hites, R. (ed.) Organohalogen Compounds, Vol. 33. Toxaphene, Transport and Fate,
Ecotoxicology and Human Exposure. 17th International Symposium on Chlorinated Dioxins
and Related compounds, Indianapolis, Indiana, USA, August 25-29, 1997, pp473-478.
Schecter, A., Päpke, Dellarco, M. Dioxin, dibenzofuran, and PCB congeners in cooked and
uncooked foods. In: Hites, R. (ed.) Organohalogen Compounds, Vol. 33. Toxaphene,
Transport and Fate, Ecotoxicology and Human Exposure. 17th International Symposium on

97
Chlorinated Dioxins and Related compounds, Indianapolis, Indiana, USA, August 25-29,
1997, pp462-466.
Seegal, R.F. Epidemiological and laboratory evidence of PCB-induced neurotoxicity. Cri. Review
Toxicol. 1996; 26:709-737.
Sonzogni, W. et al. Polychlorinated biphenyl congeners in blood of Wisconsin sport fish
consumers. Arch Environ. Contam Toxicol. 1991; 20: 56-60.
Svensson, B-G, Nilsson A., Jonsson, E., Schütz A., Åkesson, B., Hagmar, L. Fish
consumption and exposure to persistent organochlorine compounds, mercury, selenium and
methylamines among Swedish fishermen. Scand. J. Work Environ. Health 1995; 21:96-105.
Swanson, G.M., Ratcliffe, H.E. and Fischer, L.J. Human exposure to polychlorinated
biphenyls (PCBs): a critical assessment of the evidence for adverse health effects. Regul.
Toxicol Pharmacol. 1995; 21:136-150.
Thomas DJ, and Hamilton MC Organochlorine residues in biota of the Baffin Island region.
Seakem Oceanography Ltd., Sidney, B.C., 1988. (Cited by Thomas DC, Tracey B, Marshall
H, Norstrom RJ. Arctic terrestrial ecosystem contamination. Sci. Total Environ. 1992; 122:
135-164.)
Thomas DC, Tracey B, Marshall H, Norstrom RJ. Arctic terrestrial ecosystem contamination. Sci. Total
Environ. 1992; 122: 135-164.
Tryphonas, H., Hayward, S., O’Grady, L. el al. Immunotoxicity studies of PCB (Aroclor
1254) in the adult rhesus (Macaca mulatta) monkey - preliminary report. Int. J.
Immunopharmacol 1989, 11: 199-206.

98
Tryphonas, H., Luster, M.I., Schiffman G. et al. Effects of chronic exposure of PCB (Aroclor
1254) on non- specific immune parameters in the rhesus (Macaca mulatta) monkey. Int. J.
Immunopharmacol 1991, 13: 639-648.
Wein, E. E., Sabry, H., J., Evers, F.T. Food consumption patterns and use of country foods by
Native Canadian near Wood Buffalo National Park, Canada. ARCTIC 1991; 44: 196-205.
Whittle, D.M., Mageau, C., Duncan, R. K., Sergeant, D. B., Nassichuk, M. D., Morrisson,
J., Piuze, J. Canadian national dioxin sampling program: dioxins and furans in biota near 46
pulp and paper mills using the chlorine bleaching process. Chemosphere, 1993; 27:279-286.
Wolff, M.S. and Schecter, A. Use of PCB blood levels to assess potential exposure following an
electrical transformer explosion. JOM 1992; 34:1079-1083.
Wuthe, T.A., Piechotowski, I.C., Päpke, O.B., Zier, B.B., Gabri T.C., Kramer, D.C.,
Kouros, B.A., Schwenk, M.C., and Pfaff, G.C. First data on background levels of non-
ortho and mono-ortho PCBs in blood of residents from southern Germany. Chemosphere
1996; 32:567-574.
Zabik, M. E., Zabik, M. J. Tetrachlorodibenzo-p-dioxin residue reduction by
cooking/processing of fish fillets harvested from the Great Lakes. Bull. Environ. Contam.
Toxicol. 1995; 55: 264-269.