Embed Size (px)
Citation preview

YOUR PARTNER FOR THE PRODUCTIONOF STATISTICS
BY FRANÇOIS LIBEAU
GENERAL MANAGER - HENDYPLANBeirut, 29th – 30th Aug. 2018
SUT EQUALIZERA NEW GENERATION TOOL FOR THE
PRODUCTION OF SUT AND IOT
2
CONTENTS
1. The methodology
2. The IT architecture of the tool
3. The implementation of the solution
CONCLUSIONS
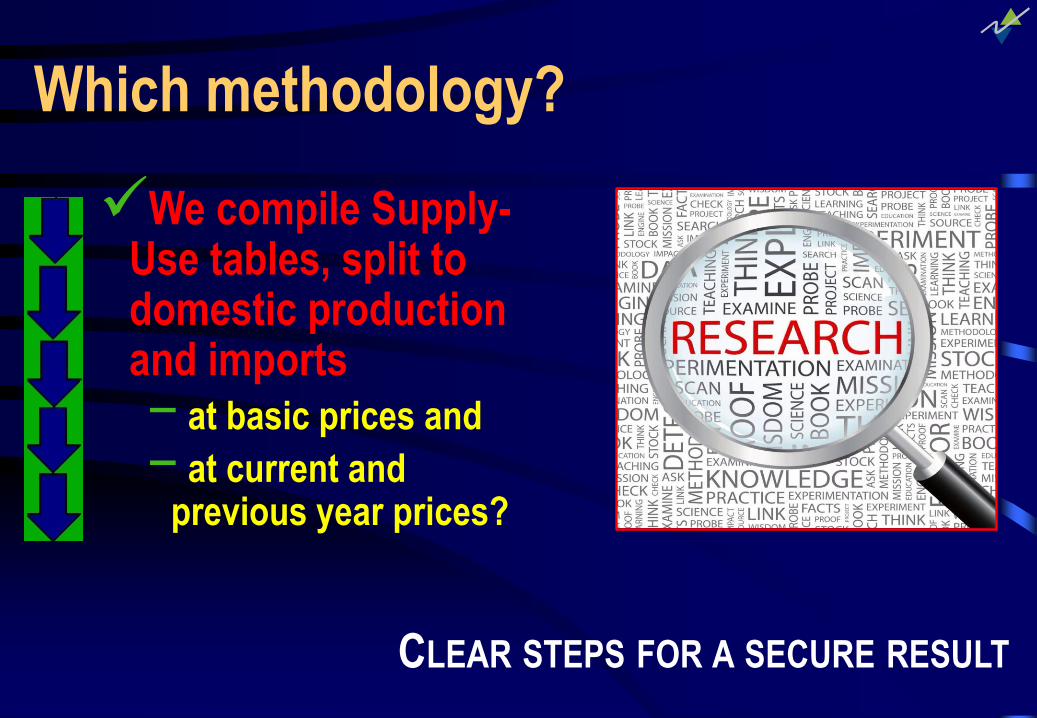
We compile Supply-Use tables, split to domestic production and imports − at basic prices and
− at current and previous year prices?
CLEAR STEPS FOR A SECURE RESULT
Which methodology?
4
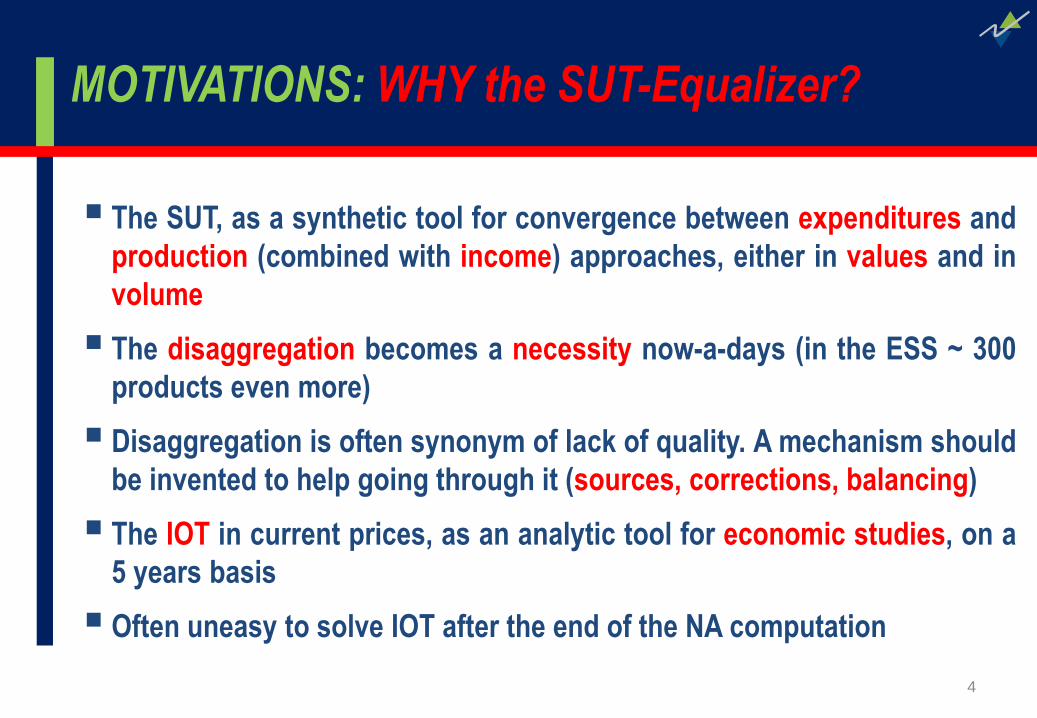
MOTIVATIONS: WHY the SUT-Equalizer?
The SUT, as a synthetic tool for convergence between expenditures and
production (combined with income) approaches, either in values and in
volume
The disaggregation becomes a necessity now-a-days (in the ESS ~ 300
products even more)
Disaggregation is often synonym of lack of quality. A mechanism should
be invented to help going through it (sources, corrections, balancing)
The IOT in current prices, as an analytic tool for economic studies, on a
5 years basis
Often uneasy to solve IOT after the end of the NA computation
5
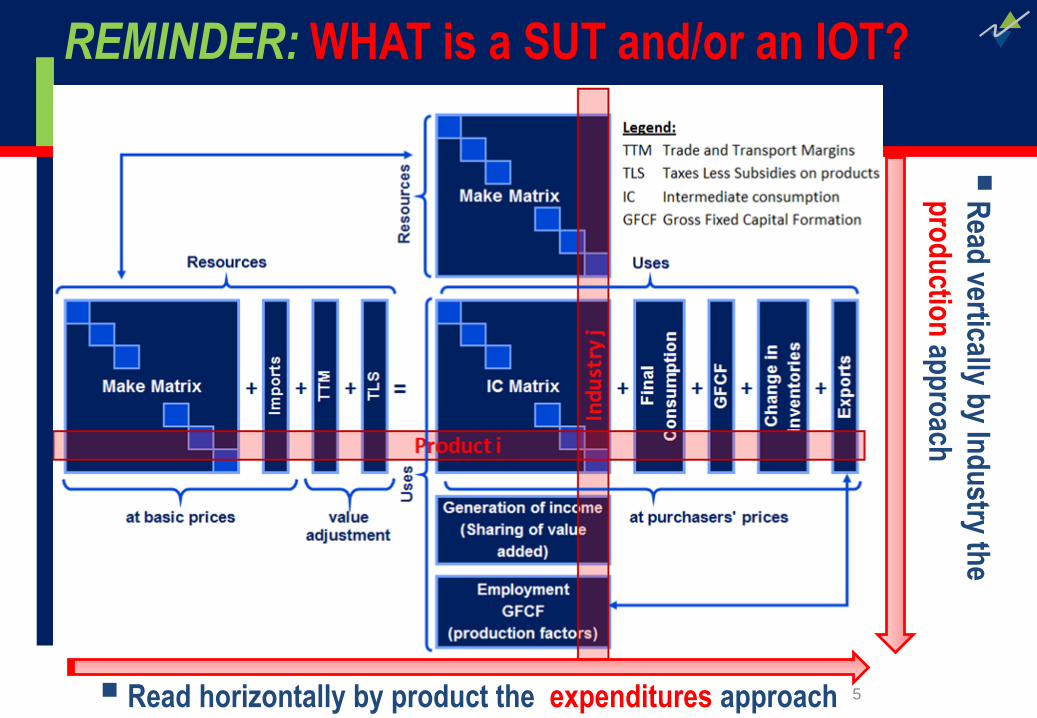
REMINDER: WHAT is a SUT and/or an IOT?
Read horizontally by product the expenditures approach
R
ead vertically b
y Ind
ustry th
e
pro
du
ction
app
roach
6
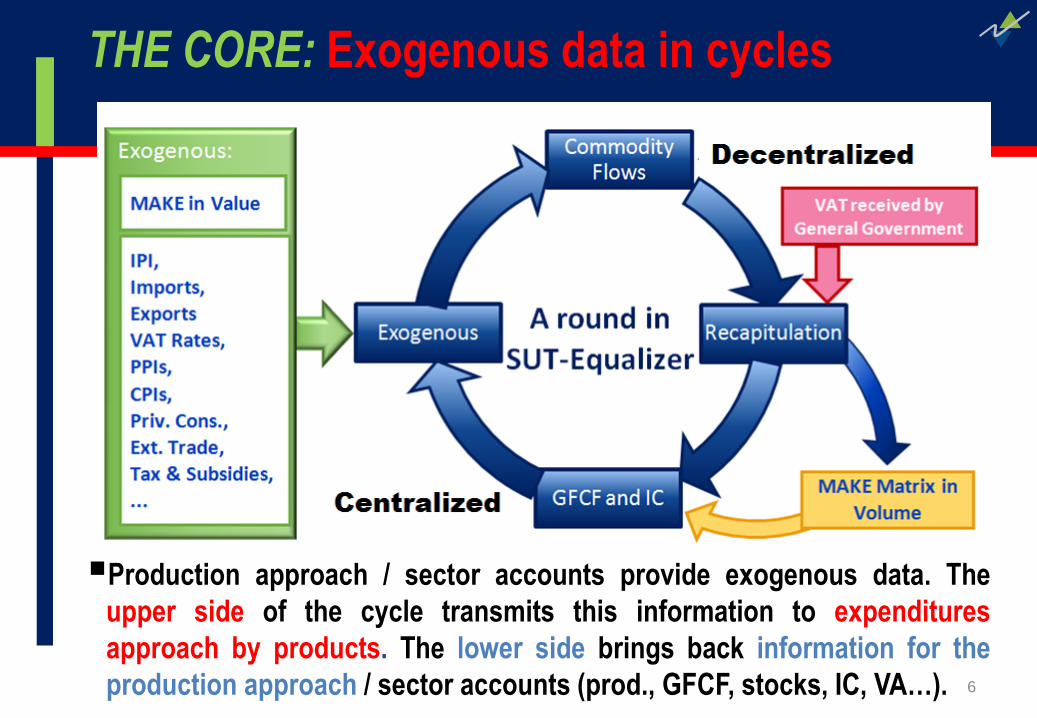
THE CORE: Exogenous data in cycles
Production approach / sector accounts provide exogenous data. The
upper side of the cycle transmits this information to expenditures
approach by products. The lower side brings back information for the
production approach / sector accounts (prod., GFCF, stocks, IC, VA…).
7
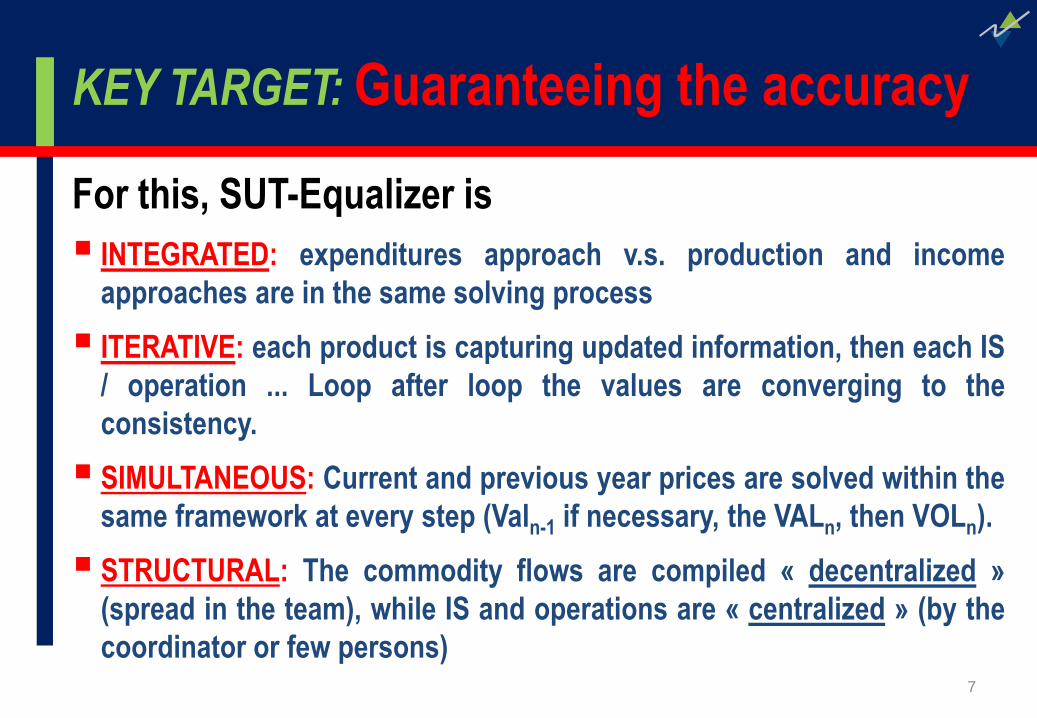
KEY TARGET: Guaranteeing the accuracy
For this, SUT-Equalizer is
INTEGRATED: expenditures approach v.s. production and income
approaches are in the same solving process
ITERATIVE: each product is capturing updated information, then each IS
/ operation ... Loop after loop the values are converging to the
consistency.
SIMULTANEOUS: Current and previous year prices are solved within the
same framework at every step (Valn-1 if necessary, the VALn, then VOLn).
STRUCTURAL: The commodity flows are compiled « decentralized »
(spread in the team), while IS and operations are « centralized » (by the
coordinator or few persons)
8
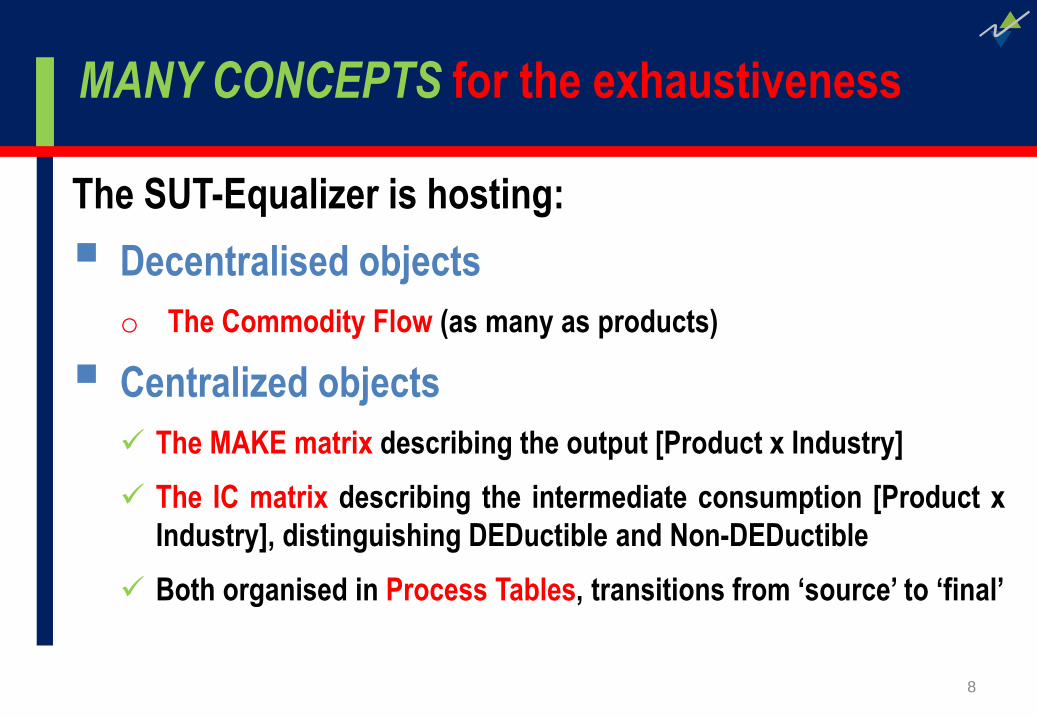
MANY CONCEPTS for the exhaustiveness
The SUT-Equalizer is hosting:
Decentralised objects
o The Commodity Flow (as many as products)
Centralized objects
The MAKE matrix describing the output [Product x Industry]
The IC matrix describing the intermediate consumption [Product x
Industry], distinguishing DEDuctible and Non-DEDuctible
Both organised in Process Tables, transitions from ‘source’ to ‘final’
9
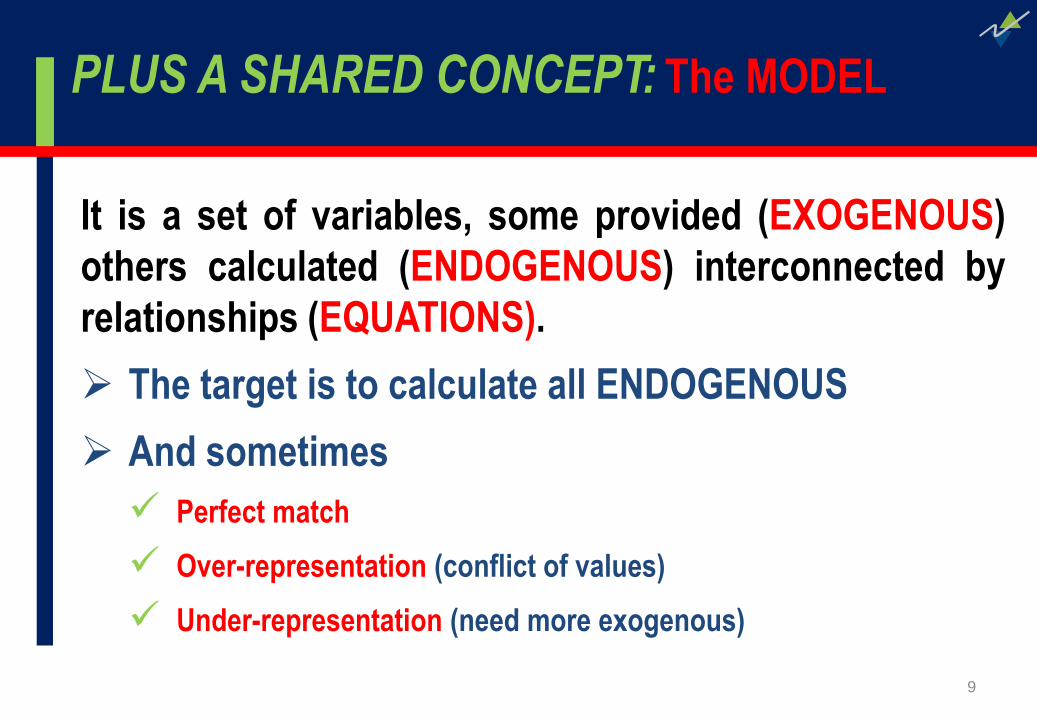
PLUS A SHARED CONCEPT: The MODEL
It is a set of variables, some provided (EXOGENOUS)
others calculated (ENDOGENOUS) interconnected by
relationships (EQUATIONS).
The target is to calculate all ENDOGENOUS
And sometimes
Perfect match
Over-representation (conflict of values)
Under-representation (need more exogenous)
10
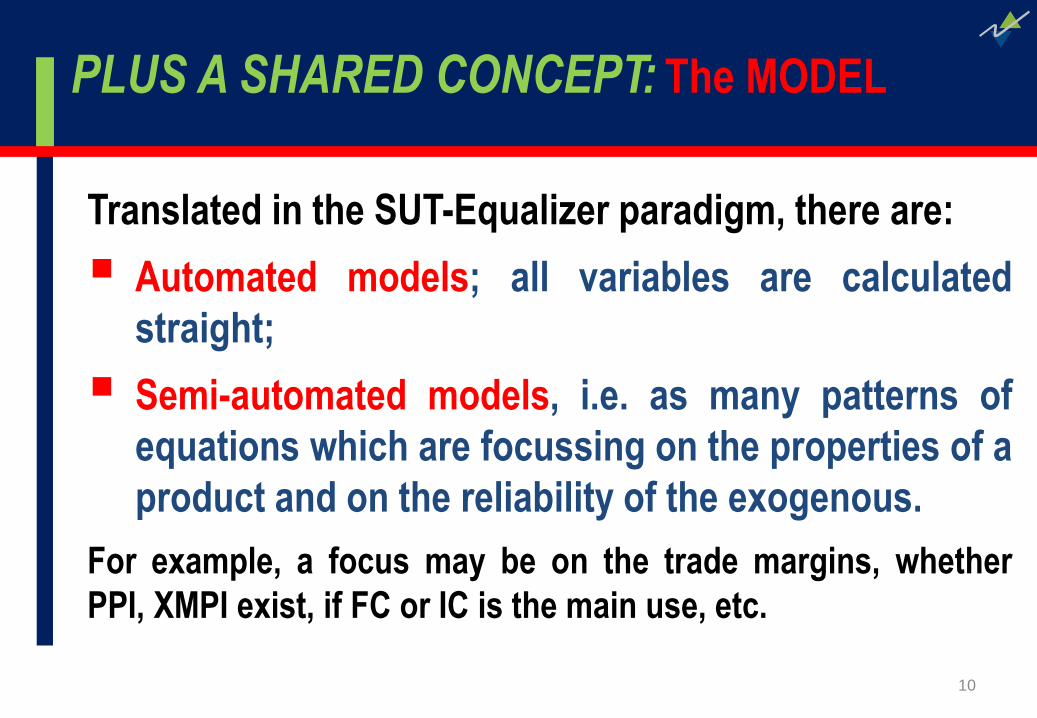
Translated in the SUT-Equalizer paradigm, there are:
Automated models; all variables are calculated
straight;
Semi-automated models, i.e. as many patterns of
equations which are focussing on the properties of a
product and on the reliability of the exogenous.
For example, a focus may be on the trade margins, whether
PPI, XMPI exist, if FC or IC is the main use, etc.
PLUS A SHARED CONCEPT: The MODEL
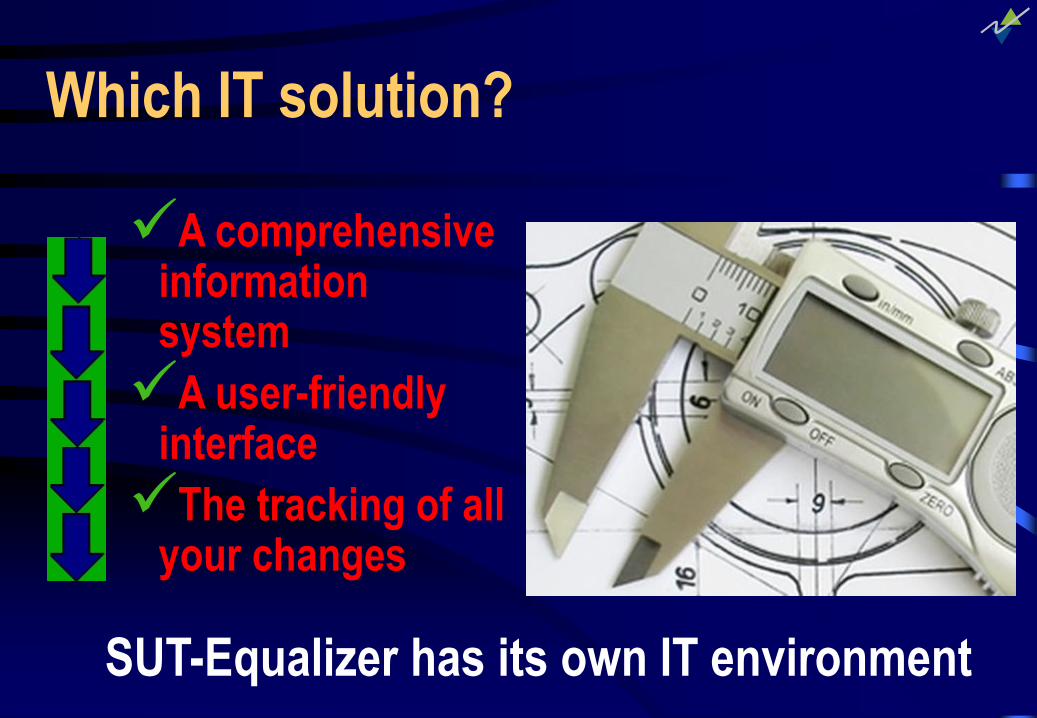
A comprehensive information system
A user-friendly interface
The tracking of all your changes
SUT-Equalizer has its own IT environment
Which IT solution?
12
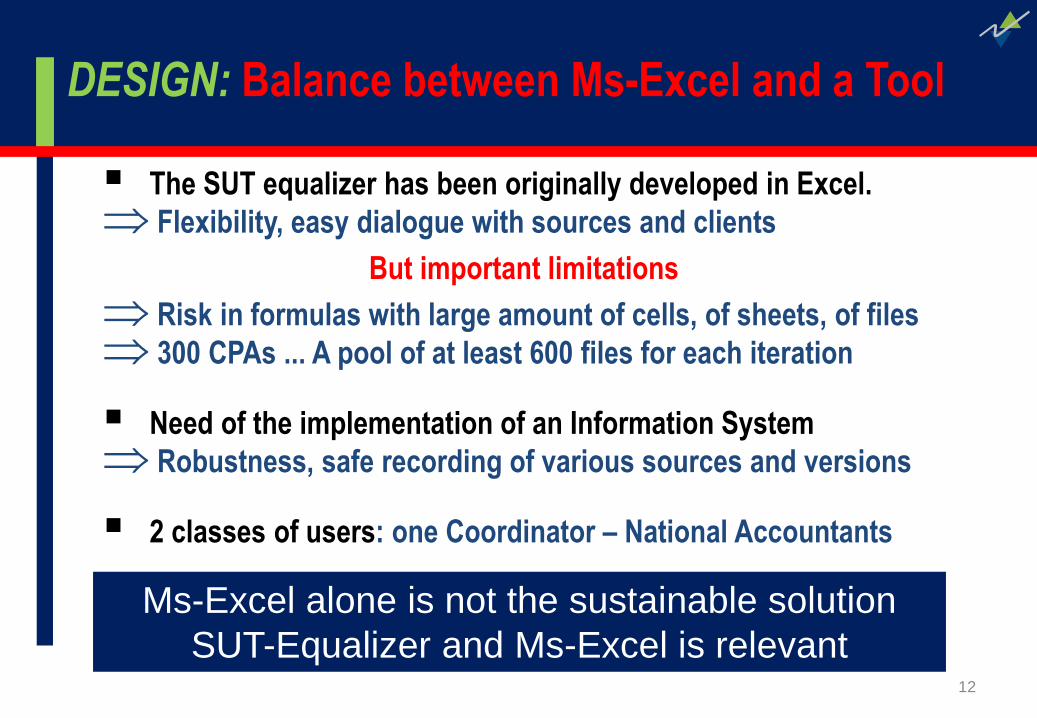
DESIGN: Balance between Ms-Excel and a Tool
The SUT equalizer has been originally developed in Excel.
Flexibility, easy dialogue with sources and clients
But important limitations
Risk in formulas with large amount of cells, of sheets, of files
300 CPAs ... A pool of at least 600 files for each iteration
Need of the implementation of an Information System
Robustness, safe recording of various sources and versions
2 classes of users: one Coordinator – National Accountants
Ms-Excel alone is not the sustainable solution
SUT-Equalizer and Ms-Excel is relevant
13
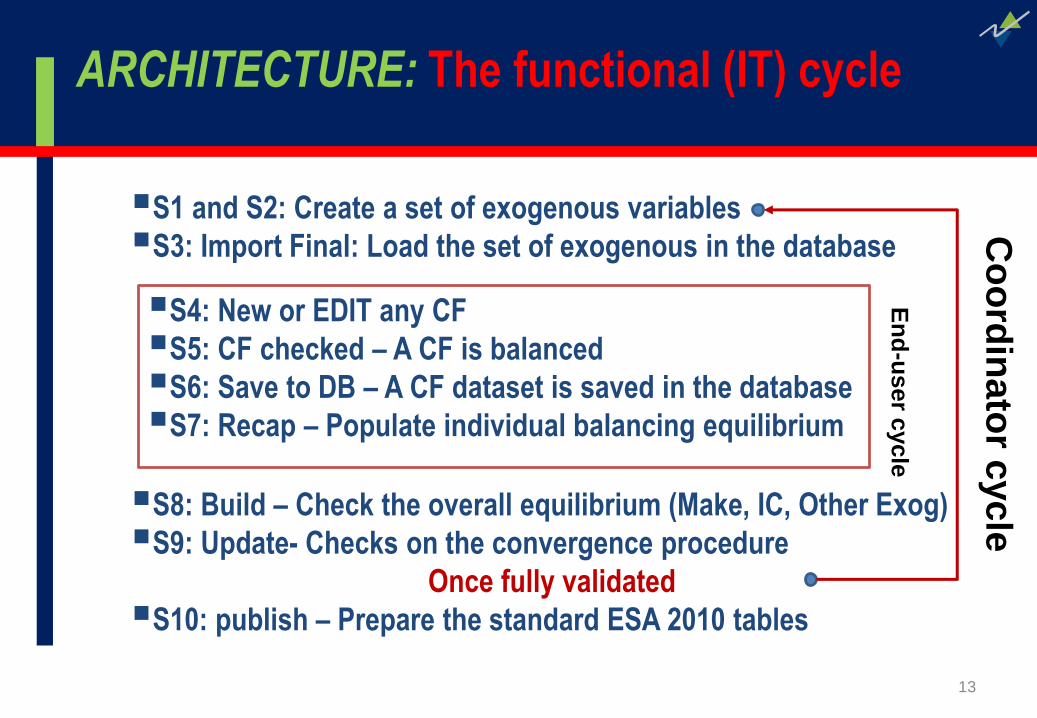
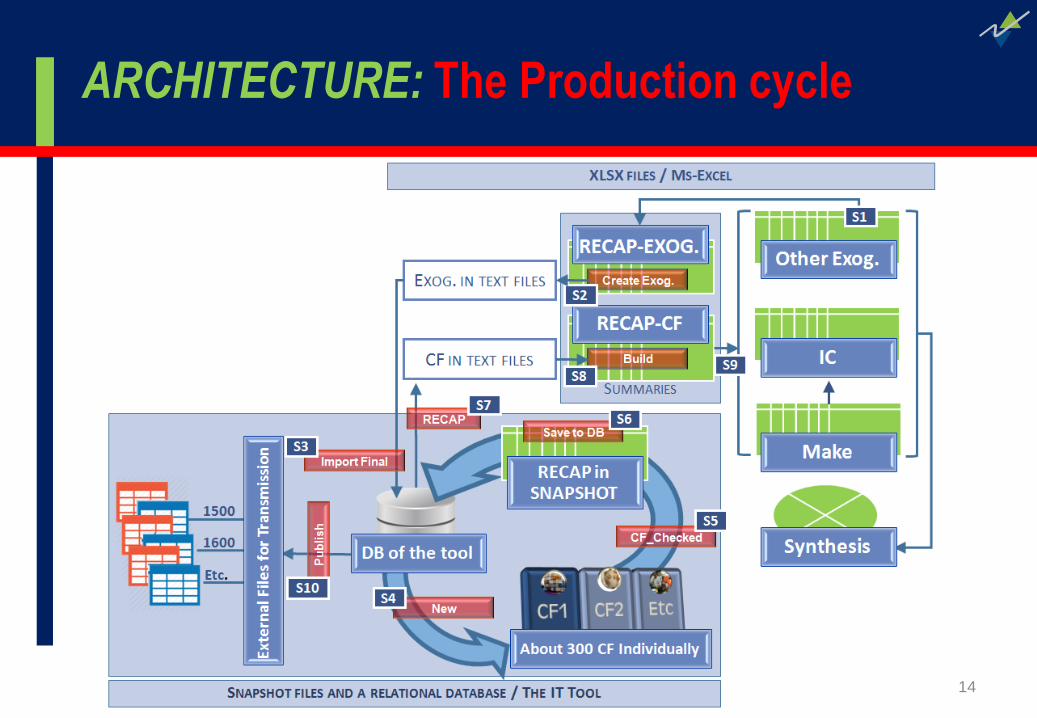
ARCHITECTURE: The functional (IT) cycle
S1 and S2: Create a set of exogenous variables
S3: Import Final: Load the set of exogenous in the database
S8: Build – Check the overall equilibrium (Make, IC, Other Exog)
S9: Update- Checks on the convergence procedure
Once fully validated
S10: publish – Prepare the standard ESA 2010 tables
S4: New or EDIT any CF
S5: CF checked – A CF is balanced
S6: Save to DB – A CF dataset is saved in the database
S7: Recap – Populate individual balancing equilibrium
Co
ord
inato
r cycle
En
d-u
se
r cyc
le
14
ARCHITECTURE: The Production cycle
15
ARCHITECTURE: A sophisticated database
A relational model and a database
Usage of standard database management system
(Ms-SQL in the demonstration)
A system compatible with Data and Metadata concept
(SDMX)
Many groups of fields and tables:
Data
Versions for complete tracking
Dimensions and codelists (SDMX compatible)
Formulas
Etc
16
The last generation of Ms-Windows objects
And comprehensive IS functionalities
A monitoring frame,
Mimic of Ms-Excel everywhere a sheet is manipulated,
Workspace and dynamic toolbars,
Docking station effects,
Eight statuses in the progress of the convergence of
commodity flows towards the convergence,
Full access to the compilation of models
Integration of the DISSEMINATION module
Visualisation of the historical data at any time
17
FUNCTIONALITIES : A spreadsheet approach
Mimic of Ms-Excel for a user-friendly environment
Interaction with sheet in a workbook
Full compatibility with Ms-Excel
Very fast learning phase regarding IT manipulations
Flexibility in the manipulation of the sheetFormulas in Ms-Excel format and through variable names,
Editable formulas
Coloured and locked cells,
Integrated balancing as a sheet in the workbook
Status of the balancing by layer of SUT
18
FUNCTIONALITIES: Others
A toolbar for each profile, the Coordinator and the National
Accountants
Immediate access to the actions by steps, in proper order
Mutual exclusion on forbidden actions
Contextual menu (right click)
The historical view: retrieval of all actions through
commenting areas
Coming: a manager for the implementation of CF standard
models
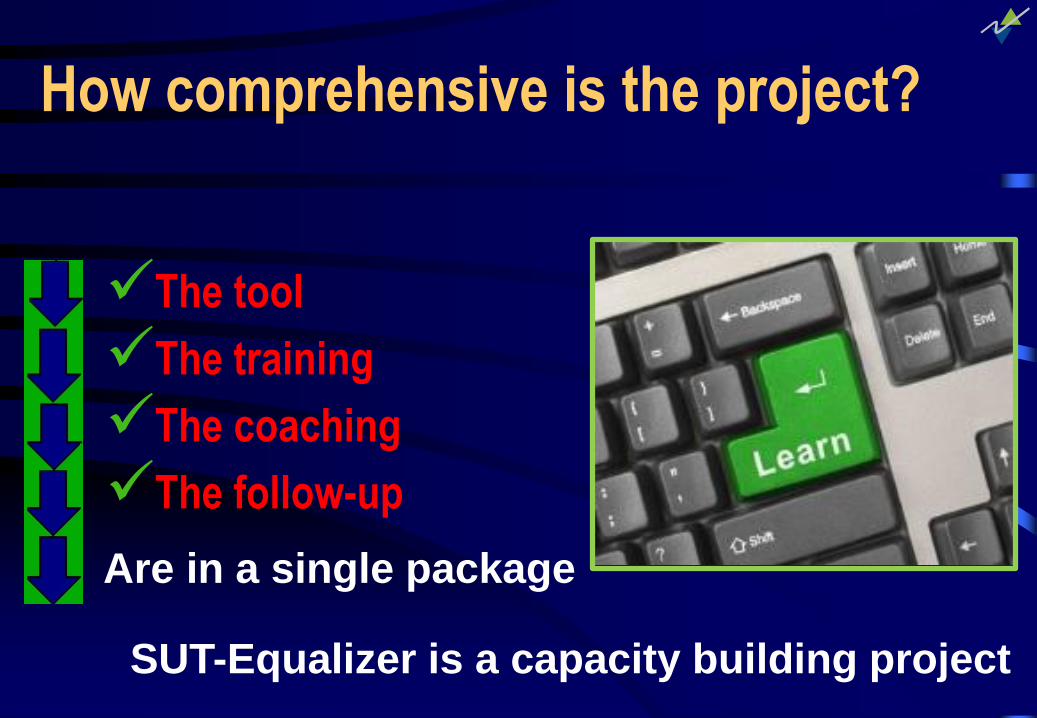
The tool
The training
The coaching
The follow-up
SUT-Equalizer is a capacity building project
Are in a single package
How comprehensive is the project?
20
THE TEAM: Pluri-displinary and adequate
From Hendyplan:
Through the intervention of a Field Expert
Assisted by:
Statisticians,
IT specialists to customize the tool,
Coordinated by a Project Manager
Plus the local team at the NSO
21
THE PHASES: Standardized
Kick-off meeting
Analysis of existing materials, choice of initial year,
Analysis of available indicators,
Definition of the main dimensions and their code-lists,
Identification of the standard models by product,
Initialization of the tables, the tools, the models, …
The tool is available
Implementation of the tool and first data at your premises,
Agreement on a coaching agenda,
Ideally during a 2-year period
And finally …
SUT-EQUALIZER PROJECT IS THE SUBSTRATUM FROM
WHERE THE CAPACITY BUILDING WILL BE EFFECTIVE
23
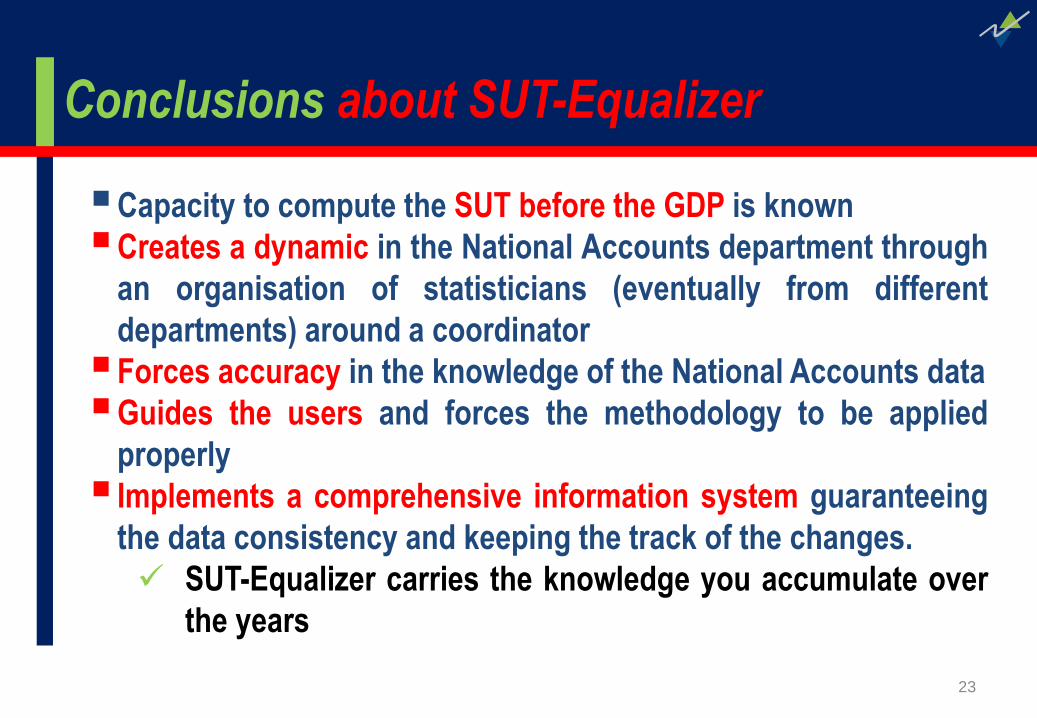
Conclusions about SUT-Equalizer
Capacity to compute the SUT before the GDP is known
Creates a dynamic in the National Accounts department through
an organisation of statisticians (eventually from different
departments) around a coordinator
Forces accuracy in the knowledge of the National Accounts data
Guides the users and forces the methodology to be applied
properly
Implements a comprehensive information system guaranteeing
the data consistency and keeping the track of the changes.
SUT-Equalizer carries the knowledge you accumulate over
the years

24SUT Equalizer: © Hendyplan SA (Antwerp, Belgium), 2014 and beyond.
FRANÇOIS LIBEAU, DIRECTOR
TEL: +352 2664 4424
Uitbreidingstraat 84/32600 BerchemBelgium
www.HENDYPLAN.com
Contact us …