Embed Size (px)
Citation preview
Sustainable use of inlet guide vanes toreduce energy consumption of main
ventilation fans
M.R. Zaaimanorcid.org 0000-0002-3298-0627
Dissertation accepted in fulfilment of the requirements for thedegree Master of Engineering in Electrical and Electronic
Engineering at the North-West University
Supervisor: Dr J. van Rensburg
Graduation: June 2021Student Number: 24889210

Title: Sustainable use of inlet guide vanes to reduce energy consumption ofmain ventilation fans
Author: M.R. ZaaimanSupervisor: Dr J. van RensburgUniversity: North-West University, Potchefstroom CampusDegree: Master of Engineering in Electrical and Electronic EngineeringKey words: Inlet guide vane (IGV), main ventilation fan (MVF), electrical cost saving,
energy efficiency, maintenance, ventilation
ABSTRACT
The rising cost of electricity has urged mines to research and implement new energy-savinginitiatives. Little research has focused on energy saving techniques on main ventilation fans(MVFs). MVFs extract hot, humid air from underground operations, which induces fresh airvia a downcast shaft. However, the operation of MVFs is an energy-intensive operation, withinstallations ranging from 1 MW to 10 MW. Incidentally, inlet guide vanes (IGVs) are one ofthe many methods that can be implemented to reduce the energy consumption of the MVFs.IGVs reduce the work of the impeller by reducing the volume drawn through the impeller.
IGVs are primarily installed as an energy-savings initiative on the MVF. However, IGVcontrol must be implemented with care to ensure that adequate ventilation is provided tounderground working areas. Therefore, a generic solution is proposed which aims to guideproject engineers and site personnel toward the sustainable implementation of IGV controlon MVFs. The solution will maintain ventilation requirements by actively monitoringreal-time data from underground environmental sensors measuring ventilation flow, dry-bulb,wet-bulb temperatures and air pressure. Furthermore, the integrity and operation of the MVFare maintained by condition monitoring of vibrations and bearing temperatures. Sustainablebenefits can be feasible and realised through active monitoring in the control of IGVs.
Therefore, to ensure sustainable operation of IGVs, a comprehensive investigation was doneinto common issues that arise from IGV control and the main cause behind previousinstallations’ failures. A case study was used to implement IGV control where previousIGVs had been installed but never utilised.
The chosen IGV control strategy determines the sustainability of IGV control. The proposedstrategy mentioned in this document was revised with the feedback from the activemonitoring of various factors, including condition monitoring of the MVF and undergroundventilation. Furthermore, to construct a sustainable control strategy, extensive testing wasconducted to ensure MVF vibrations were acceptable throughout all IGV positions. Upperand lower limits were set on the corresponding actuators to prevent detrimental vibrationsfrom not occurring during normal operation. A calibrated ventilation simulation model wasused to ensure adequate ventilation flow is provided to maintain a safe undergroundenvironment.
Page i
Previous IGV installations made use of an “open-design” that commonly corroded inside theMVF which resulted in detrimental failures that led to vanes being sucked through theimpeller. These design flaws were rectified by installing a sealed central hub. This unit issealed from corrosion and offers reduced maintenance intervals. Condition monitoringalongside the maintenance of key performance indicators improved IGV control on the MVF.
With condition monitoring capabilities alongside a maintenance plan, IGV control could beimplemented on mining main fans to realise sustainable energy savings. It was found that theenergy consumption can be reduced by 9% with a mere 2% reduction in volume extraction.The implementation of IGV control was able to achieve daily energy savings of 16.03 MWhin this case study, while realising electrical cost saving of R 4.6 million for the first year ofimplementation. With real-time data monitoring, underground ventilation requirements aremet to ensure a safe underground environment.
The implementation of the generic solution proposed by the author that revealed that IGVcontrol can achieve major energy savings, provide fan performance and, most importantly,sustain mining ventilation. The study further revealed that the improvements made to theinitial IGV design ultimately led to the sustainable implementation of IGV control on themain fans.
Page ii

ACKNOWLEDGEMENTS
I would like to dedicate this page to bring thanks to my supporters in completing my mastersdegree.
• Firstly, I would like to bring praise to my Lord and Helper for all the guidance andblessings he has bestowed upon my life. It is through Him that I am capable of achievingmy goals.
• To my dearest wife Chantal Zaaiman, without your patience and motivation I would nothave been able to complete the task set before me.
• A huge thanks to my parents, Greg and Christa Bellis, that provided me with theopportunity to further my studies and the motivation they provided.
• A thanks to my brother Lleyton Bellis for his humour and motivation.
• Thanks to Enermanage (Pty) Ltd for the financial assistance provided to complete mystudies.
• I would like to thank Dr Johann van Rensburg for his guidance and mentorship in thecompletion of my studies.
• A thanks to all my colleagues advise and motivation throughout this venture.
Page iii
CONTENTS
CONTENTS
1 Introduction 1
1.1 Background . . . . . . . . . . . . . . . . . . . . . . . . . . . . . . . . . . . 1
1.2 South African gold mining industry . . . . . . . . . . . . . . . . . . . . . . 1
1.2.1 The importance of energy-savings initiatives on energy intensiveoperations . . . . . . . . . . . . . . . . . . . . . . . . . . . . . . . . 3
1.2.2 Energy distribution on a deep-level gold mine . . . . . . . . . . . . . 4
1.3 Main ventilation fan (MVF) . . . . . . . . . . . . . . . . . . . . . . . . . . 5
1.3.1 Centrifugal fan . . . . . . . . . . . . . . . . . . . . . . . . . . . . . 6
1.3.2 Mining main fans . . . . . . . . . . . . . . . . . . . . . . . . . . . . 7
1.3.3 Mining ventilation networks . . . . . . . . . . . . . . . . . . . . . . 8
1.4 Energy savings on MVFs . . . . . . . . . . . . . . . . . . . . . . . . . . . . 12
1.4.1 Main fan damper control . . . . . . . . . . . . . . . . . . . . . . . . 14
1.4.2 Variable speed drive (VSD) . . . . . . . . . . . . . . . . . . . . . . 14
1.4.3 Inlet guide vanes . . . . . . . . . . . . . . . . . . . . . . . . . . . . 15
1.5 Inlet guide vanes (IGVs) . . . . . . . . . . . . . . . . . . . . . . . . . . . . 17
1.5.1 Impact of IGV control on mining ventilation and main fan operation . 18
1.5.2 Common issues experienced with IGV control . . . . . . . . . . . . 20
1.6 Summary . . . . . . . . . . . . . . . . . . . . . . . . . . . . . . . . . . . . 22
1.7 Need for the study . . . . . . . . . . . . . . . . . . . . . . . . . . . . . . . . 24
1.8 Overview of this document . . . . . . . . . . . . . . . . . . . . . . . . . . . 25
2 Development of solution 26
2.1 Introduction . . . . . . . . . . . . . . . . . . . . . . . . . . . . . . . . . . . 26
2.2 Feasibility study . . . . . . . . . . . . . . . . . . . . . . . . . . . . . . . . . 29
2.3 IGV simulation and impact study . . . . . . . . . . . . . . . . . . . . . . . . 31
2.4 Implementation strategy . . . . . . . . . . . . . . . . . . . . . . . . . . . . 33
Page iv
CONTENTS
2.4.1 Installation . . . . . . . . . . . . . . . . . . . . . . . . . . . . . . . 33
2.4.2 Implementation . . . . . . . . . . . . . . . . . . . . . . . . . . . . . 36
2.4.3 Control strategy . . . . . . . . . . . . . . . . . . . . . . . . . . . . . 37
2.5 Condition monitoring . . . . . . . . . . . . . . . . . . . . . . . . . . . . . . 40
2.6 Verification . . . . . . . . . . . . . . . . . . . . . . . . . . . . . . . . . . . 41
2.7 Conclusion . . . . . . . . . . . . . . . . . . . . . . . . . . . . . . . . . . . 41
3 Results 43
3.1 Overview of case study . . . . . . . . . . . . . . . . . . . . . . . . . . . . . 43
3.1.1 Mine layout . . . . . . . . . . . . . . . . . . . . . . . . . . . . . . . 44
3.1.2 Ventilation fans of mine A . . . . . . . . . . . . . . . . . . . . . . . 45
3.1.3 Ventilation fans of mine B . . . . . . . . . . . . . . . . . . . . . . . 47
3.1.4 Previous IGV installation on mine A and B . . . . . . . . . . . . . . 48
3.1.5 Improved IGV design . . . . . . . . . . . . . . . . . . . . . . . . . . 48
3.2 Feasibility study . . . . . . . . . . . . . . . . . . . . . . . . . . . . . . . . . 49
3.2.1 Technical feasibility . . . . . . . . . . . . . . . . . . . . . . . . . . 49
3.2.2 Economic feasibility . . . . . . . . . . . . . . . . . . . . . . . . . . 49
3.2.3 Legal requirements (mining ventilation) . . . . . . . . . . . . . . . . 50
3.2.4 Risk analysis . . . . . . . . . . . . . . . . . . . . . . . . . . . . . . 51
3.2.5 Mine A . . . . . . . . . . . . . . . . . . . . . . . . . . . . . . . . . 51
3.2.6 Mine B . . . . . . . . . . . . . . . . . . . . . . . . . . . . . . . . . 52
3.3 Preliminary impact study . . . . . . . . . . . . . . . . . . . . . . . . . . . . 53
3.4 Simulation results . . . . . . . . . . . . . . . . . . . . . . . . . . . . . . . . 54
3.5 Baseline measurements . . . . . . . . . . . . . . . . . . . . . . . . . . . . . 57
3.6 Installation . . . . . . . . . . . . . . . . . . . . . . . . . . . . . . . . . . . 60
3.7 Testing procedure results . . . . . . . . . . . . . . . . . . . . . . . . . . . . 63
3.7.1 Equipment . . . . . . . . . . . . . . . . . . . . . . . . . . . . . . . 63
Page v
CONTENTS
3.7.2 Preparation . . . . . . . . . . . . . . . . . . . . . . . . . . . . . . . 64
3.7.3 Results . . . . . . . . . . . . . . . . . . . . . . . . . . . . . . . . . 64
3.7.4 Summary . . . . . . . . . . . . . . . . . . . . . . . . . . . . . . . . 68
3.8 Proposed control strategy . . . . . . . . . . . . . . . . . . . . . . . . . . . . 71
3.8.1 Phase 1 . . . . . . . . . . . . . . . . . . . . . . . . . . . . . . . . . 72
3.8.2 Phase 2 . . . . . . . . . . . . . . . . . . . . . . . . . . . . . . . . . 72
3.8.3 Phase 3 . . . . . . . . . . . . . . . . . . . . . . . . . . . . . . . . . 73
3.8.4 Phase 4 . . . . . . . . . . . . . . . . . . . . . . . . . . . . . . . . . 74
3.8.5 Summary . . . . . . . . . . . . . . . . . . . . . . . . . . . . . . . . 74
3.9 Implementation . . . . . . . . . . . . . . . . . . . . . . . . . . . . . . . . . 76
3.9.1 Reduction in power . . . . . . . . . . . . . . . . . . . . . . . . . . . 76
3.9.2 Condition monitoring . . . . . . . . . . . . . . . . . . . . . . . . . . 77
3.9.3 Business case . . . . . . . . . . . . . . . . . . . . . . . . . . . . . . 80
3.9.4 Maintenance . . . . . . . . . . . . . . . . . . . . . . . . . . . . . . 81
3.10 Conclusion . . . . . . . . . . . . . . . . . . . . . . . . . . . . . . . . . . . 82
4 Conclusion 84
4.1 Summary . . . . . . . . . . . . . . . . . . . . . . . . . . . . . . . . . . . . 84
4.2 Recommendations . . . . . . . . . . . . . . . . . . . . . . . . . . . . . . . . 86
References 87
A Appendix - Technical drawings of IGV 91
B Appendix - Simulation results 96
C Appendix - Baseline results 102
D Appendix - Impact of IGV installation on individual fans 104
Page vi

CONTENTS
E Appendix - Measurement equipment 108
F Appendix - MPL data analysis 109
G Appendix - Main fan performance 113
H Appendix - Maintenance procedure 115
Page vii
LIST OF FIGURES
LIST OF FIGURES
1.1 Eskom’s annual tariff adjustment [6] . . . . . . . . . . . . . . . . . . . . . . 2
1.2 Eskom time of use (TOU) tariff - High- and low-demand season . . . . . . . 4
1.3 Energy distribution on deep-level gold mines . . . . . . . . . . . . . . . . . 5
1.4 Centrifugal impeller characteristics adapted from [15] . . . . . . . . . . . . . 7
1.5 Essential elements to mining ventilation [15] . . . . . . . . . . . . . . . . . 9
1.6 Mining main ventilation fans [24] . . . . . . . . . . . . . . . . . . . . . . . 10
1.7 Mining underground booster fans [25] . . . . . . . . . . . . . . . . . . . . . 10
1.8 Main fan impeller [24] . . . . . . . . . . . . . . . . . . . . . . . . . . . . . 11
1.9 Mining main fan schematic overview [24] . . . . . . . . . . . . . . . . . . . 12
1.10 Industrial fan damper control system [24] . . . . . . . . . . . . . . . . . . . 14
1.11 Impact VSD control on fan pressure/power vs volume characteristics adaptedfrom [34] . . . . . . . . . . . . . . . . . . . . . . . . . . . . . . . . . . . . 15
1.12 Common IGV design principle . . . . . . . . . . . . . . . . . . . . . . . . . 16
1.13 Relative power consumption among flow control devices [2] . . . . . . . . . 17
1.14 Airflow lines moving through IGV [34] . . . . . . . . . . . . . . . . . . . . 18
1.15 Impact IGV control on MVF pressure/power vs volume characteristicsadapted from [34] . . . . . . . . . . . . . . . . . . . . . . . . . . . . . . . 19
1.16 Open IGV design used in mining ventilation . . . . . . . . . . . . . . . . . . 21
2.1 Overview of a mining MVF . . . . . . . . . . . . . . . . . . . . . . . . . . . 26
2.2 Development of the solution . . . . . . . . . . . . . . . . . . . . . . . . . . 27
2.3 Volume survey measuring points . . . . . . . . . . . . . . . . . . . . . . . . 32
2.4 Proposed control strategy for phased implementation of IGV control . . . . . 38
2.5 Proposed IGV control angles . . . . . . . . . . . . . . . . . . . . . . . . . . 39
3.1 Combined energy distribution for mine A and B . . . . . . . . . . . . . . . . 44
3.2 Case study mining layout . . . . . . . . . . . . . . . . . . . . . . . . . . . . 45
3.3 Main fans located at mine A . . . . . . . . . . . . . . . . . . . . . . . . . . 45
Page viii
LIST OF FIGURES
3.4 Results obtained during weekend shutdown . . . . . . . . . . . . . . . . . . 53
3.5 Results obtained during December shutdown . . . . . . . . . . . . . . . . . 55
3.6 Level intake temperatures at varying flow rates . . . . . . . . . . . . . . . . 56
3.7 98L cross-cut intake temperatures . . . . . . . . . . . . . . . . . . . . . . . 56
3.8 Weekday power baseline for mine A . . . . . . . . . . . . . . . . . . . . . . 58
3.9 Power baseline for mine B . . . . . . . . . . . . . . . . . . . . . . . . . . . 58
3.10 Vibration baseline for mine A . . . . . . . . . . . . . . . . . . . . . . . . . . 60
3.11 Impact of IGV installation on power consumption for mine A . . . . . . . . . 61
3.12 Impact of IGV installation on power consumption for mine B . . . . . . . . . 62
3.13 IGV installation . . . . . . . . . . . . . . . . . . . . . . . . . . . . . . . . . 62
3.14 Actuator installation for IGV control . . . . . . . . . . . . . . . . . . . . . . 63
3.15 Ventilation measurement results for mine A . . . . . . . . . . . . . . . . . . 65
3.16 Power consumption measurement results for mine A . . . . . . . . . . . . . 66
3.17 Vibration measurement results for mine A . . . . . . . . . . . . . . . . . . . 66
3.18 Measurement results from underground environmental sensors at mine A . . 67
3.19 Ventilation measurement results for mine B . . . . . . . . . . . . . . . . . . 68
3.20 Power consumption measurement results mine B . . . . . . . . . . . . . . . 68
3.21 Vibration measurement results for mine B . . . . . . . . . . . . . . . . . . . 69
3.22 Activity level at mine A station area . . . . . . . . . . . . . . . . . . . . . . 73
3.23 IGV control phases for mine A . . . . . . . . . . . . . . . . . . . . . . . . . 75
3.24 Power consumption implementation results for mine A . . . . . . . . . . . . 77
3.25 Vibration measurements results for main fan 2 . . . . . . . . . . . . . . . . . 78
3.26 Reporting format used to report on mining ventilation . . . . . . . . . . . . . 79
3.27 Ventilation results for 85L intake . . . . . . . . . . . . . . . . . . . . . . . . 79
3.28 Implementation results for 95L intake . . . . . . . . . . . . . . . . . . . . . 80
3.29 Mine B, shear pin failure . . . . . . . . . . . . . . . . . . . . . . . . . . . . 82
Page ix
LIST OF TABLES
LIST OF TABLES
1.1 State-of-the-art matrix indicating gaps in past studies . . . . . . . . . . . . . 24
3.1 Fan motor characteristics of mine A . . . . . . . . . . . . . . . . . . . . . . 46
3.2 Fan motor characteristics of mine B . . . . . . . . . . . . . . . . . . . . . . 47
3.3 Initial capital expenditure for IGVs . . . . . . . . . . . . . . . . . . . . . . . 50
3.4 IGV control risk analysis . . . . . . . . . . . . . . . . . . . . . . . . . . . . 51
3.5 Weekend results summary . . . . . . . . . . . . . . . . . . . . . . . . . . . 54
3.6 Simulation results for mine A . . . . . . . . . . . . . . . . . . . . . . . . . . 57
3.7 Underground environmental baseline results . . . . . . . . . . . . . . . . . . 59
3.8 Condition monitoring operational limits . . . . . . . . . . . . . . . . . . . . 60
3.9 Measurement equipment . . . . . . . . . . . . . . . . . . . . . . . . . . . . 63
3.10 Ventilation measurement test results for mine A . . . . . . . . . . . . . . . . 65
3.11 Ventilation measurement test results for mine B . . . . . . . . . . . . . . . . 67
3.12 Comparison between simulated results and actual results for mine A . . . . . 69
3.13 Mine A test results summary . . . . . . . . . . . . . . . . . . . . . . . . . . 70
3.14 Mine B test results summary . . . . . . . . . . . . . . . . . . . . . . . . . . 70
3.15 Expected cost savings from implementation . . . . . . . . . . . . . . . . . . 75
3.16 Actual results obtained from the implementation of IGV control on mine A . 76
3.17 IGV manufacturing and installation costs (excl. VAT) . . . . . . . . . . . . . 80
3.18 Mine A power reduction results comparison . . . . . . . . . . . . . . . . . . 83
Page x
LIST OF TABLES
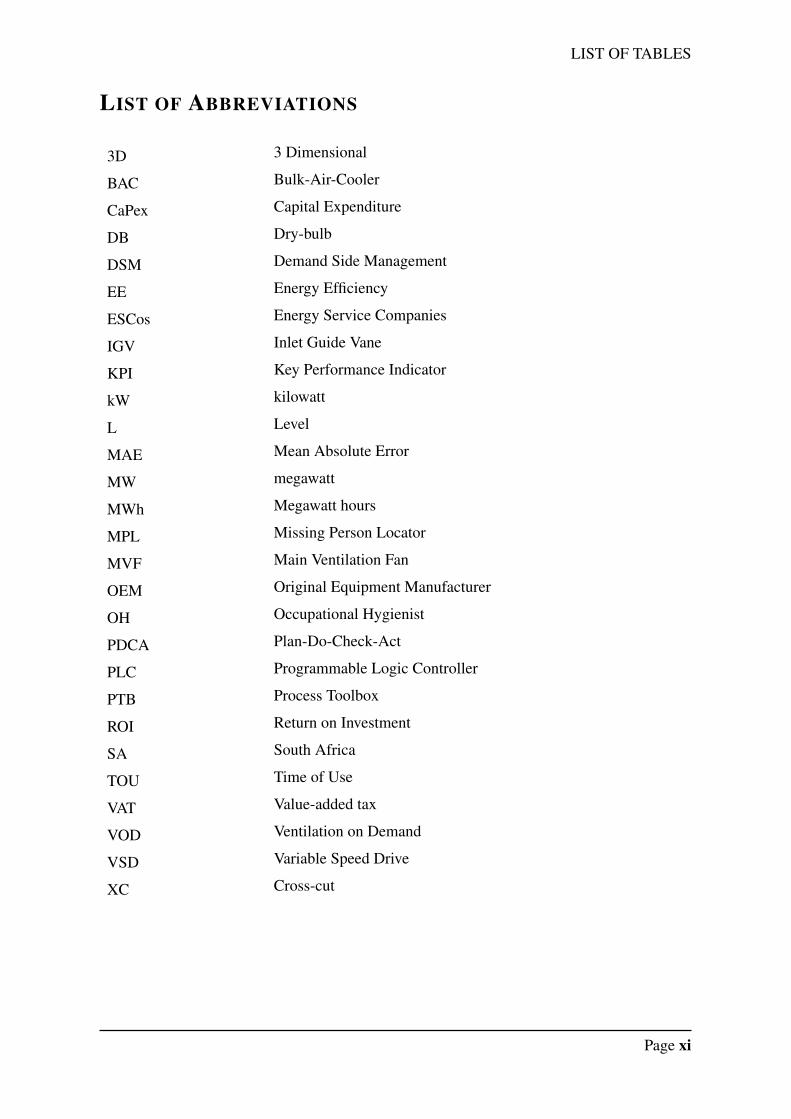
LIST OF ABBREVIATIONS
3D 3 Dimensional
BAC Bulk-Air-Cooler
CaPex Capital Expenditure
DB Dry-bulb
DSM Demand Side Management
EE Energy Efficiency
ESCos Energy Service Companies
IGV Inlet Guide Vane
KPI Key Performance Indicator
kW kilowatt
L Level
MAE Mean Absolute Error
MW megawatt
MWh Megawatt hours
MPL Missing Person Locator
MVF Main Ventilation Fan
OEM Original Equipment Manufacturer
OH Occupational Hygienist
PDCA Plan-Do-Check-Act
PLC Programmable Logic Controller
PTB Process Toolbox
ROI Return on Investment
SA South Africa
TOU Time of Use
VAT Value-added tax
VOD Ventilation on Demand
VSD Variable Speed Drive
XC Cross-cut
Page xi
1. INTRODUCTION
1 INTRODUCTION
1.1 BACKGROUND
The ever-increasing cost of electricity during the past couple of years in South Africa hasurged mines to seek more energy-saving initiatives. Due to the rising costs, deep-level minesare in search of new energy-saving initiatives to implement. To aid in the reduction ofelectrical costs. Furthermore, research has shown that mining production has not improvedsignificantly since 2009 [1], while mining costs has continued to increase on an annual basis.Implementing energy-saving initiatives can improve the mine’s fiscal outlook, by reducingtheir daily electricity consumption.
Numerous energy-saving initiatives have been implemented on the major energy loads on adeep-level mine. However, little research has been conducted on energy-saving initiatives onthe main ventilation fan (MVF) systems of deep-level gold mines. Ventilation, a large energyconsumer on a deep-level gold mine, is often over-sized due to the uncertainties confrontedby designers [2]. Inlet guide vanes (IGVs) can be used to reduce the energy consumption ofthe MVFs found on deep-level gold mines [3]. By following a systematised approach for theinstallation and implementation of IGV control on MVFs, significant energy savings can berealised.
MVFs provide sufficient airflow to maintain a safe underground environment. Therefore, IGVcontrol should not neglect the health and safety of employees working in the undergroundenvironment. A safe and habitable underground environment should always be of the highestpriority, above energy savings that could arise from the utilisation of IGVs. Through activemonitoring of underground temperatures and ventilation, energy savings can be realised whilestill providing adequate ventilation to underground operations.
1.2 SOUTH AFRICAN GOLD MINING INDUSTRY
The South African gold mining industry’s production has decreased year-on-year from 2018to 2019 by 20.4% [4]. South African gold mines face numerous challenges that crippleproductivity and profit. According to Neingo et al. [5], the South African gold miningindustry has been losing its competitiveness due to challenges arising from various technical,economic, social, and operational challenges that are unique to the country. The maincontributing factors as discussed in Neingo’s study [5] are gold price volatility, escalatingcosts of production, the declining grade of gold-ore, the ever-increasing depths of mining,and labour issues.
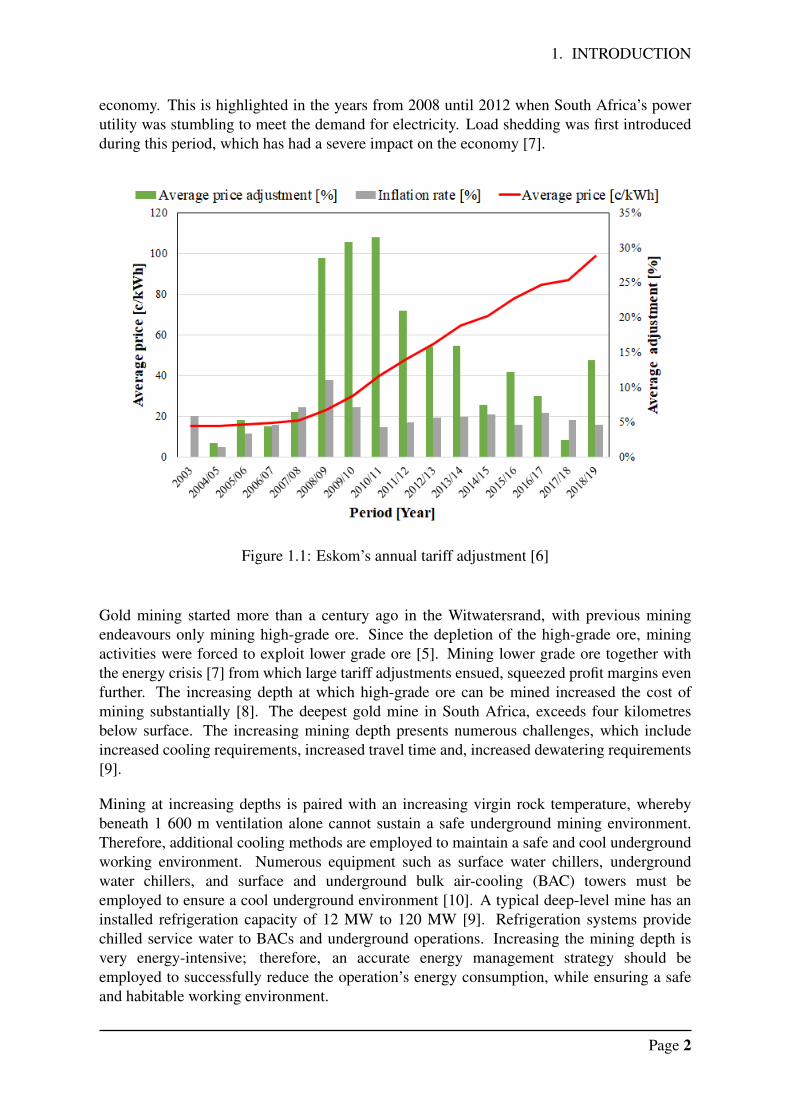
Mining companies have been facing rising input costs since the start of the energy crisis; thecost of electricity has increased with 115% between 2010 to 2019 [6]. Figure 1.1 showsEskom’s tariff adjustments, which had a tremendous impact on all energy-intensiveoperations. Figure 1.1 indicates that average tariff adjustments compared with that of theyearly inflation (consumer price index) rate. Tariff adjustments above that of the consumerprice index highlight the severity of the adjustments and their possible impact on the
Page 1
1. INTRODUCTION
economy. This is highlighted in the years from 2008 until 2012 when South Africa’s powerutility was stumbling to meet the demand for electricity. Load shedding was first introducedduring this period, which has had a severe impact on the economy [7].
Figure 1.1: Eskom’s annual tariff adjustment [6]
Gold mining started more than a century ago in the Witwatersrand, with previous miningendeavours only mining high-grade ore. Since the depletion of the high-grade ore, miningactivities were forced to exploit lower grade ore [5]. Mining lower grade ore together withthe energy crisis [7] from which large tariff adjustments ensued, squeezed profit margins evenfurther. The increasing depth at which high-grade ore can be mined increased the cost ofmining substantially [8]. The deepest gold mine in South Africa, exceeds four kilometresbelow surface. The increasing mining depth presents numerous challenges, which includeincreased cooling requirements, increased travel time and, increased dewatering requirements[9].
Mining at increasing depths is paired with an increasing virgin rock temperature, wherebybeneath 1 600 m ventilation alone cannot sustain a safe underground mining environment.Therefore, additional cooling methods are employed to maintain a safe and cool undergroundworking environment. Numerous equipment such as surface water chillers, undergroundwater chillers, and surface and underground bulk air-cooling (BAC) towers must beemployed to ensure a cool underground environment [10]. A typical deep-level mine has aninstalled refrigeration capacity of 12 MW to 120 MW [9]. Refrigeration systems providechilled service water to BACs and underground operations. Increasing the mining depth isvery energy-intensive; therefore, an accurate energy management strategy should beemployed to successfully reduce the operation’s energy consumption, while ensuring a safeand habitable working environment.
Page 2
1. INTRODUCTION
Alongside the increasing depth of mining, mining at increasing depth is extremely labourintensive. With an average stoping width of 1 m, the employment of equipment is restricted,often making deep-level mining reliant on a large labour force. Therefore, labour unrest hasthe possibility to cripple labour-intensive operations in South-Africa. Furthermore, unionsbargaining for higher wages often lead to protests and strikes, which may result in majorproduction losses [5].
Increasing input costs has urged energy-intensive mining operations to implementcost-saving initiatives to mitigate the decreasing profit margins. Since the cost of electricityhas increased with approximately 115% [6], mines, together with Eskom, researched andimplemented energy savings initiatives to assist in reducing the total energy demand,especially during Eskom’s peak demand periods.
1.2.1 The importance of energy-savings initiatives on energy intensive operations
The ever-increasing cost of electricity has urged energy-intensive industries to reduce theirelectricity consumption to curb the rising operational expenditure. Energy service companies(ESCos) have been established to assist Eskom in managing energy-intensive projects in SouthAfrica [11]. ESCos have been serving Eskom since the onset of the energy crisis in SouthAfrica. Through the implementation of energy-saving initiatives, energy demand is reducedin critical peak periods, generating benefits for Eskom and the energy user.
Popular methods to reduce energy consumption and the associated costs include implementingenergy-efficiency (EE) and demand-side management (DSM) projects. Research shows thatthe implementation of these projects achieved significant relief for Eskom and the energyuser [12] [13]. Sustaining energy-saving initiatives requires active involvement through asimple cycle, namely the Plan-Do-Check-Act (PDCA) cycle, which requires the re-evaluationof active projects and their performance. A reduction in energy usage helps to stabilise thenational electric grid while minimising the electrical expenditure for the end user [11].
DSM is the collaboration between the energy supplier and the end-user, whereby energyconsumption is reduced during certain periods of the day (load management) or by reductionof energy consumption throughout the day (EE) [12].
EE projects aim to reduce the energy consumption throughout the day. EE projects arecommonly implemented on refrigeration systems and compressed air systems. The energyconsumption of these systems is reduced by a constant factor throughout the day [11]. Forexample, the optimisation of compressed air leaks will decrease demand, which will lead toenergy savings throughout the day.
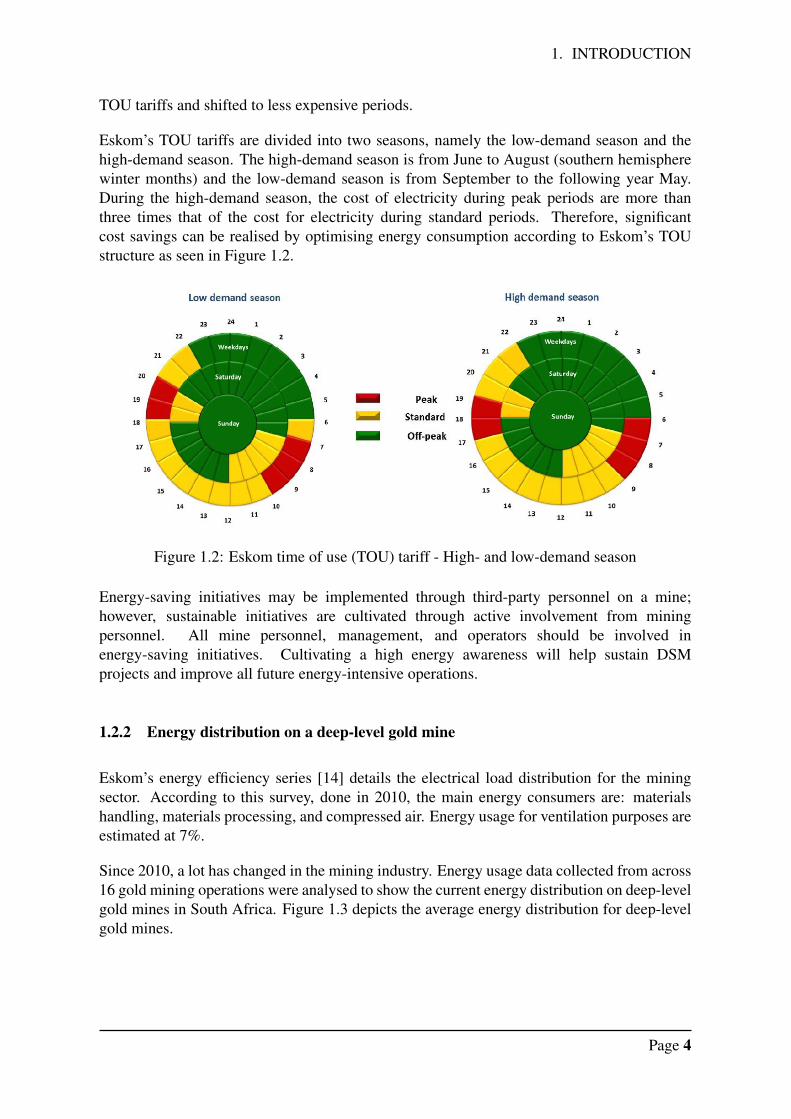
Load management projects offer short-term relief to energy suppliers in peak demandperiods. The aim of load-shifting projects is to reduce the energy consumption during peaktime-of-use periods as specified by Eskom [11] [12]. Eskom’s time-of-use (TOU) tariffs (asseen in Figure 1.2) are extremely expensive during peak demand periods, as they are aimedspecifically at motivating energy-intensive end users to reduce their energy consumptionduring these periods. For example, a load-shift project can be implemented on a mine’sdewatering system - by making use of dam capacities, pumping can be stopped during peak
Page 3
1. INTRODUCTION
TOU tariffs and shifted to less expensive periods.
Eskom’s TOU tariffs are divided into two seasons, namely the low-demand season and thehigh-demand season. The high-demand season is from June to August (southern hemispherewinter months) and the low-demand season is from September to the following year May.During the high-demand season, the cost of electricity during peak periods are more thanthree times that of the cost for electricity during standard periods. Therefore, significantcost savings can be realised by optimising energy consumption according to Eskom’s TOUstructure as seen in Figure 1.2.
Figure 1.2: Eskom time of use (TOU) tariff - High- and low-demand season
Energy-saving initiatives may be implemented through third-party personnel on a mine;however, sustainable initiatives are cultivated through active involvement from miningpersonnel. All mine personnel, management, and operators should be involved inenergy-saving initiatives. Cultivating a high energy awareness will help sustain DSMprojects and improve all future energy-intensive operations.
1.2.2 Energy distribution on a deep-level gold mine
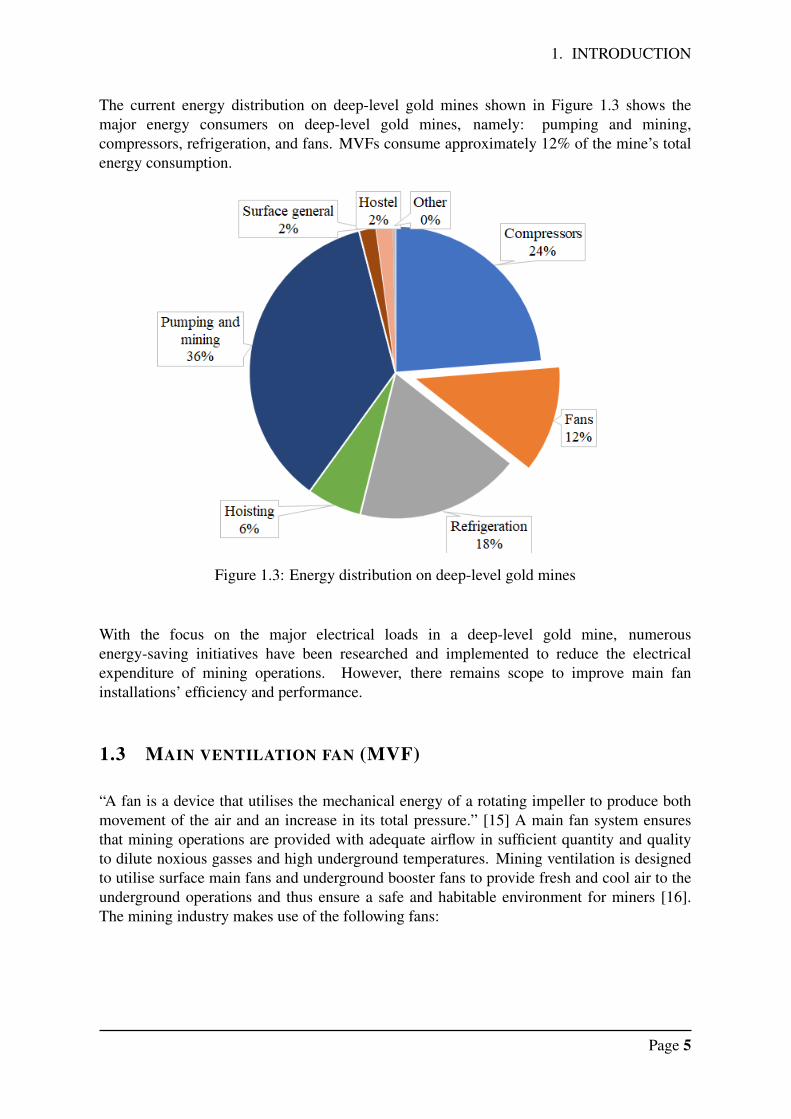
Eskom’s energy efficiency series [14] details the electrical load distribution for the miningsector. According to this survey, done in 2010, the main energy consumers are: materialshandling, materials processing, and compressed air. Energy usage for ventilation purposes areestimated at 7%.
Since 2010, a lot has changed in the mining industry. Energy usage data collected from across16 gold mining operations were analysed to show the current energy distribution on deep-levelgold mines in South Africa. Figure 1.3 depicts the average energy distribution for deep-levelgold mines.
Page 4
1. INTRODUCTION
The current energy distribution on deep-level gold mines shown in Figure 1.3 shows themajor energy consumers on deep-level gold mines, namely: pumping and mining,compressors, refrigeration, and fans. MVFs consume approximately 12% of the mine’s totalenergy consumption.
Figure 1.3: Energy distribution on deep-level gold mines
With the focus on the major electrical loads in a deep-level gold mine, numerousenergy-saving initiatives have been researched and implemented to reduce the electricalexpenditure of mining operations. However, there remains scope to improve main faninstallations’ efficiency and performance.
1.3 MAIN VENTILATION FAN (MVF)
“A fan is a device that utilises the mechanical energy of a rotating impeller to produce bothmovement of the air and an increase in its total pressure.” [15] A main fan system ensuresthat mining operations are provided with adequate airflow in sufficient quantity and qualityto dilute noxious gasses and high underground temperatures. Mining ventilation is designedto utilise surface main fans and underground booster fans to provide fresh and cool air to theunderground operations and thus ensure a safe and habitable environment for miners [16].The mining industry makes use of the following fans:
Page 5
1. INTRODUCTION
1. Centrifugal fan (radial fan)
• Generate relatively high pressures
• Frequently used in ”dirty” air-streams (high moisture and particle content)
• Known to be more efficient and reliable [2]
2. Axial fans
• Commonly found in low-pressure, high-volume applications
• Commonly used in ”clean” air applications
• Have less rotating mass and are more compact than centrifugal fans of the samecapacity [2]
Centrifugal fans are commonly used on the surface as the main ventilation fans, orunderground as large booster fans (greater than 150 kW) to further distribute fresh air toworking areas. Furthermore, axial fans are used where a high flow rate is required. Axialfans are commonly employed as small booster fans, which supplies airflow to enclosedworking areas.
Mining networks must be ventilated through the selection of a main fan which will providethe required mass flow at a specific operating pressure. However, due to the large array ofcentrifugal fans available, the selection process can become tedious.
MVF selection is a complicated process. Basic knowledge of the following system operatingrequirements such as airflow rates, temperatures, pressures, and the air-stream properties areimportant [2]. These alone are based on the operational requirements for mining ventilation,where additional factors such as costs, maintenance, operating conditions, and operating lifeshould also be considered [15].
1.3.1 Centrifugal fan
A centrifugal fan draws air to the centre of the impeller, turns through a right angle and, as itmoves outwards radially, increases in static pressure due to the centrifugal forces. The airflowfollows the volute and exits at a higher velocity and pressure through the evase [15].
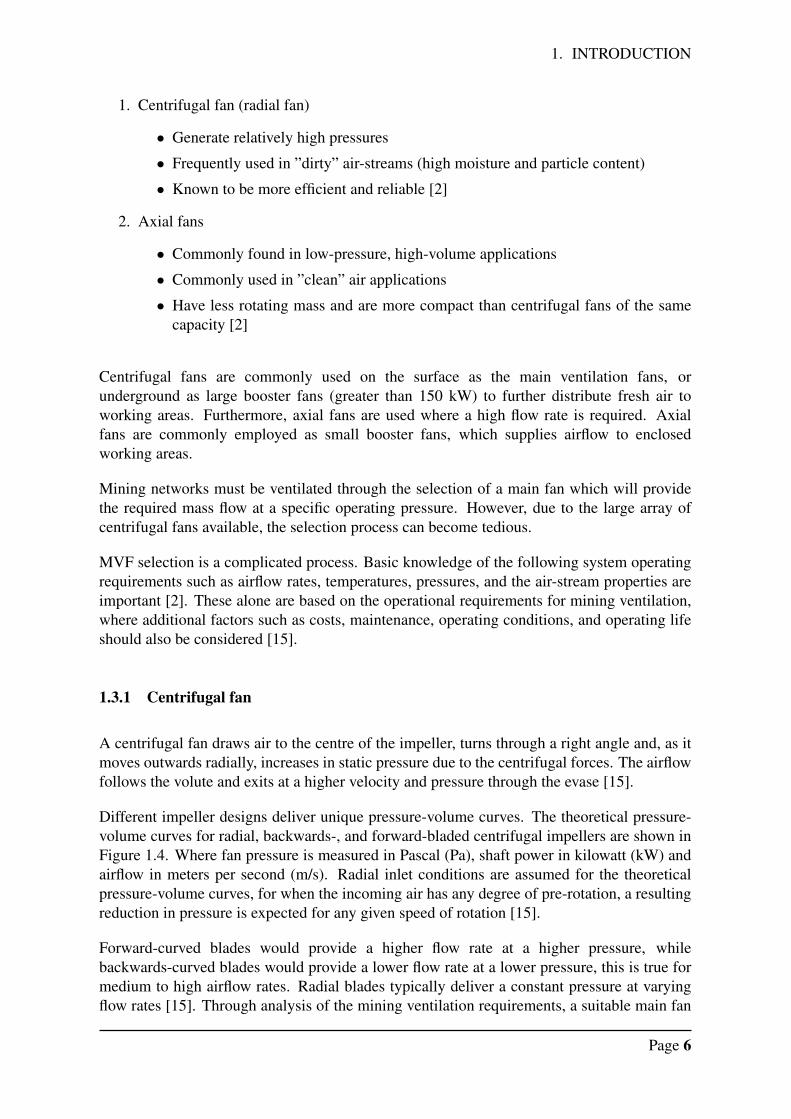
Different impeller designs deliver unique pressure-volume curves. The theoretical pressure-volume curves for radial, backwards-, and forward-bladed centrifugal impellers are shown inFigure 1.4. Where fan pressure is measured in Pascal (Pa), shaft power in kilowatt (kW) andairflow in meters per second (m/s). Radial inlet conditions are assumed for the theoreticalpressure-volume curves, for when the incoming air has any degree of pre-rotation, a resultingreduction in pressure is expected for any given speed of rotation [15].
Forward-curved blades would provide a higher flow rate at a higher pressure, whilebackwards-curved blades would provide a lower flow rate at a lower pressure, this is true formedium to high airflow rates. Radial blades typically deliver a constant pressure at varyingflow rates [15]. Through analysis of the mining ventilation requirements, a suitable main fan
Page 6
1. INTRODUCTION
selection can be made. However, improper selection may result in significant energy wastageand unwanted fan performance deviations.
Figure 1.4: Centrifugal impeller characteristics adapted from [15]
McPherson et al. [15] provides extensive insight and research into main fan selection and thetheory supporting the workings of centrifugal fans.
1.3.2 Mining main fans
Ventilation systems are often equipped with large-scale industrial fans of high power up to3 megawatt (MW). Operation of these large scale fans often suffer from vibration problemsresulting from the large rotating masses and complex flow phenomena inside the fan casing.Vibrations occur in all rotational machinery, in steady and unsteady states of operation,which can originate from various factors, such as an unbalanced fan impeller, gear meshingor improper main fan operation (can include electrical motor and fan alignment). Vibrationsare not limited to the operation of the fan and consequently occur during startup andshutdown, often passing through various resonant frequencies [17].
High powered ventilation fans draw a considerable amount of air through the fan impeller,providing another source of vibrations originating from complex and multiple flowphenomena. As per theory and standard rules, fans must operate on the right side of the fancharacteristic curve (known as the stable operating range) [17], which ensures that there isenough stabilising flow to dampen excessive vibrations. Upstream flow disturbances areoften another trigger for fan vibrations, however, these vibration issues are often addressedduring the design phase, to ensure such vibration does not occur during normaloperation [17].
MVF’s are considered as critical mining equipment that ensures a safe and habitableunderground environment [8] [18]. Therefore, a good maintenance strategy is beneficial toensure optimal performance and operation of critical equipment. Unfortunately, the SouthAfrican mining industry often bases their maintenance strategies on lagging indicators [19].
Page 7
1. INTRODUCTION
Mines commonly implement a corrective maintenance strategy for critical mining ventilationequipment 1.
High powered industrial fans are commonly maintained by following a preventativemaintenance approach [17]. Therefore, predictive maintenance is often employed, whichremains a cost-effective solution to resolve machinery problems and maintain mechanicaloperation and performance. Vibration monitoring is a proven predictive tool that can be usedfor predictive maintenance and, numerous solutions exist for the analysis of the vibrationinformation [20]. Furthermore, a successful predictive maintenance programme relies onquality information and effective analysis to make good maintenance decisions based on theinformation [21].
1.3.3 Mining ventilation networks
Mining ventilation utilises both centrifugal and axial fans. As seen in Figure 1.5, the mainfan is commonly found on surface, where-as booster fans are located underground. Axialfans are used in high flow and low pressure applications as booster fans as seen in Figure 1.7,and centrifugal fans are used in high flow, high pressure applications as main fans as seen inFigure 1.6. Figure 1.5 displays the essential components of mining ventilation.
“Ventilation is defined as the control of fresh air supplied to active working areas and theremoval of heat” [8]. Fresh air ensures that a cool underground working environment ismaintained, which in turn ensures worker efficiency and productivity. Working areas arerequired by law to be kept at a dry-bulb temperature of less than 37 ◦C and wet-bulbtemperature of 32.5 ◦C [8] [18]. Therefore, air is needed in sufficient quality and quantity tomaintain an adequate working environment.
The MVF supplies the bulk airflow through the mine, while booster fans circulate fresh airthrough the working areas. Fresh air is drawn in via the down-cast shaft, while hot, humidair is extracted via the up-cast shaft [8]. Stoppings and seals are used to seal off old miningareas that no longer require ventilation and these areas are then barricaded to prevent theshort-circuiting of fresh air. Doors and airlocks further prevent fresh air from short-circuiting,thus forcing the fresh air through the active working areas known as the stopes [15]. All thesecomponents form part of the few mentioned essential components found in the ventilationnetwork displayed in Figure 1.5.
1Mechanical foreman at mine A - H. Moore, Predictive and corrective maintenance procedures, 12 February2020
Page 8
1. INTRODUCTION
Figure 1.5: Essential elements to mining ventilation [15]
A generic overview of a basic mining ventilation network is shown in Figure 1.5. In reality,mining networks are rarely as simplistic, especially with the ever-increasing depth of mining.
Figure 1.5 shows the positioning of main fans and booster fans. These equipment is usedin conjunction with stoppings, air crossings, and ventilation doors to ensure that fresh air issupplied to the working areas. Fresh air at a temperature of less than the legal requirement isneeded in sufficient quantities to maintain a safe and habitable working environment. As theair passes through the working areas heat is transferred from the rock and other heat sourcesto the air. Therefore, additional cooling is often required in the form of BAC towers and spotcoolers (cooling cars) to ensure that a cool working environment is maintained.
Furthermore, deep-level gold mines are nearing depths of 4 000 meters below the surfacewhere virgin rock temperatures of more than 60 ◦C can be expected [22] [23]. To ventilate alarge mining network adequately, numerous surface extraction fans and underground boosterfans are needed, as shown in Figure 1.6 and 1.7, respectively. Mining ventilation networksconsist of hundreds of interconnected sections and airways, raises, cross-cuts, raise boreholes,ventilation doors, travelling ways, airflow regulators and vent shafts [18]. All these ventilationcomponent are needed to ensure that a safe working environment is maintained.
MVF installations can be configured in three distinct designs. The main fans can be used toextract hot air from the mine, an exhausting system, or it can be configured to blow air into themine, a forcing system. Another combination entails connecting a forcing and extracting fan,creating a push-pull system [15]. The most common system found on a deep-level gold mineis the exhausting system [2] [8] [15], with MVF installations generally located on surface asdepicted in Figure 1.6.
Due to the ever-expanding mining networks and complexity of mining ventilation, variousmethods have been researched to assist mine personnel and engineers to ventilate undergroundoperations adequately. Therefore, simulation software can be used to help engineers andoccupational hygienists (OH) ventilate the mine adequately [18] [26] [27] [28] [29].
Page 9
1. INTRODUCTION
Figure 1.6: Mining main ventilation fans [24]
Figure 1.7: Mining underground booster fans [25]
The power of computer-aided simulations lies within the capability of evaluating thecomplete mining ventilation network as a whole [18]. By capturing a verified simulationmodel of the mining ventilation, accurate predictions can be made by making use ofcomputer-aided simulations [18] [29]. This enables mining personnel to identify ventilationleaks and restrictions. Cheng et al. [27] suggested to further improve simulation packages, byintegrating real-time environmental monitoring systems to improve the accuracy of thesimulation results. This enables the improvement of the accuracy of the ventilation results, tomatch the actual results obtained through the monitoring stations as close as possible.Numerous mines are phasing in underground monitoring stations, which measuresventilation flow, temperature, humidity and ambient pressure 2 [16].
By making use of 3D models, the ventilation system can be modelled and displayed in a3D environment. Wei et al. [26] showed that though 3D modelling, complex relationshipsare intuitively unfolded, which assists personnel to easily grasp ventilation problems and thecorresponding solutions.
2Engineering manager at ETA Operations - H. Brand, Underground condition monitoring, 25 January 2020
Page 10
1. INTRODUCTION
As mentioned, the most popular main fan ventilation system currently utilised within deep-level gold mines is the exhausting system. This ventilation system, however, expose the mainfan assembly to dirty air-streams that contain dust particles and have a high relative humidity[30]. Maintenance requirements are increased due to the highly corrosive environment inwhich main fans are required to operate.
To protect the impeller blades and other components exposed to the corrosive environment,specialised anti-corrosion coatings are applied. Figure 1.8 depicts a centrifugal impeller for amine’s main fan. In Figure 1.8 a surface coating is applied to minimise corrosion on the fanimpeller. Wang et al. [30] determined that anti-corrosive treatments can greatly increase mainfan performance. Surface treatment on main fans managed to improve main fan performanceand furthermore provided an economical benefit of decreasing the fan power consumption by8% [30]. Surface treatment further ensures optimal main fan performance and reliability.
Figure 1.8: Main fan impeller [24]
Mining ventilation networks consume approximately between 25% to 50% of the totalenergy consumed in a mining operation [18] [31], while mining fans alone can consumeapproximately 12% of the energy consumption in a mining operation 3. Numerous studieshave been conducted to improve mining ventilation efficiency [16] [23] [31] [32] [33], eitherby optimising mining ventilation flow by improving the efficiency of the main fans. Thefollowing subsection details such findings for improving ventilation efficiency.
Therefore, with MVF installations ranging from 500 kW to 2.4 MW [18] 4, implementingenergy savings initiatives on the main fans has significant potential to realise electrical costsavings.
3MTB, Energy systems, 12 March 20204Mechanical foreman at mine A - H. Moore, Main fans, 19 February 2020
Page 11
1. INTRODUCTION
1.4 ENERGY SAVINGS ON MVFS
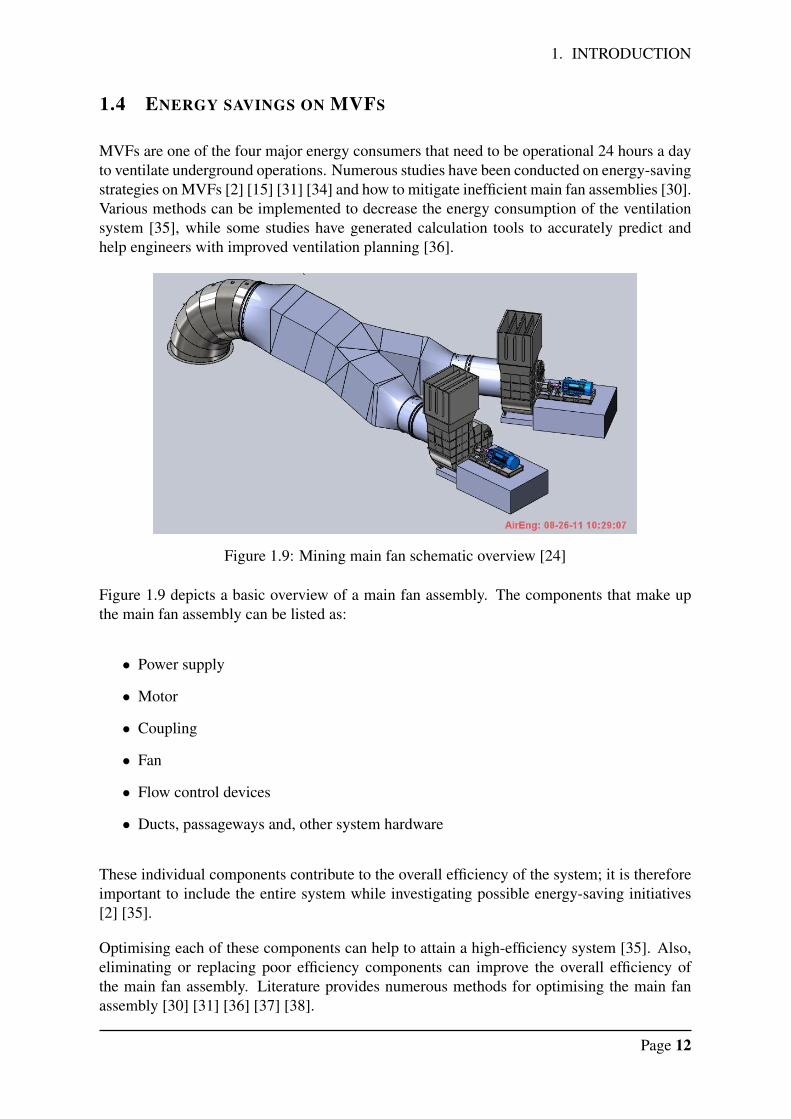
MVFs are one of the four major energy consumers that need to be operational 24 hours a dayto ventilate underground operations. Numerous studies have been conducted on energy-savingstrategies on MVFs [2] [15] [31] [34] and how to mitigate inefficient main fan assemblies [30].Various methods can be implemented to decrease the energy consumption of the ventilationsystem [35], while some studies have generated calculation tools to accurately predict andhelp engineers with improved ventilation planning [36].
Figure 1.9: Mining main fan schematic overview [24]
Figure 1.9 depicts a basic overview of a main fan assembly. The components that make upthe main fan assembly can be listed as:
• Power supply
• Motor
• Coupling
• Fan
• Flow control devices
• Ducts, passageways and, other system hardware
These individual components contribute to the overall efficiency of the system; it is thereforeimportant to include the entire system while investigating possible energy-saving initiatives[2] [35].
Optimising each of these components can help to attain a high-efficiency system [35]. Also,eliminating or replacing poor efficiency components can improve the overall efficiency ofthe main fan assembly. Literature provides numerous methods for optimising the main fanassembly [30] [31] [36] [37] [38].
Page 12
1. INTRODUCTION
The following main fan optimisation strategies were found in literature.
A major contributor to the overall efficiency of the main fan assembly is determined uponits design. Fan selection is an important step that requires basic knowledge of the systemoperating requirements and conditions. Airflow rates, pressure, air-stream properties, anda basic system layout all contribute to the optimal fan design and selection. Additionally,factors such as cost, efficiency, operating life, maintenance, and operating conditions furthercomplicate the fan selection process [2].
Fans are usually selected from a range of models and sizes best suited to meet systemrequirements. Fan selection would include the selection of a drive motor, the associatedpower supply, and the coupling between fan and motor. Due to the complexity anduncertainty that design engineers face in this regard, fans are often oversized to compensatefor the uncertainty that these engineers experience. Subsequently, oversized fans lead toinefficient main fan assemblies and significant energy wastage. Design engineers aretherefore tasked with predicting the airflow and pressure requirements, as of now and for theforeseeable future, with anticipated capacity expansions [2]. Literature provides detailedengineering design methodologies specifically for mine ventilation systems and fanassemblies [2] [15] [31].
Main fan assemblies can be optimised further by reducing system resistance and ensuring thatthe motor operates at the highest point of efficiency. Highlights from literature which providemethods to improve overall main fan assembly efficiency are given below.
Reducing air leakage by 10% can reduce the system’s overall operating cost by 30%, as shownby De Souza et al. [31]. Air leakages are commonly found in the ducting leading to the MVFassembly. Furthermore, an extensive underground sealing programme can greatly assist thesupplied ventilation flow in reaching working areas and decreasing system resistance. Therebyusing the available ventilation flow more effectively.
A study conducted by Wang et al. [30] showed the impact of a corroded main fan assemblyon the overall system performance. It is shown that a severely corroded main fan assembly’soperating efficiency is about 59.91%. To mitigate the deterioration of the main fan assembly,[30] employed an anti-corrosion coating, which managed to improve the air volume deliveredand decrease the overall power consumption by 8%.
Numerous studies [16] [36] [37] [38] have shown the importance of supplying ventilation ondemand (VOD). Therefore, flow control devices should be employed to optimise the supplyflow so that it will match the ventilation demand and in turn supply only the requiredventilation. All flow control devices will reduce the air volume and associated powerconsumption of the main fan. A range of flow control devices can be used to reduce theelectrical expenditure of the main fan, each having its advantages and disadvantages.Common flow control devices are discussed below.
Page 13
1. INTRODUCTION
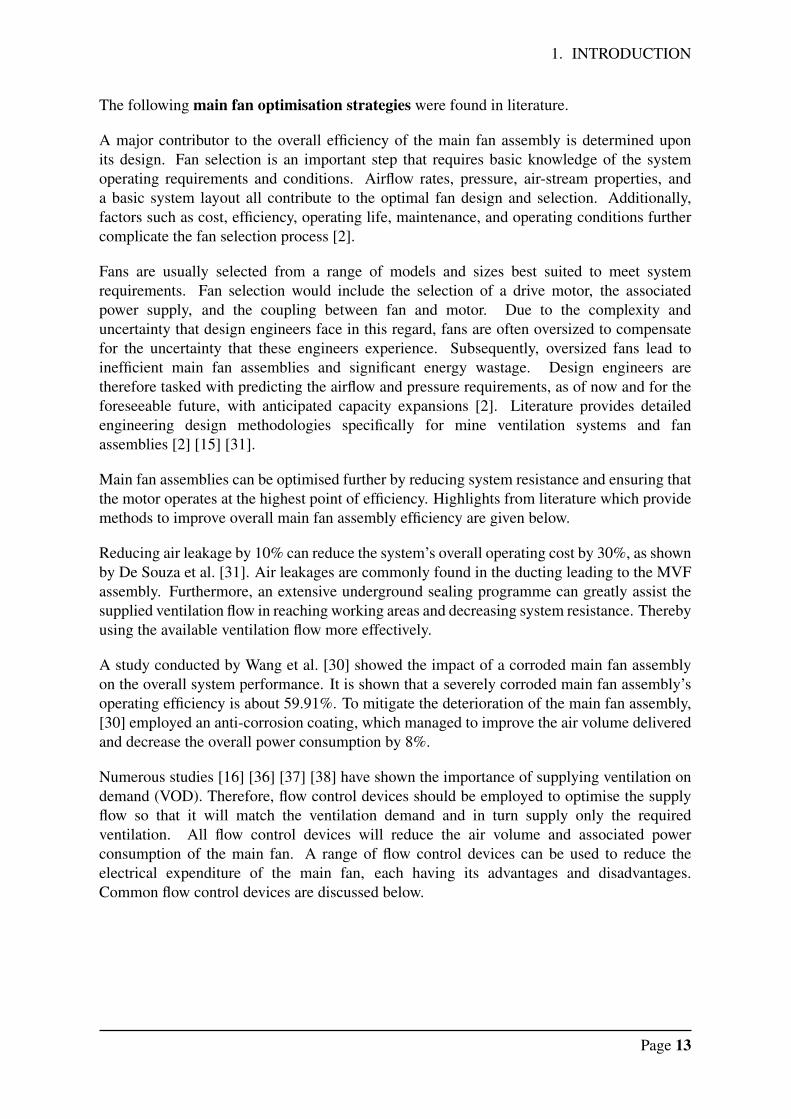
1.4.1 Main fan damper control
Dampers act on the premise of decreasing the volume of air delivered to the fan impeller [34].Vertical dampers (louvre dampers) can be installed either before the fan impeller or after,throttling the airflow through the fan [2] [35]. Louvre dampers, as shown in Figure 1.10,increases the restriction in the airflow, creating a larger pressure drop across the damper,dissipating some flow energy. The use of dampers may reduce the power consumption by asmall amount; however, delivers a large flow reduction. Louvre dampers installed after thefan impeller may not offer any energy savings other than shifting the operating point alongthe fan power curve [2].
Although dampers are inexpensive and easy to install, the reduction of flow against thereduction in power consumption is poor. Venter [34] showed that dampers may decrease theairflow by 40%, while only realising a 12% reduction in power consumption. Therefore,louvre dampers are more readily used for isolating the main fan during servicing, the same asself-closing isolation doors.
Inlet dampers are designed to only restrict the airflow, providing a small decrease in fan power.Figure 1.10 displays a common design for industrial inlet dampers.
Dampers are therefore inefficient and are commonly found on smaller applications, wherebythe primary focus is a reduction in airflow and not energy efficiency.
Figure 1.10: Industrial fan damper control system [24]
1.4.2 Variable speed drive (VSD)
A variable speed drive is used for applications where speed control is of importance due toload changes [38]. VSDs are widely used to control the speed of the motor, which is used inpumps, fans and compressors for flow control [39].
Numerous studies have shown that flow control through VSDs is the most efficient flowcontrol method among the mentioned flow control methods [35] [38] [39]. A VSD allows fora continuous range of speed adjustment, while maintaining a high efficiency. VSDs are beingused more often to generate energy savings on underground ventilation networks, providing
Page 14
1. INTRODUCTION
VOD [37] [38]. VSDs additionally provide a wide range of control, from startup to normaloperation and everything in between.
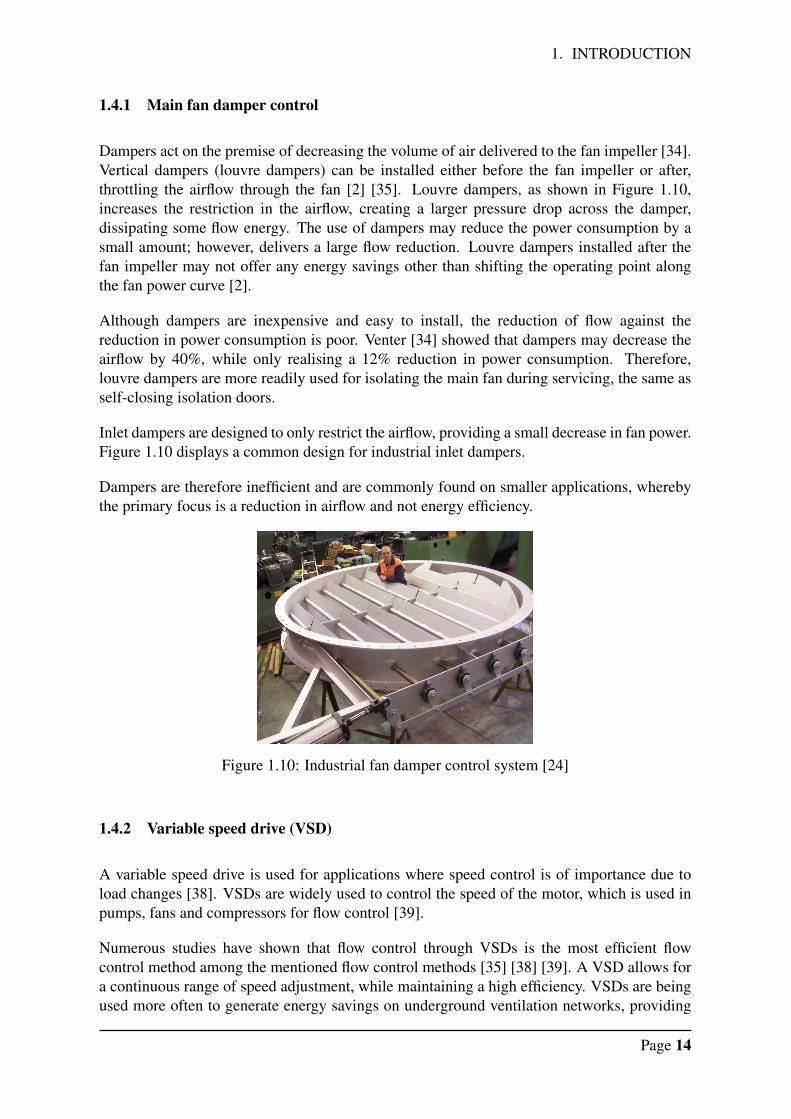
Figure 1.11 depicts the resulting fan pressure/power vs volume characteristics VSD controlmay have on the main fan. Where pressure is measured in Pascal (Pa), power in kilowatt (kW)and volume flow in cubic meters per second (m3/s). When comparing the pressure/volumecurves to that of IGV control in Figure 1.15, we may notice a larger pressure/volume decreasewith IGV control as opposed to that of VSD control, thus indicating the higher efficiency thatVSD control offers.
Figure 1.11: Impact VSD control on fan pressure/power vs volume characteristics adaptedfrom [34]
VSD speed control can deliver significant energy savings potential. However, due to the largeapplication on main fans, retrofitting existing systems with a VSD is costly.
The utilisation of VSD as a flow control method can deliver energy savings of up to 55% [39].Mining operations should consider the installation of VSD as a flow control method; however,due to the high investment costs, other flow control methods are often employed.
1.4.3 Inlet guide vanes
Inlet guide vanes (IGVs) are installed before the fan impeller, imparting spin on the airentering the fan wheel [40]. The pre-swirl is directed in the same direction of rotation of thefan impeller, which decreases the fan flow and thereby decreasing the system pressure, andultimately the power consumption of the fan [34] [41]. IGV control provides a more efficientspeed control method compared to that of inlet dampers, while investment costs areapproximately a fourth of that of VSD installations.
The primary objective of IGVs is to guide the incoming air stream into the impeller blades,increasing fan efficiency. The basic design principle of IGVs can be seen in Figure 1.12.
Page 15
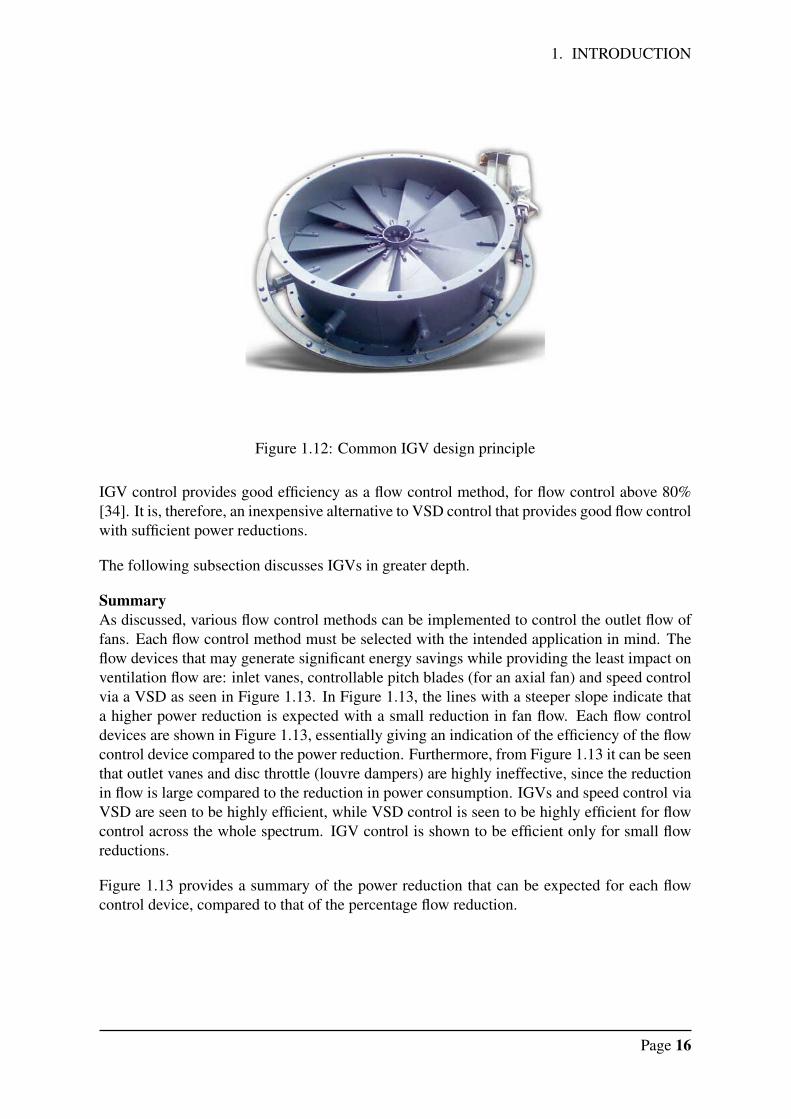
1. INTRODUCTION
Figure 1.12: Common IGV design principle
IGV control provides good efficiency as a flow control method, for flow control above 80%[34]. It is, therefore, an inexpensive alternative to VSD control that provides good flow controlwith sufficient power reductions.
The following subsection discusses IGVs in greater depth.
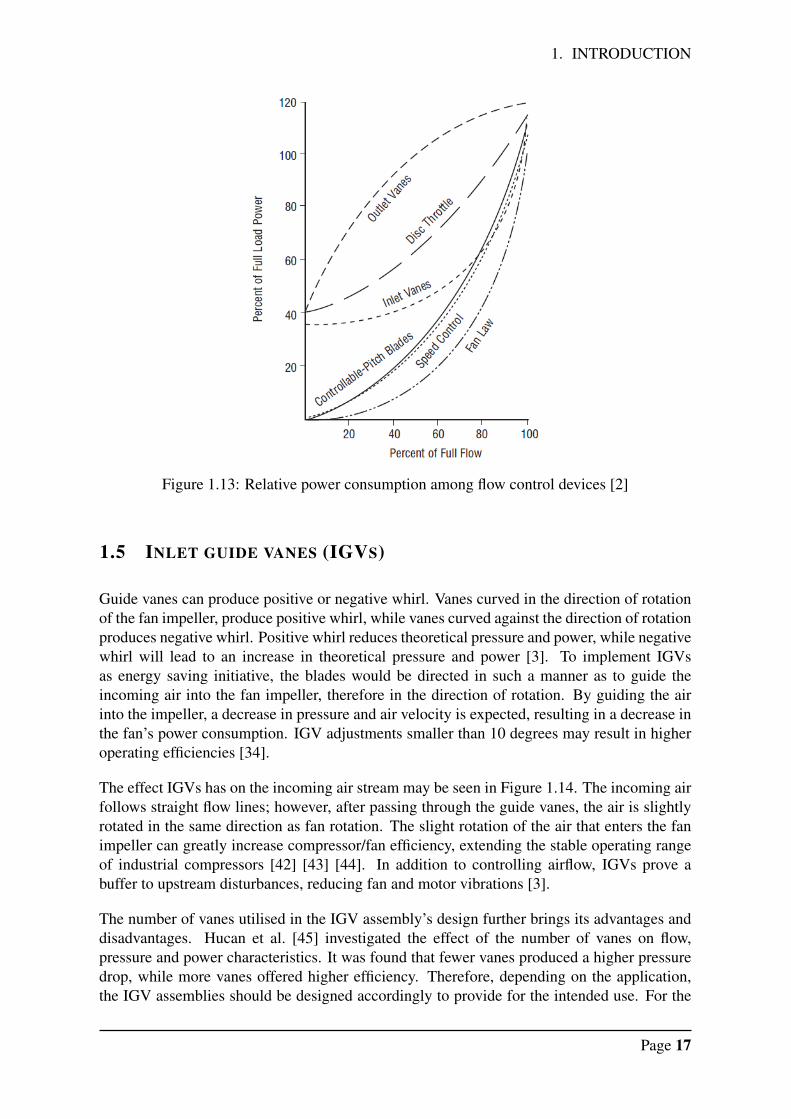
SummaryAs discussed, various flow control methods can be implemented to control the outlet flow offans. Each flow control method must be selected with the intended application in mind. Theflow devices that may generate significant energy savings while providing the least impact onventilation flow are: inlet vanes, controllable pitch blades (for an axial fan) and speed controlvia a VSD as seen in Figure 1.13. In Figure 1.13, the lines with a steeper slope indicate thata higher power reduction is expected with a small reduction in fan flow. Each flow controldevices are shown in Figure 1.13, essentially giving an indication of the efficiency of the flowcontrol device compared to the power reduction. Furthermore, from Figure 1.13 it can be seenthat outlet vanes and disc throttle (louvre dampers) are highly ineffective, since the reductionin flow is large compared to the reduction in power consumption. IGVs and speed control viaVSD are seen to be highly efficient, while VSD control is seen to be highly efficient for flowcontrol across the whole spectrum. IGV control is shown to be efficient only for small flowreductions.
Figure 1.13 provides a summary of the power reduction that can be expected for each flowcontrol device, compared to that of the percentage flow reduction.
Page 16
1. INTRODUCTION
Figure 1.13: Relative power consumption among flow control devices [2]
1.5 INLET GUIDE VANES (IGVS)
Guide vanes can produce positive or negative whirl. Vanes curved in the direction of rotationof the fan impeller, produce positive whirl, while vanes curved against the direction of rotationproduces negative whirl. Positive whirl reduces theoretical pressure and power, while negativewhirl will lead to an increase in theoretical pressure and power [3]. To implement IGVsas energy saving initiative, the blades would be directed in such a manner as to guide theincoming air into the fan impeller, therefore in the direction of rotation. By guiding the airinto the impeller, a decrease in pressure and air velocity is expected, resulting in a decrease inthe fan’s power consumption. IGV adjustments smaller than 10 degrees may result in higheroperating efficiencies [34].
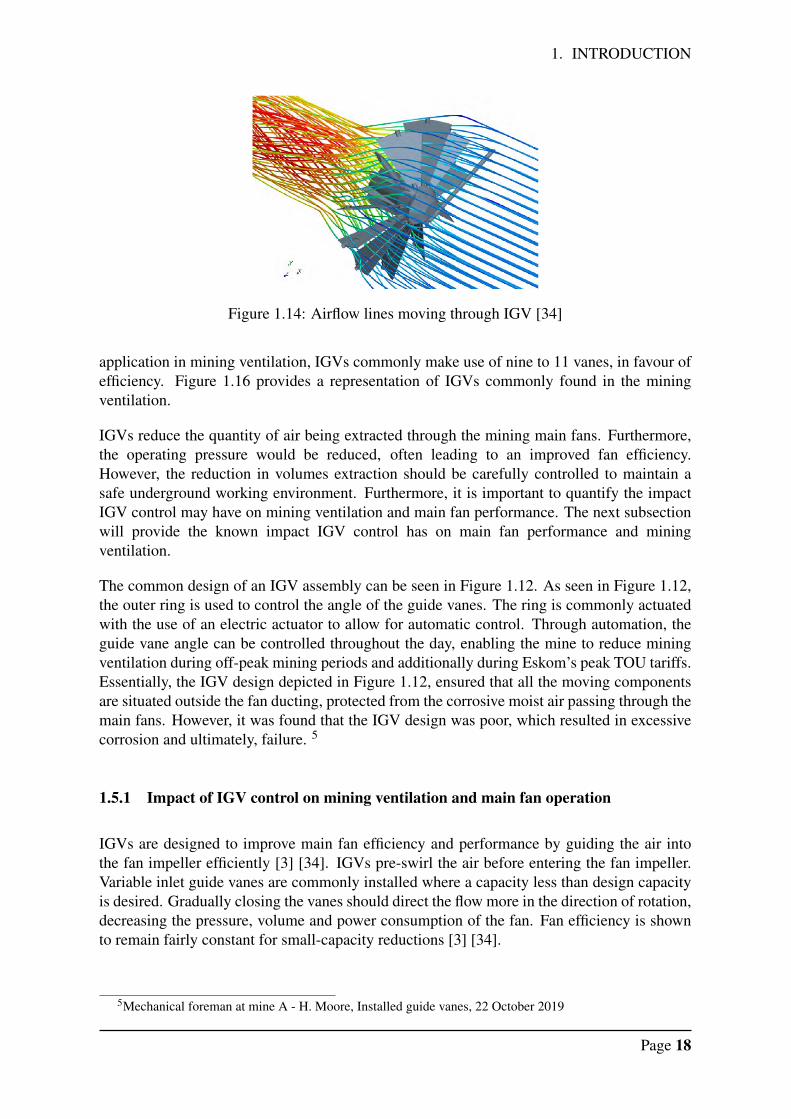
The effect IGVs has on the incoming air stream may be seen in Figure 1.14. The incoming airfollows straight flow lines; however, after passing through the guide vanes, the air is slightlyrotated in the same direction as fan rotation. The slight rotation of the air that enters the fanimpeller can greatly increase compressor/fan efficiency, extending the stable operating rangeof industrial compressors [42] [43] [44]. In addition to controlling airflow, IGVs prove abuffer to upstream disturbances, reducing fan and motor vibrations [3].
The number of vanes utilised in the IGV assembly’s design further brings its advantages anddisadvantages. Hucan et al. [45] investigated the effect of the number of vanes on flow,pressure and power characteristics. It was found that fewer vanes produced a higher pressuredrop, while more vanes offered higher efficiency. Therefore, depending on the application,the IGV assemblies should be designed accordingly to provide for the intended use. For the
Page 17
1. INTRODUCTION
Figure 1.14: Airflow lines moving through IGV [34]
application in mining ventilation, IGVs commonly make use of nine to 11 vanes, in favour ofefficiency. Figure 1.16 provides a representation of IGVs commonly found in the miningventilation.
IGVs reduce the quantity of air being extracted through the mining main fans. Furthermore,the operating pressure would be reduced, often leading to an improved fan efficiency.However, the reduction in volumes extraction should be carefully controlled to maintain asafe underground working environment. Furthermore, it is important to quantify the impactIGV control may have on mining ventilation and main fan performance. The next subsectionwill provide the known impact IGV control has on main fan performance and miningventilation.
The common design of an IGV assembly can be seen in Figure 1.12. As seen in Figure 1.12,the outer ring is used to control the angle of the guide vanes. The ring is commonly actuatedwith the use of an electric actuator to allow for automatic control. Through automation, theguide vane angle can be controlled throughout the day, enabling the mine to reduce miningventilation during off-peak mining periods and additionally during Eskom’s peak TOU tariffs.Essentially, the IGV design depicted in Figure 1.12, ensured that all the moving componentsare situated outside the fan ducting, protected from the corrosive moist air passing through themain fans. However, it was found that the IGV design was poor, which resulted in excessivecorrosion and ultimately, failure. 5
1.5.1 Impact of IGV control on mining ventilation and main fan operation
IGVs are designed to improve main fan efficiency and performance by guiding the air intothe fan impeller efficiently [3] [34]. IGVs pre-swirl the air before entering the fan impeller.Variable inlet guide vanes are commonly installed where a capacity less than design capacityis desired. Gradually closing the vanes should direct the flow more in the direction of rotation,decreasing the pressure, volume and power consumption of the fan. Fan efficiency is shownto remain fairly constant for small-capacity reductions [3] [34].
5Mechanical foreman at mine A - H. Moore, Installed guide vanes, 22 October 2019
Page 18
1. INTRODUCTION
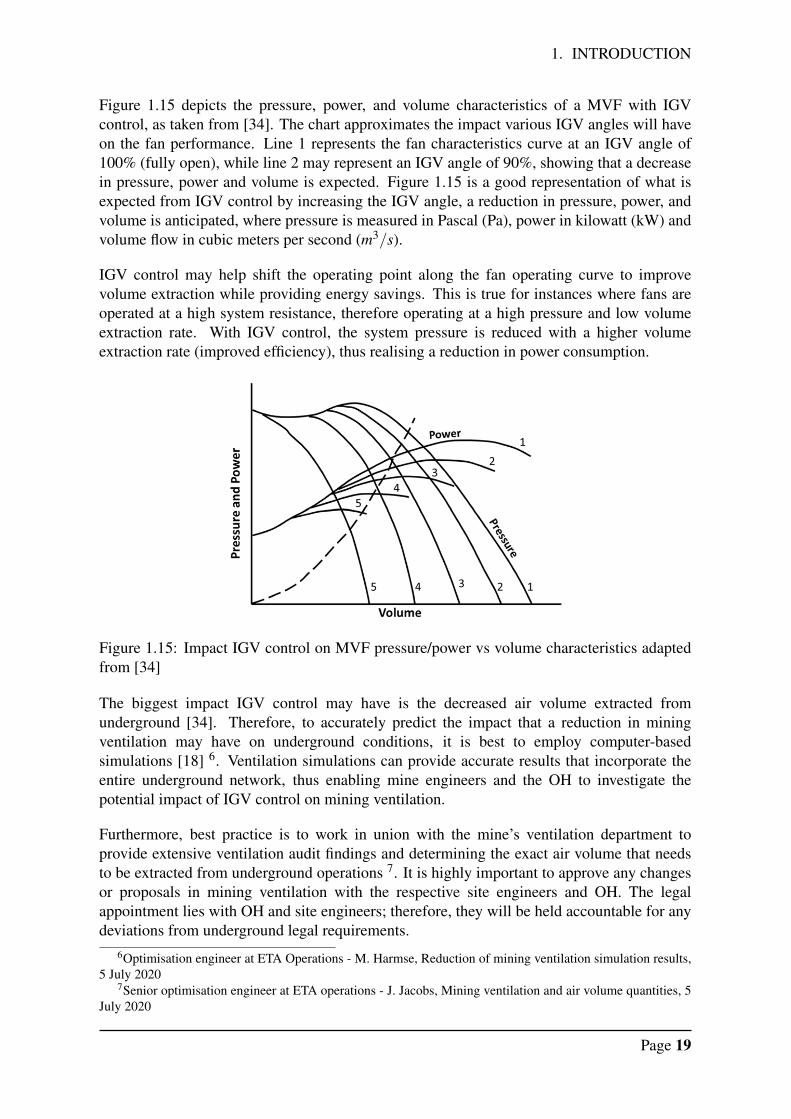
Figure 1.15 depicts the pressure, power, and volume characteristics of a MVF with IGVcontrol, as taken from [34]. The chart approximates the impact various IGV angles will haveon the fan performance. Line 1 represents the fan characteristics curve at an IGV angle of100% (fully open), while line 2 may represent an IGV angle of 90%, showing that a decreasein pressure, power and volume is expected. Figure 1.15 is a good representation of what isexpected from IGV control by increasing the IGV angle, a reduction in pressure, power, andvolume is anticipated, where pressure is measured in Pascal (Pa), power in kilowatt (kW) andvolume flow in cubic meters per second (m3/s).
IGV control may help shift the operating point along the fan operating curve to improvevolume extraction while providing energy savings. This is true for instances where fans areoperated at a high system resistance, therefore operating at a high pressure and low volumeextraction rate. With IGV control, the system pressure is reduced with a higher volumeextraction rate (improved efficiency), thus realising a reduction in power consumption.
Figure 1.15: Impact IGV control on MVF pressure/power vs volume characteristics adaptedfrom [34]
The biggest impact IGV control may have is the decreased air volume extracted fromunderground [34]. Therefore, to accurately predict the impact that a reduction in miningventilation may have on underground conditions, it is best to employ computer-basedsimulations [18] 6. Ventilation simulations can provide accurate results that incorporate theentire underground network, thus enabling mine engineers and the OH to investigate thepotential impact of IGV control on mining ventilation.
Furthermore, best practice is to work in union with the mine’s ventilation department toprovide extensive ventilation audit findings and determining the exact air volume that needsto be extracted from underground operations 7. It is highly important to approve any changesor proposals in mining ventilation with the respective site engineers and OH. The legalappointment lies with OH and site engineers; therefore, they will be held accountable for anydeviations from underground legal requirements.
6Optimisation engineer at ETA Operations - M. Harmse, Reduction of mining ventilation simulation results,5 July 2020
7Senior optimisation engineer at ETA operations - J. Jacobs, Mining ventilation and air volume quantities, 5July 2020
Page 19
1. INTRODUCTION
To further determine the potential impact of IGV control on the ventilation system,underground ventilation monitoring stations can be incorporated. Ventilation monitoringstations are placed at strategic locations underground to measure ventilation flow, humidity,pressure and temperature [16]. These monitoring capabilities can be beneficial formonitoring the impact that IGV control or any ventilation change may have on theventilation system. This, in addition to a computer-based ventilation simulation and theventilation department’s input, may deliver an accurate prediction on the potential impact ofIGV control on mining ventilation and underground conditions.
The implementation of an IGV assembly on the main fan may decrease or increase main fanand motor vibrations. It is a well-known fact that main fans vibrate during operation, as resultof imbalances and complex flow phenomena. IGV installations typically improve main fanvibrations caused by upstream flow disturbances, by conditioning the air before it enters thefan impeller [2] [3]. However, minimal research has been found on the long-term impactof IGV control on main fan performance and vibrations. A study conducted by Rusinski et.al. [46] revealed increased vibrations during the opening or closing of IGVs, as a result ofunfavourable flow phenomena. Fan operation nevertheless quickly stabilises, returning to asteady state of fan operation [46]. However small these vibrations may be, guide vane anglesshould be adjusted with caution to ensure a steady state of flow and main fan operation.
Without the needed knowledge and maintenance, IGVs can contribute to MVF vibrations.Vibrations could occur with high IGV angles, typically stalling the fan and increasing theprobability of vibration oscillations. Moreover, fan vibrations could occur due to complexflow phenomena resulting from an incompatibility between the fan operation and IGVs.Fortunately, these phenomena are uncommon. The said vibrations can be reduced byinstalling a vortex breaker, which is known to improve the stability of IGV control at highvane angles 8.
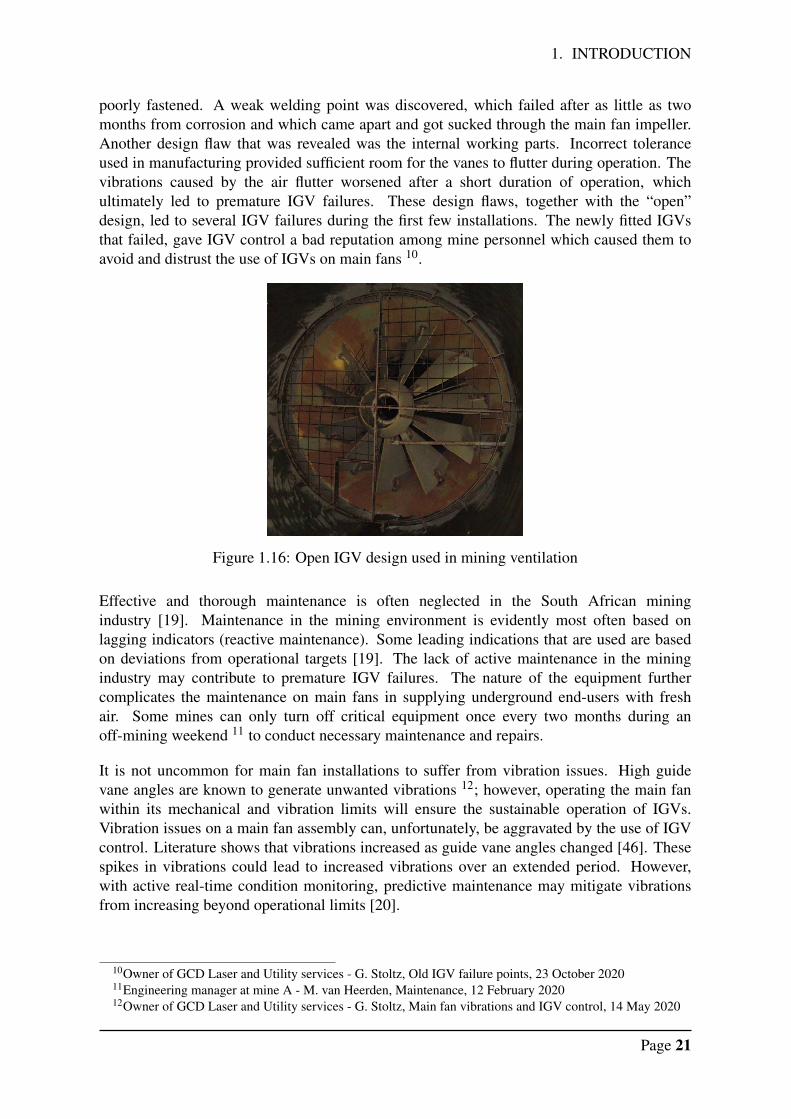
Mining main fans are usually configured in an exhausting system to extract the hot, humidair from underground [8]. Air extracted from underground operations is typically close tosaturation, as it contains a lot of moisture, oxygen and, harmful gases that create a highlycorrosive environment for the main fan assembly [30]. A corrosive environment can easilyrust moving parts in place and weaken structural members that could lead to severe failures.The “open” IGV design commonly used in practice (Figure 1.16) exposes movingcomponents to the harsh environment. Without proper care and maintenance, IGVs wouldrust and deteriorate, leading to unplanned failures.
1.5.2 Common issues experienced with IGV control
IGV systems operate in dirty, humid air-streams. The most common IGV failures are due tounkept maintenance, extensive corrosion, and fouling [34] 9.
However, IGV failures were also common for other reasons as a few failures becameapparent in the old IGV design, as seen in Figure 1.16. The vanes were poorly designed and
8Owner of GCD Laser and Utility services - G. Stoltz, MVF vibrations and IGV control, 14 May 20209Owner of GCD Laser and Utility services - G. Stoltz, Common IGV failures, 9 March 2020
Page 20
1. INTRODUCTION
poorly fastened. A weak welding point was discovered, which failed after as little as twomonths from corrosion and which came apart and got sucked through the main fan impeller.Another design flaw that was revealed was the internal working parts. Incorrect toleranceused in manufacturing provided sufficient room for the vanes to flutter during operation. Thevibrations caused by the air flutter worsened after a short duration of operation, whichultimately led to premature IGV failures. These design flaws, together with the “open”design, led to several IGV failures during the first few installations. The newly fitted IGVsthat failed, gave IGV control a bad reputation among mine personnel which caused them toavoid and distrust the use of IGVs on main fans 10.
Figure 1.16: Open IGV design used in mining ventilation
Effective and thorough maintenance is often neglected in the South African miningindustry [19]. Maintenance in the mining environment is evidently most often based onlagging indicators (reactive maintenance). Some leading indications that are used are basedon deviations from operational targets [19]. The lack of active maintenance in the miningindustry may contribute to premature IGV failures. The nature of the equipment furthercomplicates the maintenance on main fans in supplying underground end-users with freshair. Some mines can only turn off critical equipment once every two months during anoff-mining weekend 11 to conduct necessary maintenance and repairs.
It is not uncommon for main fan installations to suffer from vibration issues. High guidevane angles are known to generate unwanted vibrations 12; however, operating the main fanwithin its mechanical and vibration limits will ensure the sustainable operation of IGVs.Vibration issues on a main fan assembly can, unfortunately, be aggravated by the use of IGVcontrol. Literature shows that vibrations increased as guide vane angles changed [46]. Thesespikes in vibrations could lead to increased vibrations over an extended period. However,with active real-time condition monitoring, predictive maintenance may mitigate vibrationsfrom increasing beyond operational limits [20].
10Owner of GCD Laser and Utility services - G. Stoltz, Old IGV failure points, 23 October 202011Engineering manager at mine A - M. van Heerden, Maintenance, 12 February 202012Owner of GCD Laser and Utility services - G. Stoltz, Main fan vibrations and IGV control, 14 May 2020
Page 21
1. INTRODUCTION
Little written or published literature is available on previous IGV installations and their impacton main fan performance and operation. One study has shown that IGVs can produce powersavings of approximately 18.8 % at a guide vane angle of 70%, reducing the air volume by12.4 % [34]. However, no further information was given concerning vibrations or main fanperformance with IGV control.
Previous IGV installations at a recent case study were never used due to uncertainties on theimpact it may have on underground ventilation 13, the delay in the use of the IGVs resulted inthe corrosion and ultimately the failure of the IGV installation. All the moving componentscorroded to such an extent that the whole IGV installation became unmovable 14.
1.6 SUMMARY
Main ventilation fans are considered to be critical equipment, as they ensure that undergroundmining operations are adequately ventilated 24 hours a day. However, the operation of largemain fan installations is energy-intensive; thus, IGVs can be installed as an effort to reducethe energy consumption of mining ventilation.
IGVs pre-swirl the incoming air before entering the fan impeller, slightly improving fanefficiency and leading to a reduction in the pressure and volume the fan delivers. Thisconsequently leads to a reduction in the fan’s energy consumption and daily operationalcosts.
Care should be given to the potential impact of IGV control on underground ventilation- byincorporating the use of a computer-aided ventilation simulation to predict the impact IGVcontrol may have on mining ventilation, a safe underground working environment can bemaintained.
To ensure the sustainable operation of IGVs, main fan performance is to be monitored andmaintained. Therefore, through condition monitoring of fan vibrations and bearingtemperatures, fan integrity and performance can be maintained.
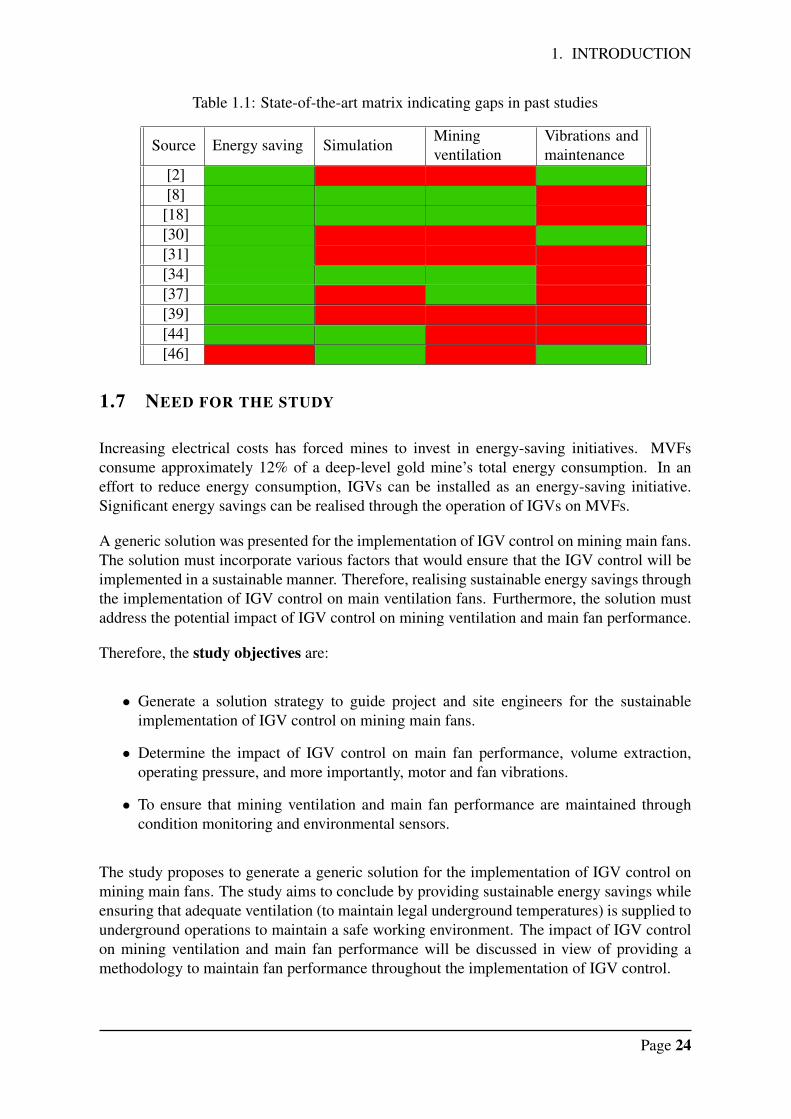
Table 1.1 shows the gaps found in the literature that was reviewed for this study. Green tilesindicate that the study discussed the topic written in the column heading, while the red tilesindicate that the study did not fully discuss the topic at hand.
Various studies have been included in the literature survey to include the most recent literaturethat is available in the specific field. The literature discussed in Table 1.1 is summarised below.
“Improving fan system performance” [2] a source book for the industry, provides a widerange of information on fans. The book includes information on the selection of fans, basicmaintenance, system leaks, and performance issues. The source book further provides usefulinformation on various flow control devices that can be implemented on fans. Energy savingsthat could arise from the various flow control devices are discussed, as well as maintenanceand vibrations on fans and to a lesser extend the impact flow control has on fan vibrations.
13OH at mine A - R. Greyling, Use of previous IGV installation, 17 October 202014Mechanical foreman at mine A - H. Moore, Use of previous IGV installation, 15 October 2020
Page 22
1. INTRODUCTION
Hancock [8] generated a generic solution for the implementation of ventilation improvementson underground networks by using computer-aided simulations to predict the impact thesesystem changes might have. The improvements made to the underground ventilation networkmanaged to achieve energy savings on the main fans. This provided sufficient evidence thatmain fan optimisation strategies do not have to focus on the MVF assembly and its operation;rather, improvements to the ventilation network can realise energy savings on the main fan.
Nel [18] provided sufficient evidence to show that simulation software can accurately predictthe changes to ventilation after a system change. Furthermore, the research showed that thesimulation package can be used for life-of-mine planning and as part of ventilation-on-demandinitiatives. Therefore, the study included literature on energy-saving initiatives on main fans,simulating system changes, and the effect on the underground network as well as the energyconsumption of main fans and underground booster fans.
Wang et al. [30] found that significant energy savings could arise from the proper maintenanceand care of main fan assemblies. This included the main fan ducting and passages leading tothe main fans. The main fan assembly was coated in an anti-corrosive coating to protect itfrom the harsh environment, which reduced maintenance requirements slightly and increasedfan efficiency while providing energy savings.
De Souza [31] presented case studies where engineering principles can be applied to solveinefficient main fan assemblies. The paper includes the energy savings that arose from theimplementation of these energy saving strategies and how these methods can be applied toother case studies.
Venter [34] investigated the implementation of IGVs on mining main fans. The study’s mainfocus was the energy savings that could arise from IGV control. Additionally, the impactIGV control has on the main fan’s delivery volume and pressure. It was further shown thatcomputer-aided simulations can be used to accurately predict the resulting flow reduction andpower reduction from IGV control at different guide vane angles. The study neglected tomention the impact of IGV control on main fan performance and vibrations.
Chatterjee et al. [37] demonstrated the energy savings that are possible through controllingunderground fans for ventilation on demand and peak TOU tariffs. The underground networkwas modelled through Kirchhoff’s laws and Tellegen’s theorem, which were used to controlthe speed of the underground fans fitted with VSDs.
Jena et al. [39] provided experimental data on the power consumption of an industrial fanwith different flow control methods. The flow control methods that were included in the studywere: outlet damper control, inlet guide vane control, eddy current coupling method, andVSD speed control. The study revealed that for energy efficiency, inlet guide vane control andVSD speed control are best, while the worst performing method was outlet damper control.Moreover, Jena et al. revealed that VSD speed control has an internal rate of return of 55%and inlet guide vane control 48%.
Rusinski et al. [46] discuss vibrations in large rotating fans. A spectral analysis was done todetermine the cause of severe main fan vibrations, including the operation of inlet guide vanes.Vibrations, resonance and vibration sources are discussed in this paper in detail, includingmitigating steps that can be implemented to improve main fan performance and vibration.
Page 23
1. INTRODUCTION
Table 1.1: State-of-the-art matrix indicating gaps in past studies
Source Energy saving SimulationMiningventilation
Vibrations andmaintenance
[2][8]
[18][30][31][34][37][39][44][46]
1.7 NEED FOR THE STUDY
Increasing electrical costs has forced mines to invest in energy-saving initiatives. MVFsconsume approximately 12% of a deep-level gold mine’s total energy consumption. In aneffort to reduce energy consumption, IGVs can be installed as an energy-saving initiative.Significant energy savings can be realised through the operation of IGVs on MVFs.
A generic solution was presented for the implementation of IGV control on mining main fans.The solution must incorporate various factors that would ensure that the IGV control will beimplemented in a sustainable manner. Therefore, realising sustainable energy savings throughthe implementation of IGV control on main ventilation fans. Furthermore, the solution mustaddress the potential impact of IGV control on mining ventilation and main fan performance.
Therefore, the study objectives are:
• Generate a solution strategy to guide project and site engineers for the sustainableimplementation of IGV control on mining main fans.
• Determine the impact of IGV control on main fan performance, volume extraction,operating pressure, and more importantly, motor and fan vibrations.
• To ensure that mining ventilation and main fan performance are maintained throughcondition monitoring and environmental sensors.
The study proposes to generate a generic solution for the implementation of IGV control onmining main fans. The study aims to conclude by providing sustainable energy savings whileensuring that adequate ventilation (to maintain legal underground temperatures) is supplied tounderground operations to maintain a safe working environment. The impact of IGV controlon mining ventilation and main fan performance will be discussed in view of providing amethodology to maintain fan performance throughout the implementation of IGV control.
Page 24
1. INTRODUCTION
1.8 OVERVIEW OF THIS DOCUMENT
Chapter 1 aimed to provide context to the reader by providing a brief background and theproblem statement at hand. The literature review enabled the reader to fully understand thetopic at hand and the existing research that is available.
Chapter 2 provides the methodology the author followed to achieve the results andconclusions made in this document. It also provides the means to achieve the studyobjectives.
Chapter 3 provides a background of the case study and an overview of the mine’s ventilationsystem and layout. It discusses the measurements that were taken and offers an analysis anddiscussion of the results obtained from the case study.
Chapter 4 concludes the outcome of the study and the results obtained from the case studyfor IGV control on a deep-level gold mine. The study objectives are discussed, andrecommendations are made for future studies.
Page 25
2. DEVELOPMENT OF SOLUTION
2 DEVELOPMENT OF SOLUTION
2.1 INTRODUCTION
In an effort to reduce the energy consumption of large industrial fans used for miningventilation, IGVs can be installed to reduce the power consumption of the main fan. Thefollowing methodology was followed to implement IGV control on MVFs. The solutionaims to ensure adequate mining ventilation while realising energy cost savings through IGVcontrol. A ventilation simulation and testing procedure is proposed to confirm the potentialimpact of IGV control on mining ventilation and ensure that main fan performance remainswithin operating limits. This allows for the impact of IGV control to be monitored andcontrolled to maintain a safe underground working environment. The solution was developedby the author, based on the requirements and procedures taken from a recent case study.
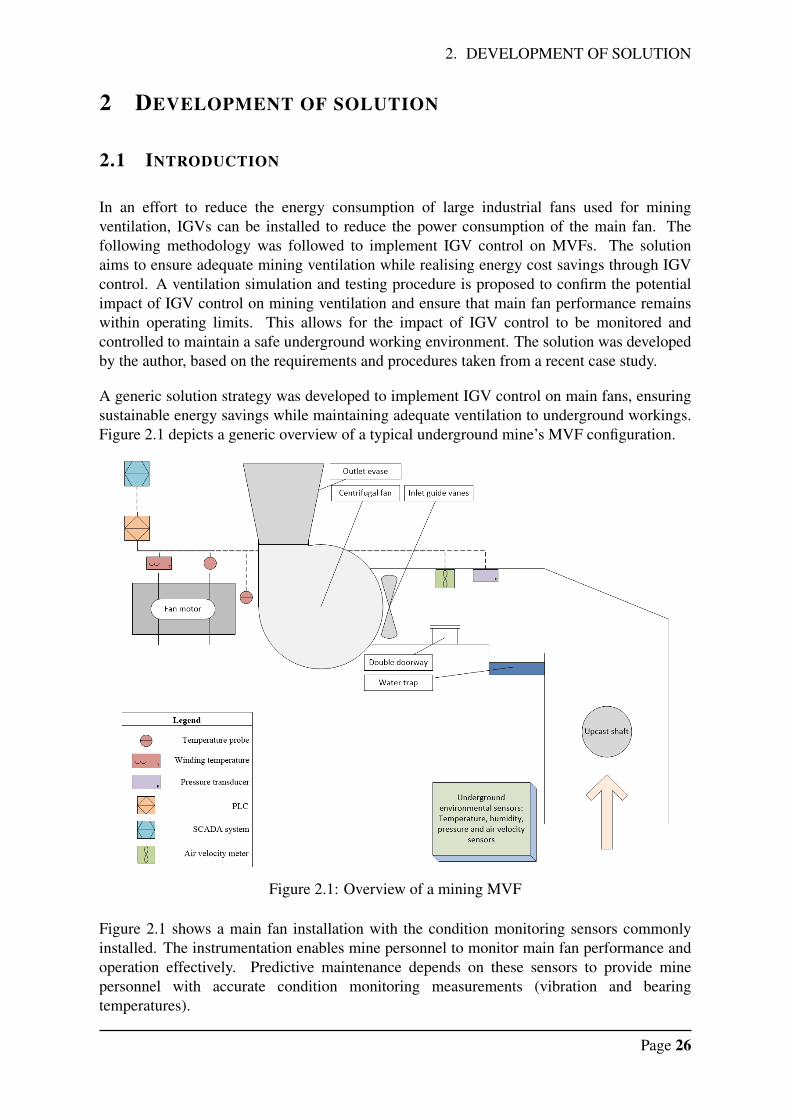
A generic solution strategy was developed to implement IGV control on main fans, ensuringsustainable energy savings while maintaining adequate ventilation to underground workings.Figure 2.1 depicts a generic overview of a typical underground mine’s MVF configuration.
Figure 2.1: Overview of a mining MVF
Figure 2.1 shows a main fan installation with the condition monitoring sensors commonlyinstalled. The instrumentation enables mine personnel to monitor main fan performance andoperation effectively. Predictive maintenance depends on these sensors to provide minepersonnel with accurate condition monitoring measurements (vibration and bearingtemperatures).
Page 26
2. DEVELOPMENT OF SOLUTION
Airflow and pressure sensors are often installed to enable the monitoring of ventilation flowand pressure. This can then easily be used to measure the impact of IGV control on main fanventilation flow and pressure. A decrease in the extracted volume can be monitored furtherthrough underground ventilation stations and measuring the ventilation flow, pressure and airtemperature at key locations underground.
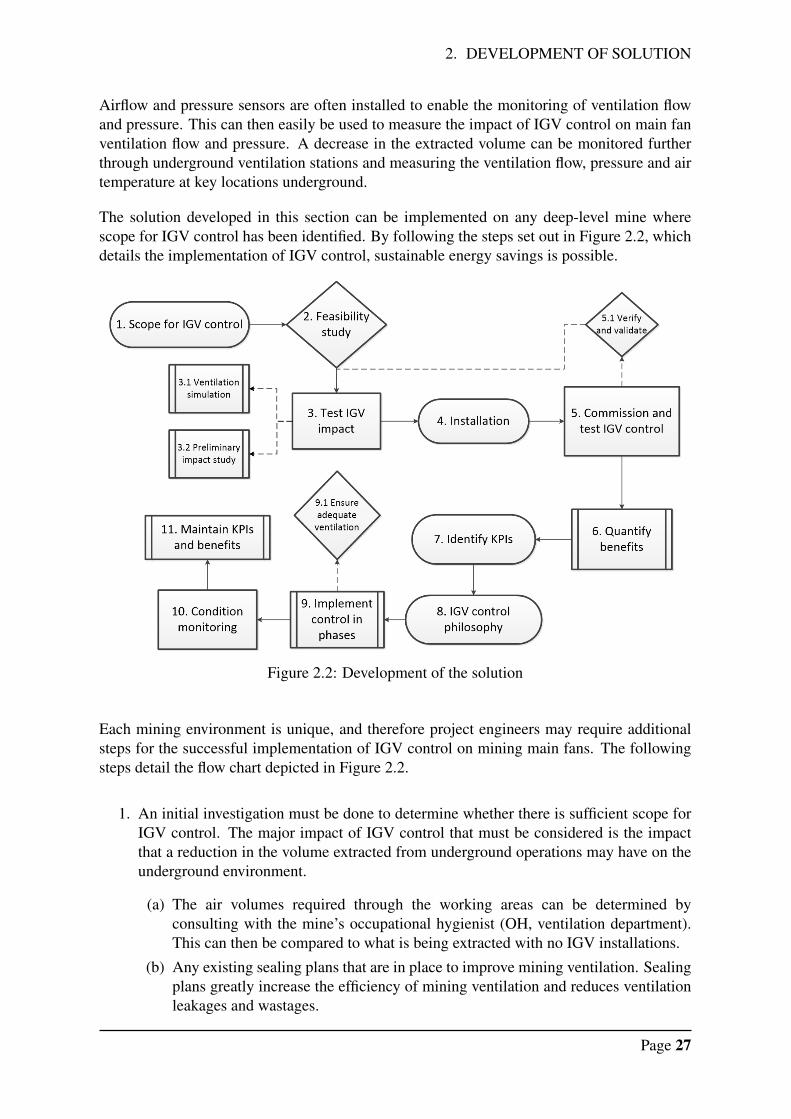
The solution developed in this section can be implemented on any deep-level mine wherescope for IGV control has been identified. By following the steps set out in Figure 2.2, whichdetails the implementation of IGV control, sustainable energy savings is possible.
Figure 2.2: Development of the solution
Each mining environment is unique, and therefore project engineers may require additionalsteps for the successful implementation of IGV control on mining main fans. The followingsteps detail the flow chart depicted in Figure 2.2.
1. An initial investigation must be done to determine whether there is sufficient scope forIGV control. The major impact of IGV control that must be considered is the impactthat a reduction in the volume extracted from underground operations may have on theunderground environment.
(a) The air volumes required through the working areas can be determined byconsulting with the mine’s occupational hygienist (OH, ventilation department).This can then be compared to what is being extracted with no IGV installations.
(b) Any existing sealing plans that are in place to improve mining ventilation. Sealingplans greatly increase the efficiency of mining ventilation and reduces ventilationleakages and wastages.
Page 27
2. DEVELOPMENT OF SOLUTION
(c) Underground areas prone to gas build up and high temperatures must be reviewedto ensure safe conditions can be maintained with a reduction in air volume flow.Working areas should always conform to all legal ventilation requirements [8][18] [47]. These areas often benefit from a detailed sealing plan to improve theventilation to such areas.
(d) Inspection of the main fan assembly to ensure technical requirements are met forthe installation of IGVs and the corresponding control mechanism (electricactuator).
(e) PLC available for automatic control (optional).
(f) Surface fan curves and current operating point (if available).
2. A feasibility study is conducted to ensure all project aspects are analysed. Theadvantages and disadvantages of IGV control is considered to determine the benefitsthat would arise from IGV control.
(a) Economic feasibility to ensure the project will realise cost savings that can coverthe initial capital expenditure within a reasonable time.
(b) Technical feasibility to ensure mechanical operation and feasibility.
(c) Legal feasibility to ensure underground temperatures are maintained within thelegal limits.
(d) A risk analysis to determine possible failure points and how to mitigate or removethese risks effectively.
(e) Identifying possible advantages and disadvantages of IGV control.
(f) Project scheduling to ensure the successful completion of the project in the allottedtime.
3. The impact IGV control may have on mining ventilation and fan operation. Anyreduction in mining ventilation may lead to additional heat build-up. Problem areasshould be identified and rectified before implementing the IGV control strategy toavoid any additional problems that may arise from a reduction in mining ventilationflow.
(a) The impact of IGV control on main fan operation can easily be managed byoperating the vane angles only in the stable operating conditions (most oftendetermined upon testing).
(b) An accurate ventilation simulation model is used to predict the impact IGV controlmay have on the underground ventilation network.
(c) A preliminary study can be conducted to determine the impact that a reduction inmining ventilation might have on the underground ventilation network. This canbe done by running one fewer main fan and measuring underground ventilationflow and temperatures at key points to predict what the impact may be. Thisexercise can possibly highlight problematic areas that can be closely monitored tomitigate any unwanted effects on the underground environment.
4. After the feasibility study’s successful approval and initial testing, installation of theIGV assembly can commence on the MVFs.
Page 28
2. DEVELOPMENT OF SOLUTION
5. Upon completion of IGV installation, a testing procedure is proposed to test IGV controlparameters and mechanical limitations. The results obtained in this step should be usedto verify the assumptions and findings made in step three.
6. Once the testing procedure is complete, the actual benefits that could arise from IGVcontrol can be calculated. Actual measurements will provide a definite indication of theimpact that IGV control may have on the system and mining ventilation. The actualcost savings that could arise from IGV control can be calculated for the verification ofthe financial feasibility.
7. Key performance indicators (KPIs) that are identified will be monitored to ensure thatfan performance and underground ventilation requirements are maintained.
8. A control philosophy can be generated with the consideration of the KPIs and energy-saving targets. Incorporating Eskom’s TOU tariffs and mining ventilation demand.
9. Implementation of IGV control in phases to ensure that ventilation changes aremonitored and thus provide adequate ventilation to underground operations throughouteach phase. The phased approach will ensure that areas of concern are activelymonitored to ensure legal compliance.
10. Through real-time data monitoring, fan performance and ventilation requirements canbe monitored to ensure fan performance and ventilation requirements are met.
11. A maintenance schedule should be implemented to ensure the sustainable operation ofIGV control. A maintenance schedule will be adopted that suites the harsh operatingenvironment of the IGV assembly.
Mining ventilation on a deep-level mine is complex and requires careful evaluation. Todetermine whether a scope exists to optimise ventilation supply, project engineers need towork in conjunction with the mine’s OH to ensure that a safe mining environment is alwaysmaintained. The ventilation department knows how much air must be extracted fromunderground operations and can easily determine whether a reduction in air quantitiesthrough the mine is possible. Ventilation simulations can be of great aid to determine theimpact that a reduction in mining ventilation may have on the underground environment.Once the initial investigation provides adequate results providing the feasibility of theproject, an in-depth feasibility study can be done.
2.2 FEASIBILITY STUDY
A feasibility study is conducted to determine a project’s feasibility with regards to theeconomic, technical and legal considerations. Project managers and engineers use feasibilitystudies to discern the advantages and disadvantages of undertaking the project beforeinvesting money into the project. Feasibility studies allows project engineers to understandfully all aspects of the project, the concept, and project plan and highlight potential problemsbefore they have the chance to occur.
Page 29
2. DEVELOPMENT OF SOLUTION
To determine a project’s technical feasibility, the technical specifications of the installationand operations thereof must be known. IGV control has two main components, namely theguide vane assembly and the control mechanism (commonly an electric actuator).
The installation of the IGV can be done in almost any main ventilation fan ducting leading tothe fan impeller. Guide vanes are installed upstream from the fan impeller as close as possibleto the fan impeller to ensure a high efficiency. The central hub is commonly supported bythree rods fixed to the surrounding ducting. Additionally, the number of vanes utilised has animpact on fan performance and overall vane efficiency. The number of vanes typically dependon the size of the main fan motor and the duct sizing. 11 guide vanes are typically installedon large main fan installations (above 1.5 MW), while smaller main fan installations receiveonly nine guide vanes 15.
The control mechanism is used to change the pitch of the guide vanes; this can either be donemanually or automatically with an electric actuator. Automatic control makes it possible tocontrol the guide vane angles to a 24-hour profile. Guide vane angles can then be reducedduring periods when a reduction in ventilation is anticipated or Eskom’s peak TOU tariffs arein effect.
The control mechanism is installed on the outside of the main fan ducting, with a control rodconnecting the actuator to the IGV central hub. IGV design determines the required torqueneeded to operate the guide vanes. The actuator is commonly mounted on a pedestal, creatinga fixed platform for the actuator to operate from. The actuator and control arm must be ableto push the central hub’s driving mechanism through 45 degrees of rotation, to fully open andclose the IGVs.
Economic feasibility investigates the financial feasibility of the project at hand. Two majorcost components that are typically involved in new projects are capital costs and operationalcosts. Capital costs are the costs incurred to install the new IGV assembly, while operationalcosts are the costs incurred to sustain the operation of the system. By determining thepotential cost savings that could be realised through IGV control, the return on investment(ROI) period can be determined, which is a performance measure used to evaluate theefficiency of an investment 16. ROI period is calculated by dividing the cost of investment bythe costs savings that could be realised though the implementation of the project. This is thenmultiplied by 12 to get a payback period in months. The ROI period is the amount of timefor the initiative/project to “repay” the initial capital expenditure. The ROI period can becalculated using the following formula:
ROI =Cost o f investment
Potential cost savings×12
Mining companies often require the ROI period to be less than 12 months to ensure that capitalexpenditures are paid back within a year from implementation 17.
15Owner of GCD Laser and Utility services - G. Stoltz, Inlet guide vane design, 12 February 202016James Chen,”Return on Investment (ROI)” Internet: www.investopedia.com [11 July 2020]17Engineering manager at ETA Operations - P. Peach, Capital Expenditure (CapEx) projects, 13 May 2019
Page 30
2. DEVELOPMENT OF SOLUTION
Legal requirements should also be considered. Mining ventilation must conform to variouslegislation to ensure a safe and habitable working environment for the miners. The impact ofIGV control must be established to ensure that the underground environment still conformsto legislation with a reduction in mining ventilation flow. One of the guidelines that governthe mining ventilation is ensuring that underground temperatures are maintained below 37 ◦Cdry-bulb and 32.5 ◦C wet-bulb [8] [18] [47].
For wet-bulb temperatures above 27.5 ◦C, a formal heat stress management (HSM)programme governed by an approved code of practice is required. Webber et al. [48]reviewed international and local heat stress indicators, which could be used for ultra-deepmining. Numerous codes of practise and guidelines are reviewed, however, no temperaturelimit is set. It is the mine’s responsibility to maintain the health and safety of the miners.Therefore, most guidelines refer to a upper limit of 32.5 ◦C wet-bulb and 37 ◦C dry-bulb as asafe working temperature, which is only potentially conductive to heat disorders, where-asabove this limit personnel are exposed to unacceptable risks of heat disorders.
An important step is to ensure that mining ventilation, operational performance, and main fanperformance are maintained through the implementation of IGV control. Project engineersare required to maintain a safe underground mining environment according to legislation.
All projects have some risks that need to be analysed prior to implementation. A risk analysishelps to avoid or mitigate common project risks that may lead to failure. Factors that mayinfluence the outcome of the project implementation is considered, these factors are thenfurther analysed to propose a risk management plan and the severity of the associated risks.
A comprehensive feasibility study will ensure a smooth project implementation, since allfactors have already been reviewed and approved. By following a generic project plan, projectengineers are forced to analyse all aspects of the project that may have an influence on theproject and the expected outcomes.
2.3 IGV SIMULATION AND IMPACT STUDY
The feasibility of IGV control depends on the impact that a reduction in mining ventilationmight have on underground conditions. Due to the complexity of deep-level miningventilation networks, computer-aided simulations software is often employed for ventilationplanning and changes. Computer-aided ventilation simulations have proven to be effective inpredicting the impact a system change might have on ventilation flow and undergroundtemperatures [18]. Therefore, a ventilation simulation can easily be employed to helpdetermine the feasibility and impact IGV control may have on mining ventilation.Generating a calibrated and verified ventilation simulation is known to be resource intensive,therefore, a model can be built that only focuses on the main fans and the air volumeextracted from underground operations. This, however, will only provide a prediction of thereduction of air volume extracted and not any indication on underground conditions.
With the help of the simplified simulation model, a real-life test can be conducted todetermine the impact IGV control may have on the ventilation network. This aims only togive a preliminary indication on the impact a reduction in ventilation flow may have on the
Page 31
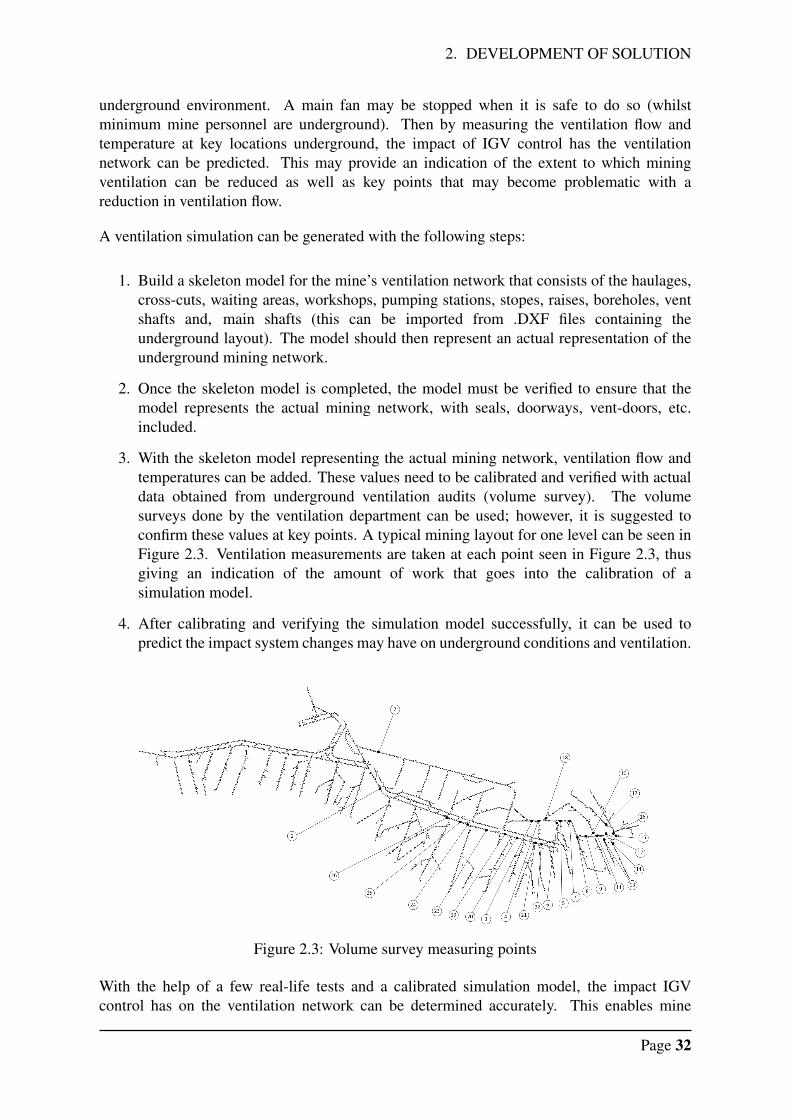
2. DEVELOPMENT OF SOLUTION
underground environment. A main fan may be stopped when it is safe to do so (whilstminimum mine personnel are underground). Then by measuring the ventilation flow andtemperature at key locations underground, the impact of IGV control has the ventilationnetwork can be predicted. This may provide an indication of the extent to which miningventilation can be reduced as well as key points that may become problematic with areduction in ventilation flow.
A ventilation simulation can be generated with the following steps:
1. Build a skeleton model for the mine’s ventilation network that consists of the haulages,cross-cuts, waiting areas, workshops, pumping stations, stopes, raises, boreholes, ventshafts and, main shafts (this can be imported from .DXF files containing theunderground layout). The model should then represent an actual representation of theunderground mining network.
2. Once the skeleton model is completed, the model must be verified to ensure that themodel represents the actual mining network, with seals, doorways, vent-doors, etc.included.
3. With the skeleton model representing the actual mining network, ventilation flow andtemperatures can be added. These values need to be calibrated and verified with actualdata obtained from underground ventilation audits (volume survey). The volumesurveys done by the ventilation department can be used; however, it is suggested toconfirm these values at key points. A typical mining layout for one level can be seen inFigure 2.3. Ventilation measurements are taken at each point seen in Figure 2.3, thusgiving an indication of the amount of work that goes into the calibration of asimulation model.
4. After calibrating and verifying the simulation model successfully, it can be used topredict the impact system changes may have on underground conditions and ventilation.
Figure 2.3: Volume survey measuring points
With the help of a few real-life tests and a calibrated simulation model, the impact IGVcontrol has on the ventilation network can be determined accurately. This enables mine
Page 32
2. DEVELOPMENT OF SOLUTION
personnel to predict with accuracy the impact a flow reduction might have on theunderground environment.
To determine the potential impact of IGV control on MVF operation and performance, anextensive testing procedure is proposed that involves testing main fan vibrations andoperating limits at all operational IGV angles. The aim of the testing procedure is todetermine the operational limits of IGV control and the impact on main fan performance.The testing procedure is explained in detail in subsection 2.4.
2.4 IMPLEMENTATION STRATEGY
Once IGV control on the mine’s main ventilation fans is deemed feasible by projectengineers and mine personnel, installation can commence. Mining main fans are commonlyrequired to be operational 24 hours a day, seven days a week. This is to ensure that a safe andhabitable underground mining environment is sustained. Therefore, installation proceduresare complicated due to the minimum down time that can be acquired at any one time.
2.4.1 Installation
Any installation or maintenance on the mine’s main fans should be planned carefully tomaintain a safe underground environment through the operation of main fans. Duringmaintenance procedures and installations, the main fan is locked out by qualified minepersonnel and declared safe to enter and to work on.
Several mines require the operation of the installed capacity to ensure a safe undergroundenvironment; which complicates the installation process. Installation is then scheduled overa period when minimum mine personnel is underground, typically during an off-weekend.An off-weekend is further known as an engineering weekend when repairs, maintenance andtesting can commence on water pipelines and compressed air lines.
Main fans receiving IGVs are typically installed over two days. All IGV assemblies arealigned with laser precision and tested to ensure functionality. It is, however, the mine’sresponsibility to ensure the sustainable operation during IGV control, since IGVs can inducevibrations at high guide vane angles. Therefore, a testing procedure is proposed to determinethe stable operating ranges of IGV control after successful installation.
The testing procedure aims to highlight critical control parameters and main fan limitations.IGV control can then be implemented within these parameters and limitations, ensuring mainfan operation and performance.
Page 33
2. DEVELOPMENT OF SOLUTION
The following equipment is required for the testing procedure;
• Airflow measurement equipment
– Pitot tube and manometer (measuring air velocity from outside the fan ducting)
– Mechanical vane anemometer (only when air velocity can be measured within fanducting)
– Barometer
– Whirling hygrometer (to measure ambient and inside duct temperature)
• Vibration measurement sensors
– Fan vibrations
– Motor vibrations
– If there is no vibration measuring equipment installed on the main fans, it is highlyrecommended to source a vibration technician to measure the vibrations on themain shaft and bearings, of both the main fan and motor.
• Bearing temperature sensors and other condition monitoring capabilities (if available)
– Non-driving-end and driving-end fan-bearing temperature
– Non-driving-end and driving-end motor-bearing temperature
– Ventilation flow (if available)
– Fan pressure (if available)
• Power-logging equipment
– Motor current
– Motor supply voltage
– Motor rated power factor
– Power logger (active and reactive power)
• Ventilation measurements at critical points located underground (specified beforehand)
– Utilisation of installed underground ventilation stations measuring ventilationflow, dry-bulb and wet-bulb temperature and pressure
– Conducting a volume survey during testing (resource intensive)
Page 34
2. DEVELOPMENT OF SOLUTION
The testing procedure ensures stable main fan operation and provides actual measurementsto determine the potential impact of IGV control on mining ventilation and main fan powerconsumption.
1. Start up the main fan with IGVs closed (0%), as this will minimise the motor’smaximum start-up current.
2. Slowly open the vanes during startup, guide vanes should be fully open at the same timethe fan reaches operating speed. This timing depends on the time it takes the motor toreach operating speed.
3. After allowing approximately 15 minutes for the ventilation network to stabilise, thefollowing measurements must be taken with the IGVs fully open;
(a) Motor power
(b) Fan air velocity
(c) Fan pressure
(d) Fan and motor vibration together with other main fan condition monitoringcapabilities
(e) Underground ventilation flow (locations to be confirmed with mining ventilationdepartment)
4. After completing the measurements, decrease the IGV angle in increments of 5%,repeating step 3.
5. Decrease the vane angles by 5% until an increase in vibrations is noticed. The main fanmust be operated within vibration and mechanical limits confirmed with engineer andmechanical foreman.
6. The actuator can then be calibrated with a lower guide vane limit once vibrations startnearing the upper vibration limit. All actuators must be calibrated with upper and lowerlimits to mitigate accidental damage to the IGV and MVF assembly.
7. High IGV angles are known to stall the main fan, leading to excessive vibrations. Thisshould be avoided by calibrating the lower limit for guide vane angles.
8. All MVFs with IGVs must be individually tested and calibrated, as each assembly isunique.
9. All measurements are then used to determine the impact IGV control may have onmining ventilation and main fan operation.
Page 35
2. DEVELOPMENT OF SOLUTION
2.4.2 Implementation
To minimise the risk of ventilation problems arising from IGV control, it is suggested toimplement IGV control in phases. Each phase proposes cutting back a little further on theguide vanes and reducing ventilation flow and main fan power consumption. Allowingapproximately a week of operation for each phase will ensure that the ventilation networkstabilises to be able to accurately measure the impact a reduction in ventilation flow has onthe underground environment. Main fan performance is to be monitored and maintainedthroughout implementation.
It is suggested to report on underground ventilation on a weekly basis. This will ensure thatany ventilation changes are noticed, especially when ventilation is reduced to such an extentthat underground flow starts decreasing with large amounts. These areas should then carefullybe monitored to ensure that temperatures do not increase beyond the legal limit. However,when temperatures start increasing without a reduction in flow, the area of concern should beinvestigated. A full ventilation audit (volume survey) will enable mine personnel to determinethe cause of the increasing temperatures. Most often the cause is unrelated to the small flowreduction caused by IGV control and a localised problem is identified.
There are various ways to monitor and assess the performance of critical equipment. KPIsare identified to assist in the monitoring of main fan performance and undergroundventilation. A performance indicator is a quantifiable measure used to evaluate theperformance of equipment. KPIs are identified to monitor and track mining ventilation andmain fan performance.
The following KPIs can be identified to monitor each system, depending on the monitoringcapabilities installed, underground environmental sensors, and main fan condition monitoring.
To monitor mining ventilation, the following monitoring capabilities are required (can be donemanually through volume surveys) and can serve as KPIs;
1. Main fan volume flow
2. Main fan delivery pressure
3. Level intake ventilation temperatures and flow
4. Working areas intake ventilation temperatures and flow
In the case where the mine does not have installed measurement equipment on the main fan orunderground environmental sensors, measurements can be taken manually. This is howeverresource intensive and extensive volume surveys are needed as a baseline to compare withonce IGV control is implemented, to quantify the actual impact.
Page 36
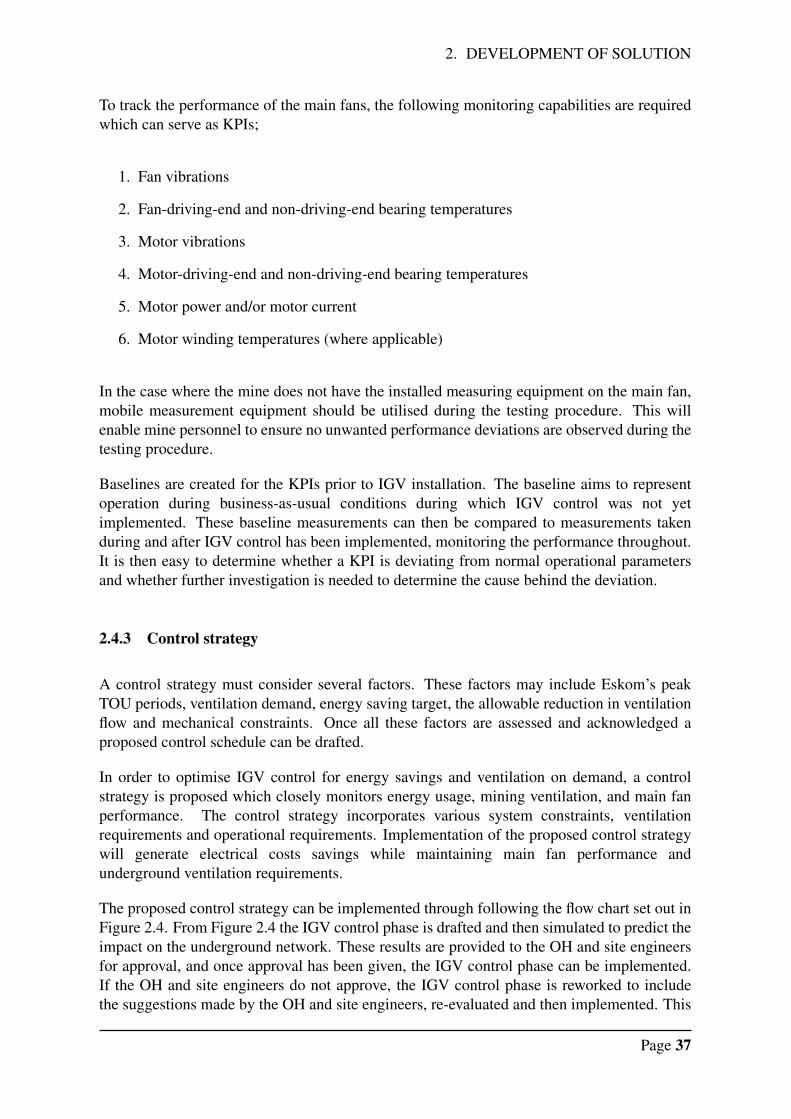
2. DEVELOPMENT OF SOLUTION
To track the performance of the main fans, the following monitoring capabilities are requiredwhich can serve as KPIs;
1. Fan vibrations
2. Fan-driving-end and non-driving-end bearing temperatures
3. Motor vibrations
4. Motor-driving-end and non-driving-end bearing temperatures
5. Motor power and/or motor current
6. Motor winding temperatures (where applicable)
In the case where the mine does not have the installed measuring equipment on the main fan,mobile measurement equipment should be utilised during the testing procedure. This willenable mine personnel to ensure no unwanted performance deviations are observed during thetesting procedure.
Baselines are created for the KPIs prior to IGV installation. The baseline aims to representoperation during business-as-usual conditions during which IGV control was not yetimplemented. These baseline measurements can then be compared to measurements takenduring and after IGV control has been implemented, monitoring the performance throughout.It is then easy to determine whether a KPI is deviating from normal operational parametersand whether further investigation is needed to determine the cause behind the deviation.
2.4.3 Control strategy
A control strategy must consider several factors. These factors may include Eskom’s peakTOU periods, ventilation demand, energy saving target, the allowable reduction in ventilationflow and mechanical constraints. Once all these factors are assessed and acknowledged aproposed control schedule can be drafted.
In order to optimise IGV control for energy savings and ventilation on demand, a controlstrategy is proposed which closely monitors energy usage, mining ventilation, and main fanperformance. The control strategy incorporates various system constraints, ventilationrequirements and operational requirements. Implementation of the proposed control strategywill generate electrical costs savings while maintaining main fan performance andunderground ventilation requirements.
The proposed control strategy can be implemented through following the flow chart set out inFigure 2.4. From Figure 2.4 the IGV control phase is drafted and then simulated to predict theimpact on the underground network. These results are provided to the OH and site engineersfor approval, and once approval has been given, the IGV control phase can be implemented.If the OH and site engineers do not approve, the IGV control phase is reworked to includethe suggestions made by the OH and site engineers, re-evaluated and then implemented. This
Page 37
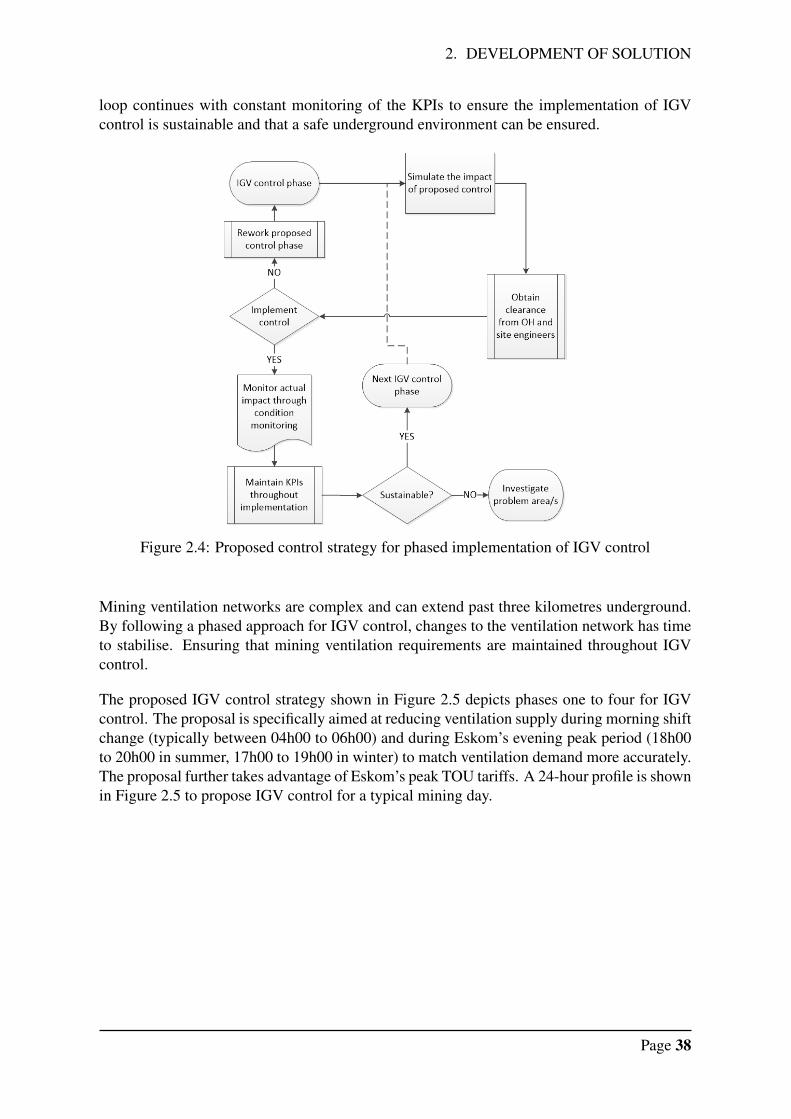
2. DEVELOPMENT OF SOLUTION
loop continues with constant monitoring of the KPIs to ensure the implementation of IGVcontrol is sustainable and that a safe underground environment can be ensured.
Figure 2.4: Proposed control strategy for phased implementation of IGV control
Mining ventilation networks are complex and can extend past three kilometres underground.By following a phased approach for IGV control, changes to the ventilation network has timeto stabilise. Ensuring that mining ventilation requirements are maintained throughout IGVcontrol.
The proposed IGV control strategy shown in Figure 2.5 depicts phases one to four for IGVcontrol. The proposal is specifically aimed at reducing ventilation supply during morning shiftchange (typically between 04h00 to 06h00) and during Eskom’s evening peak period (18h00to 20h00 in summer, 17h00 to 19h00 in winter) to match ventilation demand more accurately.The proposal further takes advantage of Eskom’s peak TOU tariffs. A 24-hour profile is shownin Figure 2.5 to propose IGV control for a typical mining day.
Page 38
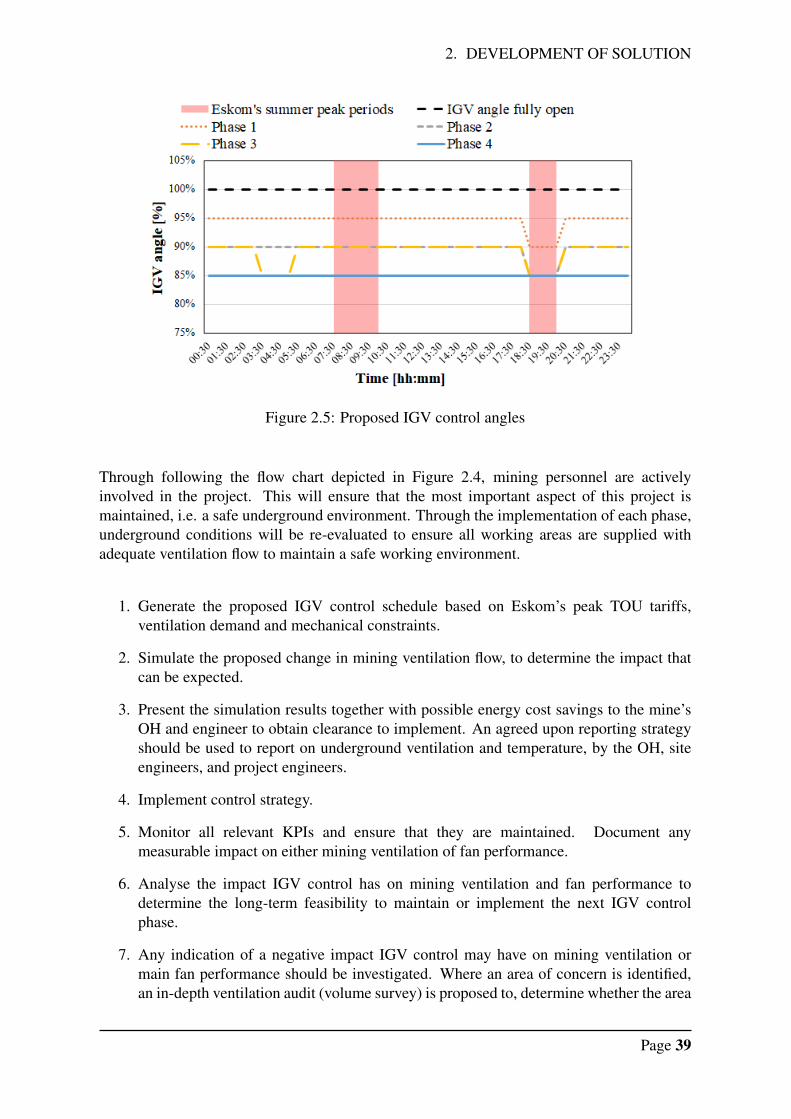
2. DEVELOPMENT OF SOLUTION
Figure 2.5: Proposed IGV control angles
Through following the flow chart depicted in Figure 2.4, mining personnel are activelyinvolved in the project. This will ensure that the most important aspect of this project ismaintained, i.e. a safe underground environment. Through the implementation of each phase,underground conditions will be re-evaluated to ensure all working areas are supplied withadequate ventilation flow to maintain a safe working environment.
1. Generate the proposed IGV control schedule based on Eskom’s peak TOU tariffs,ventilation demand and mechanical constraints.
2. Simulate the proposed change in mining ventilation flow, to determine the impact thatcan be expected.
3. Present the simulation results together with possible energy cost savings to the mine’sOH and engineer to obtain clearance to implement. An agreed upon reporting strategyshould be used to report on underground ventilation and temperature, by the OH, siteengineers, and project engineers.
4. Implement control strategy.
5. Monitor all relevant KPIs and ensure that they are maintained. Document anymeasurable impact on either mining ventilation of fan performance.
6. Analyse the impact IGV control has on mining ventilation and fan performance todetermine the long-term feasibility to maintain or implement the next IGV controlphase.
7. Any indication of a negative impact IGV control may have on mining ventilation ormain fan performance should be investigated. Where an area of concern is identified,an in-depth ventilation audit (volume survey) is proposed to, determine whether the area
Page 39
2. DEVELOPMENT OF SOLUTION
of concern is a localised problem, or whether a lack of adequate ventilation flow, highinlet temperatures, or ventilation leakages is the culprit.
Each mine has its own set of challenges and a unique ventilation network. By workingclosely with mine personnel to implement IGV control on main fans, a sustainable IGVcontrol strategy can be realised. Through the implementation of a researched and agreedupon IGV control strategy, sustainable benefits are possible, such as energy cost savings andimproved ventilation supply and demand.
2.5 CONDITION MONITORING
Condition monitoring plays an important role in the successful implementation andsustainability of IGV control. Main fan performance can be maintained by monitoring mainfan KPIs. Monitoring surface and underground ventilation stations ensures that miningventilation is maintained to supply adequate ventilation to underground working areas.Real-time condition monitoring enables mine personnel to ensure MVF performance andoperation. Through effective monitoring, issues, if any, that may arise from IGV control canbe mitigated and effectively avoided.
As highlighted in section 1, main fans often suffer from vibration issues. These issues arisefrom large rotating masses which can become un-balanced. Due to the corrosiveenvironment which the main fans operate in, fouling on the impeller blades can occur,creating an imbalance which leads to unwanted vibrations. Therefore, it should be noted thatfan vibrations can deviate significantly due to fouling. The monitoring of these vibrations isnecessary to avoid any damage to the main fan assembly and the performance of the mainfans.
MaintenanceCondition monitoring forms an important part of an active predictive maintenance plan.Deviations from normal operating conditions can be detected and acted upon by monitoringmain fan vibrations and bearing temperatures.
With the additional moving equipment installed inside the fan drift, maintenancerequirements increase. It is difficult to maintain and ensure that moving parts inside acorrosive environment are free from fouling and excessive rust, which could hindermovement. Therefore, IGV maintenance is more often based on preventative maintenancethrough regular inspections. Fouling is minimised and rectified before becoming a problemduring regular inspections. Original equipment manufacturers (OEM) propose to inspect theIGVs on a quarterly (every three months) basis to ensure sustainable operation. Guide vaneassemblies are further guaranteed against manufacturing defects for the first year ofoperation, hence the adherence to quarterly inspections.
Page 40
2. DEVELOPMENT OF SOLUTION
From the conclusions made in section 1, IGV installations found in recent case studies werefound to have failed due to excessive corrosion and fouling. The lack of regular maintenanceand inspections enabled severe corrosion and fouling that led to premature failures. It is clearfrom this that through adhering to a strict maintenance schedule, IGV control may be sustainedindefinitely.
2.6 VERIFICATION
Computer-aided simulations can be used to accurately predict the impact that system changesmay have on the ventilation network and underground conditions [8] [18]. Therefore,ventilation simulations can be used to verify that the solution proposed in the methodologywill sustain IGV control. Each phase can be implemented in the replicated simulation modelto determine what impact it may have on the ventilation network without making anychanges to the actual system.
By simulating each phase, an accurate prediction can be made from what is expected fromIGV control and the reduction in ventilation flow. By simulating the system changes thateach IGV control phase brings, the reduction in ventilation flow can be determined per levelensuring all underground working areas receive adequate ventilation flow to maintain a safeworking environment.
As depicted in the proposed solution shown in Figure 2.2, simulating the ventilation system isof great importance. The actual impact can be approximated through other methods; however,computer-aided simulations are often considered the most accurate when large system changesare considered.
Simulation are not always performed, as it depends on the conditions of the system. Somesystems do not require computer-aided simulation to predict the impact of system changes.These systems are simple, and the outcome can be accurately predicted with a thoroughunderstanding of the system and the impact a reduction in ventilation flow might have.
However, verification of the solution strategy is vital to ensure that a reduction in the miningventilation is possible without heating up underground working places beyond the legalrequirements. Whichever method is employed, mine personnel and project engineers shouldbe well acquainted with the expected impact IGV control might have on main fanperformance and the underground environment.
2.7 CONCLUSION
This section discussed the suggested solution strategy for the sustainable implementation ofIGV control on deep level mining MVFs. The solution aims to realise energy savings throughcontrolling IGVs according to mining ventilation demand and Eskom’s TOU tariffs.
The solution suggested by the author will assist in determining the impact that IGV controlwill have before implementation. This is achieved by conducting a comprehensive feasibility
Page 41
2. DEVELOPMENT OF SOLUTION
study and furthermore an impact study through computer-aided simulations, which canaccurately determine the impact IGV control might have on mining ventilation. Moreover,the study includes testing procedures to assist in determining the impact IGV control mighthave on main fan operation and performance.
The solution proposes to monitor the potential impact of IGV control on mining ventilationand main fan performance. Through the identification and active monitoring of KPIs, mainfan performance together with mining ventilation requirements can be maintained. By makinguse of real-time condition monitoring capabilities and an adequate maintenance plan for theinstalled IGVs, sustainable energy savings can be realised.
The generic solution is based on three critical steps:
1. Conduct a feasibility study to determine whether a reduction in ventilation flow ispossible for the mining network at question.
2. Conduct an impact study to determine the expected impact that IGV control might haveon main fan performance and mining ventilation.
3. Implement IGV control through following a phased approach, therefore creatingsufficient time to monitor and maintain KPIs through the use of real-time datamonitoring. This will consequently lead to the sustainable operation of IGVs to realiseenergy savings.
The following chapter details the implementation of the proposed solution strategy on a casestudy.
Page 42
3. RESULTS
3 RESULTS
The results chapter details the implementation of IGV control on a deep-level gold mine. Thecase study will determine whether the proposed solution developed in chapter 2, results in thesustainable operation of IGVs on MVFs, the impact IGV control has on mining ventilationand furthermore main fan performance and operation.
3.1 OVERVIEW OF CASE STUDY
Mine A and B are found on the border of the Vaal River in the Free State. The mining complexconsists of two business units that are interconnected on various levels underground. Mine Areaches a depth of approximately 3 153 meters below surface and boasts the deepest singlelift shaft in the world. Mine B reaches a depth of approximately 2 443 meters below surfacewith two shafts, a vent shaft, and main shaft.
Ventilation is ensured through the operation of five surface fans located at mine A and B.The installed capacity across both operations is 14.3 MW, whereby mine A has an installedcapacity of 2.5 MW per fan and is required to operate all three fans as per normal operation.Mine B has an installed capacity of 2.2 MW per fan, which operates two fans as per normaloperation with one spare fan. The mining layout for the case study can be seen in Figure 3.2.Mine A and B are required to utilise five main ventilation fans for the provision of sufficientair quantities that circulate underground networks, to ensure a safe working environment issustained.
Figure 3.1 depicts the combined energy distribution for mine A and B. The combined dailyenergy usage for the main fans across mine A and B is approximately 293 MWh. This can betranslated to a South African Rand value by making use of South Africa’s electrical utility,Eskom’s 2020/2021 Megaflex tariff structure. This translates to a daily expenditure ofapproximately R 260 000 for the summer months and R 421 000 for the winter months - thisis solely the costs that are incurred on a daily basis to operate the main fans with theobjective of ensuring a safe underground environment.
It is clear from these observations that mining ventilation is one of the major energyconsumers on a deep-level gold mine. The main ventilation fans consume approximately19% of the mine’s total energy consumption, and is the second greatest consumer next tomining, which consumes approximately 25%, shown in Figure 3.1. Another major energyconsumer is refrigeration, which helps additionally to ensure a safe and cool undergroundenvironment. Refrigeration consumes approximately 18% of the mine’s total energyconsumption.
Energy-saving initiatives are investigated in an effort to reduce the electrical costs incurred tooperate the main ventilation fans. Chapter 1 detailed numerous methods to improveventilation efficiency and main fan performance. Various energy saving techniques havebeen investigated to decrease the main fan’s energy consumption; however, IGV controloffers a promising return on investment while having the added benefit of the initial capitalexpenditure being far less compared to that of VSD control.
Page 43
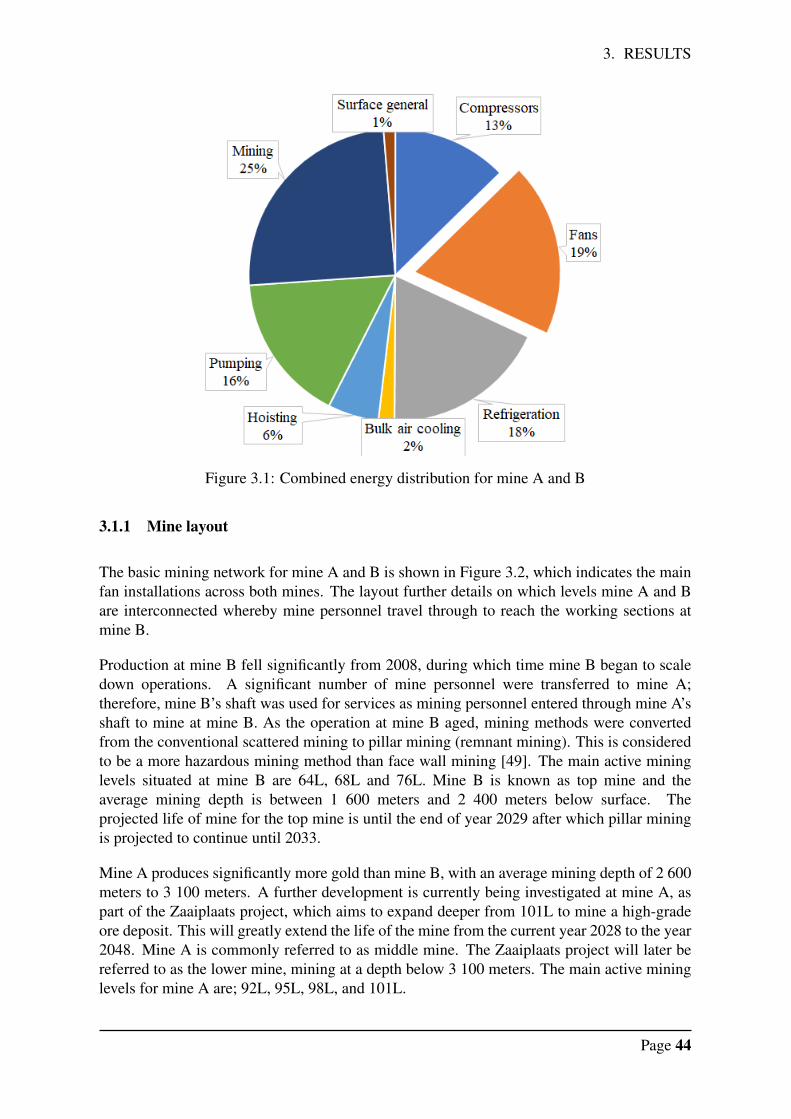
3. RESULTS
Figure 3.1: Combined energy distribution for mine A and B
3.1.1 Mine layout
The basic mining network for mine A and B is shown in Figure 3.2, which indicates the mainfan installations across both mines. The layout further details on which levels mine A and Bare interconnected whereby mine personnel travel through to reach the working sections atmine B.
Production at mine B fell significantly from 2008, during which time mine B began to scaledown operations. A significant number of mine personnel were transferred to mine A;therefore, mine B’s shaft was used for services as mining personnel entered through mine A’sshaft to mine at mine B. As the operation at mine B aged, mining methods were convertedfrom the conventional scattered mining to pillar mining (remnant mining). This is consideredto be a more hazardous mining method than face wall mining [49]. The main active mininglevels situated at mine B are 64L, 68L and 76L. Mine B is known as top mine and theaverage mining depth is between 1 600 meters and 2 400 meters below surface. Theprojected life of mine for the top mine is until the end of year 2029 after which pillar miningis projected to continue until 2033.
Mine A produces significantly more gold than mine B, with an average mining depth of 2 600meters to 3 100 meters. A further development is currently being investigated at mine A, aspart of the Zaaiplaats project, which aims to expand deeper from 101L to mine a high-gradeore deposit. This will greatly extend the life of the mine from the current year 2028 to the year2048. Mine A is commonly referred to as middle mine. The Zaaiplaats project will later bereferred to as the lower mine, mining at a depth below 3 100 meters. The main active mininglevels for mine A are; 92L, 95L, 98L, and 101L.
Page 44
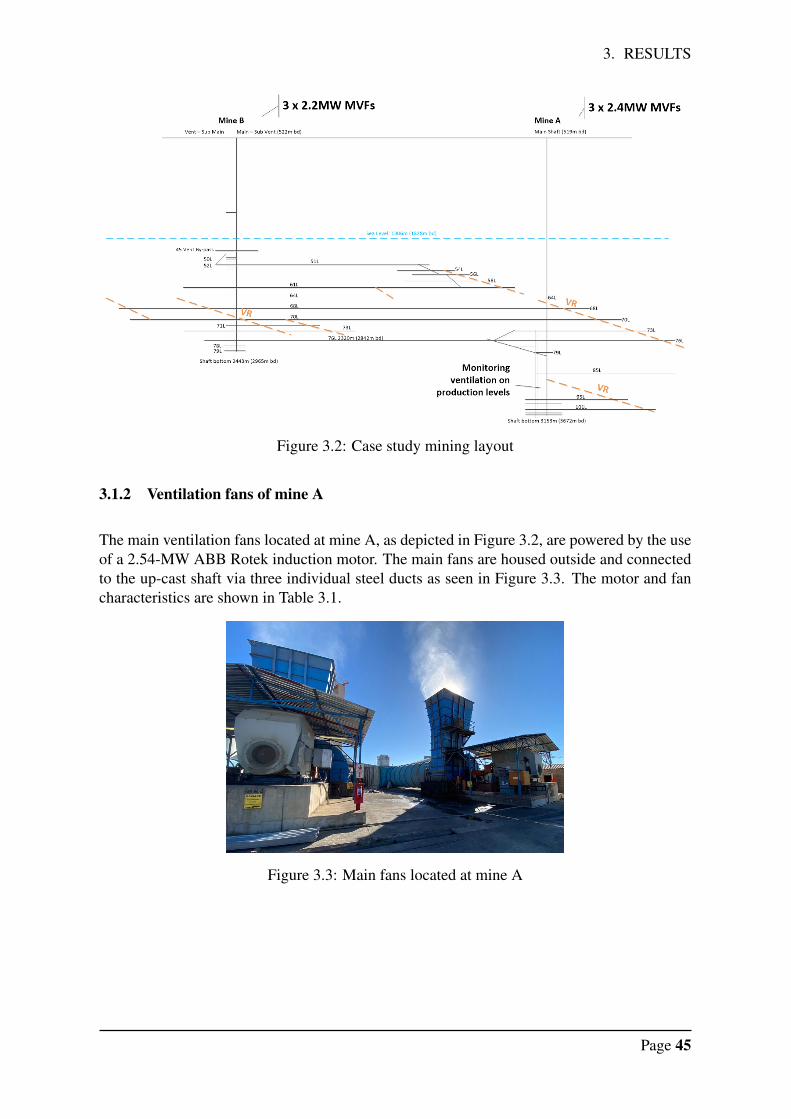
3. RESULTS
Figure 3.2: Case study mining layout
3.1.2 Ventilation fans of mine A
The main ventilation fans located at mine A, as depicted in Figure 3.2, are powered by the useof a 2.54-MW ABB Rotek induction motor. The main fans are housed outside and connectedto the up-cast shaft via three individual steel ducts as seen in Figure 3.3. The motor and fancharacteristics are shown in Table 3.1.
Figure 3.3: Main fans located at mine A
Page 45
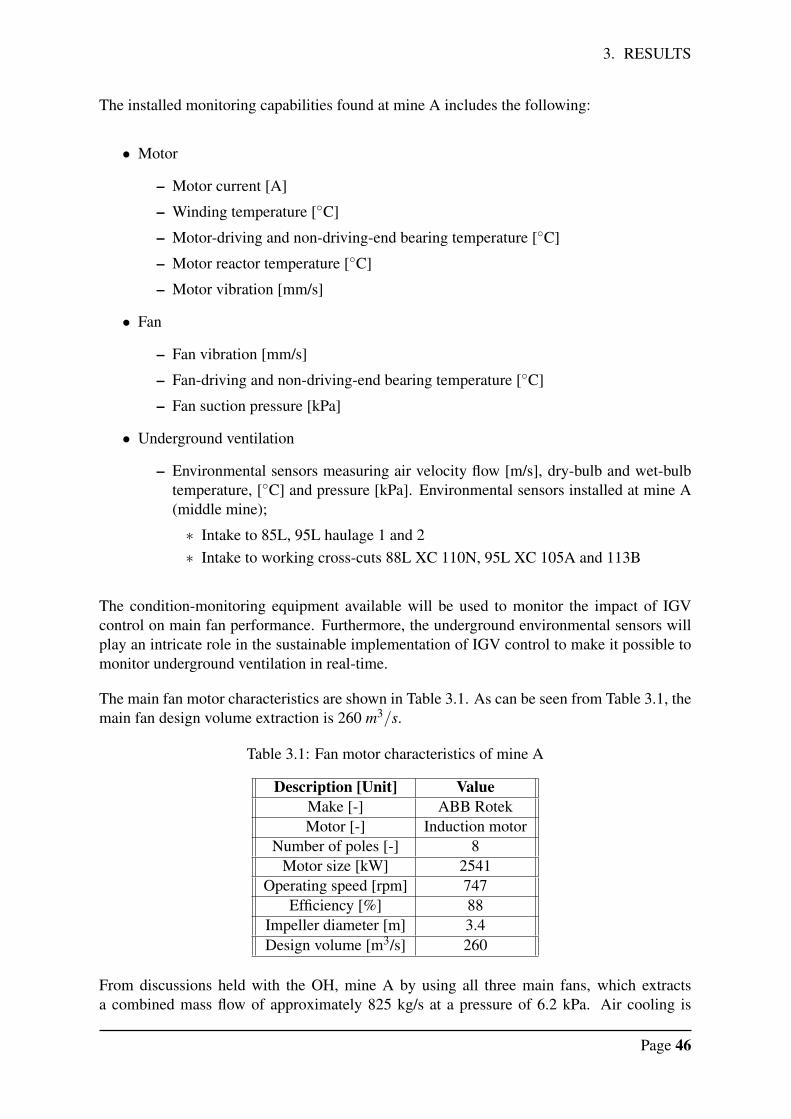
3. RESULTS
The installed monitoring capabilities found at mine A includes the following:
• Motor
– Motor current [A]
– Winding temperature [◦C]
– Motor-driving and non-driving-end bearing temperature [◦C]
– Motor reactor temperature [◦C]
– Motor vibration [mm/s]
• Fan
– Fan vibration [mm/s]
– Fan-driving and non-driving-end bearing temperature [◦C]
– Fan suction pressure [kPa]
• Underground ventilation
– Environmental sensors measuring air velocity flow [m/s], dry-bulb and wet-bulbtemperature, [◦C] and pressure [kPa]. Environmental sensors installed at mine A(middle mine);
∗ Intake to 85L, 95L haulage 1 and 2∗ Intake to working cross-cuts 88L XC 110N, 95L XC 105A and 113B
The condition-monitoring equipment available will be used to monitor the impact of IGVcontrol on main fan performance. Furthermore, the underground environmental sensors willplay an intricate role in the sustainable implementation of IGV control to make it possible tomonitor underground ventilation in real-time.
The main fan motor characteristics are shown in Table 3.1. As can be seen from Table 3.1, themain fan design volume extraction is 260 m3/s.
Table 3.1: Fan motor characteristics of mine A
Description [Unit] ValueMake [-] ABB RotekMotor [-] Induction motor
Number of poles [-] 8Motor size [kW] 2541
Operating speed [rpm] 747Efficiency [%] 88
Impeller diameter [m] 3.4Design volume [m3/s] 260
From discussions held with the OH, mine A by using all three main fans, which extractsa combined mass flow of approximately 825 kg/s at a pressure of 6.2 kPa. Air cooling is
Page 46
3. RESULTS
provided by four bulk air cooling (BAC) towers located on surface, 92L, 95L and 98L. Chilledwater is provided through the provision of four Hitachi fridge plants and four Ammonia fridgeplants with a combined cooling duty of 46 132 kW. Furthermore, mining ventilation is furtherdistributed with the provision of booster fans located on 85L and 95L. Each providing a massflow of 253 kg/s at a pressure of 2.6 kPa and 246 kg/s at a pressure of 3.3 kPa, respectively.
3.1.3 Ventilation fans of mine B
The main ventilation fans located at mine B, as depicted in Figure 3.2, are powered with2.2-MW induction motors.
The motor and fan characteristics are shown in Table 3.2.
The installed monitoring capabilities found at mine B includes the following:
• Motor
– Motor current [A]
– Winding temperature [◦C]
– Motor-driving and non-driving-end bearing temperature [◦C]
– Motor vibration [mm/s]
• Fan
– Fan vibration [mm/s]
– Fan-driving and non-driving-end bearing temperature [◦C]
Using the available data from the condition monitoring sensors can help maintain fanperformance. This is mainly done by sustaining the current operating conditions with regardsto motor and fan vibrations. Additionally, automatic alarms are set to alert mine personnel ofa parameter nearing its operating limits, thereby, providing early warning of potentialproblems or failures.
Description [Unit] ValueMake [-] Brown Boveri
Impeller diameter [m] 3.3Operating speed [rpm] 740Design volume [m3/s] 360
Motor size [kW] 2 240Efficiency [%] 88
Table 3.2: Fan motor characteristics of mine B
From discussions held with the OH, mine B is ventilated with the provisions of two main fanslocated on the surface. The extracted mass flow is expected at 741 kg/s at a pressure of 2.8
Page 47
3. RESULTS
kPa. Mining ventilation is further distributed with booster fans located on 51L, 61L, and 68L.The booster fans provide a mass flow of 260 kg/s, 106 kg/s and 111 kg/s respectively at anoperating pressure of 2.4 kPa, 1.9 kPa, and 1.0 kPa respectively.
Chilled water is supplied to underground working areas with the provision of one Hitachifridge plant and one York fridge plant located on 61L, with a combined cooling duty of 7710 kW. Two Hitachi fridge plants located on the surface is used to supply two surface BACtowers with cold service water, with an installed cooling duty of 8 772 kW.
3.1.4 Previous IGV installation on mine A and B
IGVs have previously been installed on the main fans located at mine A and B as part ofan energy-savings initiative. The IGV design used in these installations were similar to thatshown in Figure 1.12. These IGV assemblies were installed a long time ago, most probablywhen the main fans were installed; therefore, minimal information could be gathered aboutthe IGV assemblies and their initial operation.
The guide vanes were most probably installed in the year 1995, however, IGV control wasnever implemented. Mine personnel have reported that the IGV installation was neverutilised due to the refusal of the OH and ventilation department. The ventilation departmentencountered a number of uncertainties upon investigating the impact that a reduction inmining ventilation may have on the underground ventilation network and furthermore theunderground temperatures. Therefore, the ventilation department wanted the maximum airquantities the main fans could extract, 24 hours a day.
Unfortunately, with the IGVs never utilised, after a short while, the moving componentsexposed to the harsh environment corroded to such an extent that no movement was possibleanymore. This led to the guide vanes being welded in the open position and left as is.
3.1.5 Improved IGV design
Major improvements have been made to the IGV assembly and its operation. As determinedin section one common failures were a result of unkept maintenance and excessive corrosionon the assembly’s central hub together with a poor IGV design. The central hub, as seen inFigure 1.16, is open to corrosion, which was a common failure point. Therefore, in an effortto mitigate such failures, the following design changes have been made;
1. The control mechanism and critical moving parts were enclosed in a sealed hub andfilled with heavy duty grease.
2. Blades were reinforced and a more effective method was used to fasten the vanes.
3. Internal parts were machined, thus eliminating the fluttering.
4. All external parts are coated with an anti-corrosive coating to prevent excessivecorrosion.
Page 48
3. RESULTS
5. All-round improvements were made to include redundancy and safety to the IGVassembly.
The latest installation can be seen in Figure 3.13, where the sealed central hub is clearlyvisible in the figures, which provides shelter to the moving parts from the corrosive operatingenvironment. The sealed unit, together with the improvements made from the common failurepoints, proved to be successful. The new IGV assembly was reported to be operational forlonger than seven years, with no major failures 18.
3.2 FEASIBILITY STUDY
A comprehensive feasibility study (step 2 in Figure 2.2) was conducted at mine A and B toensure that sufficient scope remains for the implementation of IGV control on the MVFs.The main aspect to consider is whether the underground working areas can be maintained ata safe working temperature with a reduction in mining ventilation. Therefore, by analysingthe impact IGV control might have on main fan performance and, most importantly, miningventilation, the feasibility of IGV control can easily be determined.
3.2.1 Technical feasibility
The IGV assembly has minimal technical requirements. The space available before the fanimpeller must be sufficient, such that the IGV assembly can be installed as close as possibleto the fan impeller. 11 vanes are commonly utilised for main fans of power greater than 900kW, while nine vanes can be utilised for smaller fans. The technical drawings for the IGVinstallation can be found in Appendix A.
Furthermore, the IGV control must be considered and electric actuators installed, which wouldhave to be controlled via a PLC.
3.2.2 Economic feasibility
All capital expenditure (CaPex) projects must be applied for, which a board must approve.The application process includes the initial capital expenditure and the expected savings thatcould be realised through implementation. These values can be used to calculate the return oninvestment (ROI), which is calculated through the use of Equation 2.2.
The IGV assembly has two main components, with one part being the IGV assembly and theother part being the control mechanism (electric actuator and PLC for automatic control). Tocalculate the ROI, the costs of installation and the expected energy savings that could arisefrom implementation should be known. The expected savings are determined by using aprevious study’s findings regarding IGV control and the expected energy savings at different
18Owner of GCD Laser and Utility services - G. Stoltz, Improvements on IGV design, 23 October 2020
Page 49
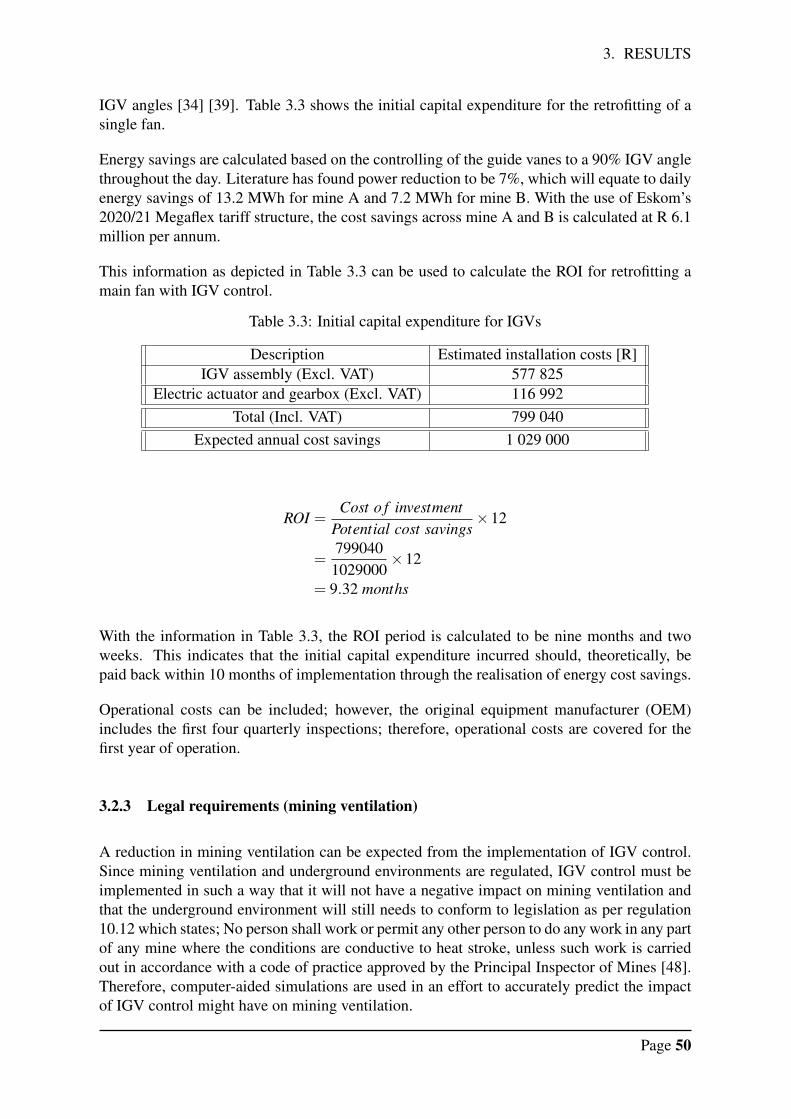
3. RESULTS
IGV angles [34] [39]. Table 3.3 shows the initial capital expenditure for the retrofitting of asingle fan.
Energy savings are calculated based on the controlling of the guide vanes to a 90% IGV anglethroughout the day. Literature has found power reduction to be 7%, which will equate to dailyenergy savings of 13.2 MWh for mine A and 7.2 MWh for mine B. With the use of Eskom’s2020/21 Megaflex tariff structure, the cost savings across mine A and B is calculated at R 6.1million per annum.
This information as depicted in Table 3.3 can be used to calculate the ROI for retrofitting amain fan with IGV control.
Table 3.3: Initial capital expenditure for IGVs
Description Estimated installation costs [R]IGV assembly (Excl. VAT) 577 825
Electric actuator and gearbox (Excl. VAT) 116 992Total (Incl. VAT) 799 040
Expected annual cost savings 1 029 000
ROI =Cost o f investment
Potential cost savings×12
=7990401029000
×12
= 9.32 months
With the information in Table 3.3, the ROI period is calculated to be nine months and twoweeks. This indicates that the initial capital expenditure incurred should, theoretically, bepaid back within 10 months of implementation through the realisation of energy cost savings.
Operational costs can be included; however, the original equipment manufacturer (OEM)includes the first four quarterly inspections; therefore, operational costs are covered for thefirst year of operation.
3.2.3 Legal requirements (mining ventilation)
A reduction in mining ventilation can be expected from the implementation of IGV control.Since mining ventilation and underground environments are regulated, IGV control must beimplemented in such a way that it will not have a negative impact on mining ventilation andthat the underground environment will still needs to conform to legislation as per regulation10.12 which states; No person shall work or permit any other person to do any work in any partof any mine where the conditions are conductive to heat stroke, unless such work is carriedout in accordance with a code of practice approved by the Principal Inspector of Mines [48].Therefore, computer-aided simulations are used in an effort to accurately predict the impactof IGV control might have on mining ventilation.
Page 50
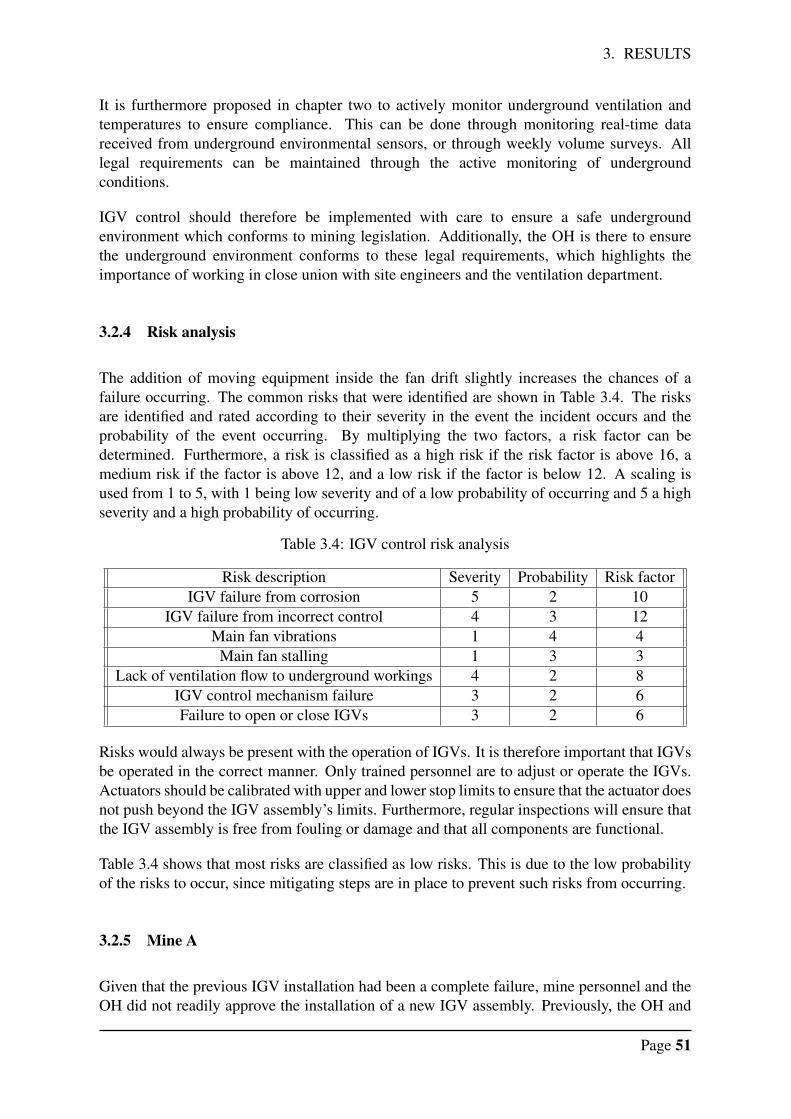
3. RESULTS
It is furthermore proposed in chapter two to actively monitor underground ventilation andtemperatures to ensure compliance. This can be done through monitoring real-time datareceived from underground environmental sensors, or through weekly volume surveys. Alllegal requirements can be maintained through the active monitoring of undergroundconditions.
IGV control should therefore be implemented with care to ensure a safe undergroundenvironment which conforms to mining legislation. Additionally, the OH is there to ensurethe underground environment conforms to these legal requirements, which highlights theimportance of working in close union with site engineers and the ventilation department.
3.2.4 Risk analysis
The addition of moving equipment inside the fan drift slightly increases the chances of afailure occurring. The common risks that were identified are shown in Table 3.4. The risksare identified and rated according to their severity in the event the incident occurs and theprobability of the event occurring. By multiplying the two factors, a risk factor can bedetermined. Furthermore, a risk is classified as a high risk if the risk factor is above 16, amedium risk if the factor is above 12, and a low risk if the factor is below 12. A scaling isused from 1 to 5, with 1 being low severity and of a low probability of occurring and 5 a highseverity and a high probability of occurring.
Table 3.4: IGV control risk analysis
Risk description Severity Probability Risk factorIGV failure from corrosion 5 2 10
IGV failure from incorrect control 4 3 12Main fan vibrations 1 4 4
Main fan stalling 1 3 3Lack of ventilation flow to underground workings 4 2 8
IGV control mechanism failure 3 2 6Failure to open or close IGVs 3 2 6
Risks would always be present with the operation of IGVs. It is therefore important that IGVsbe operated in the correct manner. Only trained personnel are to adjust or operate the IGVs.Actuators should be calibrated with upper and lower stop limits to ensure that the actuator doesnot push beyond the IGV assembly’s limits. Furthermore, regular inspections will ensure thatthe IGV assembly is free from fouling or damage and that all components are functional.
Table 3.4 shows that most risks are classified as low risks. This is due to the low probabilityof the risks to occur, since mitigating steps are in place to prevent such risks from occurring.
3.2.5 Mine A
Given that the previous IGV installation had been a complete failure, mine personnel and theOH did not readily approve the installation of a new IGV assembly. Previously, the OH and
Page 51
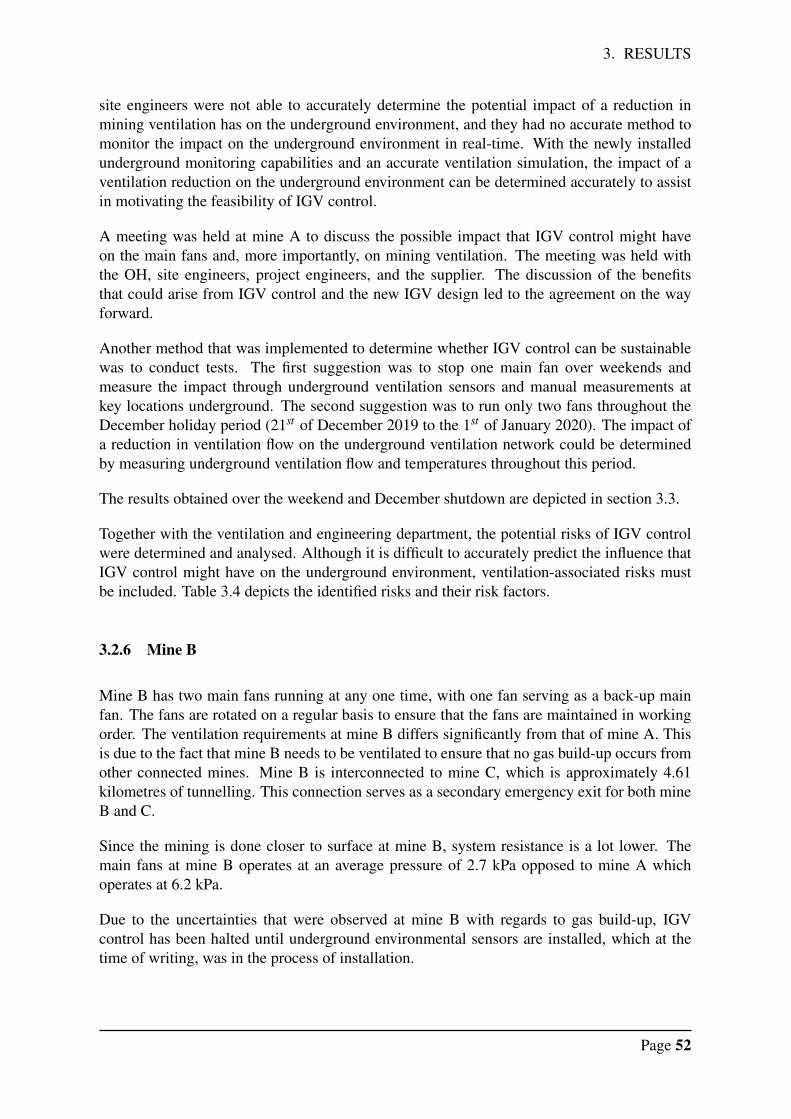
3. RESULTS
site engineers were not able to accurately determine the potential impact of a reduction inmining ventilation has on the underground environment, and they had no accurate method tomonitor the impact on the underground environment in real-time. With the newly installedunderground monitoring capabilities and an accurate ventilation simulation, the impact of aventilation reduction on the underground environment can be determined accurately to assistin motivating the feasibility of IGV control.
A meeting was held at mine A to discuss the possible impact that IGV control might haveon the main fans and, more importantly, on mining ventilation. The meeting was held withthe OH, site engineers, project engineers, and the supplier. The discussion of the benefitsthat could arise from IGV control and the new IGV design led to the agreement on the wayforward.
Another method that was implemented to determine whether IGV control can be sustainablewas to conduct tests. The first suggestion was to stop one main fan over weekends andmeasure the impact through underground ventilation sensors and manual measurements atkey locations underground. The second suggestion was to run only two fans throughout theDecember holiday period (21st of December 2019 to the 1st of January 2020). The impact ofa reduction in ventilation flow on the underground ventilation network could be determinedby measuring underground ventilation flow and temperatures throughout this period.
The results obtained over the weekend and December shutdown are depicted in section 3.3.
Together with the ventilation and engineering department, the potential risks of IGV controlwere determined and analysed. Although it is difficult to accurately predict the influence thatIGV control might have on the underground environment, ventilation-associated risks mustbe included. Table 3.4 depicts the identified risks and their risk factors.
3.2.6 Mine B
Mine B has two main fans running at any one time, with one fan serving as a back-up mainfan. The fans are rotated on a regular basis to ensure that the fans are maintained in workingorder. The ventilation requirements at mine B differs significantly from that of mine A. Thisis due to the fact that mine B needs to be ventilated to ensure that no gas build-up occurs fromother connected mines. Mine B is interconnected to mine C, which is approximately 4.61kilometres of tunnelling. This connection serves as a secondary emergency exit for both mineB and C.
Since the mining is done closer to surface at mine B, system resistance is a lot lower. Themain fans at mine B operates at an average pressure of 2.7 kPa opposed to mine A whichoperates at 6.2 kPa.
Due to the uncertainties that were observed at mine B with regards to gas build-up, IGVcontrol has been halted until underground environmental sensors are installed, which at thetime of writing, was in the process of installation.
Page 52
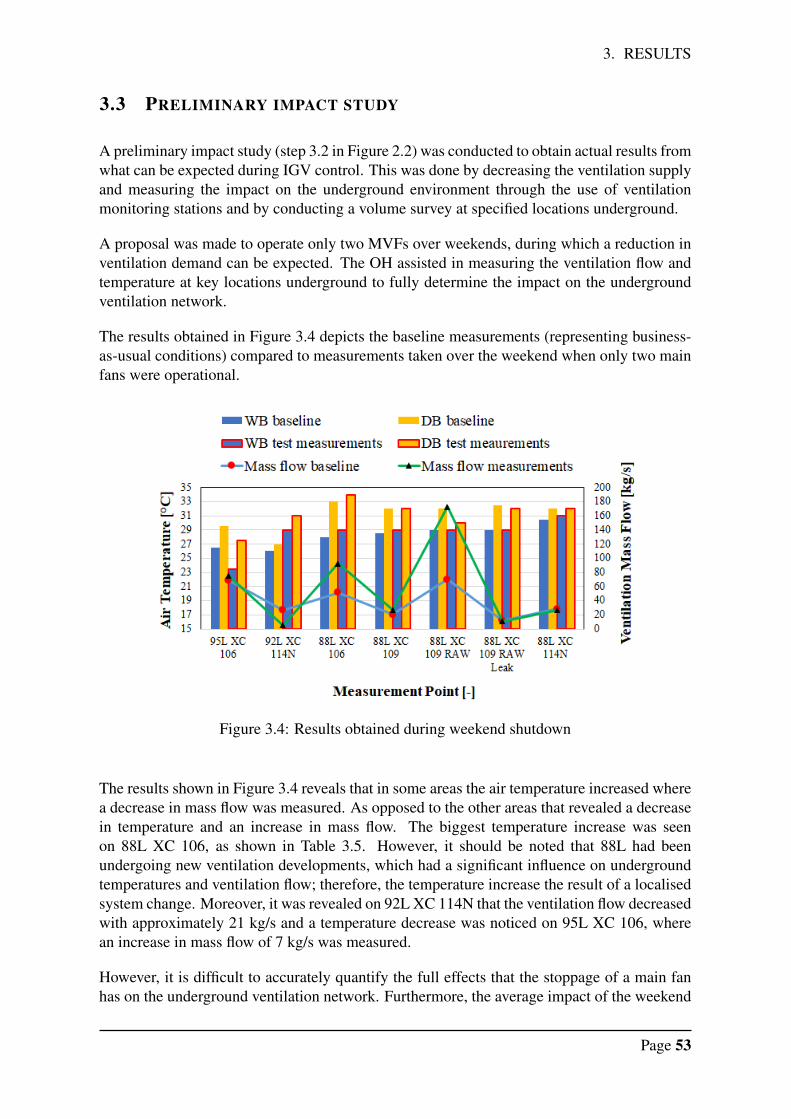
3. RESULTS
3.3 PRELIMINARY IMPACT STUDY
A preliminary impact study (step 3.2 in Figure 2.2) was conducted to obtain actual results fromwhat can be expected during IGV control. This was done by decreasing the ventilation supplyand measuring the impact on the underground environment through the use of ventilationmonitoring stations and by conducting a volume survey at specified locations underground.
A proposal was made to operate only two MVFs over weekends, during which a reduction inventilation demand can be expected. The OH assisted in measuring the ventilation flow andtemperature at key locations underground to fully determine the impact on the undergroundventilation network.
The results obtained in Figure 3.4 depicts the baseline measurements (representing business-as-usual conditions) compared to measurements taken over the weekend when only two mainfans were operational.
Figure 3.4: Results obtained during weekend shutdown
The results shown in Figure 3.4 reveals that in some areas the air temperature increased wherea decrease in mass flow was measured. As opposed to the other areas that revealed a decreasein temperature and an increase in mass flow. The biggest temperature increase was seenon 88L XC 106, as shown in Table 3.5. However, it should be noted that 88L had beenundergoing new ventilation developments, which had a significant influence on undergroundtemperatures and ventilation flow; therefore, the temperature increase the result of a localisedsystem change. Moreover, it was revealed on 92L XC 114N that the ventilation flow decreasedwith approximately 21 kg/s and a temperature decrease was noticed on 95L XC 106, wherean increase in mass flow of 7 kg/s was measured.
However, it is difficult to accurately quantify the full effects that the stoppage of a main fanhas on the underground ventilation network. Furthermore, the average impact of the weekend
Page 53
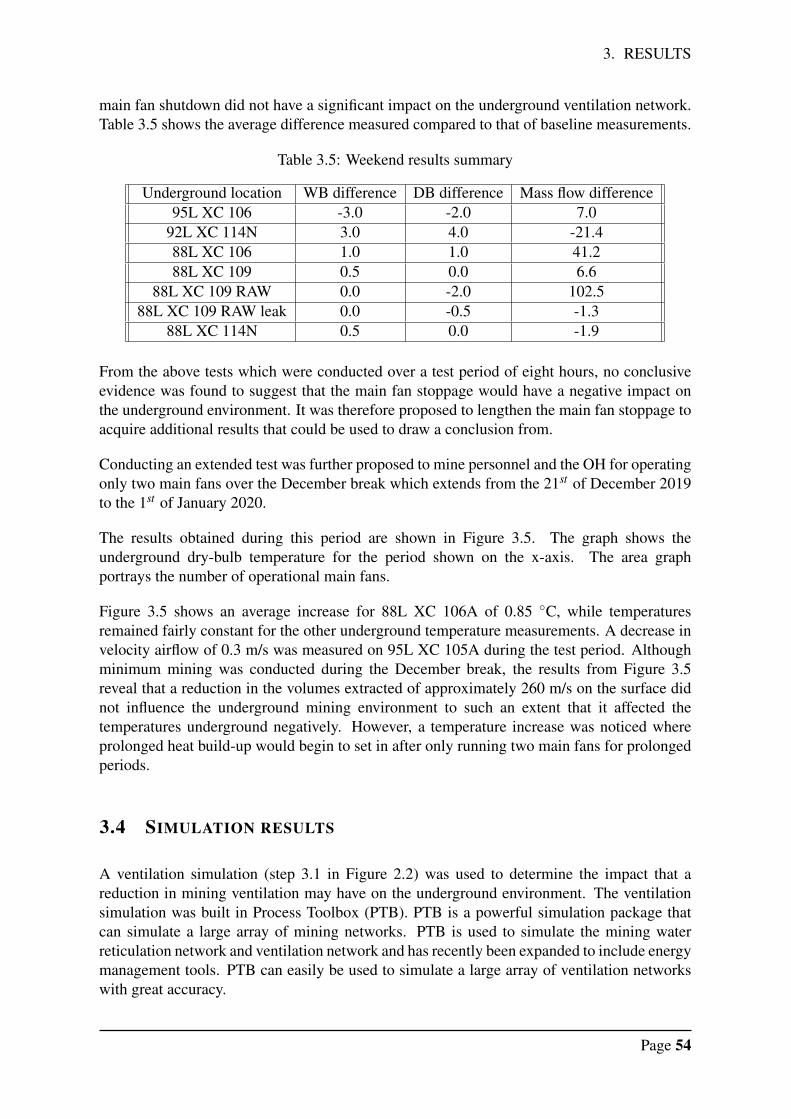
3. RESULTS
main fan shutdown did not have a significant impact on the underground ventilation network.Table 3.5 shows the average difference measured compared to that of baseline measurements.
Table 3.5: Weekend results summary
Underground location WB difference DB difference Mass flow difference95L XC 106 -3.0 -2.0 7.0
92L XC 114N 3.0 4.0 -21.488L XC 106 1.0 1.0 41.288L XC 109 0.5 0.0 6.6
88L XC 109 RAW 0.0 -2.0 102.588L XC 109 RAW leak 0.0 -0.5 -1.3
88L XC 114N 0.5 0.0 -1.9
From the above tests which were conducted over a test period of eight hours, no conclusiveevidence was found to suggest that the main fan stoppage would have a negative impact onthe underground environment. It was therefore proposed to lengthen the main fan stoppage toacquire additional results that could be used to draw a conclusion from.
Conducting an extended test was further proposed to mine personnel and the OH for operatingonly two main fans over the December break which extends from the 21st of December 2019to the 1st of January 2020.
The results obtained during this period are shown in Figure 3.5. The graph shows theunderground dry-bulb temperature for the period shown on the x-axis. The area graphportrays the number of operational main fans.
Figure 3.5 shows an average increase for 88L XC 106A of 0.85 ◦C, while temperaturesremained fairly constant for the other underground temperature measurements. A decrease invelocity airflow of 0.3 m/s was measured on 95L XC 105A during the test period. Althoughminimum mining was conducted during the December break, the results from Figure 3.5reveal that a reduction in the volumes extracted of approximately 260 m/s on the surface didnot influence the underground mining environment to such an extent that it affected thetemperatures underground negatively. However, a temperature increase was noticed whereprolonged heat build-up would begin to set in after only running two main fans for prolongedperiods.
3.4 SIMULATION RESULTS
A ventilation simulation (step 3.1 in Figure 2.2) was used to determine the impact that areduction in mining ventilation may have on the underground environment. The ventilationsimulation was built in Process Toolbox (PTB). PTB is a powerful simulation package thatcan simulate a large array of mining networks. PTB is used to simulate the mining waterreticulation network and ventilation network and has recently been expanded to include energymanagement tools. PTB can easily be used to simulate a large array of ventilation networkswith great accuracy.
Page 54
3. RESULTS
Figure 3.5: Results obtained during December shutdown
The simulation model was calibrated with data obtained through various volume surveysconducted between June 2019 and November 2019. However, variations in ambientconditions limited the accuracy of the ventilation model. The model accuracy was calculatedwith the mean absolute error (MAE) method. The MAE method compares the wet- anddry-bulb temperatures for each measurement point compared to that of various volumesurveys. Additionally, the live services monitoring (environmental sensors) stations wereused for comparison. At time of writing, only mine A had a calibrated ventilation simulationmodel. Mine B’s simulation model was undergoing development and calibration.
The simulation results compared to business-as-usual conditions revealed a baseline accuracyof 90.7%. During the COVID-19 lock-down, the simulation was used to predict the optimalpoint at which to restart mining ventilation and refrigeration. The accuracy of the simulationmodel during the lock-down period was 85.53%. Due to less water usage and wastage duringthe lock-down period, less humid conditions were measured underground, thereby, causinga slightly lower accuracy value for the model. However, the model was able to accuratelypredict the temperatures during varying operating conditions.
The simulation was used to determine the possible impact of a reduction in ventilation flowon level-intake air velocities and temperatures. The simulation model predicted the impact onthe entire ventilation network, extending from the level intakes to the furthest working areas.
The simulation results reveal the change in airflow and temperature for each level intake andadditionally to the furthest cross-cut. The entire ventilation network was analysed. Lowerflow rates through the surface fans reduces the effect of auto compression and causes a higherpercentage of airflow through the surface BAC, especially during hotter months. This resultsin colder air being drawn down the shaft and at the level inlets. The decrease in level intaketemperatures can clearly be seen in Figure 3.6.
The impact of the reduction in fan flow rate on the level intake mass flow can be seen in Figure
Page 55
3. RESULTS
B.1, in Appendix B. A flow reduction above 80% creates an unwanted reversal of flow in someareas, essentially creating unwanted return airways and providing insufficient ventilation flowto the furthest cross-cuts. An insufficient amount of air is supplied to 98L at 60% fan flowrate, which reveals a large increase in the wet-bulb temperature inlet for 98L, as seen in Figure3.6.
Figure 3.6: Level intake temperatures at varying flow rates
A reduction in flow rate has the biggest impact on the cross-cuts of 98L. As revealed inFigure 3.7, the decrease in fan flow rate results in an initial improvement in cross-cut intaketemperatures; however, after a reduction of more than 80%, the temperature increases by upto 6 ◦C. This is mainly due to insufficient airflow rates supplied to the working areas, leadingto excessive heat build-up.
Figure 3.7: 98L cross-cut intake temperatures
Page 56
3. RESULTS
Evidently, the results obtained from the simulation model reveals that a fan flow ratereduction of 80% or less is feasible. The impact on the underground level intaketemperatures are not affected negatively, while providing adequate ventilation to sustain asafe working environment. Ultimately, at 80% flow, no significant temperature issues arisewhich would negatively affect the underground working environment.
The results obtained through the ventilation simulation will assist to ensure that a safeunderground environment is maintained. The results revealed through following the testingprocedure provides the percentage flow reduction at various IGV angles. Which can then beadjusted according to the safe operating conditions as verified through the ventilationsimulation.
Furthermore, the simulation was used to determine the impact of each IGV angle on main fanperformance. The results which are of importance is the impact on the fan’s delivery pressure,mass flow, and power consumption. Table 3.6 depicts the simulation results obtained forvarying IGV angles.
Table 3.6: Simulation results for mine A
IGV angle [%] Mass flow [kg/s] Pressure [kPa] Power [kW]100 274.13 6.76 2631.5895 273.98 6.75 2626.2990 272.93 6.67 2590.3580 268.16 6.33 2440.7870 259.78 5.74 2227.2560 247.80 4.94 1996.4150 232.19 3.97 1762.0340 213.19 2.88 1484.28
3.5 BASELINE MEASUREMENTS
Baseline measurements are measurements taken prior to the implementation of IGV controlto represent business-as-usual conditions with regards to main fan power consumption andperformance. Average measurements are taken over a period best suited to fully representbusiness-as-usual conditions, typically a period of three months is used for power baselines.
The baseline shows the trend of power usage under business-as-usual conditions. The periodSeptember 2019 to November 2019 was used to represent these conditions. The baseline willbe used to determine whether there is any cost savings across mine A or B’s main ventilationfans through the implementation of IGV control.
Baselines were created for mine A for the weekdays, Saturdays and Sundays. The baselinesfor mine A can be seen in Figure 3.8 and in Appendix C in Figure C.1 and C.2. Separatepower baselines were created for Saturday and Sunday since maintenance is performed overweekends on one of the main fans. Therefore, only two main fans are operational duringweekends.
Page 57
3. RESULTS
Figure 3.8: Weekday power baseline for mine A
Mine B only operates two fans as per usual; therefore, a single power baseline is created formine B shown in Figure 3.9.
Figure 3.9: Power baseline for mine B
The baselines created for each respective mine measured the power consumption with the oldIGV assembly fitted. The baseline depicted in Figure 3.8 and 3.9 will be used to comparethe power consumption of the main fans compared to that during the implementation of IGVcontrol.
Furthermore, baselines were created to represent the velocity airflow and temperature at keylocations underground, through the data obtained from underground environmental sensors.These baselines will then be used to compare the measurements taken during the
Page 58
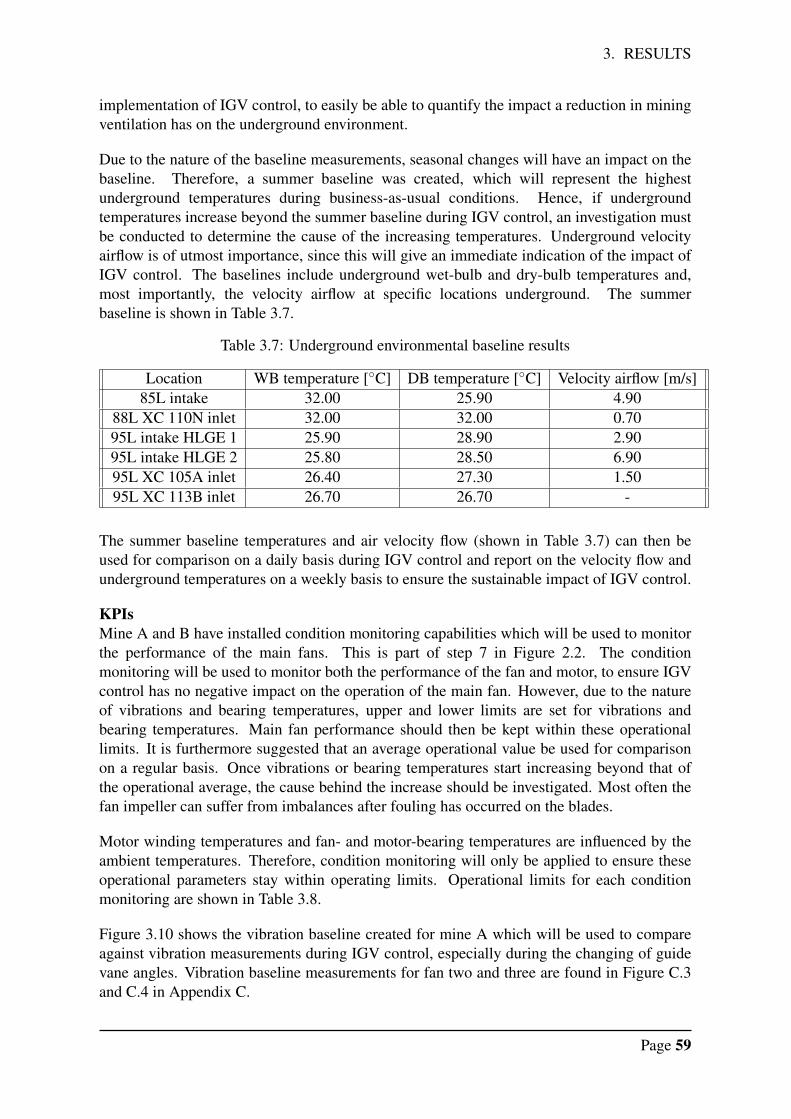
3. RESULTS
implementation of IGV control, to easily be able to quantify the impact a reduction in miningventilation has on the underground environment.
Due to the nature of the baseline measurements, seasonal changes will have an impact on thebaseline. Therefore, a summer baseline was created, which will represent the highestunderground temperatures during business-as-usual conditions. Hence, if undergroundtemperatures increase beyond the summer baseline during IGV control, an investigation mustbe conducted to determine the cause of the increasing temperatures. Underground velocityairflow is of utmost importance, since this will give an immediate indication of the impact ofIGV control. The baselines include underground wet-bulb and dry-bulb temperatures and,most importantly, the velocity airflow at specific locations underground. The summerbaseline is shown in Table 3.7.
Table 3.7: Underground environmental baseline results
Location WB temperature [◦C] DB temperature [◦C] Velocity airflow [m/s]85L intake 32.00 25.90 4.90
88L XC 110N inlet 32.00 32.00 0.7095L intake HLGE 1 25.90 28.90 2.9095L intake HLGE 2 25.80 28.50 6.9095L XC 105A inlet 26.40 27.30 1.5095L XC 113B inlet 26.70 26.70 -
The summer baseline temperatures and air velocity flow (shown in Table 3.7) can then beused for comparison on a daily basis during IGV control and report on the velocity flow andunderground temperatures on a weekly basis to ensure the sustainable impact of IGV control.
KPIsMine A and B have installed condition monitoring capabilities which will be used to monitorthe performance of the main fans. This is part of step 7 in Figure 2.2. The conditionmonitoring will be used to monitor both the performance of the fan and motor, to ensure IGVcontrol has no negative impact on the operation of the main fan. However, due to the natureof vibrations and bearing temperatures, upper and lower limits are set for vibrations andbearing temperatures. Main fan performance should then be kept within these operationallimits. It is furthermore suggested that an average operational value be used for comparisonon a regular basis. Once vibrations or bearing temperatures start increasing beyond that ofthe operational average, the cause behind the increase should be investigated. Most often thefan impeller can suffer from imbalances after fouling has occurred on the blades.
Motor winding temperatures and fan- and motor-bearing temperatures are influenced by theambient temperatures. Therefore, condition monitoring will only be applied to ensure theseoperational parameters stay within operating limits. Operational limits for each conditionmonitoring are shown in Table 3.8.
Figure 3.10 shows the vibration baseline created for mine A which will be used to compareagainst vibration measurements during IGV control, especially during the changing of guidevane angles. Vibration baseline measurements for fan two and three are found in Figure C.3and C.4 in Appendix C.
Page 59
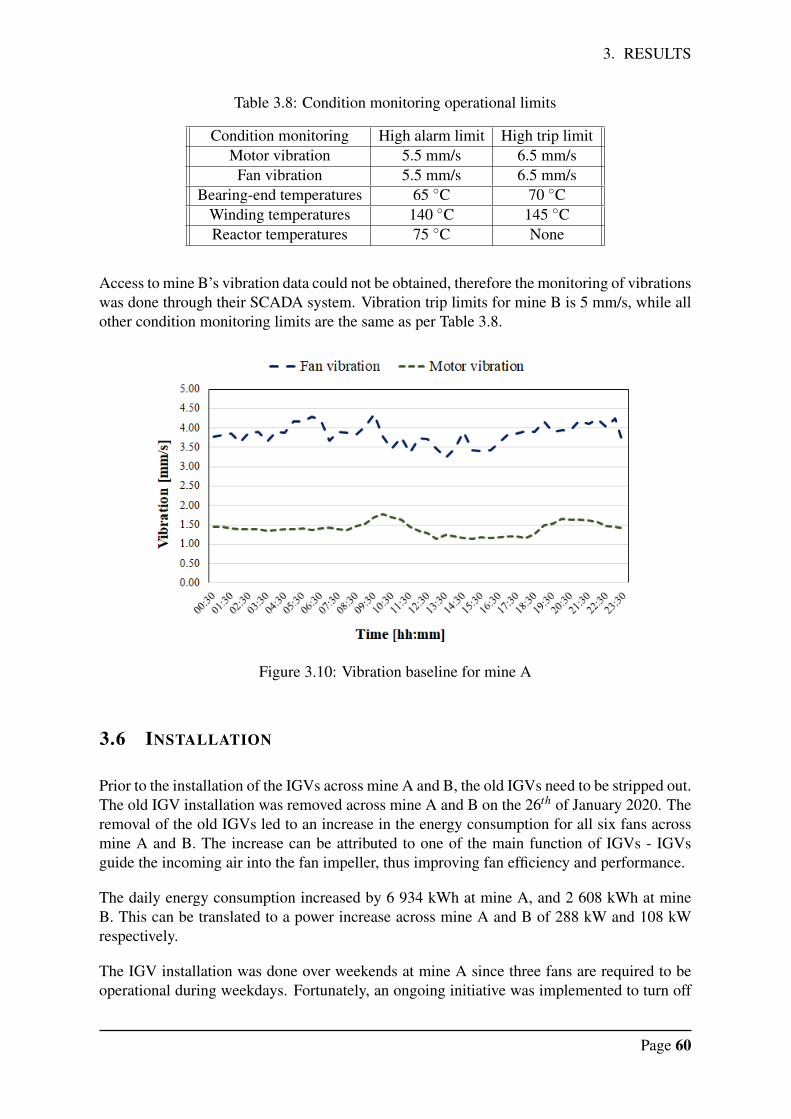
3. RESULTS
Table 3.8: Condition monitoring operational limits
Condition monitoring High alarm limit High trip limitMotor vibration 5.5 mm/s 6.5 mm/s
Fan vibration 5.5 mm/s 6.5 mm/sBearing-end temperatures 65 ◦C 70 ◦C
Winding temperatures 140 ◦C 145 ◦CReactor temperatures 75 ◦C None
Access to mine B’s vibration data could not be obtained, therefore the monitoring of vibrationswas done through their SCADA system. Vibration trip limits for mine B is 5 mm/s, while allother condition monitoring limits are the same as per Table 3.8.
Figure 3.10: Vibration baseline for mine A
3.6 INSTALLATION
Prior to the installation of the IGVs across mine A and B, the old IGVs need to be stripped out.The old IGV installation was removed across mine A and B on the 26th of January 2020. Theremoval of the old IGVs led to an increase in the energy consumption for all six fans acrossmine A and B. The increase can be attributed to one of the main function of IGVs - IGVsguide the incoming air into the fan impeller, thus improving fan efficiency and performance.
The daily energy consumption increased by 6 934 kWh at mine A, and 2 608 kWh at mineB. This can be translated to a power increase across mine A and B of 288 kW and 108 kWrespectively.
The IGV installation was done over weekends at mine A since three fans are required to beoperational during weekdays. Fortunately, an ongoing initiative was implemented to turn off
Page 60
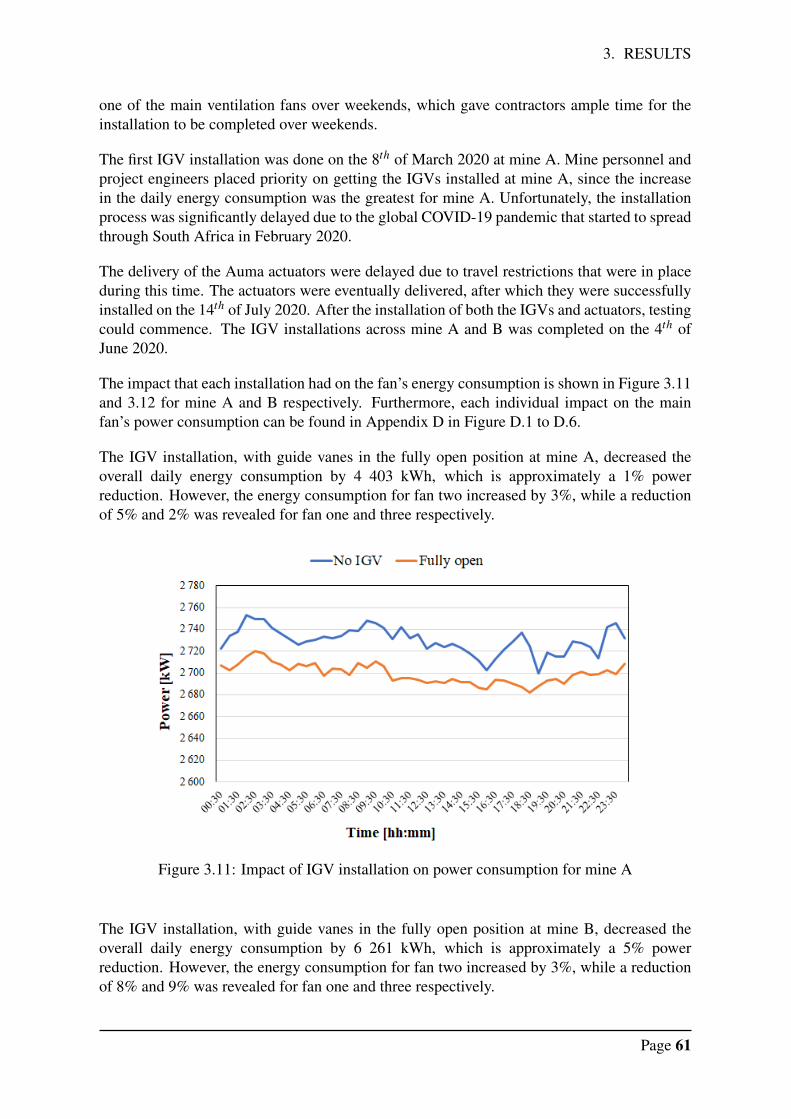
3. RESULTS
one of the main ventilation fans over weekends, which gave contractors ample time for theinstallation to be completed over weekends.
The first IGV installation was done on the 8th of March 2020 at mine A. Mine personnel andproject engineers placed priority on getting the IGVs installed at mine A, since the increasein the daily energy consumption was the greatest for mine A. Unfortunately, the installationprocess was significantly delayed due to the global COVID-19 pandemic that started to spreadthrough South Africa in February 2020.
The delivery of the Auma actuators were delayed due to travel restrictions that were in placeduring this time. The actuators were eventually delivered, after which they were successfullyinstalled on the 14th of July 2020. After the installation of both the IGVs and actuators, testingcould commence. The IGV installations across mine A and B was completed on the 4th ofJune 2020.
The impact that each installation had on the fan’s energy consumption is shown in Figure 3.11and 3.12 for mine A and B respectively. Furthermore, each individual impact on the mainfan’s power consumption can be found in Appendix D in Figure D.1 to D.6.
The IGV installation, with guide vanes in the fully open position at mine A, decreased theoverall daily energy consumption by 4 403 kWh, which is approximately a 1% powerreduction. However, the energy consumption for fan two increased by 3%, while a reductionof 5% and 2% was revealed for fan one and three respectively.
Figure 3.11: Impact of IGV installation on power consumption for mine A
The IGV installation, with guide vanes in the fully open position at mine B, decreased theoverall daily energy consumption by 6 261 kWh, which is approximately a 5% powerreduction. However, the energy consumption for fan two increased by 3%, while a reductionof 8% and 9% was revealed for fan one and three respectively.
Page 61
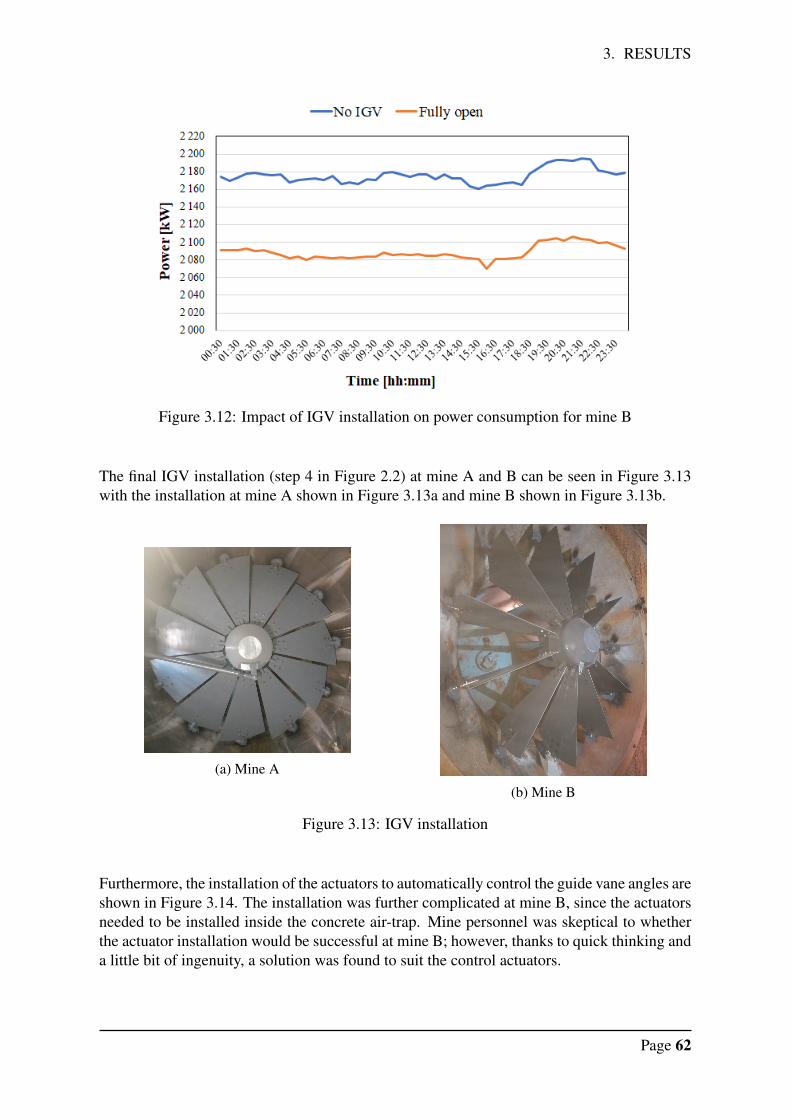
3. RESULTS
Figure 3.12: Impact of IGV installation on power consumption for mine B
The final IGV installation (step 4 in Figure 2.2) at mine A and B can be seen in Figure 3.13with the installation at mine A shown in Figure 3.13a and mine B shown in Figure 3.13b.
(a) Mine A
(b) Mine B
Figure 3.13: IGV installation
Furthermore, the installation of the actuators to automatically control the guide vane angles areshown in Figure 3.14. The installation was further complicated at mine B, since the actuatorsneeded to be installed inside the concrete air-trap. Mine personnel was skeptical to whetherthe actuator installation would be successful at mine B; however, thanks to quick thinking anda little bit of ingenuity, a solution was found to suit the control actuators.
Page 62
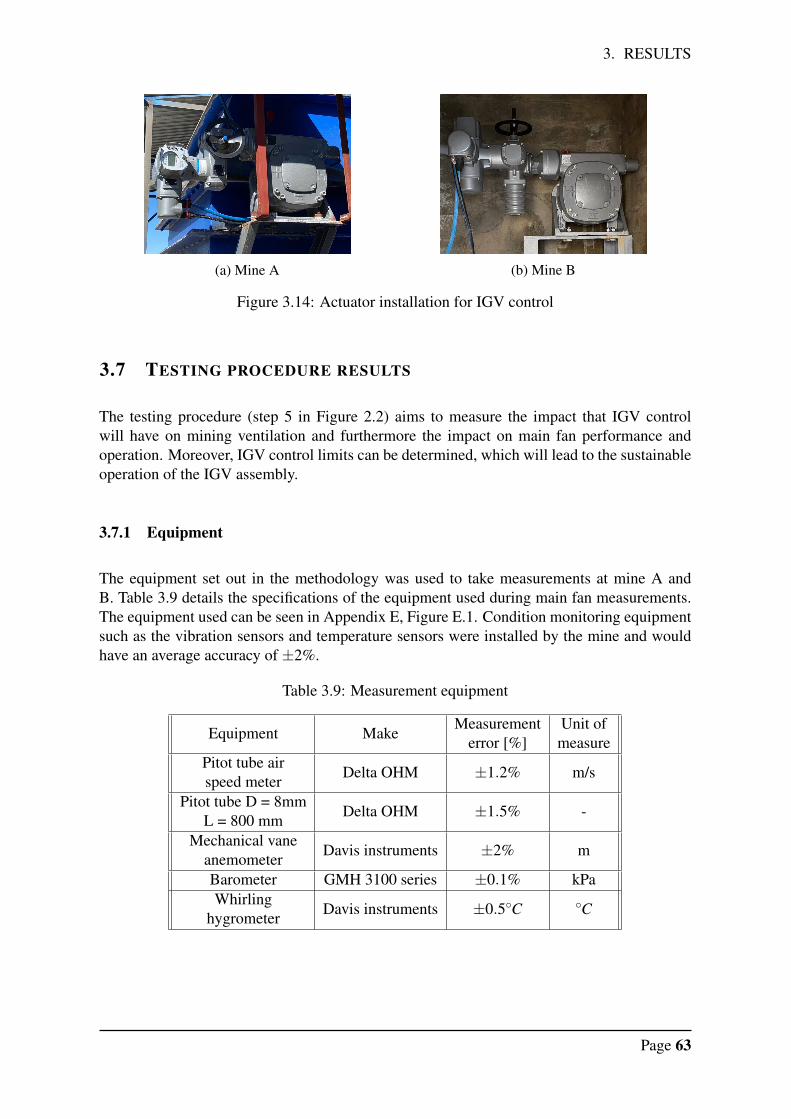
3. RESULTS
(a) Mine A (b) Mine B
Figure 3.14: Actuator installation for IGV control
3.7 TESTING PROCEDURE RESULTS
The testing procedure (step 5 in Figure 2.2) aims to measure the impact that IGV controlwill have on mining ventilation and furthermore the impact on main fan performance andoperation. Moreover, IGV control limits can be determined, which will lead to the sustainableoperation of the IGV assembly.
3.7.1 Equipment
The equipment set out in the methodology was used to take measurements at mine A andB. Table 3.9 details the specifications of the equipment used during main fan measurements.The equipment used can be seen in Appendix E, Figure E.1. Condition monitoring equipmentsuch as the vibration sensors and temperature sensors were installed by the mine and wouldhave an average accuracy of ±2%.
Table 3.9: Measurement equipment
Equipment MakeMeasurement
error [%]Unit ofmeasure
Pitot tube airspeed meter Delta OHM ±1.2% m/s
Pitot tube D = 8mmL = 800 mm Delta OHM ±1.5% -
Mechanical vaneanemometer Davis instruments ±2% m
Barometer GMH 3100 series ±0.1% kPaWhirling
hygrometer Davis instruments ±0.5◦C ◦C
Page 63
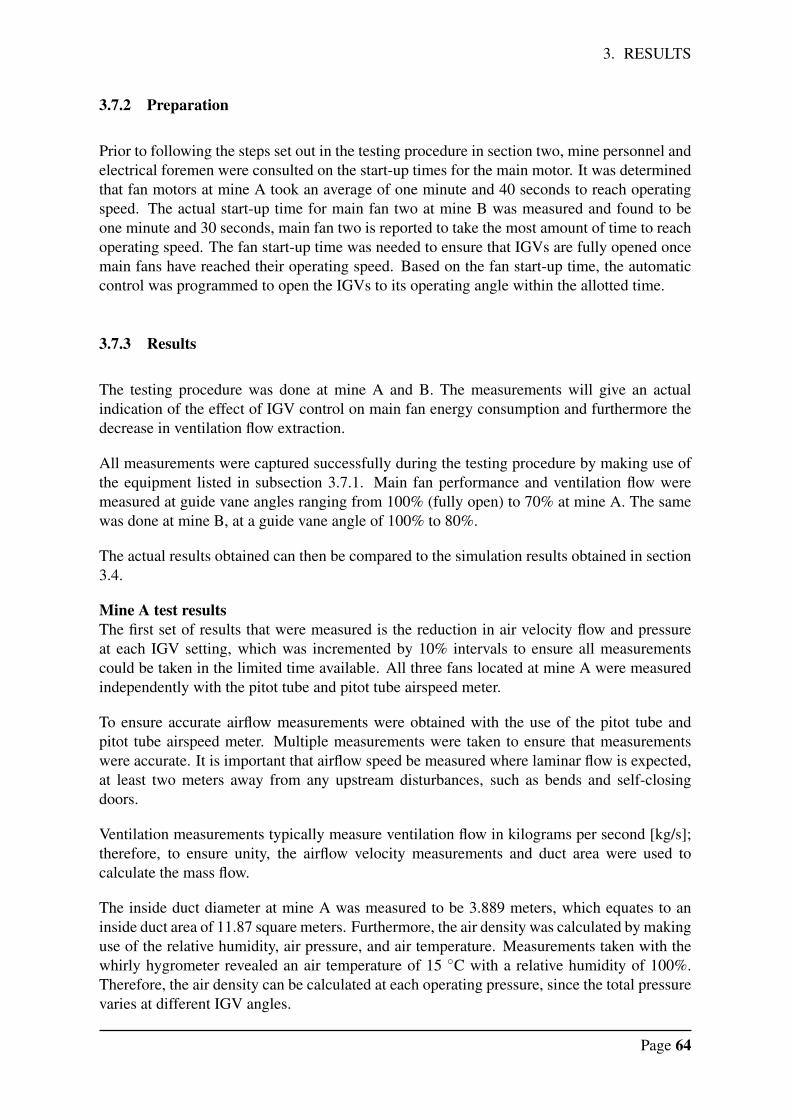
3. RESULTS
3.7.2 Preparation
Prior to following the steps set out in the testing procedure in section two, mine personnel andelectrical foremen were consulted on the start-up times for the main motor. It was determinedthat fan motors at mine A took an average of one minute and 40 seconds to reach operatingspeed. The actual start-up time for main fan two at mine B was measured and found to beone minute and 30 seconds, main fan two is reported to take the most amount of time to reachoperating speed. The fan start-up time was needed to ensure that IGVs are fully opened oncemain fans have reached their operating speed. Based on the fan start-up time, the automaticcontrol was programmed to open the IGVs to its operating angle within the allotted time.
3.7.3 Results
The testing procedure was done at mine A and B. The measurements will give an actualindication of the effect of IGV control on main fan energy consumption and furthermore thedecrease in ventilation flow extraction.
All measurements were captured successfully during the testing procedure by making use ofthe equipment listed in subsection 3.7.1. Main fan performance and ventilation flow weremeasured at guide vane angles ranging from 100% (fully open) to 70% at mine A. The samewas done at mine B, at a guide vane angle of 100% to 80%.
The actual results obtained can then be compared to the simulation results obtained in section3.4.
Mine A test resultsThe first set of results that were measured is the reduction in air velocity flow and pressureat each IGV setting, which was incremented by 10% intervals to ensure all measurementscould be taken in the limited time available. All three fans located at mine A were measuredindependently with the pitot tube and pitot tube airspeed meter.
To ensure accurate airflow measurements were obtained with the use of the pitot tube andpitot tube airspeed meter. Multiple measurements were taken to ensure that measurementswere accurate. It is important that airflow speed be measured where laminar flow is expected,at least two meters away from any upstream disturbances, such as bends and self-closingdoors.
Ventilation measurements typically measure ventilation flow in kilograms per second [kg/s];therefore, to ensure unity, the airflow velocity measurements and duct area were used tocalculate the mass flow.
The inside duct diameter at mine A was measured to be 3.889 meters, which equates to aninside duct area of 11.87 square meters. Furthermore, the air density was calculated by makinguse of the relative humidity, air pressure, and air temperature. Measurements taken with thewhirly hygrometer revealed an air temperature of 15 ◦C with a relative humidity of 100%.Therefore, the air density can be calculated at each operating pressure, since the total pressurevaries at different IGV angles.
Page 64
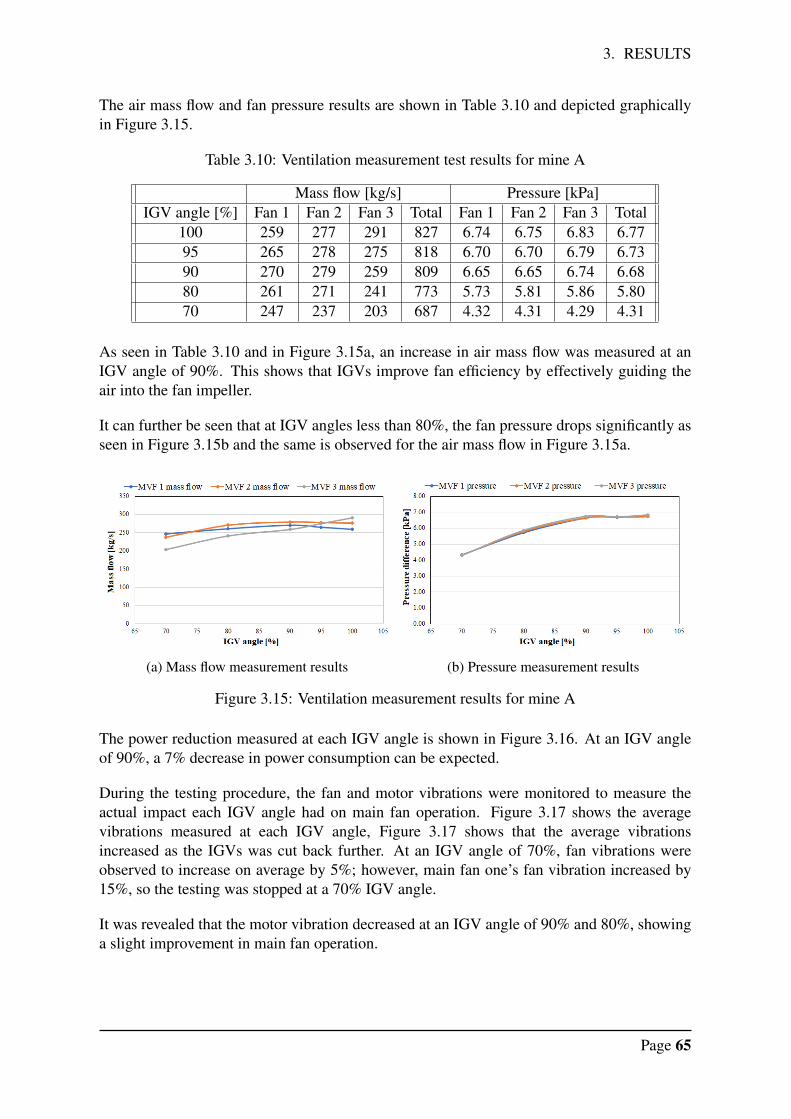
3. RESULTS
The air mass flow and fan pressure results are shown in Table 3.10 and depicted graphicallyin Figure 3.15.
Table 3.10: Ventilation measurement test results for mine A
Mass flow [kg/s] Pressure [kPa]IGV angle [%] Fan 1 Fan 2 Fan 3 Total Fan 1 Fan 2 Fan 3 Total
100 259 277 291 827 6.74 6.75 6.83 6.7795 265 278 275 818 6.70 6.70 6.79 6.7390 270 279 259 809 6.65 6.65 6.74 6.6880 261 271 241 773 5.73 5.81 5.86 5.8070 247 237 203 687 4.32 4.31 4.29 4.31
As seen in Table 3.10 and in Figure 3.15a, an increase in air mass flow was measured at anIGV angle of 90%. This shows that IGVs improve fan efficiency by effectively guiding theair into the fan impeller.
It can further be seen that at IGV angles less than 80%, the fan pressure drops significantly asseen in Figure 3.15b and the same is observed for the air mass flow in Figure 3.15a.
(a) Mass flow measurement results (b) Pressure measurement results
Figure 3.15: Ventilation measurement results for mine A
The power reduction measured at each IGV angle is shown in Figure 3.16. At an IGV angleof 90%, a 7% decrease in power consumption can be expected.
During the testing procedure, the fan and motor vibrations were monitored to measure theactual impact each IGV angle had on main fan operation. Figure 3.17 shows the averagevibrations measured at each IGV angle, Figure 3.17 shows that the average vibrationsincreased as the IGVs was cut back further. At an IGV angle of 70%, fan vibrations wereobserved to increase on average by 5%; however, main fan one’s fan vibration increased by15%, so the testing was stopped at a 70% IGV angle.
It was revealed that the motor vibration decreased at an IGV angle of 90% and 80%, showinga slight improvement in main fan operation.
Page 65
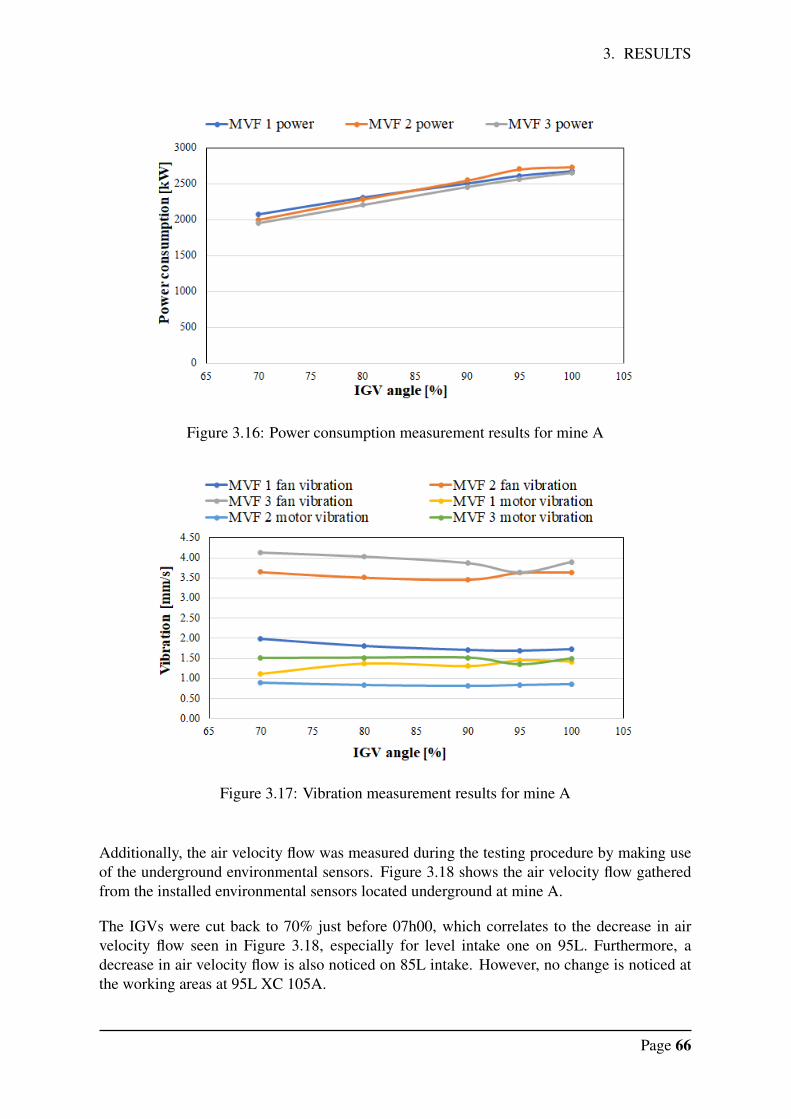
3. RESULTS
Figure 3.16: Power consumption measurement results for mine A
Figure 3.17: Vibration measurement results for mine A
Additionally, the air velocity flow was measured during the testing procedure by making useof the underground environmental sensors. Figure 3.18 shows the air velocity flow gatheredfrom the installed environmental sensors located underground at mine A.
The IGVs were cut back to 70% just before 07h00, which correlates to the decrease in airvelocity flow seen in Figure 3.18, especially for level intake one on 95L. Furthermore, adecrease in air velocity flow is also noticed on 85L intake. However, no change is noticed atthe working areas at 95L XC 105A.
Page 66
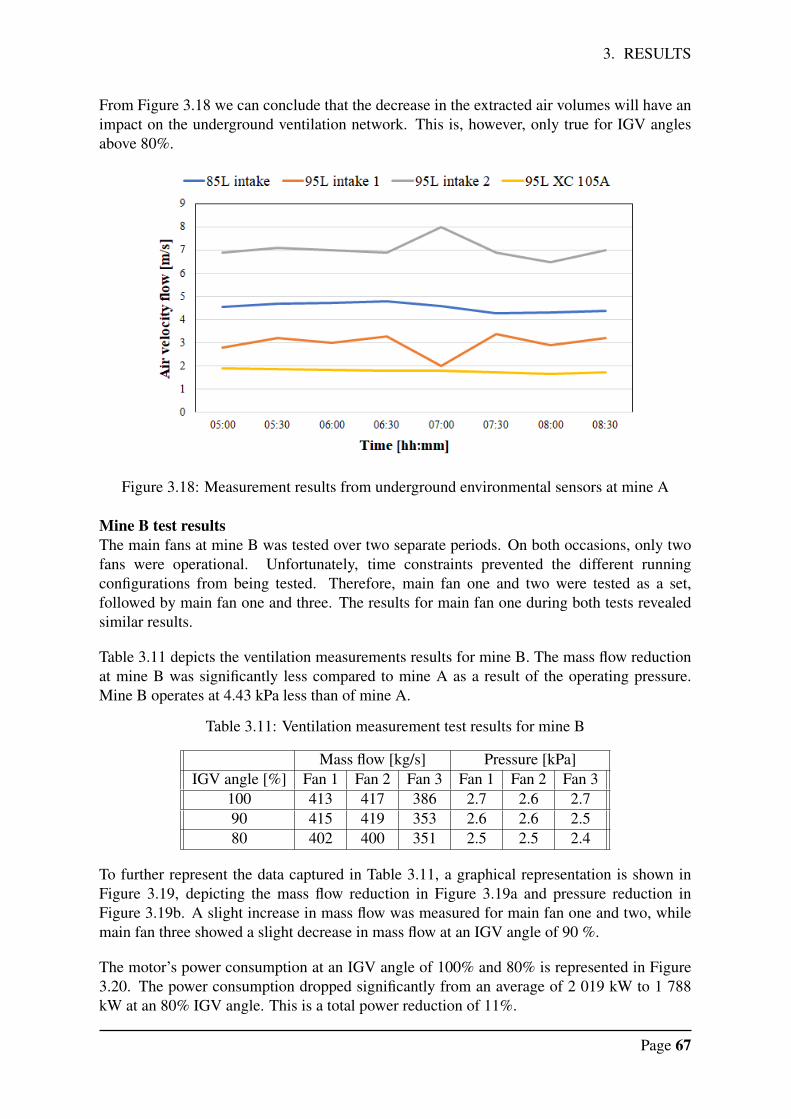
3. RESULTS
From Figure 3.18 we can conclude that the decrease in the extracted air volumes will have animpact on the underground ventilation network. This is, however, only true for IGV anglesabove 80%.
Figure 3.18: Measurement results from underground environmental sensors at mine A
Mine B test resultsThe main fans at mine B was tested over two separate periods. On both occasions, only twofans were operational. Unfortunately, time constraints prevented the different runningconfigurations from being tested. Therefore, main fan one and two were tested as a set,followed by main fan one and three. The results for main fan one during both tests revealedsimilar results.
Table 3.11 depicts the ventilation measurements results for mine B. The mass flow reductionat mine B was significantly less compared to mine A as a result of the operating pressure.Mine B operates at 4.43 kPa less than of mine A.
Table 3.11: Ventilation measurement test results for mine B
Mass flow [kg/s] Pressure [kPa]IGV angle [%] Fan 1 Fan 2 Fan 3 Fan 1 Fan 2 Fan 3
100 413 417 386 2.7 2.6 2.790 415 419 353 2.6 2.6 2.580 402 400 351 2.5 2.5 2.4
To further represent the data captured in Table 3.11, a graphical representation is shown inFigure 3.19, depicting the mass flow reduction in Figure 3.19a and pressure reduction inFigure 3.19b. A slight increase in mass flow was measured for main fan one and two, whilemain fan three showed a slight decrease in mass flow at an IGV angle of 90 %.
The motor’s power consumption at an IGV angle of 100% and 80% is represented in Figure3.20. The power consumption dropped significantly from an average of 2 019 kW to 1 788kW at an 80% IGV angle. This is a total power reduction of 11%.
Page 67
3. RESULTS
(a) Mass flow measurement results (b) Pressure measurement results
Figure 3.19: Ventilation measurement results for mine B
Figure 3.20: Power consumption measurement results mine B
During the testing procedure, the fan and motor vibrations were monitored to determine themaximum IGV angle before vibrations began to increase. However, the main fans were stilloperating smoothly at a 60% IGV angle. Due to the significant drop in pressure that wasmeasured at 60% IGV angle, the IGVs were not decreased any further. The measurementstaken at 60% IGV angle were excluded from the results, since only main fan two and threewere measured at this IGV angle.
3.7.4 Summary
The testing procedure detailed in section 2.2 aimed to deliver actual results, which can beused to determine the full impact IGV control has on mining ventilation and main fanperformance. The results accurately show the impact of IGV control on main fan mass flow,delivery pressure, and furthermore, the underground environment. The test results also gaveinsight into fan and motor vibrations and, most importantly, the energy savings that could be
Page 68
3. RESULTS
Figure 3.21: Vibration measurement results for mine B
expected from IGV control. Therefore, quantifying the benefits that could arise from IGVcontrol as set out in step 6 in Figure 2.2.
The results obtained through the use of the ventilation model is compared to the actualresults in Table 3.12. This stands in accordance with step 5.1 set out in Figure 2.2. Table 3.12reveals a rather large discrepancy between the simulation results and the actual resultsobtained. However, the reference of the actual results obtained differed from those of thesimulation model. Since the previous IGV installation has been removed, the powerconsumption at an IGV angle of 95% represented business-as-usual conditions, with similarenergy consumption to that of the old IGV installation.
When the actual results at an IGV angle of 95% is compared to that of the simulation resultsat an IGV angle of 90%, the simulation model’s accuracy greatly improves. Therefore, usingthe simulation model as verification tool can be of great value, as it provides an accurateprediction on the impact IGV control has on the underground mining environment and mainfan performance.
Table 3.12: Comparison between simulated results and actual results for mine A
Mass flow Pressure PowerIGV angle [%] Simulated Actual Simulated Actual Simulated Actual
95 0% -1% 0% -1% 0% -2%90 0% -2% -1% -1% -2% -7%80 -2% -7% -6% -14% -7% -16%70 -5% -17% -15% -36% -15% -25%60 -10% -27% -24%50 -15% -41% -33%40 -22% -57% -44%
Page 69
3. RESULTS
Table 3.13 summarises the test results for mine A. The impact that each IGV angle has on themain fan’s mass flow, pressure, power consumption, fan vibration and motor vibrations areshown, where a positive value that entails an increase and a negative value a decrease.
The actual measurement results can then be employed to propose an IGV control strategy.The IGV control strategy aims to implement IGV control to realise maximum energy saving,while ensuring that mining ventilation is maintained. IGV control will be implemented inphases, ensuring that mining ventilation together with main fan performance is maintained.The proposed control strategy is laid out in section 3.8.
Table 3.13: Mine A test results summary
IGV angle Main fan Mass flow Pressure PowerFan
vibrationMotor
vibration
95
1 2% -2% -2% -2% 2%2 1% -1% -1% 0% -2%3 -6% -3% -3% -7% -10%
Combined -1% -2% -2% -3% -4%
90
1 4% -1% -6% -1% -8%2 1% -1% -7% -5% -5%3 -11% -1% -7% -1% 1%
Combined -2% -1% -7% -2% -3%
80
1 1% -15% -14% 5% -4%2 -2% -14% -17% -4% -2%3 -17% -14% -17% 3% 1%
Combined -7% -14% -16% 1% -1%
70
1 -5% -36% -23% 15% -21%2 -14% -36% -27% 0% 3%3 -30% -37% -26% 6% 1%
Combined -17% -36% -25% 5% -7%
Table 3.14: Mine B test results summary
IGV angle Main fan Mass flow Pressure PowerFan
vibrationMotor
vibration
90
1 1% -4% -5% -5% -2%2 1% -4% -10% 4% -6%3 -9% -7% -6% 17% 0%
Average -2% -5% -7% 5% -3%
80
1 -3% -7% -11% -8% -3%2 -4% -7% -16% 7% -13%3 -9% -11% -7% 19% 0%
Average -5% -9% -11% 6% -5%
Page 70
3. RESULTS
To ensure the sustainable operation of IGV control, the following points are important:
• Actively monitoring the underground environment for decrease in mass flow, and moreimportantly, heat build-up. Heat build-up should however be considered as a localisedproblem, since heat build-up is often due to incorrect utilisation of the availableventilation flow or an upstream heat source.
• In adhering to a strict maintenance schedule, the IGV assembly is free from corrosionand fouling. Regular inspections will ensure that potential IGV failures are mitigatedand repaired prior to failures occurring.
• Maintaining main fan performance through the monitoring of condition monitoringcapabilities, like fan and motor vibrations, bearing temperatures, and motor windingtemperatures.
3.8 PROPOSED CONTROL STRATEGY
A proposed control strategy is laid out to site engineers and the OH as seen in Figure 2.2, step8. The proposed control strategy considers several factors, including but not limited to:
• Ventilation demand (number of personnel underground)
• Eskom’s TOU tariff structure
• Impact on underground conditions
• Impact on main fan operation and performance
Through consultation with site engineers and the OH, a set of IGV control phases aregenerated. The implementation of each phase is dependent on the impact the previous phasehad on mining ventilation and main fan performance. Therefore, ensuring main fanperformance together with mining ventilation throughout each phase is of high importance,as it will lead to the sustainable operation of IGV control.
By following a phased approach, mining ventilation can be monitored and sustainedthroughout the implementation of each IGV control phase.
At the time of writing, mine B was in the process of installing environmental sensors on topmine. The OH and site engineer at mine B were skeptical about IGV control; therefore, IGVcontrol was only implemented once the monitoring sensors had been installed.
The proposed IGV control phases to follow is only applicable to mine A.
Page 71
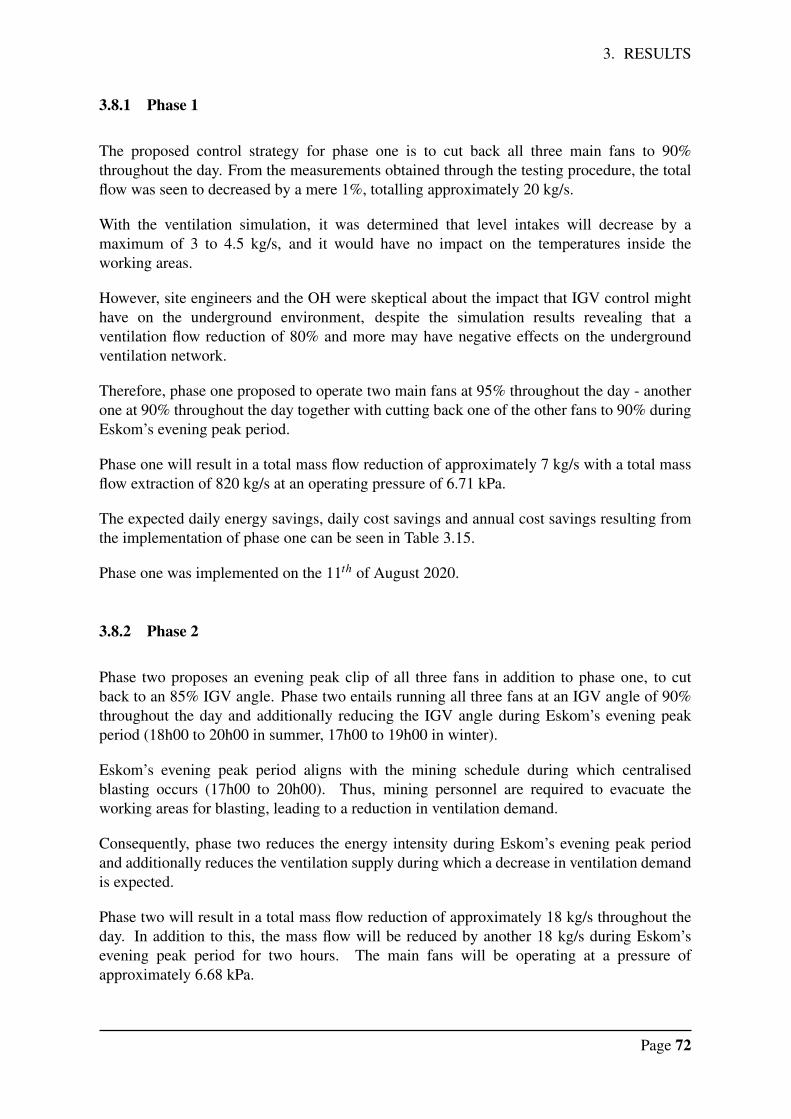
3. RESULTS
3.8.1 Phase 1
The proposed control strategy for phase one is to cut back all three main fans to 90%throughout the day. From the measurements obtained through the testing procedure, the totalflow was seen to decreased by a mere 1%, totalling approximately 20 kg/s.
With the ventilation simulation, it was determined that level intakes will decrease by amaximum of 3 to 4.5 kg/s, and it would have no impact on the temperatures inside theworking areas.
However, site engineers and the OH were skeptical about the impact that IGV control mighthave on the underground environment, despite the simulation results revealing that aventilation flow reduction of 80% and more may have negative effects on the undergroundventilation network.
Therefore, phase one proposed to operate two main fans at 95% throughout the day - anotherone at 90% throughout the day together with cutting back one of the other fans to 90% duringEskom’s evening peak period.
Phase one will result in a total mass flow reduction of approximately 7 kg/s with a total massflow extraction of 820 kg/s at an operating pressure of 6.71 kPa.
The expected daily energy savings, daily cost savings and annual cost savings resulting fromthe implementation of phase one can be seen in Table 3.15.
Phase one was implemented on the 11th of August 2020.
3.8.2 Phase 2
Phase two proposes an evening peak clip of all three fans in addition to phase one, to cutback to an 85% IGV angle. Phase two entails running all three fans at an IGV angle of 90%throughout the day and additionally reducing the IGV angle during Eskom’s evening peakperiod (18h00 to 20h00 in summer, 17h00 to 19h00 in winter).
Eskom’s evening peak period aligns with the mining schedule during which centralisedblasting occurs (17h00 to 20h00). Thus, mining personnel are required to evacuate theworking areas for blasting, leading to a reduction in ventilation demand.
Consequently, phase two reduces the energy intensity during Eskom’s evening peak periodand additionally reduces the ventilation supply during which a decrease in ventilation demandis expected.
Phase two will result in a total mass flow reduction of approximately 18 kg/s throughout theday. In addition to this, the mass flow will be reduced by another 18 kg/s during Eskom’sevening peak period for two hours. The main fans will be operating at a pressure ofapproximately 6.68 kPa.
Page 72
3. RESULTS
The expected daily energy savings, daily cost savings and annual cost savings resulting fromthe implementation of phase two can be seen in Table 3.15.
Phase two was implemented on the 29th of August 2020.
3.8.3 Phase 3
Phase three proposes cutting back during morning shift change, in addition to phase two,(typically between 04h00 to 06h00) when a decrease in ventilation is anticipated. Todetermine the best period during which a decrease in the ventilation demand can be expected,missing persons locator (MPL) data was consulted.
MPL data keeps track of mine personnel to ensure the safe return of each miner. This datacan be analysed to determine the time mine personnel enter and leave each mining section. Inother words, it can be used to accurately determine which periods of time minimum ventilationis required. Supplying ventilation on demand. Figure 3.22 depicts the movements of miningpersonnel at the station areas. The BMR front and back are the main shaft man cages. Thedata in Figure 3.22 represents the periods when mine personnel enter or leave the mine via themain shaft man cages. Additional MPL data analysis is provided and discussed in AppendixF.
Figure 3.22: Activity level at mine A station area
In Figure 3.22, a lot of activity can be seen between 03h30 and 06h00 in the morning.Typically, from 02h00 to 04h00 the night shift, will make their way back to the main station.They typically arrive at the station anytime from 02h30 to 04h00. This means that, between03h00 and 05h00, minimum mine personnel are inside against the face walls, which providesthe perfect opportunity to decrease the ventilation supply.
Page 73
3. RESULTS
The first of the morning shift to arrive is on 101L, at around 04h00. From there they will maketheir way into the mine to their working areas, which typically takes them no more than anhour.
Based on the MPL data analysis, it is proposed that the IGV angles be further reduced duringmorning shift change from 03h00 to 05h00.
Phase three will result in an additional mass flow reduction of 18 kg/s during morning shiftchange between 03h00 and 05h00.
The expected daily energy savings, daily cost savings and annual cost savings resulting fromthe implementation of phase three can be seen in Table 3.15.
Phase three was implemented on the 22nd of September 2020.
3.8.4 Phase 4
Phase four proposes to cut back all three IGV angle to 85% throughout the day. However, thiswill be done in increments by cutting back one fan to 85% throughout the day, with the othertwo fans controlling according to phase three. After running this configuration for a day ortwo, the control can be updated to cut back another main fan’s IGVs to 85% throughout theday. This will ensure that ventilation requirements are maintained and furthermore providingtime for the ventilation network to respond on the reduction in mass flow.
The ventilation simulation results revealed that a mass flow reduction of more than 80% willhave a negative impact on the underground ventilation and temperatures. Therefore, theimplementation of phase four can be done with confidence. However, the monitoring ofunderground ventilation and temperatures are needed to confirm the actual impact.
Phase four will result in a total mass flow reduction of approximately 43 kg/s. The reductionwill be distributed among the main intake levels leading to an approximate reduction of 5 to10 kg/s per level. Main fans will operate at a pressure of 6.24 kPa.
The expected daily energy savings, daily cost savings and annual cost savings resulting fromthe implementation of phase four can be seen in Table 3.15.
Unfortunately, mine A was experiencing high underground temperatures at the point at whichphase four was to be implemented, so the mine engineers and the OH decided to hold off onthe implementation of phase four of IGV control.
3.8.5 Summary
The proposed IGV control phases discussed in the above subsection can be seen in Figure3.23. The expected energy savings and cost savings, calculated with Eskom’s 20/21 Megaflextariff structure, are shown in Table 3.15.
Page 74
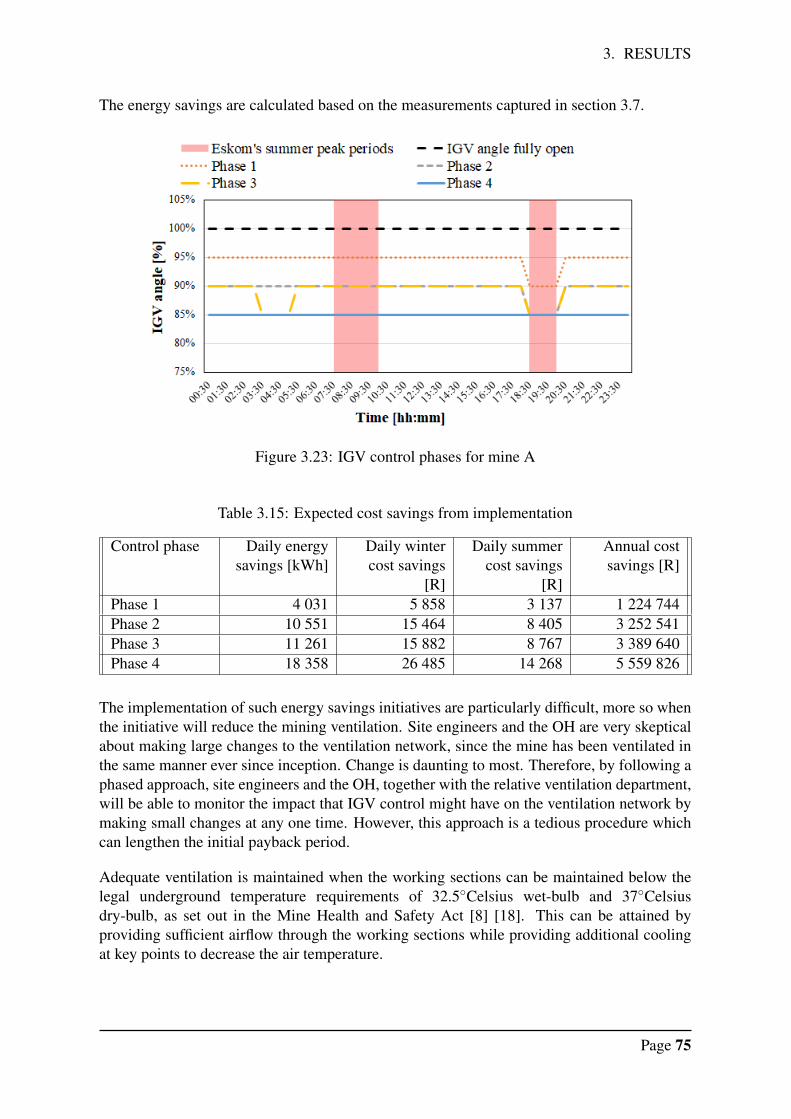
3. RESULTS
The energy savings are calculated based on the measurements captured in section 3.7.
Figure 3.23: IGV control phases for mine A
Table 3.15: Expected cost savings from implementation
Control phase Daily energysavings [kWh]
Daily wintercost savings
[R]
Daily summercost savings
[R]
Annual costsavings [R]
Phase 1 4 031 5 858 3 137 1 224 744Phase 2 10 551 15 464 8 405 3 252 541Phase 3 11 261 15 882 8 767 3 389 640Phase 4 18 358 26 485 14 268 5 559 826
The implementation of such energy savings initiatives are particularly difficult, more so whenthe initiative will reduce the mining ventilation. Site engineers and the OH are very skepticalabout making large changes to the ventilation network, since the mine has been ventilated inthe same manner ever since inception. Change is daunting to most. Therefore, by following aphased approach, site engineers and the OH, together with the relative ventilation department,will be able to monitor the impact that IGV control might have on the ventilation network bymaking small changes at any one time. However, this approach is a tedious procedure whichcan lengthen the initial payback period.
Adequate ventilation is maintained when the working sections can be maintained below thelegal underground temperature requirements of 32.5◦Celsius wet-bulb and 37◦Celsiusdry-bulb, as set out in the Mine Health and Safety Act [8] [18]. This can be attained byproviding sufficient airflow through the working sections while providing additional coolingat key points to decrease the air temperature.
Page 75
3. RESULTS
3.9 IMPLEMENTATION
Each control phase was presented to the site engineer and OH for approval beforeimplementation. The implementation of each phase (step 9 in Figure 2.2) was carefullymonitored by using underground ventilation sensors and engaging in regular discussionswith the ventilation department and OH. This ensured that mining ventilation is maintainedthroughout the implementation of each IGV control phase and to ensure that adequateventilation is provided to underground working stations as set out in step 9.1 in Figure 2.2.
3.9.1 Reduction in power
The daily energy savings that were expected for the implementation of each IGV control phaseis shown in Table 3.15, in comparison with the actual savings that were achieved through theimplementation of each IGV control phase in Table 3.16.
Table 3.16 show that the actual results reveal a higher daily energy savings. This can beattributed to the fact that the ventilation system had more time to stabilise compared to thetesting procedure which took ventilation and power measurements 15 minutes after adjustingthe IGVs.
Furthermore, the impact each individual fan has on the other operating fans are complex. Thiscan be seen in Figure 3.15, where the mass flow measurements each fan delivered is shown,fan one and two delivered approximately 16 kg/s more than main fan three at an IGV angle of90%. By reducing the operating pressure of the main fan system, the total energy consumptioncan be decreased.
Table 3.16: Actual results obtained from the implementation of IGV control on mine A
Control phase Daily energysavings [kWh]
Daily averagecost saving [R]
Total cost savingsachieved [R]
Phase 1 6 495 10 563 147 884Phase 2 13 958 13 040 195 595Phase 3 16 026 14 624 424 095
The average daily power consumption of the main fans for each IGV control phase is shownin Figure 3.24.
Page 76
3. RESULTS
Figure 3.24: Power consumption implementation results for mine A
By implementing each IGV control phase in the above-mentioned time, the total cost savingsachieved to date (3 November 2020) for mine A was R 767 574. The expected implementationof phase four of the IGV control was scheduled for the 30th of November 2020. Therefore,the total savings achieved for one year would equate to R 4.6 million.
3.9.2 Condition monitoring
Throughout each IGV control phase, the installed condition monitoring capabilities were usedto ensure main fan performance as seen in step 10 in Figure 2.2 and furthermore to activelymonitor the ventilation underground.
Main fan performance was maintained by ensuring that fan and motor vibrations, bearingtemperatures and winding temperatures remain within safe operating parameters.Furthermore, fan and motor vibrations were monitored to ensure there was no significantincrease over the duration of the implementation. This was done by comparing the averagevibration measurements for each IGV control phase and to ensure that vibrations had notincreased with the implementation of the next control phase.
Mining ventilation was maintained through reporting to the OH and site engineers on a dailybasis on any temperature or air velocity flow changes. The summer baseline results shown inTable 3.7 were used to compare the daily measurements.
Page 77
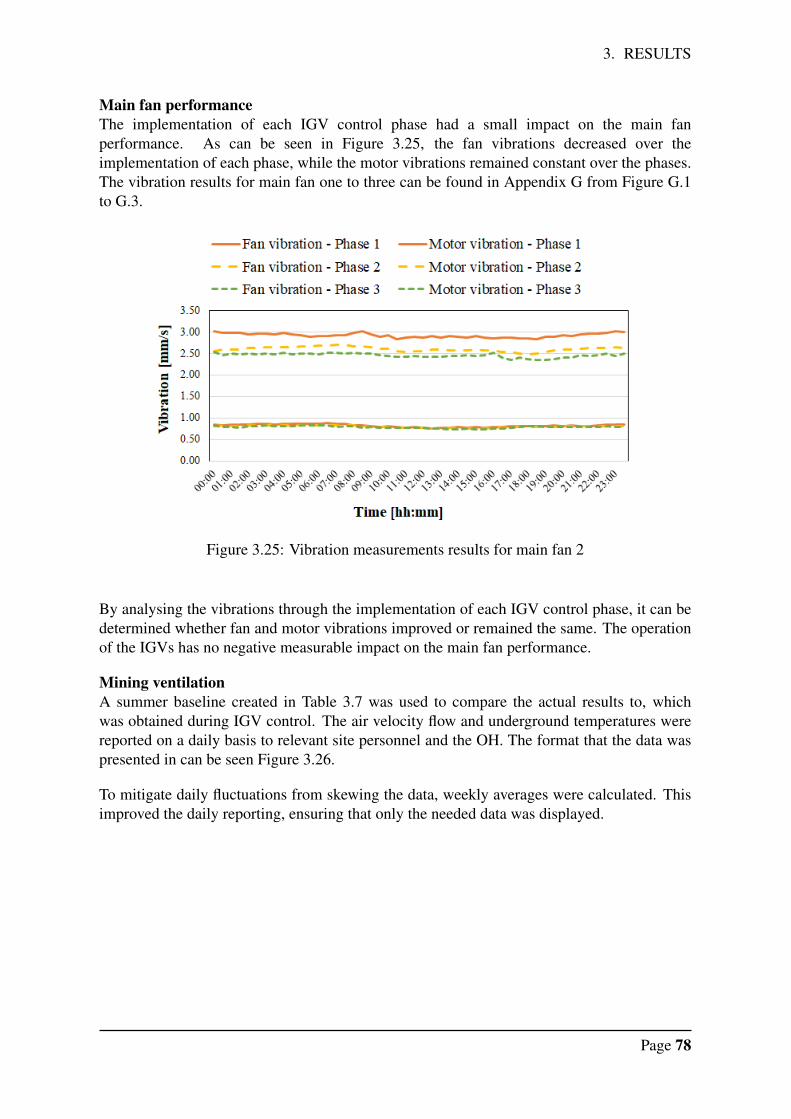
3. RESULTS
Main fan performanceThe implementation of each IGV control phase had a small impact on the main fanperformance. As can be seen in Figure 3.25, the fan vibrations decreased over theimplementation of each phase, while the motor vibrations remained constant over the phases.The vibration results for main fan one to three can be found in Appendix G from Figure G.1to G.3.
Figure 3.25: Vibration measurements results for main fan 2
By analysing the vibrations through the implementation of each IGV control phase, it can bedetermined whether fan and motor vibrations improved or remained the same. The operationof the IGVs has no negative measurable impact on the main fan performance.
Mining ventilationA summer baseline created in Table 3.7 was used to compare the actual results to, whichwas obtained during IGV control. The air velocity flow and underground temperatures werereported on a daily basis to relevant site personnel and the OH. The format that the data waspresented in can be seen Figure 3.26.
To mitigate daily fluctuations from skewing the data, weekly averages were calculated. Thisimproved the daily reporting, ensuring that only the needed data was displayed.
Page 78
3. RESULTS
Figure 3.26: Reporting format used to report on mining ventilation
From the measurements obtained throughout the implementation of each IGV control phase,the underground air velocity flow and temperatures were monitored. The level intakes to levels85 and 95 are shown in Figure 3.27 and 3.28.
Figure 3.27 indicates that the underground temperatures and flow remained fairly constantthroughout the implementation of each IGV control phase. The intake temperature doesfluctuate a small amount, this is however influenced by the ambient conditions on surface.
Figure 3.27: Ventilation results for 85L intake
Page 79
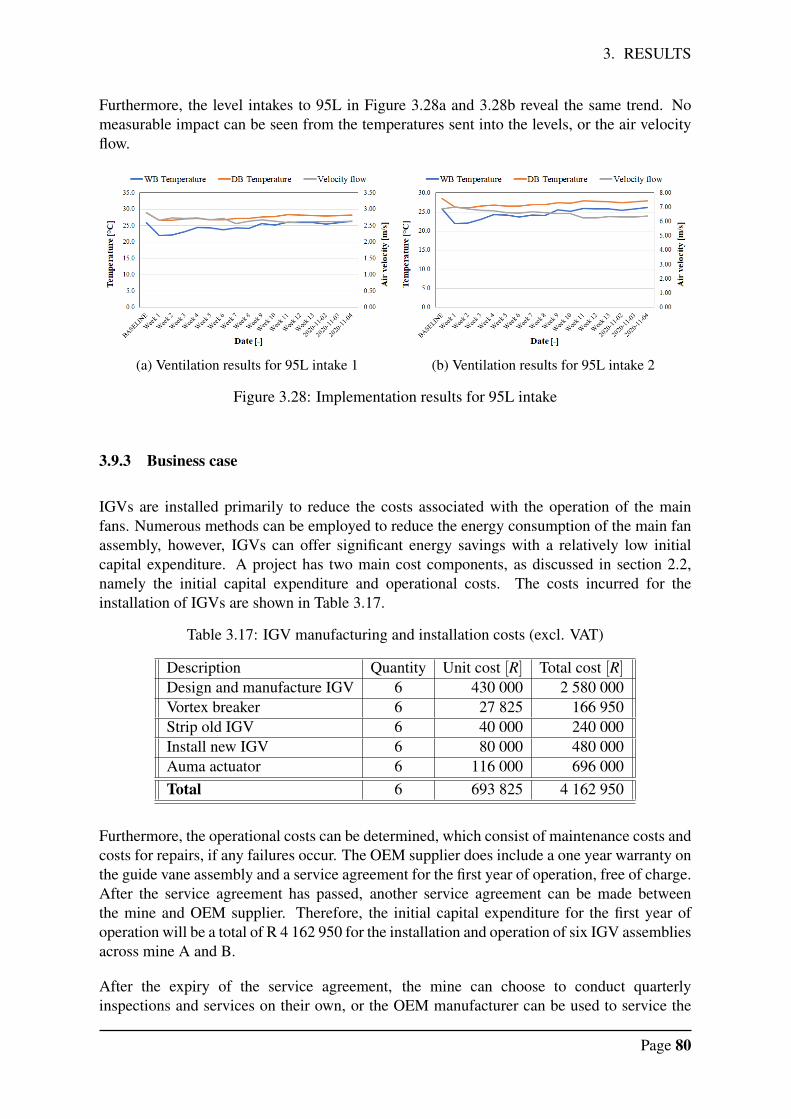
3. RESULTS
Furthermore, the level intakes to 95L in Figure 3.28a and 3.28b reveal the same trend. Nomeasurable impact can be seen from the temperatures sent into the levels, or the air velocityflow.
(a) Ventilation results for 95L intake 1 (b) Ventilation results for 95L intake 2
Figure 3.28: Implementation results for 95L intake
3.9.3 Business case
IGVs are installed primarily to reduce the costs associated with the operation of the mainfans. Numerous methods can be employed to reduce the energy consumption of the main fanassembly, however, IGVs can offer significant energy savings with a relatively low initialcapital expenditure. A project has two main cost components, as discussed in section 2.2,namely the initial capital expenditure and operational costs. The costs incurred for theinstallation of IGVs are shown in Table 3.17.
Table 3.17: IGV manufacturing and installation costs (excl. VAT)
Description Quantity Unit cost [R] Total cost [R]Design and manufacture IGV 6 430 000 2 580 000Vortex breaker 6 27 825 166 950Strip old IGV 6 40 000 240 000Install new IGV 6 80 000 480 000Auma actuator 6 116 000 696 000Total 6 693 825 4 162 950
Furthermore, the operational costs can be determined, which consist of maintenance costs andcosts for repairs, if any failures occur. The OEM supplier does include a one year warranty onthe guide vane assembly and a service agreement for the first year of operation, free of charge.After the service agreement has passed, another service agreement can be made betweenthe mine and OEM supplier. Therefore, the initial capital expenditure for the first year ofoperation will be a total of R 4 162 950 for the installation and operation of six IGV assembliesacross mine A and B.
After the expiry of the service agreement, the mine can choose to conduct quarterlyinspections and services on their own, or the OEM manufacturer can be used to service the
Page 80
3. RESULTS
IGVs on a regular basis. At the time of writing, a full year’s service would equate to R 58400 per year per fan, which includes four inspections and services for the year, excluding anyadditional replacements which are to be made.
With the information available above, the payback period can be calculated for mine A. Theinitial capital expenditure (incl. VAT) is calculated as R 2.39 million. The savings that wereachieved to date (at time of writing) is R 0.767 million, plus the expected savings that wouldbe realised through the implementation of phase 4 which equates to R 3.9 million for a totalof 180 days. Therefore, the expected costs savings is R 4.676 million per annum.
By making use of the equation set out in section 2.2, the payback period can be calculatedas six months and one week. This provides sufficient evidence that through IGV control,significant energy cost savings are feasible.
3.9.4 Maintenance
The first year’s maintenance is included in the original OEM agreement. The maintenancerequirements to maintain and sustain the operation of the IGVs is straight forward.
The central hub encases all the moving components, which are sealed from the corrosiveenvironment and packed with heavy duty grease. This sealed unit needs to be inspected on aregular basis for fouling, corrosion, or any form of failure on a biannual basis.
Thanks to the new design, shear pins have been added to prevent critical failures. This ensuresthat the shear pin breaks before any other failures occur, which will keep the blade fixed in itsposition, preventing the blade from falling out of the assembly and being sucked through themain fan impeller.
During the first quarterly inspections at mine B, it was found that two of the blades’ shearpins on main fan two had failed. This led to the guide vanes being free to move about fivedegrees. The shear pin failure can be seen in Figure 3.29. Shear pins often fail due to incorrectoperation and excessive corrosion. The actuator arm was pushed too far past its limit, placingenough force on the shear pin to break it.
Page 81
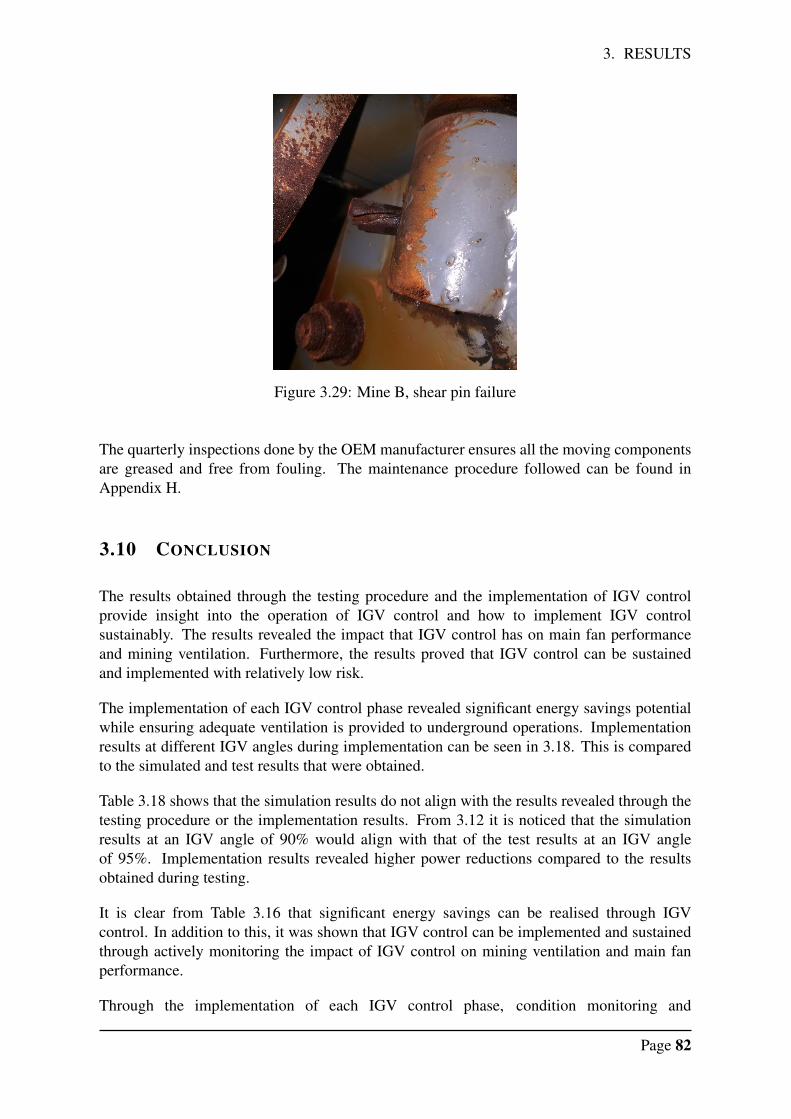
3. RESULTS
Figure 3.29: Mine B, shear pin failure
The quarterly inspections done by the OEM manufacturer ensures all the moving componentsare greased and free from fouling. The maintenance procedure followed can be found inAppendix H.
3.10 CONCLUSION
The results obtained through the testing procedure and the implementation of IGV controlprovide insight into the operation of IGV control and how to implement IGV controlsustainably. The results revealed the impact that IGV control has on main fan performanceand mining ventilation. Furthermore, the results proved that IGV control can be sustainedand implemented with relatively low risk.
The implementation of each IGV control phase revealed significant energy savings potentialwhile ensuring adequate ventilation is provided to underground operations. Implementationresults at different IGV angles during implementation can be seen in 3.18. This is comparedto the simulated and test results that were obtained.
Table 3.18 shows that the simulation results do not align with the results revealed through thetesting procedure or the implementation results. From 3.12 it is noticed that the simulationresults at an IGV angle of 90% would align with that of the test results at an IGV angleof 95%. Implementation results revealed higher power reductions compared to the resultsobtained during testing.
It is clear from Table 3.16 that significant energy savings can be realised through IGVcontrol. In addition to this, it was shown that IGV control can be implemented and sustainedthrough actively monitoring the impact of IGV control on mining ventilation and main fanperformance.
Through the implementation of each IGV control phase, condition monitoring and
Page 82
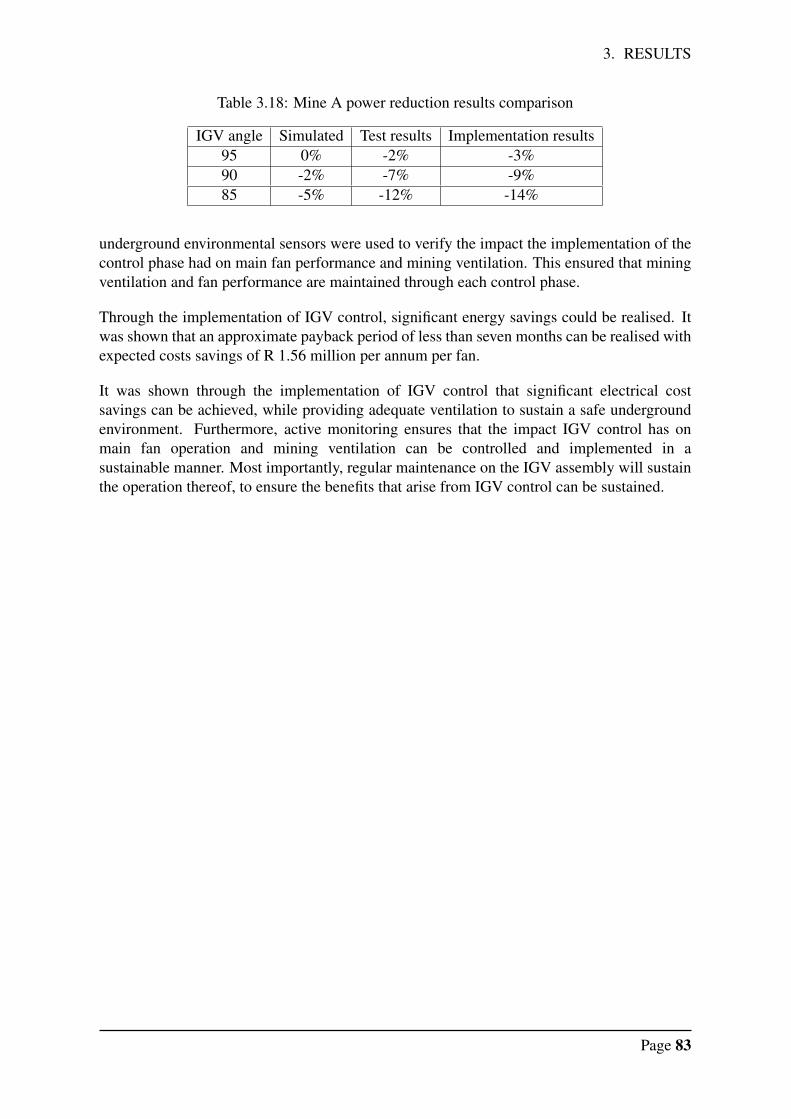
3. RESULTS
Table 3.18: Mine A power reduction results comparison
IGV angle Simulated Test results Implementation results95 0% -2% -3%90 -2% -7% -9%85 -5% -12% -14%
underground environmental sensors were used to verify the impact the implementation of thecontrol phase had on main fan performance and mining ventilation. This ensured that miningventilation and fan performance are maintained through each control phase.
Through the implementation of IGV control, significant energy savings could be realised. Itwas shown that an approximate payback period of less than seven months can be realised withexpected costs savings of R 1.56 million per annum per fan.
It was shown through the implementation of IGV control that significant electrical costsavings can be achieved, while providing adequate ventilation to sustain a safe undergroundenvironment. Furthermore, active monitoring ensures that the impact IGV control has onmain fan operation and mining ventilation can be controlled and implemented in asustainable manner. Most importantly, regular maintenance on the IGV assembly will sustainthe operation thereof, to ensure the benefits that arise from IGV control can be sustained.
Page 83
4. CONCLUSION
4 CONCLUSION
4.1 SUMMARY
Deep level mining in South Africa is an energy intensive operation, which consumesconsiderable amounts of energy. Due to the rising costs of electricity, energy savinginitiatives must be implemented to reduce the energy consumption and evidently theelectrical costs incurred. Ventilating a deep-level gold mine is found to be the second largestenergy consumer among the energy drivers on a deep-level gold mine.
In an effort to reduce the energy consumption associated with mining ventilation, inlet guidevanes can be installed on the main ventilation fans. IGVs guides the incoming air stream intothe fan impeller, which reduced the fan’s delivery pressure and flow and results in a reductionin power consumption. Implementation of IGVs can generate significant energy savings whilehaving minimal impact on mining ventilation. Therefore, the study objectives identified were:
• To generate a generic solution strategy for the implementation of IGV control on miningmain fans.
• To quantify the impact of IGV control on main fan performance.
• To sustain IGV control by actively monitoring main fan performance and miningventilation, thereby sustaining energy savings that arise from IGV control.
The author proposed a generic solution strategy which was implemented on mine A and B.Through the results obtained from the case study, the study objectives were met:
• A generic solution strategy was developed that provided project engineers and siteengineers with a step-by-step guide for the implementation of IGV control on miningmain fans.
• A testing procedure was proposed to ensure main fan performance and miningventilation is sustained.
• Implementing IGV control in phases was recommended to ensure that KPIs couldeasily be monitored and maintained, thereby ensuring main fan performance andmining ventilation is maintained, ultimately leading to sustainable energy savings.
The generic solution incorporated the lesser known impact of IGV control on main fanperformance (specifically fan and motor vibrations) and the impact on fan volumes andoperating pressure. The impact was monitored through condition monitoring sensors andunderground environmental sensors that monitor ventilation flow and temperature. Real-timedata monitoring ensured the monitoring of KPIs, which led to the sustainable operation ofIGV control.
Upon the implementation of IGV control at mine A and B, the following condensed steps areimportant to realise sustainable energy savings;
Page 84
4. CONCLUSION
1. Conduct a full feasibility study to determine whether a reduction in ventilation flow ispossible for the mining network.
2. Conduct an impact study to determine the expected impact IGV control might have onfan performance and mining ventilation. This is typically done through computer-aidedsimulations and the proposed testing procedure to determine the impact of IGV controlon the mining network and main fan performance.
3. Implementation of IGV control by following a phased approach will create sufficienttime to monitor and maintain KPIs. KPIs are monitored and maintained throughreal-time condition monitoring capabilities, for both main fan performance and miningventilation.
Consequently, by following the steps set out above, sustainable energy savings are possiblethrough the implementation of IGV control on mining main fans.
The testing of the IGVs across mine A and B revealed that main fan performance (fan andmotor vibration) could be maintained at IGV angles above 70%. Furthermore, the averagereduction in ventilation flow at an IGV angle of 80% was approximately 11.5%, with anaverage power reduction of 13.5%. Therefore, small flow adjustments of IGVs can yield highefficiency.
Furthermore, the implementation results revealed a slight decrease in ventilation flow ofapproximately 1% at an IGV angle of 90%, while revealing energy savings of approximately7%. This provides sufficient evidence to support the fact that IGVs improve main fanperformance and efficiency. Therefore, IGV control can be implemented on mines where asignificant reduction in mining ventilation flow is not feasible. Energy efficiency is thuspossible by operating the main fans at an IGV angle of 90%, resulting in a slight decrease involume extraction while providing an energy savings of approximately of 7%.
A capital expenditure of approximately R 797 899 (incl. VAT) is anticipated for theinstallation of a set of IGVs on a mining main fan. If energy savings of as little as 7% can beanticipated, annual savings would equate to approximately R 1 million per annum based onan installed fan motor rating of 2 MW. This provides an impressive payback period of lessthan ten months.
The proposed solution aimed to realise sustainable energy savings through the implementationof IGV control. The results obtained show that IGV control can easily be implemented ina sustainable manner to realise energy savings while ensuring that adequate ventilation issupplied to underground operations. The proposed solution aims to provide mine personnelwith a strategy for the implementation of IGV control. The case study results proved thatthe developed solution can easily be implemented to implement and sustain IGV control onmining main fans.
Page 85
4. CONCLUSION
4.2 RECOMMENDATIONS
The first obstacle that was encountered is the perception of mine personnel had of IGV controland the use thereof. Unfortunately, due to numerous IGV failures that occurred during the firstIGV design, the mine personnel developed a fear for IGV control. Therefore, hesitation andnumerous delays were observed among the mine personnel towards the implementation ofIGV control. Hence IGV control was implemented in phases to fully realise the impact thatIGV control has on the mining network and thereby to ensure that mine personnel are on boardwith the proceedings.
It is proposed that future studies should conduct a more in-depth study into IGV design.There seems to be little to no research on the design of IGVs for large applications. Thesestudies would improve the efficiency and operation of IGVs, leading to an increase in mainfan performance and efficiency. However, most importantly, these study results can be usedto motivate the reliability of an IGV assembly, providing the means to motivate and convincemine personnel on the benefits of IGV control on their mining main fans.
It became apparent during the testing phase that main fan velocity flow measurements aredifficult and time consuming to measure. Therefore, when possible, project engineers shouldconvince mine personnel to install main fan velocity sensors, along with pressure transducersto enable additional monitoring capabilities, especially during IGV control, since a pressureand mass flow change is imminent. This will enable mine personnel and the OH to activelymonitor the volume extraction along with the operating pressure.
The impact of IGV control on fan vibrations is complex due to complex flow phenomena andthe large rotating mass. Further studies which analyse excessive vibrations due to IGV controlcan better the knowledge we have on vibrations originating from the use of IGVs.
Therefore, in summary, further studies can be conducted to improve the knowledge we haveon large application IGVs by:
• IGV design analysis for large applications.
• Improved monitoring capabilities during IGV control, to readily measure air velocityflow and operating pressure.
• Vibration analysis on vibrations originating from the use of IGVs on large industrialfans.
Page 86
REFERENCES
REFERENCES
[1] United States geological survey, “South Africa gold production,” 2020. [Online].Available: https://www.ceicdata.com/en/indicator/south-africa/gold-production
[2] DOE and AMCA, Improving fan system performance. Washington D.C.: ResourceDynamics Corporation, April 2003.
[3] B. F. Company, Centrifugal fans. Buffalo N.Y.: Wm. J. Keller, 1970, vol. 7, booksection 6, pp. 213–215.
[4] StatsSA, “Mining: Production and sales,” p. 14, September 2019.
[5] P. Neingo and T. Tholana, “Trends in productivity in the south african gold miningindustry,” Journal of the Southern African Institute of Mining and Metallurgy, vol. 116,pp. 283 – 290, 03 2016.
[6] Eskom Holdings Limited, “Historical average prices and increase,” April 2019.
[7] R. B. I. Pretorius, S.J. Piketh, “The impact of the South African energy crisis onemissions,” WIT Transaction on Ecology and The Environment, vol. 198, p. 10, 2015.
[8] S. Hancock, “Improving the operational efficiency of deep-level mine ventilationsystems,” Masters dissertation, North-West University, South Africa, November 2018.
[9] A. J. Schutte, “An integrated energy efficiency strategy for deep mine ventilation andrefrigeration,” Masters dissertation, North-West University, South Africa, May 2014.
[10] W. C. Kukard, “Research on reducing costs of underground ventilation networks inSouth African mines,” Masters dissertation, North-West University, South Africa, 2006.
[11] M. Van Heerden, “Improving DSM project implementation and sustainability throughISO standards,” Masters dissertation, North-West University, South Africa, 2014.
[12] N. C. J. M. De Kock, “Researching the long-term impact of load management projectson South African mines,” Masters dissertation, North-West University, South Africa,2006.
[13] M. Van Eldik, “An investigation into the DSM and energy efficiency potential of amodular underground air cooling unit applied in the South African mining industry,”PhD thesis, North-West University, South Africa, November 2009.
[14] Eskom Holdings Limited, “Towards an energy efficient mining sector,” p. 7, 2010.
[15] M. J. McPherson, Subsurface ventilation engineering. Virginia USA: Springer sciencebusiness media, 2012, vol. 1, book section 10 - Fans.
[16] K. Wallace, B. Prosser, and J. D. Stinnette, “The practice of mine ventilationengineering,” Mine Ventilation Services, vol. 12, no. 2, 2014.
[17] E. Rusinski, J. Czmochowski, P. Moczko, and D. Pietrusiak, “Monitoring and testing ofhigh power industrial fans vibration,” Procedia Engineering, vol. 199, pp. 2190–2195,2017.
Page 87
REFERENCES
[18] A. Nel, “Mine ventilation characterisation through simulations,” PhD thesis, North-WestUniversity, South Africa, October 2018.
[19] R. Kotze and J. Visser, “An analysis of maintenance performance systems in the SouthAfrican mining industry,” South African Journal of Industrial Engineering, vol. 23, pp.13–29, 2012.
[20] T. Kebabsa, N. Ouelaa, and A. Djebala, “Experimental vibratory analysis of a fanmotor in industrial environment,” International Journal of Advanced ManufacturingTechnology, vol. 98, no. 9-12, pp. 2439–2447, 2018.
[21] J. T. Renwick and P. E. Babson, “Vibration analysis—a proven technique as a predictivemaintenance tool,” IEEE Transactions on Industry Applications, vol. IA-21, no. 2, pp.324–332, 1985.
[22] X. Nie, X. Wei, X. Li, and C. Lu, “Heat treatment and ventilation optimization in a deepmine,” Advances in Civil Engineering, vol. 2018, pp. 1–12, 2018.
[23] L. Mackay, S. Bluhm, and J. Van Rensburg, “Refrigeration and cooling concepts forultra-deep platinum mining,” in The 4th International Platinum Conference, Platinumin transition Boom or Bust, The Southern African Institute of Mining and Metallurgy,2010, p. 35.
[24] AirEng, “Aireng industrial fans and blowers,” 2020. [Online]. Available:https://www.aireng.com.au/
[25] M. Hall, “5 key innovations in mining ventilation,” April 2020. [Online]. Available:https://www.mining-technology.com/features/five-innovations-mining-ventilation/
[26] F. Wei, Z. Fangping, and L. Huiqing, “The use of 3d simulation system in mineventilation management,” Procedia Engineering, vol. 26, pp. 1370–1379, 2011.
[27] J. Cheng, Y. Wu, H. Xu, J. Liu, Y. Yang, H. Deng, and Y. Wang, “Comprehensiveand integrated mine ventilation consultation model,” Tunnelling and Underground SpaceTechnology incorporating Trenchless Technology Research, vol. 45, pp. 166–180, 2015.
[28] A. J. Nel, J. C. Vosloo, and M. J. Mathews, “Evaluating complex mine ventilationoperational changes through simulations,” Journal of Energy in Southern Africa, vol. 29,no. 3, pp. 22–32, Sep. 2018.
[29] N. J. Smit, “Reducing electrical costs for a mine ventilation system with the aidof simulation software.” Masters dissertation, North-West University, South Africa,October 2017.
[30] Q. Wang, D. Shang, Z. Yang, and C. Zhu, “Design of coal mine main fan performanceoptimisation,” in Second Asia-Pacific Conference on Computational Intelligence andIndustrial Applications. Hebei University of Engineering, 2009, ConferenceProceedings, pp. 1–3.
[31] E. De Souza, “Improving the energy efficiency of mine fan assemblages,” AppliedThermal Engineering, vol. 90, pp. 1092–1097, 2015.
Page 88
REFERENCES
[32] C. Pritchard, “Methods to improve efficiency of mine ventilation systems,” Nationalinstitute for occupational safety and health, pp. 1–5, 2010.
[33] A. Kamyar, S. M. Aminossadati, C. Leonardi, and A. Sasmito, “Current developmentsand challenges of underground mine ventilation and cooling methods,” Miningengineering, 2016.
[34] C. J. P. Venter, “The effect of controlling main ventilation fan inlet guide vanes for adeep level platinum mine to reduce electrical costs,” Masters dissertation, North-WestUniversity, South Africa, 2017.
[35] R. Papar, A. Szady, W. D. Huffer, V. Martin, and A. McKane, “Increasing energyefficiency of mine ventilation systems,” in Proceedings of the 8th US mine ventilationsymposium, vol. 1. University of Missouri–Rolla, 2000, Conference Proceedings, pp.1–7.
[36] E. I. Acuna and I. S. Lowndes, “A review of primary mine ventilation systemoptimization,” Interfaces, vol. 44, no. 2, pp. 163–175, 2014.
[37] A. Chatterjee, L. Zhang, and X. Xia, “Optimization of mine ventilation fan speedsaccording to ventilation on demand and time of use tariff,” Applied Energy, vol. 146,pp. 65–73, 2015.
[38] V. R. Babu, T. Maity, and S. Burman, “Optimization of energy use for mine ventilationfan with variable speed drive,” in International Conference on Intelligent Control Powerand Instrumentation (ICICPI), vol. 1. ICICPI, 2016, Conference Proceedings, pp. 1–4.
[39] M. Jena, S. Mishra, and H. Moharana, “Experimental investigation on powerconsumption of an industrial fan with different flow control methods,” EnvironmentalProgress Sustainable Energy, vol. 39, no. 1, 2019.
[40] D. Sellers, “Inlet guide vanes (IGVs) and variable speed drives (VSDs),” 2011. [Online].Available: https://av8rdas.wordpress.com/about/
[41] ABB, “Energy efficiency assesment improving fan system efficiency using variablespeed drives,” 2013. [Online]. Available: https://new.abb.com/mining/underground-mining
[42] A. P. Tibrewala, T. J. Padave, T. P. Wagh, and C. Gajare, “Flow analysis of upstream fluidflow using simulation for different positions of optimized inlet guide vane in centrifugalair compressor,” American Journal of Engineering Research, vol. 3, pp. 148–156, 2014.
[43] M. Coppinger and E. Swain, “Performance prediction of an industrial centrifugalcompressor inlet guide vane system,” Proceedings of the Institution of MechanicalEngineers, Part A: Journal of Power and Energy, vol. 214, no. 2, pp. 153–164, 2000.
[44] H. Mohtar, P. Chesse, A. Yammine, and J. F. Hetet, “Variable inlet guide vanes ina turbocharger compressor: Local and global study,” Laboratory of Fluid Mechanics,p. 13, 2008.
[45] H. Hucan, Z. Yongxue, L. Zhenlin, and Z. Yuan, “A CFD study of IGV vane number onhydraulic characteristics and pressure pulsation of an is centrifugal pump,” Journal ofVibration engineering, no. 1, p. 563, 2017.
Page 89
REFERENCES
[46] E. Rusinski, P. Moczko, P. Odyjas, and D. Pietrusiak, “Investigation of vibrations ofa main centrifugal fan used in mine ventilation,” Archives of Civil and MechanicalEngineering, vol. 14, no. 4, pp. 569–579, 2014.
[47] C. Swart, “Optimising the operation of underground mine refrigeration plants andventilation fans for minimum electricity cost. [electronic resource],” PhD Thesis,Potchefstroomse Universiteit vir Christelike Hoer Onderwys, South Africa, 2003.
[48] R. C. W. Webber, R. M. Franz, W. M. Marx, and P. C. Schutte, “A review of localand international heat stress indices, standards and limits with reference to ultra-deepmining,” The Journal of the Southern African Institutes of Mining and Metallurgy, vol.103, no. 1, pp. 313–323, 2003.
[49] N. Singh, M. Kataka, A. Milev, and E. Sellers, “Remnant mining in South African goldmines,” Deep and High Stress Mining, pp. 1–14, 2006.
[50] S. S. Henriet Stoltz, “Gcd laser utilities and services,” 2020. [Online]. Available:http://gcdlaser.co.za/
Page 90
A. APPENDIX - TECHNICAL DRAWINGS OF IGV
A APPENDIX - TECHNICAL DRAWINGS OF IGV
This section details the technical drawings of the IGVs installed at mine A and B.
The IGVs are manufactured per site specifications, since each main fan assembly is ofdifferent size and structure. The IGV design is an in-house design, manufactured solely byGCD laser utilities and services Ltd. [50]. The design is perfected through years ofexperience, while optimising the flow profile in CAD simulation software; SolidWorks.Currently, no localised standard could be found for the design and manufacturing of theIGVs.
The following technical drawings represent the design and layout of the IGV hub, vortexbreaker and vanes including their internal working parts.
Page 91
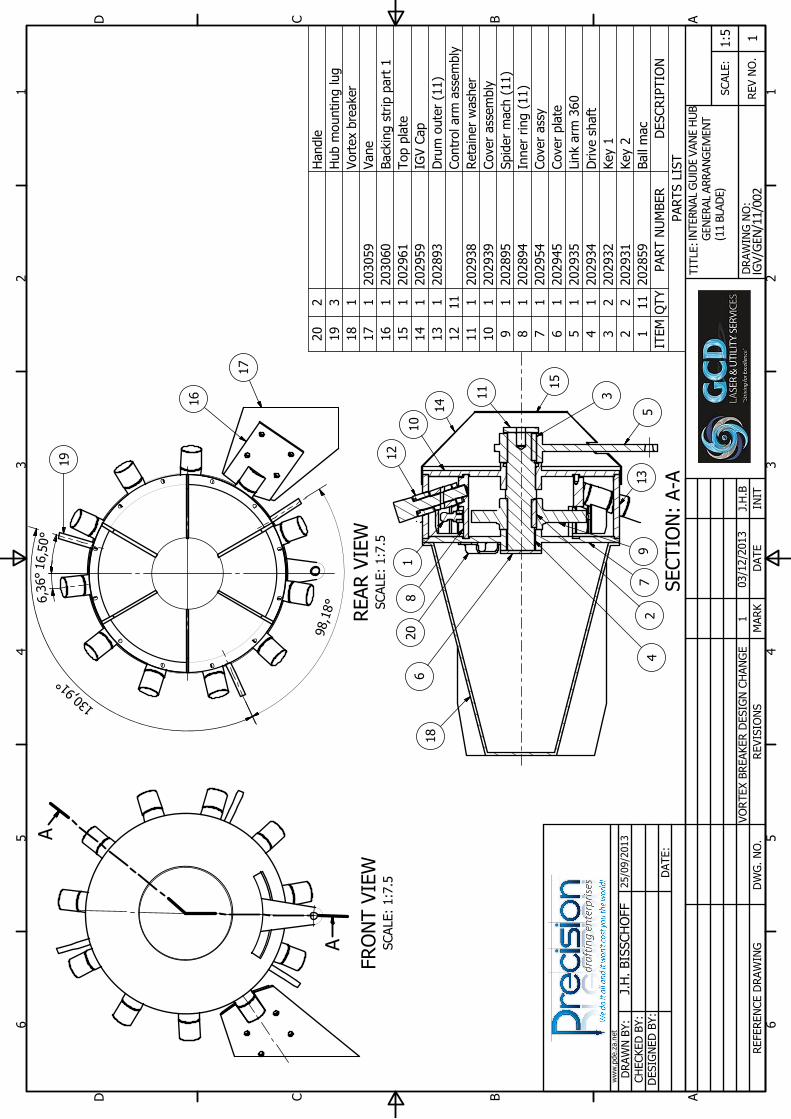
FRO
NT VIEW
SCALE: 1:7.5
SECTIO
N: A-A
REAR VIEW
SCALE: 1:7.5
A
A
Handle
2
20
Hub m
ounting lug
3
19
Vortex breaker
1
18
Vane
203059
117
Backing strip part 1
203060
116
Top plate
202961
115
IG
V Cap
202959
114
Drum
outer (11)
202893
113
Control arm
assem
bly
11
12
Retainer w
asher
202938
111
Cover assem
bly
202939
110
Spider m
ach (11)
202895
19
Inner ring (11)
202894
18
Cover assy
202954
17
Cover plate
202945
16
Link arm
360
202935
15
Drive shaft
202934
14
Key 1
202932
23
Key 2
202931
22
Ball m
ac
202859
11
1
PARTS LIST
DESCR
IPTIO
NPART N
UM
BER
QTY
ITEM
1 1
2 2
3 3
4 4
5 5
6 6
AA
BB
CC
DD
REFEREN
CE D
RAW
IN
GD
WG
. N
O.
REVISIO
NS
MAR
K
REV N
O.
IN
IT
DATE
TITLE:
DESIG
NED
BY:
CH
ECKED
BY:
DRAW
N BY:
DATE:
ww
w.pde.za.net
DR
AW
IN
G N
O:
SCALE:
J.H
. BISSCH
OFF
25/09/2013
INTE
RNAL
GUI
DE V
ANE
HUB
GENE
RAL A
RRAN
GEM
ENT
(11
BLAD
E)
IGV/
GEN/
11/0
021
1:5
14
5
11
3
6
20
13
12
2
9
4
10
8
1
15
18
19
1
6
,5
0
°
1
3
0
,
9
1
°
16
17
9
8
,
1
8
°
6,36°
7
VO
RTEX BR
EAKER D
ESIG
N CH
AN
GE
1J.H
.B
03/12/2013
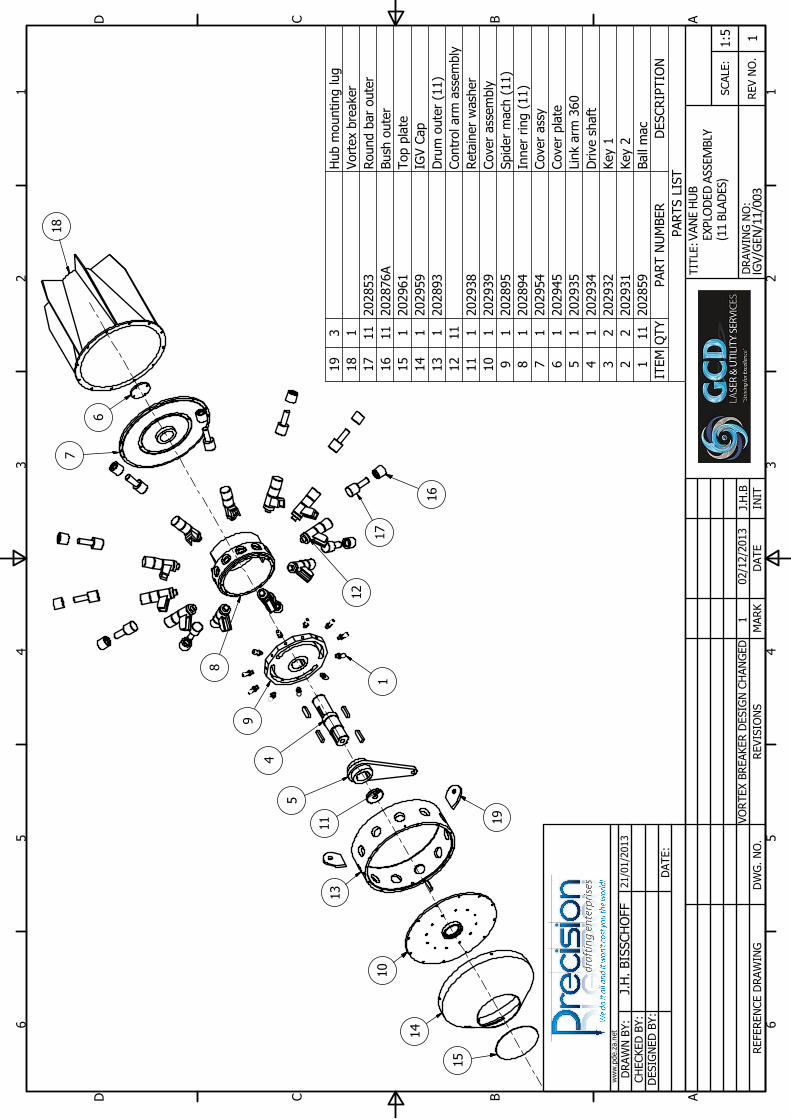
Hub m
ounting lug
3
19
Vortex breaker
1
18
Round bar outer
202853
11
17
Bush outer
202876A
11
16
Top plate
202961
115
IG
V Cap
202959
114
Drum
outer (11)
202893
113
Control arm
assem
bly
11
12
Retainer w
asher
202938
111
Cover assem
bly
202939
110
Spider m
ach (11)
202895
19
Inner ring (11)
202894
18
Cover assy
202954
17
Cover plate
202945
16
Link arm
360
202935
15
Drive shaft
202934
14
Key 1
202932
23
Key 2
202931
22
Ball m
ac
202859
11
1
PARTS LIST
DESCR
IPTIO
NPART N
UM
BER
QTY
ITEM
1 1
2 2
3 3
4 4
5 5
6 6
AA
BB
CC
DD
REFEREN
CE D
RAW
IN
GD
WG
. N
O.
REVISIO
NS
MAR
K
REV N
O.
IN
IT
DATE
TITLE:
DESIG
NED
BY:
CH
ECKED
BY:
DRAW
N BY:
DATE:
ww
w.pde.za.net
DR
AW
IN
G N
O:
SCALE:
J.H
. BISSCH
OFF
21/01/2013
VANE
HUB
EXPL
ODED
ASS
EMBL
Y(1
1 BL
ADES
)
IGV/
GEN/
11/0
031
1:5
15
14
10
11
5
4
9
8
13
7
6
16
17
18
1
12
19
VO
RTEX BR
EAKER D
ESIG
N CH
AN
GED
102/12/2013
J.H
.B
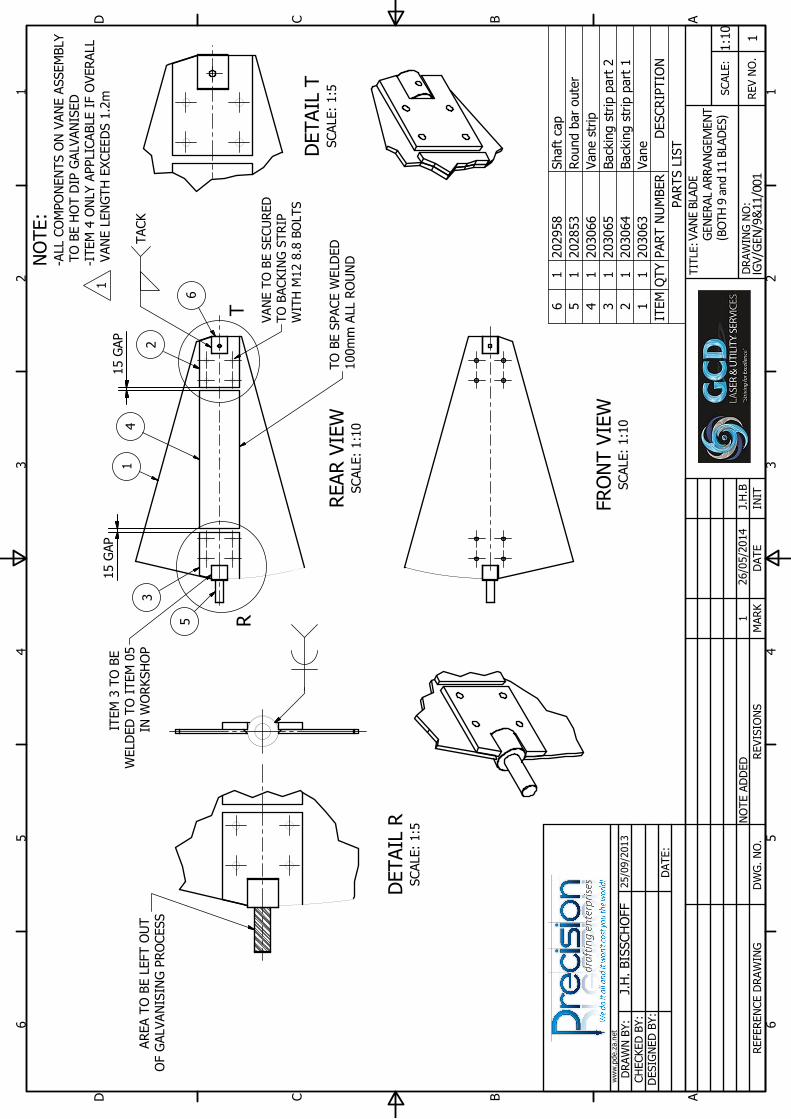
REAR VIEW
SCALE: 1:10
FRO
NT VIEW
SCALE: 1:10
DETAIL R
SCALE: 1:5
DETAIL T
SCALE: 1:5
R
T
Shaft cap
202958
16
Round bar outer
202853
15
Vane strip
203066
14
Backing strip part 2
203065
13
Backing strip part 1
203064
12
Vane
203063
11
PARTS LIST
DESCR
IPTIO
NPART N
UM
BER
QTY
ITEM
1 1
2 2
3 3
4 4
5 5
6 6
AA
BB
CC
DD
REFEREN
CE D
RAW
IN
GD
WG
. N
O.
REVISIO
NS
MAR
K
REV N
O.
IN
IT
DATE
TITLE:
DESIG
NED
BY:
CH
ECKED
BY:
DRAW
N BY:
DATE:
ww
w.pde.za.net
DR
AW
IN
G N
O:
SCALE:
J.H
. BISSCH
OFF
25/09/2013
VANE
BLA
DEGE
NERA
L ARR
ANGE
MEN
T(B
OTH
9 an
d 11
BLA
DES)
IGV/
GEN/
9&11
/001
1
1:10
TACK
VAN
E TO
BE SECU
RED
TO
BACKIN
G STRIP
WITH
M
12 8.8 BO
LTS
1
2
3
6
5
15 G
AP
15 G
AP
4
TO
BE SPACE W
ELD
ED
100m
m ALL RO
UN
D
ITEM
3 TO
BE
WELD
ED
TO
ITEM
05
IN
W
ORKSH
OP
AREA TO
BE LEFT O
UT
OF G
ALVAN
ISIN
G PRO
CESS
NO
TE:
-ALL CO
MPO
NEN
TS O
N VAN
E ASSEM
BLY
TO
BE H
OT D
IP G
ALVAN
ISED
-ITEM
4 O
NLY APPLICABLE IF O
VERALL
VAN
E LEN
GTH
EXCEED
S 1.2m
NO
TE AD
DED
126/05/2014
J.H
.B
1
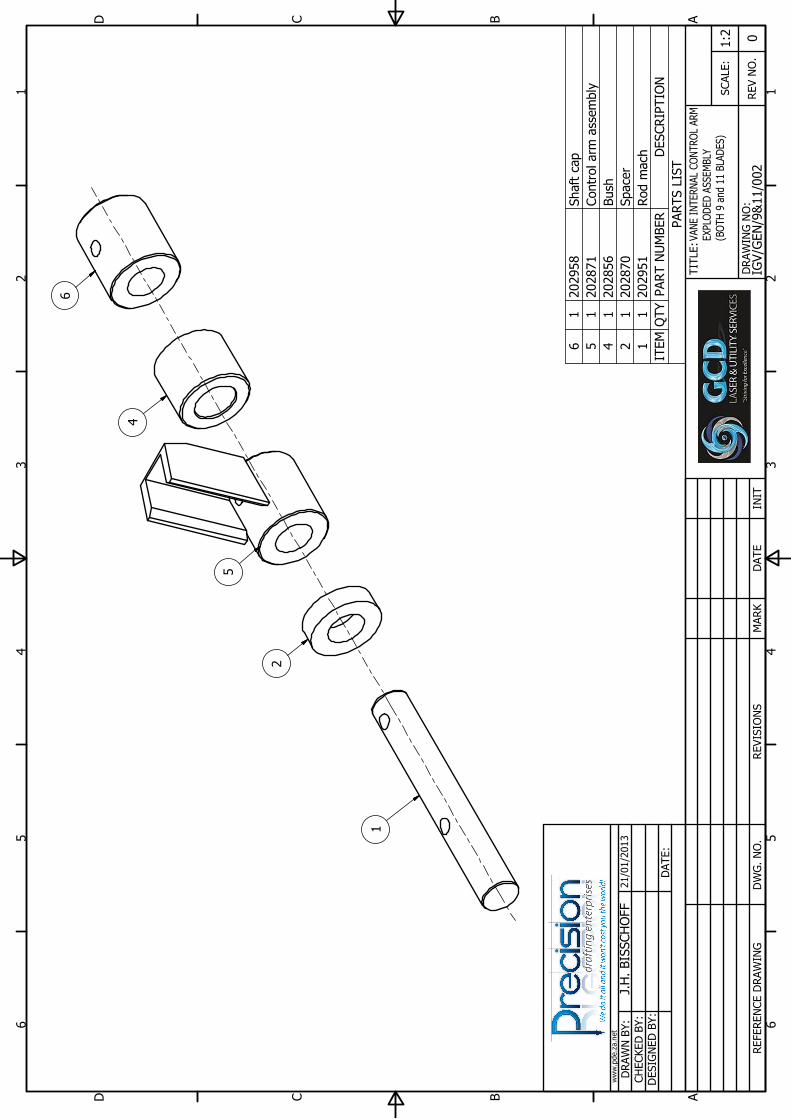
Shaft cap
202958
16
Control arm
assem
bly
202871
15
Bush
202856
14
Spacer
202870
12
Rod m
ach
202951
11
PARTS LIST
DESCRIPTIO
NPART N
UM
BER
QTY
ITEM
1 1
2 2
3 3
4 4
5 5
6 6
AA
BB
CC
DD
REFEREN
CE D
RAW
IN
GD
WG
. N
O.
REVISIO
NS
MAR
K
REV N
O.
IN
IT
DATE
TITLE:
DESIG
NED
BY:
CH
ECKED
BY:
DRAW
N BY:
DATE:
ww
w.pde.za.net
DR
AW
IN
G N
O:
SCALE:
J.H
. BISSCH
OFF
21/01/2013
VAN
E IN
TERN
AL CO
NTRO
L ARM
EXPLO
DED
ASSEM
BLY
(BO
TH
9 and 11 BLAD
ES)
IG
V/G
EN
/9&
11/002
0
1:2
1
2
5
4
6
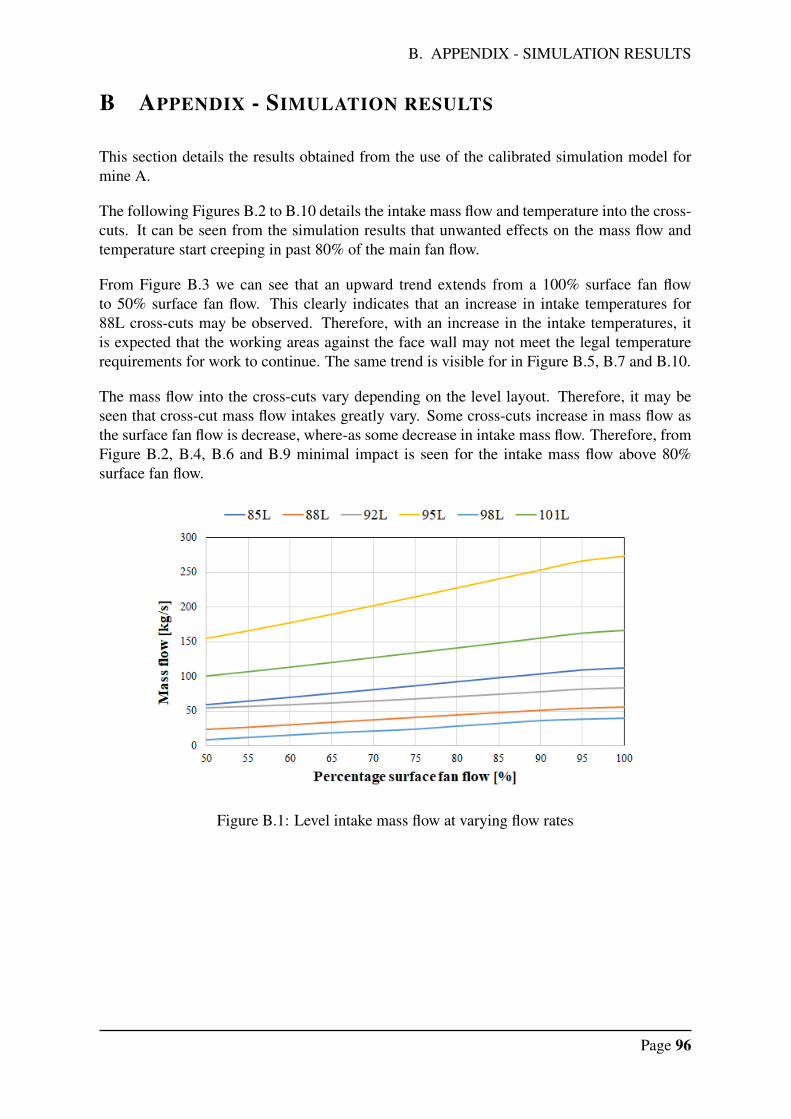
B. APPENDIX - SIMULATION RESULTS
B APPENDIX - SIMULATION RESULTS
This section details the results obtained from the use of the calibrated simulation model formine A.
The following Figures B.2 to B.10 details the intake mass flow and temperature into the cross-cuts. It can be seen from the simulation results that unwanted effects on the mass flow andtemperature start creeping in past 80% of the main fan flow.
From Figure B.3 we can see that an upward trend extends from a 100% surface fan flowto 50% surface fan flow. This clearly indicates that an increase in intake temperatures for88L cross-cuts may be observed. Therefore, with an increase in the intake temperatures, itis expected that the working areas against the face wall may not meet the legal temperaturerequirements for work to continue. The same trend is visible for in Figure B.5, B.7 and B.10.
The mass flow into the cross-cuts vary depending on the level layout. Therefore, it may beseen that cross-cut mass flow intakes greatly vary. Some cross-cuts increase in mass flow asthe surface fan flow is decrease, where-as some decrease in intake mass flow. Therefore, fromFigure B.2, B.4, B.6 and B.9 minimal impact is seen for the intake mass flow above 80%surface fan flow.
Figure B.1: Level intake mass flow at varying flow rates
Page 96
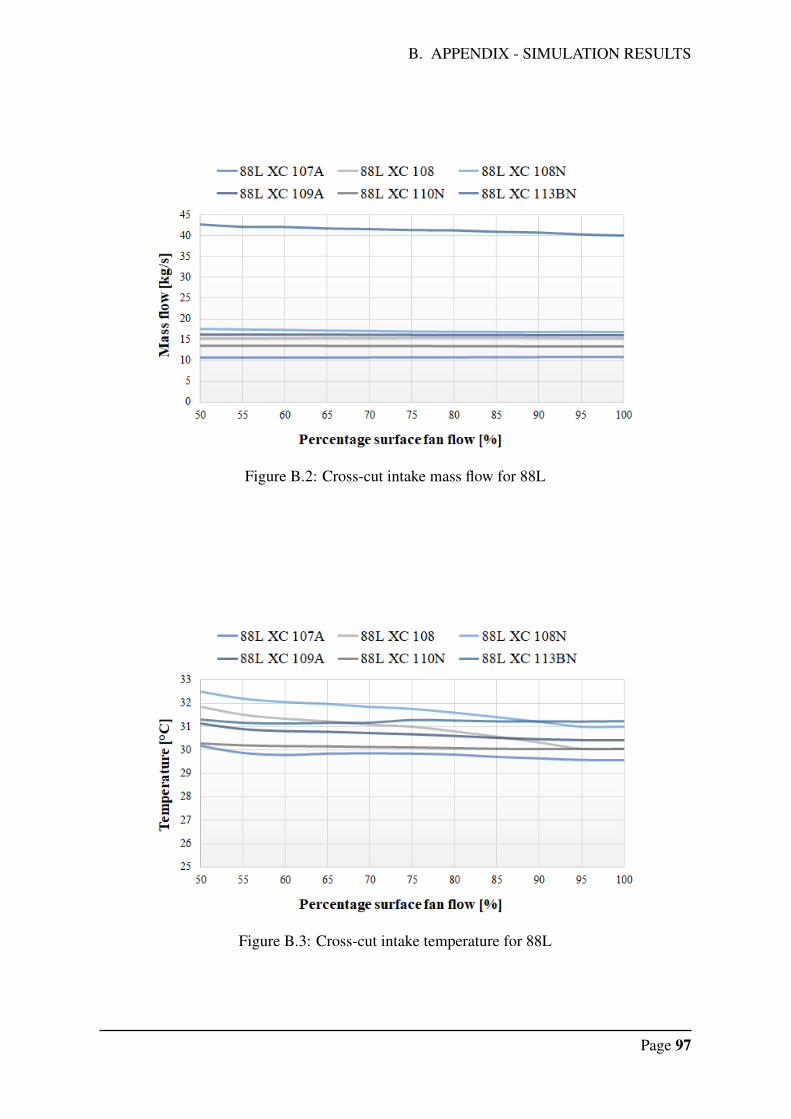
B. APPENDIX - SIMULATION RESULTS
Figure B.2: Cross-cut intake mass flow for 88L
Figure B.3: Cross-cut intake temperature for 88L
Page 97
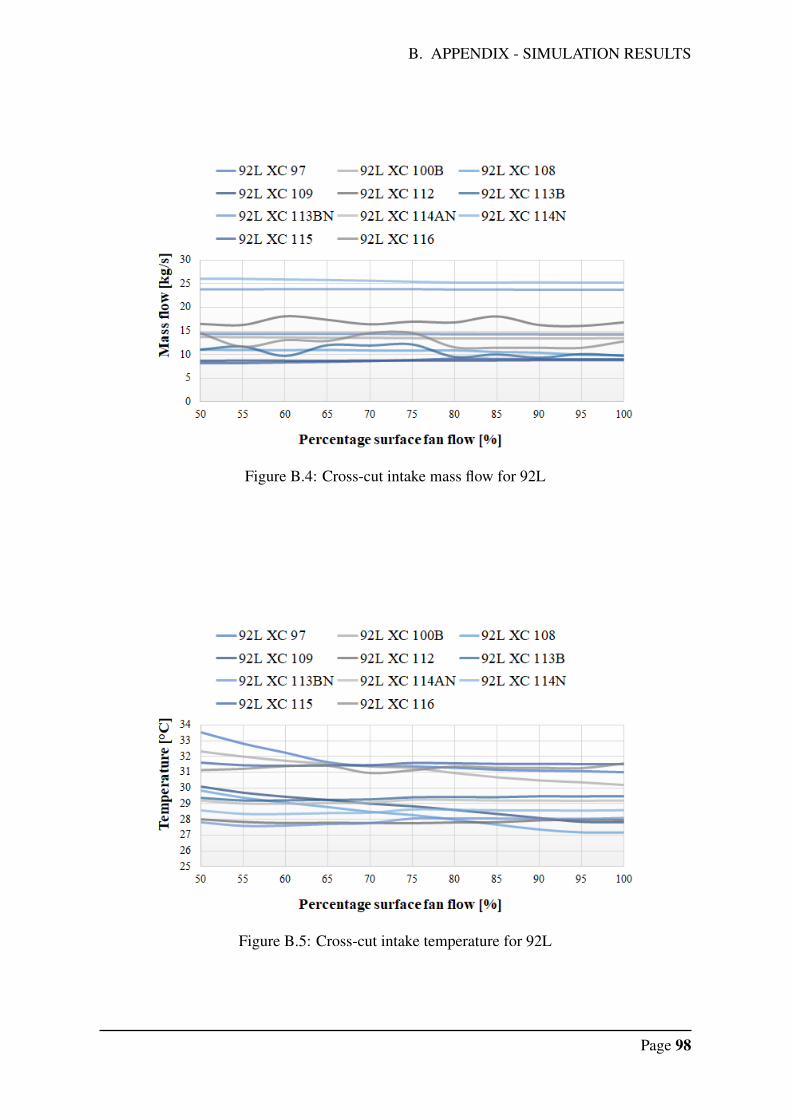
B. APPENDIX - SIMULATION RESULTS
Figure B.4: Cross-cut intake mass flow for 92L
Figure B.5: Cross-cut intake temperature for 92L
Page 98
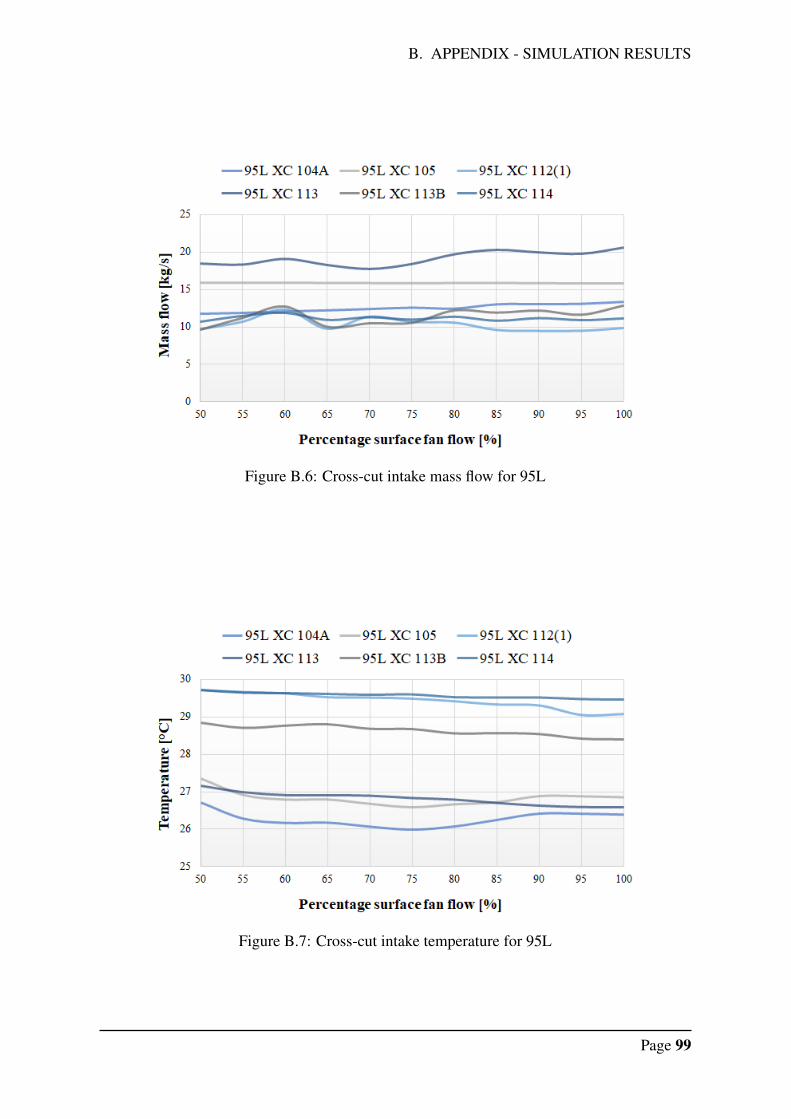
B. APPENDIX - SIMULATION RESULTS
Figure B.6: Cross-cut intake mass flow for 95L
Figure B.7: Cross-cut intake temperature for 95L
Page 99
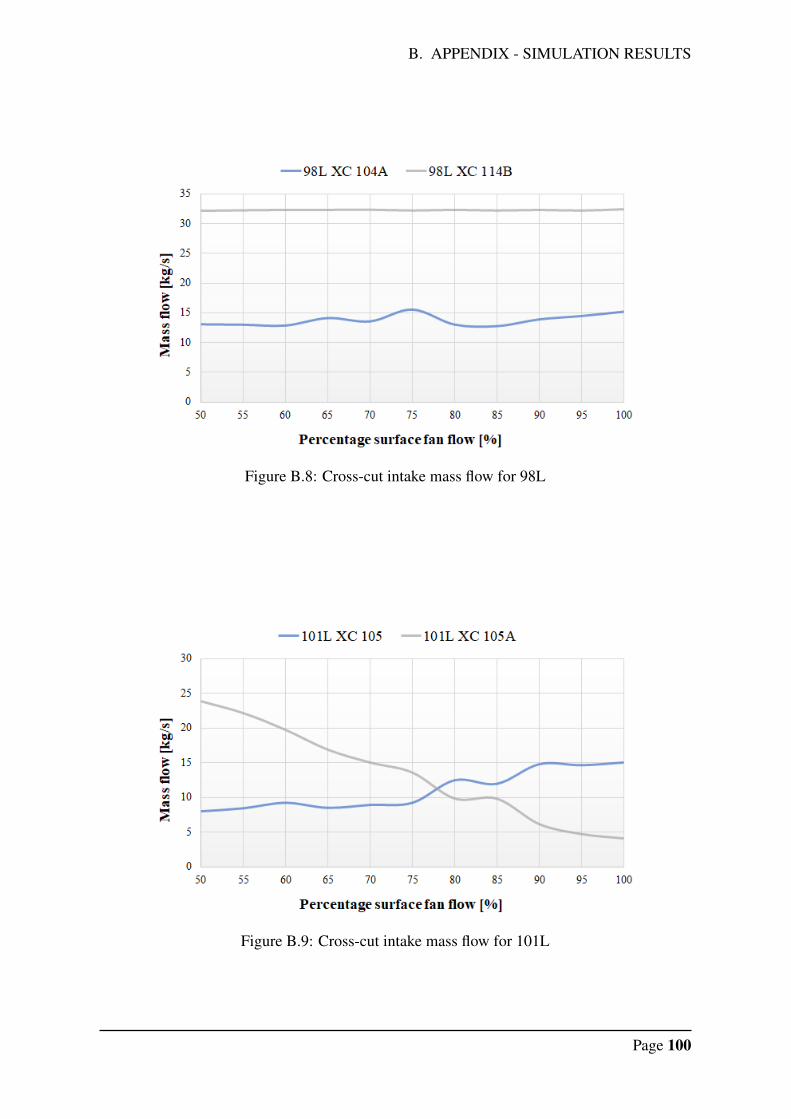
B. APPENDIX - SIMULATION RESULTS
Figure B.8: Cross-cut intake mass flow for 98L
Figure B.9: Cross-cut intake mass flow for 101L
Page 100
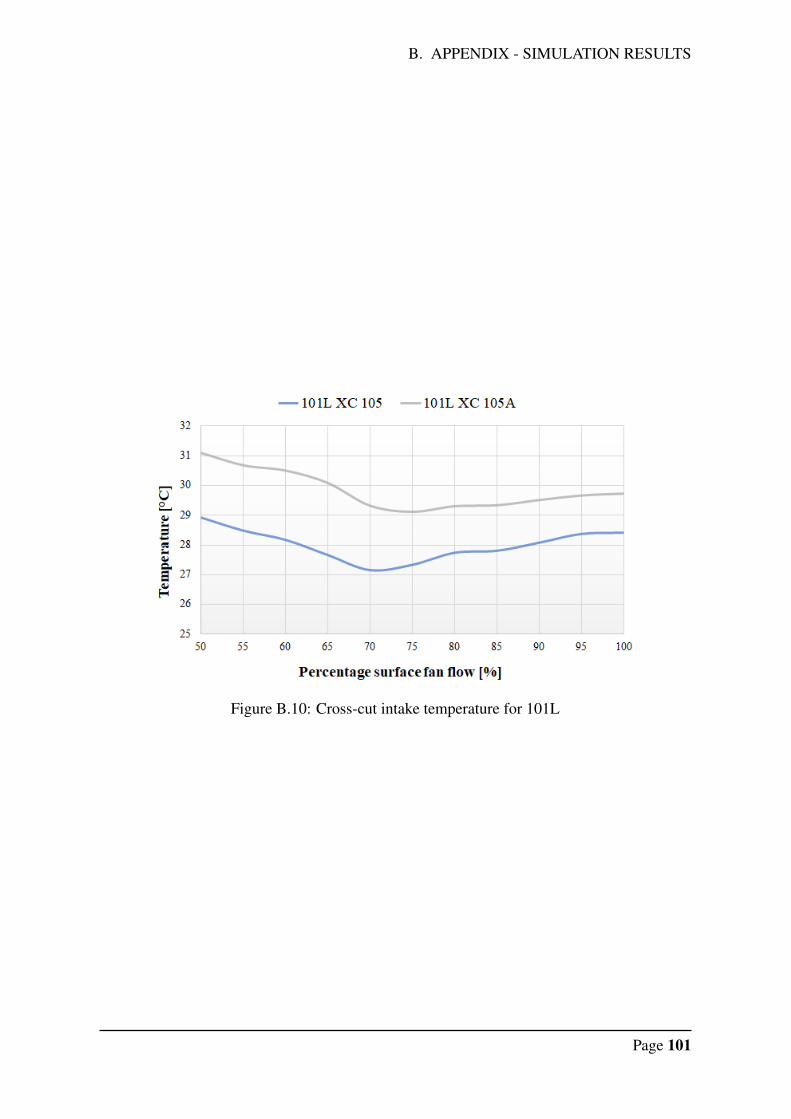
B. APPENDIX - SIMULATION RESULTS
Figure B.10: Cross-cut intake temperature for 101L
Page 101
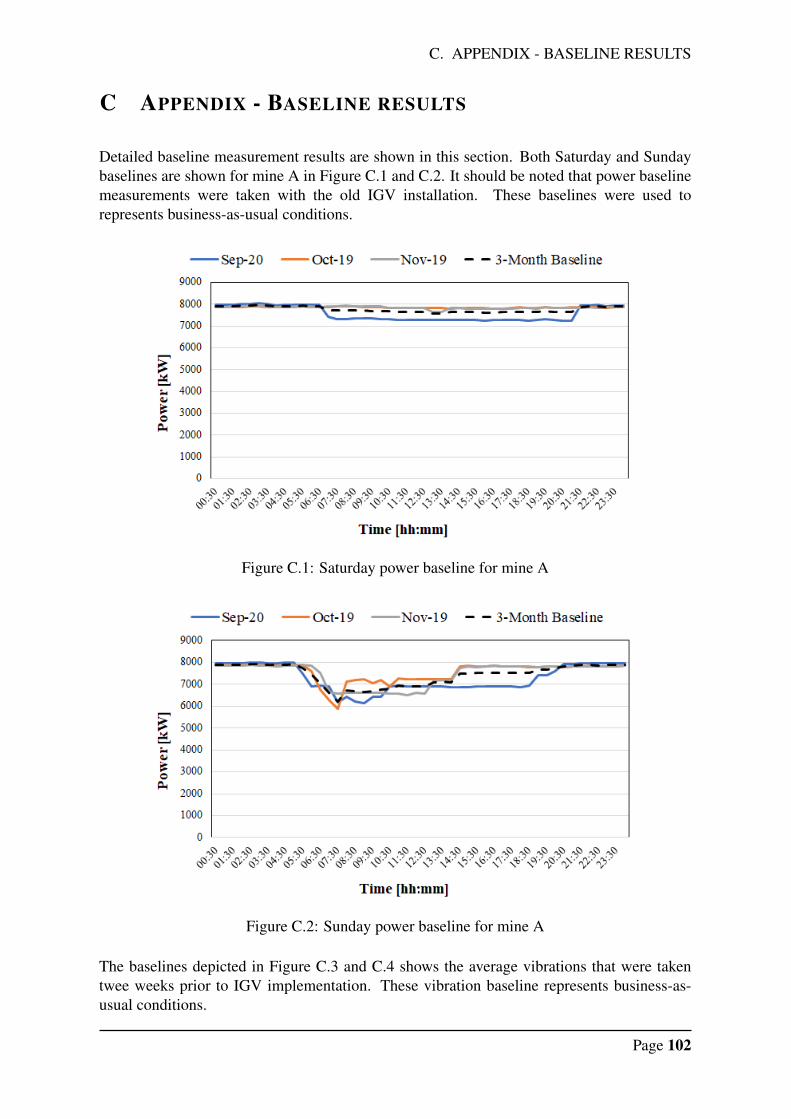
C. APPENDIX - BASELINE RESULTS
C APPENDIX - BASELINE RESULTS
Detailed baseline measurement results are shown in this section. Both Saturday and Sundaybaselines are shown for mine A in Figure C.1 and C.2. It should be noted that power baselinemeasurements were taken with the old IGV installation. These baselines were used torepresents business-as-usual conditions.
Figure C.1: Saturday power baseline for mine A
Figure C.2: Sunday power baseline for mine A
The baselines depicted in Figure C.3 and C.4 shows the average vibrations that were takentwee weeks prior to IGV implementation. These vibration baseline represents business-as-usual conditions.
Page 102
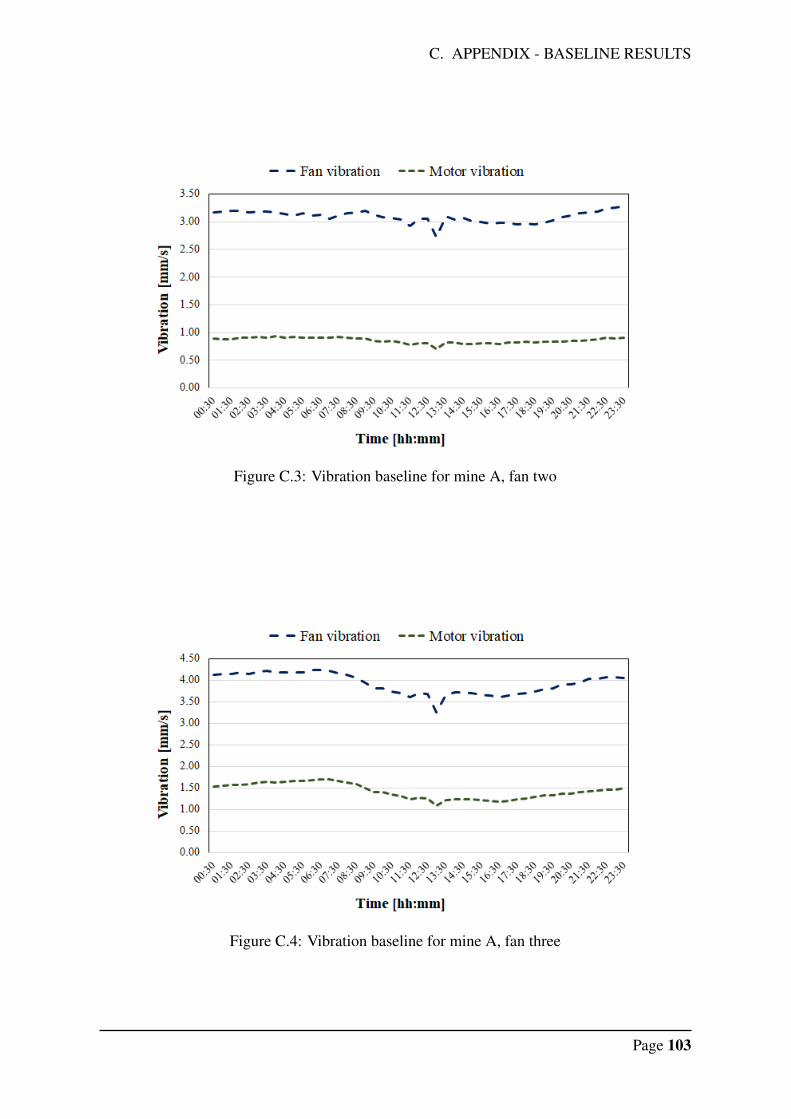
C. APPENDIX - BASELINE RESULTS
Figure C.3: Vibration baseline for mine A, fan two
Figure C.4: Vibration baseline for mine A, fan three
Page 103
D. APPENDIX - IMPACT OF IGV INSTALLATION ON INDIVIDUAL FANS
D APPENDIX - IMPACT OF IGV INSTALLATION ONINDIVIDUAL FANS
The installation of IGVs across mine A and B had an impact on the power consumption of themain fans. Most of the main fan’s power consumption decreased; however, it was revealedthat some of the fan’s power consumption increased.
As seen in Figure D.1 and D.3, a decrease in the power consumption can be seen. However, thepower consumption for main fan 2 increased as seen in Figure D.2. The power consumptionfor main fan 1 and 3 decreased by 5% and 2% respectively. The power consumption for mainfan 2 increased by 3%.
Figure D.1: Impact of IGV installation on main fan 1 - mine A
The same impact can be seen at mine B in Figures D.4 to D.6. A decrease in powerconsumption is noticed for main fan 1 and 3, with a decrease of 8% and 9% respectively. Apower increase of approximately 3% is seen for main fan two, as shown in Figure D.5.
Page 104
D. APPENDIX - IMPACT OF IGV INSTALLATION ON INDIVIDUAL FANS
Figure D.2: Impact of IGV installation on main fan 2 - mine A
Figure D.3: Impact of IGV installation on main fan 3 - mine A
Page 105
D. APPENDIX - IMPACT OF IGV INSTALLATION ON INDIVIDUAL FANS
Figure D.4: Impact of IGV installation on main fan 1 - mine B
Figure D.5: Impact of IGV installation on main fan 2 - mine B
Page 106
D. APPENDIX - IMPACT OF IGV INSTALLATION ON INDIVIDUAL FANS
Figure D.6: Impact of IGV installation on main fan 3 - mine B
Page 107
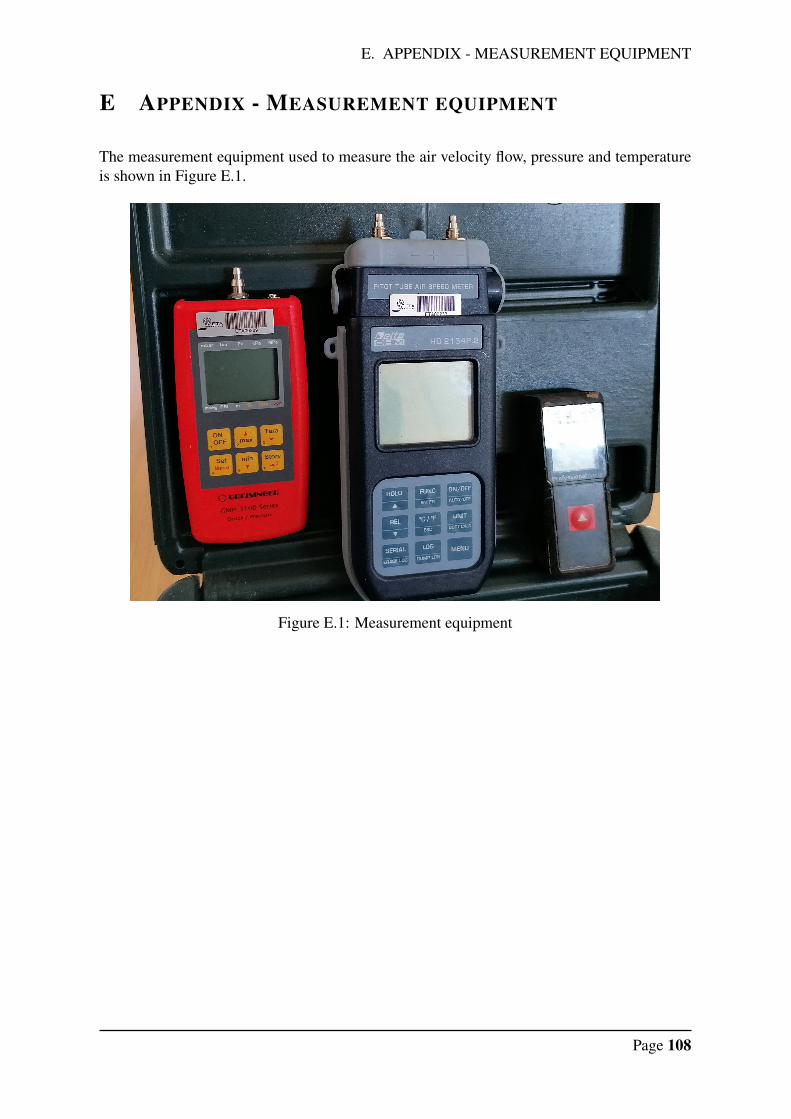
E. APPENDIX - MEASUREMENT EQUIPMENT
E APPENDIX - MEASUREMENT EQUIPMENT
The measurement equipment used to measure the air velocity flow, pressure and temperatureis shown in Figure E.1.
Figure E.1: Measurement equipment
Page 108
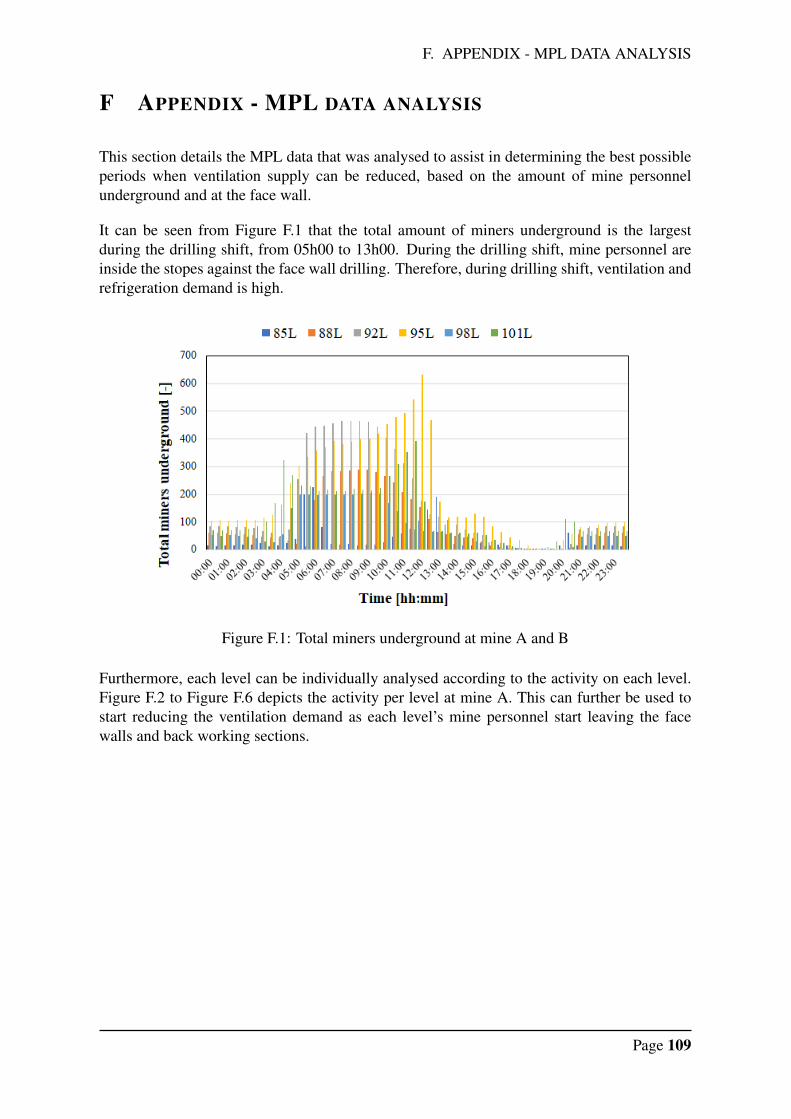
F. APPENDIX - MPL DATA ANALYSIS
F APPENDIX - MPL DATA ANALYSIS
This section details the MPL data that was analysed to assist in determining the best possibleperiods when ventilation supply can be reduced, based on the amount of mine personnelunderground and at the face wall.
It can be seen from Figure F.1 that the total amount of miners underground is the largestduring the drilling shift, from 05h00 to 13h00. During the drilling shift, mine personnel areinside the stopes against the face wall drilling. Therefore, during drilling shift, ventilation andrefrigeration demand is high.
Figure F.1: Total miners underground at mine A and B
Furthermore, each level can be individually analysed according to the activity on each level.Figure F.2 to Figure F.6 depicts the activity per level at mine A. This can further be used tostart reducing the ventilation demand as each level’s mine personnel start leaving the facewalls and back working sections.
Page 109
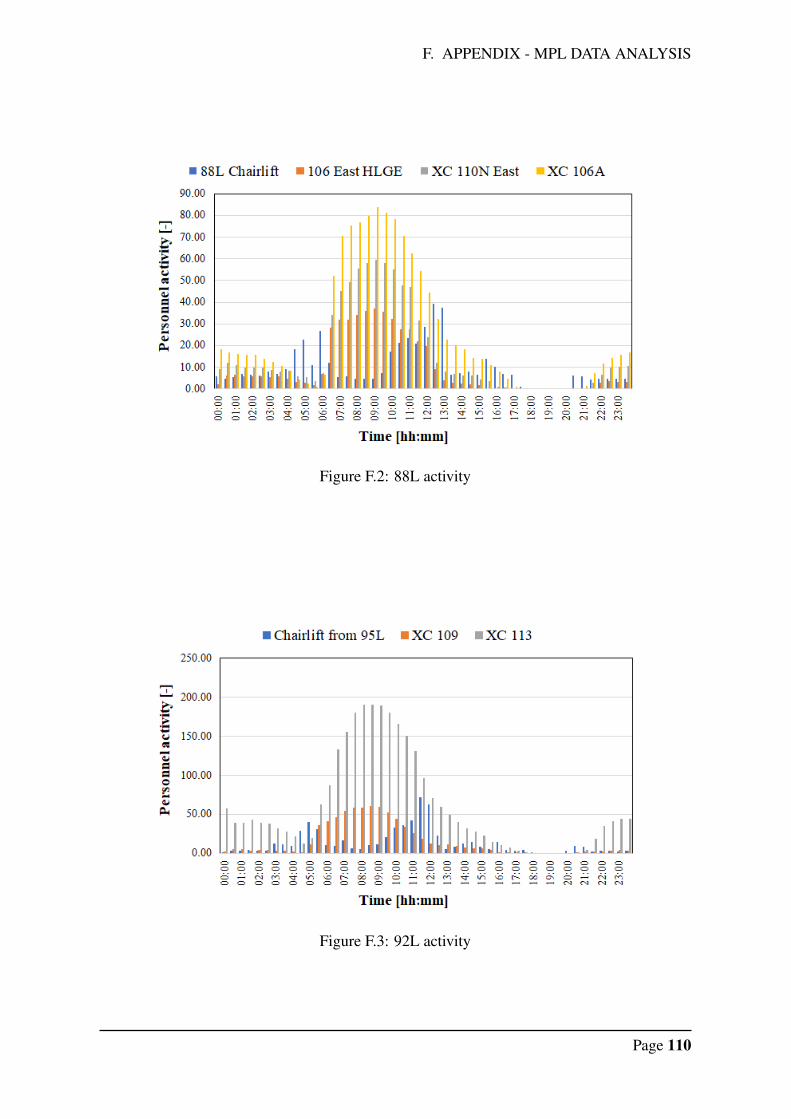
F. APPENDIX - MPL DATA ANALYSIS
Figure F.2: 88L activity
Figure F.3: 92L activity
Page 110
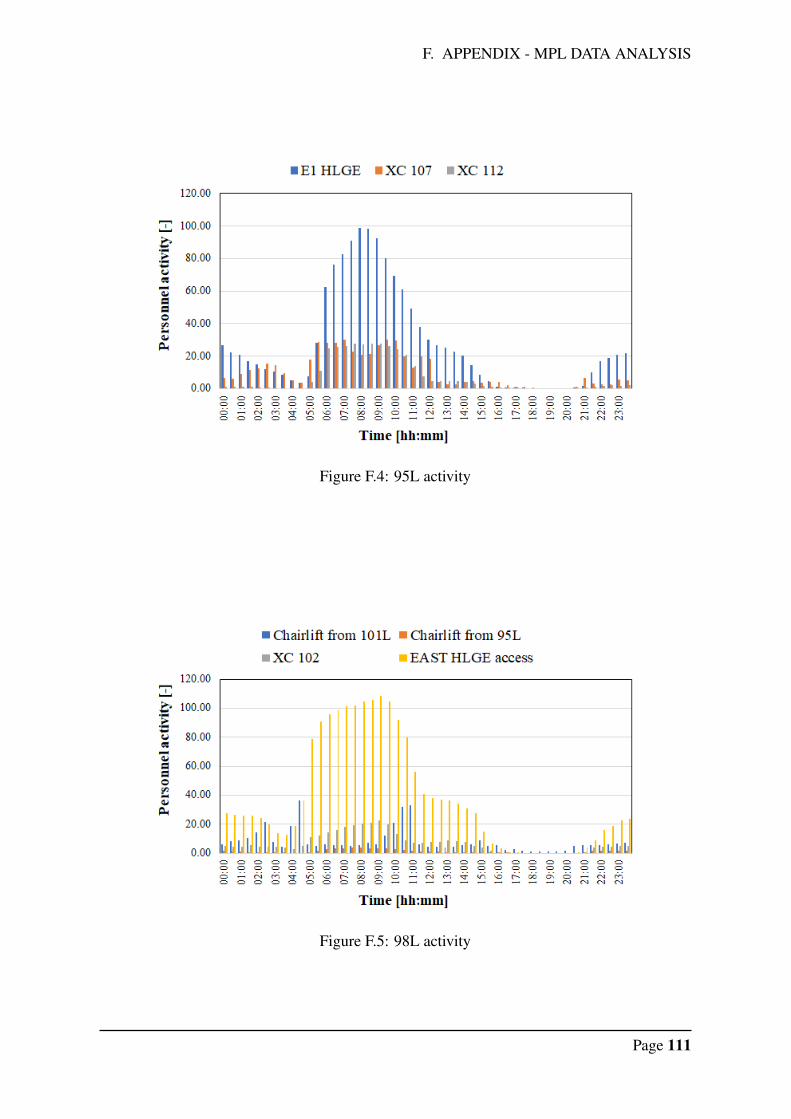
F. APPENDIX - MPL DATA ANALYSIS
Figure F.4: 95L activity
Figure F.5: 98L activity
Page 111
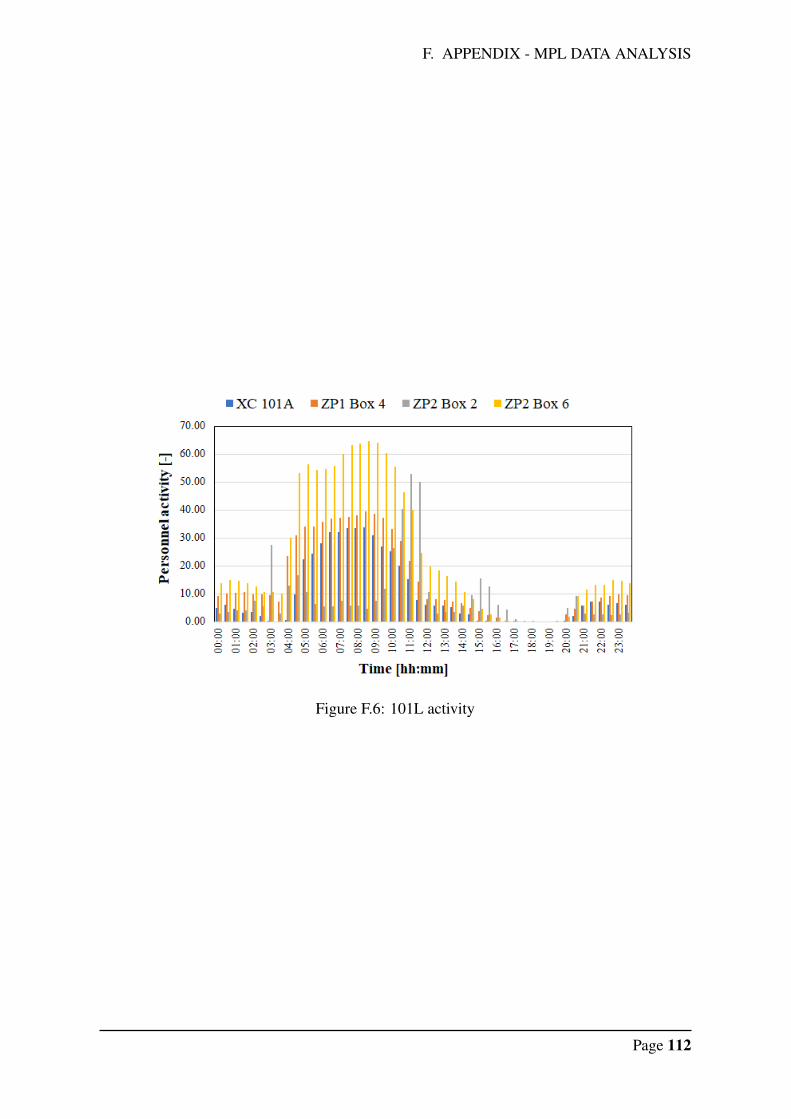
F. APPENDIX - MPL DATA ANALYSIS
Figure F.6: 101L activity
Page 112
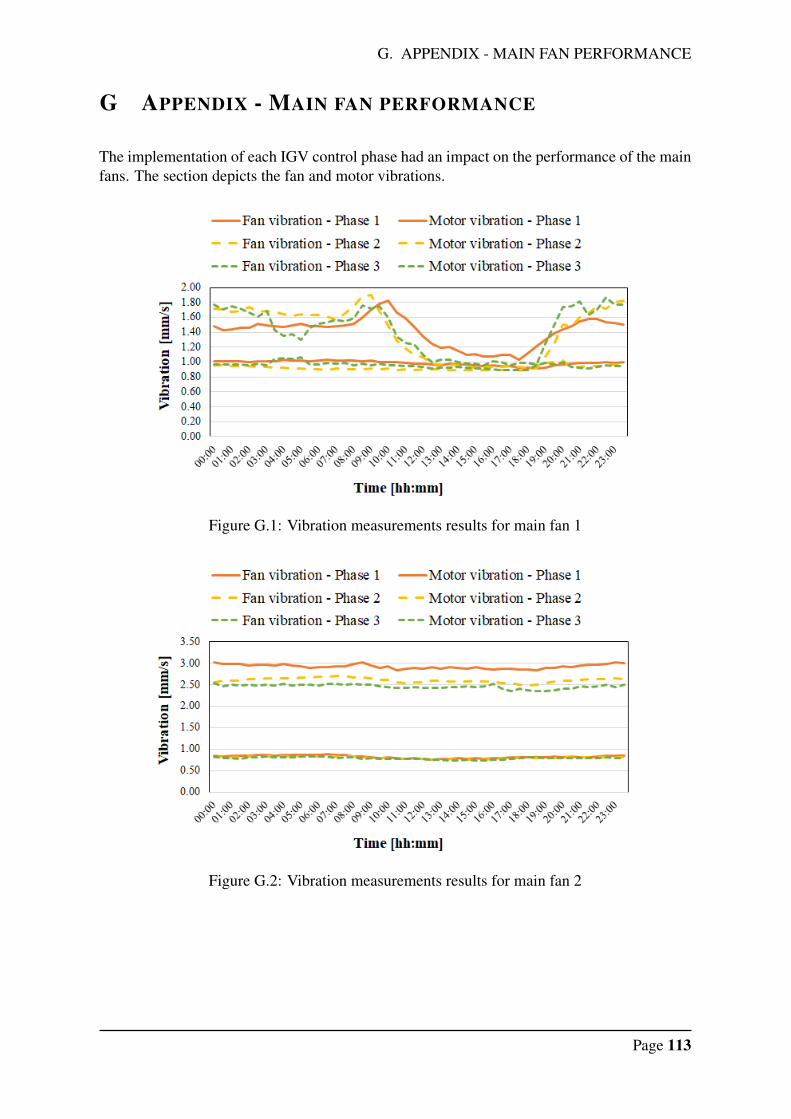
G. APPENDIX - MAIN FAN PERFORMANCE
G APPENDIX - MAIN FAN PERFORMANCE
The implementation of each IGV control phase had an impact on the performance of the mainfans. The section depicts the fan and motor vibrations.
Figure G.1: Vibration measurements results for main fan 1
Figure G.2: Vibration measurements results for main fan 2
Page 113
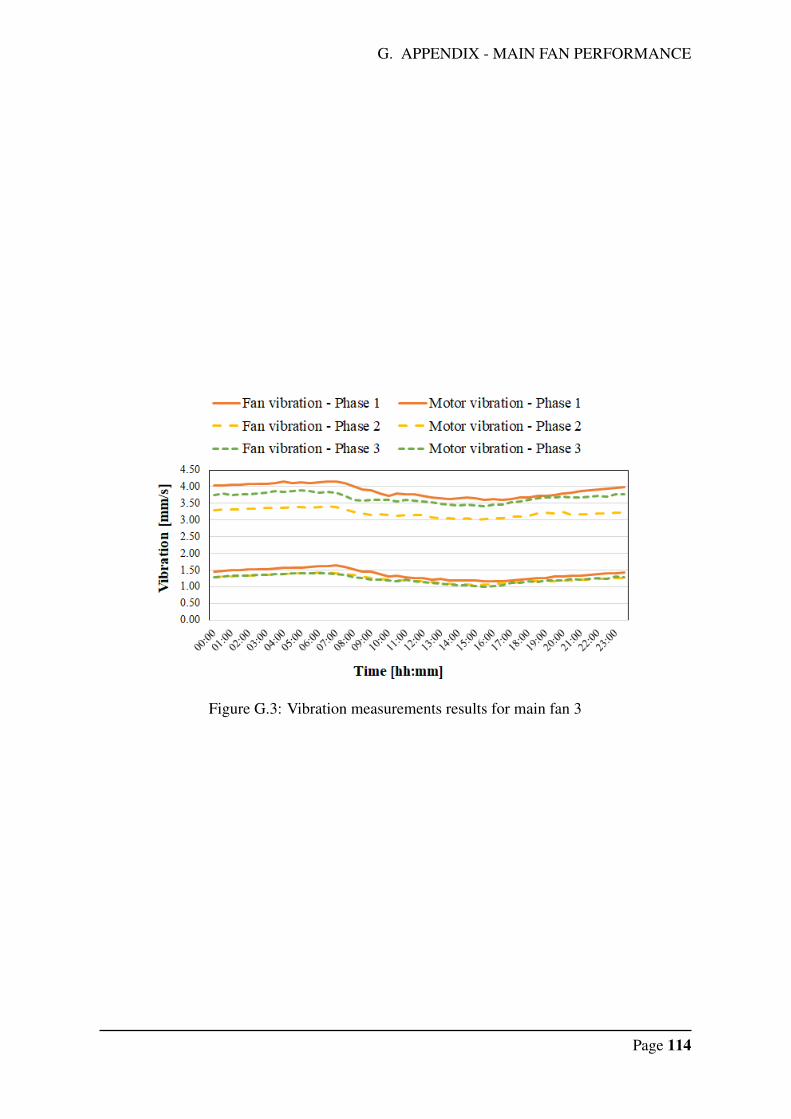
G. APPENDIX - MAIN FAN PERFORMANCE
Figure G.3: Vibration measurements results for main fan 3
Page 114
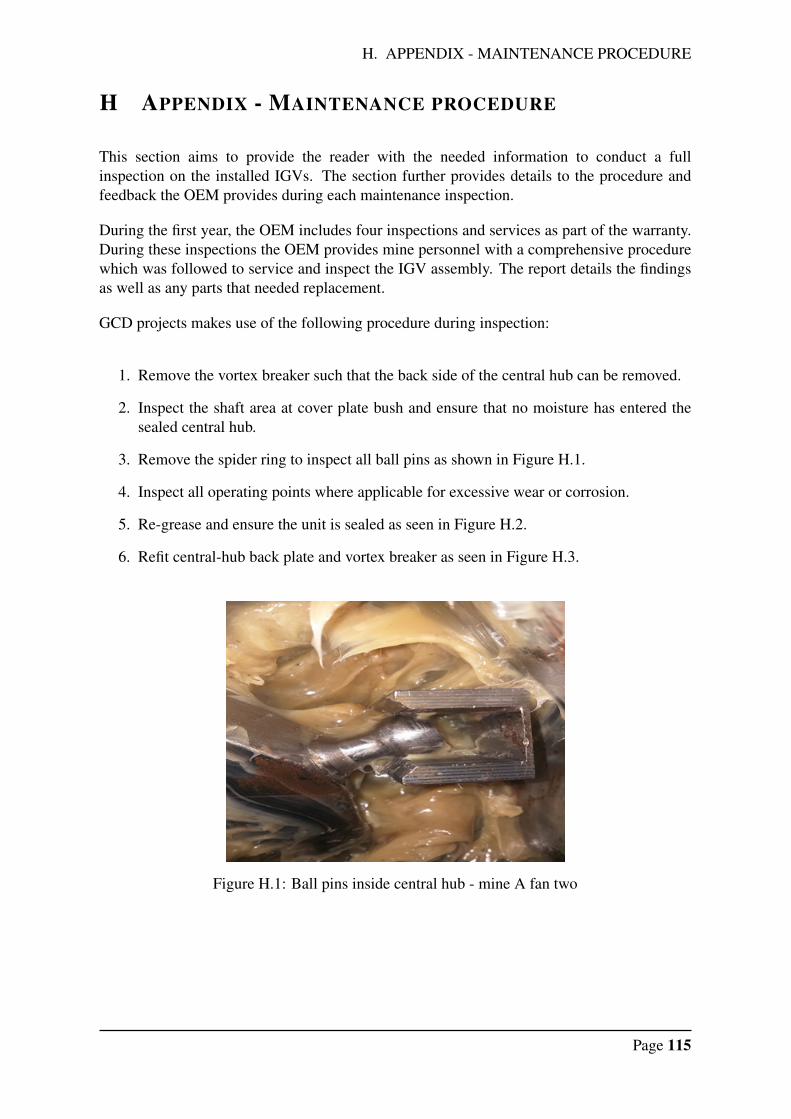
H. APPENDIX - MAINTENANCE PROCEDURE
H APPENDIX - MAINTENANCE PROCEDURE
This section aims to provide the reader with the needed information to conduct a fullinspection on the installed IGVs. The section further provides details to the procedure andfeedback the OEM provides during each maintenance inspection.
During the first year, the OEM includes four inspections and services as part of the warranty.During these inspections the OEM provides mine personnel with a comprehensive procedurewhich was followed to service and inspect the IGV assembly. The report details the findingsas well as any parts that needed replacement.
GCD projects makes use of the following procedure during inspection:
1. Remove the vortex breaker such that the back side of the central hub can be removed.
2. Inspect the shaft area at cover plate bush and ensure that no moisture has entered thesealed central hub.
3. Remove the spider ring to inspect all ball pins as shown in Figure H.1.
4. Inspect all operating points where applicable for excessive wear or corrosion.
5. Re-grease and ensure the unit is sealed as seen in Figure H.2.
6. Refit central-hub back plate and vortex breaker as seen in Figure H.3.
Figure H.1: Ball pins inside central hub - mine A fan two
Page 115
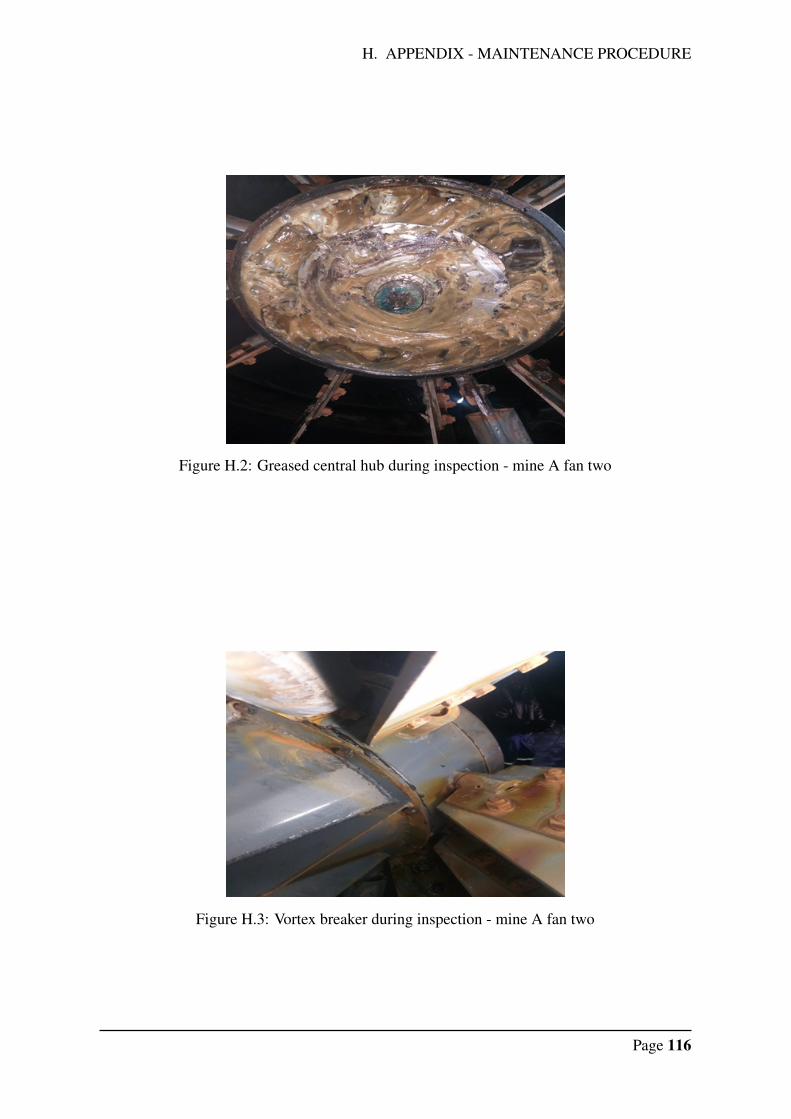
H. APPENDIX - MAINTENANCE PROCEDURE
Figure H.2: Greased central hub during inspection - mine A fan two
Figure H.3: Vortex breaker during inspection - mine A fan two
Page 116


![[Date] - Grumman/Butkusgrummanbutkus.com/.../Draft_I2SL_Higher_Ed_Labs_Report.docx · Web viewTypically, the compressor loading of a chiller is varied using inlet vanes on the impeller](https://img.pdfslide.us/doc/110x75/5aabc9047f8b9a693f8c61ad/date-grumman-viewtypically-the-compressor-loading-of-a-chiller-is-varied-using.jpg)
![Untitled-1 []€¦ · Fans with inlet & outlet cones and with guide vanes. Fire rated: 400 OC/3hrs, 300 OC/2hrs, 250 oc/2 hrs. Application: General ventilation, Basement Exhaust,](https://img.pdfslide.us/doc/110x75/5eb61563548e8d3f2640503c/untitled-1-fans-with-inlet-outlet-cones-and-with-guide-vanes-fire-rated.jpg)


![34178 - NASA · suppress rotating stall and surge: Paduand[ref.(9)] used "wiggling" inlet guide vanes to control rotating stall in the axial compressor andFfowcs Williams [ref.(10)]](https://img.pdfslide.us/doc/110x75/5e8e40089421c9008740a043/34178-nasa-suppress-rotating-stall-and-surge-paduandref9-used-wiggling.jpg)