Embed Size (px)
Citation preview
Sustainable use ofEarth’s natural resources
IR presentation
Q1-Q4 2016
© Outotec – All rights reserved
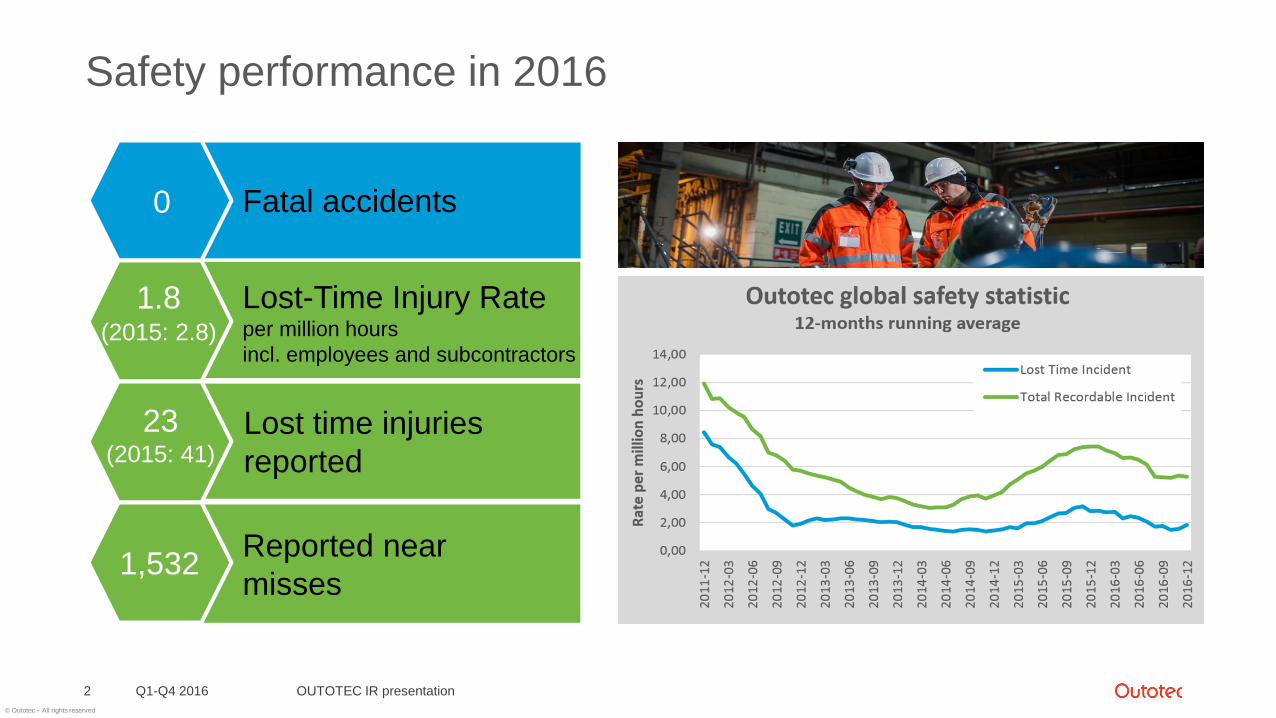
Safety performance in 2016
OUTOTEC IR presentation2 Q1-Q4 2016
0
1.8(2015: 2.8)
Fatal accidents
Lost-Time Injury Rateper million hours
incl. employees and subcontractors
Reported near
misses
23(2015: 41)
Lost time injuries
reported
1,532
© Outotec – All rights reserved
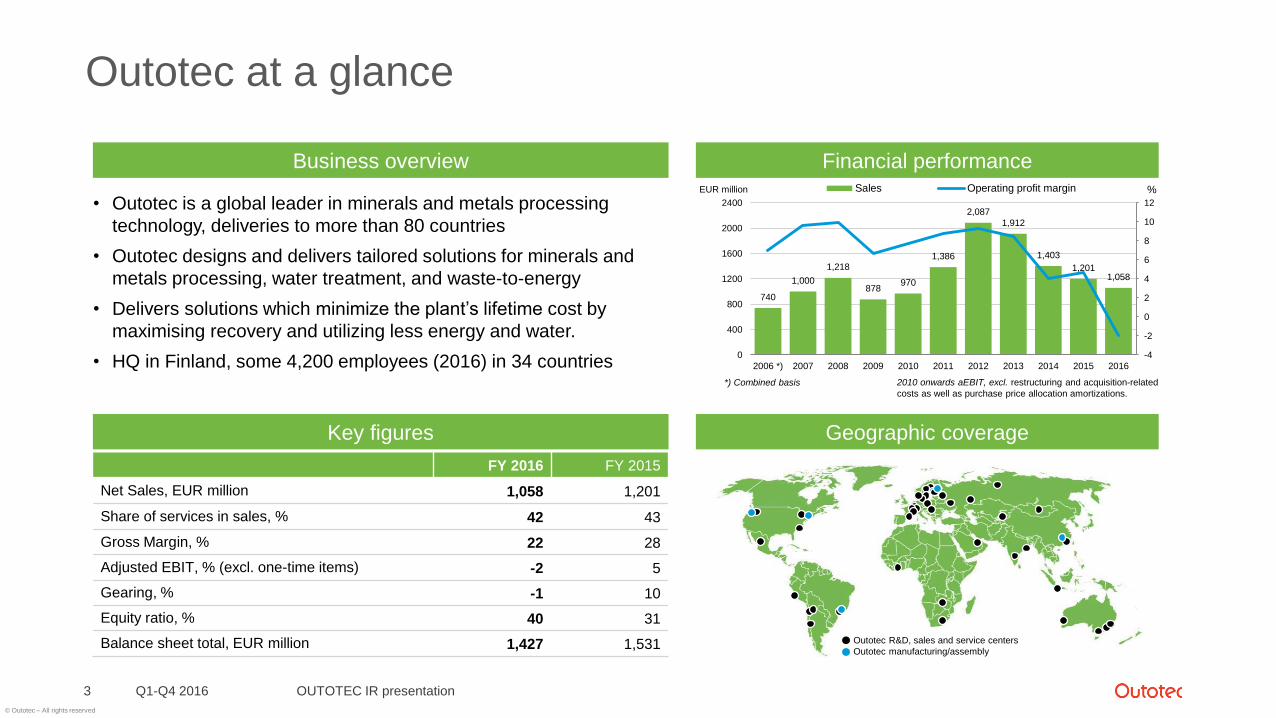
Outotec at a glance
Q1-Q4 2016 OUTOTEC IR presentation3
Key figures
Financial performance
Geographic coverage
Business overview
740
1,000
1,218
878970
1,386
2,087
1,912
1,403
1,2011,058
-4
-2
0
2
4
6
8
10
12
0
400
800
1200
1600
2000
2400
2006 *) 2007 2008 2009 2010 2011 2012 2013 2014 2015 2016
Sales Operating profit margin
*) Combined basis 2010 onwards aEBIT, excl. restructuring and acquisition-related
costs as well as purchase price allocation amortizations.
EUR million %
FY 2016 FY 2015
Net Sales, EUR million 1,058 1,201
Share of services in sales, % 42 43
Gross Margin, % 22 28
Adjusted EBIT, % (excl. one-time items) -2 5
Gearing, % -1 10
Equity ratio, % 40 31
Balance sheet total, EUR million 1,427 1,531
• Outotec is a global leader in minerals and metals processing
technology, deliveries to more than 80 countries
• Outotec designs and delivers tailored solutions for minerals and
metals processing, water treatment, and waste-to-energy
• Delivers solutions which minimize the plant’s lifetime cost by
maximising recovery and utilizing less energy and water.
• HQ in Finland, some 4,200 employees (2016) in 34 countries
Outotec R&D, sales and service centers
Outotec manufacturing/assembly
© Outotec – All rights reserved
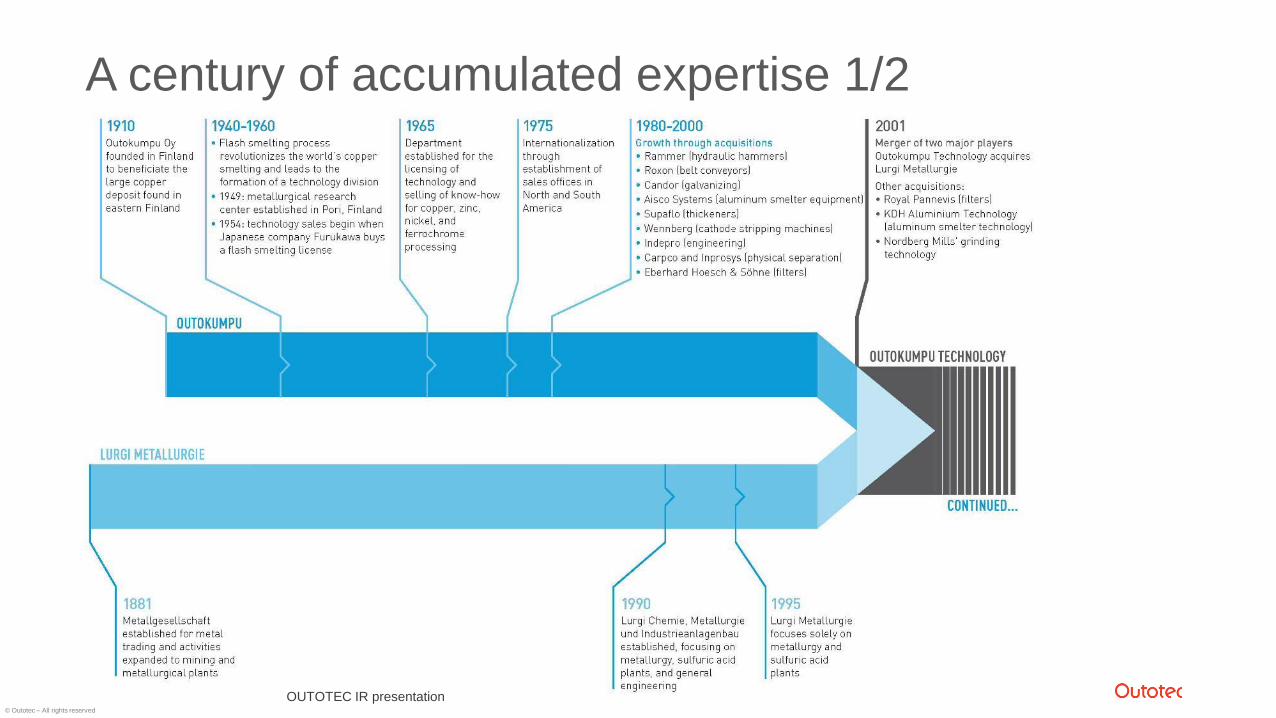
A century of accumulated expertise 1/2
Q1-Q4 2016 OUTOTEC IR presentation4 OUTOTEC IR presentation
© Outotec – All rights reserved
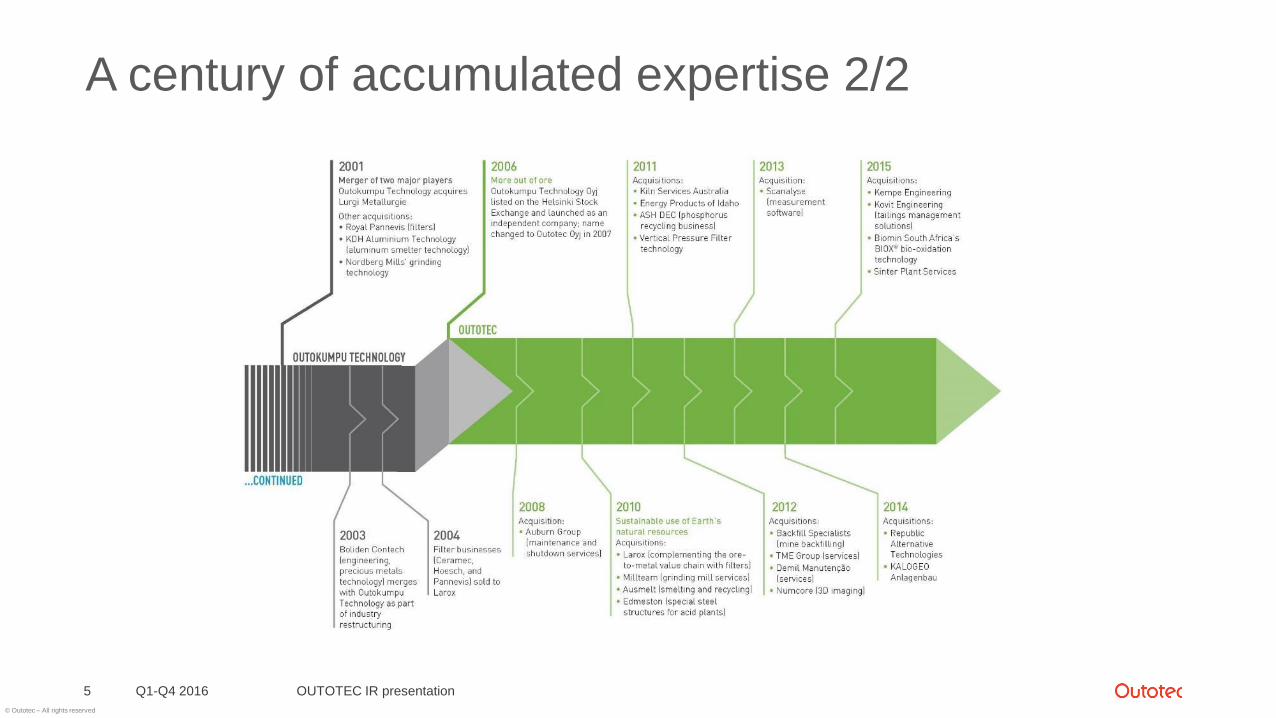
A century of accumulated expertise 2/2
Q1-Q4 2016 OUTOTEC IR presentation5
© Outotec – All rights reserved
6
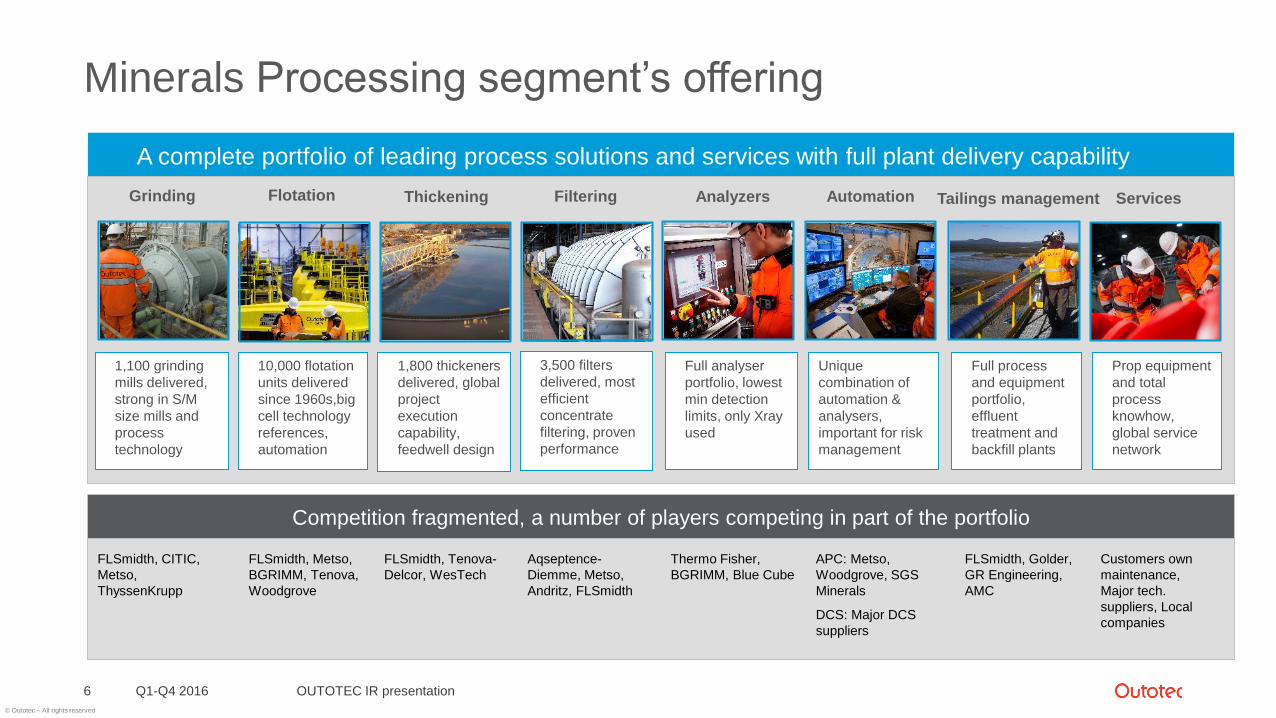
Minerals Processing segment’s offering
A complete portfolio of leading process solutions and services with full plant delivery capability
Water
Technology
FLSmidth, CITIC,
Metso,
ThyssenKrupp
FLSmidth, Metso,
BGRIMM, Tenova,
Woodgrove
FLSmidth, Tenova-
Delcor, WesTech
Aqseptence-
Diemme, Metso,
Andritz, FLSmidth
Thermo Fisher,
BGRIMM, Blue Cube
APC: Metso,
Woodgrove, SGS
Minerals
DCS: Major DCS
suppliers
FLSmidth, Golder,
GR Engineering,
AMC
Customers own
maintenance,
Major tech.
suppliers, Local
companies
Thickening AnalyzersGrinding Flotation AutomationFiltering ServicesTailings management
1,100 grinding
mills delivered,
strong in S/M
size mills and
process
technology
10,000 flotation
units delivered
since 1960s,big
cell technology
references,
automation
1,800 thickeners
delivered, global
project
execution
capability,
feedwell design
Full analyser
portfolio, lowest
min detection
limits, only Xray
used
Unique
combination of
automation &
analysers,
important for risk
management
Full process
and equipment
portfolio,
effluent
treatment and
backfill plants
Prop equipment
and total
process
knowhow,
global service
network
3,500 filters
delivered, most
efficient
concentrate
filtering, proven
performance
Competition fragmented, a number of players competing in part of the portfolio
Q1-Q4 2016 OUTOTEC IR presentation
© Outotec – All rights reserved
Q1-Q4 2016 OUTOTEC IR presentation7
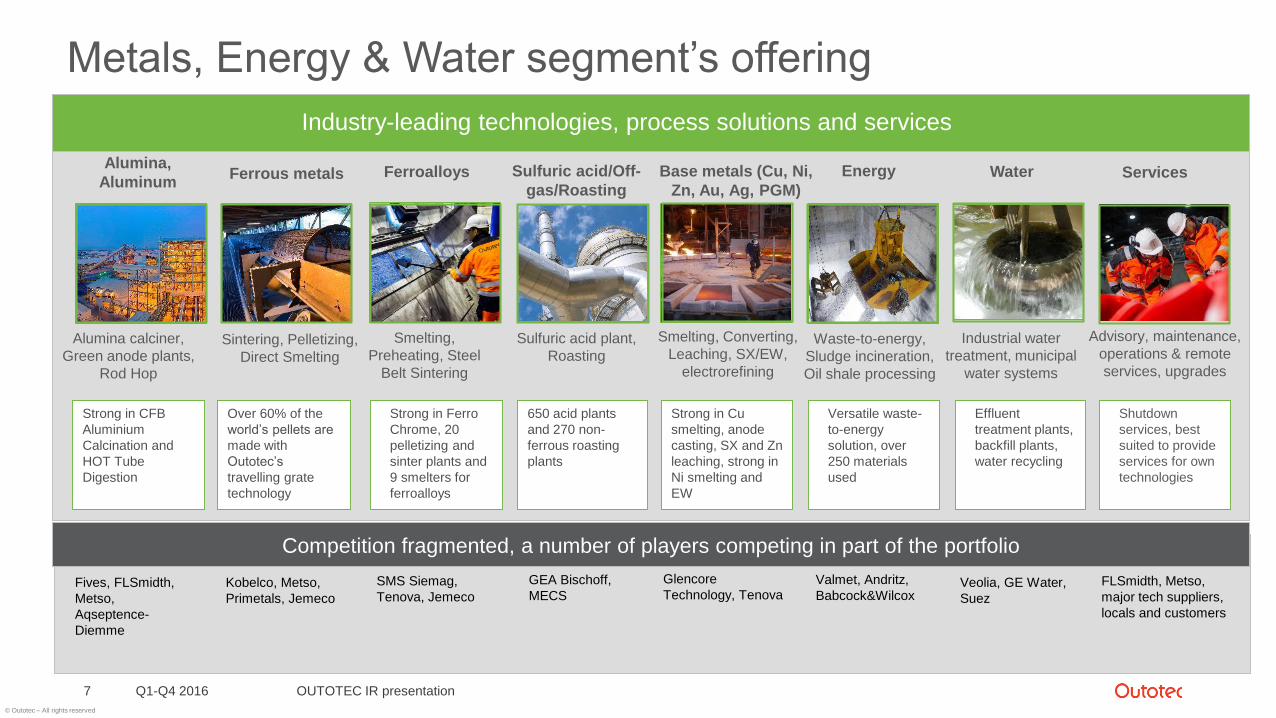
Industry-leading technologies, process solutions and services
Metals, Energy & Water segment’s offering
Ferrous metals Sulfuric acid/Off-
gas/Roasting
Fives, FLSmidth,
Metso,
Aqseptence-
Diemme
Kobelco, Metso,
Primetals, Jemeco
SMS Siemag,
Tenova, Jemeco
GEA Bischoff,
MECS
Alumina,
AluminumBase metals (Cu, Ni,
Zn, Au, Ag, PGM)Ferroalloys
Glencore
Technology, Tenova
Strong in CFB
Aluminium
Calcination and
HOT Tube
Digestion
Over 60% of the
world’s pellets are
made with
Outotec’s
travelling grate
technology
650 acid plants
and 270 non-
ferrous roasting
plants
Strong in Cu
smelting, anode
casting, SX and Zn
leaching, strong in
Ni smelting and
EW
Energy Water
Alumina calciner,
Green anode plants,
Rod Hop
Sintering, Pelletizing,
Direct Smelting
Sulfuric acid plant,
Roasting
Smelting, Converting,
Leaching, SX/EW,
electrorefining
Smelting,
Preheating, Steel
Belt Sintering
Waste-to-energy,
Sludge incineration,
Oil shale processing
Industrial water
treatment, municipal
water systems
Competition fragmented, a number of players competing in part of the portfolio
Services
Advisory, maintenance,
operations & remote
services, upgrades
Valmet, Andritz,
Babcock&WilcoxVeolia, GE Water,
Suez
FLSmidth, Metso,
major tech suppliers,
locals and customers
Strong in Ferro
Chrome, 20
pelletizing and
sinter plants and
9 smelters for
ferroalloys
Versatile waste-
to-energy
solution, over
250 materials
used
Effluent
treatment plants,
backfill plants,
water recycling
Shutdown
services, best
suited to provide
services for own
technologies
© Outotec – All rights reserved
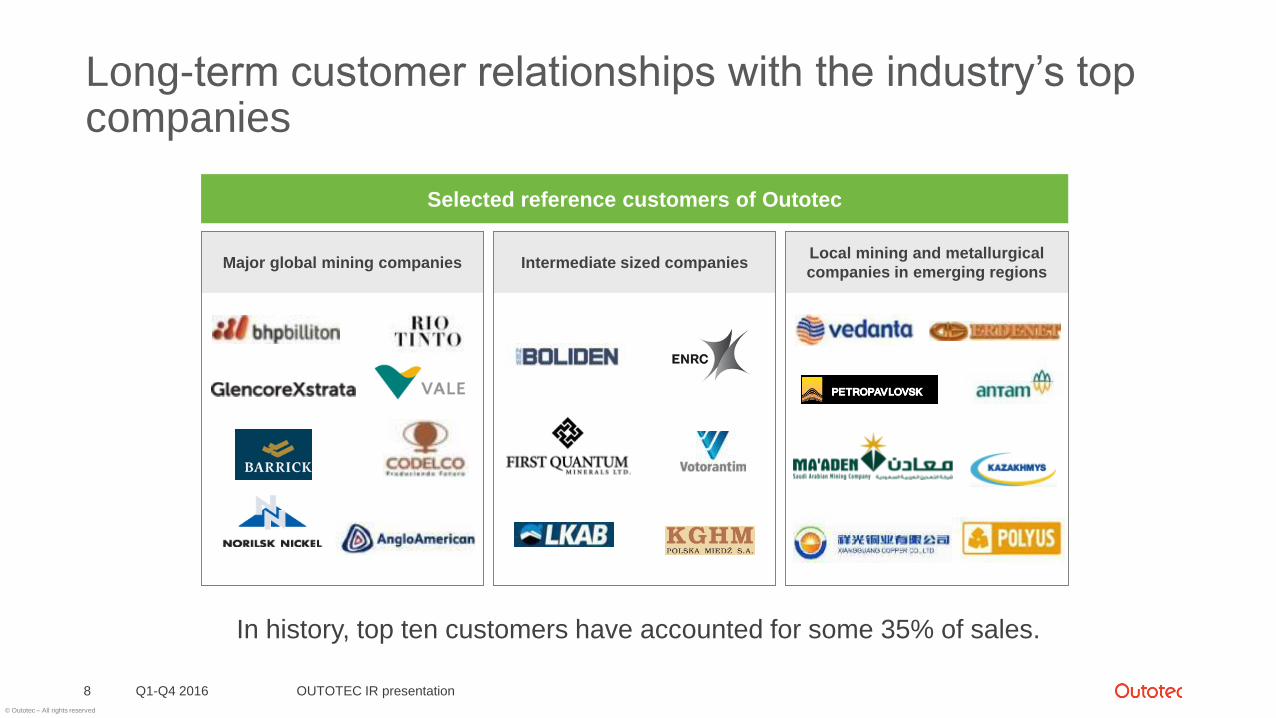
Long-term customer relationships with the industry’s top companies
Q1-Q4 2016 OUTOTEC IR presentation8
In history, top ten customers have accounted for some 35% of sales.
Major global mining companiesLocal mining and metallurgical
companies in emerging regionsIntermediate sized companies
Selected reference customers of Outotec
© Outotec – All rights reserved
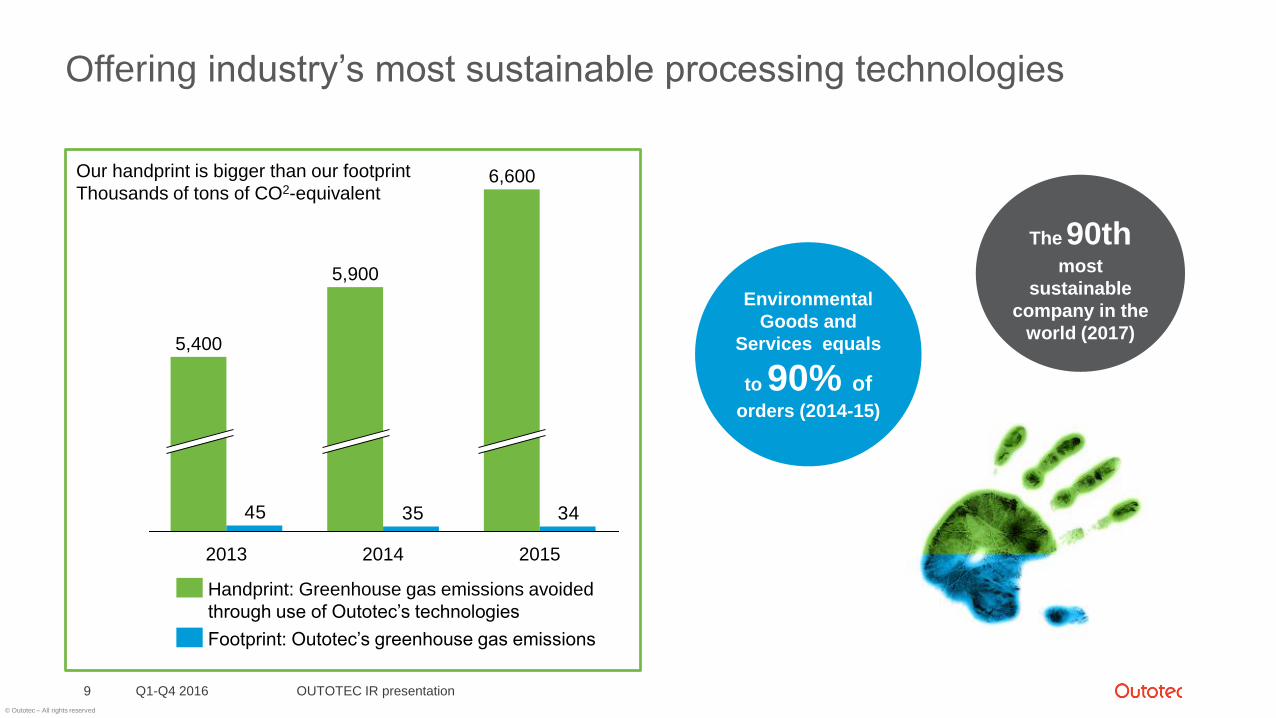
Offering industry’s most sustainable processing technologies
Q1-Q4 2016 OUTOTEC IR presentation9
343545
2015
6,600
2014
5,900
2013
5,400
Our handprint is bigger than our footprint
Thousands of tons of CO2-equivalent
Footprint: Outotec’s greenhouse gas emissions
Handprint: Greenhouse gas emissions avoided
through use of Outotec’s technologies
The 90thmost
sustainable
company in the
world (2017)
Environmental
Goods and
Services equals
to 90% of
orders (2014-15)
© Outotec – All rights reserved
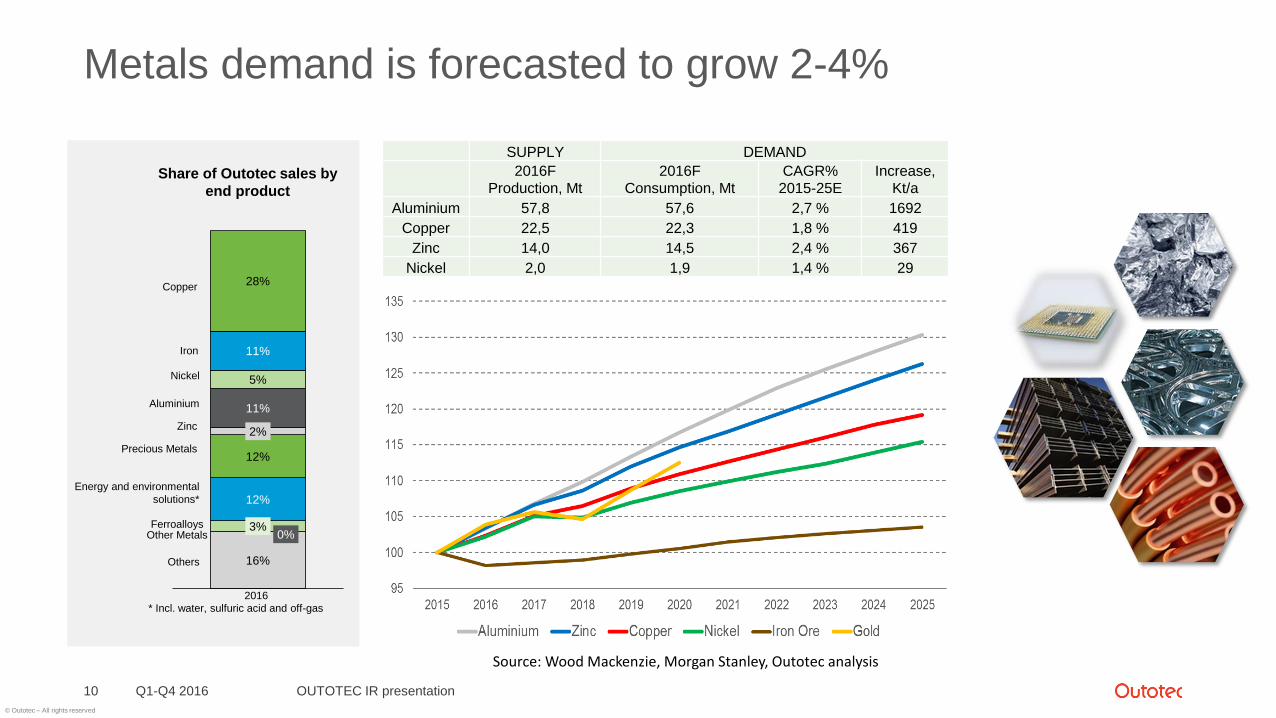
Metals demand is forecasted to grow 2-4%
Q1-Q4 2016 OUTOTEC IR presentation10
SUPPLY DEMAND
2016F
Production, Mt
2016F
Consumption, Mt
CAGR%
2015-25E
Increase,
Kt/a
Aluminium 57,8 57,6 2,7 % 1692
Copper 22,5 22,3 1,8 % 419
Zinc 14,0 14,5 2,4 % 367
Nickel 2,0 1,9 1,4 % 29
Source: Wood Mackenzie, Morgan Stanley, Outotec analysis
Share of Outotec sales by
end product
* Incl. water, sulfuric acid and off-gas
16%
0%3%
12%
12%
2%
11%
5%
11%
28%
Others
Copper
Precious Metals
Zinc
Aluminium
Ferroalloys
Iron
Nickel
Other Metals
2016
Energy and environmental
solutions*
© Outotec – All rights reserved
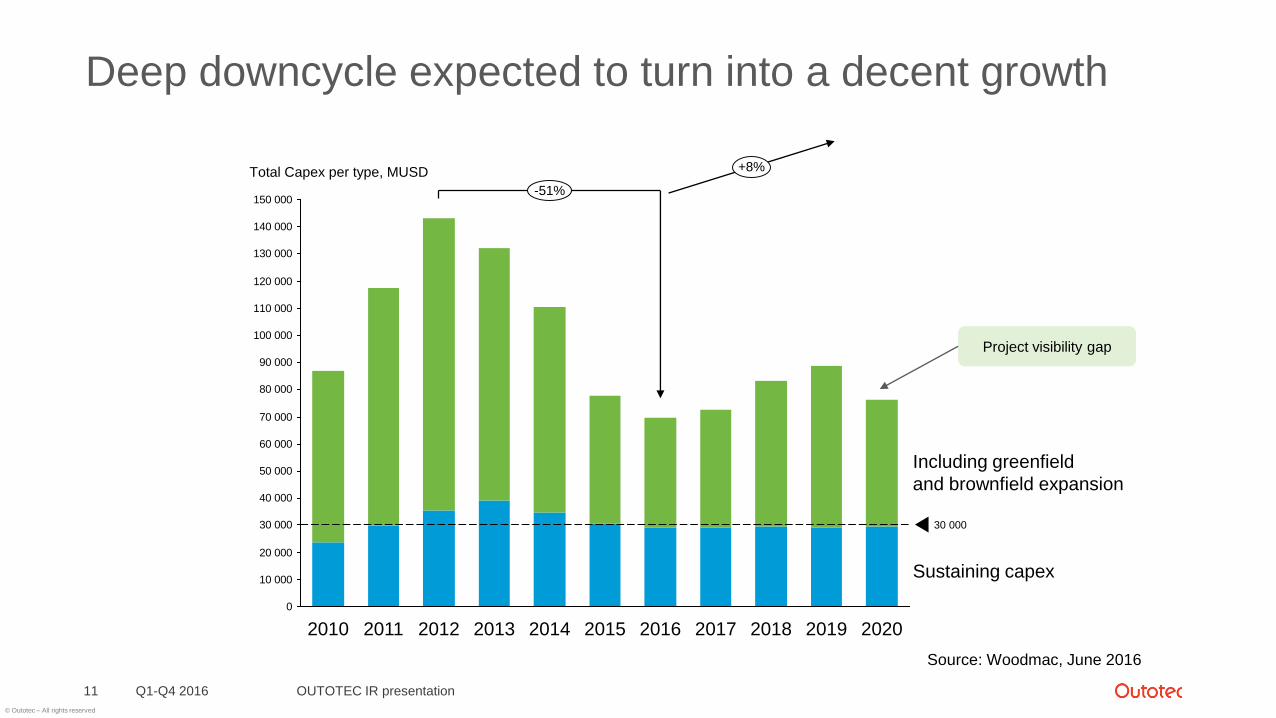
Deep downcycle expected to turn into a decent growth
Q1-Q4 2016 OUTOTEC IR presentation11
0
10 000
20 000
30 000
40 000
50 000
60 000
70 000
80 000
90 000
100 000
110 000
120 000
130 000
140 000
150 000
2019 2020201820172016201520142013201220112010
30 000
+8%
-51%
Sustaining capex
Including greenfield
and brownfield expansion
Total Capex per type, MUSD
Project visibility gap
Source: Woodmac, June 2016
© Outotec – All rights reserved
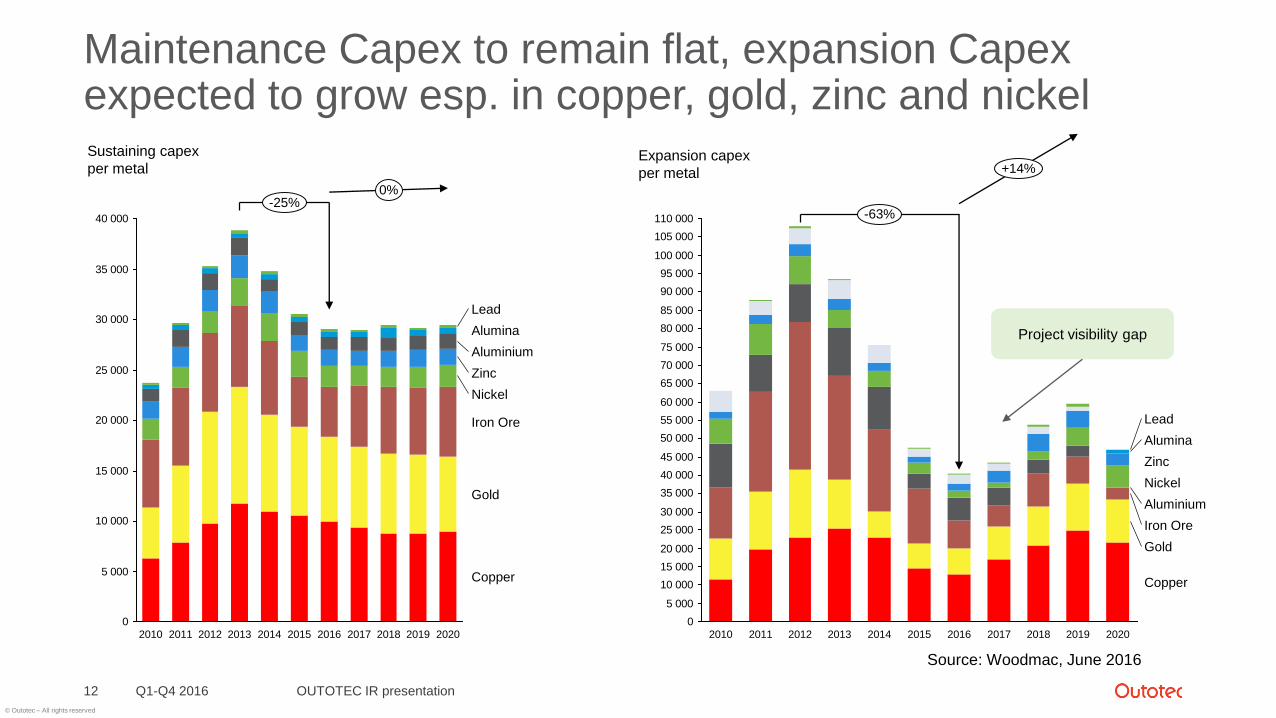
Maintenance Capex to remain flat, expansion Capexexpected to grow esp. in copper, gold, zinc and nickel
Q1-Q4 2016 OUTOTEC IR presentation12
0
5 000
10 000
15 000
20 000
25 000
30 000
35 000
40 000
0%-25%
Copper
Gold
Iron Ore
Nickel
Zinc
Aluminium
Alumina
Lead
20202019201820172016201520142013201220112010
0
5 000
10 000
15 000
20 000
25 000
30 000
35 000
40 000
45 000
50 000
55 000
60 000
65 000
70 000
75 000
80 000
85 000
90 000
95 000
100 000
105 000
110 000
20152014201320122011 201820172010 2016
+14%
-63%
Copper
Gold
Iron Ore
Aluminium
Nickel
Zinc
Alumina
Lead
20202019
Sustaining capex
per metalExpansion capex
per metal
Project visibility gap
Source: Woodmac, June 2016
© Outotec – All rights reserved
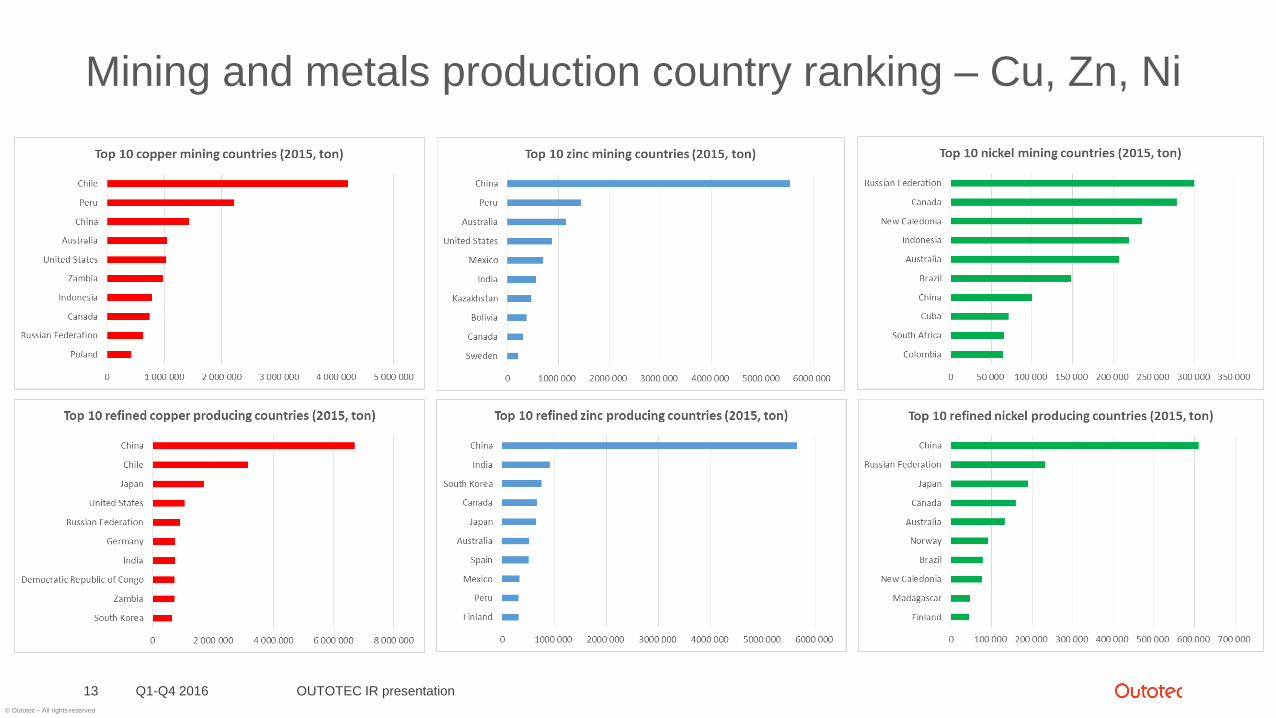
Mining and metals production country ranking – Cu, Zn, Ni
Q1-Q4 2016 OUTOTEC IR presentation13
© Outotec – All rights reserved
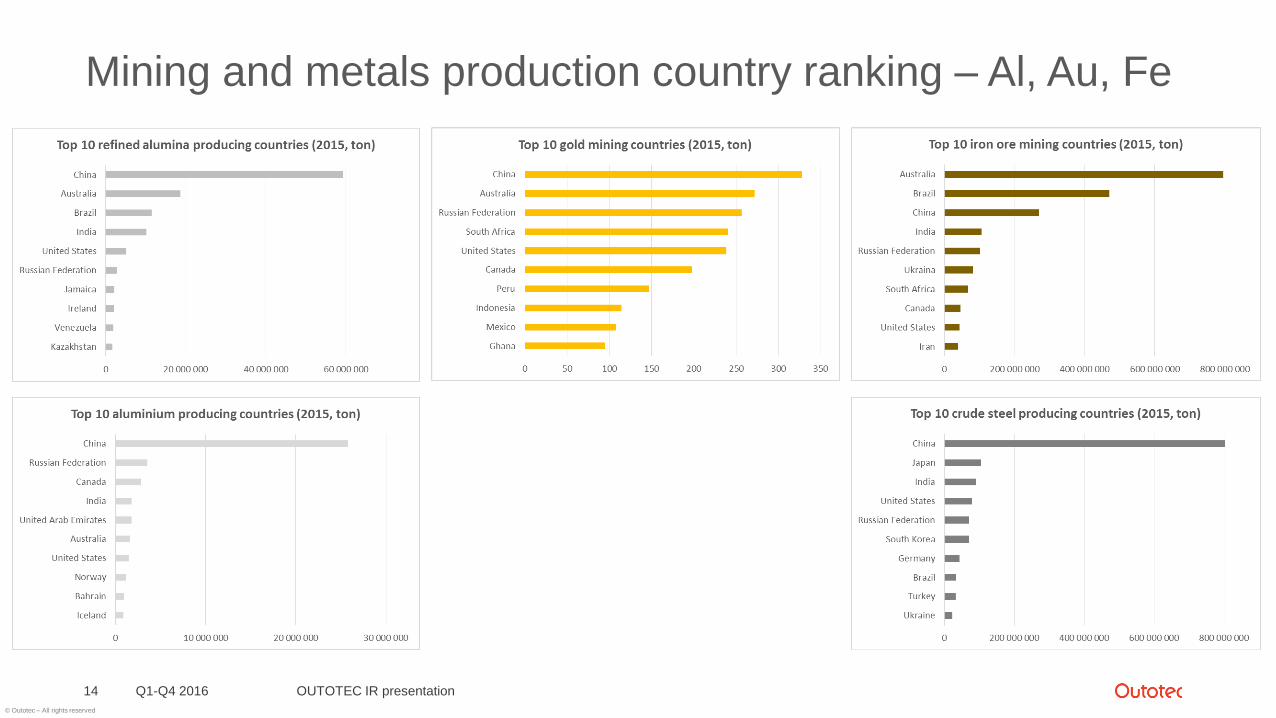
Mining and metals production country ranking – Al, Au, Fe
Q1-Q4 2016 OUTOTEC IR presentation14
© Outotec – All rights reserved
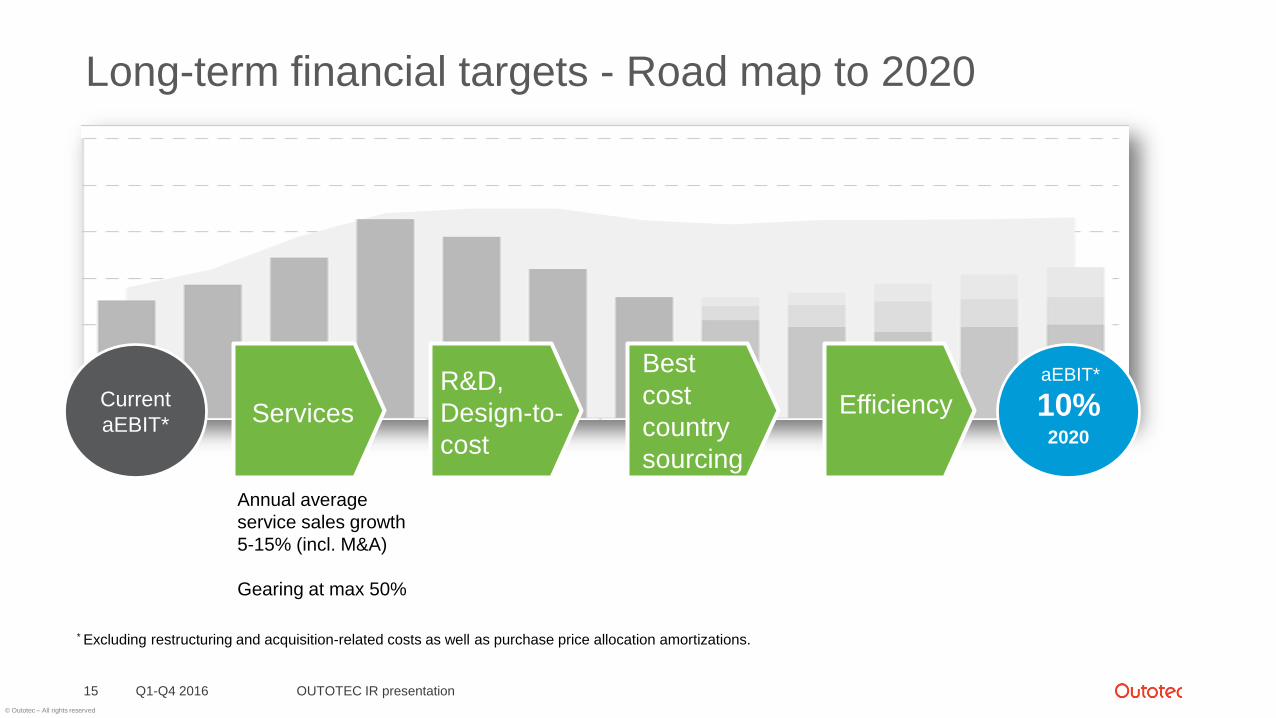
Long-term financial targets - Road map to 2020
Q1-Q4 2016 OUTOTEC IR presentation15
10%2020
Current
aEBIT*
aEBIT*
Services
R&D,
Design-to-
cost
Best
cost
country
sourcing
Efficiency
Annual average
service sales growth
5-15% (incl. M&A)
Gearing at max 50%
* Excluding restructuring and acquisition-related costs as well as purchase price allocation amortizations.
© Outotec – All rights reserved
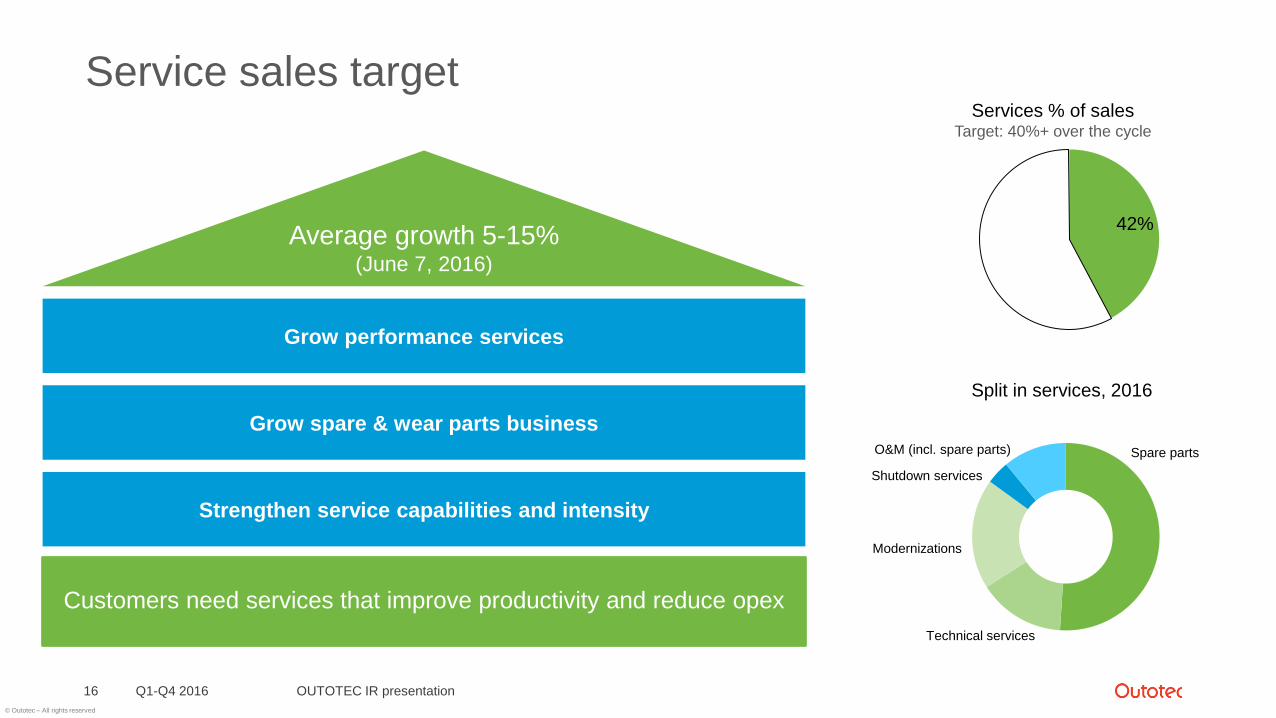
Service sales target
Q1-Q4 2016 OUTOTEC IR presentation16
Grow performance services
Grow spare & wear parts business
Strengthen service capabilities and intensity
Customers need services that improve productivity and reduce opex
Average growth 5-15%(June 7, 2016)
42%
Services % of salesTarget: 40%+ over the cycle
Spare parts
Technical services
Modernizations
Shutdown services
O&M (incl. spare parts)
Split in services, 2016
© Outotec – All rights reserved
Q1-Q4 2016 financial information
Q1-Q4 2016 OUTOTEC IR presentation17
© Outotec – All rights reserved
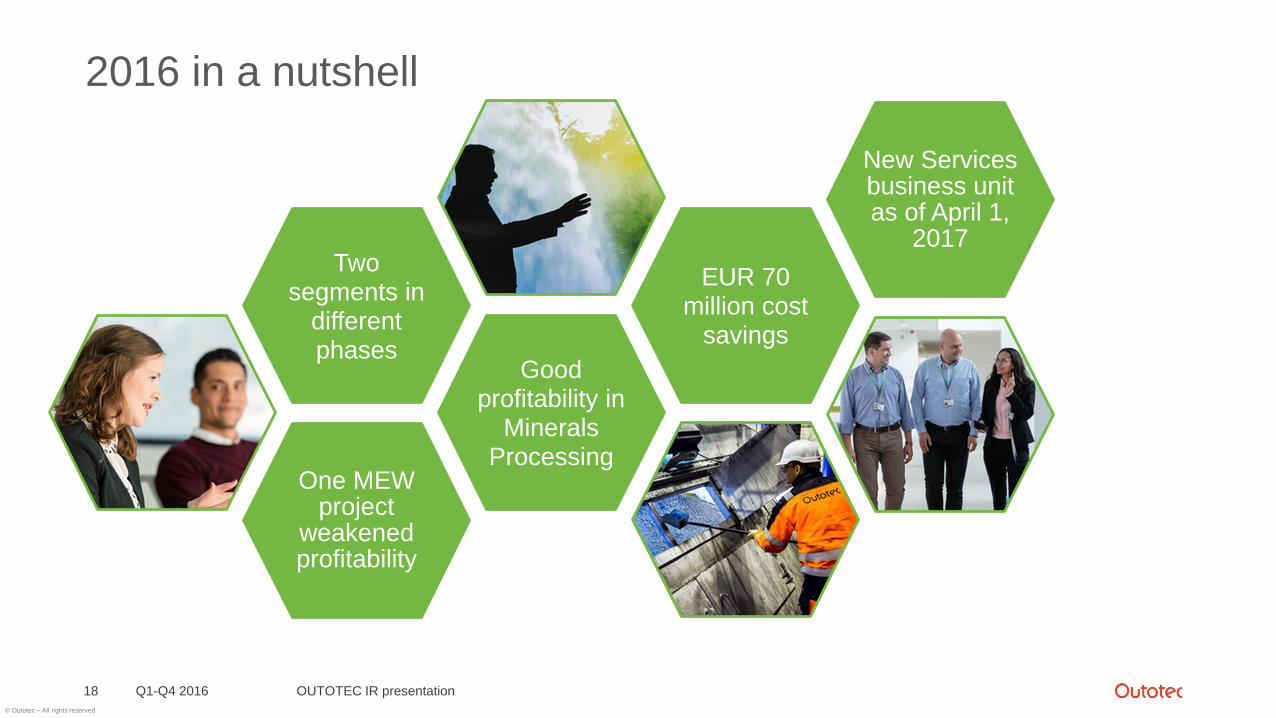
One MEW project
weakenedprofitability
Goodprofitability in
MineralsProcessing
Twosegments in
differentphases
EUR 70 million cost
savings
New Services business unit as of April 1,
2017
2016 in a nutshell
Q1-Q4 2016 OUTOTEC IR presentation18
© Outotec – All rights reserved
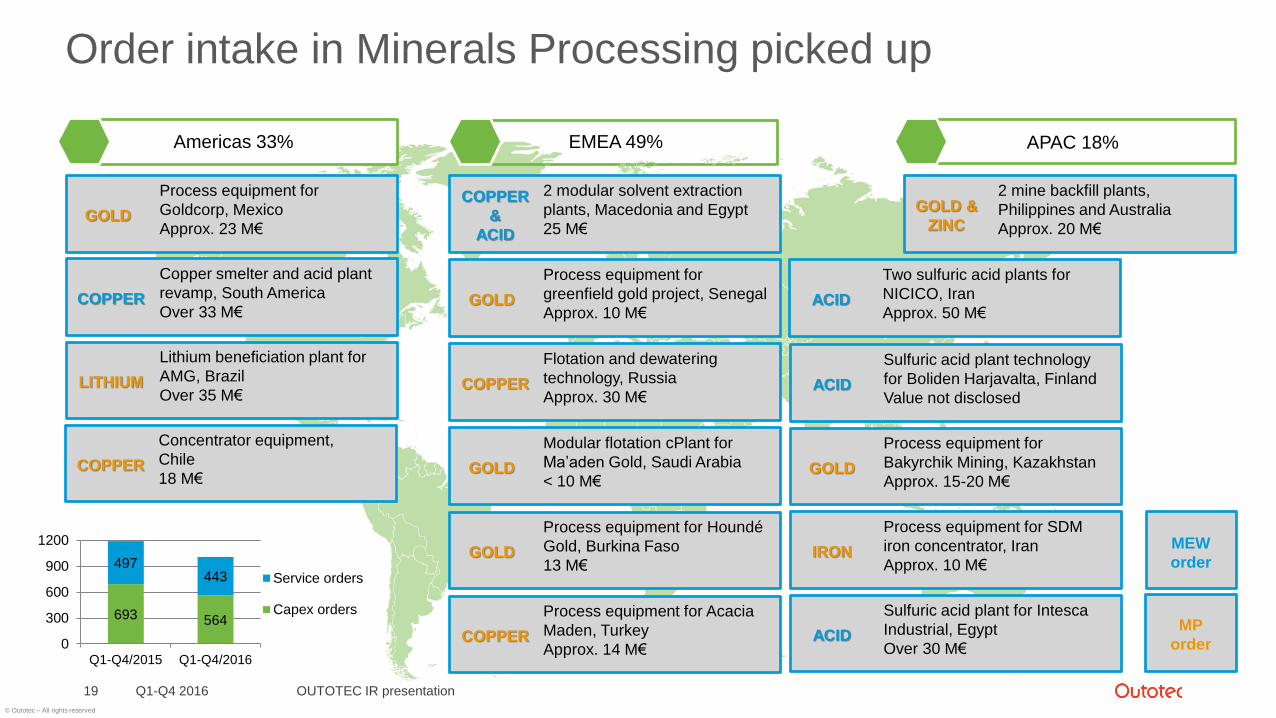
Order intake in Minerals Processing picked up
Q1-Q4 2016 OUTOTEC IR presentation19
Americas 33% EMEA 49% APAC 18%
GOLD
Process equipment for
Goldcorp, Mexico
Approx. 23 M€
COPPER
&
ACID
2 modular solvent extraction
plants, Macedonia and Egypt
25 M€
GOLD &
ZINC
2 mine backfill plants,
Philippines and Australia
Approx. 20 M€
GOLD
Process equipment for
greenfield gold project, Senegal
Approx. 10 M€
COPPER
Flotation and dewatering
technology, Russia
Approx. 30 M€
GOLD
Modular flotation cPlant for
Ma’aden Gold, Saudi Arabia
< 10 M€
COPPER
Copper smelter and acid plant
revamp, South America
Over 33 M€
GOLD
Process equipment for Houndé
Gold, Burkina Faso
13 M€
COPPER
Process equipment for Acacia
Maden, Turkey
Approx. 14 M€
GOLD
Process equipment for
Bakyrchik Mining, Kazakhstan
Approx. 15-20 M€
IRON
Process equipment for SDM
iron concentrator, Iran
Approx. 10 M€
ACID
Sulfuric acid plant for Intesca
Industrial, Egypt
Over 30 M€
ACID
Sulfuric acid plant technology
for Boliden Harjavalta, Finland
Value not disclosed
693 564
497443
0
300
600
900
1200
Q1-Q4/2015 Q1-Q4/2016
Service orders
Capex orders
LITHIUM
Lithium beneficiation plant for
AMG, Brazil
Over 35 M€
COPPER
Concentrator equipment,
Chile
18 M€
MEW
order
MP
order
ACID
Two sulfuric acid plants for
NICICO, Iran
Approx. 50 M€
© Outotec – All rights reserved
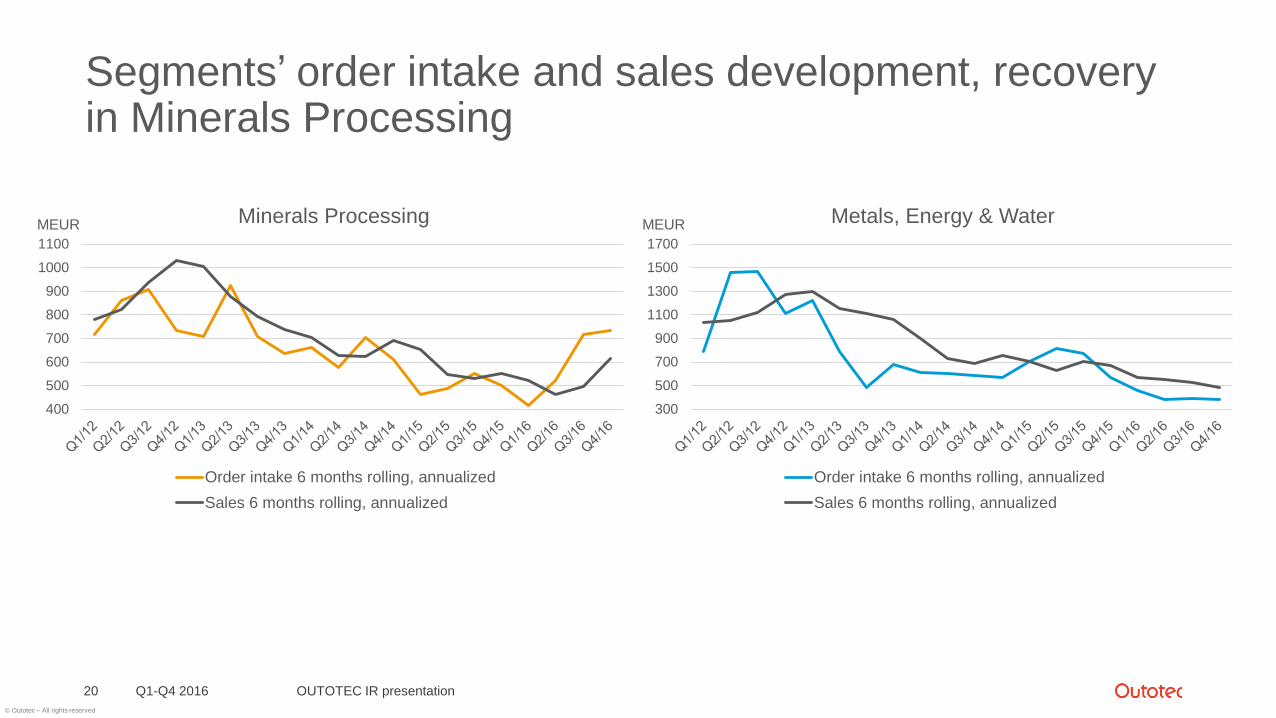
Segments’ order intake and sales development, recoveryin Minerals Processing
Q1-Q4 2016 OUTOTEC IR presentation20
300
500
700
900
1100
1300
1500
1700
Metals, Energy & Water
Order intake 6 months rolling, annualized
Sales 6 months rolling, annualized
MEURMEUR
400
500
600
700
800
900
1000
1100
Minerals Processing
Order intake 6 months rolling, annualized
Sales 6 months rolling, annualized
© Outotec – All rights reserved
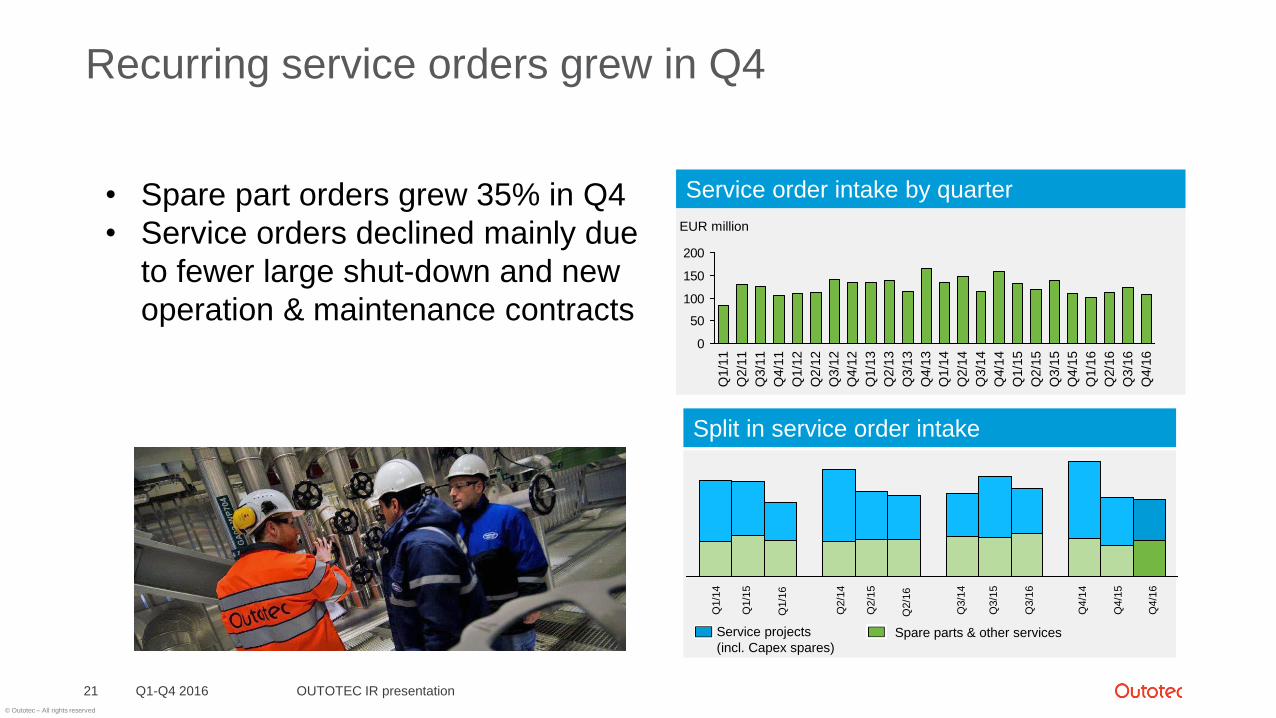
Service order intake by quarter
0
50
100
150
200
Q4/1
6
EUR million
Q3/1
6
Q2/1
6
Q1/1
6
Q4/1
5
Q3/1
5
Q2/1
5
Q1/1
5
Q4/1
4
Q3/1
4
Q2/1
4
Q1/1
4
Q4/1
3
Q3/1
3
Q2/1
3
Q1/1
3
Q4/1
2
Q3/1
2
Q2/1
2
Q1/1
2
Q4/1
1
Q3/1
1
Q2/1
1
Q1/1
1
Recurring service orders grew in Q4
Q1-Q4 2016 OUTOTEC IR presentation21
Split in service order intake
Spare parts & other servicesService projects
(incl. Capex spares)
Q1/1
4
Q1/1
5
Q2/1
4
Q2/1
5
Q3/1
4
Q3/1
5
Q4/1
4
Q4/1
5
Q1/1
6
Q2/1
6
Q3/1
6
Q4/1
6
• Spare part orders grew 35% in Q4
• Service orders declined mainly due
to fewer large shut-down and new
operation & maintenance contracts
© Outotec – All rights reserved
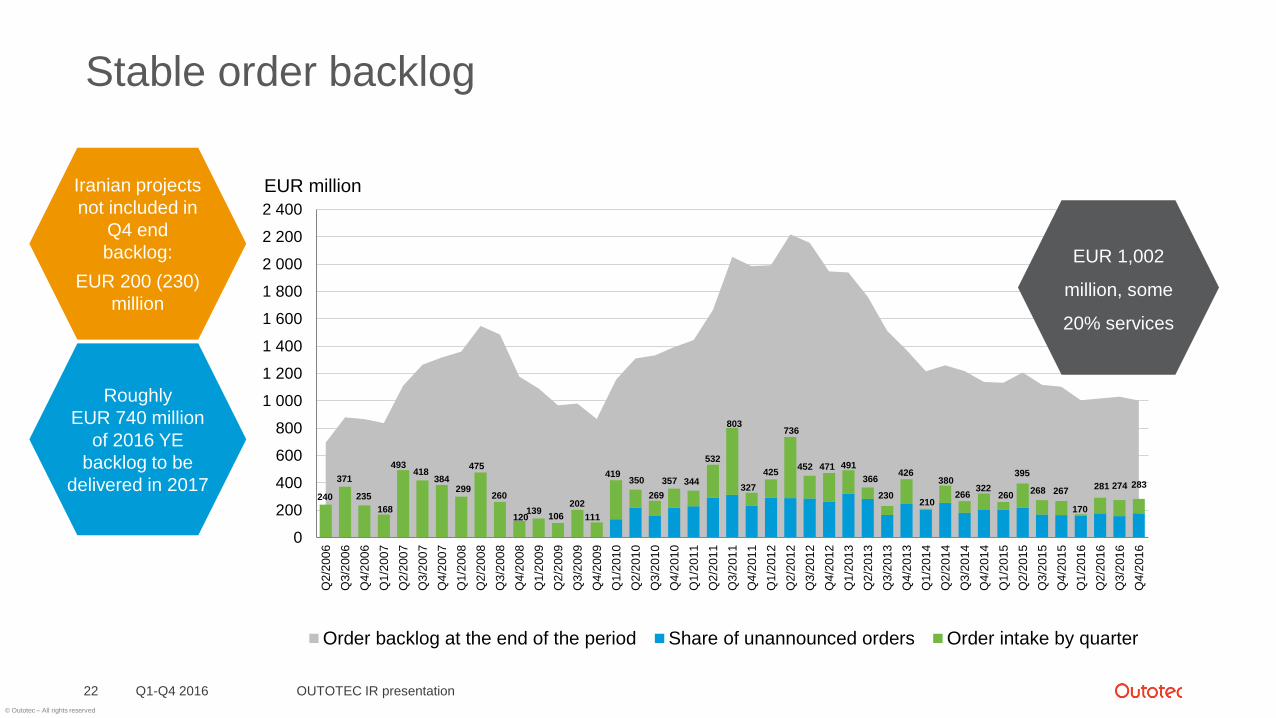
Stable order backlog
Q1-Q4 2016 OUTOTEC IR presentation22
EUR millionIranian projects
not included in
Q4 end
backlog:
EUR 200 (230)
million
240
371
235
168
493418
384299
475
260
120139
106
202
111
419350
269
357 344
532
803
327
425
736
452 471 491
366
230
426
210
380
266322
260
395
268 267
170
281 274 283
0
200
400
600
800
1 000
1 200
1 400
1 600
1 800
2 000
2 200
2 400
Q2
/200
6
Q3
/200
6
Q4
/200
6
Q1
/200
7
Q2
/200
7
Q3
/200
7
Q4
/200
7
Q1
/200
8
Q2
/200
8
Q3
/200
8
Q4
/200
8
Q1
/200
9
Q2
/200
9
Q3
/200
9
Q4
/200
9
Q1
/201
0
Q2
/201
0
Q3
/201
0
Q4
/201
0
Q1
/201
1
Q2
/201
1
Q3
/201
1
Q4
/201
1
Q1
/201
2
Q2
/201
2
Q3
/201
2
Q4
/201
2
Q1
/201
3
Q2
/201
3
Q3
/201
3
Q4
/201
3
Q1
/201
4
Q2
/201
4
Q3
/201
4
Q4
/201
4
Q1
/201
5
Q2
/201
5
Q3
/201
5
Q4
/201
5
Q1
/201
6
Q2
/201
6
Q3
/201
6
Q4
/201
6
Order backlog at the end of the period Share of unannounced orders Order intake by quarter
Roughly
EUR 740 million
of 2016 YE
backlog to be
delivered in 2017
EUR 1,002
million, some
20% services
© Outotec – All rights reserved
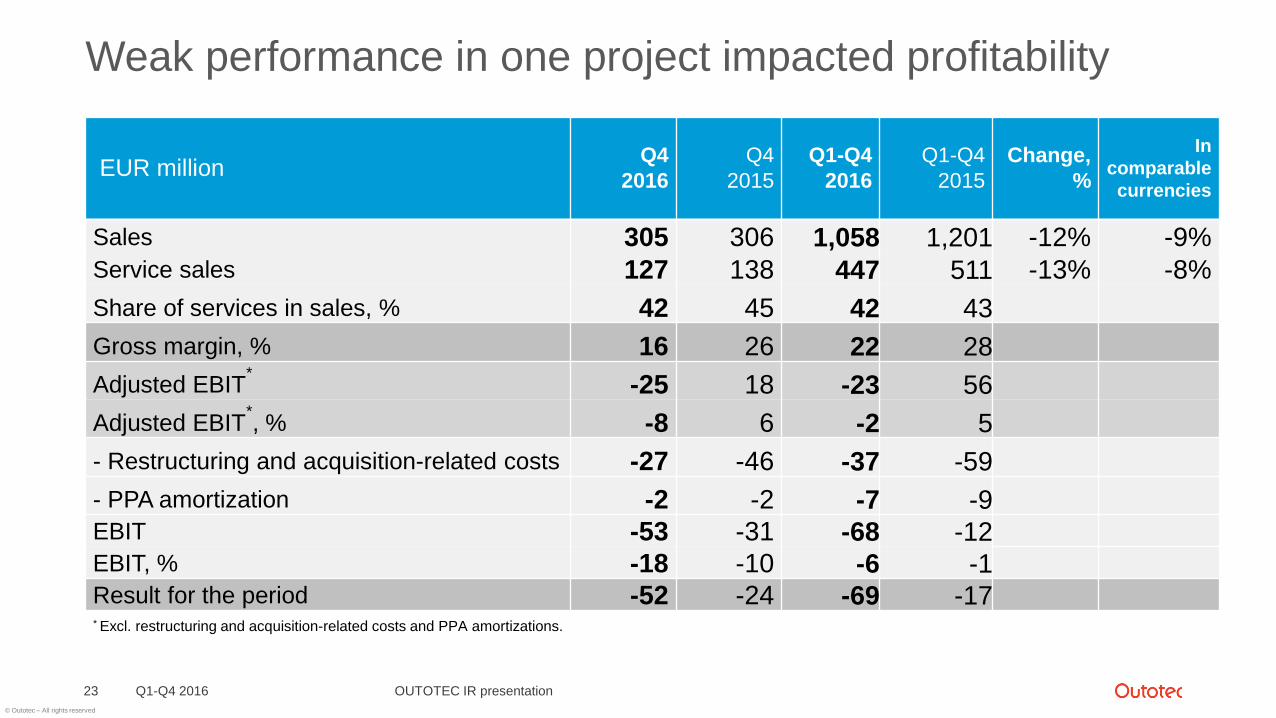
Weak performance in one project impacted profitability
Q1-Q4 2016 OUTOTEC IR presentation23
EUR millionQ4
2016
Q4
2015
Q1-Q4
2016
Q1-Q4
2015
Change,
%
In
comparable
currencies
Sales 305 306 1,058 1,201 -12% -9%
Service sales 127 138 447 511 -13% -8%
Share of services in sales, % 42 45 42 43
Gross margin, % 16 26 22 28
Adjusted EBIT*
-25 18 -23 56
Adjusted EBIT*, % -8 6 -2 5
- Restructuring and acquisition-related costs -27 -46 -37 -59
- PPA amortization -2 -2 -7 -9EBIT -53 -31 -68 -12EBIT, % -18 -10 -6 -1Result for the period -52 -24 -69 -17* Excl. restructuring and acquisition-related costs and PPA amortizations.
© Outotec – All rights reserved
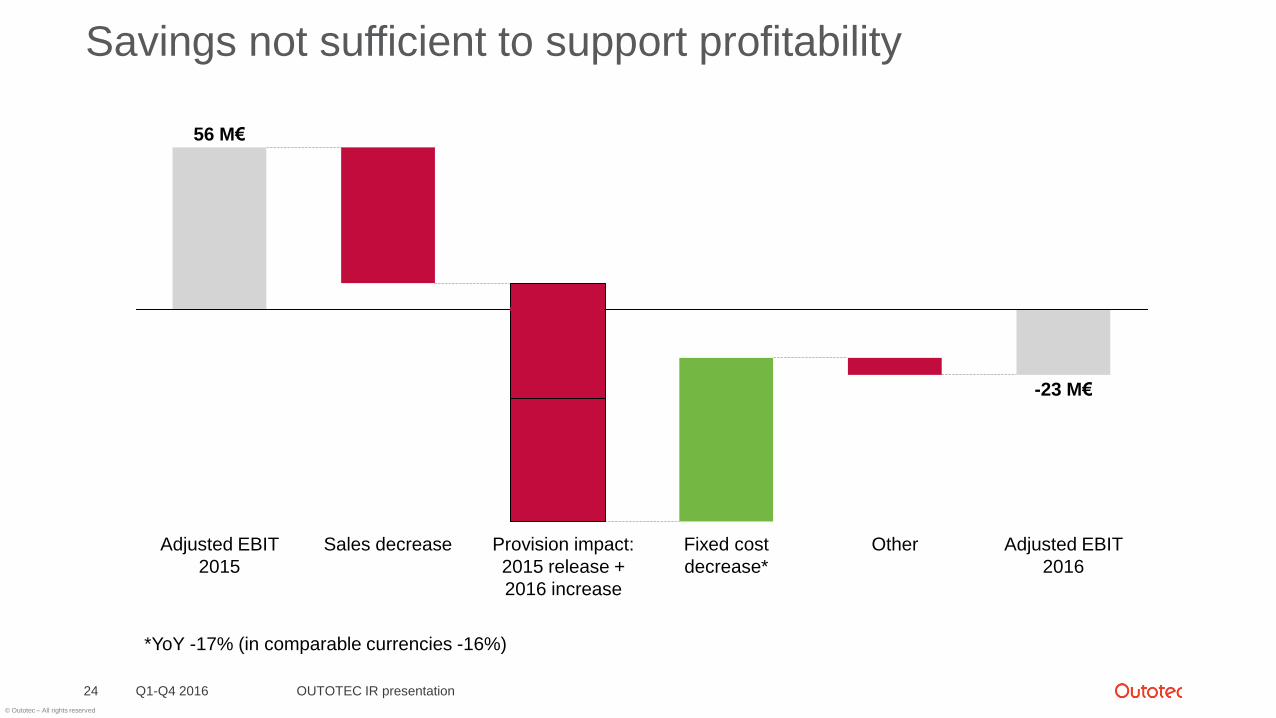
Savings not sufficient to support profitability
Q1-Q4 2016 OUTOTEC IR presentation24
Provision impact:
2015 release +
2016 increase
-23 M€
Fixed cost
decrease*
Other Adjusted EBIT
2016
Sales decreaseAdjusted EBIT
2015
56 M€
*YoY -17% (in comparable currencies -16%)
© Outotec – All rights reserved
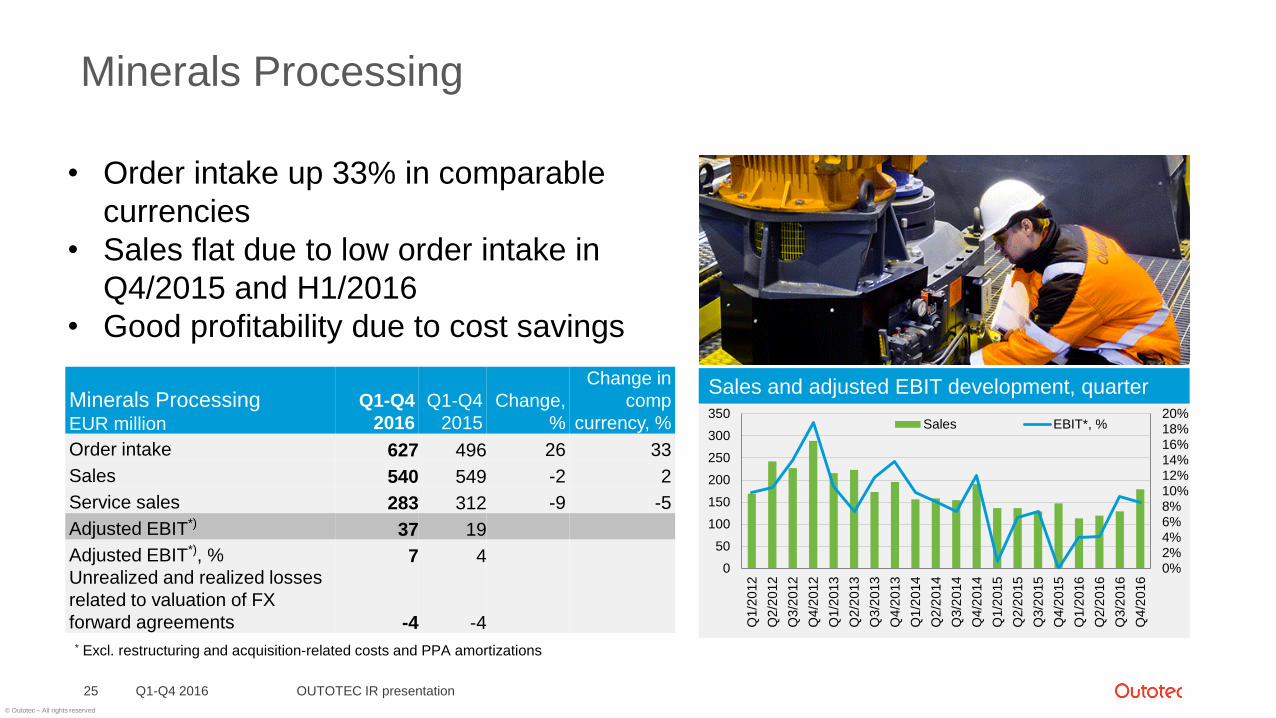
Minerals Processing
Q1-Q4 2016 OUTOTEC IR presentation25
0%2%4%6%8%10%12%14%16%18%20%
0
50
100
150
200
250
300
350
Q1/2
012
Q2/2
012
Q3/2
012
Q4/2
012
Q1/2
013
Q2/2
013
Q3/2
013
Q4/2
013
Q1/2
014
Q2/2
014
Q3/2
014
Q4/2
014
Q1/2
015
Q2/2
015
Q3/2
015
Q4/2
015
Q1/2
016
Q2/2
016
Q3/2
016
Q4/2
016
Sales EBIT*, %
Sales and adjusted EBIT development, quarter
• Order intake up 33% in comparable
currencies
• Sales flat due to low order intake in
Q4/2015 and H1/2016
• Good profitability due to cost savings
Minerals ProcessingEUR million
Q1-Q4
2016
Q1-Q4
2015
Change,
%
Change in
comp
currency, %
Order intake 627 496 26 33
Sales 540 549 -2 2
Service sales 283 312 -9 -5
Adjusted EBIT*) 37 19
Adjusted EBIT*), % 7 4Unrealized and realized losses
related to valuation of FX
forward agreements -4 -4
* Excl. restructuring and acquisition-related costs and PPA amortizations
© Outotec – All rights reserved
-40%
-30%
-20%
-10%
0%
10%
20%
0
50
100
150
200
250
300
350
400
Q1/2
012
Q2/2
012
Q3/2
012
Q4/2
012
Q1/2
013
Q2/2
013
Q3/2
013
Q4/2
013
Q1/2
014
Q2/2
014
Q3/2
014
Q4/2
014
Q1/2
015
Q2/2
015
Q3/2
015
Q4/2
015
Q1/2
016
Q2/2
016
Q3/2
016
Q4/2
016
Sales EBIT*, %
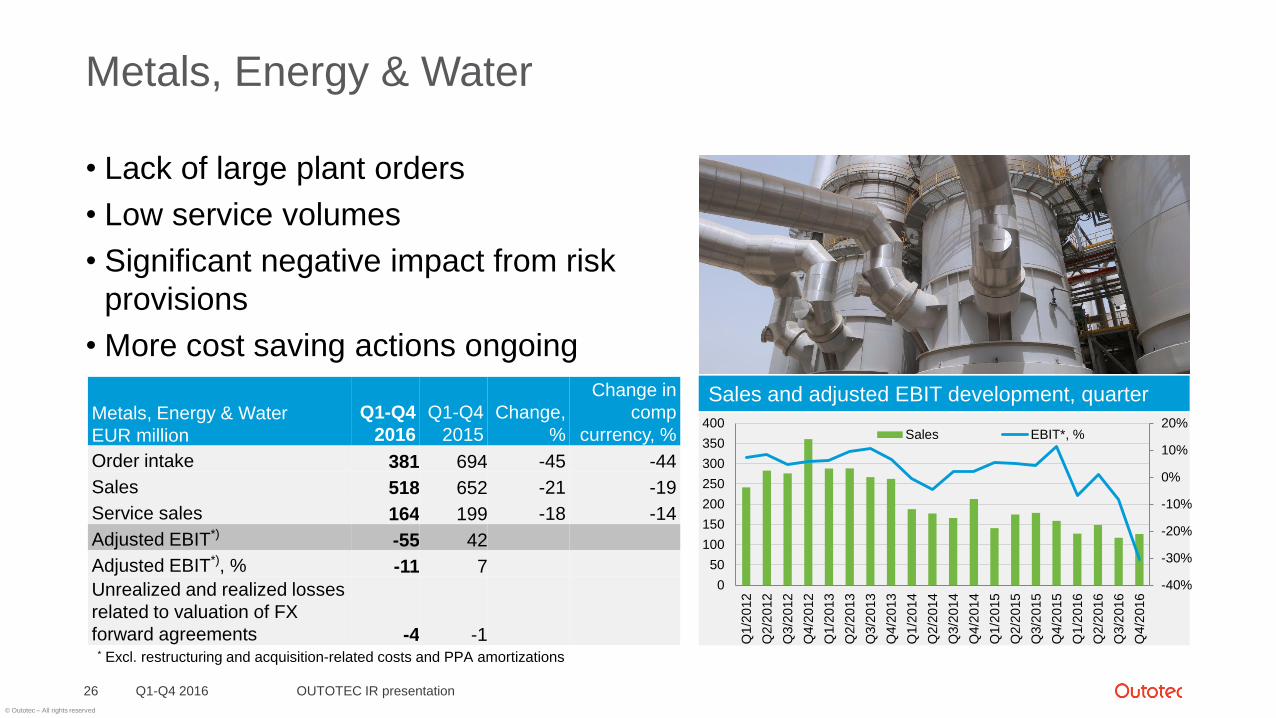
Metals, Energy & Water
• Lack of large plant orders
• Low service volumes
• Significant negative impact from risk
provisions
• More cost saving actions ongoing
Q1-Q4 2016 OUTOTEC IR presentation26
Metals, Energy & Water
EUR million
Q1-Q4
2016
Q1-Q4
2015
Change,
%
Change in
comp
currency, %
Order intake 381 694 -45 -44
Sales 518 652 -21 -19
Service sales 164 199 -18 -14
Adjusted EBIT*) -55 42
Adjusted EBIT*), % -11 7
Unrealized and realized losses
related to valuation of FX
forward agreements -4 -1* Excl. restructuring and acquisition-related costs and PPA amortizations
Sales and adjusted EBIT development, quarter
© Outotec – All rights reserved
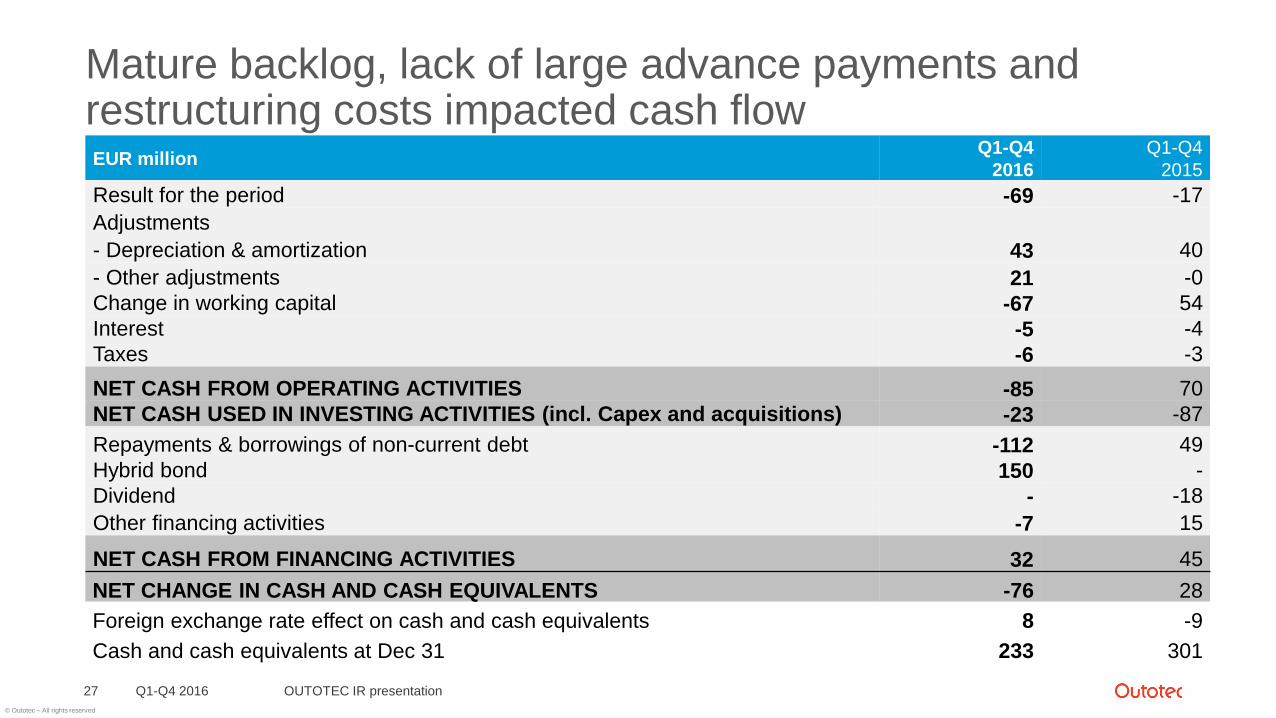
Mature backlog, lack of large advance payments and restructuring costs impacted cash flow
Q1-Q4 2016 OUTOTEC IR presentation27
EUR millionQ1-Q4
2016
Q1-Q4
2015
Result for the period -69 -17
Adjustments
- Depreciation & amortization 43 40
- Other adjustments 21 -0
Change in working capital -67 54
Interest -5 -4
Taxes -6 -3
NET CASH FROM OPERATING ACTIVITIES -85 70
NET CASH USED IN INVESTING ACTIVITIES (incl. Capex and acquisitions) -23 -87
Repayments & borrowings of non-current debt -112 49
Hybrid bond 150 -
Dividend - -18
Other financing activities -7 15
NET CASH FROM FINANCING ACTIVITIES 32 45
NET CHANGE IN CASH AND CASH EQUIVALENTS -76 28
Foreign exchange rate effect on cash and cash equivalents 8 -9
Cash and cash equivalents at Dec 31 233 301
© Outotec – All rights reserved
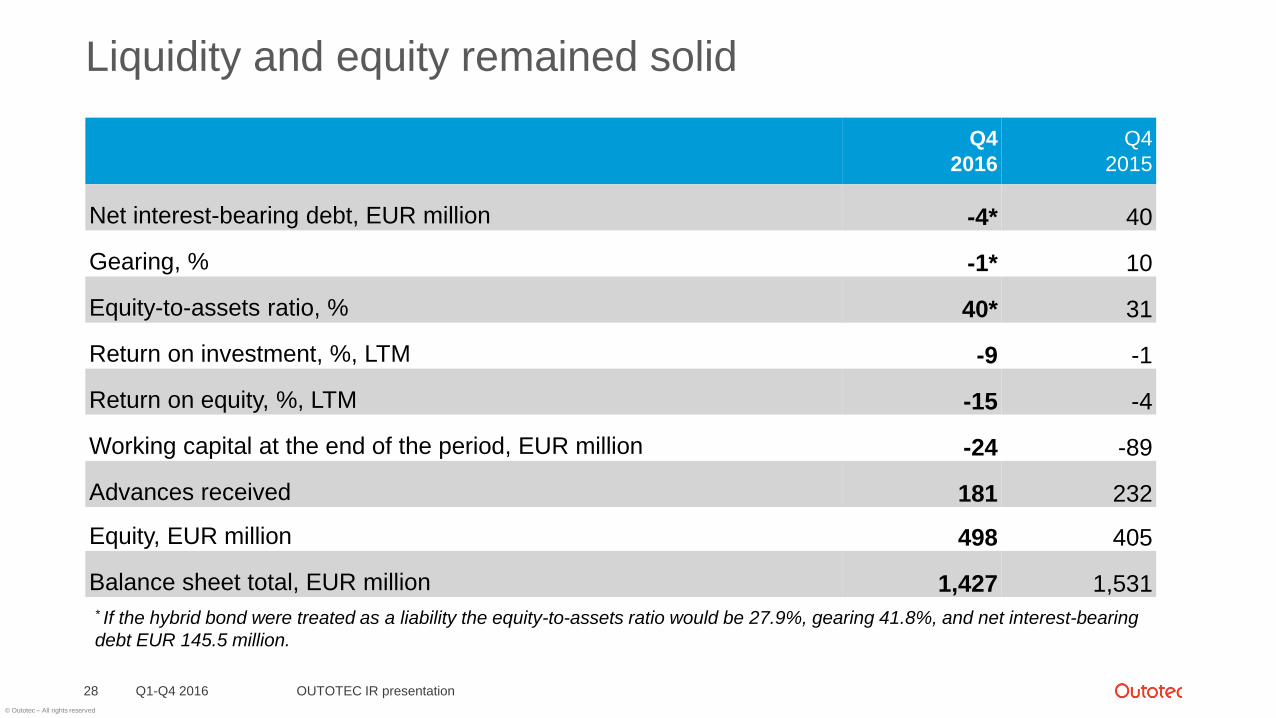
Liquidity and equity remained solid
Q1-Q4 2016 OUTOTEC IR presentation28
Q4
2016
Q4
2015
Net interest-bearing debt, EUR million -4* 40
Gearing, % -1* 10
Equity-to-assets ratio, % 40* 31
Return on investment, %, LTM -9 -1
Return on equity, %, LTM -15 -4
Working capital at the end of the period, EUR million -24 -89
Advances received 181 232
Equity, EUR million 498 405
Balance sheet total, EUR million 1,427 1,531* If the hybrid bond were treated as a liability the equity-to-assets ratio would be 27.9%, gearing 41.8%, and net interest-bearing
debt EUR 145.5 million.
© Outotec – All rights reserved
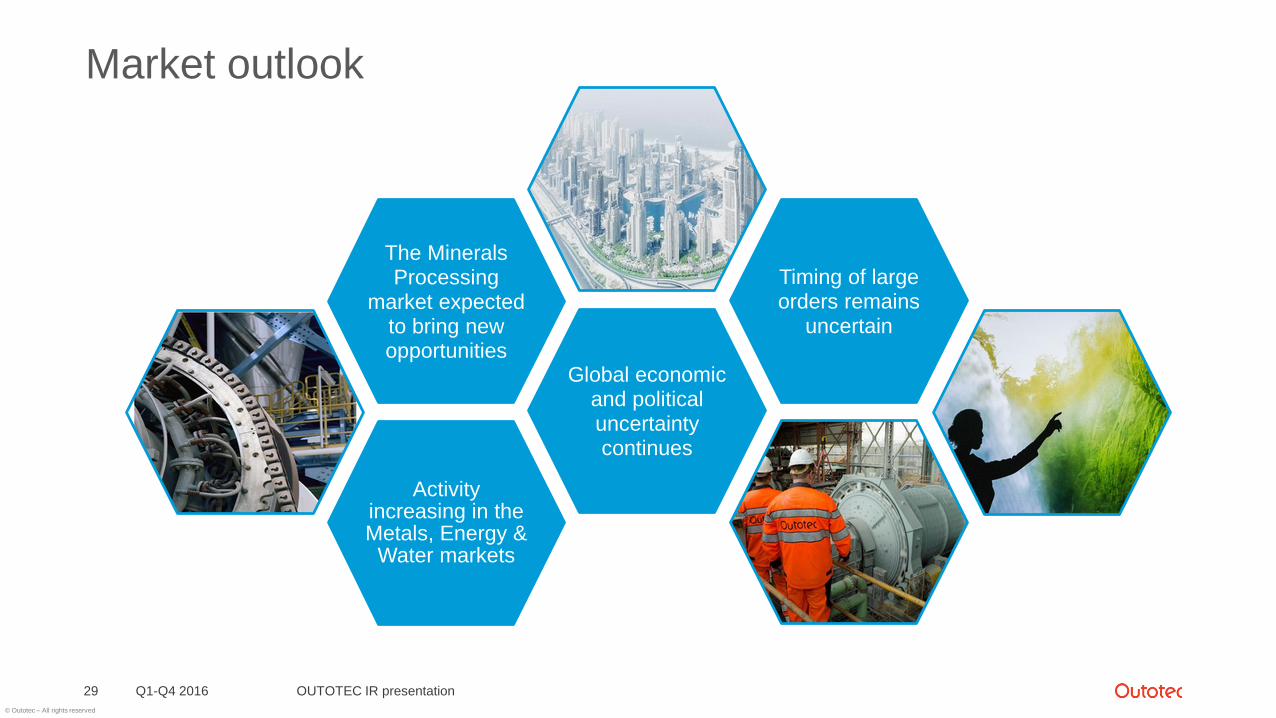
Market outlook
Q1-Q4 2016 OUTOTEC IR presentation29
Activity increasing in theMetals, Energy &
Water markets
Global economicand politicaluncertaintycontinues
The MineralsProcessing
market expectedto bring newopportunities
Timing of largeorders remains
uncertain
© Outotec – All rights reserved
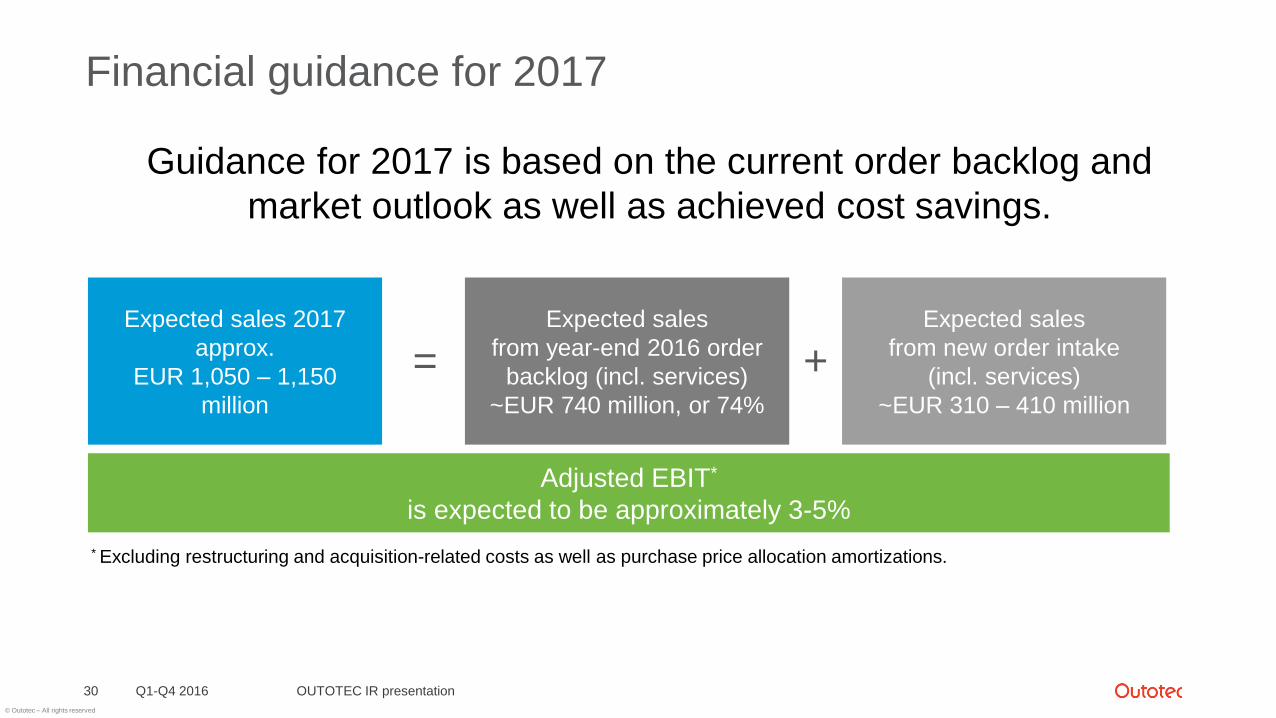
Guidance for 2017 is based on the current order backlog and
market outlook as well as achieved cost savings.
Financial guidance for 2017
Q1-Q4 2016 OUTOTEC IR presentation30
Expected sales
from year-end 2016 order
backlog (incl. services)
~EUR 740 million, or 74%
Expected sales
from new order intake
(incl. services)
~EUR 310 – 410 million
+=Expected sales 2017
approx.
EUR 1,050 – 1,150
million
Adjusted EBIT*
is expected to be approximately 3-5%
* Excluding restructuring and acquisition-related costs as well as purchase price allocation amortizations.
© Outotec – All rights reserved
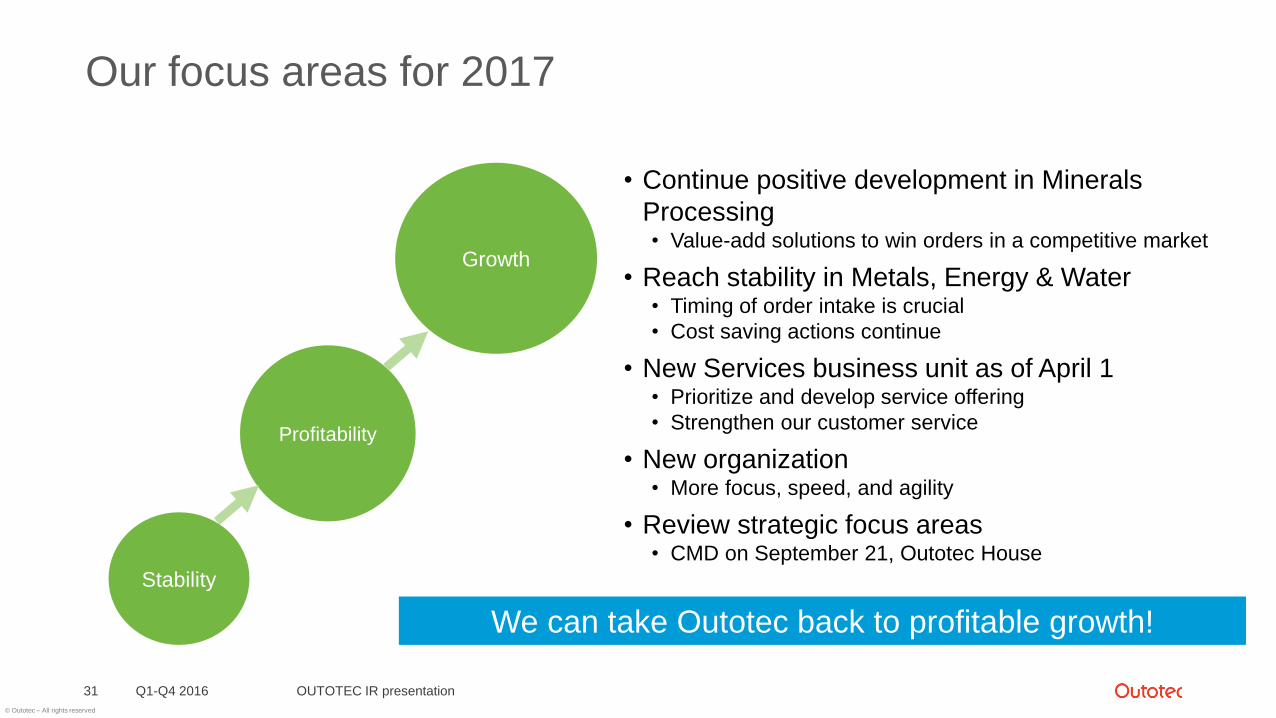
Our focus areas for 2017
Q1-Q4 2016 OUTOTEC IR presentation31
We can take Outotec back to profitable growth!
Stability
Profitability
Growth
• Continue positive development in Minerals
Processing• Value-add solutions to win orders in a competitive market
• Reach stability in Metals, Energy & Water• Timing of order intake is crucial
• Cost saving actions continue
• New Services business unit as of April 1• Prioritize and develop service offering
• Strengthen our customer service
• New organization• More focus, speed, and agility
• Review strategic focus areas• CMD on September 21, Outotec House
© Outotec – All rights reserved
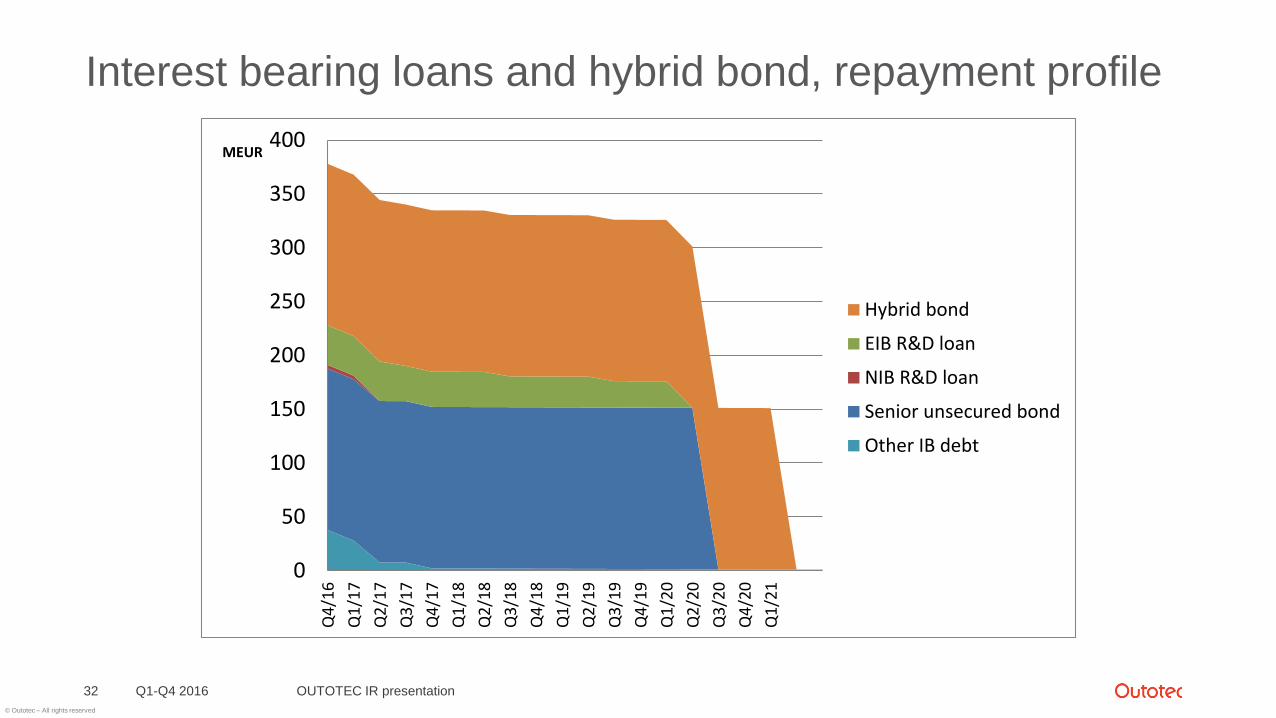
Interest bearing loans and hybrid bond, repayment profile
Q1-Q4 2016 OUTOTEC IR presentation32
0
50
100
150
200
250
300
350
400
Q4
/16
Q1
/17
Q2
/17
Q3
/17
Q4
/17
Q1
/18
Q2
/18
Q3
/18
Q4
/18
Q1
/19
Q2
/19
Q3
/19
Q4
/19
Q1
/20
Q2
/20
Q3
/20
Q4
/20
Q1
/21
MEUR
Hybrid bond
EIB R&D loan
NIB R&D loan
Senior unsecured bond
Other IB debt
© Outotec – All rights reserved
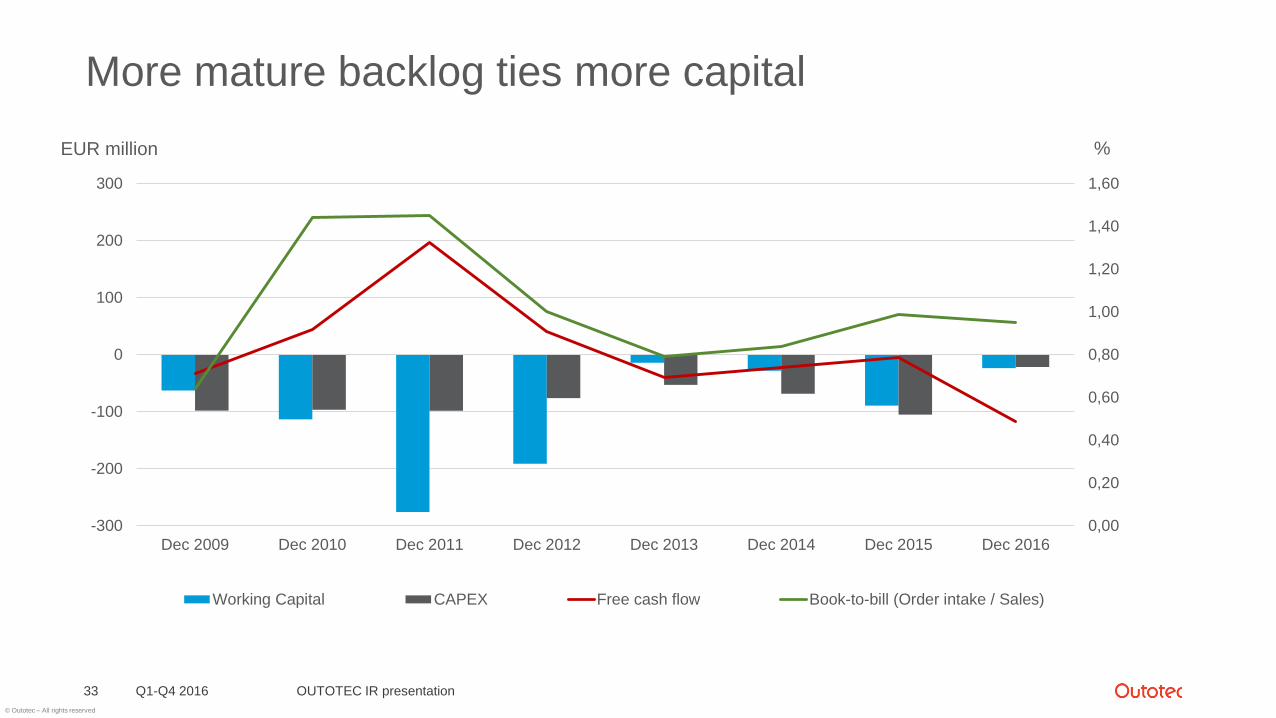
More mature backlog ties more capital
Q1-Q4 2016 OUTOTEC IR presentation33
0,00
0,20
0,40
0,60
0,80
1,00
1,20
1,40
1,60
-300
-200
-100
0
100
200
300
Dec 2009 Dec 2010 Dec 2011 Dec 2012 Dec 2013 Dec 2014 Dec 2015 Dec 2016
Working Capital CAPEX Free cash flow Book-to-bill (Order intake / Sales)
EUR million %
© Outotec – All rights reserved
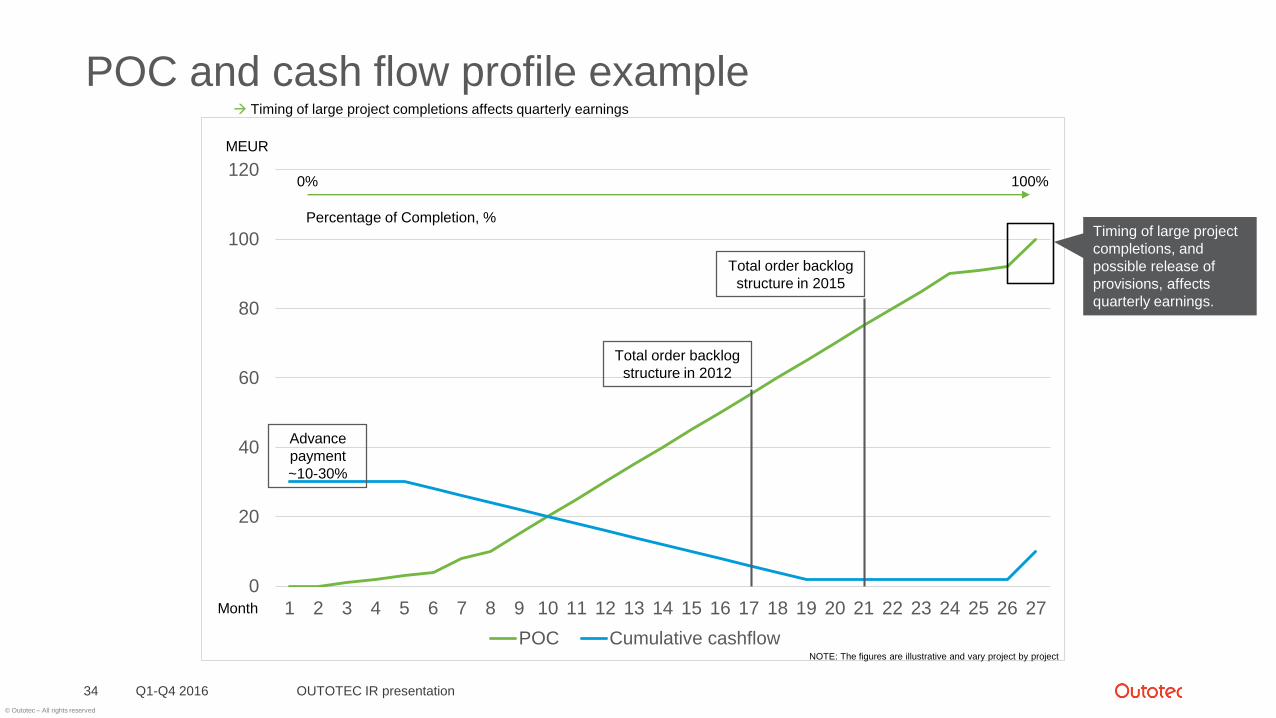
POC and cash flow profile example
Q1-Q4 2016 OUTOTEC IR presentation34
0
20
40
60
80
100
120
1 2 3 4 5 6 7 8 9 10 11 12 13 14 15 16 17 18 19 20 21 22 23 24 25 26 27
POC Cumulative cashflow
MEUR
Month
Total order backlog
structure in 2012
Total order backlog
structure in 2015
0% 100%
Percentage of Completion, %Timing of large project
completions, and
possible release of
provisions, affects
quarterly earnings.
Advance
payment
~10-30%
NOTE: The figures are illustrative and vary project by project
Timing of large project completions affects quarterly earnings
© Outotec – All rights reserved
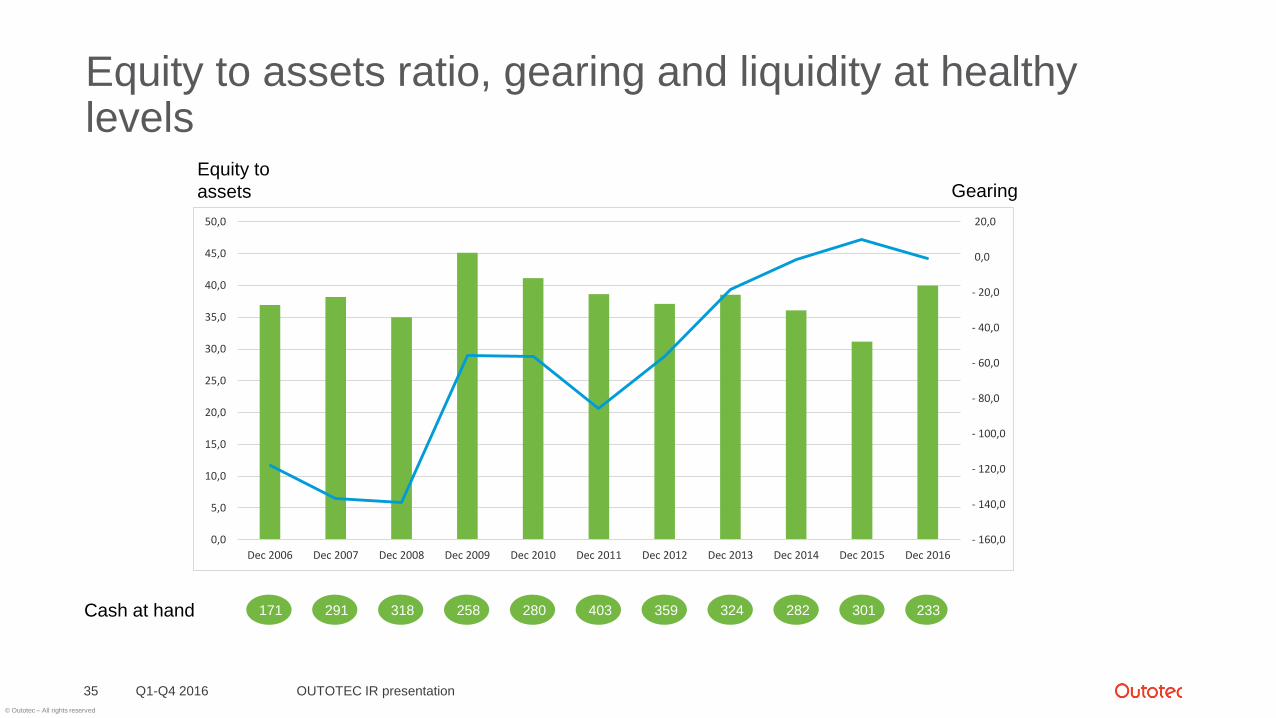
Equity to assets ratio, gearing and liquidity at healthylevels
Q1-Q4 2016 OUTOTEC IR presentation35
171 291 318 258 280 403 359 324 282 301 Cash at hand
Equity to
assets Gearing
233
- 160,0
- 140,0
- 120,0
- 100,0
- 80,0
- 60,0
- 40,0
- 20,0
0,0
20,0
0,0
5,0
10,0
15,0
20,0
25,0
30,0
35,0
40,0
45,0
50,0
Dec 2006 Dec 2007 Dec 2008 Dec 2009 Dec 2010 Dec 2011 Dec 2012 Dec 2013 Dec 2014 Dec 2015 Dec 2016
© Outotec – All rights reserved
Customer solutions
Q1-Q4 2016 OUTOTEC IR presentation36
© Outotec – All rights reserved
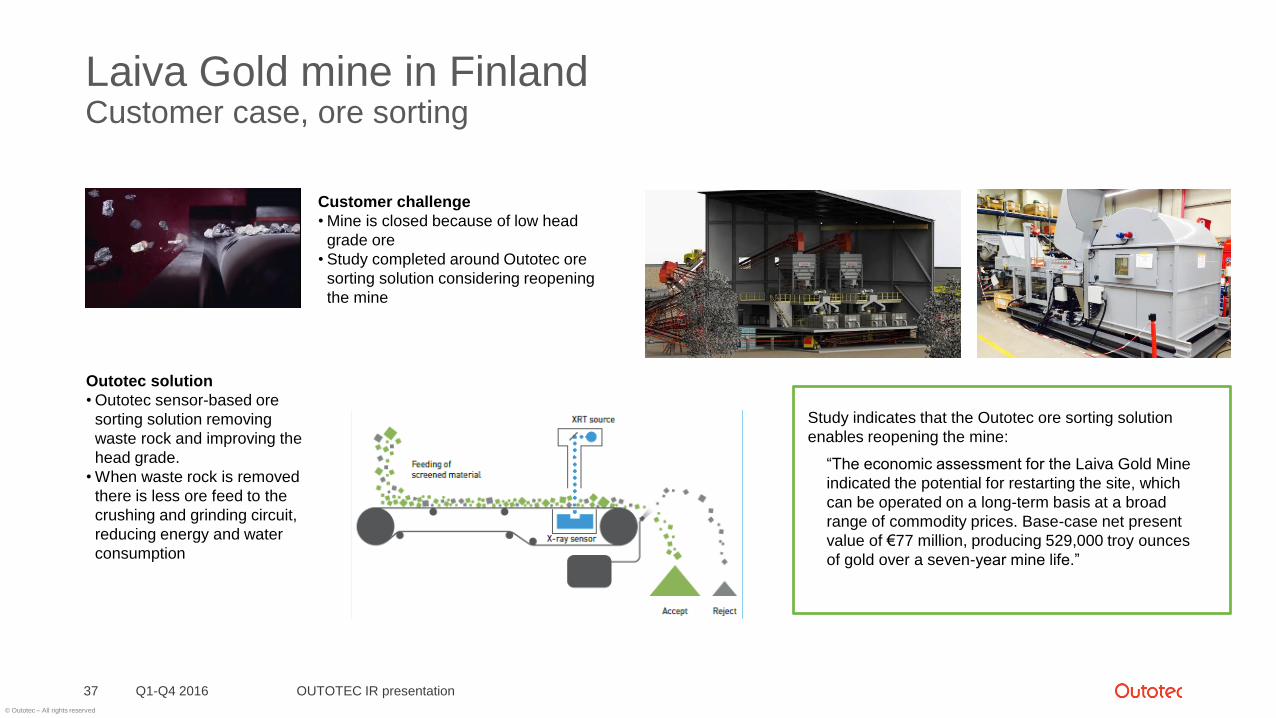
Laiva Gold mine in FinlandCustomer case, ore sorting
Q1-Q4 2016 OUTOTEC IR presentation37
Outotec solution
• Outotec sensor-based ore
sorting solution removing
waste rock and improving the
head grade.
• When waste rock is removed
there is less ore feed to the
crushing and grinding circuit,
reducing energy and water
consumption
Customer challenge
• Mine is closed because of low head
grade ore
• Study completed around Outotec ore
sorting solution considering reopening
the mine
Study indicates that the Outotec ore sorting solution
enables reopening the mine:
“The economic assessment for the Laiva Gold Mine
indicated the potential for restarting the site, which
can be operated on a long-term basis at a broad
range of commodity prices. Base-case net present
value of €77 million, producing 529,000 troy ounces
of gold over a seven-year mine life.”
© Outotec – All rights reserved
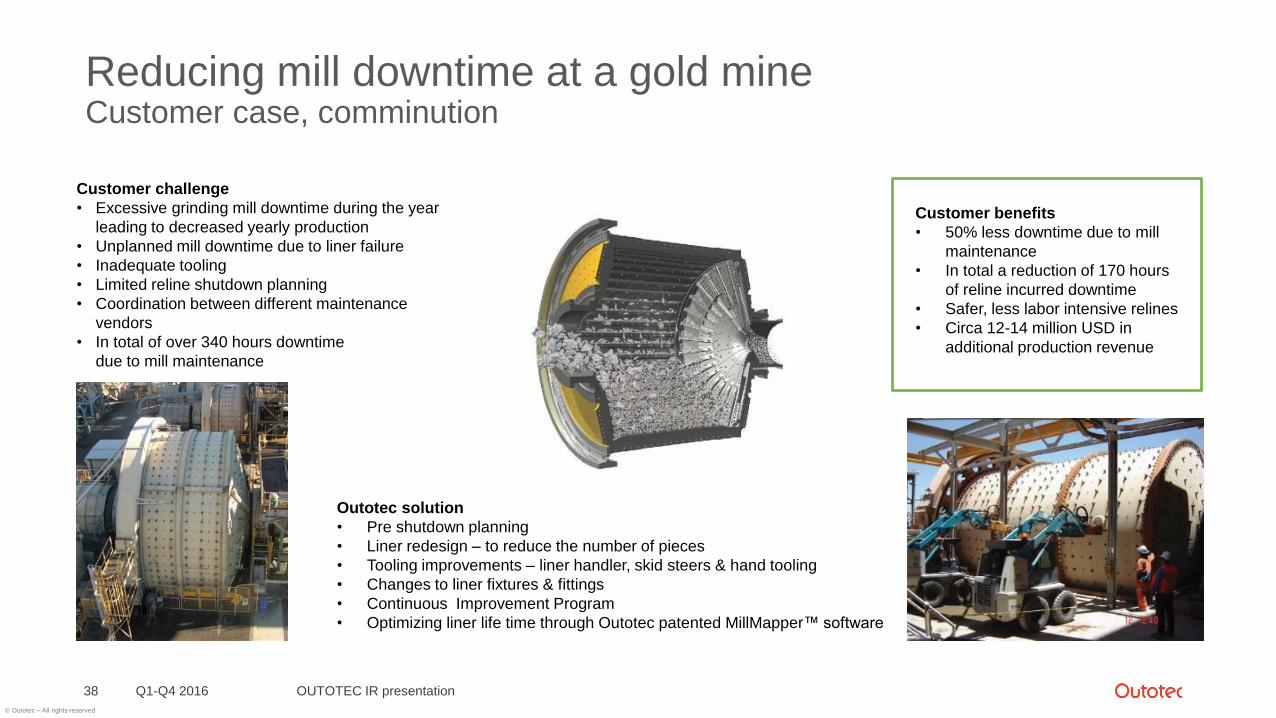
Reducing mill downtime at a gold mineCustomer case, comminution
Q1-Q4 2016 OUTOTEC IR presentation38
Customer challenge
• Excessive grinding mill downtime during the year
leading to decreased yearly production
• Unplanned mill downtime due to liner failure
• Inadequate tooling
• Limited reline shutdown planning
• Coordination between different maintenance
vendors
• In total of over 340 hours downtime
due to mill maintenance
Outotec solution
• Pre shutdown planning
• Liner redesign – to reduce the number of pieces
• Tooling improvements – liner handler, skid steers & hand tooling
• Changes to liner fixtures & fittings
• Continuous Improvement Program
• Optimizing liner life time through Outotec patented MillMapper™ software
Customer benefits
• 50% less downtime due to mill
maintenance
• In total a reduction of 170 hours
of reline incurred downtime
• Safer, less labor intensive relines
• Circa 12-14 million USD in
additional production revenue
© Outotec – All rights reserved
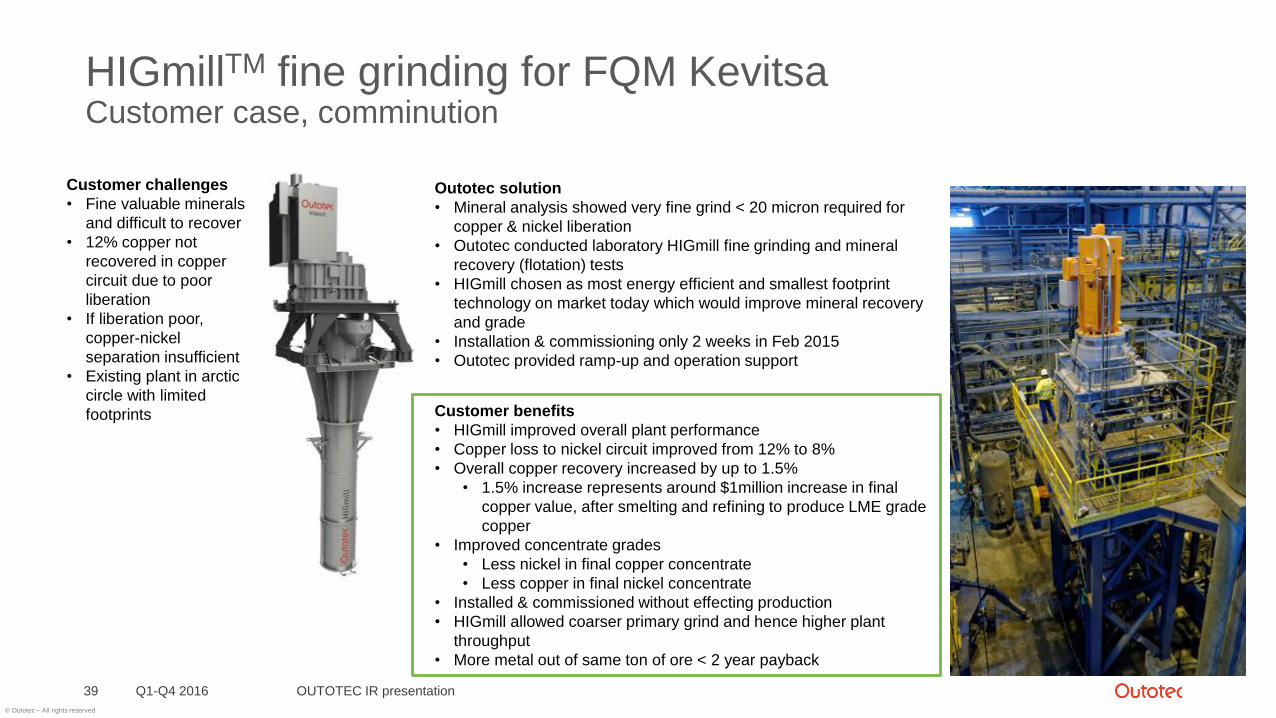
HIGmillTM fine grinding for FQM KevitsaCustomer case, comminution
Customer challenges
• Fine valuable minerals
and difficult to recover
• 12% copper not
recovered in copper
circuit due to poor
liberation
• If liberation poor,
copper-nickel
separation insufficient
• Existing plant in arctic
circle with limited
footprints
Q1-Q4 2016 OUTOTEC IR presentation39
Outotec solution
• Mineral analysis showed very fine grind < 20 micron required for
copper & nickel liberation
• Outotec conducted laboratory HIGmill fine grinding and mineral
recovery (flotation) tests
• HIGmill chosen as most energy efficient and smallest footprint
technology on market today which would improve mineral recovery
and grade
• Installation & commissioning only 2 weeks in Feb 2015
• Outotec provided ramp-up and operation support
Customer benefits
• HIGmill improved overall plant performance
• Copper loss to nickel circuit improved from 12% to 8%
• Overall copper recovery increased by up to 1.5%
• 1.5% increase represents around $1million increase in final
copper value, after smelting and refining to produce LME grade
copper
• Improved concentrate grades
• Less nickel in final copper concentrate
• Less copper in final nickel concentrate
• Installed & commissioned without effecting production
• HIGmill allowed coarser primary grind and hence higher plant
throughput
• More metal out of same ton of ore < 2 year payback
© Outotec – All rights reserved
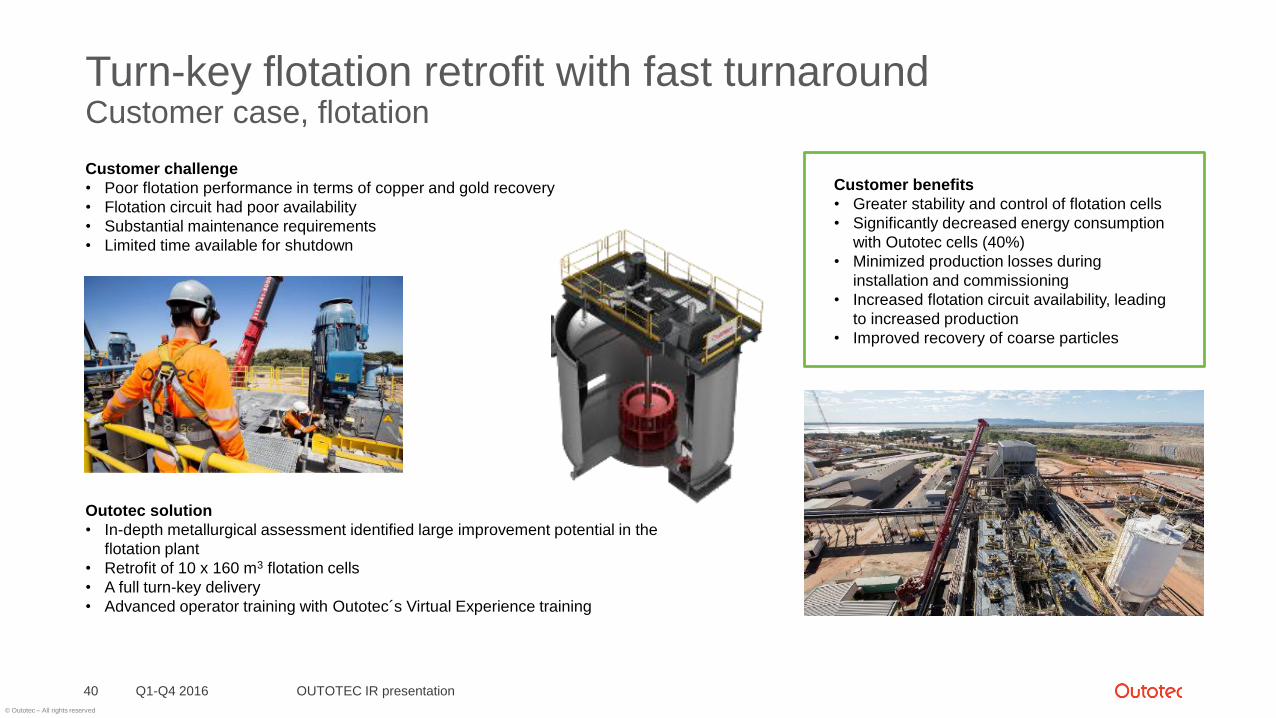
Turn-key flotation retrofit with fast turnaroundCustomer case, flotation
Customer challenge
• Poor flotation performance in terms of copper and gold recovery
• Flotation circuit had poor availability
• Substantial maintenance requirements
• Limited time available for shutdown
Q1-Q4 2016 OUTOTEC IR presentation40
Customer benefits
• Greater stability and control of flotation cells
• Significantly decreased energy consumption
with Outotec cells (40%)
• Minimized production losses during
installation and commissioning
• Increased flotation circuit availability, leading
to increased production
• Improved recovery of coarse particles
Outotec solution
• In-depth metallurgical assessment identified large improvement potential in the
flotation plant
• Retrofit of 10 x 160 m3 flotation cells
• A full turn-key delivery
• Advanced operator training with Outotec´s Virtual Experience training
© Outotec – All rights reserved
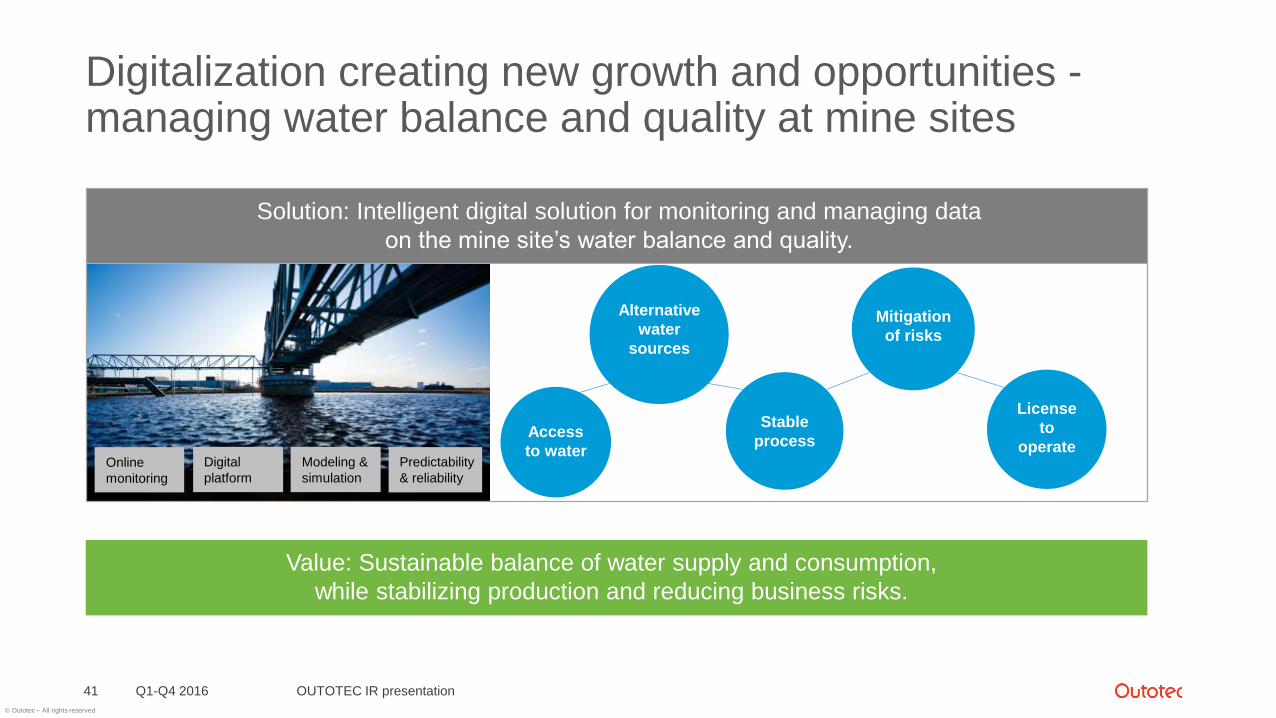
Digitalization creating new growth and opportunities -managing water balance and quality at mine sites
Q1-Q4 2016 OUTOTEC IR presentation41
Solution: Intelligent digital solution for monitoring and managing data
on the mine site’s water balance and quality.
Value: Sustainable balance of water supply and consumption,
while stabilizing production and reducing business risks.
Online
monitoring
Digital
platform
Modeling &
simulation
Predictability
& reliability
Access
to water
Alternative
water
sources
Stable
process
Mitigation
of risks
License
to
operate
© Outotec – All rights reserved
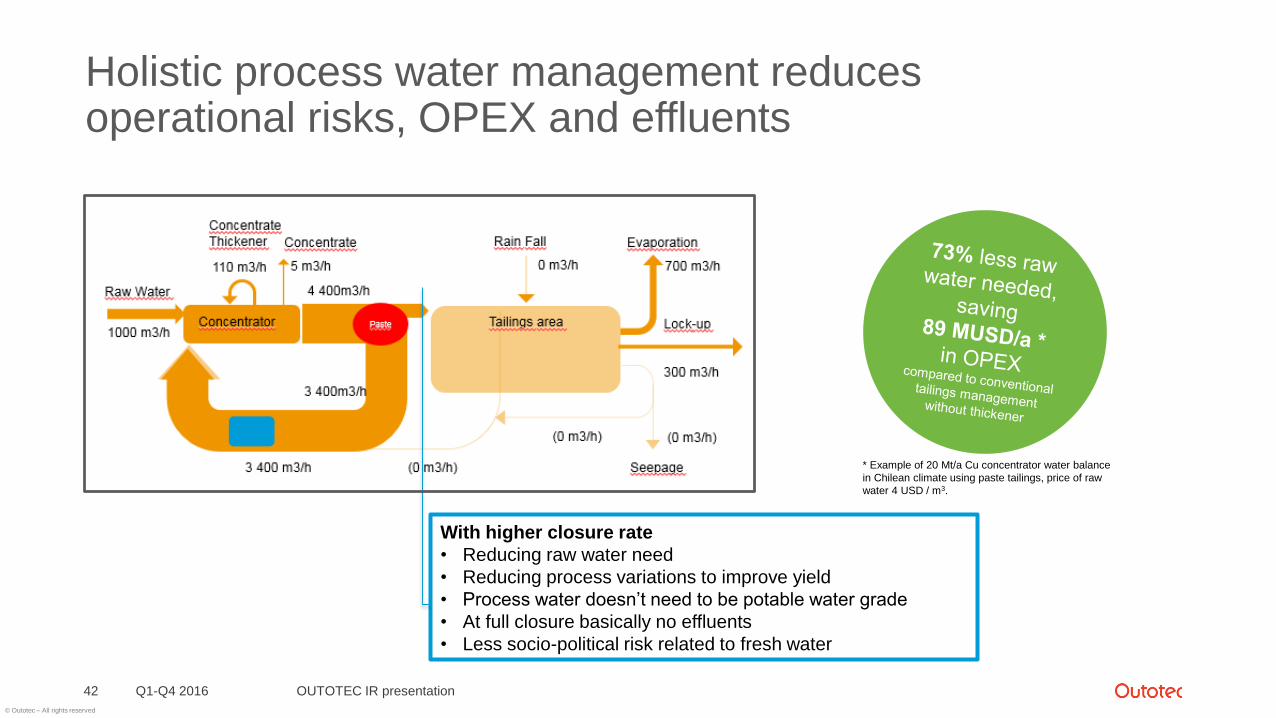
Holistic process water management reduces operational risks, OPEX and effluents
Q1-Q4 201642
With higher closure rate
• Reducing raw water need
• Reducing process variations to improve yield
• Process water doesn’t need to be potable water grade
• At full closure basically no effluents
• Less socio-political risk related to fresh water
OUTOTEC IR presentation
* Example of 20 Mt/a Cu concentrator water balance
in Chilean climate using paste tailings, price of raw
water 4 USD / m3.
© Outotec – All rights reserved
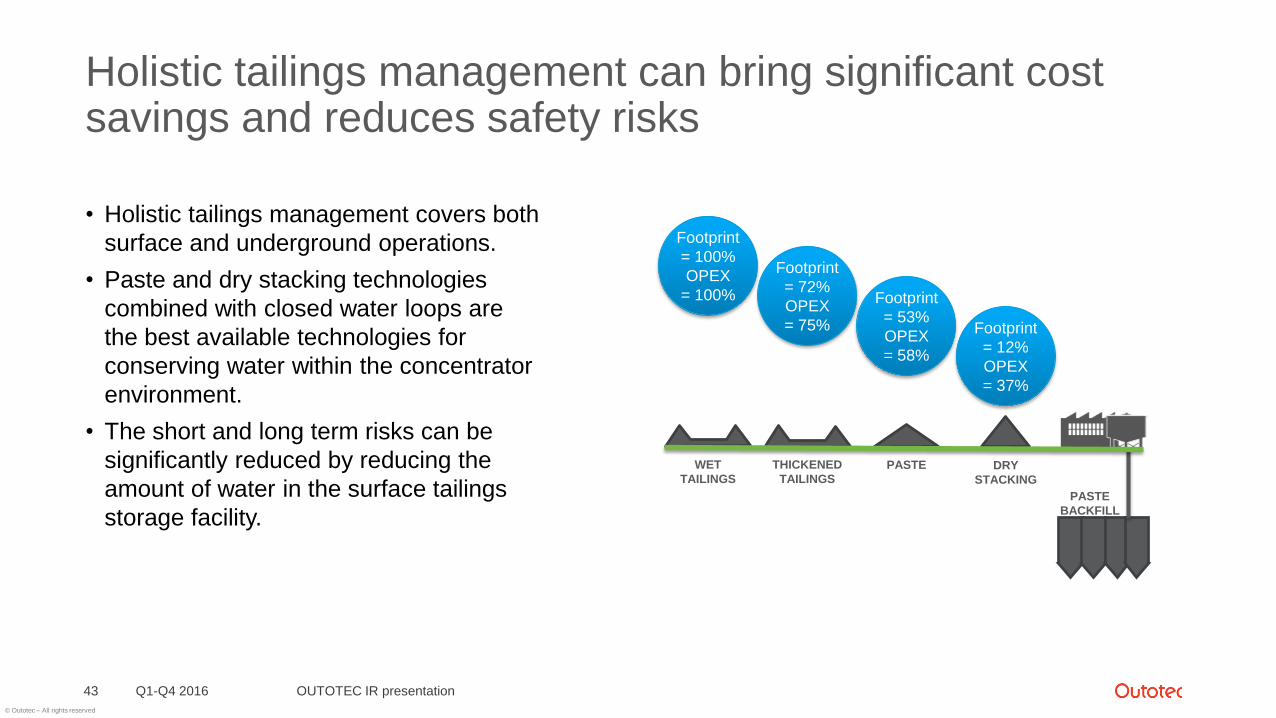
Holistic tailings management can bring significant cost savings and reduces safety risks
• Holistic tailings management covers both
surface and underground operations.
• Paste and dry stacking technologies
combined with closed water loops are
the best available technologies for
conserving water within the concentrator
environment.
• The short and long term risks can be
significantly reduced by reducing the
amount of water in the surface tailings
storage facility.
Q1-Q4 2016 OUTOTEC IR presentation43
PASTE
BACKFILL
DRY
STACKING
Footprint
= 12%
OPEX
= 37%
PASTE
Footprint
= 53%
OPEX
= 58%
THICKENED
TAILINGS
Footprint
= 72%
OPEX
= 75%
WET
TAILINGS
Footprint
= 100%
OPEX
= 100%
© Outotec – All rights reserved
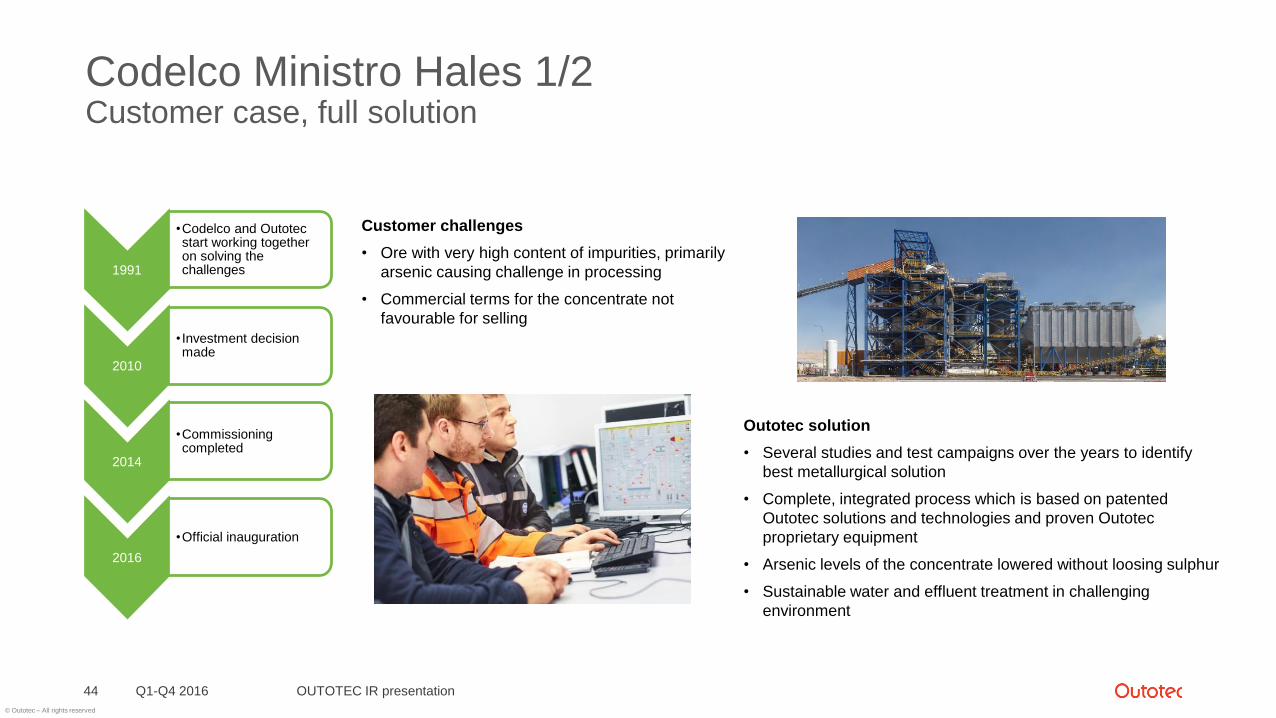
Codelco Ministro Hales 1/2Customer case, full solution
Q1-Q4 201644
Customer challenges
• Ore with very high content of impurities, primarily
arsenic causing challenge in processing
• Commercial terms for the concentrate not
favourable for selling
OUTOTEC IR presentation
Outotec solution
• Several studies and test campaigns over the years to identify
best metallurgical solution
• Complete, integrated process which is based on patented
Outotec solutions and technologies and proven Outotec
proprietary equipment
• Arsenic levels of the concentrate lowered without loosing sulphur
• Sustainable water and effluent treatment in challenging
environment
1991
•Codelco and Outotec start working together on solving the challenges
2010
• Investment decisionmade
2014
•Commissioningcompleted
2016
•Official inauguration
© Outotec – All rights reserved
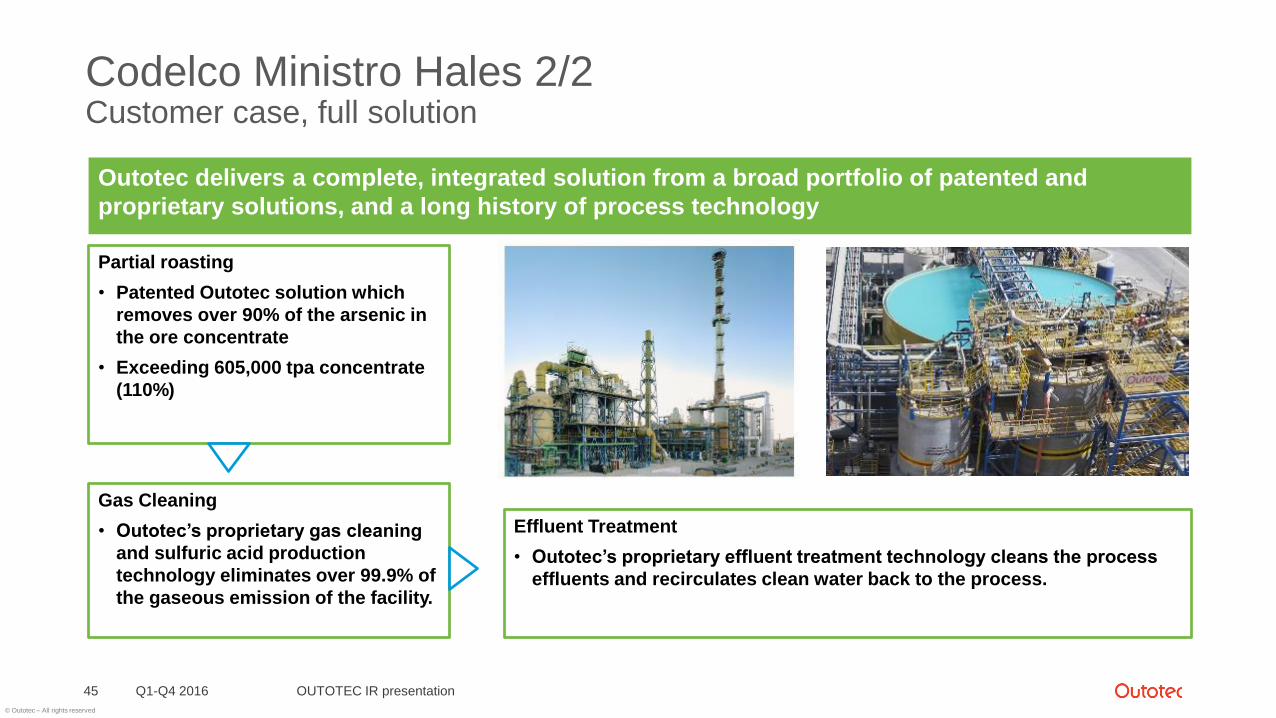
Codelco Ministro Hales 2/2Customer case, full solution
Q1-Q4 2016 OUTOTEC IR presentation45
Partial roasting
• Patented Outotec solution which
removes over 90% of the arsenic in
the ore concentrate
• Exceeding 605,000 tpa concentrate
(110%)
Gas Cleaning
• Outotec’s proprietary gas cleaning
and sulfuric acid production
technology eliminates over 99.9% of
the gaseous emission of the facility.
Effluent Treatment
• Outotec’s proprietary effluent treatment technology cleans the process
effluents and recirculates clean water back to the process.
Outotec delivers a complete, integrated solution from a broad portfolio of patented and
proprietary solutions, and a long history of process technology
© Outotec – All rights reserved
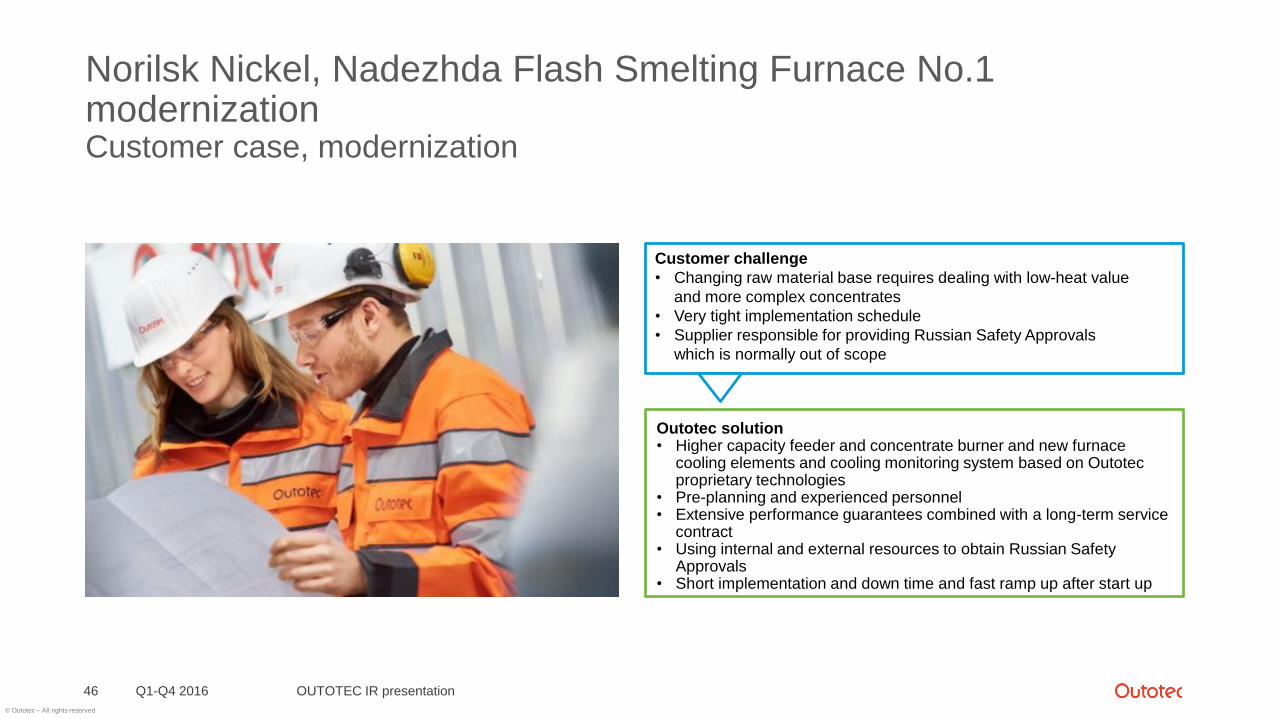
Norilsk Nickel, Nadezhda Flash Smelting Furnace No.1 modernizationCustomer case, modernization
Q1-Q4 201646 OUTOTEC IR presentation
Customer challenge
• Changing raw material base requires dealing with low-heat value
and more complex concentrates
• Very tight implementation schedule
• Supplier responsible for providing Russian Safety Approvals
which is normally out of scope
Outotec solution• Higher capacity feeder and concentrate burner and new furnace
cooling elements and cooling monitoring system based on Outotec proprietary technologies
• Pre-planning and experienced personnel• Extensive performance guarantees combined with a long-term service
contract• Using internal and external resources to obtain Russian Safety
Approvals• Short implementation and down time and fast ramp up after start up
© Outotec – All rights reserved
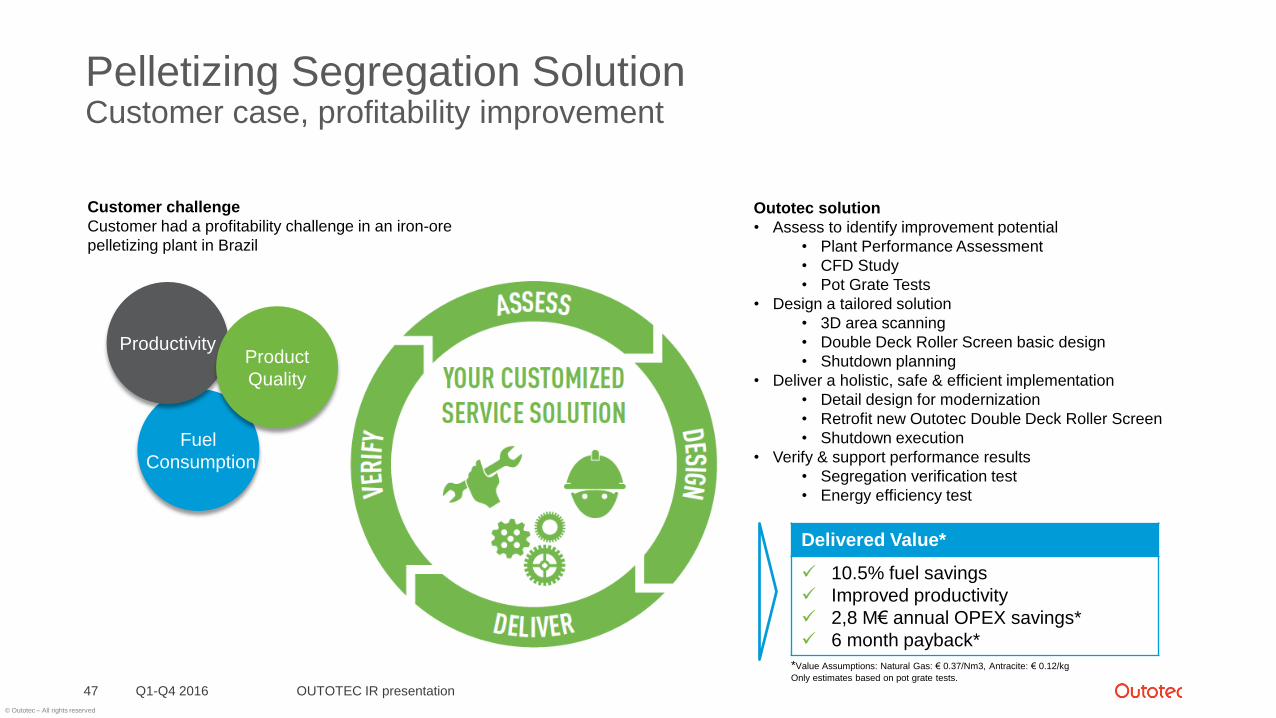
Pelletizing Segregation SolutionCustomer case, profitability improvement
OUTOTEC IR presentationQ1-Q4 201647
Customer challenge
Customer had a profitability challenge in an iron-ore
pelletizing plant in Brazil
Fuel
Consumption
ProductivityProduct
Quality
Outotec solution
• Assess to identify improvement potential
• Plant Performance Assessment
• CFD Study
• Pot Grate Tests
• Design a tailored solution
• 3D area scanning
• Double Deck Roller Screen basic design
• Shutdown planning
• Deliver a holistic, safe & efficient implementation
• Detail design for modernization
• Retrofit new Outotec Double Deck Roller Screen
• Shutdown execution
• Verify & support performance results
• Segregation verification test
• Energy efficiency test
Delivered Value*
10.5% fuel savings
Improved productivity
2,8 M€ annual OPEX savings*
6 month payback*
*Value Assumptions: Natural Gas: € 0.37/Nm3, Antracite: € 0.12/kg
Only estimates based on pot grate tests.
© Outotec – All rights reserved
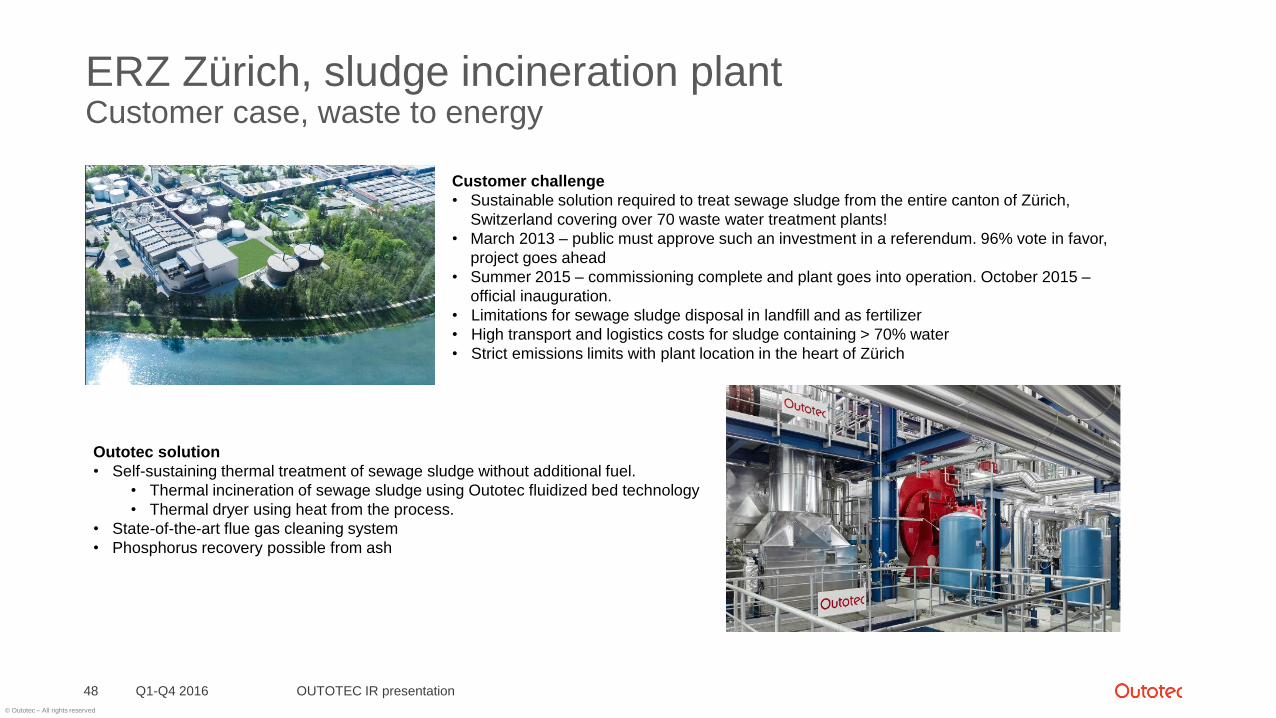
ERZ Zürich, sludge incineration plantCustomer case, waste to energy
Q1-Q4 201648
Customer challenge
• Sustainable solution required to treat sewage sludge from the entire canton of Zürich,
Switzerland covering over 70 waste water treatment plants!
• March 2013 – public must approve such an investment in a referendum. 96% vote in favor,
project goes ahead
• Summer 2015 – commissioning complete and plant goes into operation. October 2015 –
official inauguration.
• Limitations for sewage sludge disposal in landfill and as fertilizer
• High transport and logistics costs for sludge containing > 70% water
• Strict emissions limits with plant location in the heart of Zürich
OUTOTEC IR presentation
Outotec solution
• Self-sustaining thermal treatment of sewage sludge without additional fuel.
• Thermal incineration of sewage sludge using Outotec fluidized bed technology
• Thermal dryer using heat from the process.
• State-of-the-art flue gas cleaning system
• Phosphorus recovery possible from ash
© Outotec – All rights reserved
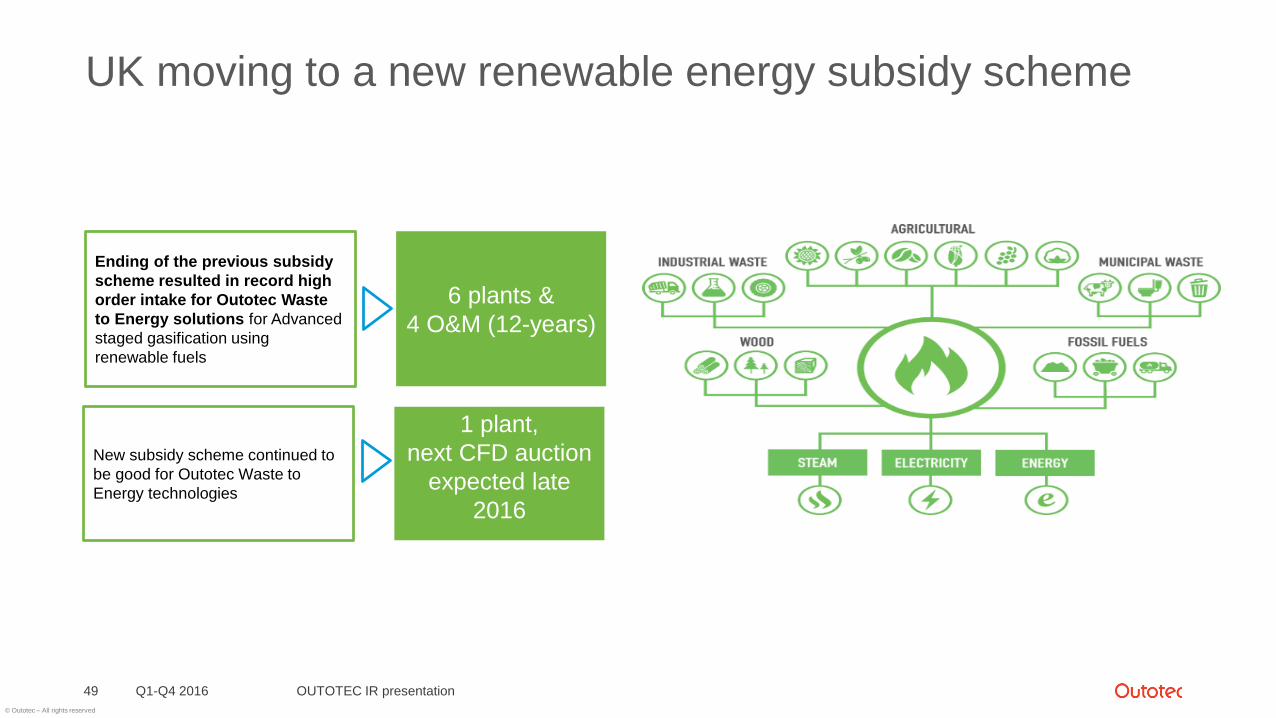
UK moving to a new renewable energy subsidy scheme
Q1-Q4 2016 OUTOTEC IR presentation49
Ending of the previous subsidy
scheme resulted in record high
order intake for Outotec Waste
to Energy solutions for Advanced
staged gasification using
renewable fuels
6 plants &
4 O&M (12-years)
New subsidy scheme continued to
be good for Outotec Waste to
Energy technologies
1 plant,
next CFD auction
expected late
2016
© Outotec – All rights reserved
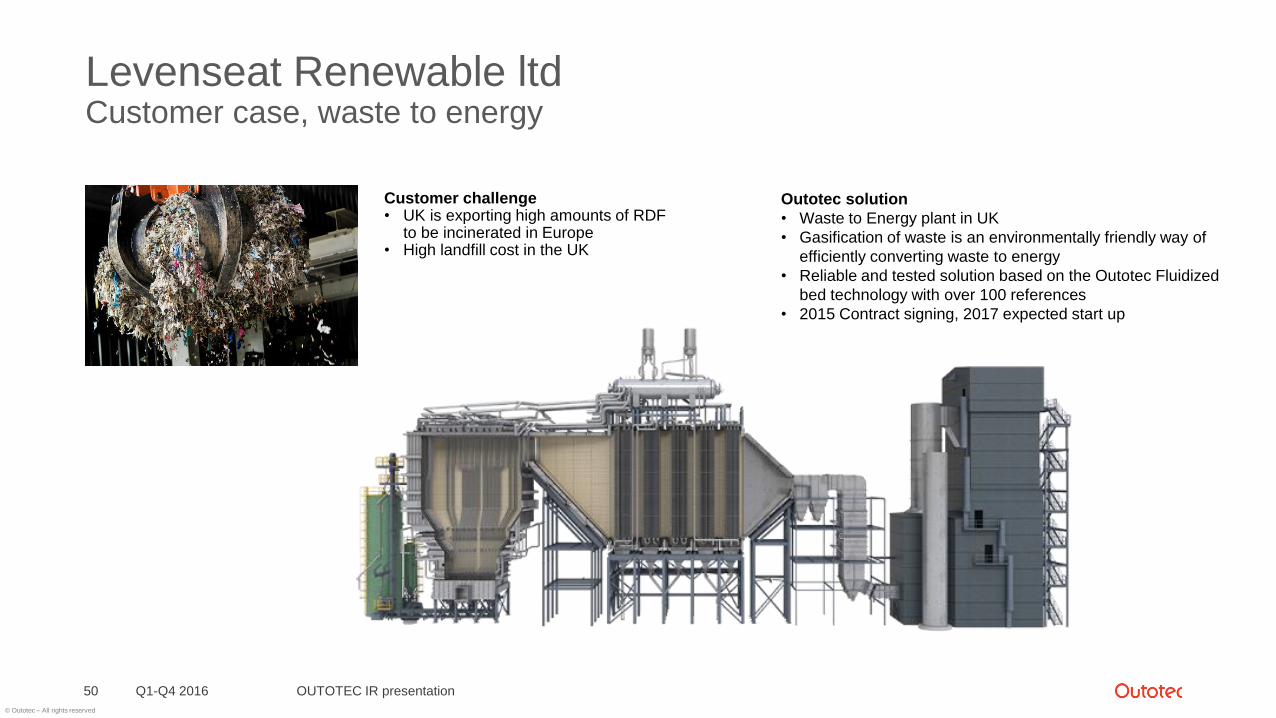
Levenseat Renewable ltdCustomer case, waste to energy
Q1-Q4 201650
Customer challenge• UK is exporting high amounts of RDF
to be incinerated in Europe • High landfill cost in the UK
OUTOTEC IR presentation
Outotec solution
• Waste to Energy plant in UK
• Gasification of waste is an environmentally friendly way of
efficiently converting waste to energy
• Reliable and tested solution based on the Outotec Fluidized
bed technology with over 100 references
• 2015 Contract signing, 2017 expected start up
© Outotec – All rights reserved
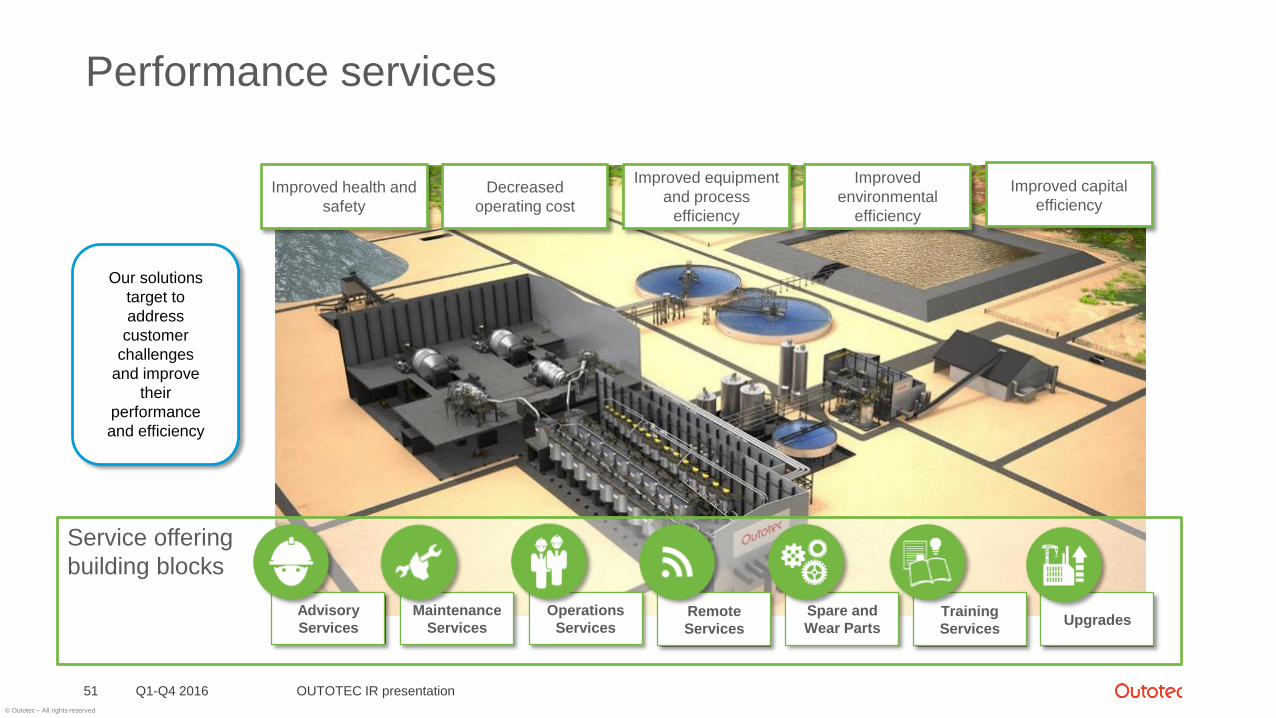
Service offering
building blocks
Performance services
Q1-Q4 2016 OUTOTEC IR presentation51
Operations
Services
Advisory
Services
Maintenance
ServicesRemote
Services
Training
Services
Spare and
Wear PartsUpgrades
Decreased
operating cost
Improved health and
safety
Improved
environmental
efficiency
Improved capital
efficiency
Improved equipment
and process
efficiency
Our solutions
target to
address
customer
challenges
and improve
their
performance
and efficiency
© Outotec – All rights reserved
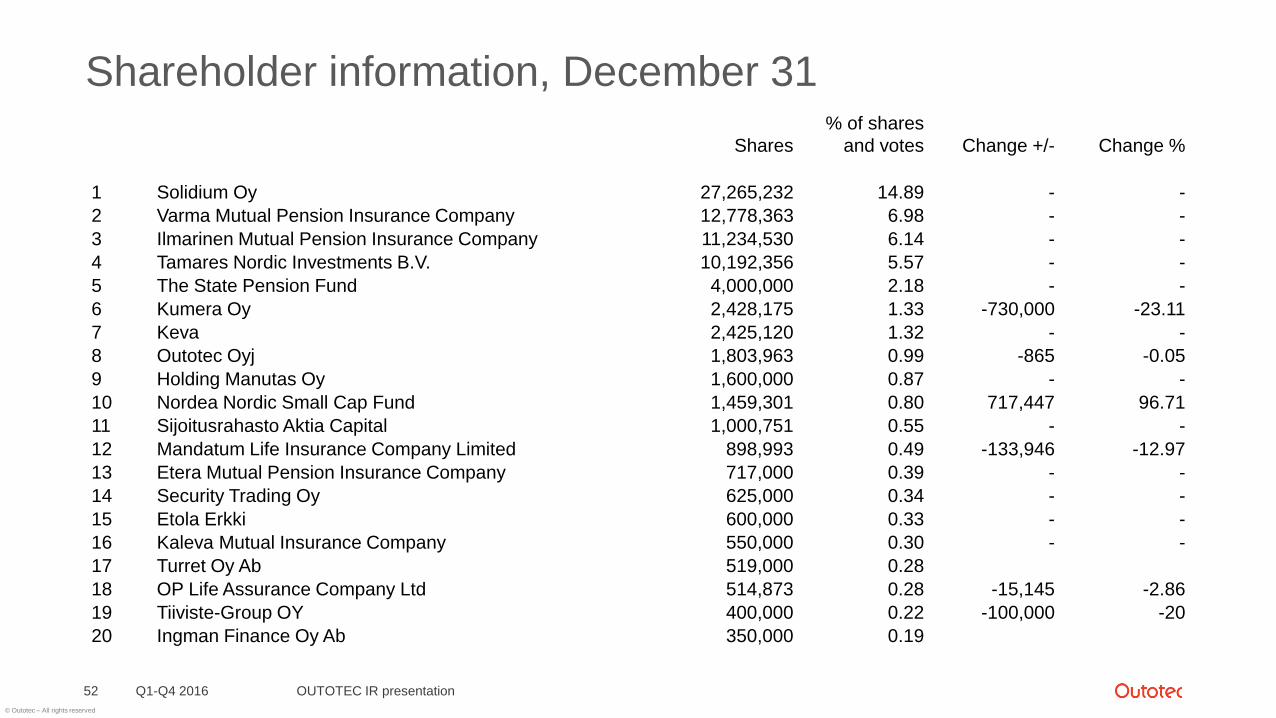
Shareholder information, December 31
Q1-Q4 2016 OUTOTEC IR presentation52
Shares
% of shares
and votes Change +/- Change %
1 Solidium Oy 27,265,232 14.89 - -
2 Varma Mutual Pension Insurance Company 12,778,363 6.98 - -
3 Ilmarinen Mutual Pension Insurance Company 11,234,530 6.14 - -
4 Tamares Nordic Investments B.V. 10,192,356 5.57 - -
5 The State Pension Fund 4,000,000 2.18 - -
6 Kumera Oy 2,428,175 1.33 -730,000 -23.11
7 Keva 2,425,120 1.32 - -
8 Outotec Oyj 1,803,963 0.99 -865 -0.05
9 Holding Manutas Oy 1,600,000 0.87 - -
10 Nordea Nordic Small Cap Fund 1,459,301 0.80 717,447 96.71
11 Sijoitusrahasto Aktia Capital 1,000,751 0.55 - -
12 Mandatum Life Insurance Company Limited 898,993 0.49 -133,946 -12.97
13 Etera Mutual Pension Insurance Company 717,000 0.39 - -
14 Security Trading Oy 625,000 0.34 - -
15 Etola Erkki 600,000 0.33 - -
16 Kaleva Mutual Insurance Company 550,000 0.30 - -
17 Turret Oy Ab 519,000 0.28
18 OP Life Assurance Company Ltd 514,873 0.28 -15,145 -2.86
19 Tiiviste-Group OY 400,000 0.22 -100,000 -20
20 Ingman Finance Oy Ab 350,000 0.19
© Outotec – All rights reserved
0
5
10
15
20
25
30
35
40
45
50
2006 2007 2008 2009 2010 2011 2012 2013 2014 2015 2016
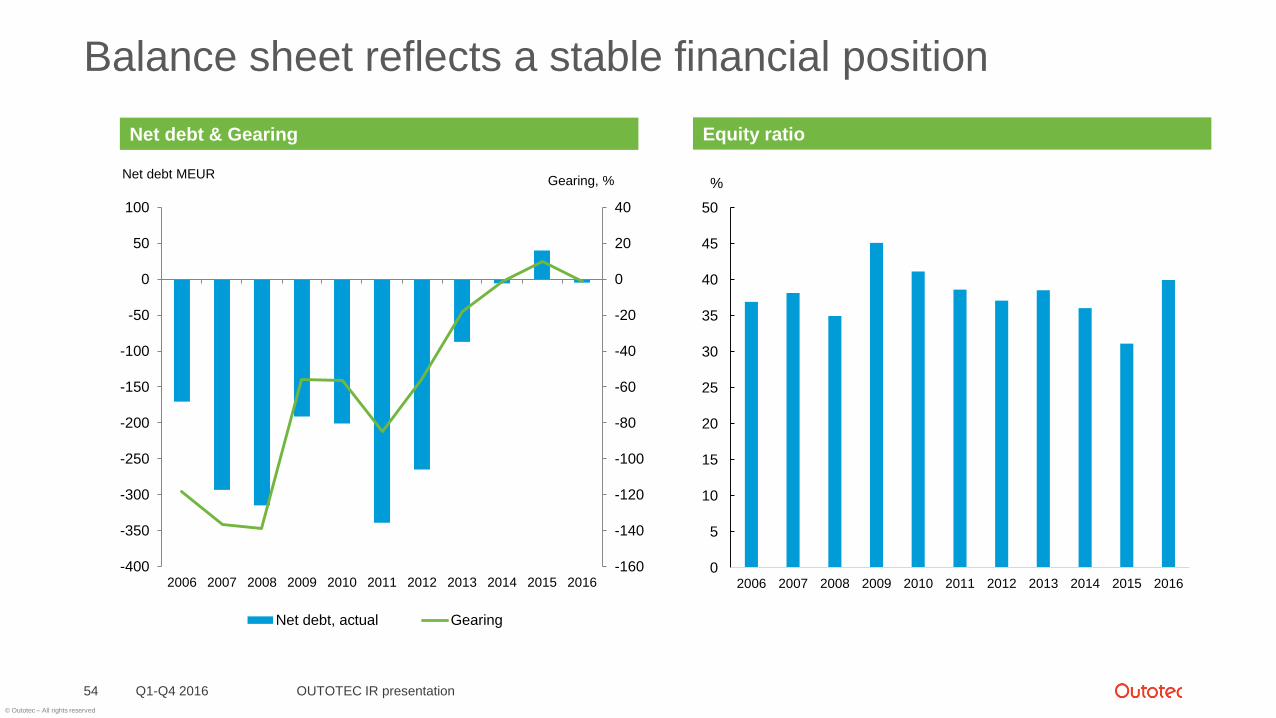
Balance sheet reflects a stable financial position
Q1-Q4 2016 OUTOTEC IR presentation54
-160
-140
-120
-100
-80
-60
-40
-20
0
20
40
-400
-350
-300
-250
-200
-150
-100
-50
0
50
100
2006 2007 2008 2009 2010 2011 2012 2013 2014 2015 2016
Gearing, %Net debt MEUR
Net debt, actual Gearing
Net debt & Gearing Equity ratio
%