Embed Size (px)
Citation preview
Journal of Industrial Engineering and ManagementJIEM, 2020 – 13(2): 417-429 – Online ISSN: 2013-0953 – Print ISSN: 2013-8423
https://doi.org/10.3926/jiem.3204
Sustainable Supply Chain Management Framework in a Higher EducationLaboratory Using Intuitionistic Fuzzy Cognitive Map
Muhammad Ridwan Andi Purnomo1 , Adhe Rizky Anugerah2 , Bella Taradipa Dewipramesti1
1Department of Industrial Engineering, Universitas Islam Indonesia (Indonesia)2Institute of Tropical Forestry and Forest Products (INTROP), Universiti Putra Malaysia (Malaysia)
[email protected], [email protected], [email protected]
Received: May 2020Accepted: June 2020
Abstract:
Purpose: This research aims to develop framework in the sustainable supply chain management (SCM)and to provide causal model of service industry specifically in higher education laboratory.
Design/methodology/approach: The concepts of sustainable SCM in higher education laboratory wereobtained by in-depth interviews and organized using Delphi method. While to identify the relationshipbetween concepts, intuitionistic fuzzy cognitive map was utilized.
Findings: As many as 15 concepts were identified to assess sustainability in the higher educationlaboratory SCM. These 15 concepts were classified into four categories according to its importance level,and there are two most important concepts: legal requirement and social responsibility. It is recommendedfor higher education laboratories to constantly obey national and regional government regulations and tosatisfy current and prospective employers by providing work-ready graduates. This suggestion is expectedto make higher education achieving its sustainability goals.
Originality/value: this research has identified factors that can help university laboratories achieve theirsustainability by using combined methods. Greater and more accurate insight in determining the mostimportant factor in the sustainable education can be identified.
Keywords: causal model, intuitionistic fuzzy cognitive map, laboratory, service supply chain, sustainable
To cite this article:
Purnomo, M.R.A., Anugerah, A.R., & Dewipramesti, B.T. (2020). Sustainable supply chain managementframework in a higher education laboratory using intuitionistic fuzzy cognitive map. Journal of IndustrialEngineering and Management, 13(2), 417-429. https://doi.org/10.3926/jiem.3204
1. Introduction
Along with the development of economic globalization, service industries have increased rapidly and give positivecontributions to economic growth for both developing and developed countries. In Indonesia, the contribution ofservice industries to gross domestic product increased from 45% in 2011 to 54% in 2018. This indicates that severaldeveloping countries have shifted from product-based manufacturing to more service-based economies.
-417-
Journal of Industrial Engineering and Management – https://doi.org/10.3926/jiem.3204
The rapid growth of the service sector over the last 50 years has contributed to the need for innovation andincreased service efficiency in order to fuel economic growth (Giannakis, 2011). However, the performance of theservice industry was lower than that of the manufacturing sector (Cho, Lee, Ahn & Hwang, 2012; van Ark,O’Mahony & Timmer, 2008). One of the reasons is the ability of manufacturing industries to achieve higherperformance in the Supply Chain Management (SCM) practices. Several researchers believe that SCM focus isheavily biased toward the manufacturing sector (Mirghafoori, Sharifabadi & Takalo, 2018). Therefore, moreattention should be given to the research and development of service supply chain management, since it becomesthe major contributor for most of the developing and developed economies.
Education is one of an important sector in the service industry because of its contribution to socio-economicdevelopment. Investment and development in the education sector were expected to contribute more to povertyreduction. At a higher education level, one of the factors that determine the quality of the institutions is theresearch activities conducted in the laboratory. Similar to the manufacturing industry, the service industry shouldalso have effective and efficient processes.
Laboratory is considered as a business unit as it delivers services to customers. In order to give excellent services toall stakeholders, there are 2 flows to be managed, which are backward flow; which is information flow, and forwardflow, which is material flow. A laboratory must have a reliable supply chain system in order to have high accuracy ofinformation and smooth material flow from material suppliers to customers. Moreover, strict environmentallegislation and a high level of public knowledge of sustainability issues lead institutions to incorporateenvironmental and social responsibility issues into supply chain management (Saeed & Kersten, 2019).
Companies, especially in developing countries, are beginning to adopt sustainable supply chain management as arivalry requirement (Hussain, Khan & Al-aomar, 2016). This is done to create, protect, and enhance the long-termenvironmental, social, and economic value of all stakeholders involved when delivering products or services to themarket (Esfahbodi, Zhang & Watson, 2016). Sustainable aspects in a supply chain aim to provide the best quality ofproducts and services throughout the supply chain while still increasing effectiveness, reducing waste and costs. Thedynamic and specific requirements in every supply chain make it difficult to solve in a sustainable way.
Given the broad range of services provided by the education sector, this research is focused on one unit:laboratory, since its contribution to teaching, learning, and research outputs of higher education. The aim of thisresearch is to identify the concept or factor affecting the sustainability of the university laboratory supply chainand to provide a causal model of it. In order to achieve this objective, Intuitionistic Fuzzy Cognitive Map(IFCM) in the form of a causal model is commonly used. This methodology has been proven capable toidentifying concepts and developing causal model to achieve sustainable supply chain in the health care industry(Mirghafoori et al., 2018).
Fuzzy Cognitive Map (FCM) is defined as a method for modelling complex systems and identifying relationshipsbetween criteria (Axelrod, 1976). FCM consists of several nodes that represent a criterion. In order to identify therelationships, the concept of intuitionistic fuzzy sets was developed to solve issues related to the doubts of expertson the basis of insufficient information available (Atanassov, 1986). In this research, criteria in the causal modelwere identified based on several expert opinions. Later, the criteria are called concept, and since the concepts haveincomplete information, the IFCM method was implemented to construct the causal model.
2. Literature Review2.1. Causal Model
The causal model is a model used to identify the relationship between concepts and how strong the conceptsrelationship is (Mirghafoori et al., 2018). The causal model is appropriate for events that can be conceptualized asprocesses that cause other events to trigger other processes. This structural modelling approach adopts the form ofa directed graph, a causal effect diagram, to present the interrelationships and the values of the influential effectbetween groups (Tseng., Lin, Chen, Calahorrano Sarmiento & Tan, 2019). The presence of causal interrelationshipsamong criteria leads to obtain importance degree of each criteria (Dursun & Gumus, 2020). This makes the causalmodel able to predict system behaviour.
-418-
Journal of Industrial Engineering and Management – https://doi.org/10.3926/jiem.3204
2.2. Sustainable Service Supply Chain Management (SS-SCM)
Service Supply Chain Management (S-SCM) is the management of information, processes, resources, and serviceperformance from the initial supplier to the end customer (Hussain et al., 2016). The service supply chain consistsof three basic units: the supplier, the service provider and the customer (Nouri, Nikabadi & Olfat,, 2018). Theaddition of sustainable development ideas and services to the supply chain is called SS-SCM. It is about designingand managing supply chains from three dimensions that are environmental, economic, and social. Theconsideration of triple bottom line, the focus of sustainable service supply chain management (SSSCM) hasbecome to optimize the whole service supply chain’s economy, environment, and social performance (Liu, Bai, Liu& Wei, 2017).
2.3. Intuitionistic Fuzzy Cognitive Map
This study uses a mixed method between FCM and IFS and called as IFCM. FCM is a graph containing nodes thatrepresent the concept (Ci) of the study domain, which relates to one another with weight axis W(i, j) showing howconcept i is influenced by concept j. Intuitionistic Fuzzy Sets (IFS) could be considered as an approach if there isinsufficient information available to define the inaccuracy of conventional fuzzy sets. Conventional fuzzy sets onlyconsider the level of acceptance; however, IFS is characterized by the function of membership and non-membership functions so that the second number of values is less than one. In this study, a triangular intuitionisticfuzzy number is used, as shown in Table 1. The μ and υ signify the membership and non-membership degreerespectively, and π is called the degree of indeterminacy or hesitation (Lu & Ng, 2005).
Linguistic Term Intuitionistic Fuzzy Number (μ, υ, π)
No Influence (0.1, 0.9, 0)
Very low influence (0.35, 0.6, 0.05)
Low influence (0.5, 0.45, 0.05)
High influence (0.75, 0.2, 0.05)
Very high influence (0.9, 0.1, 0)
Table 1. Triangular Intuitionistic Fuzzy Number
2.4. Related Publication
Several researchers have conducted research in the area of service supply chain management, and most of themhave discussed marketing and operational issues. In order to support the main objective, this section will focus onresearch in developing concepts or factors and the relationship between the concept to achieve sustainability in theservice industry.
The framework for SS-SCM was developed using a literature review approach (Liu et al., 2017). There were 248papers from 101 journals were analyzed and extracted to summaries the SSCM framework for both manufacturingand service industries. In the specificity of the service sector, the SSCM actors are suppliers, focal company andstakeholders (government, customer, NGOs, etc.). Focal companies were expected to do SSCM practices:sustainable supplier management, managing sustainability risks, and managing pressures and incentives.
The service sustainable supply chain framework in the Arab world, especially Abu Dhabi, has been constructedusing confirmatory factor analysis (CFA) (Hussain et al., 2016). The research was taken in three industries: bank,airline, and hospital, with a total organization observed is 169. There are four factors affecting sustainability in theservice supply chain management: environmental management (with 4 indicators), social responsibility (with 3indicators), health, safety, and risk management (with 3 indicators), and customer management (with 7 indicators).Furthermore, all those four factors have a strong correlation.
In the hospitality industry, factors influencing the sustainability of the service supply chain have been developed byusing a combination of CFA and structural equation modelling (SEM) (Xu & Gursoy, 2015). The constructedframework was linked to the customer’s attitude and behaviors, including satisfaction, loyalty, and willingness to pay
-419-
Journal of Industrial Engineering and Management – https://doi.org/10.3926/jiem.3204
a premium for sustainable hospitality goods and services. The research was conducted in the US with 499 validresponses. There are three main factors influencing the sustainability in the hospitality SCM: environmentaldimension (product design, service process, recycling, product management, etc.), social dimension (employees,customers, community, etc.), and economic dimension (cost control, revenue growth, etc.). The results found thatenvironmental and economic dimensions positively influence customer satisfaction, loyalty, and willingness, whilesocial dimension positively influences customer satisfaction and negatively influences customer willingness.
Besides, a sustainable supply chain framework has been developed in electronic manufacturing firms that focus ondelivering design (Tseng, Lim, Wong, Chen & Zhan, 2018). The research was conducted in Taiwan and started bydeveloping a framework from the existing study. The Fuzzy Delphi Method (FDM) was utilized to validate thecontent of the constructed framework by asking the opinions of 10 professors and 20 management professionals;therefore, less important criteria could be eliminated. Furthermore, ANP is used to evaluate the interdependentrelationships between variables. The results indicated that environmental service operation design in the top-ranking aspect should be considered.
FDM can also be joined with the balance scorecard (BSC) method (Nouri et al., 2019). The BSC is used toaccommodate goals and integrate the business strategy with sustainability and SCM aspects. The objective of thisresearch is to develop a SSCM framework in the hospitality industry. There were four dimensions to achievesustainability in the hospitality industry: financial, supply chain stakeholders, learning growth, and innovationdimension. Twenty-three criteria under four dimensions were defined, and 2 criteria were deleted because of theirlow importance. Based on the results, every criterion is interrelated.
Integrating the Delphi method and IFCM method to develop the SS-SCM framework has been successfully done inthe Iranian hospital industry (Mirghafoori et al., 2018). The framework was developed and selected through Delphimethod by interviewing 18 experts in the hospital. The research was able to reorganize 68 initial concepts into 15concepts. Furthermore, IFCM was used to select the most important concept to be prioritized. The results foundthat service delivery management is highly important among other concepts.
In this research, we proposed a framework in the university laboratory to achieve its sustainability in the supplychain. This research was started by reviewing several articles to develop the initial framework. Once the initialframework was established, we used the Delphi method to eliminate several irrelevant concepts. Lastly, the IFCMwas utilized to understand the importance level of each concept.
3. MethodologyThe main objective of this research is to develop SS-SCM in the Indonesian university laboratory and determinewhich concept has the highest importance level. A comprehensive research methodology is required to achieve thisobjective and has been developed in this section. The research methodology includes research materials, datacollection methods, questionnaire development, and data analysis methods.
This research consists of primary data which collected through in-depth interviews and a survey questionnairedistributed to SCM and university laboratory experts and secondary data which obtained from an extensiveliterature review of SS-SCM and IFCM methods.
3.1. Research Materials
This research was conducted in the Industrial Statistics and Optimization Laboratory (later we called as SIOP),Islamic University of Indonesia, Yogyakarta. This is a well-known private university in Indonesia with total averageenrollment is more than 26,000 annually. SIOP lab is a subunit of industrial engineering department with mainactivities are research, teaching, and social responsibility. SIOP Lab as the service industry has a supply chain, asshown in Figure 1.
There are two actors at the supplier level: the university department (study program) and laboratory materialsuppliers. The university department is a vital actor for laboratory, as the laboratory was developed under thedepartment. The university department acts as the main source for research and development funding, and it hasmajor control in giving approval of any lab activities.
-420-
Journal of Industrial Engineering and Management – https://doi.org/10.3926/jiem.3204
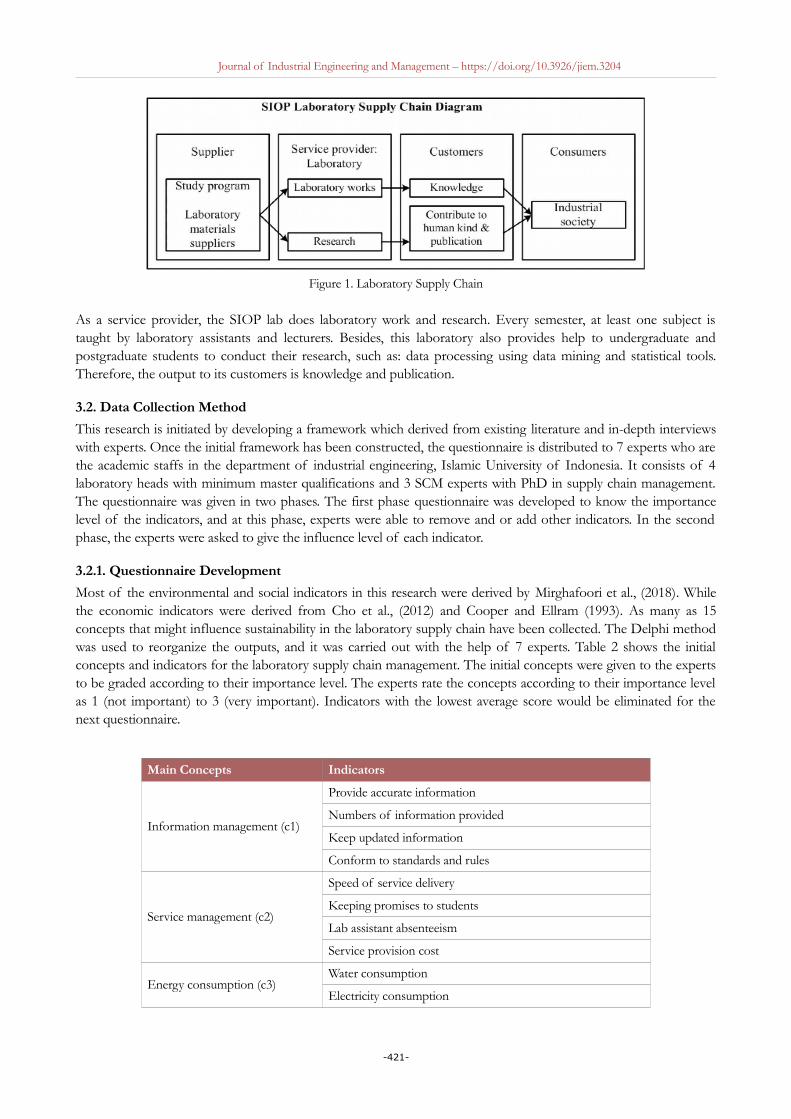
Figure 1. Laboratory Supply Chain
As a service provider, the SIOP lab does laboratory work and research. Every semester, at least one subject istaught by laboratory assistants and lecturers. Besides, this laboratory also provides help to undergraduate andpostgraduate students to conduct their research, such as: data processing using data mining and statistical tools.Therefore, the output to its customers is knowledge and publication.
3.2. Data Collection Method
This research is initiated by developing a framework which derived from existing literature and in-depth interviewswith experts. Once the initial framework has been constructed, the questionnaire is distributed to 7 experts who arethe academic staffs in the department of industrial engineering, Islamic University of Indonesia. It consists of 4laboratory heads with minimum master qualifications and 3 SCM experts with PhD in supply chain management.The questionnaire was given in two phases. The first phase questionnaire was developed to know the importancelevel of the indicators, and at this phase, experts were able to remove and or add other indicators. In the secondphase, the experts were asked to give the influence level of each indicator.
3.2.1. Questionnaire Development
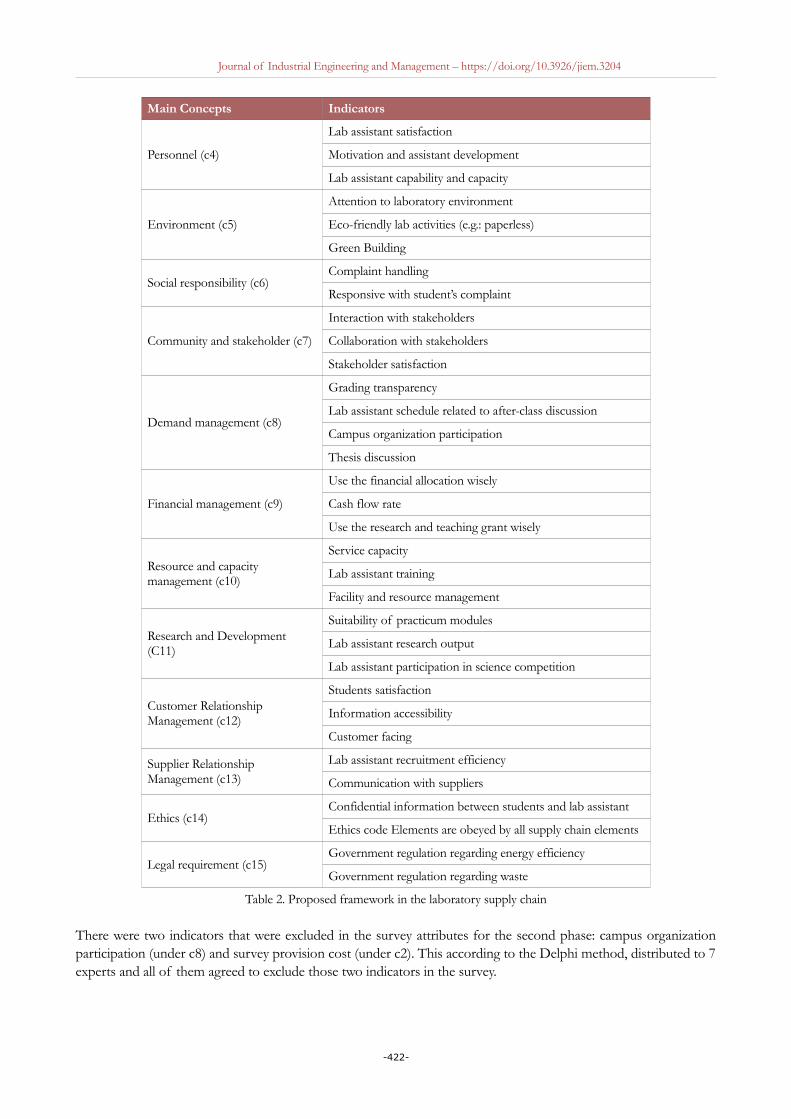
Most of the environmental and social indicators in this research were derived by Mirghafoori et al., (2018). Whilethe economic indicators were derived from Cho et al., (2012) and Cooper and Ellram (1993). As many as 15concepts that might influence sustainability in the laboratory supply chain have been collected. The Delphi methodwas used to reorganize the outputs, and it was carried out with the help of 7 experts. Table 2 shows the initialconcepts and indicators for the laboratory supply chain management. The initial concepts were given to the expertsto be graded according to their importance level. The experts rate the concepts according to their importance levelas 1 (not important) to 3 (very important). Indicators with the lowest average score would be eliminated for thenext questionnaire.
Main Concepts Indicators
Information management (c1)
Provide accurate information
Numbers of information provided
Keep updated information
Conform to standards and rules
Service management (c2)
Speed of service delivery
Keeping promises to students
Lab assistant absenteeism
Service provision cost
Energy consumption (c3)Water consumption
Electricity consumption
-421-
Journal of Industrial Engineering and Management – https://doi.org/10.3926/jiem.3204
Main Concepts Indicators
Personnel (c4)
Lab assistant satisfaction
Motivation and assistant development
Lab assistant capability and capacity
Environment (c5)
Attention to laboratory environment
Eco-friendly lab activities (e.g.: paperless)
Green Building
Social responsibility (c6)Complaint handling
Responsive with student’s complaint
Community and stakeholder (c7)
Interaction with stakeholders
Collaboration with stakeholders
Stakeholder satisfaction
Demand management (c8)
Grading transparency
Lab assistant schedule related to after-class discussion
Campus organization participation
Thesis discussion
Financial management (c9)
Use the financial allocation wisely
Cash flow rate
Use the research and teaching grant wisely
Resource and capacity management (c10)
Service capacity
Lab assistant training
Facility and resource management
Research and Development (C11)
Suitability of practicum modules
Lab assistant research output
Lab assistant participation in science competition
Customer Relationship Management (c12)
Students satisfaction
Information accessibility
Customer facing
Supplier Relationship Management (c13)
Lab assistant recruitment efficiency
Communication with suppliers
Ethics (c14)Confidential information between students and lab assistant
Ethics code Elements are obeyed by all supply chain elements
Legal requirement (c15)Government regulation regarding energy efficiency
Government regulation regarding waste
Table 2. Proposed framework in the laboratory supply chain
There were two indicators that were excluded in the survey attributes for the second phase: campus organizationparticipation (under c8) and survey provision cost (under c2). This according to the Delphi method, distributed to 7experts and all of them agreed to exclude those two indicators in the survey.
-422-
Journal of Industrial Engineering and Management – https://doi.org/10.3926/jiem.3204
3.3. Data Analysis Method3.3.1. Constructing the Intuitionistic Fuzzy Matrix of Success
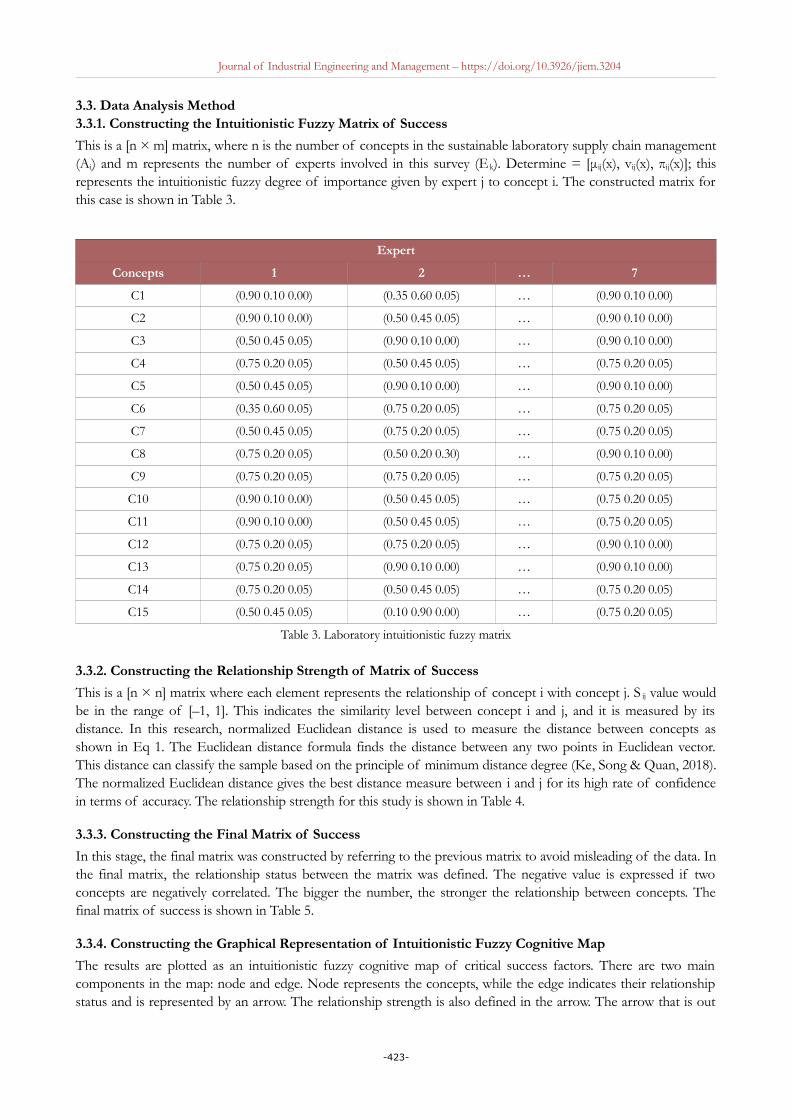
This is a [n × m] matrix, where n is the number of concepts in the sustainable laboratory supply chain management(Ai) and m represents the number of experts involved in this survey (Ek). Determine = [μij(x), vij(x), πij(x)]; thisrepresents the intuitionistic fuzzy degree of importance given by expert j to concept i. The constructed matrix forthis case is shown in Table 3.
Expert
Concepts 1 2 … 7
C1 (0.90 0.10 0.00) (0.35 0.60 0.05) … (0.90 0.10 0.00)
C2 (0.90 0.10 0.00) (0.50 0.45 0.05) … (0.90 0.10 0.00)
C3 (0.50 0.45 0.05) (0.90 0.10 0.00) … (0.90 0.10 0.00)
C4 (0.75 0.20 0.05) (0.50 0.45 0.05) … (0.75 0.20 0.05)
C5 (0.50 0.45 0.05) (0.90 0.10 0.00) … (0.90 0.10 0.00)
C6 (0.35 0.60 0.05) (0.75 0.20 0.05) … (0.75 0.20 0.05)
C7 (0.50 0.45 0.05) (0.75 0.20 0.05) … (0.75 0.20 0.05)
C8 (0.75 0.20 0.05) (0.50 0.20 0.30) … (0.90 0.10 0.00)
C9 (0.75 0.20 0.05) (0.75 0.20 0.05) … (0.75 0.20 0.05)
C10 (0.90 0.10 0.00) (0.50 0.45 0.05) … (0.75 0.20 0.05)
C11 (0.90 0.10 0.00) (0.50 0.45 0.05) … (0.75 0.20 0.05)
C12 (0.75 0.20 0.05) (0.75 0.20 0.05) … (0.90 0.10 0.00)
C13 (0.75 0.20 0.05) (0.90 0.10 0.00) … (0.90 0.10 0.00)
C14 (0.75 0.20 0.05) (0.50 0.45 0.05) … (0.75 0.20 0.05)
C15 (0.50 0.45 0.05) (0.10 0.90 0.00) … (0.75 0.20 0.05)
Table 3. Laboratory intuitionistic fuzzy matrix
3.3.2. Constructing the Relationship Strength of Matrix of Success
This is a [n × n] matrix where each element represents the relationship of concept i with concept j. S ij value wouldbe in the range of [–1, 1]. This indicates the similarity level between concept i and j, and it is measured by itsdistance. In this research, normalized Euclidean distance is used to measure the distance between concepts asshown in Eq 1. The Euclidean distance formula finds the distance between any two points in Euclidean vector.This distance can classify the sample based on the principle of minimum distance degree (Ke, Song & Quan, 2018).The normalized Euclidean distance gives the best distance measure between i and j for its high rate of confidencein terms of accuracy. The relationship strength for this study is shown in Table 4.
3.3.3. Constructing the Final Matrix of Success
In this stage, the final matrix was constructed by referring to the previous matrix to avoid misleading of the data. Inthe final matrix, the relationship status between the matrix was defined. The negative value is expressed if twoconcepts are negatively correlated. The bigger the number, the stronger the relationship between concepts. Thefinal matrix of success is shown in Table 5.
3.3.4. Constructing the Graphical Representation of Intuitionistic Fuzzy Cognitive Map
The results are plotted as an intuitionistic fuzzy cognitive map of critical success factors. There are two maincomponents in the map: node and edge. Node represents the concepts, while the edge indicates their relationshipstatus and is represented by an arrow. The relationship strength is also defined in the arrow. The arrow that is out
-423-
Journal of Industrial Engineering and Management – https://doi.org/10.3926/jiem.3204
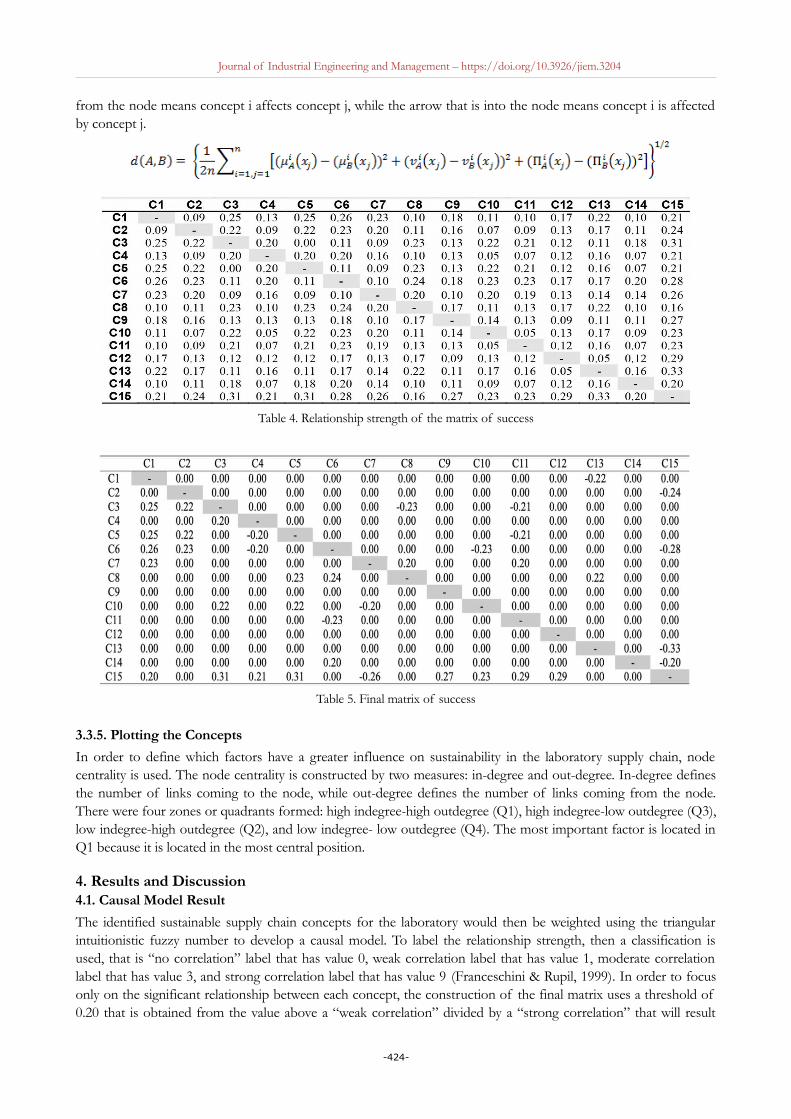
from the node means concept i affects concept j, while the arrow that is into the node means concept i is affectedby concept j.
Table 4. Relationship strength of the matrix of success
Table 5. Final matrix of success
3.3.5. Plotting the Concepts
In order to define which factors have a greater influence on sustainability in the laboratory supply chain, nodecentrality is used. The node centrality is constructed by two measures: in-degree and out-degree. In-degree definesthe number of links coming to the node, while out-degree defines the number of links coming from the node.There were four zones or quadrants formed: high indegree-high outdegree (Q1), high indegree-low outdegree (Q3),low indegree-high outdegree (Q2), and low indegree- low outdegree (Q4). The most important factor is located inQ1 because it is located in the most central position.
4. Results and Discussion4.1. Causal Model Result
The identified sustainable supply chain concepts for the laboratory would then be weighted using the triangularintuitionistic fuzzy number to develop a causal model. To label the relationship strength, then a classification isused, that is “no correlation” label that has value 0, weak correlation label that has value 1, moderate correlationlabel that has value 3, and strong correlation label that has value 9 (Franceschini & Rupil, 1999). In order to focusonly on the significant relationship between each concept, the construction of the final matrix uses a threshold of0.20 that is obtained from the value above a “weak correlation” divided by a “strong correlation” that will result
-424-
Journal of Industrial Engineering and Management – https://doi.org/10.3926/jiem.3204
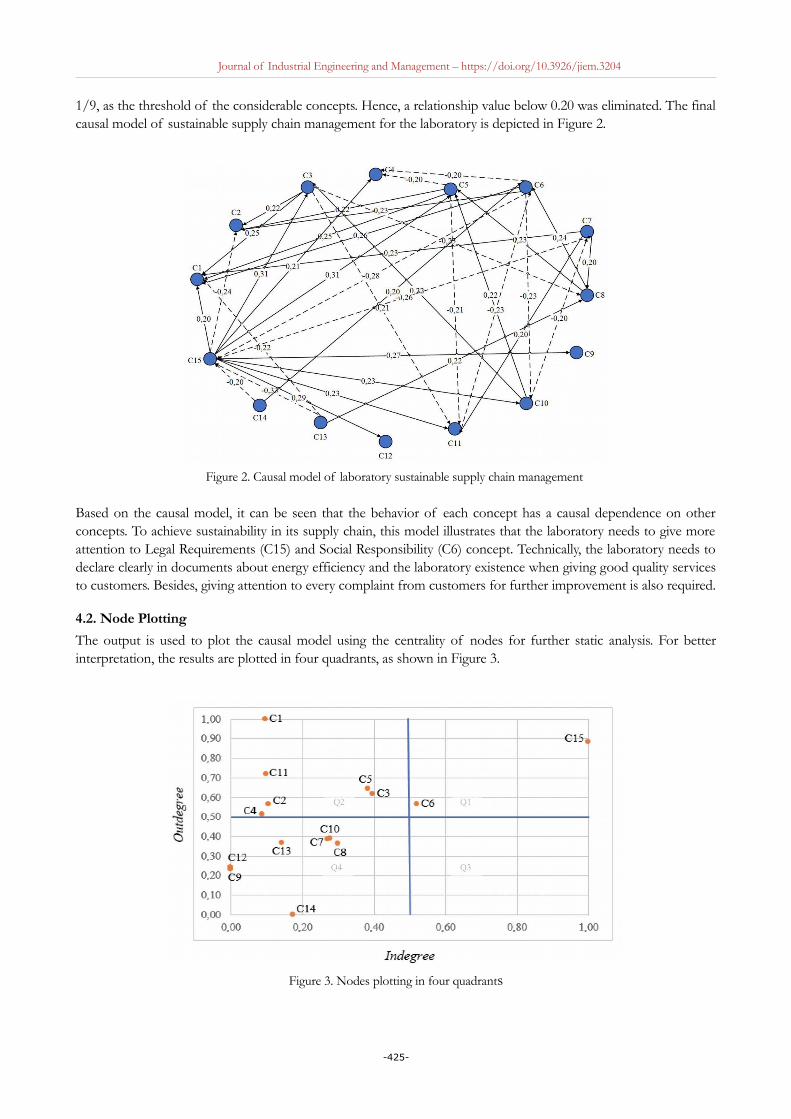
1/9, as the threshold of the considerable concepts. Hence, a relationship value below 0.20 was eliminated. The finalcausal model of sustainable supply chain management for the laboratory is depicted in Figure 2.
Figure 2. Causal model of laboratory sustainable supply chain management
Based on the causal model, it can be seen that the behavior of each concept has a causal dependence on otherconcepts. To achieve sustainability in its supply chain, this model illustrates that the laboratory needs to give moreattention to Legal Requirements (C15) and Social Responsibility (C6) concept. Technically, the laboratory needs todeclare clearly in documents about energy efficiency and the laboratory existence when giving good quality servicesto customers. Besides, giving attention to every complaint from customers for further improvement is also required.
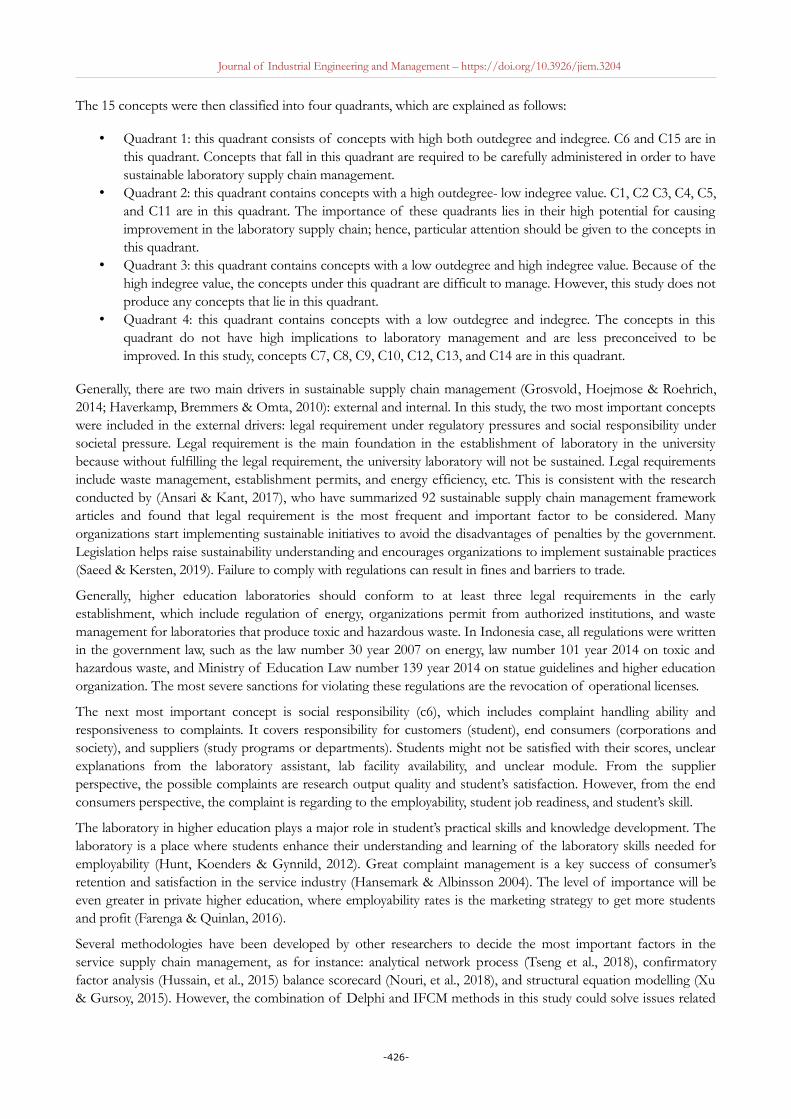
4.2. Node Plotting
The output is used to plot the causal model using the centrality of nodes for further static analysis. For betterinterpretation, the results are plotted in four quadrants, as shown in Figure 3.
Figure 3. Nodes plotting in four quadrants
-425-
Journal of Industrial Engineering and Management – https://doi.org/10.3926/jiem.3204
The 15 concepts were then classified into four quadrants, which are explained as follows:
• Quadrant 1: this quadrant consists of concepts with high both outdegree and indegree. C6 and C15 are inthis quadrant. Concepts that fall in this quadrant are required to be carefully administered in order to havesustainable laboratory supply chain management.
• Quadrant 2: this quadrant contains concepts with a high outdegree- low indegree value. C1, C2 C3, C4, C5,and C11 are in this quadrant. The importance of these quadrants lies in their high potential for causingimprovement in the laboratory supply chain; hence, particular attention should be given to the concepts inthis quadrant.
• Quadrant 3: this quadrant contains concepts with a low outdegree and high indegree value. Because of thehigh indegree value, the concepts under this quadrant are difficult to manage. However, this study does notproduce any concepts that lie in this quadrant.
• Quadrant 4: this quadrant contains concepts with a low outdegree and indegree. The concepts in thisquadrant do not have high implications to laboratory management and are less preconceived to beimproved. In this study, concepts C7, C8, C9, C10, C12, C13, and C14 are in this quadrant.
Generally, there are two main drivers in sustainable supply chain management (Grosvold, Hoejmose & Roehrich,2014; Haverkamp, Bremmers & Omta, 2010): external and internal. In this study, the two most important conceptswere included in the external drivers: legal requirement under regulatory pressures and social responsibility undersocietal pressure. Legal requirement is the main foundation in the establishment of laboratory in the universitybecause without fulfilling the legal requirement, the university laboratory will not be sustained. Legal requirementsinclude waste management, establishment permits, and energy efficiency, etc. This is consistent with the researchconducted by (Ansari & Kant, 2017), who have summarized 92 sustainable supply chain management frameworkarticles and found that legal requirement is the most frequent and important factor to be considered. Manyorganizations start implementing sustainable initiatives to avoid the disadvantages of penalties by the government.Legislation helps raise sustainability understanding and encourages organizations to implement sustainable practices(Saeed & Kersten, 2019). Failure to comply with regulations can result in fines and barriers to trade.
Generally, higher education laboratories should conform to at least three legal requirements in the earlyestablishment, which include regulation of energy, organizations permit from authorized institutions, and wastemanagement for laboratories that produce toxic and hazardous waste. In Indonesia case, all regulations were writtenin the government law, such as the law number 30 year 2007 on energy, law number 101 year 2014 on toxic andhazardous waste, and Ministry of Education Law number 139 year 2014 on statue guidelines and higher educationorganization. The most severe sanctions for violating these regulations are the revocation of operational licenses.
The next most important concept is social responsibility (c6), which includes complaint handling ability andresponsiveness to complaints. It covers responsibility for customers (student), end consumers (corporations andsociety), and suppliers (study programs or departments). Students might not be satisfied with their scores, unclearexplanations from the laboratory assistant, lab facility availability, and unclear module. From the supplierperspective, the possible complaints are research output quality and student’s satisfaction. However, from the endconsumers perspective, the complaint is regarding to the employability, student job readiness, and student’s skill.
The laboratory in higher education plays a major role in student’s practical skills and knowledge development. Thelaboratory is a place where students enhance their understanding and learning of the laboratory skills needed foremployability (Hunt, Koenders & Gynnild, 2012). Great complaint management is a key success of consumer’sretention and satisfaction in the service industry (Hansemark & Albinsson 2004). The level of importance will beeven greater in private higher education, where employability rates is the marketing strategy to get more studentsand profit (Farenga & Quinlan, 2016).
Several methodologies have been developed by other researchers to decide the most important factors in theservice supply chain management, as for instance: analytical network process (Tseng et al., 2018), confirmatoryfactor analysis (Hussain, et al., 2015) balance scorecard (Nouri, et al., 2018), and structural equation modelling (Xu& Gursoy, 2015). However, the combination of Delphi and IFCM methods in this study could solve issues related
-426-
Journal of Industrial Engineering and Management – https://doi.org/10.3926/jiem.3204
to the doubts of experts on the basis of insufficient information available and give greater insight into the issue ofsustainability in the service supply chain.
5. ConclusionThe performance of the service industry was left behind compared to the manufacturing industry. Most of theresearchers believe that this was due to the ability of each sector in manage their supply chain. However, most ofthe study was much focus on the manufacturing sector instead of the service industry because of the higher varietyand complexity of the service industry supply chain. Several frameworks, along with the concepts and indicators,have been developed to help the service industry assess their company’s performance and be more sustainable intheir business. Because of their specificity, researchers have built a sustainable supply chain framework in variousand specific sectors: hospitality, airplane, hospital, bank, etc. Nonetheless, a sustainable supply chain framework inthe education sector focusing in the university laboratories is still lacking.
In this study, we identified 15 main concepts influencing the sustainability of university laboratory supply chainmanagement by conducting in-depth interviews with experts and addressing ambiguity among expert’s opinions,and finally developed a causal model. Every business sector in the service industry may have different concern indetermining the most important factor to keep their business sustainable. As for instance, in the healthcare industry,the most important factor is service management (Mirghafoori et al., 2018). While in the electronic design company,the most important factor is environmental service operation design (Tseng et al., 2018). Nonetheless, in this study,legal requirement and social responsibility became the most important factors for higher education in achievingsustainability in their business.
The contribution of this study is the factors that can help university laboratories achieve their sustainability in theirbusiness. This study also used the IFCM method to give greater insight into the issue of sustainability in theuniversity laboratory supply chain. The proposed model could be adopted by other university laboratories in generalto assess their current performance and to identify which factors should be paid more attention. Therefore, theuniversity laboratory as a subunit in the higher education institution would achieve their sustainability in thebusiness and be more competitive.
However, this study has several limitations. First, the number of respondents, this research is collected the datafrom seven experts and professional opinion, and the second is location, where this research is only conducted inone prominent private university in Indonesia. It is recommended to add more respondents to more than 15, assuggested by Mirghafoori et al., (2018) and Tseng et al., (2018). Future research also suggested to enhance theresearch area, not limited to Yogyakarta, Indonesia, but also across cities, provinces, and countries to get an overallframework for education supply chain management and the critical enabler.
Declaration of Conflicting Interests
The authors declared no potential conflicts of interest with respect to the research, authorship, and/or publicationof this article.
Funding
The authors received no financial support for the research, authorship, and/or publication of this article.
References
Ansari, Z. N., & Kant, R. (2017). Exploring the Framework Development Status for Sustainability in Supply Chain Management: A Systematic Literature Synthesis and Future Research Directions. Business Strategy and the Environment, 26(7), 873-892. https://doi.org/10.1002/bse.1945
Atanassov, K.T. (1986). Intuitionistic Fuzzy Sets. Fuzzy Sets and Sytems, 20, 87-96. https://doi.org/10.1016/S0165-0114(86)80034-3
Axelrod, R. (1976). Cognitive Mapping Approach to Decision Making. In Structure of Decision: The Cognitive Maps of Political Elites (3-17). Princeton University Press. https://doi.org/10.1515/9781400871957-004
-427-
Journal of Industrial Engineering and Management – https://doi.org/10.3926/jiem.3204
Cho, D.W., Lee, Y.H., Ahn, S.H., & Hwang, M.K. (2012). A framework for measuring the performance of service supply chain management. Computers & Industrial Engineering , 62, 801-818. https://doi.org/10.1016/j.cie.2011.11.014
Cooper, M.C., & Ellram, L.M. (1993). Characteristics of Supply Chain Management and the Implications for Purchasing and Logistics Strategy. The International Journal of Logistics Management, 4(2), 13-24. https://doi.org/10.1108/MBE-09-2016-0047
Dursun, M., & Gumus, G. (2020). Intuitionistic Fuzzy Cognitive Map Approach for the Evaluation of Supply Chain Configuration Criteria. Mathematical Methods in the Applied Sciences. https://doi.org/10.1002/mma.6238
Esfahbodi, A., Zhang, Y., & Watson, G. (2016). Sustainable supply chain management in emerging economies : Trade-offs between environmental and cost performance. International Journal of Production Economics, 181, 350-366. https://doi.org/10.1016/j.ijpe.2016.02.013
Farenga, S.A., & Quinlan, K.M. (2016). Classifying university employability strategies: three case studies and implications for practice and research. Journal of Education and Work, 29(7), 767-787. https://doi.org/10.1080/13639080.2015.1064517
Franceschini, F., & Rupil, A. (1999). Rating scales and prioritization in QFD. International Journal of Quality and Reliability Management, 16(1), 85-97.
Giannakis, M. (2011). Management of service supply chains with a service-oriented reference model : the case of management consulting. Supply Chain Management: An International Journal, 16(5), 346-361. https://doi.org/10.1108/13598541111155857
Grosvold, J., Hoejmose, S.U., & Roehrich, J.K. (2014). Squaring the circle: Management, measurement and performance of sustainability in supply chains. Supply Chain Management, 19(3), 292-305. https://doi.org/10.1108/SCM-12-2013-0440
Hansemark, O.C., & Albinsson, M. (2004). Customer satisfaction and retention: The experiences of individual employees. Managing Service Quality: An International Journal, 14(1), 40-57. https://doi.org/10.1108/09604520410513668
Haverkamp, D.J., Bremmers, H., & Omta, O. (2010). Stimulating environmental management performance: Towards a contingency approach. British Food Journal, 112(11), 1237-1251. https://doi.org/10.1108/00070701011088223
Hunt, L., Koenders, A., & Gynnild, V. (2012). Assessing practical laboratory skills in undergraduate molecular biology courses. Assessment and Evaluation in Higher Education, 37(7), 861-874. https://doi.org/10.1080/02602938.2011.576313
Hussain, M., Khan, M., & Al-aomar, R. (2016). A framework for supply chain sustainability in service industry with Confirmatory Factor Analysis. Renewable and Sustainable Energy Reviews, 55, 1301-1312. https://doi.org/10.1016/j.rser.2015.07.097
Ke, D., Song, Y, & Quan, W. (2018). New Distance Measure for Atanassov’s Intuitionistic Fuzzy Sets and Its Application in Decision Making. Symmetry, 10(10), 429. https://doi.org/10.3390/sym10100429
Liu, W., Bai, E., Liu, L., & Wei, W. (2017). A Framework of Sustainable Service Supply Chain Management : A Literature Review and Research Agenda. Sustainability (Switzerland), 9(3), 1-25. https://doi.org/10.3390/su9030421
Lu, A., & Ng, W. (2005). Vague Sets or Intuitionistic Fuzzy Sets for Handling Vague Data: Which One Is Better? In Delcambre L., Kop C., Mayr H.C., Mylopoulos J., & Pastor O. (Eds). Conceptual Modeling - ER 2005. ER 2005. Lecture Notes in Computer Science (3716). Springer, Berlin, Heidelberg. https://doi.org/10.1007/11568322_26
Mirghafoori, S.H., Sharifabadi, A.M., & Takalo, S.K. (2018). Development of Causal Model of Sustainable HospitalSupply Chain Management Using the Intuitionistic Fuzzy Cognitive Map (IFCM) Method. Journal of Industrial Engineering and Management, 11(3), 588-605. https://doi.org/10.3926/jiem.2517
-428-
Journal of Industrial Engineering and Management – https://doi.org/10.3926/jiem.3204
Nouri, F.A., Nikabadi, M.S., & Olfat, L. (2019). Developing the framework of sustainable service supply chain balanced scorecard (SSSC BSC). International Journal of Prouctivity and Performance Management, 68(1), 148-170. https://doi.org/10.1108/IJPPM-04-2018-0149
Saeed, M.A., & Kersten, W. (2019). Drivers of Sustainable Supply Chain Management : Identification and Classification. Sustainability (Switzerland), 11(4), 1137-1160. https://doi.org/10.3390/su11041137
Tseng, M., Lim, M.K., Wong, W., Chen, Y., & Zhan, Y. (2018). A framework for evaluating the performance of sustainable service supply chain management under uncertainty. International Journal of Production Economics, 195, 359-372. https://doi.org/10.1016/j.ijpe.2016.09.002
Tseng, M.L., Lin, S., Chen, C.-C., Calahorrano Sarmiento, L.S., & Tan, C.L. (2019). A causal sustainable product-service system using hierarchical structure with linguistic preferences in the Ecuadorian construction industry. Journal of Cleaner Production, 230, 477-487. https://doi.org/10.1016/j.jclepro.2019.05.140
van Ark, B., O’Mahony, M., & Timmer, M.P. (2008). The productivity gap between Europe and the United States. Journal of Economic Perspectives, 22(1), 24-44. https://doi.org/10.1257/jep.22.1.25
Xu, X., & Gursoy, D. (2015). Influence of sustainable hospitality supply chain management on customers’ attitudes and behaviors. International Journal of Hospitality Management, 49, 105-116. https://doi.org/10.1016/j.ijhm.2015.06.003
Journal of Industrial Engineering and Management, 2020 (www.jiem.org)
Article’s contents are provided on an Attribution-Non Commercial 4.0 Creative commons International License. Readers areallowed to copy, distribute and communicate article’s contents, provided the author’s and Journal of Industrial Engineering andManagement’s names are included. It must not be used for commercial purposes. To see the complete license contents, please
visit https://creativecommons.org/licenses/by-nc/4.0/.
-429-