Embed Size (px)
Citation preview
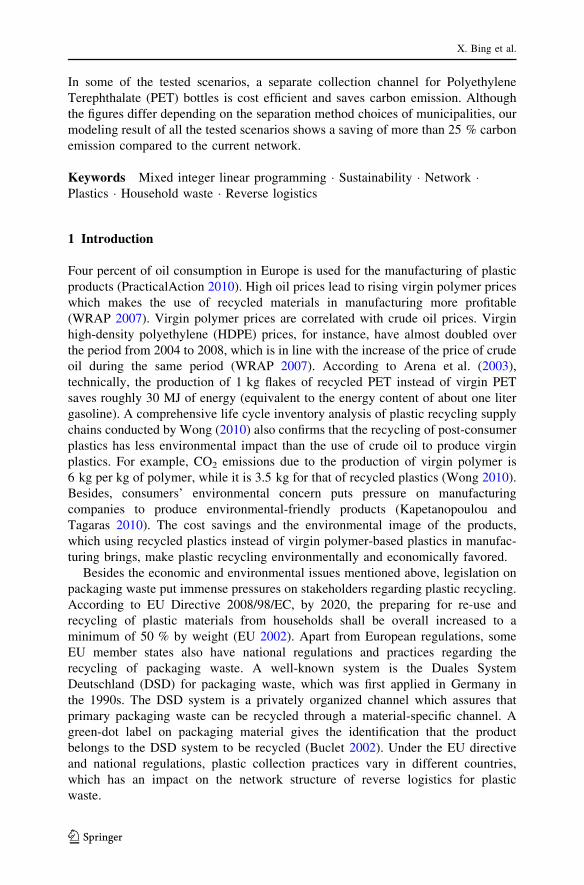
Sustainable reverse logistics network designfor household plastic waste
Xiaoyun Bing • Jacqueline M. Bloemhof-Ruwaard •
Jack G. A. J. van der Vorst
� Springer Science+Business Media, LLC 2012
Abstract Plastic recycling is a legal requirement and can yield environmental
benefits. In the Netherlands, there is a complex network of various collection
methods, separation centers, sorting centers and reprocessors. The first step of the
recycling system, separating plastics from other waste, can occur within households
(source-separation) or in separation centers (post-separation), making a difference in
collection channel choice and technology requirements. The purpose of this paper is
to provide decision support on choosing the most suitable combination of separation
methods in the Netherlands. Decision support is given through optimized reverse
logistics network design which makes the overall recycling system more efficient
and sustainable, while taking into account the interests of various stakeholders
(municipalities, households, etc.). A mixed integer linear programming (MILP)
model, which minimizes both transportation cost and environmental impact, is used
in this network design. The research follows the approach of scenario study; the
baseline scenario is the current situation and other scenarios are designed with
various strategic alternatives. Modeling is conducted by using a graphical optimi-
zation tool IBM LogicNet Plus 7.1. Comparing these scenarios, the results show that
the current network settings of the baseline situation is efficient in logistics terms
but has a potential to adapt to strategic changes, depending on the assumptions
regarding availability of the required processing facilities to treat plastic waste.
X. Bing (&) � J. M. Bloemhof-Ruwaard � J. G. A. J. van der Vorst
Operations Research and Logistics, Wageningen University, Wageningen, The Netherlands
e-mail: [email protected]
J. M. Bloemhof-Ruwaard
e-mail: [email protected]
J. G. A. J. van der Vorst
e-mail: [email protected]
X. Bing
Top Institute Food and Nutrition, Wageningen, The Netherlands
123
Flex Serv Manuf J
DOI 10.1007/s10696-012-9149-0
In some of the tested scenarios, a separate collection channel for Polyethylene
Terephthalate (PET) bottles is cost efficient and saves carbon emission. Although
the figures differ depending on the separation method choices of municipalities, our
modeling result of all the tested scenarios shows a saving of more than 25 % carbon
emission compared to the current network.
Keywords Mixed integer linear programming � Sustainability � Network �Plastics � Household waste � Reverse logistics
1 Introduction
Four percent of oil consumption in Europe is used for the manufacturing of plastic
products (PracticalAction 2010). High oil prices lead to rising virgin polymer prices
which makes the use of recycled materials in manufacturing more profitable
(WRAP 2007). Virgin polymer prices are correlated with crude oil prices. Virgin
high-density polyethylene (HDPE) prices, for instance, have almost doubled over
the period from 2004 to 2008, which is in line with the increase of the price of crude
oil during the same period (WRAP 2007). According to Arena et al. (2003),
technically, the production of 1 kg flakes of recycled PET instead of virgin PET
saves roughly 30 MJ of energy (equivalent to the energy content of about one liter
gasoline). A comprehensive life cycle inventory analysis of plastic recycling supply
chains conducted by Wong (2010) also confirms that the recycling of post-consumer
plastics has less environmental impact than the use of crude oil to produce virgin
plastics. For example, CO2 emissions due to the production of virgin polymer is
6 kg per kg of polymer, while it is 3.5 kg for that of recycled plastics (Wong 2010).
Besides, consumers’ environmental concern puts pressure on manufacturing
companies to produce environmental-friendly products (Kapetanopoulou and
Tagaras 2010). The cost savings and the environmental image of the products,
which using recycled plastics instead of virgin polymer-based plastics in manufac-
turing brings, make plastic recycling environmentally and economically favored.
Besides the economic and environmental issues mentioned above, legislation on
packaging waste put immense pressures on stakeholders regarding plastic recycling.
According to EU Directive 2008/98/EC, by 2020, the preparing for re-use and
recycling of plastic materials from households shall be overall increased to a
minimum of 50 % by weight (EU 2002). Apart from European regulations, some
EU member states also have national regulations and practices regarding the
recycling of packaging waste. A well-known system is the Duales System
Deutschland (DSD) for packaging waste, which was first applied in Germany in
the 1990s. The DSD system is a privately organized channel which assures that
primary packaging waste can be recycled through a material-specific channel. A
green-dot label on packaging material gives the identification that the product
belongs to the DSD system to be recycled (Buclet 2002). Under the EU directive
and national regulations, plastic collection practices vary in different countries,
which has an impact on the network structure of reverse logistics for plastic
waste.
X. Bing et al.
123
Dutch regulation on packaging waste and paper waste, issued in 2006 and started
in 2008, specified the goal of recycling 42 % of plastic packaging waste in 2012
(Cramer 2007). Household plastic waste recycling in the Netherlands is character-
ized by various collection, separation and treatment systems. As the first step of
recycling, separating plastics from other waste can occur in households (source-
separation) or in separation centers (post-separation). Currently, both source-
separation and post-separation systems exist in the Netherlands with source-
separation dominating (88 % of municipalities) as suggested by regulation. The
overall collection rate, however, is not satisfying yet. In the Netherlands, there are
441 different municipalities varying a lot in population density (Poelman 2009).
Municipalities are in charge of choosing the collection methods of plastic waste.
Currently, only the northern part of the Netherlands has post-separation facilities,
therefore the post-separation system is adopted only in the North. Despite this
current situation, most rural regions prefer source-separation. Large urban
municipalities dislike applying source-separation, due to limited space at home
for doing source-separation. The cost for a separate collection system of plastic
waste and the investment in the collection facilities are quite high for municipalities.
Some of the EU member states apply economic instruments including taxes to
create incentives for residents to separate recyclables from regular waste streams. A
deposit-refund system provides one type of such incentives for ensuring the
maximum reuse and recycling. Denmark implemented one of the oldest deposit-
refund systems ‘‘Dansk Retursystem‘‘ for beverage bottles and mineral water bottles
(Pro-Europe 2009). The Netherlands also adopted a deposit-refund system for
collecting PET bottles([0.5 L) with special collection machines in supermarkets.
For PET bottle collection, a deposit-refund system is in place, meaning PET bottles
are collected through a different channel. There is a trade-off between cost for using
the refund collection system and the collection rate. Due to this trade-off, whether or
not a separate collection channel is more efficient, in terms of transportation, than
integrating the PET bottle collection into the normal plastic waste collection
channels is worth investigation. Moreover, if a separate collection channel is used
for PET bottles, whether or not to collect all the PET bottles through this channel is
also an issue.
For an optimized network design, the choices of collection methods of
municipalities should take into account the characteristics of the municipalities.
This network design should provide decision support that both balances the interests
of stakeholders and makes an overall efficient collection network for all household
plastic waste types. Additionally, efficiency is not the only concern for the recycling
system. Sustainability is also a crucial issue. Emissions from collection should be
controlled by taking into account environmental parameters in the network design.
The purpose of network design is not just to choose the most efficient way to deal
with plastic waste, but also a sustainable one.
This research views plastic recycling as an application of reverse logistics.
Reverse logistics is the process of planning, implementation and controlling the
efficient, effective inbound flow and storage of secondary goods and related
information opposite to the traditional supply chain directions for the purpose of
recovering value and proper disposal (Fleischmann et al. 1997). This paper aims at
Sustainable reverse logistics network design
123
designing a sustainable reverse logistics network for plastic recycling that is both
efficient and sustainable, through building of a reverse logistics network model. The
research issues we study in particular are (1) the choice between source-separation
and post-separation and (2) whether or not to collect PET bottles separately and if
separately, whether or not to include PET bottles of all sizes in this channel.
In the following, Sect. 2 describes the theoretical framework and methodology
with a literature review. Section 3 provides a system description of the network and
the scenarios for analysis. Section 4 presents the mathematical formulation of the
model, input data, the assumptions for all the scenarios as well as the modeling tool
we use to solve the model. Section 5 shows the modeling results with sensitivity
analysis and discussion. The last section gives a conclusion and points out the
further research directions.
2 Theoretical framework
A lot of research has been conducted on improving the understanding of plastic
recycling. Astrup et al. (2009) focus on the accounting of greenhouse gas and the
global warming contributions of plastic recycling. Ambrose et al. (2002) compare
the quality of products made from recycled plastic materials with those from virgin
plastics. Heng et al. (2008) work on increasing the participation of households to
recycle plastics. Among these studies, Jahre (1995) points out that viewing waste
collection themes as reverse logistics channels can also improve the understanding
of the reverse system.
A review on the characteristics of the research on reverse logistics during the
period of 1995–2005 shows that the majority of research focuses on the study of
tactical and operational aspects like production planning and inventory manage-
ment. Research on strategic aspects of reverse logistics is scarce (Rubio et al. 2008).
Besides, very few attempts in the supply chain research area are made to study
reverse and recycling supply chains (Wong 2010). Some research in the
management science fields focuses on reverse logistics of waste management. Pati
et al. (2008) propose a mixed integer goal programming model to capture the inter-
relationships among the economic, social and quality goals in the paper recycling
industry. Bautista and Pereira (2006) establish a set covering problem for locating
the collection points of urban waste in Barcelona and develop a genetic algorithm to
solve the problem. In order to decide how to allocate the recycling containers for
glass recycling, Gonzalez-Torre and Adenso-Diaz (2006) develop a two stage goal
programming model to maximize the material collected and reduce the logistics
costs. The allocation of bins is decided in the first stage and the route is planned in a
following stage. These studies focus on a tactical and operational level by finding,
among others, the optimized location of collection points and the routes. In our
research we focus more on a strategic level than an operational level. That is, the
impact of the choice of separation method on the channel choice in the network, the
facilities required, the total transportation cost and emissions. The focus of this
research is a comparison of network modeling results between the alternatives of
separation strategies.
X. Bing et al.
123
Reverse distribution networks are not necessarily the symmetric picture of
forward distribution. Most of them have a ‘‘many to few’’ (convergent) network
structure instead of a ‘‘few to many’’ (divergent) structure (Fleischmann et al.
1997). For plastic waste recycling network, there are a lot of municipalities as the
source, however, only a few end users which reprocess the material. The structure of
the plastic reverse network in this paper is a convergent multi-level network.
Fleischmann et al. (2001); Fleischmann et al. (2004) develop a generic MILP
network model for product recovery network design illustrated by an example of
paper recycling. This generic model provides a general approach to model a
convergent network. We follow this general approach and apply it to the case of
plastic waste with an extension of taking into account environmental impact in the
model. Besides environmental considerations, the special characteristic of plastic
waste also distinguishes our work from others. Plastic waste consists of various
plastic types which need to be separated during the flow and shipped to different
destinations for reprocessing. This is also a multicommodity-based problem.
Geoffrion and Graves (1974) are among the first researchers who introduce
multicommodity logistics network model for optimizing product flows. Lots of
studies have been conducted on this type of network since then. For example,
Arntzen et al. (1995) develop a multiperiod, multicommodity mixed integer model
in order to optimize the global supply chain and Melo et al. (2006) propose a
mathematical modeling framework for strategic supply chain planning of dynamic
multicommodity capacitated facility location. Studying multicommodity network in
a reverse supply chain setting is relatively new. Additionally, the implication of
choosing separation strategy (source-separation or post-separation) on the network
design is that, under such convergent network structure, the location where plastic is
separated from other waste and the location where various plastic types, dirt and
moisture are sorted out are places where waste separation happens. Opposite to the
forward supply chain, in which products are assembled throughout the stages in the
chain, this waste separation is similar to a process of product disassembly.
Disassembly is a systematic method of separating a product into its constituent
parts, components, subassemblies or other groupings (Taleb and Gupta 1997). It
may involve dismantling and/or demolition and/or reprocessing (Srivastava 2007).
Compared to the process of disassembling, waste treatment also involves separation
and/or incineration and/or reprocessing. The major difference is that the separation
of waste materials, as waste is a loose mix, is more stochastic than the disassembling
process in which components of the objects are fixed (i.e. old cars). The separation
will have an influence on the particular distribution channel choice. The point where
separation happens could have an impact on the overall performance of the network.
Consequently, this paper examines the impact of separation in plastic reverse
logistics network by studying the difference in performance when choosing a
different separation point for PET bottles than for other plastic waste.
Another trend in this research field is that environmental issues become an
important parameter in logistics network design. The new concept of green supply
chain management leads to a shift from minimizing cost to a balance between cost
and environmental impact (Srivastava 2007). Green supply chain management/
logistics is an area that combines the concept of sustainability and logistics. Carbon
Sustainable reverse logistics network design
123
footprint, as the weighted sum of greenhouse gas emissions and greenhouse gas
removals of a process, a system of processes or a product system, expressed in CO2
equivalents is a common measurement for environmental impact. Chaabane et al.
(2012) introduce a mixed-integer linear programming based framework for
sustainable supply chain design and demonstrate that efficient carbon management
strategies can help to achieve sustainability objectives in a cost-effective manner.
Environmental issues become an important parameter in logistics network design
and the purpose is usually to get a balance between profit and environmental impact.
Quariguasi Frota Neto et al. (2006) use multi-objective programming (MOP) to
apply this sustainability concept in the design of a sustainable logistics network.
Krikke et al. (2002) use a multi-objective model to minimize cost, energy and
residue waste. Cachon (2009) discusses how the objective of reducing carbon
footprints affects supply chain operations and structures. In our research, we also
take into account environmental issues in the modeling by calculating the logistics
cost which embeds environmental cost.
A study on methodologies and initiatives of product carbon footprint of the
European Commission shows that although very significant progress has been made
in developing product carbon footprint methodologies, current methodologies still
lack precision on some critical aspects like the end-of-life phase (Mugnier et al.
2010). Some research exists on post-consumer products, but rarely on the plastic
sector. Chilton et al. (2010) undertook research on a life cycle assessment of the
closed-loop recycling and thermal recovery of post-consumer PET to compare the
environmental impact of different recovery options of PET bottles. Still, hardly any
research studies the environmental impact with integrated household plastic waste
types instead of focusing on a specific type.
To summarize, this paper studies the recycling of household plastic waste from a
reverse logistics network design angle while taking environmental parameters into
consideration, under a convergent multi-level network with multi-product and
product split. The aim is to provide decision support on choosing the most suitable
separation and corresponding distribution strategy with an optimized reverse
logistics network which makes the recycling system more efficient and sustainable.
3 System description and research approach
3.1 System description
The Dutch network is presented in Fig. 1. The scope of this research is limited to the
trajectory of reverse supply chain from collection in Dutch municipalities to the
reprocessors within Europe according to current practice. The 441 municipalities as
suppliers and the few sorting plants form a convergent structure. In sorting centers,
plastic is sorted into 6 different streams:
• PET (Polyethylene Terephthalate): Water bottles and soda bottles, salad trays
• PP (Polypropylene): Margarine tubs, microwaveable meal trays, ice-cream trays,
detergent bottles
X. Bing et al.
123
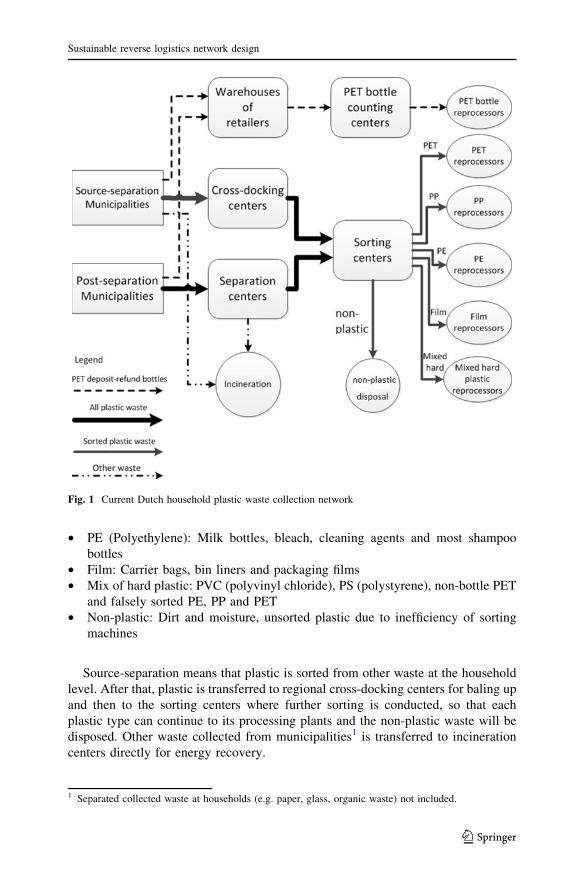
• PE (Polyethylene): Milk bottles, bleach, cleaning agents and most shampoo
bottles
• Film: Carrier bags, bin liners and packaging films
• Mix of hard plastic: PVC (polyvinyl chloride), PS (polystyrene), non-bottle PET
and falsely sorted PE, PP and PET
• Non-plastic: Dirt and moisture, unsorted plastic due to inefficiency of sorting
machines
Source-separation means that plastic is sorted from other waste at the household
level. After that, plastic is transferred to regional cross-docking centers for baling up
and then to the sorting centers where further sorting is conducted, so that each
plastic type can continue to its processing plants and the non-plastic waste will be
disposed. Other waste collected from municipalities1 is transferred to incineration
centers directly for energy recovery.
Fig. 1 Current Dutch household plastic waste collection network
1 Separated collected waste at households (e.g. paper, glass, organic waste) not included.
Sustainable reverse logistics network design
123
Post-separation means that plastic is not sorted from other waste at households. It
is collected and transferred to separation centers together with other waste to be
sorted. Afterwards, plastic waste is baled up and shipped to sorting centers where
further processing is conducted. The remaining waste from separation centers is
transferred to incineration centers directly. Source-separation requires the cooper-
ation of householders and extra infrastructures, therefore, is more difficult and
expensive to apply. Post-separation is easier to apply and results in a higher
separation rate, as machinery separation is more efficient than householders’
separation, meaning more plastic can be recycled in post-separation. However, since
plastic waste is mixed with other waste, therefore, contaminated, the quality of the
recycled material is lower than the material from the source-separation system.
The PET bottle is a special category of plastic waste. In the Netherlands, PET
bottle ([0.5 L) from all municipalities are collected through a channel that is
especially for this type of plastic waste. The municipal collection is at the retailers
by collection machines that have deposit-refund function. These deposit-refund PET
bottles (DPET) are shipped to the warehouses of these retailers first. Then, they will
be transferred to PET bottle counting centers before they go to the PET processing
plants especially for processing PET bottles from the deposit-refund system.
From the description, it can be summarized that the household plastic waste
recycling network in the Netherlands is a multi-product and multi-channel network.
The channel choice is dependent on the choice of separation method used by
municipalities, which has an influence on the total cost and emission of the network.
Besides, there are also multiple stakeholders involved (householders, collection
companies, municipalities, etc.), whose interests need to be considered in the
network design.
3.2 Scenarios
This research follows the approach of scenario study by forming a list of scenarios
first, then comparing the network modeling results of these scenarios. Scenarios are
designed with research partners after the discussion with various stakeholders. In the
scenario study, the baseline scenario is a representation of the current situation as
presented in the previous sections. Since source-separation is dominating as
suggested by legislation, more than 88 % of the municipalities do source-separation.
The 12 % post-separation is conducted mostly in the northern part of the country
because the only two currently available separation centers are both located in the
North. DPET is collected through the special channel as described above. According
to the scenario study approach, the scenarios used in the modeling are designed as
described in Table 1. Based on the current situation (scenario 1), we investigate the
impacts of various strategic alternatives:
• adopting a PET collection system that includes all sizes of PET bottles (scenario 2)
• choosing a collection method according to the population density of the
municipality (scenarios 3 and 4)
• shifting to 100 % post-separation (scenarios 5 and 6)
• integrating PET bottle collection in the normal channel (scenarios 4 and 6)
X. Bing et al.
123
These strategic alternatives take into account the differences in the character-
istics of municipalities and the alternative utility of the existing channels in order
to search for balanced interests of stakeholders such as food companies,
householders, municipalities, collection companies and policy makers. Adopting
PET collection from other countries investigates the possibility to include more
plastic bottles in the separate collection scheme as some other countries are doing,
such as Switzerland. Integrating PET collection in the normal collection channel,
on the contrary, investigates the results of removing the separate channel.
Considering the difference in the characteristics of municipalities prioritizes the
interests of householders while shifting to 100 % post-separation takes into
account the preferences of some of the municipalities. This scenario study
includes building model according to scenarios with various strategic assumptions
and comparing modeling results to provide decision support for making the choice
of source-separation or post-separation and the choice of corresponding processing
facilities. The purpose is to achieve the lowest overall transport cost from the
municipalities to final processing facilities while taking into account emissions of
transportation.
Mixed integer linear programming (MILP) is used in this network design.
Modeling is conducted by using a graphical optimization tool IBM LogicNet Plus
7.1. Unlike the usual forward supply chain network model, we have all the plastic
types and non-plastic as various ‘‘products’’ in the model. Municipalities are the
supplier of these ‘‘products‘‘. The distinctive convergent structure is built in and the
special feature of product disassembly during the flow is simulated. Contrary to
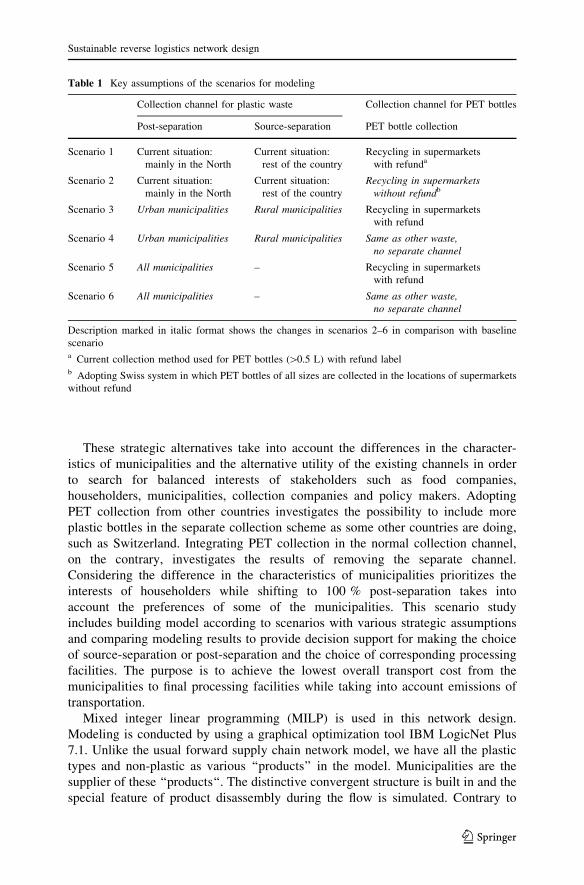
Table 1 Key assumptions of the scenarios for modeling
Collection channel for plastic waste Collection channel for PET bottles
Post-separation Source-separation PET bottle collection
Scenario 1 Current situation:
mainly in the North
Current situation:
rest of the country
Recycling in supermarkets
with refunda
Scenario 2 Current situation:
mainly in the North
Current situation:
rest of the country
Recycling in supermarketswithout refundb
Scenario 3 Urban municipalities Rural municipalities Recycling in supermarkets
with refund
Scenario 4 Urban municipalities Rural municipalities Same as other waste,no separate channel
Scenario 5 All municipalities – Recycling in supermarkets
with refund
Scenario 6 All municipalities – Same as other waste,no separate channel
Description marked in italic format shows the changes in scenarios 2–6 in comparison with baseline
scenarioa Current collection method used for PET bottles ([0.5 L) with refund labelb Adopting Swiss system in which PET bottles of all sizes are collected in the locations of supermarkets
without refund
Sustainable reverse logistics network design
123
normal distribution networks in which products are assembled at the source or
during the flow, plastic waste is separated and sorted along distribution from the
sources to the end processors. Many plastic fractions are collected together at the
source, mixed with dirt and moisture and even other municipal solid waste,
depending on the collection method. Along the flow, separation and sorting are
conducted. The residual part out of each step of separation and sorting will be
disposed; therefore, the quantity of plastics also reduces during distribution.
The objective of the MILP model is to minimize the overall transportation cost
and environmental impact. In each scenario, different network layouts, assumptions
on the choices of collection channels and the characteristics of municipalities define
the quantity of the products, their flows and the availability of facilities in the
network, which are constraints for the model. Additionally, PET bottles are a special
category of plastic waste. They can have a unique channel of recycling in the
network other than the normal plastic waste. The network design has to fit these
features.
3.3 Data
Data collection for building up the model took place in cooperation with research
partners through interviews, industrial reports and literature. A summary of the data
used in the model and data sources is presented below.
Municipalities (population, quantity of plastic waste, location) Statistics are
collected from the Central Bureau of Statistics in Netherlands, 2009. There are
441 municipalities in 2009, varying a lot in population. Municipalities are
classified according to their population density into 5 classes where class 1 is the
most populated municipality class and class 5 is the most rural one. Furthermore,
we aggregated these 5 classes into 2 types of municipalities: urban (class 1, 2) and
rural (class 3, 4 and 5).
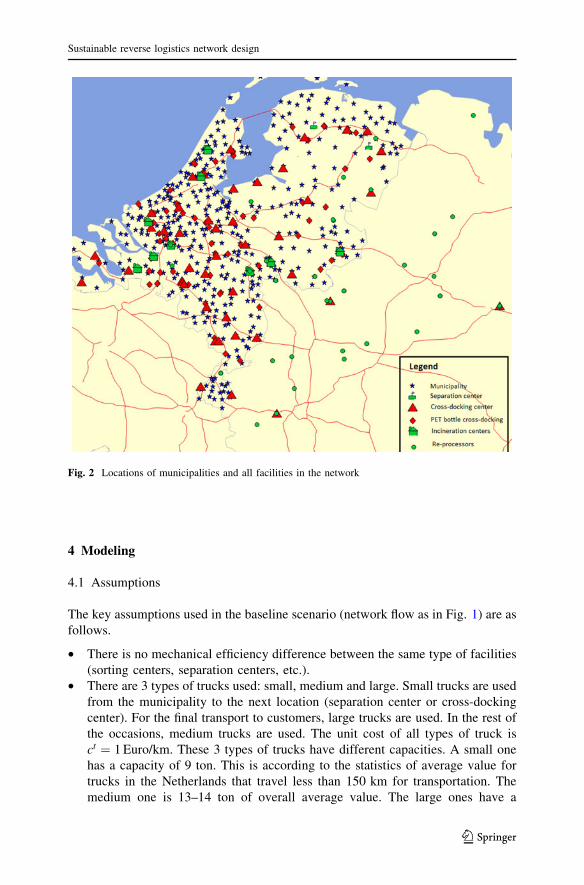
Processing facilities (function, location, availability) Nedvang (Dutch packag-
ing waste recycling agency) provided data on the locations and the functions of
processing facilities in Netherlands. Processing facilities include cross-docking
centers, separation centers, PET counting centers, incineration centers as well as
all the processors in the network. Their locations, functions and some of their
availability constraints are used in the model. The locations of all the facilities
and municipalities are presented in Fig. 2.
Plastic waste (components, quality) Total quantity and the quality of each
component are provided by one of the research anchors of the Kenniscentrum
Nascheiding (KCN), an expertise center located at Wageningen University that
investigates the technological and economic feasibility, as well as the
environmental impact, of new technologies for the treatment of plastics.
Quality data is the reference for calculating the impurities mixed in the plastic
waste.
Carbon equivalent emission cost For the cost of transportation emission,
we refer to the price of EU carbon allowances in 2008 (Ellerman et al.
2010).
X. Bing et al.
123
4 Modeling
4.1 Assumptions
The key assumptions used in the baseline scenario (network flow as in Fig. 1) are as
follows.
• There is no mechanical efficiency difference between the same type of facilities
(sorting centers, separation centers, etc.).
• There are 3 types of trucks used: small, medium and large. Small trucks are used
from the municipality to the next location (separation center or cross-docking
center). For the final transport to customers, large trucks are used. In the rest of
the occasions, medium trucks are used. The unit cost of all types of truck is
ct ¼ 1 Euro/km. These 3 types of trucks have different capacities. A small one
has a capacity of 9 ton. This is according to the statistics of average value for
trucks in the Netherlands that travel less than 150 km for transportation. The
medium one is 13–14 ton of overall average value. The large ones have a
Fig. 2 Locations of municipalities and all facilities in the network
Sustainable reverse logistics network design
123
capacity of 18–19 ton, which is according to the average loading weight of 40
foot high container trucks (PASI 2007). Utilization rates are all 100 %.
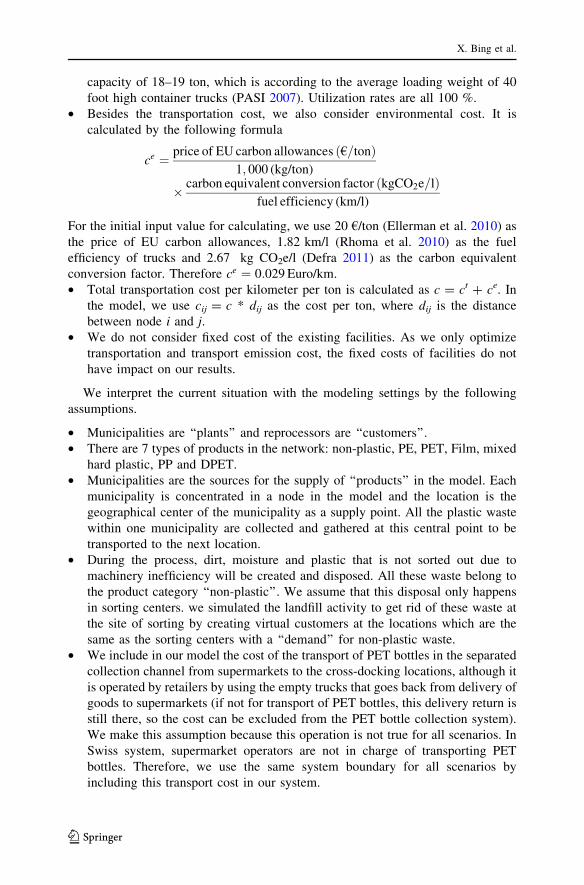
• Besides the transportation cost, we also consider environmental cost. It is
calculated by the following formula
ce ¼ price of EU carbon allowances ð€=tonÞ1; 000 (kg/ton)
� carbon equivalent conversion factor ðkgCO2e=lÞfuel efficiency (km/l)
For the initial input value for calculating, we use 20 €/ton (Ellerman et al. 2010) as
the price of EU carbon allowances, 1.82 km/l (Rhoma et al. 2010) as the fuel
efficiency of trucks and 2.67 kg CO2e/l (Defra 2011) as the carbon equivalent
conversion factor. Therefore ce ¼ 0:029 Euro/km.
• Total transportation cost per kilometer per ton is calculated as c = ct ? ce. In
the model, we use cij = c * dij as the cost per ton, where dij is the distance
between node i and j.• We do not consider fixed cost of the existing facilities. As we only optimize
transportation and transport emission cost, the fixed costs of facilities do not
have impact on our results.
We interpret the current situation with the modeling settings by the following
assumptions.
• Municipalities are ‘‘plants’’ and reprocessors are ‘‘customers’’.
• There are 7 types of products in the network: non-plastic, PE, PET, Film, mixed
hard plastic, PP and DPET.
• Municipalities are the sources for the supply of ‘‘products’’ in the model. Each
municipality is concentrated in a node in the model and the location is the
geographical center of the municipality as a supply point. All the plastic waste
within one municipality are collected and gathered at this central point to be
transported to the next location.
• During the process, dirt, moisture and plastic that is not sorted out due to
machinery inefficiency will be created and disposed. All these waste belong to
the product category ‘‘non-plastic’’. We assume that this disposal only happens
in sorting centers. we simulated the landfill activity to get rid of these waste at
the site of sorting by creating virtual customers at the locations which are the
same as the sorting centers with a ‘‘demand’’ for non-plastic waste.
• We include in our model the cost of the transport of PET bottles in the separated
collection channel from supermarkets to the cross-docking locations, although it
is operated by retailers by using the empty trucks that goes back from delivery of
goods to supermarkets (if not for transport of PET bottles, this delivery return is
still there, so the cost can be excluded from the PET bottle collection system).
We make this assumption because this operation is not true for all scenarios. In
Swiss system, supermarket operators are not in charge of transporting PET
bottles. Therefore, we use the same system boundary for all scenarios by
including this transport cost in our system.
X. Bing et al.
123
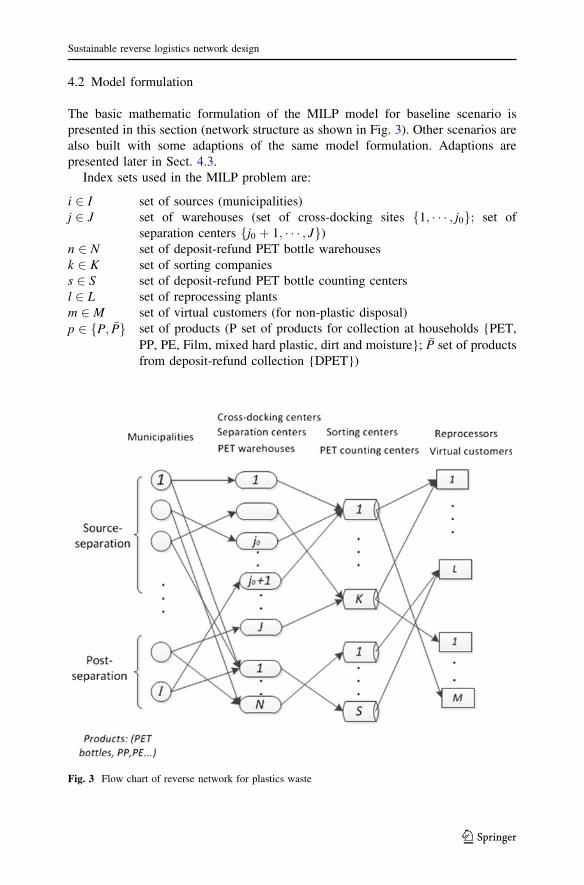
4.2 Model formulation
The basic mathematic formulation of the MILP model for baseline scenario is
presented in this section (network structure as shown in Fig. 3). Other scenarios are
also built with some adaptions of the same model formulation. Adaptions are
presented later in Sect. 4.3.
Index sets used in the MILP problem are:
i 2 I set of sources (municipalities)
j 2 J set of warehouses (set of cross-docking sites f1; � � � ; j0g; set of
separation centers fj0 þ 1; � � � ; Jg)n 2 N set of deposit-refund PET bottle warehouses
k 2 K set of sorting companies
s 2 S set of deposit-refund PET bottle counting centers
l 2 L set of reprocessing plants
m 2 M set of virtual customers (for non-plastic disposal)
p 2 fP; �Pg set of products (P set of products for collection at households {PET,
PP, PE, Film, mixed hard plastic, dirt and moisture}; �P set of products
from deposit-refund collection {DPET})
Fig. 3 Flow chart of reverse network for plastics waste
Sustainable reverse logistics network design
123
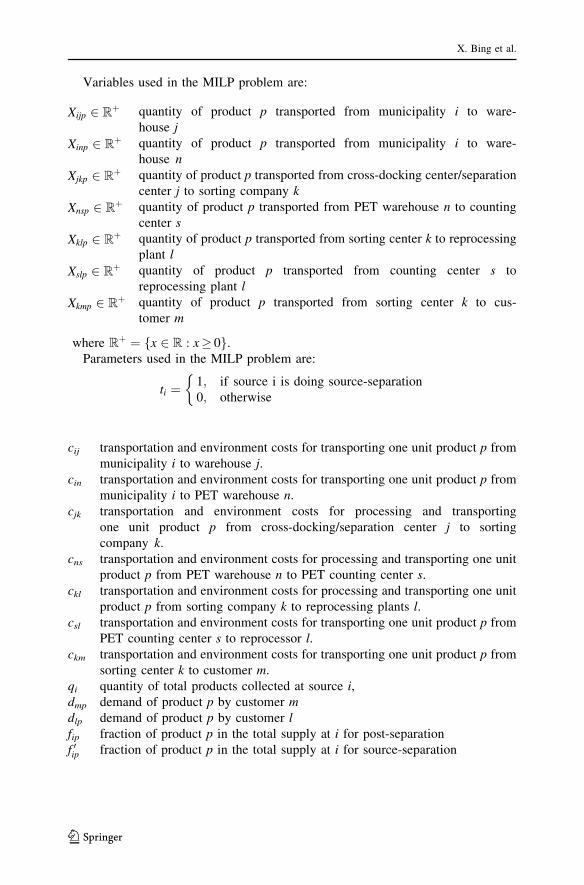
Variables used in the MILP problem are:
Xijp 2 Rþ quantity of product p transported from municipality i to ware-
house j
Xinp 2 Rþ quantity of product p transported from municipality i to ware-
house n
Xjkp 2 Rþ quantity of product p transported from cross-docking center/separation
center j to sorting company k
Xnsp 2 Rþ quantity of product p transported from PET warehouse n to counting
center s
Xklp 2 Rþ quantity of product p transported from sorting center k to reprocessing
plant l
Xslp 2 Rþ quantity of product p transported from counting center s to
reprocessing plant l
Xkmp 2 Rþ quantity of product p transported from sorting center k to cus-
tomer m
where Rþ ¼ fx 2 R : x� 0g.
Parameters used in the MILP problem are:
ti ¼1; if source i is doing source-separation
0; otherwise
�
cij transportation and environment costs for transporting one unit product p from
municipality i to warehouse j.cin transportation and environment costs for transporting one unit product p from
municipality i to PET warehouse n.
cjk transportation and environment costs for processing and transporting
one unit product p from cross-docking/separation center j to sorting
company k.
cns transportation and environment costs for processing and transporting one unit
product p from PET warehouse n to PET counting center s.
ckl transportation and environment costs for processing and transporting one unit
product p from sorting company k to reprocessing plants l.csl transportation and environment costs for transporting one unit product p from
PET counting center s to reprocessor l.ckm transportation and environment costs for transporting one unit product p from
sorting center k to customer m.
qi quantity of total products collected at source i,dmp demand of product p by customer mdlp demand of product p by customer lfip fraction of product p in the total supply at i for post-separation
f 0ip fraction of product p in the total supply at i for source-separation
X. Bing et al.
123
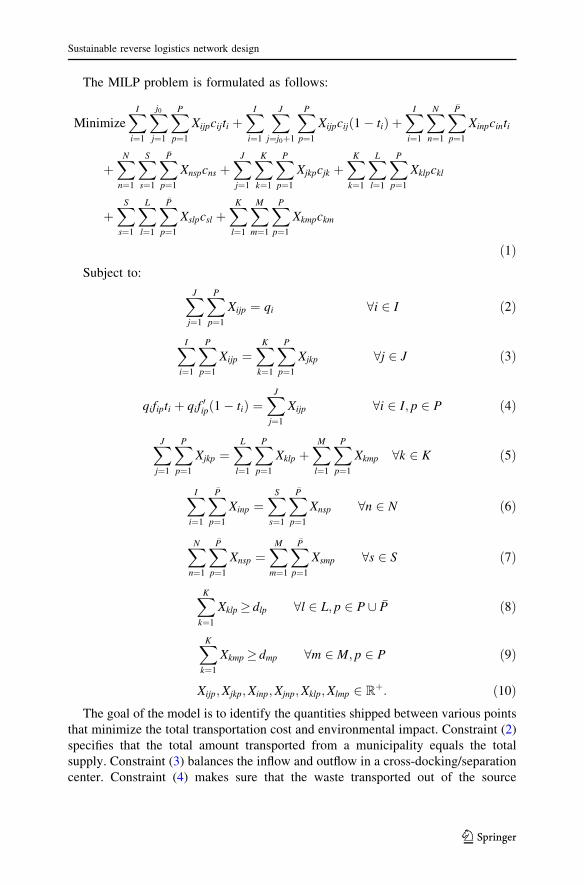
The MILP problem is formulated as follows:
MinimizeXI
i¼1
Xj0
j¼1
XP
p¼1
Xijpcijti þXI
i¼1
XJ
j¼j0þ1
XP
p¼1
Xijpcijð1� tiÞ þXI
i¼1
XN
n¼1
X�P
p¼1
Xinpcinti
þXN
n¼1
XS
s¼1
X�P
p¼1
Xnspcns þXJ
j¼1
XK
k¼1
XP
p¼1
Xjkpcjk þXK
k¼1
XL
l¼1
XP
p¼1
Xklpckl
þXS
s¼1
XL
l¼1
X�P
p¼1
Xslpcsl þXK
l¼1
XM
m¼1
XP
p¼1
Xkmpckm
ð1ÞSubject to:
XJ
j¼1
XP
p¼1
Xijp ¼ qi 8i 2 I ð2Þ
XI
i¼1
XP
p¼1
Xijp ¼XK
k¼1
XP
p¼1
Xjkp 8j 2 J ð3Þ
qifipti þ qif0ipð1� tiÞ ¼
XJ
j¼1
Xijp 8i 2 I; p 2 P ð4Þ
XJ
j¼1
XP
p¼1
Xjkp ¼XL
l¼1
XP
p¼1
Xklp þXM
l¼1
XP
p¼1
Xkmp 8k 2 K ð5Þ
XI
i¼1
X�P
p¼1
Xinp ¼XS
s¼1
X�P
p¼1
Xnsp 8n 2 N ð6Þ
XN
n¼1
X�P
p¼1
Xnsp ¼XM
m¼1
X�P
p¼1
Xsmp 8s 2 S ð7Þ
XK
k¼1
Xklp� dlp 8l 2 L; p 2 P [ �P ð8Þ
XK
k¼1
Xkmp� dmp 8m 2 M; p 2 P ð9Þ
Xijp;Xjkp;Xinp;Xjnp;Xklp;Xlmp 2 Rþ: ð10Þ
The goal of the model is to identify the quantities shipped between various points
that minimize the total transportation cost and environmental impact. Constraint (2)
specifies that the total amount transported from a municipality equals the total
supply. Constraint (3) balances the inflow and outflow in a cross-docking/separation
center. Constraint (4) makes sure that the waste transported out of the source
Sustainable reverse logistics network design
123
municipalities in the fixed fraction as produced, in other words, no separation
happens before the products arrive at warehouse j. Constraint (5) balances the inflow
and outflow in a sorting center. Constraint (6) balances the inflow and outflow in a
PET bottle warehouse. Constraint (7) balances the inflow and outflow in a PET
bottle counting center. Constraint (8) specifies that the total amount of all products
transported to a customer should satisfy the demand of the customer. Constraint (9)
specifies that the total amount of all products transported to a virtual customer
should satisfy the demand of the customer.
4.3 Model adaption for scenarios
Other scenarios are also built accordingly, however, with different assumptions.
• For scenario 2, the only difference in the model is the quantity of PET and
DPET. Since the Swiss system is used in this scenario, the quantity of DPET
bottles increases, and consequently, the quantity of other PET reduces.
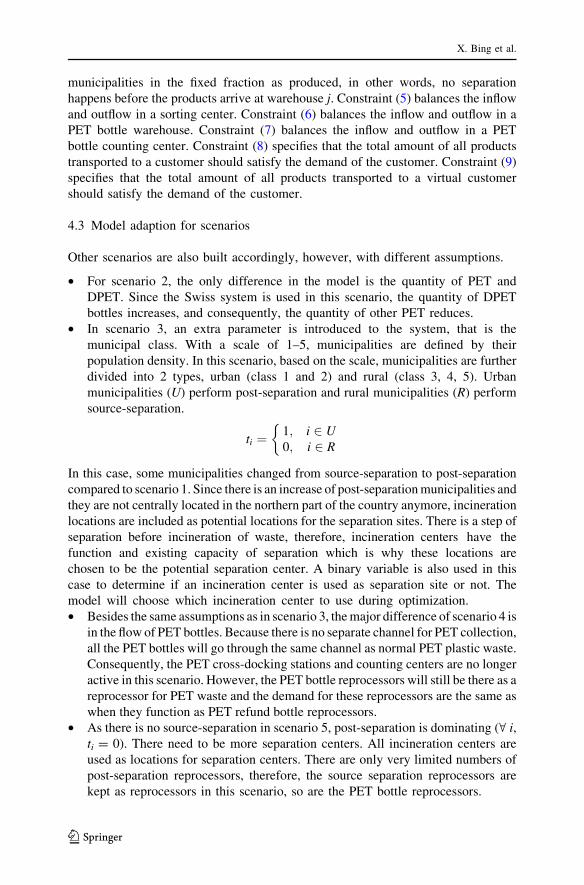
• In scenario 3, an extra parameter is introduced to the system, that is the
municipal class. With a scale of 1–5, municipalities are defined by their
population density. In this scenario, based on the scale, municipalities are further
divided into 2 types, urban (class 1 and 2) and rural (class 3, 4, 5). Urban
municipalities (U) perform post-separation and rural municipalities (R) perform
source-separation.
ti ¼1; i 2 U0; i 2 R
�
In this case, some municipalities changed from source-separation to post-separation
compared to scenario 1. Since there is an increase of post-separation municipalities and
they are not centrally located in the northern part of the country anymore, incineration
locations are included as potential locations for the separation sites. There is a step of
separation before incineration of waste, therefore, incineration centers have the
function and existing capacity of separation which is why these locations are
chosen to be the potential separation center. A binary variable is also used in this
case to determine if an incineration center is used as separation site or not. The
model will choose which incineration center to use during optimization.
• Besides the same assumptions as in scenario 3, the major difference of scenario 4 is
in the flow of PET bottles. Because there is no separate channel for PET collection,
all the PET bottles will go through the same channel as normal PET plastic waste.
Consequently, the PET cross-docking stations and counting centers are no longer
active in this scenario. However, the PET bottle reprocessors will still be there as a
reprocessor for PET waste and the demand for these reprocessors are the same as
when they function as PET refund bottle reprocessors.
• As there is no source-separation in scenario 5, post-separation is dominating (V i,ti = 0). There need to be more separation centers. All incineration centers are
used as locations for separation centers. There are only very limited numbers of
post-separation reprocessors, therefore, the source separation reprocessors are
kept as reprocessors in this scenario, so are the PET bottle reprocessors.
X. Bing et al.
123
• The assumptions in scenario 6 are the same as in scenario 5, except that PET
bottles from the deposit-refund channel go with normal plastic waste through
post-separation channel, and the final reprocessors are not those for refund
systems but the same as normal PET plastic waste reprocessors.
5 Results and discussion
5.1 Results
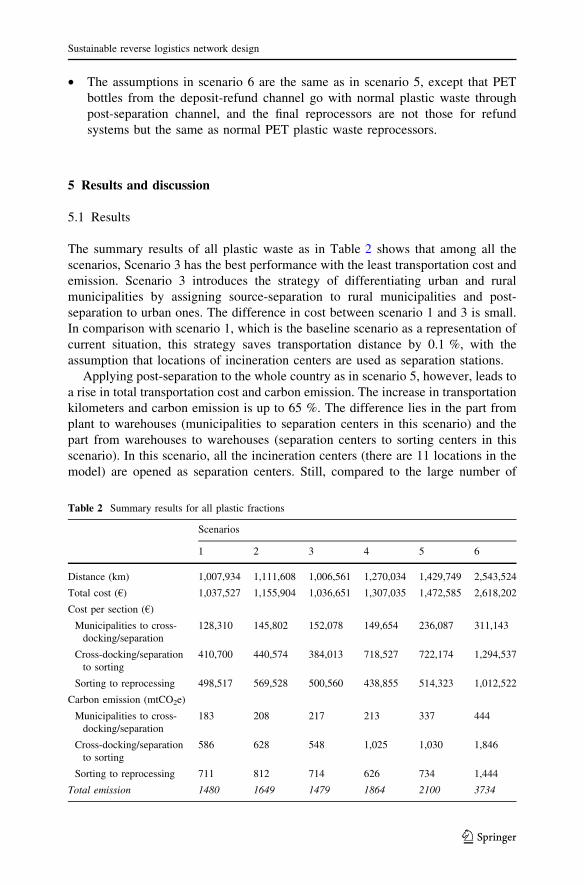
The summary results of all plastic waste as in Table 2 shows that among all the
scenarios, Scenario 3 has the best performance with the least transportation cost and
emission. Scenario 3 introduces the strategy of differentiating urban and rural
municipalities by assigning source-separation to rural municipalities and post-
separation to urban ones. The difference in cost between scenario 1 and 3 is small.
In comparison with scenario 1, which is the baseline scenario as a representation of
current situation, this strategy saves transportation distance by 0.1 %, with the
assumption that locations of incineration centers are used as separation stations.
Applying post-separation to the whole country as in scenario 5, however, leads to
a rise in total transportation cost and carbon emission. The increase in transportation
kilometers and carbon emission is up to 65 %. The difference lies in the part from
plant to warehouses (municipalities to separation centers in this scenario) and the
part from warehouses to warehouses (separation centers to sorting centers in this
scenario). In this scenario, all the incineration centers (there are 11 locations in the
model) are opened as separation centers. Still, compared to the large number of
Table 2 Summary results for all plastic fractions
Scenarios
1 2 3 4 5 6
Distance (km) 1,007,934 1,111,608 1,006,561 1,270,034 1,429,749 2,543,524
Total cost (€) 1,037,527 1,155,904 1,036,651 1,307,035 1,472,585 2,618,202
Cost per section (€)
Municipalities to cross-
docking/separation
128,310 145,802 152,078 149,654 236,087 311,143
Cross-docking/separation
to sorting
410,700 440,574 384,013 718,527 722,174 1,294,537
Sorting to reprocessing 498,517 569,528 500,560 438,855 514,323 1,012,522
Carbon emission (mtCO2e)
Municipalities to cross-
docking/separation
183 208 217 213 337 444
Cross-docking/separation
to sorting
586 628 548 1,025 1,030 1,846
Sorting to reprocessing 711 812 714 626 734 1,444
Total emission 1480 1649 1479 1864 2100 3734
Sustainable reverse logistics network design
123
cross-docking centers (more than 50) as used in scenario 1, there is an increase in
cost for these two parts, especially the part from separation centers to sorting centers
in comparison with that from cross-docking centers to the sorting centers. The rise
in cost of this part is up to 268 %.
The Swiss system, in which the PET bottles of all sizes (not only bottles larger than
0.5 liter as in the current situation) are collected through deposit-refund channel,
would bring an increase of transportation costs by 10 %. The transport from the
retailers to the warehouses of the retailers in the PET refund system has been included
in these calculations. After adapting the choice of separation method according to
municipal type, removing separate PET deposit-refund channel from the system
would result in an increase of cost too. Comparing scenario 3 and 4, we can see that the
difference is up to 26 %. Comparison between scenario 5 and 6 confirms this
observation. Scenario 6 also has much more cost than scenario 5, which represents an
increase of 79 %. Emission is calculated by traveling distance, therefore is linear to
transport. The results shows the same difference as the transportation cost.
A separate PET bottle collection channel is a sort of product disassembly in the
source of the network. The availability of facilities and their locations in the
network in this case, play an important role on determining which separation point
choice is better. The modeling results of scenarios 3–6 show that with the existing
facilities for processing PET bottles, this separation at the source (separate
collection) has less cost and emission than separation in a later stage (combined
with normal plastic waste).
5.2 Sensitivity analysis
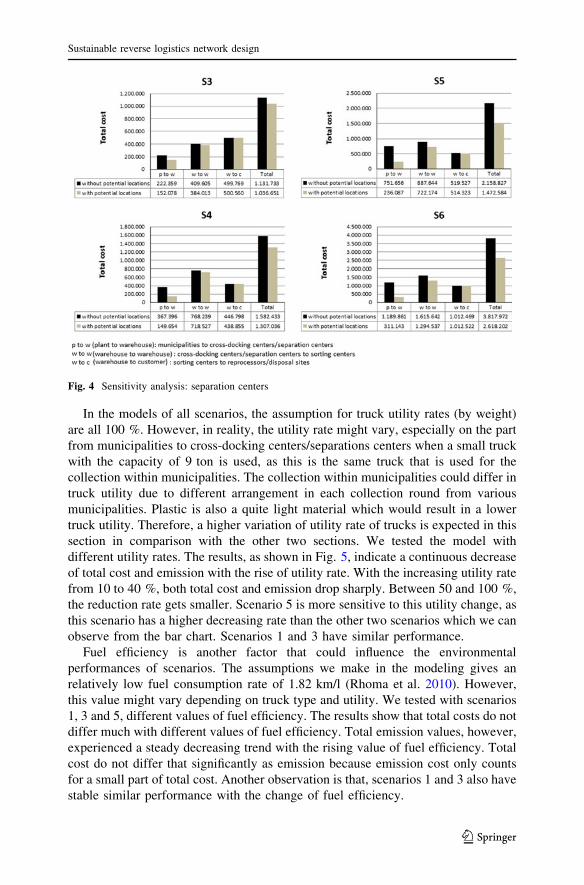
In the model assumptions for scenarios 3 and 4, the locations of incineration centers
can be the potential locations for separation centers and in scenarios 5 and 6, all the
incineration locations are opened as fixed locations for separation. We tested the
results of using only the current locations of separation centers in these 4 scenarios
and got the results as shown in Fig. 4. For all these scenarios, the choice of
separation centers does not have much influence on the transport between sorting
centers and reprocessors. However, it is quite obvious that without the potential
separation locations, there would be an increase in transportation for the other two
sections. For scenarios 3 and 4, the differences are not as large as in scenarios 5 and
6. That is because, scenarios 3 and 4 still have a lot of municipalities performing
source-separation which do not need separation centers. When the collection shift to
post-separation for the whole country, the differences become much larger. With the
only 2 current separation centers in the north, in scenarios 5 and 6, all the waste
collected from the Netherlands is shipped to the northern facilities to get separated
and transported to Germany for sorting (all the sorting centers are located in
Germany). If we compare the total costs between baseline scenario and scenario 3
with the assumption that only the current 2 separation centers can be used, then
scenario 3 leads to an increase of transportation cost by 9 % instead of having
almost the same cost as baseline scenario when we make the assumption that
potential locations can be used.
X. Bing et al.
123
In the models of all scenarios, the assumption for truck utility rates (by weight)
are all 100 %. However, in reality, the utility rate might vary, especially on the part
from municipalities to cross-docking centers/separations centers when a small truck
with the capacity of 9 ton is used, as this is the same truck that is used for the
collection within municipalities. The collection within municipalities could differ in
truck utility due to different arrangement in each collection round from various
municipalities. Plastic is also a quite light material which would result in a lower
truck utility. Therefore, a higher variation of utility rate of trucks is expected in this
section in comparison with the other two sections. We tested the model with
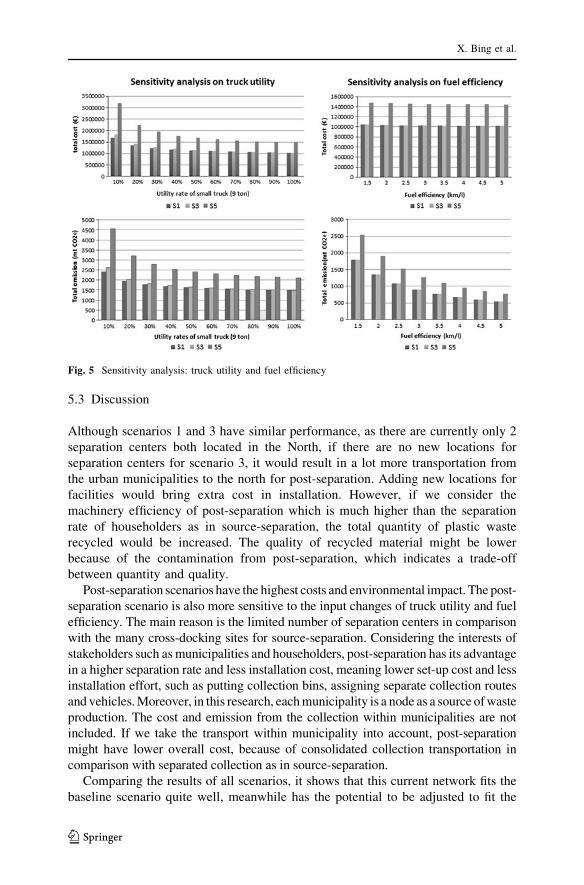
different utility rates. The results, as shown in Fig. 5, indicate a continuous decrease
of total cost and emission with the rise of utility rate. With the increasing utility rate
from 10 to 40 %, both total cost and emission drop sharply. Between 50 and 100 %,
the reduction rate gets smaller. Scenario 5 is more sensitive to this utility change, as
this scenario has a higher decreasing rate than the other two scenarios which we can
observe from the bar chart. Scenarios 1 and 3 have similar performance.
Fuel efficiency is another factor that could influence the environmental
performances of scenarios. The assumptions we make in the modeling gives an
relatively low fuel consumption rate of 1.82 km/l (Rhoma et al. 2010). However,
this value might vary depending on truck type and utility. We tested with scenarios
1, 3 and 5, different values of fuel efficiency. The results show that total costs do not
differ much with different values of fuel efficiency. Total emission values, however,
experienced a steady decreasing trend with the rising value of fuel efficiency. Total
cost do not differ that significantly as emission because emission cost only counts
for a small part of total cost. Another observation is that, scenarios 1 and 3 also have
stable similar performance with the change of fuel efficiency.
Fig. 4 Sensitivity analysis: separation centers
Sustainable reverse logistics network design
123
5.3 Discussion
Although scenarios 1 and 3 have similar performance, as there are currently only 2
separation centers both located in the North, if there are no new locations for
separation centers for scenario 3, it would result in a lot more transportation from
the urban municipalities to the north for post-separation. Adding new locations for
facilities would bring extra cost in installation. However, if we consider the
machinery efficiency of post-separation which is much higher than the separation
rate of householders as in source-separation, the total quantity of plastic waste
recycled would be increased. The quality of recycled material might be lower
because of the contamination from post-separation, which indicates a trade-off
between quantity and quality.
Post-separation scenarios have the highest costs and environmental impact. The post-
separation scenario is also more sensitive to the input changes of truck utility and fuel
efficiency. The main reason is the limited number of separation centers in comparison
with the many cross-docking sites for source-separation. Considering the interests of
stakeholders such as municipalities and householders, post-separation has its advantage
in a higher separation rate and less installation cost, meaning lower set-up cost and less
installation effort, such as putting collection bins, assigning separate collection routes
and vehicles. Moreover, in this research, each municipality is a node as a source of waste
production. The cost and emission from the collection within municipalities are not
included. If we take the transport within municipality into account, post-separation
might have lower overall cost, because of consolidated collection transportation in
comparison with separated collection as in source-separation.
Comparing the results of all scenarios, it shows that this current network fits the
baseline scenario quite well, meanwhile has the potential to be adjusted to fit the
Fig. 5 Sensitivity analysis: truck utility and fuel efficiency
X. Bing et al.
123
strategic change of the collection methods. The key issue is the availability of
intermediate facilities and their locations. Although extra costs might be needed,
benefit of more balanced interests of stakeholders and the potential higher recycling
rate resulting from it by implementing strategic changes should be considered. The
results from the modeling provides support in decision making by quantifying the
difference, in terms of transportation cost and emission, would be if strategic
changes are to be made.
The Swiss system, in which all PET bottles are transported through a separate
channel, leads to more transportation in comparison with the baseline scenario.
However, if we take into account that the PET refund bottles are transported in the
empty trucks of retailers, which would have to drive back to the warehouses anyway
after delivering goods to the retailers, meaning transportation in this section can be
neglected from this system, the results might change. In general, a separate
collection channel for PET bottles is beneficial when the municipalities’ choices of
performing source-separation/post-separation change as in scenarios 3–6. A
separate channel also prevents PET bottles from contamination and ensures a high
reaction rate by deposit, although the installation cost (e.g. collection machines) is
relatively high.
6 Conclusion and further research
In order to improve plastic recycling system, decision support is needed on choosing
the most suitable recycling collection method with the collection alternatives and
separation possibilities in the Netherlands. This paper analyzes the strategic
alternatives of reverse logistics network design by scenario study approach.
Together with a baseline scenario of the current situation, scenarios with various
strategic changes are modeled. The results show that for plastic waste, applying
post-separation and differentiating urban and rural municipalities (by assigning
post-separation to urban municipalities and source-separation to rural ones) has a
similar result as the current situation with a slight reduction of overall cost with the
assumption that additional facilities are available. In the model, all the incineration
centers are set as potential separation centers. Without these potential locations, a
lot more transportation would be generated by applying these strategic changes. In
sensitivity analysis, this scenario also has similar stable performance as the baseline
scenario. In general, increased truck utility reduces the total cost and emission. The
rising fuel efficiency also brings such trend.
Post-separation scenarios have the highest costs and environmental impact. The
main reason is the limited number of separation centers in comparison with the
many cross-docking sites for source-separation. Post-separation has its advantage in
a higher separation rate and less installation cost for municipalities and household-
ers. It would be interesting for future research to include quality and separation rate
as parameters in the model.
The Swiss system gives a slight rise in total transportation cost. After assigning
post-separation to urban municipalities and source-separation to rural municipal-
ities, PET bottles collection that has a separate channel should be kept because of
Sustainable reverse logistics network design
123
the significant cost increase by integrating PET bottle collection into the normal
plastic waste collection theme. Integrating PET collection in the normal collection
channel results in more cost and emission. Post-separation scenarios are more
sensitive to this integration than source-separation scenarios.
This model optimizes both transportation cost and environmental impact. Only
emissions from transportation are considered. Other environmental influences such
as the quality of material as the result of separation method choice and the emissions
from each step of the processing in the network are not included in this research, but
would be interesting for future research. Moreover, in this network model, the
collection cost, distances, and environmental impact of collection additivity within
municipalities are not considered , however, would also be interesting for further
investigation.
Acknowledgments This research is financially supported by TI Food & Nutrition (Top Institute Food
and Nutrition, the Netherlands). Data collection is in cooperation with Nedvang (Dutch packaging waste
recycling association) and KCN (an expertise center in Wageningen University of plastic recycling). We
would like to thank them for all the support they give and also the great help in collecting data for this
research. We also thank the anonymous reviewers and Prof. Chee Wong for their valuable comments on
the manuscript.
References
Ambrose CA, Hooper R, Potter AK, Singh MM (2002) Diversion from landfill: quality products from
valuable plastics. Resour Conserv Recycl 36(4):309–318
Arena U, Mastellone ML, Perugini F (2003) Life cycle assessment of a plastic packaging recycling
system. Int J Life Cycle Assess 8(2):92–98
Arntzen BC, Brown GG, Harrison TP, Trafton LL (1995) Global supply chain management at digital
equipment corporation. Interfaces 25(1):69–93
Astrup T, Fruergaard T, Ghristensen TH (2009) Recycling of plastic:accounting of greenhouse gases and
global warming contribution. Waste Manag Res 27:763–772
Bautista J, Pereira J (2006) Modeling the problem of locating collection areas for urban waste
management. an application to the metropolitan area of Barcelona. Omega 34(6):617–629
Buclet N (2002) Municipal waste managenent in Europe: European policy between harmonisation and
subsidiarity. Kluwer, Dordrecht
Cachon G (2009) Carbon footprint and the management of supply chains. The INFORMS annual
meeting, San Diego CA
Chaabane A, Ramudhin A, Paquet M (2012) Design of sustainable supply chains under the emission
trading scheme. Int J Prod Econ 135:37–49
Chilton T, Burnley S, Nesaratnam S (2010) A life cycle assessment of the closed-loop recycling and
thermal recovery of post-consumer PET. Resour Conserv Recycl 54(12):1241–1249
Cramer J (2007) Framework agreement between the ministry of environment, the packaging industry and
VNG on the approach to the packaging and litter records for the years 2008 /2012
Defra (2011) 2011 guidelines to Defra/DECC’s GHG conversion factors for company reporting:
methodology paper for emisssion factors. Technical report, Department for Environment, Food and
Rural Affairs, UK
Ellerman AD, Convery FJ, de Perthuis C (2010) Pricing carbon: the European union emissions trading
scheme. Cambridge Univeristy Press, New York
EU (2002) Directive 2008/98/EC of the european parliament and of the council of 19 november 2008 on
waste and repealing certain directives
Fleischmann M, Bloemhof-Ruwaard JM, Dekker R, van der Laan E, van Nunen JAEE, Van Wassenhove
LN (1997) Quantitative models for reverse logistics: a review. Eur J Oper Res 103(1):1–17
Fleischmann M, Beullens P, Bloemhof-Ruwaard JM, van Wassenhove LN (2001) The impact of product
recovery on logistics network design. Prod Oper Manag 10(2):156–173 ISSN 1937–5956
X. Bing et al.
123
Fleischmann M, Bloemhof-Ruward JM, Beullens P, Dekker R (2004) Reverse logistics: quantitative
models for closed-loop supply chains. Springer, Berlin
Geoffrion AM, Graves GW (1974) Multicommodity distribution system design by Benders decompo-
sition. Manag Sci 20(5):822–844 ISSN 00251909
Gonzalez-Torre PL, Adenso-Diaz B (2006) Reverse logistics practices in the glass sector in Spain and
Belgium. Int Bus Rev 15(5):527–546
Heng N, Ungul LU, Mehrdadi N (2008) Recycling and reuse of household plastics. Int J Environ Res
2(1):27–36
Jahre M (1995) Household waste collection as a reverse channel: a theoretical perspective. Int J Phys
Distrib Logist Manag 25(2):39–55
Kapetanopoulou P, Tagaras G (2010) An empirical investigation of value-added product recovery
activities in SMEs using multiple case studies of OEMs and independent remanufacturers. Flexible
Ser Manuf J 21(3-4):92–113
Krikke H, Pappis CP, Tsoulfas GT, Bloemhof J (2002) Extended design principles for closed loop supply
chains: optimizing economic, logistic and environmental performance. In: Klose A, Speranza MG,
Van Wassenhove LN (eds) Quantitative approaches to distribution logistics and supply chain
management, lecture notes 519 in economics and mathematical systems
Melo MT, Nickel S, Saldanhada Gama F (2006) Dynamic multi-commodity capacitated facility location:
a mathematical modeling framework for strategic supply chain planning. Comput Oper Res
33(1):181–208
Mugnier E, Mairet A, Boucher J (2010) Product carbon footprinting: a study on methodologies and
initiatives. Technical report, European Commission DG Environment
Simo PASI (2007) Average loads, distances and empty running in road transport-2005. Technical report,
EU
Pati RK, Vrat P, Kumar P (2008) A goal programming model for paper recycling system. Omega
36(3):405–417
Poelman B (2009) 441 gemeenten in 2009. http://www.cbs.nl/nl-NL/menu/themas/dossiers/nederland-
regionaal/publicaties/artikelen/archief/2009/2009-2666-wm.htm, 2009. CBS.
PracticalAction. Recycling plastics. Technical report, The Schumacher Center for Technology &
Development, 2010
Pro-Europe (2009) Packaging waste legislation in denmark. http://pro-e.org/Denmark
QuariguasiFrota Neto J, Bloemhof-Ruwaard JM, van Nunen JAEE, van Heck E (2006) Designing and
evaluating sustainable logistics network. Int J Prod Econ 111:195–208
Rhoma F, Zhang Z, Luo Y, Noche B (2010) Environmental and economical optimization for municipal
solid waste collection problems, a modeling and algorithmic approach case study. In: WSEAS
international conference on mathematical methods, computational techniques and intellegent
systems, Sousse, Tunisia. WSEAS Press
Rubio S, Chamorro A, Miranda FJ (2008) Characteristics of the research on reverse logistics
(1995–2005). Int J Prod Res 46(4):1099–1120
Srivastava SK (2007) Green supply-chain management: a state-of-the-art literature review. Int J Manag
Rev 9(1):53–80
Taleb KN, Gupta SM (1997) Disassembly of multiple product structures. Comput Ind Eng 32(4):949–961
Wong C (2010) A study of plastic recycling supply chain. Technical report. University of Hull Business
School and Logistics Institute,
WRAP (2007) Realising the value of recovered plastics. Technical report, Waste and Resource Action
Program, UK
Author Biographies
Xiaoyun Bing is a PhD researcher at the Operations Research and Logistics group at Wageningen
University. She works in the project ‘‘Post-consumer packing recycling’’ funded by Top Institute Food
and Nutrition, the Netherlands. Before working as a PhD researcher, she obtained her Msc. in Logistics
and Transport Management from Gothenburg University, Sweden. Her main fields of research interests
are supply chain management, reverse logistics, logistics network design, transport planning and
sustainability.
Sustainable reverse logistics network design
123
Jacqueline M. Bloemhof-Ruwaard is Associate Professor Sustainable Supply Chain Management at the
Operations Research and Logistics group at Wageningen University. Before joining Wageningen
University, she was Assistant Professor at Rotterdam School of Management Erasmus University
Rotterdam, a PhD at Wageningen University and a research associate at INSEAD, France. Her main fields
of research interests are supply chain management, closed loop supply chains, logistics networks,
agricultural distribution networks, and sustainability. She has published on these topics in many
international peer reviewed journals and books. Her current research focuses on the design and redesign
of sustainable supply chains.
Jack G. A. J. van der Vorst is Full Professor and head of the Operations Research and Logistics group at
Wageningen University. He obtained his PhD degree in 2000 with a thesis entitled ‘‘Effective Food
Supply Chains; generating, modeling and evaluating supply chain scenarios’’, at Wageningen University.
His research is published in international peer reviewed journals, books and at international conferences.
He worked as senior management consultant for food industries and agribusiness and is a fellow of the
WASS Graduate School. His current research focuses on the development of innovative logistics concepts
in Agri Food Supply Chain Networks and Decision Support Models and Tools.
X. Bing et al.
123